
Evaluation of the Efficiency of Maritime Transport Using a Network Slacks-Based Measure (SBM) Approach: A Case Study on the Korean Coastal Ferry Market


Abstract
:1. Introduction
2. Literature Review
2.1. Network DEA
2.2. DEA Application Studies in Ferry Transport
3. Method
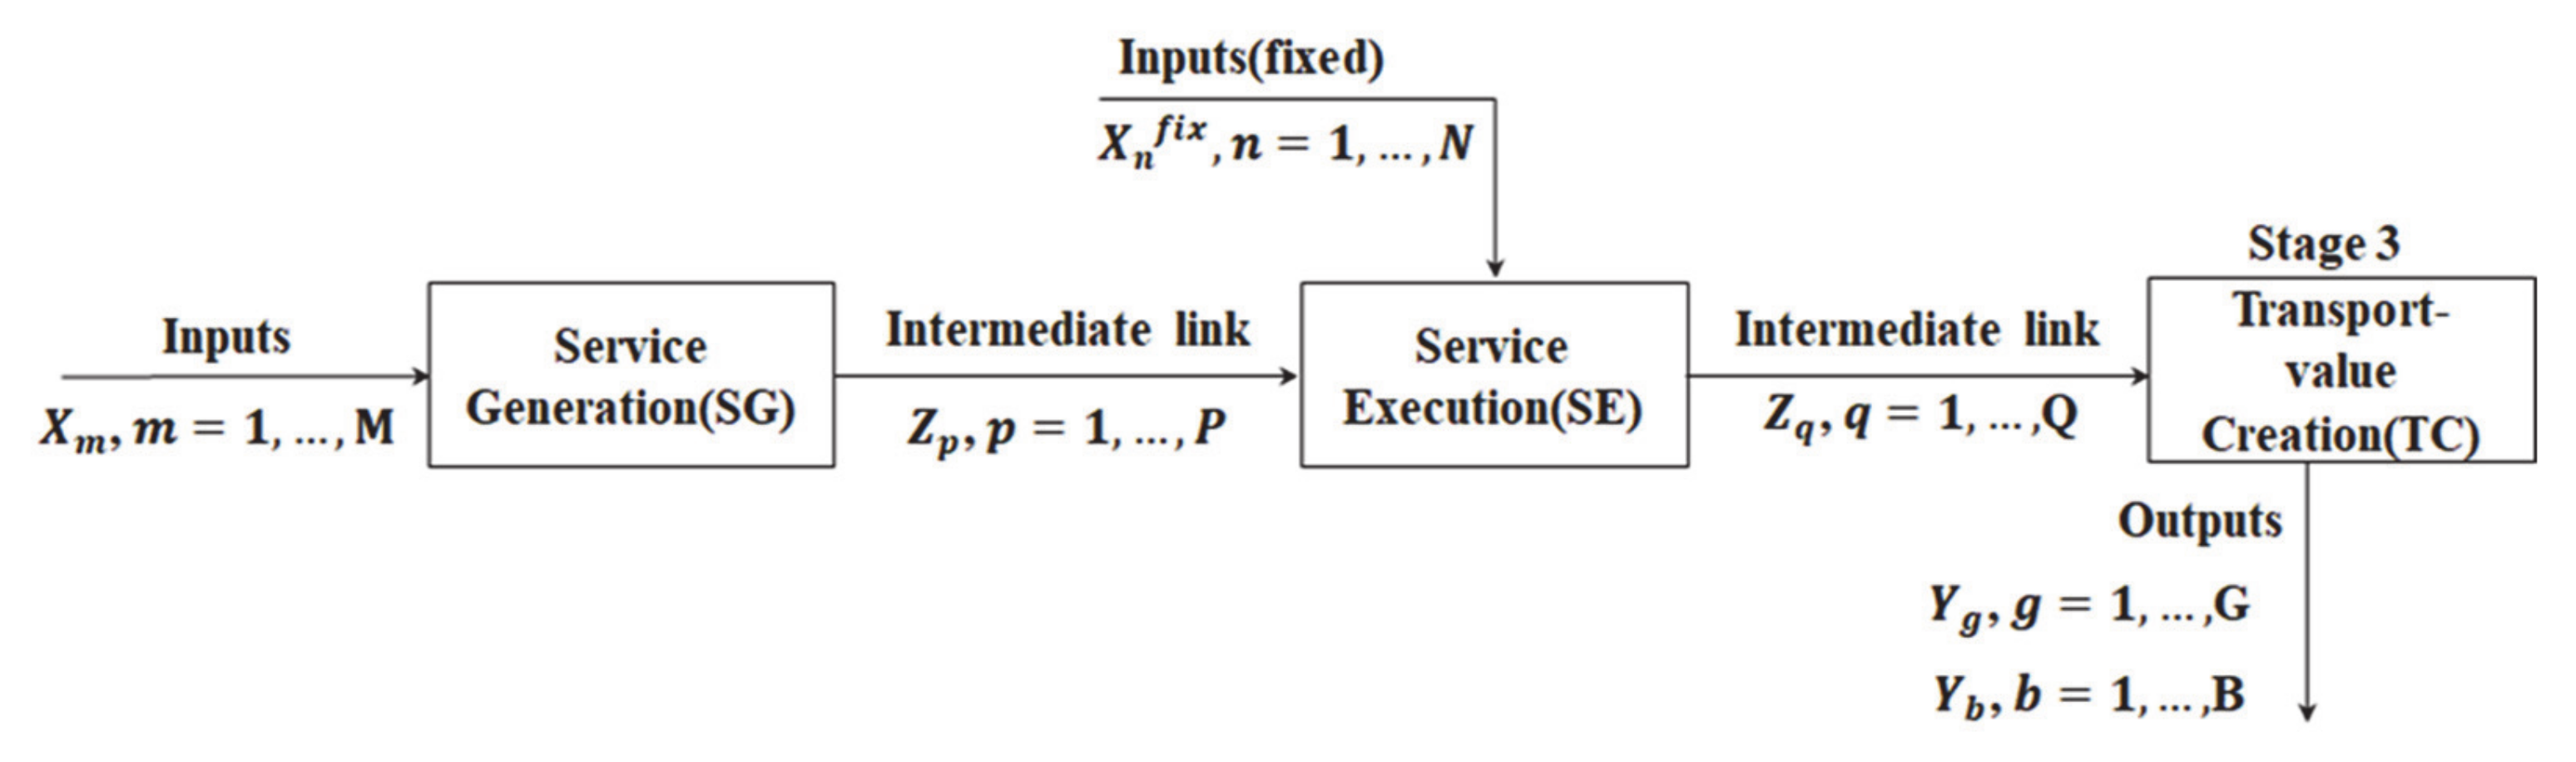
3.1. Design of Network SBM Model
3.2. Selection of Variables
3.3. Data Description
4. Results and Discussion
5. Conclusions
Author Contributions
Funding
Acknowledgments
Conflicts of Interest
Abbreviations
| SG | Service generation stage. |
| SE | Service execution stage. |
| TC | Transport value creation stage. |
| B | Number of undesirable output variables. |
| G | Number of desirable output variables. |
| J | Number of coastal ferry operators evaluated. |
| M | Number of input variables in SG. |
| N | Number of fixed input variables in SE. |
| P | Number of intermediate variables between SG and SE. |
| Q | Number of intermediate variables between SE and TC. |
| Input variable for SG of coastal ferry operator . | |
| Intermediate variable between SG and SE of coastal ferry operator . | |
| Intermediate variable between SG and SE of coastal ferry operator . | |
| Fixed input variable for SE of coastal ferry operator . | |
| Desirable output variable of coastal ferry operator . | |
| Undesirable output variable of coastal ferry operator . | |
| Overall transport efficiency score of coastal ferry operator. | |
| Divisional efficiency score of SG. | |
| Divisional efficiency score of SE. | |
| Divisional efficiency score of TC. | |
| Slacks vectors for input excess for SG. | |
| Slacks vectors of desirable output shortage. | |
| Slacks vectors of undesirable output excess. | |
| Intensity vectors for SG of coastal ferry operator . | |
| Intensity vectors for SE of coastal ferry operator . | |
| Intensity vectors for TC of coastal ferry operator . |
References
- Korea Shipping Association (KSA). Status of Coastal Passenger Transportation Services in 2020. Available online: http://www.theksa.or.kr/site/main/board/sub05_08_01_04/81407?cp=1&sortOrder=BA_REGDATE&sortDirection=DESC&listType=list&bcId=sub05_08_01_04&baNotice=false&baCommSelec=false&baOpenDay=false&baUse=true (accessed on 5 March 2021).
- Baird, A. A Scottish east coast European ferry service: Review of the issues. J. Transp. Geogr. 1997, 5, 291–302. [Google Scholar] [CrossRef]
- Baird, A.J. Comparing the efficiency of public and private ferry services on the Pentland Firth between mainland Scotland and the Orkney Islands. Res. Transp. Bus. Manag. 2012, 4, 79–89. [Google Scholar] [CrossRef]
- Bergantino, A.S.; Bolis, S. Monetary values of transport service attributes: Land versus maritime ro-ro transport. An application using adaptive stated preferences. Marit. Policy Manag. 2008, 35, 159–174. [Google Scholar] [CrossRef]
- Tzannatos, E.S. Technical reliability of the Greek coastal passenger fleet. Mar. Policy 2005, 29, 85–92. [Google Scholar] [CrossRef]
- Ministry of Oceans and Fisheries. Marine Transportation Act (Act No.15011, 31 October 2017). Available online: http://www.law.go.kr/LSW/eng/engLsSc.do?menuId=2§ion=lawNm&query=%ED%95%B4%EC%9A%B4%EB%B2%95&x=0&y=0#liBgcolor12 (accessed on 5 March 2021).
- (MOF) The Ministry of Oceans and Fisheries. Implementation Plan for Maritime Safety in 2020. Available online: https://www.mof.go.kr/article/view.do?articleKey=31887&searchCategory=%ED%95%B4%EC%82%AC%EC%95%88%EC%A0%84%EC%A0%95%EC%B1%85&searchSelect=title&searchValue=%ED%95%B4%EC%82%AC%EC%95%88%EC%A0%84%EC%8B%9C%ED%96%89%EA%B3%84%ED%9A%8D&boardKey=22&menuKey=1013¤tPageNo=1 (accessed on 5 March 2021).
- Barak, S.; Dahooei, J.H. A novel hybrid fuzzy DEA-Fuzzy MADM method for airlines safety evaluation. J. Air Transp. Manag. 2018, 73, 134–149. [Google Scholar] [CrossRef] [Green Version]
- Chen, C.-M.; Du, J.; Huo, J.; Zhu, J. Undesirable factors in integer-valued DEA: Evaluating the operational efficiencies of city bus systems considering safety records. Decis. Support Syst. 2012, 54, 330–335. [Google Scholar] [CrossRef]
- Cui, Q.; Li, Y. Evaluating energy efficiency for airlines: An application of VFB-DEA. J. Air Transp. Manag. 2015, 44, 34–41. [Google Scholar] [CrossRef]
- Djordjević, B.; Krmac, E.; Mlinarić, T.J. Non-radial DEA model: A new approach to evaluation of safety at railway level crossings. Saf. Sci. 2018, 103, 234–246. [Google Scholar] [CrossRef]
- Egilmez, G.; McAvoy, D. Benchmarking road safety of U.S. states: A DEA-based Malmquist productivity index approach. Accid. Anal. Prev. 2013, 53, 55–64. [Google Scholar] [CrossRef]
- Han, J.S.; Kim, H.R.; Go, S.Y. Evaluation of efficiency in the Seoul’s arterial bus routes considering undesirable outputs. J. Korean Soc. Transport. 2010, 28, 43–54. [Google Scholar]
- Pal, D.; Mitra, S.K. An application of the directional distance function with the number of accidents as an undesirable output to measure the technical efficiency of state road transport in India. Transp. Res. Part A Policy Pract. 2016, 93, 1–12. [Google Scholar] [CrossRef]
- Roets, B.; Verschelde, M.; Christiaens, J. Multi-output efficiency and operational safety: An analysis of railway traffic control centre performance. Eur. J. Oper. Res. 2018, 271, 224–237. [Google Scholar] [CrossRef]
- Stolzer, A.J.; Friend, M.A.; Truong, D.; Tuccio, W.A.; Aguiar, M. Measuring and evaluating safety management system effectiveness using Data Envelopment Analysis. Saf. Sci. 2018, 104, 55–69. [Google Scholar] [CrossRef]
- Friman, M.; Lättman, K.; Olsson, L.E. Public Transport Quality, Safety, and Perceived Accessibility. Sustainability 2020, 12, 3563. [Google Scholar] [CrossRef]
- Nocera, S. The key role of quality assessment in public transport policy. Traffic Eng. Control 2011, 52, 394–398. [Google Scholar]
- Nocera, S. An operational approach for the quality evaluation in public transport services. Ing. Ferrov. 2010, 65, 363–383. [Google Scholar]
- Charnes, A.; Cooper, W.W.; Rhodes, E. Measuring the efficiency of decision making units. Eur. J. Oper. Res. 1978, 2, 429–444. [Google Scholar] [CrossRef]
- Banker, R.D.; Charnes, A.; Cooper, W.W. Some Models for Estimating Technical and Scale Inefficiencies in Data Envelopment Analysis. Manag. Sci. 1984, 30, 1078–1092. [Google Scholar] [CrossRef] [Green Version]
- Tone, K. A slacks-based measure of efficiency in data envelopment analysis. Eur. J. Oper. Res. 2001, 130, 498–509. [Google Scholar] [CrossRef] [Green Version]
- Tone, K. Dealing with Undesirable Outputs in DEA: A Slacks-Based Measure (SBM) Approach; GRIPS Research Report Series; I-2003-0005; 2003; Available online: https://www.researchgate.net/profile/Kaoru-Tone/publication/284047010_Dealing_with_undesirable_outputs_in_DEA_a_Slacks-Based_Measure_SBM_approach/links/5cca60444585156cd7c1b264/Dealing-with-undesirable-outputs-in-DEA-a-Slacks-Based-Measure-SBM-approach.pdf?origin=publication_detail (accessed on 27 May 2021).
- Tone, K.; Tsutsui, M. Applying an Efficiency Measure of Desirable and Undesirable Outputs in DEA to U.S. Electric Utilities. J. Cent. Cathedra 2011, 4, 236–249. [Google Scholar] [CrossRef]
- Tone, K.; Tsutsui, M. Network DEA: A slacks-based measure approach. Eur. J. Oper. Res. 2009, 197, 243–252. [Google Scholar] [CrossRef] [Green Version]
- Li, Y.; Shi, X.; Emrouznejad, A.; Liang, L. Environmental performance evaluation of Chinese industrial systems: A network SBM approach. J. Oper. Res. Soc. 2018, 69, 825–839. [Google Scholar] [CrossRef]
- Färe, R. Measuring Farrell efficiency for a firm with intermediate inputs. Acad. Econ. Pap. 1991, 19, 329–340. [Google Scholar]
- Färe, R.; Grosskopf, S. Network DEA. Socio-Econ. Plan. Sci. 2000, 34, 35–49. [Google Scholar] [CrossRef]
- Mahmoudabadi, M.Z.; Azar, A.; Emrouznejad, A. A novel multilevel network slacks-based measure with an application in electric utility companies. Energy 2018, 158, 1120–1129. [Google Scholar] [CrossRef]
- Zhu, J. Airlines Performance via Two-Stage Network DEA Approach. J. Cent. Cathedra 2011, 4, 260–269. [Google Scholar] [CrossRef]
- Lozano, S.; Gutierrez, E. A slacks-based network DEA efficiency analysis of European airlines. Transp. Plan. Technol. 2014, 37, 623–637. [Google Scholar] [CrossRef]
- Zhang, Q.; Koutmos, D.; Chen, K.; Zhu, J. Using Operational and Stock Analytics to Measure Airline Performance: A Network DEA Approach. Decis. Sci. 2019. [Google Scholar] [CrossRef]
- Lozano, S.; Gutierrez, E.; Moreno, P. Network DEA approach to airports performance assessment considering undesirable outputs. Appl. Math. Model. 2013, 37, 1665–1676. [Google Scholar] [CrossRef]
- Chen, C.; Yan, H. Network DEA model for supply chain performance evaluation. Eur. J. Oper. Res. 2011, 213, 147–155. [Google Scholar] [CrossRef]
- Momeni, E.; Azadi, M.; Saen, R.F. Measuring the efficiency of third party reverse logistics provider in supply chain by multi objective additive network DEA model. Int. J. Shipp. Transp. Logist. 2015, 7, 21. [Google Scholar] [CrossRef]
- Omrani, H.; Keshavarz, M. A performance evaluation model for supply chain of shipping company in Iran: An application of the relational network DEA. Marit. Policy Manag. 2016, 43, 121–135. [Google Scholar] [CrossRef]
- Kahi, V.S.; Yousefi, S.; Shabanpour, H.; Saen, R.F. How to evaluate sustainability of supply chains? A dynamic network DEA approach. Ind. Manag. Data Syst. 2017, 117, 1866–1889. [Google Scholar] [CrossRef] [Green Version]
- Wanke, P.F. Physical infrastructure and shipment consolidation efficiency drivers in Brazilian ports: A two-stage network-DEA approach. Transp. Policy 2013, 29, 145–153. [Google Scholar] [CrossRef]
- Yu, M.-M.; Lin, E.T. Efficiency and effectiveness in railway performance using a multi-activity network DEA model. Omega 2008, 36, 1005–1017. [Google Scholar] [CrossRef]
- Hahn, J.-S.; Kim, D.-K.; Kim, H.-C.; Lee, C. Efficiency analysis on bus companies in Seoul city using a network DEA model. KSCE J. Civ. Eng. 2013, 17, 1480–1488. [Google Scholar] [CrossRef]
- Shirazi, F.; Mohammadi, E. Efficiency evaluating and improvement by using the network SBM-DEA model with undesirable output: A case study of Iranian airlines. IJDEA 2019, 7, 47–64. [Google Scholar]
- Fukuyama, H.; Weber, W.L. A slacks-based inefficiency measure for a two-stage system with bad outputs. Omega 2010, 38, 398–409. [Google Scholar] [CrossRef]
- Huang, J.; Chen, J.; Yin, Z. A Network DEA Model with Super Efficiency and Undesirable Outputs: An Application to Bank Efficiency in China. Math. Probl. Eng. 2014, 2014, 793192. [Google Scholar] [CrossRef]
- Lozano, S. Alternative SBM Model for Network DEA. Comput. Ind. Eng. 2015, 82, 33–40. [Google Scholar] [CrossRef]
- Liu, Y.; Wang, K. Energy efficiency of China’s industry sector: An adjusted network DEA (data envelopment analysis)-based decomposition analysis. Energy 2015, 93, 1328–1337. [Google Scholar] [CrossRef]
- Førsund, F.R. A comparison of parametric and non-parametric efficiency measures: The case of Norwegian ferries. J. Prod. Anal. 1992, 3, 25–43. [Google Scholar] [CrossRef]
- Bang, H.-S.; Kang, H.-W.; Martin, J.; Woo, S.-H. The impact of operational and strategic management on liner shipping efficiency: A two-stage DEA approach. Marit. Policy Manag. 2012, 39, 653–672. [Google Scholar] [CrossRef]
- Chao, S.-L.; Yu, M.-M.; Hsieh, W.-F. Evaluating the efficiency of major container shipping companies: A framework of dynamic network DEA with shared inputs. Transp. Res. Part A Policy Pract. 2018, 117, 44–57. [Google Scholar] [CrossRef]
- Chung, C.C.; Hwang, C.C. analysis on vessel registration and operational performance of bulk-shipping firms. Proc. East. Asia Soc. Transport. Stud. 2005, 5, 631–646. [Google Scholar]
- Gong, X.; Wu, X.; Luo, M. Company performance and environmental efficiency: A case study for shipping enterprises. Transp. Policy 2019, 82, 96–106. [Google Scholar] [CrossRef]
- Gutierrez, E.; Lozano, S.; Furió, S. Evaluating efficiency of international container shipping lines: A bootstrap DEA approach. Marit. Econ. Logist. 2014, 16, 55–71. [Google Scholar] [CrossRef]
- Huang, W.H.; Chao, S.L.; Chang, C.C. Assessment of differences in efficiency across strategic groups in the container shipping context: A data envelopment analysis. Int. J. Shipp. Transp. Logist. 2017, 9, 651–672. [Google Scholar] [CrossRef]
- Lin, W.C.; Liu, C.F.; Chu, C.W. Performance efficiency evaluation of the Taiwan’s shipping industry: An application of data envelopment analysis. Proc. East. Asia Soc. Transport. Stud. 2005, 5, 467–476. [Google Scholar]
- Panayides, P.M.; Lambertides, N.; Savva, C.S. The relative efficiency of shipping companies. Transp. Res. Part E Logist. Transp. Rev. 2011, 47, 681–694. [Google Scholar] [CrossRef]
- Chang, M.H. A study on the management efficiency of coastal passenger routes in Korea. Korean Logist. Rev. 2010, 20, 217–242. [Google Scholar]
- Jo, G.S.; Yeo, G. A Study on the Operational Efficiency of Coastal Passenger Route using a DEA and Malmquist Index. Korean J. Logist. 2013, 21, 67–84. [Google Scholar] [CrossRef]
- Caves, D.W.; Christensen, L.R.; Diewert, W.E. The Economic Theory of Index Numbers and the Measurement of Input, Output, and Productivity. Econometrica 1982, 50, 1393. [Google Scholar] [CrossRef]
- Yu, M.-M.; Chen, L.-H.; Hsiao, B. A performance-based subsidy allocation of ferry transportation: A data envelopment approach. Transp. Policy 2018, 68, 13–19. [Google Scholar] [CrossRef]
- Du, J.; Cook, W.D.; Liang, L.; Zhu, J. Fixed cost and resource allocation based on DEA cross-efficiency. Eur. J. Oper. Res. 2014, 235, 206–214. [Google Scholar] [CrossRef]
- Park, S.H.; Pham, T.Y.; Yeo, G.T. The Impact of Ferry Disasters on Operational Efficiency of the South Korean Coastal Ferry Industry: A DEA-Window Analysis. Asian J. Shipp. Logist. 2018, 34, 248–255. [Google Scholar] [CrossRef]
- Charnes, A.; Clark, C.T.; Cooper, W.W.; Golany, B. A developmental study of data envelopment analysis in measuring the efficiency of maintenance units in the U.S. air forces. Ann. Oper. Res. 1984, 2, 95–112. [Google Scholar] [CrossRef]
- Pham, T.; Lee, G.; Kim, H. Toward Sustainable Ferry Routes in Korea: Analysis of Operational Efficiency Considering Passenger Mobility Burdens. Sustainability 2020, 12, 8819. [Google Scholar] [CrossRef]
- Park, S.H.; Yeo, G.T. Study On ferry business efficiency analysis considering undesirable variable. J. Shipp. Logist. 2020, 36, 1–18. [Google Scholar]
- Chang, Y.-T.; Lee, S.; Park, H.K. Efficiency analysis of major cruise lines. Tour. Manag. 2017, 58, 78–88. [Google Scholar] [CrossRef]
- Kim, J.; Lee, G.; Kim, H. Analysis of Operational Efficiency Considering Safety Factors as an Undesirable Output for Coastal Ferry Operators in Korea. J. Mar. Sci. Eng. 2020, 8, 367. [Google Scholar] [CrossRef]
- Boussofiane, A.; Dyson, R.; Thanassoulis, E. Applied data envelopment analysis. Eur. J. Oper. Res. 1991, 52, 1–15. [Google Scholar] [CrossRef]
- Dyson, R.; Allen, R.; Camanho, A.; Podinovski, V.; Sarrico, C.; Shale, E. Pitfalls and protocols in DEA. Eur. J. Oper. Res. 2001, 132, 245–259. [Google Scholar] [CrossRef]
- Tsai, W.-H.; Lee, H.-L.; Yang, C.-H.; Huang, C.-C. Input-Output Analysis for Sustainability by Using DEA Method: A Comparison Study between European and Asian Countries. Sustainability 2016, 8, 1230. [Google Scholar] [CrossRef] [Green Version]
- Yeh, L.T. Comparative study of various methods for treating zero undesirable outputs in data envelopment analysis. In Proceedings of the ISER 135th International Conference, Saint Petersburg, Russia, 9–10 July 2018. [Google Scholar]
- Ma, Y.; Zhao, Q.; Xi, M. Decision-makings in safety investment: An opportunity cost perspective. Saf. Sci. 2016, 83, 31–39. [Google Scholar] [CrossRef]


| Inputs | Intermediates | Desirable Output | Undesirable Output |
|---|---|---|---|
| : Fleet size : Service frequency : Route distance | : Transport capacity : Passenger-km | : Revenue | : Safety defects records |
| Var. | Description |
|---|---|
| The number of ships actually operated during the observation period (Except for the reserve fleet owned by ferry operators) | |
| The number of available service frequencies during the observation period | |
| Sum of the Origin-Destination distance of ferry operators’ licensed routes | |
| Sum of the allowable number of passengers on board the ships | |
| Total number of carried passengers multiplied to the distance travelled during the observation period | |
| Total revenue from ferry transport service during the observation period | |
| Total number of accident and detention records during the observation period |
| Classification | Damage Type | |
|---|---|---|
| Ship damage | Total loss | 0.238 |
| Significant damage | 0.092 | |
| Minor damage | 0.030 | |
| No damage | 0.019 | |
| Casualties | 1st class casualties | 0.410 |
| 2nd class casualties | 0.145 | |
| 3rd class casualties | 0.048 | |
| No casualties | 0.019 |
| Var. | |||||||
|---|---|---|---|---|---|---|---|
| Mean | 1.000 | 1.000 | 1.000 | 1.000 | 1.000 | 1.000 | 1.000 |
| Std Dev. | 0.430 | 0.712 | 1.123 | 0.920 | 1.616 | 1.569 | 0.973 |
| Max. | 0.450 | 0.507 | 1.262 | 0.847 | 2.612 | 2.461 | 0.947 |
| Min. | 0.185 | 0.145 | 0.091 | 0.181 | 0.034 | 0.056 | 0.000 |
| Stage | Var. | |||
|---|---|---|---|---|
| SG | 1.000 | |||
| 0.269 | 1.000 | |||
| 0.491 * | 0.448 * | 1.000 | ||
| SE | Var. | |||
| 1.000 | ||||
| 0.031 | 1.000 | |||
| 0.057 | 0.752 ** | 1.000 | ||
| TC | Var. | |||
| 1.000 | ||||
| 0.970 ** | 1.000 | |||
| 0.727 ** | 0.656 ** | 1.000 |
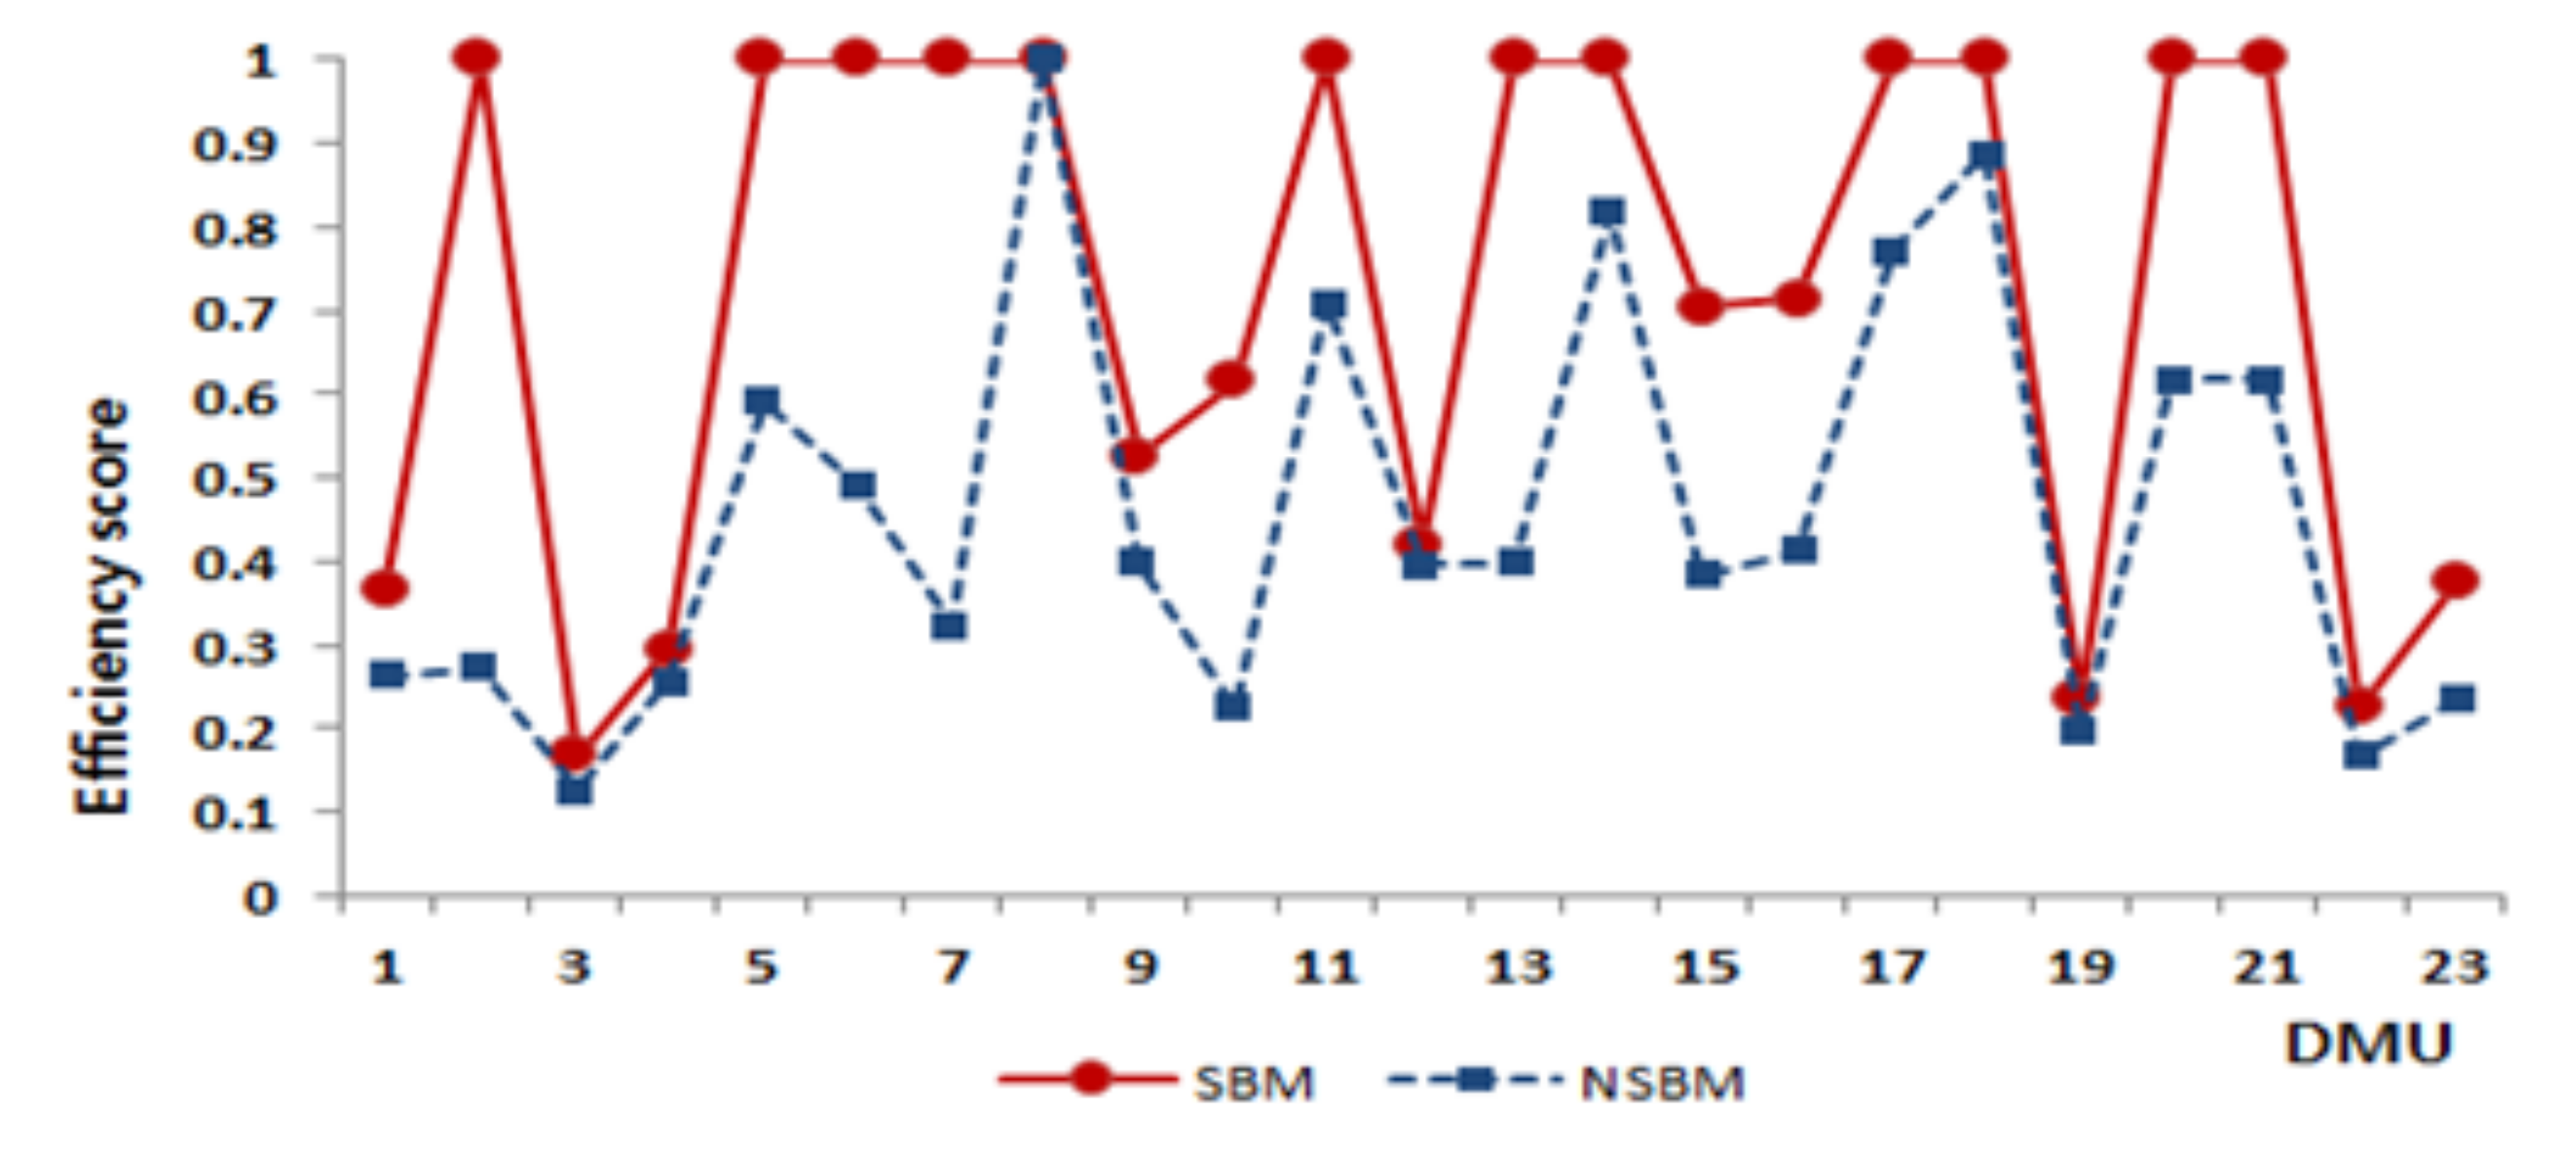
| DMU | SBM | Network SBM | ||||||
|---|---|---|---|---|---|---|---|---|
| Overall Efficiency | Divisional Efficiency | Reference Set(λ) | ||||||
| SG | SE | TC | SC | SE | TV | |||
| 1 | 0.368 | 0.263 | 0.329 | 0.220 | 0.396 | 4(0.052); 20(0.948) | 5(0.475); 8(0.427); 18(0.098) | 11(0.500); 17(0.500) |
| 2 | 1.000 | 0.273 | 0.579 | 1.000 | 0.346 | 4(0.050); 20(0.950) | 2(1.000) | 8(0.320); 12(0.680) |
| 3 | 0.167 | 0.127 | 0.343 | 0.110 | 0.190 | 4(0.040); 20(0.960) | 2(0.346); 8(0.569); 18(0.085) | 11(0.098); 12(0.902) |
| 4 | 0.295 | 0.257 | 0.350 | 0.086 | 0.380 | 4(0.163); 20(0.837) | 2(0.605); 18(0.395) | 11(0.547); 12(0.453) |
| 5 | 1.000 | 0.592 | 0.843 | 1.000 | 0.643 | 4(0.049); 20(0.951) | 5(1.000) | 11(0.801); 17(0.199) |
| 6 | 1.000 | 0.492 | 0.502 | 1.000 | 0.655 | 4(0.141); 20(0.859) | 6(1.000) | 11(0.018); 17(0.982) |
| 7 | 1.000 | 0.324 | 0.719 | 0.456 | 0.377 | 4(0.040); 20(0.960) | 2(0.553); 8(0.399); 18(0.0478) | 11(0.048); 12(0.952) |
| 8 | 1.000 | 1.000 | 1.000 | 1.000 | 1.000 | 8(1.000) | 8(1.000) | 8(1.000) |
| 9 | 0.527 | 0.398 | 0.315 | 0.830 | 0.605 | 4(0.148); 20(0.852) | 6(0.964); 18(0.036) | 11(0.078); 12(0.923) |
| 10 | 0.616 | 0.225 | 0.620 | 0.168 | 0.277 | 4(0.018); 20(0.982) | 5(0.006); 8(0.916); 18(0.079) | 11(0.085); 12(0.858); 17(0.057) |
| 11 | 1.000 | 0.708 | 0.417 | 0.844 | 1.000 | 4(0.185); 20(0.815) | 5(0.381); 8(0.121); 18(0.500) | 11(1.000) |
| 12 | 0.420 | 0.395 | 0.268 | 0.159 | 0.623 | 4(0.154); 20(0.846) | 6(0.931); 18(0.069) | 11(0.114); 17(0.886) |
| 13 | 1.000 | 0.398 | 0.365 | 1.000 | 0.583 | 4(0.168); 20(0.8325) | 13(1.000) | 11(0.614); 17(0.386) |
| 14 | 1.000 | 0.817 | 0.634 | 0.793 | 1.000 | 20(1.000) | 4(0.006); 5(0.045); 8(0.874); 20(0.075) | 14(1.000) |
| 15 | 0.705 | 0.384 | 0.401 | 0.798 | 0.548 | 4(0.067); 20(0.933) | 2(0.841); 6(0.149); 18(0.010) | 11(0.009); 12(0.991) |
| 16 | 0.714 | 0.413 | 0.682 | 0.273 | 0.491 | 16(0.137); 20(0.863) | 5(0.277); 8(0.723) | 11(0.191); 17(0.809) |
| 17 | 1.000 | 0.771 | 0.543 | 0.673 | 1.000 | 4(0.089); 20(0.911) | 2(0.579); 6(0.419); 18(0.003) | 17(1.000) |
| 18 | 1.000 | 0.887 | 0.775 | 1.000 | 1.000 | 4(0.335); 20(0.665) | 18(1.000) | 18(1.000) |
| 19 | 0.235 | 0.195 | 0.373 | 0.084 | 0.284 | 4(0.176); 20(0.824) | 6(0.818); 18(0.182) | 11(0.278); 12(0.722) |
| 20 | 1.000 | 0.617 | 1.000 | 1.000 | 0.617 | 20(1.000) | 20(1.000) | 11(0.314); 17(0.686) |
| 21 | 1.000 | 0.618 | 0.687 | 1.000 | 0.732 | 4(0.468); 20(0.532) | 21(1.000) | 11(0.099); 17(0.901) |
| 22 | 0.226 | 0.168 | 0.321 | 0.159 | 0.255 | 4(0.081); 20(0.919) | 2(0.575); 8(0.261); 18(0.164) | 11(0.208); 17(0.792) |
| 23 | 0.374 | 0.235 | 0.213 | 0.148 | 0.388 | 4(0.007); 20(0.993) | 5(0.263); 8(0.539); 20(0.198) | 11(0.250); 17(0.750) |
| Avg. | 0.724 | 0.459 | 0.534 | 0.600 | 0.582 | |||
| Classification | Divisional Efficiency | |||
|---|---|---|---|---|
| Overall efficiency | 0.649 ** | 0.699 ** | 0.960 ** | |
Publisher’s Note: MDPI stays neutral with regard to jurisdictional claims in published maps and institutional affiliations. |
© 2021 by the authors. Licensee MDPI, Basel, Switzerland. This article is an open access article distributed under the terms and conditions of the Creative Commons Attribution (CC BY) license (https://creativecommons.org/licenses/by/4.0/).
Share and Cite
Kim, J.; Kim, H. Evaluation of the Efficiency of Maritime Transport Using a Network Slacks-Based Measure (SBM) Approach: A Case Study on the Korean Coastal Ferry Market. Sustainability 2021, 13, 6094. https://0-doi-org.brum.beds.ac.uk/10.3390/su13116094
Kim J, Kim H. Evaluation of the Efficiency of Maritime Transport Using a Network Slacks-Based Measure (SBM) Approach: A Case Study on the Korean Coastal Ferry Market. Sustainability. 2021; 13(11):6094. https://0-doi-org.brum.beds.ac.uk/10.3390/su13116094
Chicago/Turabian StyleKim, Joohwan, and Hwayoung Kim. 2021. "Evaluation of the Efficiency of Maritime Transport Using a Network Slacks-Based Measure (SBM) Approach: A Case Study on the Korean Coastal Ferry Market" Sustainability 13, no. 11: 6094. https://0-doi-org.brum.beds.ac.uk/10.3390/su13116094