1. Introduction
To reduce the carbon dioxide emissions of ships, measures have been taken in relation to speed control, quality of the fuel used, state of conservation of a ship’s hull, and time required to perform mooring and unmounting maneuvers [
1].
Today, new and innovative automatic mooring systems using vacuum suction cups are being developed, leading to a saving in the maneuver times of the ships. These systems are already installed and operating in 23 docks in 12 different countries and different types of terminals such as general cargo, ro-ro and passenger cargo, container, jetty, or locks. This study focuses on specialized container terminals used by container ships.
The three ports in which this automatic mooring technology is currently being used are Salalah in Oman, Beirut in Lebanon, and Ngqura in South Africa.
The average time devoted to the berthing maneuver of a ship to moor and unmoor again is reduced from 30 min to about 30 s by changing the method of mooring from the traditional to automatic mooring systems using vacuum suction cups.
The objective of this study is to quantify the reduction of dioxide emissions at container terminals during ship mooring operations, using automatic mooring systems via vacuum suction cups.
Two different “bottom-up” methodologies, the Environmental Protection Agency (EPA) [
2] and Environmental and Engineering Consultancy (ENTEC) [
3], are used to calculate the emissions and thus make a comparison between the results obtained by the two methods.
Once the carbon dioxide emissions produced by the container ships have been calculated, the emissions per twenty-foot equivalent unit transported can be determined.
A twenty-foot equivalent unit (TEU) is a shipping container whose internal dimensions measure about 20 feet long, 8 feet wide, and 8 feet tall. It can hold between 9 and 11 pallets, depending on whether they are standard pallets or EUR-pallets. Two TEUs have the capacity of a single FEU [
4].
2. Background
According to data from the World Bank [
5], maritime container traffic has gone from 225 million TEUs in 2000 to 700 million twenty-foot equivalent units (TEUs) in 2019, with the number and size of vessels also increasing: In the year 2000, the largest vessels were able to transport approximately 7000 TEUs, while currently, they can carry up to 20,000. In the last decade, the capacity of the fleet has increased by 240%, reaching 19.7 million TEUs at the end of 2015, and it is expected to reach 24 million in 2022, according to the international maritime association BIMCO [
6].
Taking into account that today, the largest volume of non-bulk merchandise is transported in containers, it is not surprising that there are numerous studies that deal with the problem of gas emissions to the atmosphere generated by container traffic by sea.
In 2004, a study was published [
7] that aimed to establish a precautionary approach concerning air pollution related to ports, promoting the local production of goods to reduce maritime traffic, proposing a more ecological design for new terminals and cutting-edge approaches to emission control that have proven to be successful in ports around the world.
In 2007, a study by Yang [
8] estimated the total CO
2 emissions in 2003 at the port of Shanghai to stand at 3 million tons. The total number of vessels studied was approximately 1.3 million, of which 57% were ships sailing through the Inland Port and 43% were ships in the Outer Port.
In 2015, Acciaro and McKinnon published a paper [
9] aimed at helping both shipping companies to develop plans to reduce carbon emissions and governments to design appropriate policies to encourage decarbonization of the maritime sector.
A study published in 2016 by Cullinane [
10] estimated the atmospheric emissions emitted by container ships during mooring operations in 2012 in the three largest container ports in Taiwan: Kaohsiung, Keelung, and Taichung. It was estimated that approximately 58.65% of emissions occurred in Kaohsiung; however, emissions per container in this port were the lowest compared to those of the other two ports of the study.
Another study, also from 2016 [
1], which examined how to reduce vessel emissions and air pollution in the process of entering and leaving a port, focused research on the relation between the emissions of polluting gases from a vessel, its speed, and the journey made and calculated the emissions of vessels through a quantitative calculation model.
Other studies have also focused on the operational side of container transport, such as the work by Hou in 2017 [
11] that established the optimization of intermodal container transport in port as the main problem of the port operator, also studying the possibility of reducing emissions by improving operational efficiency. The same author [
12] highlighted the common challenge faced by both container terminal operators and shipowners: how to reduce vessel emissions during the period of navigation, mooring, and loading or unloading.
In 2017, another study [
12] found that in the Busan container terminal in South Korea, an average of 108.2 million kg of CO
2 equivalent emissions is produced annually in five types of processes: 51.1% in the maneuvering process of vessels, 0.57% in the process of securing a vessel to its berth, 37.3% during loading and unloading of a vessel, 1.0% in container transport by truck through the terminal, and 9.9% during the process of receiving and delivering a container. This study indicated that more than 50% of CO
2 emissions in container terminals are the product of operations with vessels.
More recently, in 2018, two studies were presented: In the first one, the total carbon emissions in container terminals and in their installations, trucks, cranes, and docked vessels were analyzed, concluding that the most polluting part in this total is maritime [
13]; in the second one, emissions of post-Panamax container ships in navigation were calculated using different methods [
14].
In 2017, Martinez [
15] conducted research which provided key information about the real energy consumption and CO
2 emissions of one of the most relevant container terminals in the Mediterranean area, located in Valencia, Spain.
In 2020, a paper by Likun [
16] proposed an easily implemented method for calculating CO
2 emissions from port container distribution (PCD) and investigated their spatial characteristics and driving factors.
In 2020, a study by Asariotis [
17] reflected the influence of the pandemic on global container traffic [
18].
3. Description of the Automatic Mooring System (AMS)
The Ports of Salalah in Oman [
19], Beirut in Libya, and Ngqura in South Africa use an innovative automatic mooring system (AMS) developed by Cavotec [
20], which instead of the traditional ropes uses vacuum suction cups to secure the vessel to the dock, providing the physical coupling between them in a safe and controlled manner.
The system consists of robots equipped with vacuum suction cups remotely controlled, which can be installed on the edge of the pier or above it and are joined by arms with a vertical and horizontal movement, hydraulically operated, allowing the fixing of the ship’s hull to the pier through the vacuum such vacuum cups in a few seconds [
21].
It is a very fast system and can be activated or deactivated by operating a single button, offering, among others, environmental benefits, since it reduces the maneuver time and in cases of contrary winds avoids the need for the use of tugs to push the hull against the dock to secure the vessel.
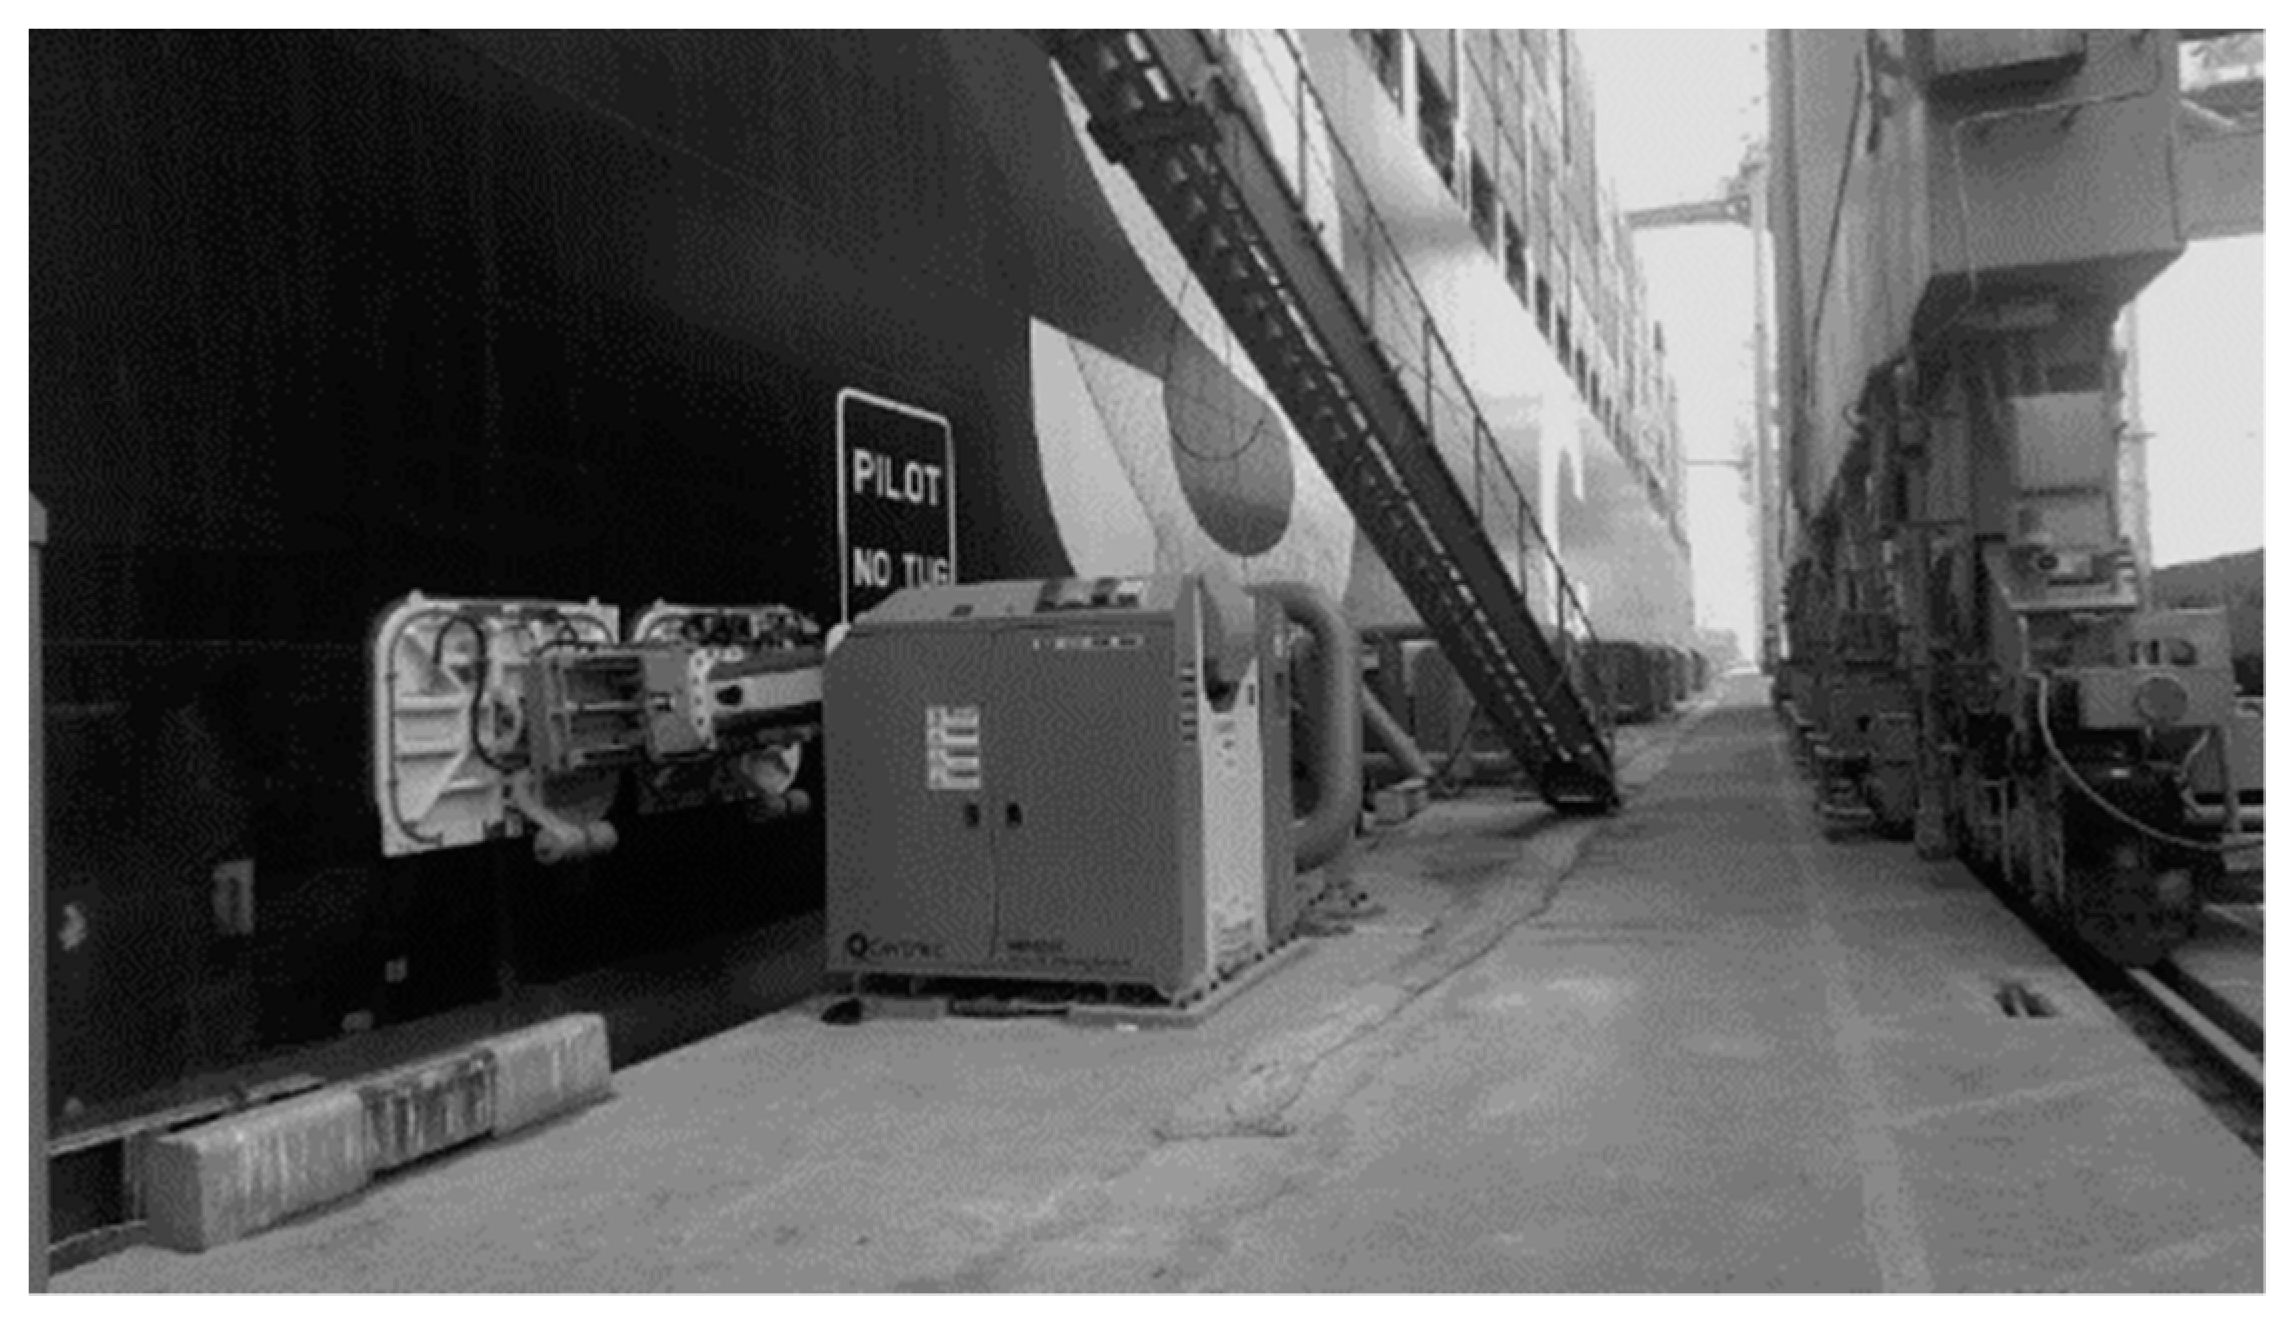
In the port of Salalah, it was decided to install an AMS because the system can work with generators independent of the electric network and because the monsoon season, which usually begins in July and lasts three months, brings with it swells, low visibility, and a unique set of challenges for that port (see
Figure 1).
In general, the loading of container ships is a very precise and difficult operation for the person operating the crane if the vessel is moving, a situation which is normally due to the effects of meteorology or currents, so that it is at times necessary to suspend loading operations until the vessel is totally stationary. This problem is solved with the AMS since it not only cushions the movement of the vessel, but it also makes mooring more resistant to inclement weather.
4. Methodology
To carry out the present work, it is necessary to have evidence-based information on the movement of container ships in terminals equipped with an AMS; therefore, two databases are required, one containing info on ports equipped with AMS container terminals and a second database to relate the vessels operating in those terminals and the frequency of stopovers, adding some technical characteristics obtained from the database in Fairplay [
23].
Next, we have to calculate the CO2 emissions of container ships to the atmosphere while ships are being moored, taking into account that this operation only covers the final time of the complete berthing maneuver.
Calculations take into consideration two different methods of mooring, the first assuming vessel moors with traditional mooring methods and ropes in the bow and stern and the second assuming that the vessel moors with the help of an AMS.
Once the results for both methods of mooring are obtained, we can compare the total emissions in order to obtain the total of reduced CO2 emissions when using automatic mooring systems.
With the average value of CO2 reductions resulting from the arithmetic mean between the two methods and information already gathered from the yearly TEU sea transport in ports with an AMS and the capacity of vessels in TEUs, we can obtain the exact value of reduced emissions by TEU when using both methods, i.e., the AMS and the traditional system of mooring container ships.
Finally, the value of reduced emissions by TEU using an AMS was extrapolated and implemented in the maritime traffic of containers in ports in the countries with the largest port traffic around the world. This is how we were able to calculate yearly emissions per TEU.
To conclude the calculations of emissions, two different methodologies were employed, EPA and ENTEC, already used in previous studies that have been published in the past [
24,
25,
26,
27].
The EPA methodology [
2,
27] is a mathematical model described in the document “Vessels Emissions and Fuel Consumption Data”, which uses a methodology based on three stages of calculation. The first measures the time a ship takes for each of the different modes of operation. In the second stage, fuel consumption is calculated for each operating mode, and in the third, emissions are calculated using the data of the specific emission consumption factor of each fuel. These calculations are made as a function of the type of vessel and engine power. In the EPA method, ship emissions are “E”.
The ENTEC method [
3,
27,
28] has been used to develop bottom-up inventories on a European level for several consecutive years [
29]. In the ENTEC inventories, emissions are estimated individually for each vessel using weighted emission factors, and in order to verify their movements, the Lloyd’s Marine Intelligence Unit (LMIU) database is used, this being the only commercial database of all of the movements of vessels in the world; it also registers their characteristics, such as type of vessel and speed. This type of vessel data is used mainly to obtain an approximation to general data, such as the type of fuel used or the characteristics of the engines.
The following formulas were included in the calculations of average emission in each port depending on the method used:
AER 1 … n stands for the difference in CO
2 emissions when mooring using an
AMS and
ropes in every chosen port.
TER is the sum of
AER 1 … n; these are the total reduced emissions divided by the number of chosen ports.
To calculate the reduction in emissions by
TEU, we considered the average occupancy in vessels per call after gathering the data of yearly
TEU maritime transport in ports with
AMS and the capacity of the vessels in
TEUs.
ERTEU being equal to the average reduction in CO2 emissions by TEU during the time saved by doing the maneuver of mooring with an AMS and number of TEUs moved in the chosen ports by the vessels operating in them in a month.
5. Case Study: Container Ships
The data on the ports used to develop this work, the year of installation of the AMS, and the times used for the maneuvers with an AMS were provided to us by Cavotec [
18], the company that supplies the AMS all over the world.
As mentioned above, automatic mooring systems are currently installed in the container terminals of Salalah in Oman, Beirut in Lebanon, and Ngqura in South Africa, ports that have supported an average movement of 424,000 TEUs per month in the last four years [
23,
24].
The calculations of CO2 emissions to the atmosphere shown below, carried out applying the methodologies described above, are those produced during the month of May 2017 by the 225 container ships that operated in the selected ports, in the time taken for the mooring phase during the berthing maneuvers, for a total of 280 calls.
These calculations were made for two different situations: using an AMS to tie the ship to the dock and mooring the dock by means of ropes or cables, that is, the traditional system.
Table 1 shows the data for the average movement of vessels and TEUs in the ports selected for the study, for the period 2014–2017.
In the port of Salalah, in May 2017, there was a total of 158 calls, carried out by 140 different ships, with a total theoretical capacity among all the ships that arrived of 945,944 TEUs, which represents an average of 5987 TEUs per call, with an average percentage of occupation of loading spaces of vessels of 28.35%.
The vessel with the largest tonnage that moored that month in the container terminal was the MSC La Spezia with a GT of 153,115 tons, a length of 365 m, and a load capacity of 14,036 TEUs, its power installed in the main engine being 72,240 Kw and in its auxiliary engines, 15,600 Kw. The vessel with the lowest tonnage was the Alice Rickmers of 2631 tons of GT and a length of 195 m, a load capacity of 1850 TEUs, and a power installed in the main engine of 12,000 Kw and in its auxiliary engines, 3500 Kw.
In Beirut, in the same month, the number of vessels that called at the container terminal was 66, making 84 calls, with a total capacity in TEUs of 320,420, which gives an average of 3814 TEUs per ship, with an average occupation of vessel capacities of 31.16%.
The vessel with the largest tonnage that berthed that month in the container terminal was the MSC New York with 176,490 tons, a length of 399 m, and a load capacity of 16,652 TEUs, with a power installed in the main engine of 53,802 Kw and in the auxiliary engine, 17,380 Kw. The vessel with the lowest tonnage was the Shuttle 2 with 2900 tons of GT, a length of 98 m, and a load capacity of 366 TEUs, with a power installed in the main engine of 2940 Kw and in the auxiliary engine of 1102 Kw.
Finally, the data recorded in the port of Ngqura in May 2017 tell us that the number of vessels that called at their terminal was 19, making 2 calls per ship, with a total capacity of 352,520 TEUs, or in other words, with an average of 9.277 TEUs per vessel, with an average percentage of occupation of the loading spaces of vessels of 16%.
The vessel with the largest tonnage that moored that month in the container terminal was the Eugen Maersk with 171,542 tons, with a length of 398 m and a load capacity of 17,816 TEUs, with a power installed in the main engine of 80,080 Kw and in the auxiliary engine, 29,240 Kw. The vessel with the lowest tonnage was the MOL Proficience of 71,906 tons of GT, a length of 293 m, and a load capacity of 6350 TEUs, with a power installed in the main engine of 62,920 Kw and in the auxiliary engine, 10,000 Kw.
Parallel to the port data, a database was made with the 225 container ships that operated in these three ports in the month of May 2017, the month from which we obtained all the necessary data on the total traffic, which includes all their technical characteristics (length, gross tonnage, power of the main engines, ME, and auxiliary engines, AE, in kW, ports where they operate, and capacity of each vessel in TEUs). These data are gathered in
Table 2, where the average values are shown based on the number of calls recorded.
Since some vessels made more than one call in the same port, the total number of calls registered was 280.
The names of the vessels used in this study were obtained from the various webpages of the three ports selected [
23,
24], and these pages also provided data on the traffic for that month. The Fairplay [
19] database was consulted using the names of the vessels in order to obtain their characteristics.
In order to verify the times required for the maneuvers performed using the traditional mooring methods, acting officers onboard the vessels of this type were consulted, providing us with sufficient data to establish an average time for such maneuvers. The result of these surveys was that as an average value, the times employed for mooring operations with ropes was 30 min, and according to the specifications of the manufacturer, when an AMS is installed, the time required is 30 s, the average time it takes to secure a vessel to the dock with this system. On the website of the Cavotec [
22] company, you can see the time needed to carry out a mooring operation with an AMS. Thus, the reduction in emissions is made in those 29.5 min saved when performing mooring operations with an AMS, a time in which CO
2 would no longer be emitted into the atmosphere.
6. Results
This section presents the results of the calculations of the CO2 emissions emitted by the vessels selected in each port, obtained using the EPA and ENTEC methods, both for maneuvers with ropes and with an AMS. Once these values are known, the value of the reduction in CO2 emissions due to the use of an AMS can be calculated for the total of maneuvers that vessels perform in the ports selected for the study, thus obtaining the amounts of CO2 whose emission is avoided per day, week, month, and year. Finally, and considering the number of TEUs that are moved annually in these ports, the average reduction in emissions per TEU during the time saved by performing mooring maneuvers with an AMS can be calculated, both for the vessels and for the selected ports.
6.1. Emissions of CO2 during Mooring Operations and Calculation of Average Emissions When Using Ropes and When Using an AMS
Table 2 presents the results of the calculations of the CO
2 emissions produced in the total number of the vessels selected in each port per month, week, day, and year, obtained using the EPA [
2] and ENTEC [
3] methods, both for maneuvers with ropes and with an AMS, as well as their average value [AE].
Taking into account the calculations made using the ENTEC methodology [
3,
23], when adding the daily emissions made by vessels using an AMS in the three ports equipped with the system, the total is 0.6 tons of CO
2 as compared to the 36 tons that would have been emitted if maneuvers had been made with ropes.
The results per day using the EPA methodology provide CO2 emission figures of 0.7 tons using an AMS, while for maneuvers with ropes, this figure is 45.3 tons.
The difference in the emissions when using one system or the other is 0.2 tons of CO2 per day using an AMS and 9.34 tons of CO2 when mooring with ropes.
6.2. Calculation of the Reduction in Emissions in Container Ports with AMS
Table 2 also shows the values of the reduction in CO
2 emissions (ER) due to the use of an AMS for the total of maneuvers made by the vessels in each port and according to the different calculation methods.
In view of the results obtained, the average monthly value of the reduction in CO2 emissions in each port due to the use of an AMS can be determined, as well as the aggregate values of the three ports.
From the data obtained, expressed in annual terms, we obtain an average amount of reduction in CO2 emissions of 14,395.3 tons, the amount of emissions per year without using an AMS being 14,639.2 tons, while when using it, this value is 243.8 tons. From these data, it can be inferred that the ports in which an AMS is installed are reducing their emissions by 98%.
6.3. Calculation of the Reduction in Emissions Per TEU in Ports with AMS Installed
In
Table 3, by applying Formula (5), the average reduction in emissions per TEU is calculated based on the 29.5 min saved by performing mooring maneuvers using an AMS rather than with ropes in the selected ports with their respective traffic.
According to
Table 3, the average emissions per TEU using ropes are 2.9 kg/TEU and using an AMS are 0.05 Kg/TEU.
7. Discussion
When a vessel arrives at the port to carry out operations, whether loading or unloading, the berthing maneuver begins, in which several auxiliary vessels may be involved, such as pilot boats, mooring vessels, and tugboats, as well as the vessel itself. During this maneuver, two phases can be differentiated, one following the other, the first being the approach phase of the vessel to the dock, during which auxiliary vessels have a more active role, and the second being the actual mooring operation. The latter will have a more or less prolonged duration in time depending on the means used to secure the vessel to the dock. Today, two completely different models are available: on the one hand, mooring of the ship to land using the traditional rope system and, on the other hand, vacuum systems that secure the vessel to land by means of suction elements (AMS).
In recent years, European regulations have been drawn up [
26,
27] to limit greenhouse gas (CO
2) emissions in the case of the emission of pollutants harmful to health produced by vessels during approach to port and berthing and unberthing maneuvers. The fluctuations in emissions in these different stages depend on different factors, such as engine speed or speed control [
28,
29,
30], the quality of fuel used, the state of conservation of the vessel and hull or the times taken to carry out maneuvers of mooring or unmooring with ropes [
26,
31].
Currently, there are serious limitations on CO2 emissions from vessels in port, as the main commercial ports are often very close to urban centers.
Anthropogenic activity contributes to climate change with significant environmental implications and impacts on the economy, resource availability, and human welfare.
The port activities of maritime transport must be involved in the development of initiatives to reduce the emission of greenhouse gases. In this context, the determination of the initial CO2 emission with a traditional mooring system allows us to contribute to the calculation of these emissions with respect to this port activity. The application of the technical measure of the mooring system constitutes a mitigation activity or an initiative to reduce emissions, and the emission of CO2/TEU is a specific indicator of CO2 emission.
Therefore, the determination of these factors related to GHG emissions would facilitate the application of ISO 14064-1: 2008 [
32] by increasing the environmental integrity of the GHG quantification of the port facility.
Previous studies have determined the suitability of the use of the AMS as a system that contributes significantly to the reduction in levels of greenhouse gas emissions, in particular of CO
2 emissions, in multimodal terminals [
33] and in terminals of regular line Ro-Ro/Pax vessels [
34,
35]. As a follow-up to these studies, in this paper, we focused on those container ship terminals which, according to the AMS manufacturer, have an AMS installed in them: Beirut, Ngqura, and Salalah.
From the results shown in
Table 3, it can be deduced that the emissions of vessels that operate monthly in the aforementioned ports would amount to a total of 1220 tons of CO
2 if they performed the maneuvers with ropes, compared to the 20 tons that they emit when mooring with an AMS. This result clearly shows the effectiveness of the application of these modern mooring systems with respect to the traditional method, since in just one month, and in just three ports, the savings in emissions would be around 1200 tons of CO
2.
As we have data available on the traffic of container ships that move monthly in these ports (
Table 3), it is possible to obtain a highly significant datum, never previously calculated, which is what each TEU that is transported in a container terminal contributes in terms of CO
2 emissions, both when mooring a vessel with ropes and with an AMS, and, thus, the savings in emissions that the use of the vacuum cup system implies. Between the three ports, an average value of emission reduction of 2.9 Kg of CO
2 per TEU transported is obtained.
If we look back, we can obtain the amounts whose emission has been avoided since an AMS was installed in each of the ports by December 2017. In the port of Salalah, the system was installed in 2015, having transported since then just over 9,840,000 TEUs, which means that the savings in emissions to date have been around 26,000 tons. Similarly, in the port of Ngqura, also installed in 2015, the savings have been around 8800 tons for a traffic of nearly two million containers. Finally, the biggest veteran among ports with an AMS, Beirut, has transported since 2014, when its system was installed, a total of 4,800,000 TEUS, with a saving in emissions of 11,600 tons.
In total, we can say that thanks to the installation of an AMS in these three ports, the reduction in CO2 emissions to the atmosphere can be estimated at over 46,400 tons.
If we use the data obtained from the emissions per TEU and transfer them to the world traffic of TEUs in the last ten years, we can obtain that the world traffic of containers has increased by 45% since 2009, that is, from 3,956,350,706 TEUs in 2009 to 7,226,894,733 TEUs in 2019 (see
Table 4).
If we talk about CO2 emissions, they have also increased in the same proportion; they would have gone from about 11,869,052 tons of CO2 in 2009 to about 21,680,684 tons in 2019.
If the AMS were to be implemented in a number of ports that represented 20% of the world traffic of TEUs, CO2 emissions could be reduced in the same proportion, that is, emissions could be reduced by 37,898,117 tons of CO2 during the stay of container ships in these ports.
Table 5 provides an assessment of the reduction in emissions that would have been achieved in 2019 if the AMS had been installed in container terminals in different countries around the world, taking into account container traffic and the average reduction in CO
2 emissions per TEU calculated.
8. Conclusions
From the results obtained from the research described above, the following conclusions have been obtained:
The savings in the emission of CO2 (in tons) to the atmosphere since the installation of an AMS are 21,295 in Salalah, 10,157 in Beirut, and 7438 in Ngqura, which means that around 38,890 tons of CO2 have been emitted into the atmosphere since the installation of an AMS in those ports;
In the ports where an AMS is installed, the reduction of CO2 emissions during mooring operations can be estimated at 98%;
The countries that contribute the most to the lowering of CO2 emissions are those that have the biggest container traffic, although the size of the vessels is also a major factor;
It has been estimated that with the installation of an AMS in a container port, a reduction of 2.9 Kg of CO2 per TEU transported can be obtained;
Port authorities should encourage the installation of these automatic mooring systems in commercial docks.
The data that have been determined in the article can be used for the application of the ISO 14064-1: 2008 standard [
33].


 ,
, 


