Article

An Auxiliary Index for Reducing Brent Crude Investment Risk—Evaluating the Price Relationships between Brent Crude and Commodities

1
Department of Information and Finance Management, National Taipei University of Technology, Taipei 10608, Taiwan
2
Department of Industrial Engineering and Management, National Taipei University of Technology, Taipei 10608, Taiwan
3
Graduate Institute of Information and Finance Management, National Taipei University of Technology, Taipei 10608, Taiwan
*
Author to whom correspondence should be addressed.
Sustainability 2021, 13(9), 5050; https://0-doi-org.brum.beds.ac.uk/10.3390/su13095050
Submission received: 30 March 2021 / Revised: 26 April 2021 / Accepted: 27 April 2021 / Published: 30 April 2021
(This article belongs to the Special Issue Energy Return on Energy Investment)

Abstract

:
Examining the price relationships of Brent Crude with 78 global commodities, our study shows that the spot price of a certain commodity, New York Harbor No. 2 Heating Oil Spot Price FOB, can serve as an auxiliary forecasting index of the rise and fall of the monthly Brent Crude oil price. With an innovative view for evaluating the price relationship and prediction based on simple, practical measurement, our findings provide a helpful auxiliary index tool for investors and analysts by offering a high success rate (82.98%) and predicting the rise and fall of the monthly Brent Crude oil price three weeks in advance.

1. Introduction

Crude oil is the most actively traded commodity in the world by the Futures Industry Association (FIA) does. Its influence spreads all over the world [1]. While oil industries cover upstream, midstream and downstream markets, predicting crude oil prices remains a major challenge for oil companies, oil-related industries, and countries that demand or supply petroleum. The rise and fall of crude oil prices are related to the sustainable development plans and investment policies of many companies. However, the market trend and fluctuation of international oil prices often lead to unpredictable market conditions. An accurate crude oil price forecast is crucial so that institutions may take significant precautions and plan necessary policies in advance.
Since the first oil crisis erupted in Oct. 1973, crude oil prices have been volatile. The price is determined not only by the rules of supply and demand, but also by more factors. Some of them are as follows: the quality of crude, oil futures contracts, geopolitical events and related catastrophes, financial crises, GDP growth, economic recession, wars, oil embargos, inflation, seasonal variations, changes in stocks, the fluctuations of US dollar exchange rates, speculations, psychological expectations, OPEC’s oil strategies, disasters (e.g., the COVID-19 pandemic), etc. Many of these factors are hard to parameterize effectively in the prediction process.
The volatility of crude oil prices often shows the characteristics of complexity, uncertainty and randomness. The financial crisis in 2008 was a major event which resulted in a structural breakdown in oil prices and changed the long-run equilibrium price relationships and the short-run price dynamics, according to Armando et al. (2015) [2].
The movements of crude oil price are often influenced by particular industries or sectors. For example, the responses of crude oil prices to OPEC’s policies are often greater than responses to seasonal variations. Today, oil prices still fluctuate greatly due to uncertain conditions and events. Athanasia et al. (2019) provided evidence that points to the rejection of even a weak form of efficiency in the crude oil market, implying that a ceiling exists in predicting oil prices [3]. Therefore, it is necessary to surmount this ceiling in order to reduce crude oil investment risks by finding other auxiliary methods.
Many methods have been developed to predict crude oil price, and some of them have reached accuracies of around 61% [4]. A lot of room for improvement still exists for effective forecasting of crude oil prices. Finding out how closely a commodity’s price is related to the Brent Crude oil price by using mathematical methods to serve as a predicting index may be a feasible and simple way to help reduce Brent Crude investment risks.
On top of this, focusing on the price relationships between commodities and Brent Crude may reduce the cost and time of complex factor selection, processing load, decision weighting, etc. By this simple method, the selected commodities can be used as auxiliary indices for the Brent Crude investment and, when appropriate, can also be used as the direct indices for forecasting the rise and fall of Brent Crude oil price.
To predict the Brent Crude oil price using commodity prices requires not only a close relationship but also an accurate directional variation. It is important to find a useful leading index of the rise and fall of the price. Achieving these goals at the same time is not easy. Before making a forecast, using a commodity’s price as an auxiliary predicting tool is a good way to improve the success rate and to help better guide investing decisions.
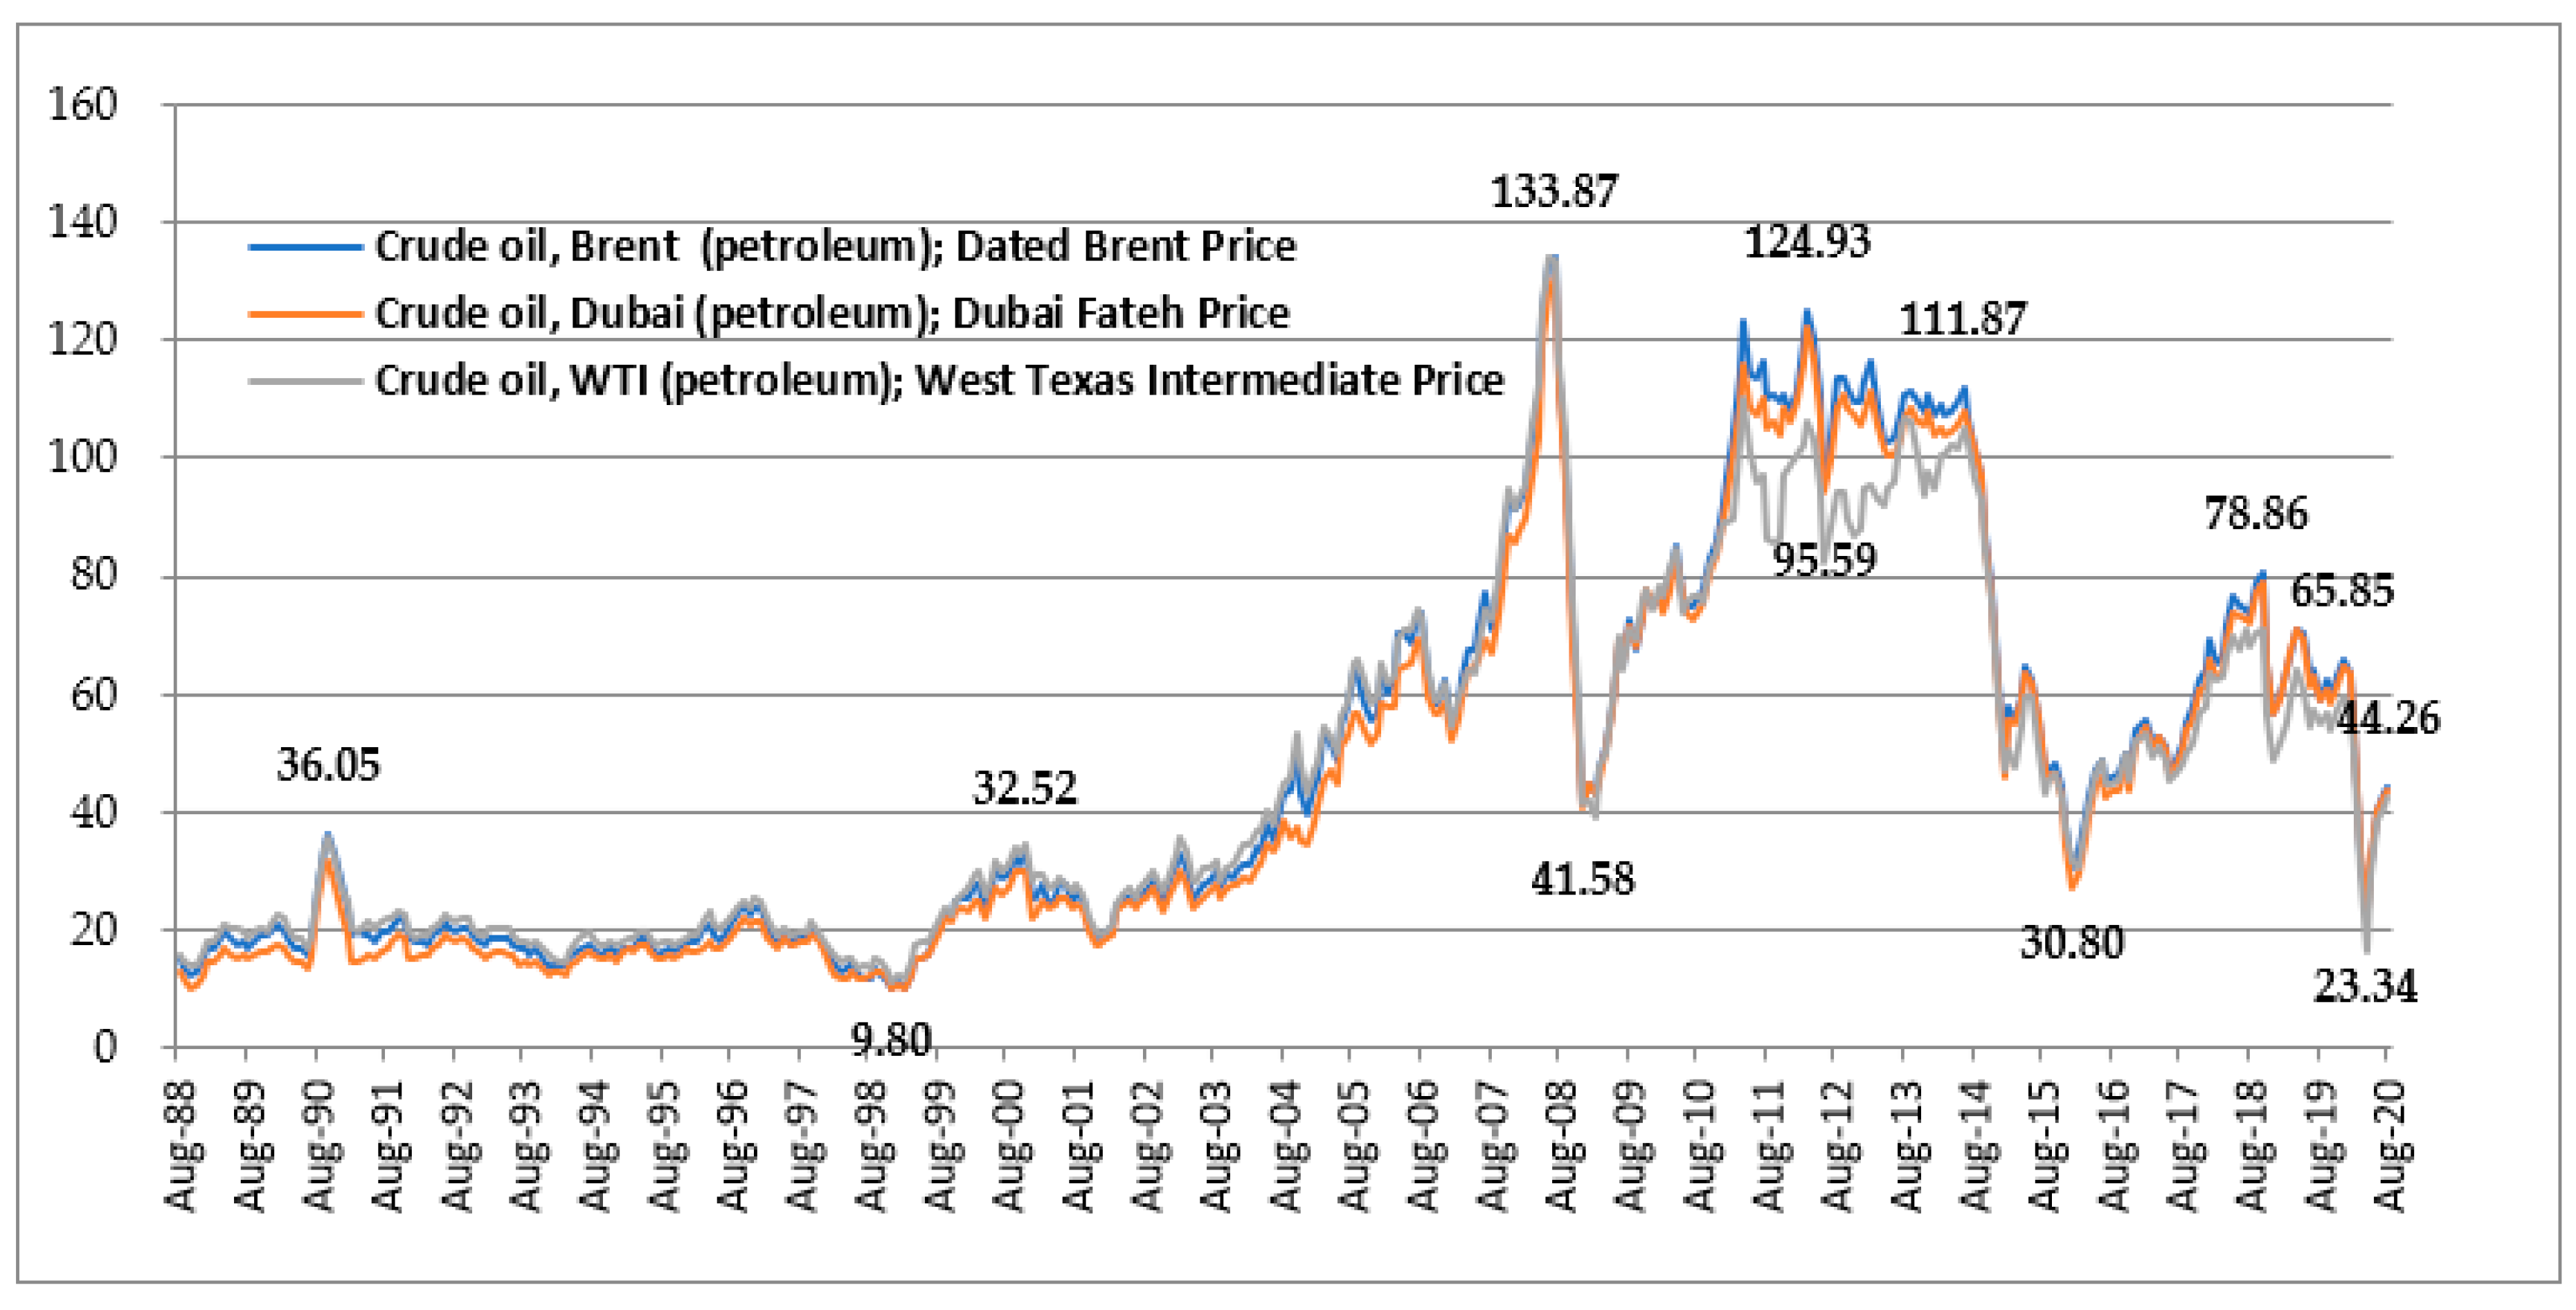
The price trends of Brent Crude, Dubai Crude and WTI Crude show a close price relationship, as shown in Figure 1. However, it is less meaningful to speculate on the target crude oil price using other crude oil prices, unless other crude oil prices can accurately be predicted first. One of the famous investors’ fallacies for crude oil is that past historical price changes can always reflect future price changes. Making predictions using other commodity prices may allow investors to avoid the results of this fallacy.
The aim of this study is to find out what commodities demonstrate high price relationships with Brent Crude according to past data and design an auxiliary leading index for predicting the rise and fall of the monthly Brent Crude oil price.

2. Literature Review

Market research related to forecasting crude oil prices has a long history. Structural models and time series models are the two main approaches to predicting oil price. In structural models, oil price is predicted using many explanatory variables, such as supply and demand, consumption, production, available stock of oil, net oil imports, etc. In time series models, oil price could be predicted solely using the past price trend, either linear (ARMA) or non-linear trends (GARCH or ANN) (Bostanchi, 2017) [5]. The time series method is often referred to as the Box-Jenkins approach [6].
Many factors strongly influence crude oil prices and show the complex characteristics of nonlinearity, dynamic variation, and high irregularity, as pointed out by Plourde and Watkins (1994) [7]. Bopp and Sitzer (1987) found that futures prices of heating are useful predictors of spot prices [8]. Asche et al. (2003) showed that in a multivariate framework, crude oil price is weakly exogenous and that the spread is constant in some but not all relationships [9].
Since the 1980s, many typical statistical and econometric techniques have been widely applied to oil price forecasting, such as: Linear regression (LinR), Co-integration analysis, Generalized Autoregressive Conditional Heteroskedasticity (GARCH) models, Naive Random Walk, Vector Auto-Regression (VAR), error correction models (ECM), Autoregressive Integrated Moving Average (ARIMA), autoregressive distributed lag (ARDL) test, etc. Many studies have employed conventional empirical methods.
Morana (2001) showed how the GARCH properties of oil price changes can be employed to forecast the oil price distribution over short-term horizons [10]. Lanza et al. (2005) used ECM specifications to predict crude oil prices [11]. Akpanta and Okorie (2014) applied the ARIMA method in modeling and forecasting Nigerian crude oil prices [12]. Oil prices are time related with a great deal of nonlinearity and irregularity. Numerous experiments have demonstrated that typical statistical and econometric models have not been promising for forecasting, such as complex series, according to Moshiri and Foroutan (2006) [13].
Chang and Lee (2015) found evidence of a long-run co-integration price relationship between oil spot prices and the prices of futures [14]. Arfaoui (2018) drew the conclusion that the short-run and long-run elasticities exist between spot and futures prices and between crude and refined oil prices, with the exception of gasoline, by using an ARDL bounds testing approach [15]. Yin et al. (2018) made an oil price forecast by using many predictor variables with a new time-varying weight combination approach to improve the accuracy. Good prediction results can be provided by using the above model based on the near linear relationships [4]. Zhao et al. (2020) proposed a crude oil price forecasting method based on time-varying trend decomposition to describe the changes in trends over time and forecast crude oil prices [16].
Over two decades ago, machine learning attracted wide attention in various fields due to development of AI. Researchers have used the machine learning (or deep learning) model to fit and predict time series data to improve the accuracy of oil price forecasting.
Mirmirani and Li (2003) suggested that the BPN-GA model noticeably outperforms the VAR model [17]. Alvarez-Ramirez et al. (2008) analyzed the auto-correlations of international crude oil prices [18]. Yu et al. (2008) made a forecast on crude oil prices with an EMD-based neural network [19]. Slim (2015) improved the forecasting of crude oil prices with statistical learning methods (SLM) based on a combined fuzzy system (FS), artificial neural network (ANN), and support vector regression (SVR) [20]. He et al. (2016) showed a significant performance improvement in forecasting WTI and Brent Crude oil prices using a multivariate EMD-based model [21].
The Long Short-Term Memory (LSTM) method based on recurrent neural networks (RNN) techniques were initially developed in 1980 and have since been widely used to deal with sequence-based problems, such as machine translation, text classification, power demand forecasting, stock market prediction, and behavior recognition. Gupta and Pandey (2018) predicted crude oil prices by using LSTM networks [22]. Cen and Wang (2019) applied LSTM with a deep learning algorithm to predict the volatility behaviors of crude oil prices [23]. Liab et al. (2019) proposed a hybrid model for forecasting monthly crude oil spot prices by using various mode decompositions and AI, such as the GASVM and GABP methods [24]. Yin and Wang (2019) discovered the best prediction model of WTI Crude oil prices by constructing a new HWP-CHAOS model which outperforms prediction models such as ANN + Chaos-type, Chaos-type and ANN-type [25].
Kevin et al. (2003) used the crude oil and heating oil markets for diesel fuel purchasing decisions [26]. Some studies have discussed the price relationship between oil prices and various commodities, such as agro, food or metal commodities. Kousik et al. (2020) stated it is still uncertain whether oil prices have relationships with agro-commodity prices [27]. Roman et al. (2020) indicated that there are long-term relationships between crude oil and meat prices. The linkage of crude oil prices occurred with food, cereal, and oil prices has been observed in the short term [28]. Vo et al. (2019) indicated that not every oil shock has the same effect on agricultural price fluctuations, and similarly the effects of aggregate demand shocks on the agricultural market vary [29]. Farhad et al. (2019) found that the impact of biofuel prices on food prices is statistically significant but explains less than 2% of the food price variance [1].

3. Methodology

The procedure in this study can be roughly divided into two phases. The purpose in the first phase is selecting the commodities having close price relationships with Brent Crude through evaluation and verification. The purpose in the second phase is calculating the success rate of each selected commodity, verifying the accuracy of its predictions in the COVID-19 period, and picking out the best commodity according to the success rate and verification results.
  • First phase
Pearson’s correlation coefficient, simple linear regression and scatter plotting play major roles in the first phase for the following reasons.
(1)
Covariance is likely to be misleading if the same data are compared in different units. This weakness was compensated for by the correlation coefficient (rxy).
(2)
Any method using too many parameters is complex and difficult to change, which causes more errors. Therefore, multiple or nonlinear modeling can also be very case dependent and time-consuming, and cause collinear problems.
(3)
A pure mathematical relationship in which the R2 (Sample coefficient of determination) has exactly the square of rxy allows us to easily eliminate low R2 commodities by the rxy method.
(4)
A scatter plot allows us to avoid many pitfalls such as outliers, misleading results, etc., thus enhancing study quality.
(5)
These methods are simple and commonly used, and they conform to the simplicity notion of the razor principle.
Owing to the good results in the first phase, multiple regressions or non-linear regressions, which are highly complex and time-consuming, are not adopted. Descriptions of the study methods are provided as follows.
2.
Second phase
Two paths were designed to measure the success rate of predicting the rise and fall of Brent Crude oil price.

3.1. Correlation Coefficient and Simple Linear Regression

Pearson’s correlation coefficient is denoted by rxy and is defined by (1).
r x y = C o v ( x , y ) V a r ( x ) V a r ( y ) = S x y S x x S y y = n   x y   x   y { n   x 2 (   x ) 2 } { n   y 2 (   y ) 2 }
where x and y are the variables.
| c o v ( x ,   y ) | 2 S x x S y y = | r x y | 2   1
which implies that rxy is always in the range of −1.0 to 1.0.
The rxy, an indicator of the goodness of fit between x and y variables, measures the strength of association and the direction of the relationships between both variables. It provides evidence of association, not causation, which also tells us how strong a linear relationship between two variables is under a situation with no outliers. Rodgers and Nicewander (1988) published a detailed description [30].
The relevant sizes of two samples are not necessarily proportional to rxy. A high rxy does not mean a causal relationship exists in both. Krehbiel (2004) [31] and Asuero et al. (2006) [32] suggested modified rules of thumb to describe the rxy strength, which can be divided into seven levels ranging from no correlation to perfect correlation, as shown in Table 1.
The requirements of |r| still vary in different fields. For natural/science/social science/economics studies, a |r| equal to 0.6 may be enough. For instrument calibration, a |r| equal to 0.9 may be unacceptable. The greater the “n” (data range) is, the higher the acceptability (significance) of |r|. A satisfactory |r| is dependent on the purpose of usage or on the quality of raw data. Due to the fact that the rxy may be strongly affected by outliers, the raw data and results in this study must be evaluated by the scatter plot.
Regression is a generic term that is often used in finance, investment, economic forecasting and other disciplines such as commodities, interest rates, machine learning, etc. Stanton et al. (2001) [33] also described regression in detail. A simple linear regression equation is given in (3).
Linear   regression :   Y = a + b X + ε
where,
  • Y = the dependent variable to be predicted;
  • X = the independent variable used to predict Y;
  • a = the intercept of the regression line (the value of Y when X = 0);
  • b = the slope of the regression line;
  • ε = the regression residuals which are known as the error term.
Correlation coefficient (rxy) and linear regression are different statistical techniques and differ in meaning. In general, the study of interdependence leads to the study of correlations, while the study of dependence leads to the theory of regression. However, both have the same valid expressions that are not mutually exclusive. Asuero et al. (2006) provided a full description [32].

3.2. Sample Coefficient of Determination (R2)

The R2 of simple linear regression is a measure of how well observed outcomes are replicated by the model, based on the proportion of total variation of outcomes that can be explained by the model, which is a useful tool to check the fitness of a model. The R2 is given in (4).
R 2 = 1 S S r e s S Y Y = S S R e g S Y Y
where SSres is the sum of squares of residuals (i.e., SSE); SSReg is the sum of squares due to regression; SYY is the total sum of squares (proportional to the variance of the data); and R2 ranges from 0 to 1.
It is a mathematical relationship where the R2 is exactly the square of the rxy in simple linear regression. That is, when there is no association between both variables, linear regression probably will not provide a useful fitting model. Following this concept, we can eliminate the low R2 commodities by the rxy method roughly.

3.3. Scatter Plot

A scatter plot can show more information than the rxy does, which merely gives a value to show how closely the relationship between both variables is. It can show what categories different types of data belong to, such as linearity, nonlinearity, separated points, etc. Several scatter plots can be combined on one page, making it easy to understand the whole dataset’s structure. The regression line on the scatter plot is difficult to detect when the matching relationship is weak (e.g., |rxy| ≤ 0.3). The shape becomes clearer when the relationship is strong (e.g., |rxy| ≥ 0.90).
By scatter plotting, researchers can avoid many pitfalls such as outliers, misleading results, etc., and have more confidence in the study quality. Therefore, the raw data and the study results can be checked by using a scatter plot and line chart to ensure the quality. Furthermore, the fit of a model provided is more convincing when a scatter plot is combined with linear regression.

3.4. The Proposed Auxiliary Leading Index for Predicting the Rise and Fall of Brent Crude Oil Price

Two paths were designed to measure the success rate of predicting the rise and fall of Brent Crude oil price as follows.
  • First step
Path 1: The spread (Sppath 1) is the first weekly price of each month minus the monthly price of previous month, which is expressed as follows:
S p p a t h   1   t = P f i r s t   w e e k   t P   m o n t h   t 1 S p p a t h   1   t = P f i r s t   w e e k   t P   m o n t h   t 1
where Sp is the spread; P is the commodity price; t is monthly unit.
Path 2: The spread (Sppath 2) is the first weekly price of each month minus the first weekly price of previous month, which is expressed as follows:
S p p a t h   2   t = P f i r s t   w e e k   t P f i r s t   w e e k   t 1 S p p a t h   2   t = P f i r s t   w e e k   t P f i r s t   w e e k   t 1
2.
Second step
The spread of each Path is compared with the direction of the rise and fall of the monthly Brent Crude oil price in the same time slot to calculate the success rate (Sr) of each Path. The Sr is expressed as follows:
S u c c e s s   R a t e ( S r ) = 1 n i = 1 n s t
where st = 1 if (Sppath 1 or Sppath 2) * (PBrent t − PBrent t-1) > 0 and st = 0 otherwise; n is the number of spreads (i.e., n = data range − 1). The Sr is in the range from 0 to 1. The higher the Sr is, the more accurate the model.
The auxiliary index using commodity price in this study focuses on finding commodity prices with a high success rate to predict the rise and fall of Brent Crude monthly oil price in that month three weeks in advance. The proposed index does not predict crude oil price directly. This index shows the rise and fall of Brent Crude monthly oil price in the short-term, not in the long-term price or according to target price. It could be used conjunction with other predicting methods such as ARIMA, LSTM, etc., rather than being used separately.

3.5. Remarks

In the first phase, we are more interested in determining the strength of rxy for the following reasons:
  • High rxy is the basis of accurate crude price estimates using commodity price. If the rxy is weak or moderate, this method will be less meaningful.
  • In a mathematical relationship, the fact that the rxy2 is equal to the R2 can reduce the complexity of the process, and less collinear problems will occur, unlike other methods such as multiple regression.
In the second phase, we focus on the success rate of empirical analysis, which is the basis of this auxiliary leading index.
Thus, high rxy is the critical point in the first phase (i.e., correlation analysis or linear regression). Evaluating based on use of a scatter plot is another critical point for ensuring the study quality. The high success rate of the empirical results is of course a major point of concern.

4. Analysis and Empirical Results

A close price relationship is indispensable when using commodity prices to predict the rise or fall of Brent Crude oil price. Such a relationship can alleviate the effect of factors which are difficult to effectively parameterize in other kinds of studies, such as those related to geopolitics. If scientifically proven, the proposed index may be more convenient and convincing than many previous theories and models due to its simplicity and practicality.

4.1. Data Description

We selected past monthly Brent Crude oil prices as one variable. The other variable is the monthly price of each commodity. Brent Crude is extracted from the North Sea and is a major trading classification of sweet light crude oil that serves as a benchmark price for purchases of crude oil worldwide. Prices for other crude oils are generally priced as a differential (discount or premium) to Brent Crude. The prices of the same commodity vary from place to place, but we can estimate this price more accurately and easily (but not all) if a benchmark price of the commodity exists. Brent Crude oil price is more globally representative than that of Dubai Crude and WTI Crude, which serve as the comparative references in this study.
The study’s dataset structure, shown in Appendix A and taken from the Mundi company website, includes 81 types of monthly commodity prices that are divided into 11 categories. Each commodity price herein is treated as one dataset with the attributes of “training data” or “testing data”. The training data are mostly dated from December 1988 to Oct. 2019. That is, the training data length of each commodity normally has 371 consecutive price data points (pts), owing to these data are not affected by COVID-19. The recorded data dated after Oct. 2019 is treated as testing data, which can be used to verify the training data study results, even if the data range is insufficient.
To reduce the uncertainty of processing results, each commodity’s training data must have at least 156 consecutive data points, including the price data dated Oct. 2019. That is, each commodity analyzed has at least 13 years of monthly-recorded data. None of the data has been adjusted for inflation, weighting, time lag, etc.
Each defective dataset is wholly replaced or deleted for the sake of quality, thus avoiding data incompleteness, massive data losses, data discontinuity, and poor accuracy. Replaced datasets were extracted from the World Bank, IMF or EIA (U.S. Energy Information Administration) based on Mundi’s data source indexes. A big context gap may exist for the same commodity with different data sources. The replaced datasets were selected based on past experience when dual data sources existed.
After replacing and deleting data, there were still 79 qualified commodities in the datasets as shown in Appendix B, included Brent Crude oil price. Moreover, they include seven incomplete commodities: Ultra Sulfur No. 2 Diesel (No. 7; 171 pts), Kerosene-Type Jet Fuel (No. 11; 345 pts), TX Propane (No. 13; 339 pts), RBOB Regular Gasoline (No. 14; 207 pts), Palm Kernel Oil (No. 41; 296 pts), Rapeseed oil (No. 45; 223 pts) and Sunflower oil (No. 49; 212 pts). Each commodity has at least 171 consecutive monthly prices, include “testing data”, and only one data source.
The datasets also include silver and zinc commodities with dual data sources from the World Bank and IMF. Full descriptions of each commodity can be reviewed in Mundi [34], World Bank [35], IMF [36] or EIA [37] reports. For the sake of consistency of price correlation and price change rate (or rate of price change) correlation, a maximum of 370 data points were used in the first phase.

4.2. Stability Analysis

Stability is an important basic trait when predicting crude oil prices using commodity prices. Without it, we would face great uncertainties. If a stable and close price relationship shows between the commodity and Brent Crude with different time lengths, it could be persuasive for investors or analysts.
Since commodity price belongs to a time series type, the rxy has two types: price and price change rate, in this analysis. For the example of price rxy, according to our design, the monthly price of each commodity in Oct. 2019 is taken as the point of origin. The time length of the first rxy is 18 months for the sake of comparison. The time length of the second rxy is 24 months. Thereafter, the time length of each rxy is extended forward until the last data point by an interval unit of 24 months to calculate each rxy in different time lengths, i.e., 48 months, 72 months, 96 months … and so on. (See Appendix C and Appendix D).
For further analysis, each selected commodity price must be closely related to the Brent Crude oil price, whether in the short-term or long-term. That is, the average of rxy is high and the SD of rxy is small. Moreover, short-term prediction is often more valuable than that of long-term in the real world. To improve the prediction accuracy of Brent Crude, the time slot between predicted data and real data should be shortened. That is, the higher the short-term rxy is, the better the accuracy is. We take these conditions as the basis to select commodities.

4.2.1. Correlation Analysis of Price

Price rxy with different time lengths between 78 commodities and Brent Crude are shown in Appendix C. A big gap in price rxy appears for different commodities or categories. We also find that the rxy of many commodities are over 0.90, reaching as high as 0.98, thus surpassing our expectations.
For further analysis, we select the commodities with average rxy over 0.90 and with SD of rxy under 0.05. In total, six commodities met these conditions, including commodity No. 5, 6, 7, 8, 9 and 11 (see Table 2).

4.2.2. Correlation Analysis of Price Change Rate

By this analysis, we can understand the sensitivity of the price change rate between each commodity and Brent Crude. The selection of the commodity is verified scientifically if the price change rate rxy shows a close relationship.
The price change rate is the change rate of two neighboring prices, as shown in (8).
P r i c e   C h a n g e   R a t e = ( P r i c e t     P r i c e t 1 ) P r i c e t 1
where t is the monthly unit.
The price change rates rxy with different time lengths are shown in Appendix D. For the same commodity, the price change rate rxy is mostly less than the price rxy because the former is not as easy to match as the latter. By sorting the average of price change rate rxy, we see a sharp gap between commodity no 8 (rxy = 0.8286) which ranked 6th and no 14 (rxy = 0.6916), which ranked 7th.
We selected the commodities with average rxy of over 0.80 and SD of rxy under 0.06. In total, six commodities met these conditions, including commodity No. 5, 6, 7, 8, 9 and 11, which are the same as the commodities selected by price rxy (see Table 2). The price change rates rxy of the four selected commodities, with the exception of crude oil, were above 0.82, reaching as high as 0.94.

4.2.3. Discussion of Commodities Selection

Lots of commodities were excluded by the rxy method, such as Coal Export Price (South African, no. 2), Indonesian Liquefied Natural Gas Price (no. 10), TX Propane Spot Price FOB (no. 13), Russian Natural Gas Price (no. 15), Wheat Price (no. 26), Soybeans Price (no. 48), Copper Price (no. 62), Iron Ore Price (no. 64), Platinum Price (no. 68), etc. Fortunately, some commodities were not excluded. Moreover, we also found that a weak or moderate price relationship exists between Brent Crude oil and agro-commodities.
For further analysis, the commodities selected are New York Harbor Ultra-Low Sulfur No 2 Diesel Spot Price (no. 7; No 2 Diesel Spot Price), New York Harbor Conventional Gasoline Regular Spot Price FOB (no. 8; Gasoline Regular Spot Price FOB), New York Harbor No. 2 Heating Oil Spot Price FOB (no. 9; Heating Oil Spot Price FOB), and U.S. Gulf Coast Kerosene-Type Jet Fuel Spot Price FOB (no. 11; Kerosene-Type Jet Fuel Spot Price FOB). All of them belong to the energy category and are the downstream products of crude oil. There seems to be causalities between these commodities and Brent Crude.

4.3. Scatter Plot and Linear Regression

Scatter plots combined with regression lines are more convincing, offering a useful tool to help make choices. After excluding commodities through correlation analysis, scatter plots and line charts of six commodities plotted by price and price change rate are shown in Figure 2 and Figure 3. The regression formulae and R2 of each commodity are shown also.
As seen in the pictures, three selected commodities clearly show a nice in-phase shape. The Gasoline Regular Spot Price FOB (R2 = 0.6317) is removed because neither R2 nor the short-term rxy of the price change rate are good enough. High R2 commodities are one option (but not the only option) in this study.

4.3.1. Commodities’ Selection in the Datasets

New datasets are made from five commodities, including the reference commodities, WTI Crude and Dubai Crude. The others are the commodities selected based on the price relationship. We reprocess the price rxy and the price change rate rxy by reducing the data range to 161 points for the sake of consistency, because the minimum training data range among the selected commodities is 161 points. Table 3 shows some characteristics as follows.
  • In price rxy, the average and R2 of all selected commodities are over that of WTI Crude.
  • In price change rate rxy, the average and R2 of the No 2 Diesel Spot Price show better performance than those of WTI Crude. The Heating Oil Spot Price FOB also shows good performance. The performance of Kerosene-Type Jet Fuel Spot Price FOB is also close to that of WTI Crude.
These characteristics have never been clearly reported before. Some selected commodities maybe serve as good auxiliary indexes for investment in Brent Crude.
However, three other selected commodities have close price relationships with Brent Crude, and are downstream co-products of crude oil. They have their own demand markets, traders, specific consumers (e.g., Kerosene-Type Jet Fuel Spot), usage etc. Kevin et al. (2003) suggested that diesel fuel prices forecasted using the crude oil or heating oil futures market are reasonably accurate [26].

4.3.2. Pre-Examination of the Time Series

The most important feature of prediction by using time series, we believe, is that it is related to the before and after, or is related between both. Thus, the characteristics of each commodity should have a basic understanding before research. We operate the tests as follows.
1.
All selected and related commodities are non-stationary according to the results of ADF (Augmented Dickey-Fuller) test. (See Table 4)
2.
All selected commodities have passed the RESET test (Ramsey, 1969). That is, there exists a less significant non-linear relationship when you have built a linear regression model according to the results of RESET tests. (See Table 5 and Table 6)

4.3.3. Discussion of Price Relationships of Some Unselected Commodities

Some unselected commodities in the energy category are the derivates of crude oil and show different price relationships especially in price change rate, such as “Mont Belvieu, TX Propane Spot Price FOB” (no 13, 0.6561), Los Angeles Reformulated RBOB Regular Gasoline Spot Price (no 14, 0.6916), which are products of crude oil. Moreover, “Indonesian Liquefied Natural Gas Price, Japan” (no 10, −0.1525), which the contract price is mostly linked to crude oil price, has a negative value. Apparently, crude oil price is not the only component of the prices of these unselected commodities. Surely, the increase or decrease in demand for the derivates is not equal to that of Brent Crude oil in the short term.
We did not know before that the three selected commodities have such close price relationships with Brent Crude. The 161 monthly-price data points indicate that the commodities have been through various events, such as the financial crisis, U.S. shale oil and gas boom, economic sanctions on Iran, global oil price war, Iran nuclear crisis and deal, OPEC’s oil production cuts, Trump Trade war etc. Each event had a significant effect on global crude oil prices and its derivates. It is not easy for a commodity to maintain such a good match with the Brent Crude oil price throughout this period.

4.4. Estimated Brent Crude Oil Prices Using a Linear Regression Formulae

Estimated Brent Crude oil prices, derived from each commodity price by its formulae of linear regression, are shown in Appendix E. Analysis of these data, given below, can help us understand the differences between estimated and real Brent Crude oil prices. The estimated price line charts with residuals are shown in Figure 4.
In Figure 4, the degree of price matching between Dubai crude and Brent Crude is not disputed. It is less necessary to discuss this in the later phases. The residuals of WTI Crude were once over $20/bbl in the period of “gas effect”. All selected commodities show high residuals in the period of the financial crisis.

4.5. Performance Metrics

Mean squared prediction error (MSPE) and directional accuracy ratio (DAR) are popular metrics for forecasting in economics and finance. Zhao et al. (2020), Gao and Lei (2017) also applied both metrics to evaluate the performance of crude oil price forecasting [16,38]. They are also useful metrics for picking out a commodity as the best auxiliary investing tool for predicting Brent Crude oil price. MSPE and DAR are described as follows.
1.
MSPE
MSPE summarizes the predictive ability of a model by measuring the average of the squares of the price errors. The price error is the difference between real crude price and estimated price. Let y1, y2, …, yn be the real crude oil prices and ŷ1, ŷ2, …, ŷn be the estimated prices from each commodity model. MSPE is expressed as follows:
M S P E = 1 n i = 1 n ( ŷ i y i ) 2
where n is data range. The lower the MSPE is, the more accurate the model.
2.
DAR
DAR is a measure for predicting the accuracy of directional variation between real crude price and estimated price (i.e., The commodity price has the same rise or fall of crude price in the same time slot). DAR is expressed as follows:
D A R = 1 n i = 1 n d t
where dt = 1 if (ytyt−1) * (ŷ − ŷt−1) > 0 and dt = 0 otherwise. We herein modified (ŷtyt−1) as (ŷtŷt−1) reasonably in the field of commodity price. DARs are all in the range from 0 to 1. The higher the DAR is, the more accurate the model.
If the DAR of a model is greater than 0.5, it is better than “Random Walk”. Highly accurate directional variation of price is a key basis for predicting Brent Crude oil price using a commodity price. It herein is more important than MSPE. We assume that commodity prices can assist in price predicting under the following conditions (but not all).
  • The total ratio of the same price directional variation in one time slot for the commodity and Brent Crude is over 80%. That is, DAR is over 80%.
  • The average of squared residuals between the estimated price and real price of Brent Crude is close to or lower than that of WTI Crude or Dubai Crude.
The results of DAR and MSPE in the three different time ranges shown in Table 7 have the following characteristics.
  • Dubai Crude with high DAR and low MSPE performs very well and has significant improvement in DAR after Jun. 2006.
  • The MSPE of WTI Crude is more than that of all the selected commodities in the three time ranges. The significance of MSPE gets worse after June 2006 and gets well during the COVID-19 period.
  • The DARs of Kerosene-Type Jet Fuel Spot Price FOB approach or exceed 0.90 in the three time ranges. Of all selected commodities, this is the only commodity that does so.

4.6. Discussion of the above Analytical Results

A summary of the analyses results of this study is shown in Table 8, including the performance metrics, where the data range is from Jun. 2006 to Oct. 2019. We identified the following characteristics.
  • As for DARs, all selected commodities show a high match (≧87.50%), and Kerosene-Type Jet Fuel Spot Price FOB has the same DAR (91.25%) as that of WTI Crude. Besides, by ignoring the commodities prices for which monthly price change rates of Brent Crude are within ±2% in the same time slot, we can recalculate DARs. It is interesting that the DARs of three commodities are over 96.72%, and the No 2 Diesel Spot Price has the same DAR (97.54%) as that of WTI Crude. That is, these selected commodities show a high degree of consistency in directional variation when Brent Crude oil prices fluctuate significantly. All of them should be eligible for assisting in prediction.
  • For MSPE, all selected commodities are at the same level. Each commodity’s MSPE is less than that of WTI Crude (40.16), and No. 2 Heating Oil Spot Price FOB (15.37) shows excellent performance.
Briefly, the No 2 Diesel Spot Price shows a good match with the average and SD of price change rates rxy. Heating Oil Spot Price shows a low MSPE. Kerosene-Type Jet Fuel Spot Price has a DAR which is as good as that of WTI Crude. Each selected commodity has its advantages. It is not easy to select a suitable commodity as the auxiliary index for prediction.

4.7. Verification of Testing Data

During the COVID-19 pandemic is a good time to verify the degree to which prices of selected commodities match with Brent Crude. The results’ summary in Table 9 shows a similar trend with the previous analytical results of this study. The performance of the Dubai Crude model is outstanding and surpasses other models. The performance of the WTI Crude model is not good enough when compared with the models of the selected commodities, and the following differences appear.
  • In the DAR, the Kerosene-Type Jet Fuel Spot Price FOB model shows good performance (90%). It has the same DARs as the Dubai Crude model and WTI Crude model since the outbreak of COVID-19 in Jan. 2020. This model is better than the other commodity models as both “training data” and “testing data”. Moreover, the DAR (70%) of the No. 2 Heating Oil Spot Price FOB is less than 80%. (See Appendix F)
  • In the MSPE, all selected commodity models reach the same level. Among of them, the No 2 Diesel Spot Price model shows a good performance because its MSPE is lower than that of the WTI Crude model.
There was a turning point at which price soared in May 2020 after the crude oil price slump resulting from the COVID-19 outbreak. The Kerosene-Type Jet Fuel Spot Price FOB model shows a better price response (turning point) than do the other selected commodity models. After recalculating the rxy of price and price change rate from Jun. 2006 to August 2020, we find the following characteristics (see Table 10).
  • In price rxy, the average and the R2 of all selected commodities are higher than those of WTI Crude. The high averages and low SDs of selected commodities show a stable and reliable relationship with Brent Crude, both in the short-term and long-term.
  • Some selected commodities show big variations compared with training data in price change rate rxy due to the soaring price in May 2020, even if their price rxy is high still. The commodities, No. 2 Diesel Spot Price and No. 2 Heating Oil Spot Price FOB, show less capability to capture the price turning point in time.
  • In price change rate rxy, the high average (0.9209) and low SDs (0.0045) of Kerosene-Type Jet Fuel Spot Price FOB demonstrate that it has short-term and long-term stability and reliability with Brent Crude. Moreover, its R2 is better than the others, except for Dubai Crude.
In this analysis, the Kerosene-Type Jet Fuel Spot Price FOB shows good stability, reliability and turning point capturing ability compared with the others. It may be a good auxiliary tool for Brent Crude investments.

4.8. The Empirical Results of the Auxiliary Leading Index for Predicting the Rise and Fall of Brent Crude

The selected commodity price is not only contemporaneous to the price of Brent Crude. It assists in reducing the investment risks of Brent Crude if it can serve as a leading index for predicting the rise and fall of Brent Crude oil price. That is, the index is helpful for investors and analysts.
In the second phase, we quote the first weekly price data of each month of WTI Crude and three selected commodities and go on to further analyze the prediction. All of the price data are from EIA. There are 176 spreads (or 177 pts) in the data ranging from Jun. 2006 to February 2021 (see Appendix G). The empirical results of this auxiliary leading index are shown in Table 11.
Taking the example of Kerosene-Type Jet Fuel Spot Price FOB, there are 131 spreads with the same direction as the rise or fall of the monthly Brent Crude oil price, in Path 1. That is, the success rate is 77.06%. In Path 2, there are 123 spreads with the same direction as the monthly Brent Crude oil price. The success rate is 72.35%.
In Table 11, the success rate of WTI Crude is the highest (80.59%) in Path 1, followed by No. 2 Heating Oil Spot Price FOB and Kerosene-Type Jet Fuel Spot Price FOB (77.06%). The success rate of Ultra-Low Sulfur No 2 Diesel Spot Price is the highest (77.65%) in Path 2, followed by No. 2 Heating Oil Spot Price FOB (76.47%).
Moreover, there are 140 spreads following the same direction between Path 1 and Path 2. Among them, there are 112 spreads following the same directions with the monthly Brent Crude oil spreads. The success rate rises to 80.00%. That is, we have an 80.00% success rate for predicting the rise and fall of Brent Crude oil monthly price of that month three weeks in advance, when the spreads of both paths (Path 1 & Path 2) have the same direction.
Table 11 also shows the best commodity for predicting the rise and fall of Brent Crude oil price when combining both paths, which is No. 2 Heating Oil Spot Price FOB with an 82.98% success rate. The second ranked path is the No. 2 Diesel Spot Price with an 81.69% success rate.
Actually, all three selected commodities are at the same high level of success rates for predicting the rise and fall of Brent Crude oil monthly price three weeks in advance. Investors and analysts can evaluate whether precaution measurements need to be taken or plan necessary policies in advance to reduce investment risks or losses, particularly when the auxiliary index shows a different direction from the current investment on the first day after the first week in that month. Thus, this auxiliary index should be a useful tool for investors and analysts.

4.8.1. The Empirical Results of Consecutive Prediction Mistakes in the Auxiliary Leading Index

No price prediction index is always right. Investors or analysts could lose confidence in this predicting index if many cases of consecutive price prediction mistakes occur. The setting for maximum allowable number of consecutive prediction mistakes by us is three. Table 12 shows that the commodities with no three consecutive prediction mistakes are WTI Crude, Ultra-Low Sulfur No 2 Diesel Spot Price and No. 2 Heating Oil Spot Price FOB over a period of 170 months. Consecutive prediction mistakes were made for the Kerosene-Type Jet Fuel Spot Price FOB. Furthermore, using the same change direction in both paths as the discrimination criterion is an effective method to improve the prediction success rate obviously.

4.8.2. The Empirical Verifying of the Auxiliary Leading Index during the COVID-19 Period

During the COVID-19 period, there are 13 spreads from February 2020 to February 2021. We extend data range from Aug 2020 to February 2021 for operating the detail empirical analysis. Table 13 shows the price directional variations between Brent Crude and three selected commodities. Three selected commodities were able to capture the trend of price slump and surge, except for the loss in May 2020 due to the rebound of crude oil price. They could be a nice rechecking tool for Brent Crude investment.
Among them, Kerosene-Type Jet Fuel Spot Price FOB shows a full match between Path 1 and Path 2 over a period of 13 months. Two other selected commodities show two mismatched points between Path 1 and Path 2, and thus do not count. All selected commodities show a prediction mistake in May 2020. It is also interesting that the prediction results of the “Path 2 and Brent” items are better than those of the “Path 1 & Brent” item, unlike in Table 11.
COVID-19 pandemic is an unusual and unexpected event, having a heavy impact on Brent Crude oil price. This index was able to capture the trend of the rise and fall of Brent Crude oil price during the COVID-19 period from February 2020 to February 2021. Thus, the findings surpass our expectations.

4.8.3. The Empirical Results of the Auxiliary Leading Index after Seasonal Adjustment

Considering seasonal effect on crude oil, we operate the seasonal adjustment of all selected commodities, even if seasonality tests (Wo, 2019) could "not identify seasonality". The empirical results under STL decomposition concepts show that the success rates of mostly selected commodities are slightly better than that of no-seasonal adjusting. (See Table 11, Table 14 and Table 15)
This seasonal adjusted auxiliary index is a nice tool but a bit time consuming when investors want to predict with a nice success rate. The non-seasonally adjusted index is also a nice choice when investors want to get the response quickly, owing to its simplicity, ease of use, and its success rates is nice also.

5. Discussion and Conclusions

The main purpose of this paper is to serve as a practical investment reference for investors or analysts by offering a simple, less time-consuming (<3 min.), and high success rate index that requires less data. Investors could evaluate whether the precaution measurements need to be taken or plan necessary policies in advance to reduce investment risks or losses, particularly when the auxiliary index shows a different direction from the Brent Crude current investment on the first day after the first week of that month. This index can serve as one rechecking tool during Brent Crude investing, rather than to replace other predicting price methods. Brent Crude investing risks can be further reduced when using this index in conjunction with other prediction methods. Making predictions based on commodities is the initial stage of our research. Many applied fields and associated causalities await further exploration. Nonetheless, the empirical results show the proposed auxiliary index works.
The concept, direction, basis and usage purpose of the proposed index vary from most of price prediction methods, such as LSTM, ARIMA. For example, this auxiliary index is based on empirical results and is designed specifically to predict the short-term rise and fall of Brent Crude oil price (about one month). The advantages of our method are that it is less time-consuming (<3 min.), requires less data for calculation (3 price pts), has a high success rate (>80%), requires no-preprocessing, and is simple and easy to calculate. The autoregressive methods such as ARIMA, which are the famous time-series predicting methods, operate under the assumption of a stationary state. These methods are not applied specifically for predicting the Brent Crude oil price. Using ARIMA is time-consuming (several days), requires preprocessing (seasonal adjustment, trend adjustment and unit root test, etc.), needs software and large amounts of data, and is complex. The same is true in AI methods such as LSTM. The concept, direction, basis and usage purpose of the proposed index vary from most previous price prediction methods, such as LSTM, ARIMA, etc. It is difficult to compare these methods with the proposed index.
After examining the price relationships of Brent Crude with 78 global commodities, some commodities show good price relationships with Brent Crude, all of which belong to the energy sector, but the degrees of closeness vary. The commodities can be ranked in the following order: crude oil, refined oil, natural gas, coal and carbon, etc. In the non-energy sector, the prices of metal commodities such as copper and iron ore are closely related to the Brent Crude oil price, but they cannot be used as auxiliary investing tools due to the low rxy in price change rate. Moreover, we conclude that a weak or moderate price relationship exists between Brent Crude oil and agro-commodities, which supports the finding of several papers [28].
The price relationships between Brent Crude, Dubai Crude (Y = 1.0361X−0.3291) and WTI Crude (Y = 1.0892X − 1.2927) are the closest, theoretically. However, the study results show that the price trends of some refined oil products outperform even WTI Crude, including No 2 Diesel Spot Price, Heating Oil Spot Price FOB and Kerosene-Type Jet Fuel Spot Price FOB. These commodities are the downstream co-products of crude oil and seem to be causally linked with Brent Crude.
All the selected commodities show close price relationships, reaching a high success rate level for forecasting the rise and fall of Brent Crude oil price. However, we recommend using the Heating Oil Spot Price FOB model to serve as an auxiliary investing index of Brent Crude, since it has a highest success rate (82.98%), which is better than that of WTI Crude and other selected commodities. Moreover, no three consecutive prediction mistakes occurred over a period of 170 months. The second index is Ultra-Low Sulfur No 2 Diesel Spot Price. The findings can be helpful for investors or analysts in the real world. In particular, investment risks can be reduced when measures are taken at least three weeks in advance.
Moreover, this seasonal adjusted auxiliary index is nice tool but time consuming a bit, when investors want to predict with a nice success rate. The no-seasonal adjusted index is also a nice choice when Investors want to get the response quickly, owing to its simple, and its success rates is at the high level also. Investors can adopt either case by case.
After all, the Brent Crude investment is huge. It is necessary to take all reasonable measures to minimize investment risks. This index likes a reference indicator of investors before taking precaution measurements or remedial measurements, simple but important.
This study shows that a close price relationship is one (but not the only) prerequisite for predicting the rise and fall of Brent Crude oil price based on a commodity’s price, and the combination of different commodities or methods could improve the success rate of prediction. Our next step will be to create a more accurate forecasting model for crude oil price using "+" or "-" signs, rather than just forecasting a wide price range, or to set the investment threshold using commodities to obtain good returns on investment.
The indexes of each selected commodity do not always achieve a close price relationship with Brent Crude. Therefore, the price relationships should be re-evaluated every one or two years, especially when major events occur, or the market’s key factors change. AI technology is improving in the field of crude oil price prediction. Making predictions based on commodity prices, which has been ignored in the past, could be helpful in the AI field.

Author Contributions

M.-C.H. contributed the conception, design and materials and performed the experiments. Y.-W.C. and C.-Y.C. analyzed the data results. M.-C.H. wrote the paper. All authors have read and agreed to the published version of the manuscript.

Funding

This research received no external funding.

Institutional Review Board Statement

Not applicable.

Informed Consent Statement

Not applicable.

Data Availability Statement

Not applicable.

Acknowledgments

I give my thankful acknowledgement to Kong, the former president of CPC in Taiwan, and Lee, the president of CPC in Taiwan, for his support and encouragement.

Conflicts of Interest

The authors declare no conflict of interest.

Appendix A

Figure A1. Commodity Categories and Structures of the Datasets in this Study. Note: Commodity categories in dotted frames are applied in this study. Source: Mundi Website in Jan. 2020.
Sustainability 13 05050 g0a1

Appendix B

Table A1. Data Items and Sources of Commodities in This Study.
No.CategoryCommodity ItemUnitSourceInitial Record Training Data
1EnergyCoal, Australian Thermal coal Price$/mtWB1988.12371
2Coal, South African export price$/mtWB1988.12371
3Crude oil, average (petroleum) Price $/bblWB1988.12371
4Crude oil, Brent (petroleum); Dated Brent Price $/bblWB1988.12371
5Crude oil, Dubai (petroleum); Dubai Fateh Price$/bblWB1988.12371
6Crude oil, WTI (petroleum); West Texas Intermediate Price $/bblWB1988.12371
7New York Harbor Ultra-Low Sulfur No 2 Diesel Spot Price$/gallonEIA2006.06161
8New York Harbor Conventional Gasoline Regular Spot Price FOB$/gallonEIA1988.12371
9New York Harbor No. 2 Heating Oil Spot Price FOB$/gallonEIA1988.12371
10Indonesian Liquefied Natural Gas Price, Japan $/mmbtuWB1988.12371
11U.S. Gulf Coast Kerosene-Type Jet Fuel Spot Price FOB $/gallonEIA1990.04355
12Natural gas Price, US $/mmbtuWB1988.12371
13Mont Belvieu, TX Propane Spot Price FOB$/gallonEIA1992.06329
14Los Angeles Reformulated RBOB Regular Gasoline Spot Price $/gallonEIA2003.06197
15Russian Natural Gas Price$/mmbtuWB1988.12371
16Natural Gas, Russian Natural Gas border price in Germany $/mmbtuIMF1988.12371
17BeveragesCoCoa beans Price $/kgWB1988.12371
18Coffee, Other Mild Arabicas Price$/kgWB1988.12371
19Coffee, Robusta Price$/kgWB1988.12371
20Tea Price, Mombasa $/kgWB1988.12371
21CerealsBarley Price$/mtWB1988.12371
22Maize (corn) Price $/mt)WB1988.12371
23Rice Price$/mtWB1988.12371
24Soft Red Winter Wheat Price, US SRW $/mtWB1988.12371
25Sorghum Price $/mtWB1988.12371
26Wheat Price, US HRW $/mtWB1988.12371
27FruitsBananas, Central American and Ecuador, FOB U.S. Ports$/mtIMF1988.12371
28Oranges Price $/kgWB1988.12371
29MeatBeef Price$/kgWB1988.12371
30Poultry (Chicken) Price$/kgWB1988.12371
31Lamb, frozen carcass Smithfield London$ cents/pdIMF1988.12371
32Swine (pork), 51-52% lean Hogs, U.S. price$ cents/pdIMF1988.12371
33SeafoodFish (salmon), Farm Bred Norwegian Salmon, export price$/kgIMF1988.12371
34Shrimps Price, Mexican $/kgWB1988.12371
35SugarSugar Price, world $/kgWB1988.12371
36Sugar, European import price$/kgWB1988.12371
37Sugar, U.S. import price$/kgWB1988.12371
38Vegetable Oils and Protein MealCoconut oil$/mtWB1988.12371
39Fish meal Price $/mtWB1988.12371
40Olive Oil, extra virgin less than 1% free fatty acid, ex-tanker price U.K.$/mtIMF1988.12371
41Palm Kernel Oil Price$/mtWB1996.01286
42Palm oil Price $/mtWB1988.12371
43Groundnut oil Price$/mtWB1988.12371
44Groundnuts (peanuts) Price $/mtWB1988.12371
45Rapeseed oil $/mtWB2002.02213
46Soybean meal$/mtWB1988.12371
47Soybean Oil Price $/mtWB1988.12371
48Soybeans Price$/mtWB1988.12371
49Sunflower oil $/mtWB2003.01202
50Agricultural Raw MaterialsWool, coarse, 23 micron, Australian Wool Exchange spot quote$ cents/kgIMF1988.12371
51Cotton, A Index Cotton Price$/kgWB1988.12371
52Wool, fine, 19 micron, Australian Wool Exchange spot quote$ cents/kgIMF1988.12371
53Logs, Malaysian Hard Logs Price$/cmWB1988.12371
54Sawnwood, Malaysian Hard Sawnwood Price $/cmWB1988.12371
55Hides, Heavy native steers, over 53 pounds, wholesale dealer’s price, US, Chicago, fob Shipping Point$ cents/Pd.IMF1988.12371
56Plywood Price $ cents/sheetWB1988.12371
57Rubber Price, SGP/MYS $/kgWB1988.12371
58Soft Logs, Average Export price from the U.S. for Douglas Fir$/cmIMF1988.12371
59Soft Sawnwood, average export price of Douglas Fir, U.S. Price$/cmIMF1988.12371
60Wood Pulp Price$/mtWB1988.12371
61MetalsAluminum Price $/mtWB1988.12371
62Copper, grade A cathode Price$/mtWB1988.12371
63Gold Price$/troy ozWB1988.12371
64Iron Ore Price, cfr spot price$/dmtWB1988.12371
65Lead Price$/mtWB1988.12371
66Nickel Price$/mtWB1988.12371
67Palladium, LME spot price$/troy ozIMF1988.12371
68Platinum$/troy ozWB1988.12371
69Silver Price $/troy ozIMF1988.12371
70Silver$/troy ozWB1988.12371
71Tin Price $/mtWB1988.12371
72Uranium, NUEXCO, Restricted Price, Nuexco exchange spot$/pdIMF1988.12371
73Zinc Price $/mtIMF1988.12371
74Zinc$/mtWB1988.12371
75FertilizersDAP fertilizer Price$/mtWB1988.12371
76Potassium chloride (Muriate of Potash) Standard Grade: FOB Vancouver Spot Price, $/mtWB1988.12371
77Phosphate Rock Price $/mtWB1988.12371
78Triple Superphosphate Price$/mtWB1988.12371
79Urea Price $/mtWB1988.12371
Note: 1. WB: World Bank; 2. IMF: International Monetary Fund; 3. EIA: U.S. Energy Information Administration; 4. MT: Metric Ton; 5. MMBTU: Million Metric British Thermal Unit; 6. CM: Cubic Meter; 7. OZ: Ounce; 8. PD: Pound; 9. $/mt: US Dollars per Metric Ton; 10. $/bbl: US Dollars per Barrel; 11. $/gallon: US Dollars per Gallon; 12. $/mmbtu: US Dollars per Million Metric British Thermal Unit; 13. $/dmt: US Dollars per Dry Metric Ton; 14. $ cents/sheet: US Cents per Sheet; 15. $/pd: US Dollars per Pound; 16. $/troy oz: US Dollars per Troy Ounce; 17. $/cm: US$ per Cubic Meter. Source: Mundi, World Bank, IMF, EIA. Data type: Monthly Average Price.

Appendix C

Table A2. Price rxy Comparisons of Commodities and Brent Crude in Different time Ranges.
DateFrom2019.102019.102019.102019.102019.102019.102019.102019.102019.102019.102019.102019.102019.102019.102019.102019.102019.10AverageSD
TO2018.052017.112015.112013.112011.112009.112007.112005.112003.112001.111999.111997.111995.111993.11199.1111989.111989.01
No.pts1824487296120144168192216240264288312336360370
13710.6581 0.6009 0.7606 0.2289 0.3957 0.4980 0.5765 0.5920 0.6601 0.7568 0.7979 0.8264 0.8363 0.8448 0.8515 0.8544 0.8558 0.6820 0.1825
23710.6058 0.5447 0.7223 0.3397 0.4859 0.5719 0.6215 0.6301 0.6846 0.7737 0.8119 0.8423 0.8552 0.8655 0.8748 0.8797 0.8818 0.7054 0.1624
33710.9968 0.9965 0.9987 0.9992 0.9986 0.9974 0.9968 0.9968 0.9974 0.9981 0.9984 0.9987 0.9989 0.9990 0.9990 0.9991 0.9991 0.9981 0.0010
4371 1.0000 1.00000.0000
53710.9945 0.9861 0.9964 0.9984 0.9989 0.9984 0.9982 0.9976 0.9969 0.9977 0.9980 0.9983 0.9985 0.9987 0.9987 0.9987 0.9987 0.9972 0.0031
63710.9696 0.9562 0.9825 0.9917 0.9863 0.9773 0.9701 0.9683 0.9730 0.9803 0.9836 0.9868 0.9883 0.9895 0.9903 0.9907 0.9910 0.9809 0.0103
71610.9626 0.9579 0.9870 0.9889 0.9937 0.9919 0.9857 0.9857 0.9817 0.0136
83710.8861 0.8776 0.9343 0.9769 0.9850 0.9848 0.9833 0.9791 0.9813 0.9852 0.9872 0.9894 0.9904 0.9913 0.9918 0.9920 0.9921 0.9710 0.0362
93710.9551 0.9364 0.9858 0.9898 0.9941 0.9929 0.9885 0.9886 0.9900 0.9919 0.9928 0.9941 0.9947 0.9952 0.9955 0.9956 0.9956 0.9869 0.0161
10371(0.1367)0.0265 0.6789 0.8108 0.8866 0.8506 0.7411 0.7280 0.7831 0.8349 0.8599 0.8852 0.8970 0.9069 0.9132 0.9164 0.9184 0.7353 0.3074
113550.9722 0.9539 0.9830 0.9917 0.9951 0.9950 0.9863 0.9856 0.9844 0.9881 0.9899 0.9919 0.9928 0.9935 0.9939 0.9941 0.9941 0.9874 0.0104
123710.0590 0.0708 0.4259 0.7994 0.5215 0.4838 0.4288 0.2128 0.0461 0.0819 0.1016 0.2250 0.2821 0.3491 0.3925 0.4267 0.4404 0.3145 0.2067
133290.8091 0.6482 0.7310 0.8506 0.8279 0.7919 0.8008 0.7528 0.7438 0.7946 0.8117 0.8482 0.8623 0.8768 0.8835 0.8022 0.0632
141970.7127 0.7108 0.8698 0.8984 0.9435 0.9457 0.9521 0.9396 0.9478 0.9511 0.8872 0.0962
153710.5264 0.4934 0.6479 0.8166 0.9053 0.8998 0.7129 0.7033 0.7616 0.8210 0.8456 0.8748 0.8888 0.8997 0.9069 0.9102 0.9124 0.7957 0.1355
163710.5706 0.4950 0.5711 0.7686 0.8810 0.8728 0.6525 0.6498 0.7220 0.7918 0.8205 0.8530 0.8681 0.8801 0.8884 0.8922 0.8947 0.7689 0.1334
173710.0811 0.1609 (0.5265)0.1428 (0.0989)0.0343 0.0571 0.1750 0.3659 0.4753 0.5922 0.6318 0.6583 0.6850 0.7109 0.7262 0.7317 0.3296 0.3630
183710.1207 0.0124 (0.6547)0.2885 0.3497 0.4794 0.4266 0.4596 0.5738 0.6929 0.7313 0.6738 0.5819 0.5155 0.5583 0.5790 0.5752 0.4096 0.3354
193710.6030 0.3538 (0.1984)0.2070 0.4124 0.4630 0.5404 0.5464 0.6506 0.7584 0.7951 0.6932 0.6133 0.3602 0.4069 0.4347 0.4226 0.4743 0.2335
203710.6935 0.1986 (0.1730)(0.5034)(0.1821)(0.1193)(0.0792)0.0599 0.2895 0.4620 0.5025 0.5067 0.5440 0.5897 0.6105 0.6314 0.6388 0.2747 0.3714
213710.0876 0.1488 0.5371 0.7329 0.8317 0.8490 0.8625 0.8449 0.8566 0.8407 0.8608 0.8702 0.8494 0.8570 0.8673 0.8733 0.8761 0.7439 0.2495
22371(0.2609)(0.1084)0.2180 0.7005 0.7918 0.8086 0.8058 0.7846 0.8115 0.8448 0.8686 0.8727 0.8323 0.8336 0.8420 0.8454 0.8463 0.6669 0.3552
23371(0.0135)0.0958 0.4276 0.4676 0.7480 0.7209 0.5490 0.5583 0.6589 0.7545 0.7972 0.7878 0.7676 0.7639 0.7762 0.7791 0.7769 0.6127 0.2458
24371(0.2729)(0.0180)0.4738 0.7362 0.8213 0.8041 0.7406 0.7210 0.7604 0.8080 0.8428 0.8633 0.8260 0.8200 0.8220 0.8244 0.8202 0.6702 0.3225
253710.2130 0.1023 0.2717 0.5262 0.7798 0.7748 0.7762 0.7477 0.7822 0.8245 0.8527 0.8655 0.8375 0.8412 0.8497 0.8541 0.8557 0.6915 0.2511
263710.5006 0.5043 0.5881 0.8460 0.8902 0.8789 0.8244 0.8195 0.8407 0.8631 0.8859 0.8963 0.8544 0.8487 0.8532 0.8559 0.8523 0.8001 0.1313
27371(0.0355)0.0156 0.7213 (0.2095)(0.3798)(0.3252)(0.2595)(0.0311)0.2613 0.4741 0.5586 0.6290 0.6590 0.6889 0.7063 0.7066 0.7077 0.2875 0.4248
283710.6604 0.5341 (0.1919)0.0045 0.3059 0.2876 0.3941 0.3716 0.3418 0.4832 0.5689 0.6526 0.6899 0.7157 0.7330 0.7431 0.7494 0.4732 0.2694
29371(0.4891)(0.4626)0.3174 0.3038 (0.0010)(0.0490)0.0448 0.1504 0.3162 0.5045 0.5960 0.6740 0.7128 0.7284 0.7276 0.7254 0.7261 0.3250 0.4079
303710.5357 0.5600 0.5185 0.5371 0.3746 0.2390 0.1757 0.2593 0.3918 0.5655 0.6505 0.7077 0.7401 0.7701 0.7854 0.7919 0.7971 0.5529 0.2051
313710.0055 (0.0011)0.7529 0.8351 0.3607 0.4187 0.4060 0.2821 0.0402 (0.0656)0.0113 0.0955 0.0408 0.0838 0.1221 0.1604 0.1824 0.2194 0.2614
323710.1758 0.1455 0.0411 0.6726 0.6535 0.6644 0.5940 0.6056 0.5731 0.6587 0.6528 0.7032 0.5145 0.5210 0.5254 0.3551 0.3622 0.4952 0.2058
333710.5231 0.5010 0.2667 0.1015 (0.3094)(0.2738)(0.1747)(0.0655)0.1984 0.4246 0.5102 0.5593 0.5803 0.5492 0.4910 0.4534 0.4386 0.2808 0.3103
34371(0.3094)(0.2682)0.2698 0.6942 0.2878 0.2088 0.1944 0.2528 0.3253 0.3336 0.1636 0.0520 (0.0221)(0.0621)(0.0239)0.0006 0.0073 0.1238 0.2426
35371(0.2971)(0.3138)(0.5412)0.1037 0.5282 0.5421 0.4126 0.4307 0.5644 0.6679 0.7085 0.7326 0.7156 0.6869 0.6993 0.6906 0.6832 0.4126 0.4142
363710.6952 0.3097 0.5342 0.8880 0.9105 0.8014 0.4470 0.2256 (0.0352)(0.1152)(0.1488)(0.2256)(0.3125)(0.3682)(0.3993)(0.3996)(0.3846)0.1425 0.4885
37371(0.2118)(0.2598)(0.3999)(0.5982)(0.1502)0.1459 0.1162 0.1741 0.2884 0.3698 0.4389 0.4527 0.4632 0.4667 0.4835 0.4859 0.4854 0.1618 0.3560
383710.6134 0.0983 (0.5422)(0.1428)(0.2470)0.0071 0.1465 0.2201 0.3518 0.5118 0.5886 0.5913 0.5953 0.6121 0.6343 0.6544 0.6600 0.3149 0.3727
393710.4653 0.3300 0.2032 0.5198 0.5135 0.2638 0.1942 0.2771 0.4688 0.6142 0.6929 0.7356 0.7613 0.7881 0.8047 0.8145 0.8192 0.5451 0.2284
403710.4445 0.0594 (0.3124)(0.3745)(0.5218)(0.5502)(0.2981)(0.3420)(0.4287)(0.1682)0.0203 0.0824 (0.0725)(0.0352)0.0386 0.0812 0.1159 −0.1330 0.2700
412860.6379 0.1508 (0.3758)0.0100 (0.0007)0.2122 0.3220 0.3708 0.4621 0.5927 0.6541 0.6395 0.6359 0.3316 0.3206
423710.5968 0.2398 (0.3971)0.5004 0.7341 0.7300 0.7496 0.7397 0.7747 0.8231 0.8540 0.8046 0.7989 0.7831 0.7996 0.8080 0.8125 0.6560 0.3108
433710.2058 0.0661 0.3641 0.2849 0.6878 0.6651 0.6677 0.6665 0.6746 0.7434 0.7910 0.8120 0.8224 0.8256 0.8371 0.8413 0.8450 0.6353 0.2472
443710.5797 0.5284 (0.1533)(0.3467)0.5100 0.5062 0.5380 0.5568 0.6184 0.6873 0.7205 0.7240 0.7323 0.7331 0.7372 0.6779 0.6853 0.5315 0.3079
45213(0.4283)(0.4108)0.1460 0.6255 0.8089 0.7904 0.7973 0.8027 0.8319 0.8697 0.4833 0.5203
463710.6250 0.4984 0.3524 0.8186 0.7826 0.6929 0.6969 0.6479 0.6985 0.7754 0.8134 0.8440 0.8353 0.8504 0.8595 0.8657 0.8636 0.7365 0.1432
473710.1837 (0.0362)(0.1180)0.6293 0.8162 0.8054 0.8187 0.7966 0.8189 0.8610 0.8833 0.8692 0.8705 0.8587 0.8688 0.8750 0.8780 0.6870 0.3331
483710.1236 0.0798 (0.1490)0.7237 0.8289 0.8365 0.8568 0.7903 0.8029 0.8560 0.8816 0.8912 0.8789 0.8836 0.8898 0.8940 0.8920 0.7036 0.3342
492020.2380 0.1041 (0.7170)0.2789 0.7177 0.7372 0.7511 0.7530 0.7774 0.7934 0.4434 0.4850
503710.5827 0.5303 0.8639 0.1765 0.1352 0.1452 0.1628 0.2397 0.3842 0.4863 0.5917 0.6639 0.6921 0.7125 0.7348 0.7452 0.7452 0.5054 0.2489
513710.7157 0.6826 0.7290 0.5388 0.6551 0.4837 0.4514 0.4834 0.5206 0.5912 0.6264 0.6159 0.5498 0.4707 0.4941 0.4634 0.4565 0.5605 0.0947
523710.6157 0.5903 0.8658 0.0488 0.0571 0.2098 0.2434 0.3066 0.4386 0.5554 0.6098 0.6669 0.6860 0.6899 0.7132 0.6970 0.6679 0.5096 0.2463
53371(0.5076)(0.3147)0.1283 0.5712 0.7537 0.7232 0.6007 0.6144 0.6980 0.7845 0.8198 0.8429 0.7945 0.6722 0.5258 0.5520 0.5614 0.5188 0.3887
543710.6920 0.3748 (0.3250)0.5752 0.7039 0.7365 0.7115 0.7152 0.7724 0.8386 0.8569 0.8774 0.8191 0.7171 0.7036 0.7181 0.7221 0.6594 0.2785
553710.7784 0.4717 (0.5621)0.4737 0.4923 0.4802 0.5207 0.4482 0.3596 0.2956 0.2456 0.2639 0.2035 0.1491 0.1616 0.1282 0.1117 0.2954 0.2845
56371(0.5076)(0.3147)0.1283 0.5712 0.8055 0.8013 0.6738 0.5289 0.6046 0.7196 0.7605 0.7995 0.7417 0.5665 0.4864 0.5228 0.5385 0.4957 0.3807
57371(0.0444)(0.0315)0.0399 0.4822 0.7786 0.6740 0.6847 0.6896 0.7309 0.7864 0.8223 0.8423 0.8328 0.8221 0.8324 0.8395 0.8409 0.6249 0.3179
583710.4648 0.2150 0.6291 0.0652 (0.4420)(0.3753)(0.2983)(0.3237)(0.2849)0.0193 0.0159 0.0775 (0.1096)(0.2625)(0.2627)(0.1284)(0.0694)−0.0629 0.2941
593710.3608 0.2964 0.7064 0.4091 0.0210 (0.1696)(0.1952)(0.2230)(0.1383)0.2054 0.3155 0.4001 0.4018 0.4201 0.4708 0.4873 0.4978 0.2510 0.2847
603710.0265 (0.6605)(0.3168)0.0799 0.1712 0.3714 0.5895 0.6341 0.7040 0.7033 0.6611 0.6859 0.6401 0.6097 0.3500 0.4319
613710.7246 0.5561 0.7647 0.3366 0.4338 0.5154 0.6118 0.3889 0.4588 0.5969 0.6460 0.7008 0.7115 0.7040 0.7290 0.7326 0.7036 0.6068 0.1353
623710.5799 0.3211 0.7886 0.7969 0.8953 0.8371 0.8351 0.7890 0.8153 0.8656 0.8892 0.9092 0.9156 0.9177 0.9231 0.9253 0.9244 0.8193 0.1544
63371(0.6041)(0.5486)0.3152 0.2218 0.6637 0.6613 0.4009 0.4165 0.5624 0.6863 0.7452 0.7862 0.8057 0.8187 0.8299 0.8368 0.8396 0.4963 0.4481
64371(0.4425)(0.3653)0.5146 0.7578 0.8765 0.7945 0.7975 0.7939 0.8305 0.8669 0.8868 0.8948 0.9030 0.9094 0.9132 0.9154 0.9170 0.6920 0.4240
653710.3006 0.0855 0.4798 0.3328 0.2853 0.3929 0.4269 0.3910 0.5497 0.6927 0.7527 0.7944 0.8119 0.8293 0.8422 0.8471 0.8496 0.5685 0.2488
66371(0.0817)(0.0209)0.7407 0.7807 0.8326 0.6914 0.6812 0.2969 0.3299 0.4648 0.5362 0.6095 0.6385 0.6623 0.6826 0.6891 0.6744 0.5417 0.2654
67371(0.7284)(0.5790)0.6358 0.1497 (0.1629)(0.1567)(0.0723)0.0234 0.2096 0.3275 0.2628 0.3391 0.4170 0.4750 0.5178 0.5452 0.5553 0.1623 0.3961
683710.0184 (0.0427)(0.4549)0.6923 0.8619 0.8024 0.8096 0.8093 0.8377 0.8820 0.9025 0.9221 0.9307 0.9380 0.9421 0.9435 0.9441 0.6905 0.4212
69371(0.3416)(0.3262)(0.1991)0.5833 0.7700 0.7744 0.6827 0.6886 0.7501 0.8115 0.8416 0.8550 0.8677 0.8759 0.8843 0.8888 0.8902 0.6057 0.4362
70371(0.3518)(0.3346)(0.2107)0.5777 0.7691 0.7727 0.6809 0.6870 0.7488 0.8104 0.8407 0.8542 0.8669 0.8751 0.8836 0.8882 0.8895 0.6028 0.4397
713710.3753 0.3234 0.5534 0.7052 0.7129 0.6647 0.6527 0.6028 0.6858 0.7797 0.8194 0.8445 0.8590 0.8699 0.8781 0.8827 0.8802 0.7112 0.1720
72371(0.3521)(0.2234)(0.3381)0.1874 0.6365 0.6428 0.5176 0.2655 0.3867 0.5258 0.6012 0.6491 0.6727 0.6969 0.7157 0.7285 0.7333 0.4145 0.3781
733710.4711 0.1816 0.6721 0.0382 (0.2961)(0.2717)(0.0858)(0.1625)0.1282 0.3785 0.4723 0.5411 0.5731 0.6079 0.6271 0.6297 0.6209 0.3015 0.3452
743710.4711 0.1816 0.6721 0.0382 (0.2961)(0.2720)(0.0861)(0.1628)0.1272 0.3775 0.4713 0.5400 0.5720 0.6069 0.6262 0.6290 0.6202 0.3010 0.3450
753710.5766 0.5692 0.5528 0.5005 0.6907 0.6540 0.5433 0.5650 0.6407 0.7165 0.7597 0.7738 0.7834 0.7955 0.8103 0.8183 0.8213 0.6807 0.1124
76371(0.4059)(0.3265)(0.4405)0.3293 0.7267 0.7148 0.3434 0.3876 0.5110 0.6155 0.6706 0.7076 0.7322 0.7502 0.7638 0.7743 0.7789 0.4490 0.4281
77371(0.0329)0.0370 (0.7077)(0.1545)0.5451 0.5829 0.0475 0.1224 0.2459 0.3480 0.4084 0.4628 0.5016 0.5318 0.5545 0.5708 0.5773 0.2730 0.3516
783710.4377 0.4555 0.4025 0.4564 0.6935 0.7043 0.5511 0.5759 0.6381 0.7039 0.7424 0.7518 0.7619 0.7773 0.7917 0.8002 0.8026 0.6498 0.1411
79371(0.1785)(0.1576)0.5133 0.6344 0.7828 0.7370 0.6763 0.6825 0.7273 0.7939 0.8297 0.8579 0.8599 0.8665 0.8740 0.8768 0.8789 0.6621 0.3287
Note: SD, Standard Deviation.

Appendix D

Table A3. Price Change Rate rxy between Commodities and Brent Crude in Different Time Ranges.
DateFrom2019.102019.102019.102019.102019.102019.102019.102019.102019.102019.102019.102019.102019.102019.102019.102019.102019.10AverageSD
TO2018.052017.112015.112013.112011.112009.112007.112005.112003.11200.1111999.111997.111995.111993.11199.1111989.111989.01
No.pts1824487296120144168192216240264288312336360370
13700.28200.27670.11460.17850.20210.22060.35460.37410.35830.34180.29960.28620.28200.26980.26400.23860.23640.26940.0681
23700.17550.25270.18940.30660.30900.30470.43520.43300.37450.34400.25180.21920.21630.21220.20960.18720.18540.27100.0854
33700.99180.99220.99170.99150.98850.98810.99100.99020.98870.98820.98700.98630.98640.98590.98570.98740.98730.98870.0023
4370 1.00001.00000.0000
53700.99050.99110.98950.99090.98720.98600.98840.98380.96900.96790.96470.96260.96050.95870.95750.96020.96000.97460.0138
63700.94170.94460.93930.92700.90920.90240.92280.92520.92790.93020.92650.92690.92850.92720.92820.93700.93660.92830.0106
71600.94780.94980.94940.94160.94150.94210.93880.9345 0.94320.0054
83700.82390.83200.78370.83590.83020.83630.87200.85610.84580.83620.83060.83990.82370.82240.82000.80320.79480.82860.0212
93700.94440.94220.93160.92800.92870.93170.93590.92850.91430.90010.82020.83030.82450.81170.81370.80120.79980.88160.0591
10370(0.3328)(0.1892)(0.1190)(0.2662)(0.2360)(0.1758)(0.1630)(0.1532)(0.1382)(0.1236)(0.1200)(0.0972)(0.0994)(0.0971)(0.0947)(0.0930)(0.0944)−0.15250.0693
113540.94470.95040.89890.92400.92200.92560.92120.89680.87180.87390.85860.86510.86420.85580.85410.8677 0.89340.0335
12370(0.2751)0.04140.10000.15690.08830.04070.14500.12880.15850.20820.13250.15210.14140.13480.13270.14010.13280.10350.1059
133280.72060.70120.75530.66930.65180.61960.70010.69850.67390.68290.59200.60490.59430.58990.5869 0.65610.0548
141960.81120.76380.58650.64810.65740.66110.69870.70640.69570.6866 0.69160.0622
153700.13390.16240.29040.14230.11860.12520.07290.08320.09480.06790.06320.05670.06270.06330.06030.03580.02840.09780.0627
163700.16000.07520.12120.08580.06350.10660.02220.04470.07000.04310.04450.03300.03530.03500.0315(0.0084)(0.0133)0.05590.0445
173700.08680.06700.12320.16560.17780.17630.24980.28890.25670.26300.17520.14050.11770.12020.09530.07810.06630.15580.0724
183700.13990.14150.08170.05020.06260.09990.18810.20310.14610.11750.14990.09300.05080.06580.05180.05740.05900.10340.0501
193700.16960.08470.19860.16070.16520.19010.24360.23430.16480.16120.17990.13030.09710.10870.08890.10440.10050.15190.0495
203700.29070.18430.0479(0.0637)(0.0302)(0.0015)0.12090.11040.09900.09330.08410.09100.08330.08580.08420.11540.12670.08950.0794
213700.04070.13640.04950.00060.01230.10320.33960.32440.27780.23990.19520.18050.17200.14550.15050.16380.17300.15910.0998
22370(0.2223)(0.1596)0.03380.03840.08290.13690.31390.24220.20240.17960.13770.11330.09460.06520.06480.02060.02440.08050.1308
23370(0.0000)0.27270.08510.0598(0.0057)(0.0130)0.14410.14390.13550.12260.11020.07860.07180.03580.03490.02230.02130.07760.0728
24370(0.3409)(0.3239)(0.0937)(0.0777)0.00920.03360.08540.08040.07350.07540.06500.07400.08820.06270.05720.03540.0391−0.00340.1345
253700.04060.00180.15120.11290.11200.16570.30560.23630.19830.17670.15360.12230.10730.08210.07420.03640.03780.12440.0787
26370(0.0882)0.1013(0.1244)(0.0190)0.02890.06230.15650.16360.13530.13180.13630.12170.11200.07940.06910.04660.05120.06850.0820
273700.1497(0.0700)(0.2491)(0.1512)(0.0274)(0.0154)(0.0642)(0.0731)(0.0716)0.00370.01960.0214(0.0041)(0.0309)(0.0356)(0.0592)(0.0502)−0.04160.0820
28370(0.0201)0.01990.0462(0.0355)(0.0745)(0.0475)0.10660.07300.11820.13210.11880.12870.12020.13030.11890.11980.11930.06910.0724
29370(0.2365)(0.2352)(0.0081)(0.0657)(0.0360)0.06040.27460.24180.22040.22430.21390.19730.17870.16260.16100.15430.14710.09730.1594
303700.00670.1592(0.0612)0.04280.01910.01540.03120.03080.03060.03560.04360.02870.01310.01340.00870.00140.00090.02470.0422
31370(0.1421)(0.0427)0.10990.22090.21850.23060.36400.36680.31070.29680.24210.27010.26150.25420.22920.20090.19940.21120.1309
323700.31200.25830.18440.18300.13910.13850.15990.13000.12600.11180.08310.13830.12460.11230.11280.08220.07920.14560.0614
333700.27260.26500.07860.00290.04510.09700.18340.20540.19470.18000.15140.14500.14480.14490.13280.13830.13870.14830.0691
34370(0.2241)(0.1841)(0.2831)0.00100.0118(0.0229)0.01900.04730.0252(0.0028)0.01190.02050.00260.01230.0198(0.0421)(0.0353)−0.03670.0967
353700.18680.13930.27590.24790.24510.17070.21170.22600.22530.22200.20350.15820.14680.13170.14080.10540.10120.18460.0526
36370(0.1929)(0.0239)0.02490.19850.22370.25990.37440.37130.31730.31270.22670.20300.19210.19190.17010.19670.19680.19080.1427
373700.00460.01970.12430.04860.08950.04690.17640.16150.14980.12700.08240.06840.06810.06300.06510.06510.06160.08360.0485
38370(0.2011)(0.0388)0.07720.11930.14280.18480.31290.30870.27210.26060.20780.18900.17210.13310.12470.11260.10900.14630.1261
39370(0.0001)0.16370.07270.10280.10400.11830.07210.04630.02770.04080.00840.00450.0151(0.0007)0.00380.03720.03040.04980.0485
40370(0.5112)(0.3454)(0.1644)(0.1973)(0.0670)(0.0291)0.09960.12180.13090.13720.07650.12500.15460.15410.14800.15800.15780.00880.2019
41285(0.1025)(0.0217)0.21520.19590.20880.19980.34100.33830.31130.30000.25310.24070.2302 0.20850.1313
423700.28520.23360.30380.33450.34690.32810.43920.43370.38500.33050.20740.15830.15770.12590.12190.11790.11230.26010.1136
43370(0.2821)(0.2611)(0.1049)(0.0410)(0.0786)(0.0201)0.14760.15530.13220.11370.06920.03080.01890.00590.02000.03460.0471−0.00070.1258
443700.27410.2296(0.0005)(0.0796)(0.0670)(0.0405)0.10530.07300.03380.01680.06030.05210.05560.04060.03130.24530.24390.07500.1102
45212(0.0862)(0.0642)0.11530.22050.23710.28540.47660.47930.42020.3657 0.24500.2050
46370(0.0874)(0.0081)0.23580.17370.19290.17580.32780.28560.25410.22800.19070.19580.18970.17940.16690.17440.17800.17960.0974
47370(0.0468)0.02000.15620.21260.26700.28180.52200.50400.45750.34530.16520.14650.13740.10470.10490.11580.11600.21240.1635
48370(0.3396)(0.2825)0.09450.08270.14160.15970.39950.37450.31120.27510.23010.20810.18680.16640.15650.13550.13790.14340.1936
49201(0.0011)(0.0107)0.14070.13360.16160.18960.39210.38260.3569 0.19390.1537
503700.26200.28060.06680.18350.16480.24300.36920.32150.26240.22900.20820.19040.15330.14600.15300.14040.13940.20670.0764
513700.10070.25900.10140.19530.23800.26720.32850.32540.28660.25840.25430.22710.21340.20150.20870.13770.14070.22020.0692
523700.30350.38160.20910.29610.26160.30660.38550.33520.30540.26130.25030.27040.22830.22500.21630.21920.21830.27490.0560
53370(0.3680)(0.3145)(0.1773)0.0020(0.0521)(0.0512)(0.1886)(0.1409)(0.1408)(0.0844)(0.0393)0.01830.01090.05520.05350.04500.0361−0.07860.1274
543700.27050.32620.30470.35100.30210.30280.30190.30640.31330.30710.26290.23330.20440.20460.17860.16120.12660.26220.0653
553700.51400.51860.23500.25500.22820.23990.27020.23430.22550.21590.19410.18690.18560.19380.20070.16030.16630.24850.1052
56370(0.3680)(0.3145)(0.1773)0.00200.00870.0255(0.0191)0.0280(0.0320)(0.0209)0.02240.06780.05720.08110.06040.05640.0444−0.02810.1321
573700.08480.08990.30780.34350.32360.35780.49640.44290.41320.39890.38510.34110.31840.31790.31650.29800.29830.32550.1051
58370(0.0984)(0.0107)(0.1158)(0.0952)(0.1296)(0.1059)(0.1439)(0.1130)(0.1057)(0.0898)(0.0505)(0.0640)(0.0806)(0.0700)(0.0652)(0.0595)(0.0474)−0.08500.0337
593700.23210.29860.0664(0.0275)(0.0202)(0.0446)0.01990.04440.13590.09530.17350.16810.17790.16520.15800.11940.10100.10960.0945
60370 0.0066(0.0355)0.04150.32850.30540.22890.14420.08750.11850.10490.10310.10860.10970.11050.12590.1019
613700.42640.44650.29760.33960.32290.36950.53480.48490.44980.43050.41450.42960.40690.38300.36840.39290.37590.40430.0588
623700.30350.35090.29450.39410.42510.44160.57620.54960.51550.48570.46170.46410.42580.40560.39200.37430.37100.42540.0785
63370(0.2879)(0.1771)(0.0327)(0.0206)0.03630.05620.12160.18930.15870.17600.16040.13850.13370.12780.12590.16870.16720.07310.1341
643700.42470.33590.29260.24750.21830.25230.36420.34880.32870.31140.28750.25750.25020.24510.24510.21920.22260.28540.0588
65370(0.1165)(0.0955)0.01960.17930.22140.28810.35360.33280.28830.27270.24770.22540.21940.20250.19680.16850.15920.18610.1336
663700.29240.31560.24360.30320.28570.32820.44670.41250.35370.34570.34970.36110.34270.31300.31350.29320.28390.32850.0491
67370(0.0330)0.01010.15180.22430.23730.27880.36770.35360.31200.28650.28820.26760.23620.23810.22820.19840.20330.22640.1051
683700.38670.36170.25860.21650.26780.29650.42780.42440.39340.39740.38880.35100.32600.32320.31910.29590.29200.33690.0613
69370(0.0822)0.00610.05430.08300.14340.24490.31500.33630.30530.28750.26310.20820.19540.19250.18850.17740.17730.18210.1140
70370(0.1043)(0.0106)0.03930.05920.12910.23480.30860.33040.29840.28080.25740.20280.19000.18720.18350.17300.17290.17250.1189
713700.18830.15920.29270.19080.23220.29720.48320.45630.41160.38200.36220.33150.32500.30530.30810.27490.27730.31050.0904
72370(0.1248)(0.0128)0.02230.0003(0.0056)0.02580.08440.08000.07120.07520.05670.09250.09320.08820.08660.04420.04000.04220.0560
733700.24080.22480.29830.35040.35540.36980.42560.38310.36280.36090.33790.32550.28970.28320.27250.21710.21020.31220.0640
743700.24080.22480.29830.35040.35620.36890.42810.38610.36390.36350.34170.32960.29410.28760.27680.22120.21410.31450.0637
753700.07100.23000.34660.09040.05270.01880.15350.15760.15180.12950.11370.10100.10420.09570.09940.09200.09310.12360.0742
763700.25520.18140.09930.08080.09160.08990.13190.12150.11540.10740.09950.09210.08950.08850.08820.07820.07490.11090.0451
77370(0.1960)(0.1350)(0.2074)(0.2033)(0.0874)(0.0529)(0.1005)(0.0721)(0.0703)(0.0674)(0.0617)(0.0597)(0.0589)(0.0589)(0.0570)(0.0526)(0.0525)−0.09370.0558
783700.10430.24460.11980.08700.01450.10140.26140.26400.24770.22800.20070.17610.17510.16820.16760.15490.15300.16870.0690
79370(0.3012)(0.1808)(0.0774)(0.0473)(0.0236)(0.0317)0.16190.15300.16050.15970.15260.15470.15230.15810.15950.14040.13820.06050.1439
Note: SD, Standard Deviation.

Appendix E

Table A4. Estimated Brent Crude Oil Price, Change Rate and Residuals of Each Selected Commodity.
Brent Crude Oil Price New York Harbor Ultra-Low Sulfur No 2 Diesel Spot PriceNew York Harbor No. 2 Heating Oil Spot Price FOBU.S. Gulf Coast Kerosene-Type Jet Fuel Spot Price FOB
FormulaeY = 38.023X − 7.7037Y = 37.149X − 2.4578Y = 36.358X − 1.8652
Items(1)(1)(2)(3)(4)(5)(1)(2)(3)(4)(5)(1)(2)(3)(4)(5)
Training Data
Jun-0668.85772.09171.802 2.945 4.28% 1.92569.054 0.196 0.29% 2.08173.796 4.938 7.17%
Jul-0673.89712.21776.593 2.696 3.65%+1.93569.426 −4.472 −6.05%+2.15476.450 2.553 3.45%+
Aug-0673.61222.24777.734 4.122 5.60%-1.98471.246 −2.366 −3.21%-2.13375.686 2.074 2.82%+
Sep-0662.77191.8161.118 −1.654 −2.63%+1.69960.658 −2.114 −3.37%+1.8163.943 1.171 1.87%+
Oct-0658.38001.79460.510 2.130 3.65%+1.64858.764 0.384 0.66%+1.73961.361 2.981 5.11%+
Nov-0658.48321.81161.156 2.673 4.57%+1.64858.764 0.281 0.48%-1.73361.143 2.660 4.55%-
Dec-0662.31471.83361.992 −0.322 −0.52%+1.68460.101 −2.214 −3.55%+1.8163.943 1.628 2.61%+
Jan-0754.29911.6354.274 −0.025 −0.05%+1.52854.306 0.007 0.01%+1.65458.271 3.972 7.31%+
Feb-0757.75701.75959.179 1.422 2.46%+1.69360.435 2.678 4.64%+1.7461.398 3.641 6.30%+
Mar-0762.14361.89164.198 2.054 3.31%+1.74262.256 0.112 0.18%+1.84665.252 3.108 5.00%+
Apr-0767.39842.05370.358 2.959 4.39%+1.86466.788 −0.610 −0.91%+2.03672.160 4.761 7.06%+
May-0767.47612.04470.015 2.539 3.76%-1.88467.531 0.055 0.08%+2.04472.451 4.974 7.37%+
Jun-0771.31622.1272.905 1.589 2.23%+1.99171.506 0.190 0.27%+2.09974.450 3.134 4.39%+
Jul-0777.20412.14673.894 −3.310 −4.29%+2.07274.515 −2.689 −3.48%+2.13775.832 −1.372 −1.78%+
Aug-0770.79652.10672.373 1.576 2.23%+1.98471.246 0.449 0.63%+2.09274.196 3.399 4.80%+
Sep-0777.12702.3280.510 3.383 4.39%+2.17978.490 1.363 1.77%+2.26580.486 3.359 4.35%+
Oct-0782.85782.41784.198 1.340 1.62%+2.28282.316 −0.542 −0.65%+2.37284.376 1.518 1.83%+
Nov-0792.52822.794.958 2.430 2.63%+2.58693.610 1.081 1.17%+2.67395.320 2.792 3.02%+
Dec-0791.45002.63192.335 0.885 0.97%+2.57493.164 1.714 1.87%+2.60192.702 1.252 1.37%+
Jan-0891.92052.5990.776 −1.145 −1.25%-2.55892.569 0.649 0.71%-2.60592.847 0.927 1.01%+
Feb-0894.81672.77497.772 2.955 3.12%+2.64495.764 0.947 1.00%+2.72897.319 2.503 2.64%+
Mar-08103.27753.253115.985 12.708 12.30%+3.066111.441 8.164 7.90%+3.124111.717 8.440 8.17%+
Apr-08110.18773.443123.209 13.022 11.82%+3.226117.385 7.197 6.53%+3.365120.479 10.292 9.34%+
May-08123.93623.821137.582 13.646 11.01%+3.615131.836 7.900 6.37%+3.738134.041 10.105 8.15%+
Jun-08133.04863.887140.092 7.043 5.29%+3.801138.746 5.697 4.28%+3.878139.131 6.083 4.57%+
Jul-08133.87303.845138.495 4.622 3.45%-3.759137.185 3.312 2.47%-3.886139.422 5.549 4.14%+
Aug-08113.84903.273116.746 2.897 2.54%+3.169115.267 1.418 1.25%+3.271117.062 3.213 2.82%+
Sep-0899.06413.041107.924 8.860 8.94%+2.911105.683 6.619 6.68%+3.375120.843 21.779 21.98%-
Oct-0872.84262.39783.437 10.595 14.54%+2.23980.719 7.876 10.81%+2.31582.304 9.461 12.99%+
Nov-0853.24101.92365.415 12.174 22.86%+1.84366.008 12.767 23.98%+1.8866.488 13.247 24.88%+
Dec-0841.58091.43646.897 5.316 12.79%+1.40249.625 8.044 19.35%+1.37548.127 6.546 15.74%+
Jan-0944.86001.49649.179 4.319 9.63%+1.46551.965 7.105 15.84%+1.46951.545 6.685 14.90%+
Feb-0943.24251.30641.954 −1.288 −2.98%+1.27945.056 1.813 4.19%+1.25943.910 0.667 1.54%+
Mar-0946.83911.33843.171 −3.668 −7.83%+1.27744.981 −1.858 −3.97%-1.26844.237 −2.602 −5.56%+
Apr-0950.84521.44947.392 −3.454 −6.79%+1.35747.953 −2.892 −5.69%+1.36947.909 −2.936 −5.78%+
May-0957.94101.5250.091 −7.850 −13.55%+1.47352.263 −5.678 −9.80%+1.48852.236 −5.705 −9.85%+
Jun-0968.61681.8261.498 −7.119 −10.37%+1.74762.442 −6.175 −9.00%+1.80563.761 −4.856 −7.08%+
Jul-0964.91001.72257.772 −7.138 −11.00%+1.62858.021 −6.889 −10.61%+1.71260.380 −4.530 −6.98%+
Aug-0972.50481.92765.567 −6.938 −9.57%+1.86566.825 −5.680 −7.83%+1.88566.670 −5.835 −8.05%+
Sep-0967.68681.79560.548 −7.139 −10.55%+1.72861.736 −5.951 −8.79%+1.74961.725 −5.962 −8.81%+
Oct-0973.19411.98267.658 −5.536 −7.56%+1.92969.203 −3.991 −5.45%+1.94268.742 −4.452 −6.08%+
Nov-0977.03671.99868.266 −8.770 −11.38%+1.98171.134 −5.902 −7.66%+1.98670.342 −6.695 −8.69%+
Dec-0974.66951.9867.582 −7.088 −9.49%+1.96870.651 −4.018 −5.38%+1.97970.087 −4.582 −6.14%+
Jan-1076.37302.06670.852 −5.521 −7.23%+2.04673.549 −2.824 −3.70%+2.05272.741 −3.632 −4.76%+
Feb-1074.31202.03569.673 −4.639 −6.24%+1.97871.023 −3.289 −4.43%+1.98970.451 −3.861 −5.20%+
Mar-1079.27482.15974.388 −4.887 −6.16%+2.08374.924 −4.351 −5.49%+2.10874.777 −4.497 −5.67%+
Apr-1084.97862.28479.141 −5.838 −6.87%+2.20479.419 −5.560 −6.54%+2.24379.686 −5.293 −6.23%+
May-1076.25102.13673.513 −2.738 −3.59%+2.0473.326 −2.925 −3.84%+2.06373.141 −3.110 −4.08%+
Jun-1074.83822.10872.449 −2.389 −3.19%+2.03273.029 −1.809 −2.42%+2.05872.960 −1.879 −2.51%+
Jul-1074.73552.06670.852 −3.884 −5.20%+1.97971.060 −3.675 −4.92%+2.01971.542 −3.194 −4.27%+
Aug-1076.69322.12272.981 −3.712 −4.84%+2.01672.435 −4.259 −5.55%+2.08373.869 −2.825 −3.68%+
Sep-1077.78682.17574.996 −2.790 −3.59%+2.0975.184 −2.603 −3.35%+2.11474.996 −2.791 −3.59%+
Oct-1082.91812.30179.787 −3.131 −3.78%+2.24280.830 −2.088 −2.52%+2.24879.868 −3.051 −3.68%+
Nov-1085.67002.37782.677 −2.993 −3.49%+2.3283.728 −1.942 −2.27%+2.32382.594 −3.076 −3.59%+
Dec-1091.79652.587.354 −4.443 −4.84%+2.46889.226 −2.571 −2.80%+2.45387.321 −4.476 −4.88%+
Jan-1196.29432.64292.753 −3.541 −3.68%+2.60494.278 −2.016 −2.09%+2.61993.356 −2.938 −3.05%+
Feb-11103.95552.84100.282 −3.674 −3.53%+2.77100.445 −3.511 −3.38%+2.839101.355 −2.600 −2.50%+
Mar-11114.44133.131111.346 −3.095 −2.70%+3.034110.252 −4.189 −3.66%+3.125111.754 −2.688 −2.35%+
Apr-11123.07003.271116.670 −6.400 −5.20%+3.196116.270 −6.800 −5.52%+3.267116.916 −6.154 −5.00%+
May-11114.45823.035107.696 −6.762 −5.91%+2.952107.206 −7.252 −6.34%+3.085110.299 −4.159 −3.63%+
Jun-11113.75773.054108.419 −5.339 −4.69%-2.967107.763 −5.994 −5.27%-3.046108.881 −4.876 −4.29%+
Jul-11116.46003.17112.829 −3.631 −3.12%+3.068111.515 −4.945 −4.25%+3.131111.972 −4.488 −3.85%+
Aug-11110.08133.01106.746 −3.336 −3.03%+2.946106.983 −3.098 −2.81%+3.008107.500 −2.582 −2.35%+
Sep-11110.87912.98105.605 −5.274 −4.76%-2.921106.054 −4.825 −4.35%-2.948105.318 −5.561 −5.02%-
Oct-11109.46863.008106.669 −2.799 −2.56%-2.953107.243 −2.225 −2.03%-2.966105.973 −3.496 −3.19%-
Nov-11110.50413.095109.977 −0.527 −0.48%+3.054110.995 0.491 0.44%+3.046108.881 −1.623 −1.47%+
Dec-11107.90902.937103.970 −3.939 −3.65%+2.891104.940 −2.969 −2.75%+2.873102.591 −5.318 −4.93%+
Jan-12111.15623.08109.407 −1.749 −1.57%+3.054110.995 −0.161 −0.14%+3.087110.372 −0.784 −0.71%+
Feb-12119.70243.223114.844 −4.858 −4.06%+3.196116.270 −3.432 −2.87%+3.207114.735 −4.967 −4.15%+
Mar-12124.92863.302117.848 −7.080 −5.67%+3.217117.051 −7.878 −6.31%+3.256116.516 −8.412 −6.73%+
Apr-12120.46353.242115.567 −4.897 −4.06%+3.15114.562 −5.902 −4.90%+3.226115.426 −5.038 −4.18%+
May-12110.52172.987105.871 −4.651 −4.21%+2.913105.757 −4.765 −4.31%+2.974106.263 −4.258 −3.85%+
Jun-1295.58902.7195.339 −0.250 −0.26%+2.61994.835 −0.754 −0.79%+2.67895.502 −0.088 −0.09%+
Jul-12103.14092.921103.361 0.221 0.21%+2.813102.042 −1.099 −1.07%+2.892103.282 0.141 0.14%+
Aug-12113.34003.179113.171 −0.169 −0.15%+3.045110.661 −2.679 −2.36%+3.156112.881 −0.459 −0.41%+
Sep-12113.38253.229115.073 1.690 1.49%+3.134113.967 0.585 0.52%+3.191114.153 0.771 0.68%+
Oct-12111.97353.236115.339 3.365 3.01%-3.14114.190 2.217 1.98%-3.111111.245 −0.729 −0.65%+
Nov-12109.71183.18113.209 3.498 3.19%+3.009109.324 −0.388 −0.35%+2.96105.754 −3.957 −3.61%+
Dec-12109.67653.07109.027 −0.650 −0.59%+2.995108.803 −0.873 −0.80%+2.94105.027 −4.649 −4.24%+
Jan-13112.97363.103110.282 −2.692 −2.38%+3.068111.515 −1.458 −1.29%+3.091110.517 −2.456 −2.17%+
Feb-13116.51953.237115.377 −1.143 −0.98%+3.168115.230 −1.289 −1.11%+3.218115.135 −1.385 −1.19%+
Mar-13109.24003.037107.772 −1.468 −1.34%+2.943106.872 −2.368 −2.17%+2.969106.082 −3.158 −2.89%+
Apr-13102.87552.9102.563 −0.312 −0.30%+2.74299.405 −3.471 −3.37%+2.808100.228 −2.647 −2.57%+
May-13103.02702.888102.107 −0.920 −0.89%-2.73999.293 −3.734 −3.62%-2.72597.210 −5.817 −5.65%-
Jun-13103.11002.891102.221 −0.889 −0.86%+2.75299.776 −3.334 −3.23%+2.76998.810 −4.300 −4.17%+
Jul-13107.71613.018107.050 −0.666 −0.62%+2.885104.717 −2.999 −2.78%+2.894103.355 −4.361 −4.05%+
Aug-13110.96453.068108.951 −2.014 −1.81%+2.958107.429 −3.536 −3.19%+3.003107.318 −3.647 −3.29%+
Sep-13111.62143.048108.190 −3.431 −3.07%-2.961107.540 −4.081 −3.66%+2.934104.809 −6.812 −6.10%-
Oct-13109.47872.995106.175 −3.304 −3.02%+2.94106.760 −2.718 −2.48%+2.885103.028 −6.451 −5.89%+
Nov-13108.07622.938104.008 −4.068 −3.76%+2.923106.129 −1.947 −1.80%+2.83101.028 −7.048 −6.52%+
Dec-13110.67403.045108.076 −2.598 −2.35%+3.032110.178 −0.496 −0.45%+2.955105.573 −5.101 −4.61%+
Jan-14107.42003.117110.814 3.394 3.16%-3.063111.330 3.910 3.64%-2.921104.337 −3.083 −2.87%+
Feb-14108.81003.227114.997 6.187 5.69%+3.061111.255 2.445 2.25%-2.965105.936 −2.874 −2.64%+
Mar-14107.40002.993106.099 −1.301 −1.21%+2.912105.720 −1.680 −1.56%+2.89103.209 −4.191 −3.90%+
Apr-14107.79002.958104.768 −3.022 −2.80%-2.888104.829 −2.961 −2.75%-2.888103.137 −4.653 −4.32%-
May-14109.68002.936103.932 −5.748 −5.24%-2.86103.788 −5.892 −5.37%-2.868102.410 −7.270 −6.63%-
Jun-14111.87002.962104.920 −6.950 −6.21%+2.882104.606 −7.264 −6.49%+2.883102.955 −8.915 −7.97%+
Jul-14106.98002.879101.765 −5.215 −4.88%+2.776100.668 −6.312 −5.90%+2.817100.555 −6.425 −6.01%+
Aug-14101.92002.85100.662 −1.258 −1.23%+2.75399.813 −2.107 −2.07%+2.839101.355 −0.565 −0.55%-
Sep-1497.34002.7496.479 −0.861 −0.88%+2.63395.356 −1.984 −2.04%+2.72997.356 0.016 0.02%+
Oct-1487.27002.53288.571 1.301 1.49%+2.42487.591 0.321 0.37%+2.4687.575 0.305 0.35%+
Nov-1478.44002.4384.692 6.252 7.97%+2.24981.090 2.650 3.38%+2.29781.649 3.209 4.09%+
Dec-1462.33002.03469.635 7.305 11.72%+1.85666.491 4.161 6.68%+1.80163.616 1.286 2.06%+
Jan-1548.07001.67856.099 8.029 16.70%+1.61657.575 9.505 19.77%+1.49652.526 4.456 9.27%+
Feb-1557.93001.99168.000 10.070 17.38%+1.87367.122 9.192 15.87%+1.76662.343 4.413 7.62%+
Mar-1555.79001.85662.867 7.077 12.69%+1.63258.169 2.379 4.26%+1.62957.362 1.572 2.82%+
Apr-1559.39001.84362.373 2.983 5.02%-1.72261.513 2.123 3.57%+1.70260.016 0.626 1.05%+
May-1564.56001.96567.011 2.451 3.80%+1.83265.599 1.039 1.61%+1.84965.361 0.801 1.24%+
Jun-1562.34001.88864.084 1.744 2.80%+1.76262.999 0.659 1.06%+1.73261.107 −1.233 −1.98%+
Jul-1555.87001.68456.327 0.457 0.82%+1.55755.383 −0.487 −0.87%+1.54954.453 −1.417 −2.54%+
Aug-1546.99001.51649.939 2.949 6.28%+1.38749.068 2.078 4.42%+1.38948.636 1.646 3.50%+
Sep-1547.24001.51649.939 2.699 5.71%-1.42350.405 3.165 6.70%+1.39548.854 1.614 3.42%+
Oct-1548.12001.47248.266 0.146 0.30%-1.40449.699 1.579 3.28%-1.39148.709 0.589 1.22%-
Nov-1544.42001.41346.023 1.603 3.61%+1.31646.430 2.010 4.53%+1.32646.346 1.926 4.33%+
Dec-1537.72001.13835.566 −2.154 −5.71%+1.03736.066 −1.654 −4.39%+1.08237.474 −0.246 −0.65%+
Jan-1630.80000.97929.521 −1.279 −4.15%+0.93932.425 1.625 5.28%+0.9331.948 1.148 3.73%+
Feb-1633.20001.03631.688 −1.512 −4.55%+0.97233.651 0.451 1.36%+0.97333.511 0.311 0.94%+
Mar-1639.07001.1937.544 −1.526 −3.91%+1.13239.595 0.525 1.34%+1.06937.002 −2.068 −5.29%+
Apr-1642.25001.24739.711 −2.539 −6.01%+1.18841.675 −0.575 −1.36%+1.14739.837 −2.413 −5.71%+
May-1647.13001.42346.403 −0.727 −1.54%+1.35647.916 0.786 1.67%+1.29945.364 −1.766 −3.75%+
Jun-1648.48001.49148.989 0.509 1.05%+1.41650.145 1.665 3.43%+1.38248.382 −0.098 −0.20%+
Jul-1645.07001.3744.388 −0.682 −1.51%+1.29245.539 0.469 1.04%+1.27244.382 −0.688 −1.53%+
Aug-1646.14001.39945.490 −0.650 −1.41%+1.32546.765 0.625 1.35%+1.29545.218 −0.922 −2.00%+
Sep-1646.19001.41846.213 0.023 0.05%+1.35147.730 1.540 3.34%+1.31946.091 −0.099 −0.21%+
Oct-1649.73001.55951.574 1.844 3.71%+1.48852.820 3.090 6.21%+1.45751.108 1.378 2.77%+
Nov-1646.44001.46347.924 1.484 3.20%+1.3949.179 2.739 5.90%+1.35647.436 0.996 2.15%+
Dec-1654.07001.64254.730 0.660 1.22%+1.55355.235 1.165 2.15%+1.49152.345 −1.725 −3.19%+
Jan-1754.89001.62354.008 −0.882 −1.61%-1.55155.160 0.270 0.49%-1.51453.181 −1.709 −3.11%+
Feb-1755.49001.62454.046 −1.444 −2.60%+1.56255.569 0.079 0.14%+1.54754.381 −1.109 −2.00%+
Mar-1751.97001.52850.395 −1.575 −3.03%+1.49252.969 0.999 1.92%+1.44550.672 −1.298 −2.50%+
Apr-1752.98001.58652.601 −0.379 −0.72%+1.52354.120 1.140 2.15%+1.5153.035 0.055 0.10%+
May-1750.87001.51449.863 −1.007 −1.98%+1.45451.557 0.687 1.35%+1.41249.472 −1.398 −2.75%+
Jun-1746.89001.41746.175 −0.715 −1.53%+1.33247.025 0.135 0.29%+1.29545.218 −1.672 −3.56%+
Jul-1748.69001.52150.129 1.439 2.96%+1.42350.405 1.715 3.52%+1.41749.654 0.964 1.98%+
Aug-1751.37001.63154.312 2.942 5.73%+1.51953.972 2.602 5.06%+1.56154.890 3.520 6.85%+
Sep-1755.16001.79160.395 5.235 9.49%+1.70860.993 5.833 10.57%+1.863.579 8.419 15.26%+
Oct-1757.62001.79960.700 3.080 5.34%+1.70760.956 3.336 5.79%-1.65958.453 0.833 1.45%-
Nov-1762.57001.91665.148 2.578 4.12%+1.82365.265 2.695 4.31%+1.7662.125 −0.445 −0.71%+
Dec-1764.21001.94466.213 2.003 3.12%+1.86366.751 2.541 3.96%+1.81764.197 −0.013 −0.02%+
Jan-1868.99002.07471.156 2.166 3.14%+2.01772.472 3.482 5.05%+1.95269.106 0.116 0.17%+
Feb-1865.42001.93765.947 0.527 0.81%+1.85366.379 0.959 1.47%+1.84965.361 −0.059 −0.09%+
Mar-1866.45001.9365.681 −0.769 −1.16%-1.87467.159 0.709 1.07%+1.85865.688 −0.762 −1.15%+
Apr-1871.63002.07971.346 −0.284 −0.40%+2.03773.215 1.585 2.21%+2.01571.396 −0.234 −0.33%+
May-1876.65002.2377.088 0.438 0.57%+2.18778.787 2.137 2.79%+2.15576.486 −0.164 −0.21%+
Jun-1875.19002.14673.894 −1.296 −1.72%+2.11276.001 0.811 1.08%+2.0974.123 −1.067 −1.42%+
Jul-1874.44002.1473.666 −0.774 −1.04%+2.10875.852 1.412 1.90%+2.09874.414 −0.026 −0.04%-
Aug-1873.13002.15374.160 1.030 1.41%-2.12576.484 3.354 4.59%-2.11875.141 2.011 2.75%-
Sep-1878.86002.25277.924 −0.936 −1.19%+2.22580.199 1.339 1.70%+2.18977.722 −1.138 −1.44%+
Oct-1880.47002.33280.966 0.496 0.62%+2.31383.468 2.998 3.73%+2.24979.904 −0.566 −0.70%+
Nov-1865.17002.04870.167 4.997 7.67%+2.03373.066 7.896 12.12%+1.94568.851 3.681 5.65%+
Dec-1856.46001.80160.776 4.316 7.64%+1.78463.816 7.356 13.03%+1.69659.798 3.338 5.91%+
Jan-1959.27001.84662.487 3.217 5.43%+1.81965.116 5.846 9.86%+1.78462.997 3.727 6.29%+
Feb-1964.13001.96266.897 2.767 4.32%+1.93169.277 5.147 8.03%+1.91467.724 3.594 5.60%+
Mar-1966.41001.98867.886 1.476 2.22%+1.96570.540 4.130 6.22%+1.90267.288 0.878 1.32%-
Apr-1971.20002.06270.700 −0.500 −0.70%+2.03673.178 1.978 2.78%+1.97770.015 −1.185 −1.66%+
May-1970.53002.03169.521 −1.009 −1.43%+2.00672.063 1.533 2.17%+1.97269.833 −0.697 −0.99%+
Jun-1963.30001.84662.487 −0.813 −1.28%+1.8265.153 1.853 2.93%+1.81764.197 0.897 1.42%+
Jul-1964.00001.9265.300 1.300 2.03%+1.88867.680 3.680 5.75%+1.91367.688 3.688 5.76%+
Aug-1959.25001.82461.650 2.400 4.05%+1.79564.225 4.975 8.40%+1.863.579 4.329 7.31%+
Sep-1962.33001.93565.871 3.541 5.68%+1.91968.831 6.501 10.43%+1.87466.270 3.940 6.32%+
Oct-1959.37001.93765.947 6.577 11.08%-1.9268.868 9.498 16.00%-1.86165.797 6.427 10.83%+
Testing Data
Nov-1962.74001.93365.795 3.055 4.87%-1.91568.683 5.943 9.47%-1.82464.452 1.712 2.73%-
Dec-1965.85001.98867.886 2.036 3.09%+1.96670.577 4.727 7.18%+1.89366.960 1.110 1.69%+
Jan-2063.60001.84862.563 −1.037 −1.63%+1.82965.488 1.888 2.97%+1.7762.488 −1.112 −1.75%+
Feb-2055.00001.62253.970 −1.030 −1.87%+1.58956.572 1.572 2.86%+1.50952.999 −2.001 −3.64%+
Mar-2032.9800 1.1937.5437 4.5637 13.84%+1.15640.486 7.506 22.76%+0.95332.7840 −0.1960 −0.59%+
Apr-2023.3400 0.8825.7565 2.4165 10.35%+0.85229.1931 5.8531 25.08%+0.60620.1677 −3.1723 −13.59%+
May-2031.0200 0.88726.0227 −4.9973 −16.11%+0.84328.8588 −2.1612 −6.97%-0.68623.0764 −7.9436 −25.61%+
Jun-2039.9300 1.12435.0342 −4.8958−12.26%+1.07337.4031−2.5269−6.33%+0.98333.8747−6.0553−15.16%+
Jul-2042.8100 1.2439.4448 −3.3652 −7.86%+1.18741.6381 −1.1719 −2.74%+1.08437.5469 −5.2631 −12.29%+
Aug-2044.2600 1.22638.9125 −5.3475 −12.08%-1.1841.3780 −2.8820 −6.51%-1.11238.5649 −5.6951 −12.87%+
Note: 1. Data range is from Jun. 2006 to August 2020; 2. Dubai Crude and WTI Crude are not listed; 3. Item: (1) Real price; (2) Estimated Brent Crude oil price; (3) Residuals; (4) Change (%); (5) Directional variation; 4. “+” means the commodity and Brent Crude have the same directional variation of price.

Appendix F

Table A5. Summary of All Selected Models after Verification.
CommodityItems19-Nov19-Dec20-Jan20-Feb20-Mar20-Apr20-May20-June20-July20-AugDARsMSPEs
Brent Crude Oil Price(1)62.7465.8563.65532.9823.3431.0239.9342.8144.26--
5.68%4.96%−3.42%−13.52%−40.04%−29.23%32.90%28.72%7.21%3.39%
Crude oil, Dubai; Dubai Fateh Price(1)61.4164.4163.7654.5133.7523.2731.5640.1442.6443.71100%4.81
5.03%4.89%−1.01%−14.51%−38.08%−31.05%35.63%27.19%6.23%2.51%
(2)64.03667.08866.42757.01635.89525.23233.66742.39644.93946.028
(3)1.2961.2382.8272.0162.9151.8922.6472.4662.1291.768
2.07%1.88%4.44%3.67%8.84%8.11%8.53%6.18%4.97%3.99%
(4)++++++++++
Crude oil, WTI; West Texas Intermediate Price(1)57.0659.857.5250.5329.8816.5228.5638.340.7542.36100%14.67
5.71%4.80%−3.81%−12.15%−40.87%−44.71%72.88%34.10%6.40%3.95%
(2)59.61562.67060.12852.33529.31214.41727.84038.69941.43143.226
(3)−3.125−3.180−3.472−2.665−3.668−8.923−3.180−1.231−1.379−1.034
−4.98%−4.83%−5.46%−4.85%−11.12%−38.23%−10.25%−3.08%−3.22%−2.34%
(4)++++++++++
New York Harbor Ultra-Low Sulfur No 2 Diesel Spot Price(1)1.9331.9881.8481.6221.190.880.8871.1241.241.22680%13.11
−0.21%2.85%−7.04%−12.23%−26.63%−26.05%0.80%26.72%10.32%−1.13%
(2)65.79567.88662.56353.97037.54425.75726.02335.03439.44538.913
(3)3.0552.036−1.037−1.034.5642.417−4.997−4.896−3.365−5.348
4.87%3.09%−1.63%−1.87%13.84%10.35%−16.11%−12.26%−7.86%−12.08%
(4)++++++++
New York Harbor No. 2 Heating Oil Spot Price FOB(1)1.9151.9661.8291.5891.1560.8520.8431.0731.1871.1870%17.50
−0.26%2.66%−6.97%−13.12%−27.25%−26.30%−1.06%27.28%10.62%−0.59%
(2)68.68370.57765.48856.57240.48629.19328.85937.40341.63841.378
(3)5.9434.7271.8881.5727.5065.853−2.161−2.527−1.172−2.882
9.47%7.18%2.97%2.86%22.76%25.08%−6.97%−6.33%−2.74%−6.51%
(4)+++++++
U.S. Gulf Coast Kerosene-Type Jet Fuel Spot Price FOB(1)1.8241.8931.771.5090.9530.6060.6860.9831.0841.11290%17.94
−1.99%3.78%−6.50%−14.75%−36.85%−36.41%13.20%43.29%10.27%2.58%
(2)64.45266.96062.48852.99932.78420.16823.07633.87537.54738.567
(3)1.7121.110−1.112−2.001−0.196−3.172−7.944−6.055−5.263−5.695
2.73%1.69%−1.75%−3.64%−0.59%−13.59%−25.61%−15.16%−12.29%−12.87%
(4)+++++++++
Note: 1. Item: (1) Real Price ($) & Monthly Change Rate (%); (2) Estimated Brent Price ($/bbl); (3) Residuals ($/bbl) & Change Rate (%); (4) Monthly Directional Variation (+/−); 2. Residuals = Estimated Brent Crude oil price—Brent Crude oil price; Change Rate = Residuals/Brent Crude oil price; 3. Directional Variation: (1) Estimated prices derived from commodities have the same direction of price change as that of Brent Crude, excluding unchanged prices; (0) otherwise.

Appendix G

Table A6. The First Weekly Price of Each Month of the Selected Commodities and WTI Crude.
ItemsCrude oil, WTIUltra-Low Sulfur No 2 Diesel Spot PriceNo. 2 Heating Oil Spot Price FOBKerosene-Type Jet Fuel Spot Price FOBItemsCrude Oil, WTIUltra-Low Sulfur No 2 Diesel Spot PriceNo. 2 Heating Oil Spot Price FOBKerosene-Type Jet Fuel Spot Price FOB
Jun-0671.532.0991.9752.09Nov-1396.942.952.9232.875
Jul-0674.652.1691.9472.124Dec-1396.213.0523.0442.952
Aug-0675.22.372.0472.226Jan-1496.473.043.0352.96
Sep-0670.012.1081.9282.038Feb-1497.783.3893.0592.881
Oct-0659.771.7611.6181.739Mar-14103.073.1143.0282.992
Nov-0658.551.7211.5991.657Apr-14100.462.9052.8542.833
Dec-0662.021.9171.7351.848May-14100.512.9452.8652.869
Jan-0757.761.6831.5511.669Jun-14103.232.872.7952.799
Feb-0757.111.7131.6431.721Jul-14105.522.9442.8452.845
Mar-0761.641.8571.7651.827Aug-14102.192.8792.7772.842
Apr-0764.822.0461.8542.013Sep-1494.062.8252.7142.841
May-0763.822.0181.8662.024Oct-1491.442.6542.5662.626
Jun-0763.942.0561.8932.045Nov-1478.242.4732.312.395
Jul-0771.782.1792.0742.138Dec-1467.182.1771.9812.03
Aug-0776.752.1492.0552.151Jan-1553.441.8361.7031.582
Sep-0775.962.252.1032.181Feb-1550.581.8181.7461.679
Oct-0780.592.3052.1712.287Mar-1550.382.1091.7881.751
Nov-0793.462.6052.4872.575Apr-1548.911.7191.5821.575
Dec-0788.712.6032.5092.56May-1557.981.9491.8231.806
Jan-0898.172.7192.6972.721Jun-1559.661.8971.7691.765
Feb-0891.142.5462.5162.562Jul-1557.921.8421.721.696
Mar-08103.443.1362.9353.026Aug-1544.941.5321.4051.419
Apr-08103.463.1973.0163.081Sep-1546.731.5911.4761.45
May-08115.423.4083.2133.347Oct-15451.4861.4161.398
Jun-08128.163.8123.7013.782Nov-1545.981.5081.431.426
Jul-08142.524.0453.9924.109Dec-1540.41.3141.1991.226
Aug-08124.573.5823.4723.599Jan-1636.991.0581.0041.027
Sep-08108.373.1263.023.224Feb-1631.261.0480.9791.004
Oct-0896.592.9232.7422.865Mar-1634.431.1021.0461.007
Nov-0864.312.1012.0042.048Apr-1636.821.1631.1011.032
Dec-0845.61.5741.5251.536May-1644.221.3381.2791.204
Jan-0942.41.3761.3341.361Jun-16491.491.4221.369
Feb-0940.781.3741.3551.329Jul-1648.171.4671.4011.389
Mar-0943.181.2181.181.161Aug-1640.821.2691.181.158
Apr-0950.341.4631.3671.38Sep-1645.111.4221.3551.333
May-0950.21.3821.3121.314Oct-1649.481.5671.4961.463
Jun-0968.111.7861.7321.756Nov-1645.511.4691.41.368
Jul-0969.321.7821.6981.778Dec-1648.631.5611.4771.433
Aug-0971.581.9651.8891.916Jan-1753.341.6761.6011.539
Sep-0968.391.7881.7211.733Feb-1753.331.6211.5471.518
Oct-0968.841.811.7421.754Mar-1753.561.6061.5731.527
Nov-09792.0242.0072.002Apr-1751.261.591.5131.512
Dec-0976.812.0131.9942.006May-1747.211.4561.3911.364
Jan-1079.072.1082.1062.074Jun-1748.481.5181.4461.404
Feb-1074.572.0021.9651.956Jul-1744.961.4651.381.352
Mar-1080.192.1392.062.091Aug-1749.521.6461.5421.551
Apr-1083.012.2252.152.182Sep-1746.681.7181.5821.759
May-1080.242.2772.1822.198Oct-1750.231.7641.6891.645
Jun-1072.912.0711.9832.016Nov-1754.591.8751.7811.706
Jul-1074.962.0321.9761.988Dec-1757.811.9271.8391.782
Aug-1081.792.2292.132.178Jan-1861.362.072.0061.923
Sep-1074.022.1132.0122.05Feb-1865.322.0742.0031.973
Oct-1078.412.2582.1782.194Mar-1862.071.9171.8431.861
Nov-1084.932.3662.3162.312Apr-1863.071.981.9351.919
Dec-1086.752.4482.3822.382May-1868.382.1472.1042.076
Jan-1189.542.542.5092.51Jun-1866.962.2112.1692.138
Feb-1189.522.7822.7392.773Jul-1873.732.172.1372.112
Mar-11101.053.1123.0243.126Aug-1869.462.1312.1042.104
Apr-11105.083.1493.0623.146Sep-1868.512.2312.2022.183
May-11105.843.1323.053.175Oct-1875.132.4062.3842.32
Jun-11100.923.1083.0353.122Nov-1865.062.2312.2152.144
Jul-1193.72.9592.8632.935Dec-1852.631.8851.871.785
Aug-1190.853.0773.0013.063Jan-19471.7091.6881.621
Sep-1188.073.0973.0353.082Feb-1953.631.8791.8511.842
Oct-1179.432.872.7942.857Mar-1956.122.0031.971.934
Nov-1193.243.0733.0293.027Apr-1962.362.0141.991.936
Dec-1199.913.0292.9872.974May-1962.92.0722.0461.984
Jan-12102.393.1053.0673.075Jun-1952.971.8031.7771.772
Feb-1297.83.0833.0713.089Jul-1957.321.911.8731.883
Mar-12107.523.2813.2383.245Aug-1956.551.9091.8781.905
Apr-12103.523.3033.1983.269Sep-1955.731.8571.8391.815
May-12103.473.1993.1143.188Oct-1953.121.8941.8731.839
Jun-1287.062.7932.7232.772Nov-1955.171.9331.9251.847
Jul-1285.742.852.7252.798Dec-1957.641.9191.8961.821
Aug-1289.12.9672.862.955Jan-2061.742.032.0131.951
Sep-1295.683.2623.133.227Feb-2050.361.6221.5941.499
Oct-1290.813.2453.1413.144Mar-2045.571.5121.4811.392
Nov-1285.873.1543.0492.951Apr-2021.691.0250.9890.717
Dec-12873.0452.9792.928May-2015.710.6920.6540.461
Jan-1392.773.073.0372.99Jun-2037.321.0260.9950.901
Feb-1397.333.1683.1293.179Jul-2039.851.1941.1411.023
Mar-1392.193.1193.0173.087Aug-2041.571.2421.1931.111
Apr-1395.073.0392.9292.962Sep-2041.841.1661.1241.074
May-1393.42.8592.6682.686Oct-2038.991.1241.0710.995
Jun-1394.252.8692.7312.755Nov-2037.711.1441.0731.05
Jul-13100.652.9342.8092.812Dec-2045.371.3681.3021.26
Aug-13105.543.052.8982.944Jan-2147.981.4781.3971.348
Sep-13108.773.143.043.036Feb-2155.391.691.5671.498
Oct-13103.142.9872.9112.857
Note: Data time range is from Jun. 2006 to February 2021. Source: EIA; 2. the third weekly price of Ultra-Low Sulfur No 2 Diesel Spot Price on Jun. 2006 treat as the first weekly price due to no data.

References

  1. Taghizadeh-Hesary, F.; Rasoulinezhad, E.; Yoshino, N. Energy and Food Security: Linkages through Price Volatility. Energy Policy 2019, 128, 796–806. [Google Scholar] [CrossRef]
  2. Zavaleta, A.; Walls, W.; Rusco, F.W. Refining for export and the convergence of petroleum product prices. Energy Econ. 2015, 47, 206–214. [Google Scholar] [CrossRef]
  3. Dimitriadou, A.; Gogas, P.; Papadimitriou, T.; Plakandaras, V. Oil Market Efficiency under a Machine Learning Perspective. Forecasting 2018, 1, 11. [Google Scholar] [CrossRef] [Green Version]
  4. Yin, X.; Peng, J.; Tang, T. Improving the Forecasting Accuracy of Crude Oil Prices. Sustainability 2018, 10, 454. [Google Scholar] [CrossRef] [Green Version]
  5. Bostanchi, H. WTI Oil Price Prediction Modeling and Forecasting; Project Report; Faculty of California State Polytechnic University: Pomona, CA, USA, 2017. [Google Scholar]
  6. Box, G.E.P.; Jenkins, G.M. Time Series Analysis: Forecasting and Control; Holden Day: San Francisco, CA, USA, 1976. [Google Scholar]
  7. Plourde, A.; Watkins, G. How volatile are crude oil prices? OPEC Rev. 1994, 18, 431–444. [Google Scholar] [CrossRef]
  8. Bopp, A.E.; Sitzer, S. Are petroleum futures prices good predictors of cash value? J. Futures Mark. 1987, 7, 705–719. [Google Scholar] [CrossRef]
  9. Asche, F.; Gjølberg, O.; Völker, T. Price relationships in the petroleum market: An analysis of crude oil and refined product prices. Energy Econ. 2003, 25, 289–301. [Google Scholar] [CrossRef] [Green Version]
  10. Morana, C. A semiparametric approach to short-term oil price forecasting. Energy Econ. 2001, 23, 325–338. [Google Scholar] [CrossRef]
  11. Lanza, A.; Manera, M.; Giovannini, M. Modeling and forecasting cointegrated relationships among heavy oil and product prices. Energy Econ. 2005, 27, 831–848. [Google Scholar] [CrossRef]
  12. Akpanta, A.C.; Okorie, I.E. Application of box-Jenkins techniques in modelling and forecasting Nigeria crude oil prices. Int. J. Stat. Appl. 2014, 4, 283–291. [Google Scholar] [CrossRef]
  13. Moshiri, S.; Foroutan, F. Forecasting nonlinear crude oil future prices. Energy J. 2006, 27, 81–96. [Google Scholar] [CrossRef]
  14. Chang, C.-P.; Lee, C.-C. Do oil spot and futures prices move together? Energy Econ. 2015, 50, 379–390. [Google Scholar] [CrossRef]
  15. Arfaoui, M. On the spot-futures relationship in crude-refined petroleum prices: New evidence from an ARDL bounds testing approach. J. Commod. Mark. 2018, 11, 48–58. [Google Scholar] [CrossRef]
  16. Zhao, L.-T.; Wang, S.-G.; Zhang, Z.-G. Oil Price Forecasting Using a Time-Varying Approach. Energies 2020, 13, 1403. [Google Scholar] [CrossRef] [Green Version]
  17. Mirmirani, S.; Li, H.C. A Comparison of Var And Neural Networks With Genetic Algorithm In Forecasting Price Of Oil. Econom. Netw. 2004, 19, 203–223. [Google Scholar] [CrossRef]
  18. Alvarez-Ramirez, J.; Alvarez, J.; Rodriguez, E. Short-term predictability of crude oil markets: A detrended fluctuation analysis approach. Energy Econ. 2008, 30, 2645–2656. [Google Scholar] [CrossRef]
  19. Yu, L.; Wang, S.; Lai, K.K. Forecasting crude oil price with an EMD-based neural network ensemble learning paradigm. Energy Econ. 2008, 30, 2623–2635. [Google Scholar] [CrossRef]
  20. Slim, C. Improved Crude Oil Price Forecasting With Statistical Learning Methods. J. Mod. Account. Audit. 2015, 11, 51–62. [Google Scholar] [CrossRef] [Green Version]
  21. He, K.; Zha, R.; Wu, J.; Lai, K.K. Multivariate EMD-Based Modeling and Forecasting of Crude Oil Price. Sustainability 2016, 8, 387. [Google Scholar] [CrossRef] [Green Version]
  22. Gupta, V.; Pandey, A. Crude oil price prediction using LSTM networks. Int. J. Comput. Inf. Eng. 2018, 12, 226–230. [Google Scholar] [CrossRef]
  23. Cen, Z.; Wang, J. Crude oil price prediction model with long short term memory deep learning based on prior knowledge data transfer. Energy 2019, 169, 160–171. [Google Scholar] [CrossRef]
  24. Li, J.; Zhu, S.; Wu, Q. Monthly crude oil spot price forecasting using variational mode decomposition. Energy Econ. 2019, 83, 240–253. [Google Scholar] [CrossRef]
  25. Yin, T.; Wang, Y. Predicting the Price of WTI Crude Oil Using ANN and Chaos. Sustainability 2019, 11, 5980. [Google Scholar] [CrossRef] [Green Version]
  26. Kevin, C.D.; Erik, D.; Joseph, L.P. Using the crude oil and heating oil markets for diesel fuel purchasing decisions. Am. J. Agric. Econ. 2003, 21, 213–229. Available online: https://www.researchgate.net/publication/23942728 (accessed on 26 March 2021).
  27. Guhathakurta, K.; Dash, S.R.; Maitra, D. Period specific volatility spillover based connectedness between oil and other commodity prices and their portfolio implications. Energy Econ. 2020, 85, 104566. [Google Scholar] [CrossRef]
  28. Roman, M.; Górecka, A.; Domagała, J. The Linkages between Crude Oil and Food Prices. Energies 2020, 13, 6545. [Google Scholar] [CrossRef]
  29. Vo, D.H.; Vu, T.N.; Vo, A.T.; McAleer, M. Modeling the Relationship between Crude Oil and Agricultural Commodity Prices. Energies 2019, 12, 1344. [Google Scholar] [CrossRef] [Green Version]
  30. Rodgers, J.L.; Nicewander, W.A. Thirteen Ways to Look at the Correlation Coefficient. Am. Stat. 1988, 42, 59–66. [Google Scholar] [CrossRef]
  31. Krehbiel, T.C. Correlation Coefficient Rule of Thumb. Decis. Sci. J. Innov. Educ. 2004, 2, 97–100. [Google Scholar] [CrossRef]
  32. Asuero, A.G.; Sayago, A.; González, A.G. The Correlation Coefficient: An Overview. Crit. Rev. Anal. Chem. 2006, 36, 41–59. [Google Scholar] [CrossRef]
  33. Stanton, J.M. Galton, Pearson, and the Peas: A Brief History of Linear Regression for Statistics Instructors. J. Stat. Educ. 2001, 9. [Google Scholar] [CrossRef]
  34. Mundi. Commodity Prices. Available online: https://www.indexmundi.com/commodities/ (accessed on 1 January 2020).
  35. World Bank. World Bank Monthly Commodity Feed Prices. 2018. Available online: http://www.worldbank.org/en/research/commodity-markets (accessed on 9 April 2021).
  36. IMF. Primary Commodity Prices Web. Available online: https://www.imf.org/en/Research/commodity-prices (accessed on 9 April 2021).
  37. EIA. Price Web in U.S. Available online: https://www.eia.gov/petroleum/data.php#prices (accessed on 9 April 2021).
  38. Gao, S.; Lei, Y. A new approach for crude oil price prediction based on stream learning. Geosci. Front. 2017, 8, 183–187. [Google Scholar] [CrossRef] [Green Version]
Figure 1. Monthly Price Trends of Brent, Dubai and WTI. Note: 1. The figures in the plot are Brent Crude oil prices; 2. Data range is from August 1988 to August 2020. Unit: US$/bbl Source: World Bank.
Sustainability 13 05050 g001
Figure 2. Scatter Plot (left) and Line Chart (right) for the Price of Each Selected Commodity and Brent Crude. Note: Data range is from December 1988 to Oct. 2019 except for Figure 2c,f. (See Appendix B)
Sustainability 13 05050 g002
Figure 3. Scatter Plot (left) and Line Chart (right) for the Price Change Rate of Each Selected Commodity and Brent Crude. Note: Data range is from December 1988 to Oct. 2019 except for Figure 3c,f. (See Appendix B)
Sustainability 13 05050 g003
Figure 4. Scatter Plots (left) and Line Charts (right) of the Estimated Price and Real Price of Brent Crude. Note: Data range is from Jun. 2006 to August 2020.
Sustainability 13 05050 g004
Table 1. The Rule of Thumb for Interpreting the Size of the Correlation Coefficient.
Size of |r|Interpretation
(Timothy C. Krehbiel)(A. G. Asuero, et al.)
0.0 = |r|0.0 = |r|no correlation
0.0 < |r| < 0.20.0 < |r| < 0.3very weak correlation
0.2 ≤ |r| < 0.40.3 ≤ |r| < 0.5weak correlation
0.4 ≤ |r| < 0.60.5 ≤ |r| < 0.7moderately strong correlation
0.6 ≤ |r| ≤ 0.80.7 ≤ |r| < 0.9strong correlation
0.8 ≤ |r| < 1.00.9 ≤ |r| < 1.0very strong correlation
1.0 = |r|1.0 = |r|perfect correlation
Source: The Rule of Thumb suggested by T. C. Krehbiel (2004) [31] and by Asuero et al. (2006) [32].
Table 2. The Commodities Selected through Correlation Analyses.
No.CommoditySourcePrice rxyPrice Change Rate rxy
ptsFullAverageSDptsFullAverageSD
5Crude oil, Dubai (petroleum); Dubai Fateh PriceWB3700.99870.99720.00313700.96000.97460.0138
6Crude oil, WTI (petroleum); West Texas Intermediate Price WB3700.99100.98090.01033700.93660.92830.0106
7New York Harbor Ultra-Low Sulfur No 2 Diesel Spot PriceEIA1610.98570.98170.01361600.93450.94320.0054
8New York Harbor Conventional Gasoline Regular Spot Price FOBEIA3700.99210.97100.03623700.79480.82860.0212
9New York Harbor No. 2 Heating Oil Spot Price FOBEIA3700.99560.98690.01613700.79980.88160.0591
11U.S. Gulf Coast Kerosene-Type Jet Fuel Spot Price FOBEIA3550.99410.98740.01043540.86770.89340.0335
Note: 1. Data range is from Jan. 1989 to Oct. 2019 (Training Data); 2. SD, Standard Deviation.
Table 3. Correlation between Selected Commodities and Brent Crude over Different Time Lengths.
Price rxy2019.102019.102019.102019.102019.102019.102019.102019.10AverageSDR2
2018.052017.112015.112013.112011.112009.112007.112006.6
No.Data Item (Monthly)1824487296120144161
5Crude oil, Dubai (petroleum); Dubai Fateh Price0.99450.98610.99640.99840.99890.99840.99820.99790.9961 0.0043 0.9957
6Crude oil, WTI (petroleum); West Texas Intermediate Price0.96960.95620.98250.99170.98630.97730.97010.96870.9753 0.0114 0.9384
7New York Harbor Ultra-Low Sulfur No 2 Diesel Spot Price0.96260.95790.9870.98890.99370.99190.98570.98570.9817 0.0136 0.9716
9New York Harbor No. 2 Heating Oil Spot Price FOB0.95510.93640.98580.98980.99410.99290.98850.98860.9789 0.0212 0.9773
11U.S. Gulf Coast Kerosene-Type Jet Fuel Spot Price FOB0.97220.95390.9830.99170.99510.9950.98630.98570.9829 0.0139 0.9716
Price Change Rate rxy2019.102019.102019.102019.102019.102019.102019.102019.10AverageSDR2
2018.052017.112015.112013.112011.112009.112007.112006.7
No.Data Item (Monthly)1824487296120144160
5Crude oil, Dubai (petroleum); Dubai Fateh Price0.99050.99110.98950.99090.98720.9860.98840.98570.9887 0.0022 0.9717
6Crude oil, WTI (petroleum); West Texas Intermediate Price0.94170.94460.93930.9270.90920.90240.92280.92420.9264 0.0152 0.8542
7New York Harbor Ultra-Low Sulfur No 2 Diesel Spot Price0.94780.94980.94940.94160.94150.94210.93880.93450.9432 0.0054 0.8733
9New York Harbor No. 2 Heating Oil Spot Price FOB0.94440.94220.93160.9280.92870.93170.93590.93290.9344 0.0060 0.8704
11U.S. Gulf Coast Kerosene-Type Jet Fuel Spot Price FOB0.94470.95040.89890.9240.9220.92560.92120.92070.9259 0.0158 0.8476
Note: 1. SD, Standard Deviation; 2. Data range is from jun. 2006 to Oct. 2019.
Table 4. The results of ADF test.
Monthly DataCrude Oil (For Reference)Selected Commodity
CommodityBrent CrudeDubai CrudeWTI CrudeUltra-Low Sulfur No 2 Diesel Spot PriceNo. 2 Heating Oil Spot Price FOBKerosene-Type Jet Fuel Spot Price FOB
Dickey-Fuller−2.5835−2.52−3.0486−2.6591−2.7006−2.8188
Lag order555555
p-value0.33260.35910.13840.30110.28370.2344
Test ResultsFALSEFALSEFALSEFALSEFALSEFALSE
Note: 1. Data range is from Jun. 2006 to August 2020; 2. FALSE means “non-stationary state”; 3. Using the ADF test in r.
Table 5. The Results of RESET Test.
Monthly DataCrude Oil (For Reference)Selected Commodity
CommodityDubai CrudeWTI CrudeUltra-Low Sulfur No 2 Diesel Spot PriceNo. 2 Heating Oil Spot Price FOBKerosene-Type Jet Fuel Spot Price FOB
Data points171171171171171
RESET2.63512.02491.03510.681520.081086
p-value0.10640.15660.31040.41020.7762
Note: 1. Data range is from Jun. 2006 to Aug; 2. The other time series is Brent Crude; 3. Using Ramsey’s RESET test (1969) in r.
Table 6. The Formulae and R2 of Linear Regression between Selected Commodities and Brent Crude.
No.CommodityptsPrice
FormulaeR2
5Crude oil, Dubai (petroleum); Dubai Fateh Price171Y = 1.0361X-0.32910.996
6Crude oil, WTI (petroleum); West Texas Intermediate Price171Y = 1.08915X-1.29240.9442
7New York Harbor Ultra-Low Sulfur No 2 Diesel Spot Price171Y = 37.865X−7.30220.9733
9New York Harbor No. 2 Heating Oil Spot Price FOB171Y = 38.506X−5.55450.9783
11U.S. Gulf Coast Kerosene-Type Jet Fuel Spot Price FOB171Y = 36.694X−2.12020.9728
Note: Data range is from Jun. 2006 to August 2020.
Table 7. The DAR and MSPE in Different Time Ranges.
Time RangeItemsCrude oil, Dubai (Petroleum); Dubai Fateh PriceCrude oil, WTI (Petroleum); West Texas Intermediate PriceNew York Harbor Ultra-Low Sulfur No 2 Diesel Spot PriceNew York Harbor No. 2 Heating Oil Spot Price FOBU.S. Gulf Coast Kerosene-Type Jet Fuel Spot Price FOB
Full Range
(2020.08~1988.12)
Data range381381171381365
Number of “+”348344148329325
DAR (%)91.58%90.53%87.06%86.58%89.29%
MSPE2.8119.2717.909.5812.91
Partial Range I
(2020.08~2006.06)
Data range171171171171171
Number of “+”167156148148155
DAR (%)98.24%91.76%87.06%87.06%91.18%
MSPE3.1538.6717.9015.5018.61
Partial Range II
(2019.10~2006.06)
Data range161161161161161
Number of “+”157146140141146
DAR (%)98.13%91.25%87.50%88.13%91.25%
MSPE3.0540.1618.2015.3718.65
Note: 1. ”+” means the same directional variation with Brent Crude oil price; 2. DAR’s data range = Data range −1; 3. Partial Range II: the minimum training data range among all selected commodities (161 pts); 4. Partial Range I: Partial Range II plus testing data range (10 pts); 5. EIA added the data of ultra-low sulfur No. 2 diesel spot price on 14 June 2006.
Table 8. A Brief Summary of Performance Metrics.
ItemsCrude Oil, Dubai (Petroleum); Dubai Fateh PriceCrude Oil, WTI (Petroleum); West Texas Intermediate PriceNew York Harbor Ultra-Low Sulfur No 2 Diesel Spot PriceNew York Harbor No. 2 Heating Oil Spot Price FOBU.S. Gulf Coast Kerosene-Type Jet Fuel Spot Price FOB
Price rxy0.99790.96870.98570.98860.9857
Average & SD of Price rxy with different time lengths0.996 1 ±0.00430.9753 ± 0.01140.9817 ± 0.01360.9789 ± 0.02120.9829 ± 0.0139
Price Change rate rxy0.98570.92420.93450.93290.9207
Average & SD of Price Change Rate rxy with different time lengths0.9887 ± 0.00220.9264 ± 0.01520.9432 ± 0.00540.9344 ± 0.00600.9259 ± 0.0158
MSPE3.0640.1618.2015.3718.65
DAR (%)98.13%91.25%87,50%88.13%91.25%
DAR (price change rate > ±2%)100%97.54%97.54%96.72%96.72%
Note: 1. SD, Standard Deviation; Explanatory ability (R2) = rxy2; 2. Data range is from Jun. 2006 to Oct. 2019, and the data range is 161 data points; 3. Data number ignoring the price change rate of Brent Crude within ±2% per month has 122 data points.
Table 9. A Brief Summary of All Selected Commodity Models after Verification.
Performance MetricsCrude Oil, Dubai); Dubai Fateh PriceCrude Oil, WTI; West Texas Intermediate PriceNew York Harbor Ultra-Low Sulfur No 2 Diesel Spot PriceNew York Harbor No. 2 Heating Oil Spot Price FOBU.S. Gulf Coast Kerosene-Type Jet Fuel Spot Price FOB
DARs100%100%80%70%90%
MSPEs4.8114.6713.1117.517.94
Note: Testing data range is from Nov. 2019 to August 2020.
Table 10. Correlation between Selected Commodities and Brent Crude Included “Testing Data”.
Price rxy2020.82020.82020.82020.82020.82020.82020.82020.82020.8AverageSDR2
2019.32018.92016.92014.92012.92010.92008.92006.92006.6
No.Data Item (Month)1824487296120144168171
5Crude oil, Dubai (petroleum); Dubai Fateh Price0.99900.99900.99700.99650.99880.99880.99850.99810.99800.9982 0.0009 0.9960
6Crude oil, WTI (petroleum); West Texas Intermediate Price0.99040.99050.98190.98360.98660.98430.97700.97220.97170.9820 0.0071 0.9442
7New York Harbor Ultra-Low Sulfur No 2 Diesel Spot Price0.97830.97930.98060.98020.99250.99350.98880.98680.98660.9852 0.0058 0.9734
9New York Harbor No. 2 Heating Oil Spot Price FOB0.97550.97660.97890.98190.99280.99390.98990.98920.98910.9853 0.0071 0.9783
11U.S. Gulf Coast Kerosene-Type Jet Fuel Spot Price FOB0.98420.98200.97890.98470.99290.99460.98850.98650.98630.9865 0.0050 0.9728
Price Change Raterxy2020.82020.82020.82020.82020.82020.82020.82020.82020.8AverageSDR2
2019.32018.92016.92014.92012.92010.92008.92006.92006.7
No.Data Item (Monthly)1824487296120144168170
5Crude oil, Dubai (petroleum); Dubai Fateh Price0.9961 0.9962 0.9944 0.9940 0.9925 0.9912 0.9912 0.9891 0.9891 0.9926 0.0027 0.9783
6Crude oil, WTI (petroleum); West Texas Intermediate Price0.9486 0.9436 0.9355 0.9233 0.9186 0.9100 0.9169 0.9184 0.9182 0.9259 0.0134 0.8430
7New York Harbor Ultra-Low Sulfur No 2 Diesel Spot Price0.8680 0.8804 0.8836 0.9096 0.9034 0.9084 0.9158 0.9121 0.9122 0.8993 0.0173 0.8321
9New York Harbor No. 2 Heating Oil Spot Price FOB0.8519 0.8654 0.8682 0.8914 0.8886 0.8944 0.9058 0.9086 0.9070 0.8868 0.0205 0.8227
11U.S. Gulf Coast Kerosene-Type Jet Fuel Spot Price FOB0.9218 0.9241 0.9097 0.9249 0.9219 0.9235 0.9195 0.9215 0.9213 0.9209 0.0045 0.8488
Note: 1. SD, Standard Deviation; 2. Data range is from Jun. 2006 to August 2020.
Table 11. Success Rate Comparison of WTI Crude and the Selected Commodities.
Selected CommodityWTI Crude
(For Reference)
Ultra-Low Sulfur No 2 Diesel Spot PriceNo. 2 Heating Oil Spot Price FOBKerosene-Type Jet Fuel Spot Price FOB
Number of spreads in the same directional variationptsSuccess rateptsSuccess rateptsSuccess rateptsSuccess rate
Path 1 & Brent13780.59%12875.29%13378.24%13177.06%
Path 2 & Brent12171.18%13277.65%13076.47%12372.35%
Path 1 & Path 2 & Brent 11580.99%11681.69%11782.98%11280.00%
Path 1 & Path 2142142141140
Note: Data range is from Jun 2006 to August 2020. (170 spreads).
Table 12. Number of Consecutive Prediction Mistakes for WTI Crude and the Selected Commodities.
ItemSelected CommodityWTI Crude
(For Reference)
Ultra-Low Sulfur No 2 Diesel Spot PriceNo. 2 Heating Oil Spot Price FOBKerosene-Type Jet Fuel Spot Price FOB
1Number of two consecutive prediction mistakes2456
2Max. months per consecutive prediction mistake2225
3Number of three consecutive prediction mistakes0003
4Number of three consecutive prediction mistakes in “Path 1 & Path 2 & Brent” only39715
Note: 1. Data range is from Jun. 2006 to August 2020 (170 spreads); 2. The items for this empirical analysis are “Path 1 & Path 2” and “Path 1 & Path 2 & Brent”; 3. This row data is no count when the cell in the “Path 1 & Path 2” item is “-“, except for item 4.
Table 13. The monthly price variation between Brent Crude and the Selected Commodities during the COVID-19 period.
DateBrent CrudeUltra-Low Sulfur No 2 Diesel Spot PriceNew No. 2 Heating Oil Spot Price FOBKerosene-Type Jet Fuel Spot Price FOB
Path 1 & Brent Path 2 & Brent Path 1 & Path 2Path 1 & 2 & Brent Path 1 & Brent Path 2 & Brent Path 1 & Path 2Path 1 & 2 & Brent Path 1 & Brent Path 2 & Brent Path 1 & Path 2Path 1 & 2 & Brent
Feb-2055.000++++++++++++
Mar-2032.980++++++++++++
Apr-2023.340++++++++++++
May-2031.020--+---+---+-
Jun-2039.930++++++++++++
Jul-2042.810++++++++++++
Aug-2044.260++++++++++++
Sep-2041.090++++++++++++
Oct-2040.470-+-nc-+-nc++++
Nov-2043.230-+-nc-+-nc++++
Dec-2049.870++++++++++++
Jan-2154.550++++++++++++
Feb-2161.960++++++++++++
Number of “+”101211101012111012121312
Success rate76.92%92.31% 90.91%76.92%92.31% 90.91%92.31%92.31% 92.31%
Note: 1. “+” means the item has the same directional variation; 2. Unit: US$/bbl (Brent Crude oil price); 3. “nc” means not count because the cell in “Path 1 & Path 2” item is “-“; 4. Data range is from February 2020 to February 2021. (13 pts).
Table 14. The Seasonality Test’s Results.
Monthly DataCrude Oil (For Reference)Selected Commodity
CommodityBrent CrudeWTI CrudeUltra-Low Sulfur No 2 Diesel Spot PriceNo. 2 Heating Oil Spot Price FOBKerosene-Type Jet Fuel Spot Price FOB
p-value0.84154560.84151990.81579940.95199990.9246915
Test ResultsFALSEFALSEFALSEFALSEFALSE
First Weekly data
p-value0.56796840.58780430.92966760.95559630.7810095
Test ResultsFALSEFALSEFALSEFALSEFALSE
Note: 1. Data range is from Jun. 2006 to August 2020; 2. FALSE means “not identify seasonality”; 3. Using seasonality test in r.
Table 15. Success Rate Comparison after Seasonal Adjustment.
Selected CommodityWTI Crude
(For Reference)
Ultra-Low Sulfur No 2 Diesel Spot PriceNo. 2 Heating Oil Spot Price FOBKerosene-Type Jet Fuel Spot Price FOB
Number of spreads in the same directional variationptsSuccess rateptsSuccess rateptsSuccess rateptsSuccess rate
Path 1 & Brent13478.82%12875.29%13881.18%13277.65%
Path 2 & Brent13277.65%13076.47%13177.06%12875.29%
Path 1 & Path 2 & Brent 12382.00%11580.99%12184.62%11781.25%
Path 1 & Path 2150142143144
Note: Data range is from Jun. 2006 to August 2020. (170 spreads).
Publisher’s Note: MDPI stays neutral with regard to jurisdictional claims in published maps and institutional affiliations.

