
The Economic Evaluation of Methanol and Propylene Production from Natural Gas at Petrochemical Industries in Iran


Abstract
:1. Introduction
- A substantial supply of light feeds such as methane, ethane, propane, and butane in various parts of the world, including the Middle East and the United States;
- Reduction in the efficiency of propylene production in steam crackers owing to the use of light feed (ethane and liquefied petroleum gas);
- The need to increase the competitiveness of petrochemical complexes in the production of various products;
- The presence of significant natural gas reserves in Iran, maximum commissioning of coal in China, and the use of shale gas in the United States.
- The direct source of emissions (process-based emission),
- The indirect source of emissions (utilizing the power in the process),
- The direct source of emissions from lateral services (steam and furnaces).
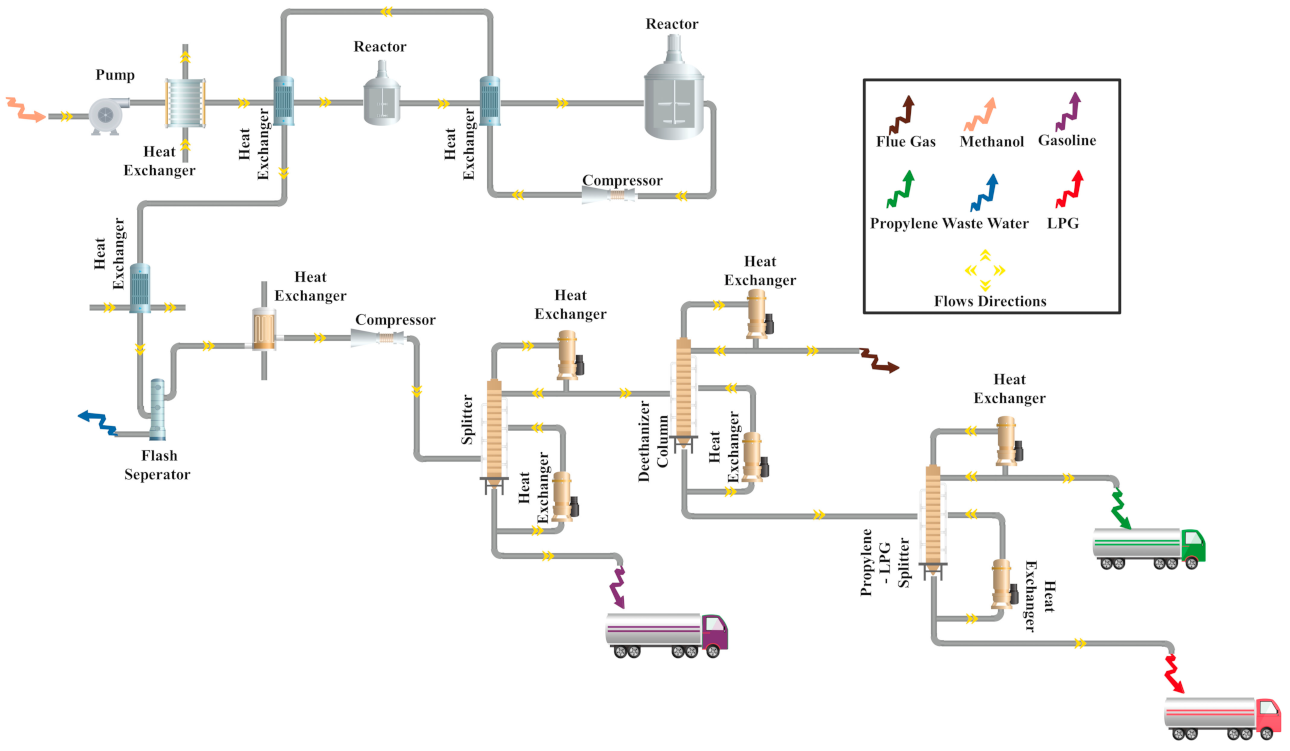
2. Description of the Processes
2.1. Description of Lurgi GTM Process
2.1.1. Syngas Generation
2.1.2. Methanol Generation
2.1.3. Methanol Refining
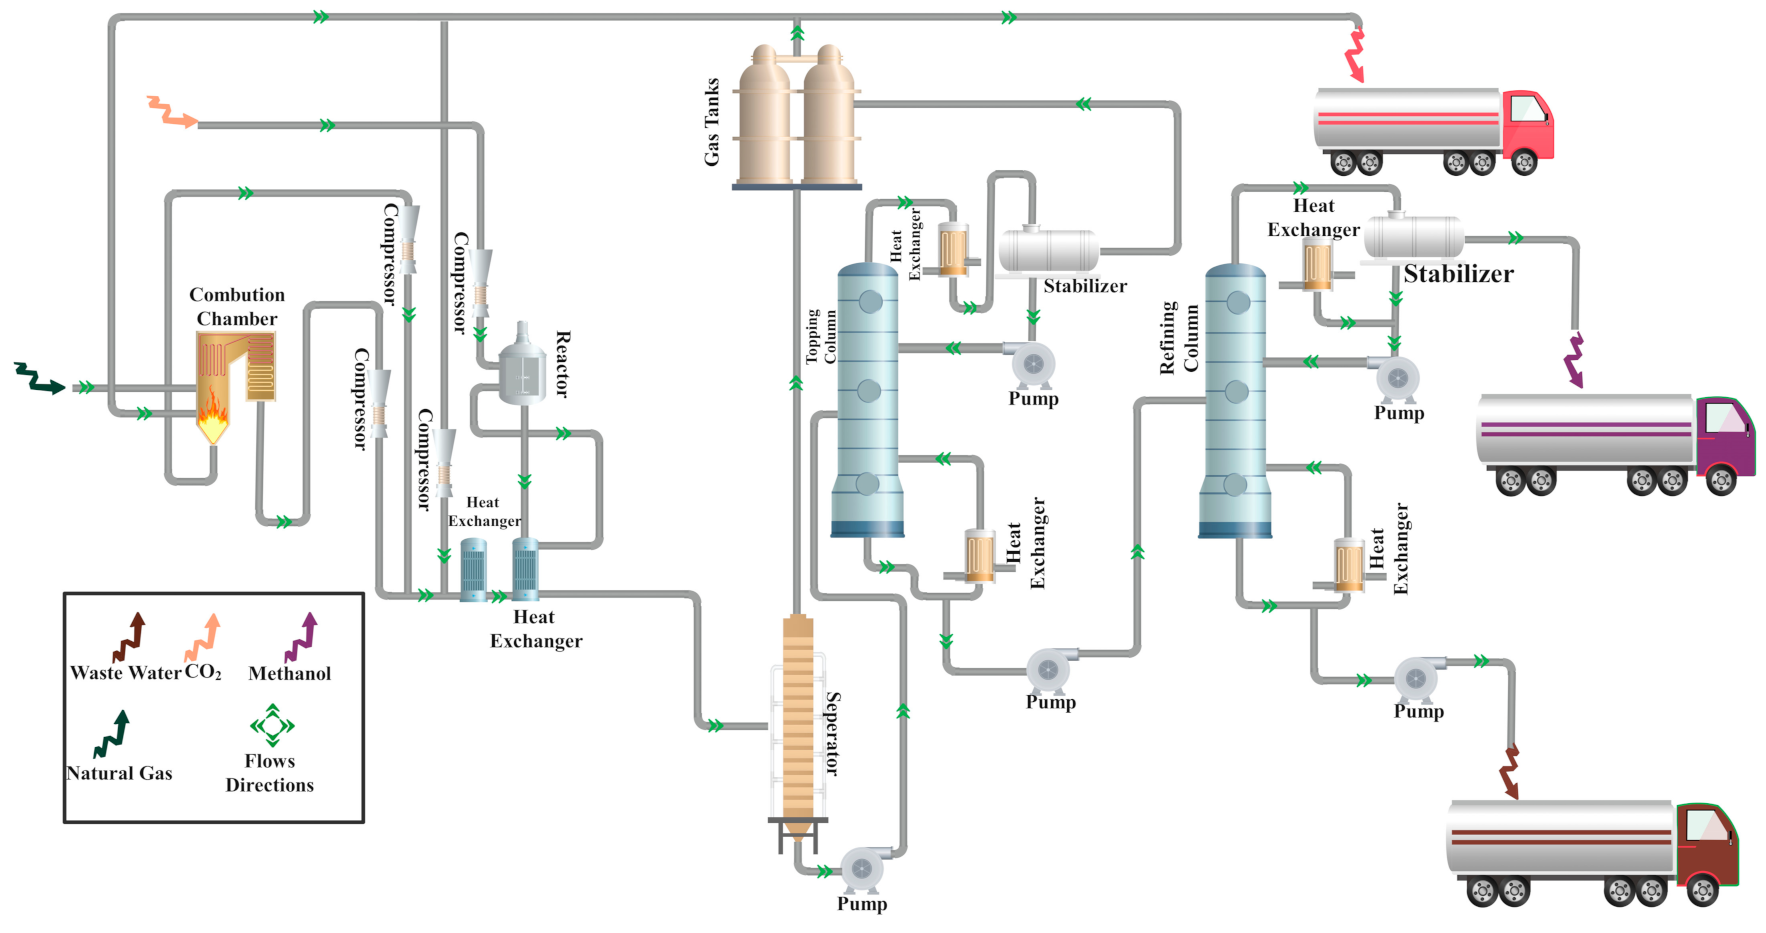
2.2. Description of Lurgi MTP Process
3. Material and Methods
3.1. Economic Evaluation
- Estimation of fixed and working investment,
- Annual production cost,
- Estimation of annual depreciation,
- Determination of profits and losses of project,
- Calculation of final price with net cash and discount flows of the total investment,
- Internal rate of return (IRR),
- Determination of net present value,
- Determination of rate and period of investment payback, and
- Sensitivity analysis and break-even analysis.
3.2. Assumptions
- The construction period of a petrochemical unit is two years and the first year of operation of the units is 2023.
- Annual inflation is estimated at 2% (based on the dollar).
- The minimum return on investment (MIRR) is 18% [98].
- Depreciation is calculated using the straight-line method, and the residual value of the equipment is considered 10%.
- The price of natural gas feed in Iran for methanol production is about 10 cents per cubic meter, and if the chain continues from methanol to propylene and subsequent chains, a maximum 30% discount is assumed (about 7 cents per cubic meter) [99].
- Oil price fluctuations have a relatively direct effect on methanol prices. In recent years, methanol price variations have had a similar pattern to oil price changes in the same period (for instance, West Texas Intermediate crude oil).
- On the other hand, world methanol production capacity will increase by about 23% (especially with the arrival of shale gas in the United States as feed) by 2022, which can also affect the price of methanol [100]. Therefore, considering the direct effect of the methanol price on stopping or developing the production chain of propylene, the economic evaluation of the mentioned processes is established on three methanol price scenarios: optimistic, realistic, and pessimistic; the selling prices of methanol are estimated at USD 239.2, USD 239, and USD 118.8 per ton for the three scenarios, respectively.
- Sales prices of propylene are estimated at USD 1097, USD 1097, and USD 821 per ton for the mentioned scenarios [101].
- Byproducts such as ethylene, gasoline, and LPG are also produced while converting methanol to propylene. These three byproducts are also considered in the form of three scenarios. The projected price for ethylene sales in 2023 is USD 1069 per ton based on optimistic scenarios, USD 800 per ton in realistic scenarios [101], and USD 531 per ton in pessimistic scenarios. On the other hand, the anticipated price for the sale of LPG according to the optimistic scenarios is USD 525.12 per ton, USD 393 per ton in realistic scenarios [101], and USD 260.87 per ton in the pessimistic scenarios. Finally, the forecast price for gasoline sales in 2023 is USD 923.3 [101], USD 691, and USD 465.68 per ton in the scenarios, respectively.
4. Results of Economic Evaluations
4.1. Assessment of Economic Productivity
4.1.1. Investment Prices
4.1.2. Production Prices
4.1.3. Internal Rate of Return (IRR)
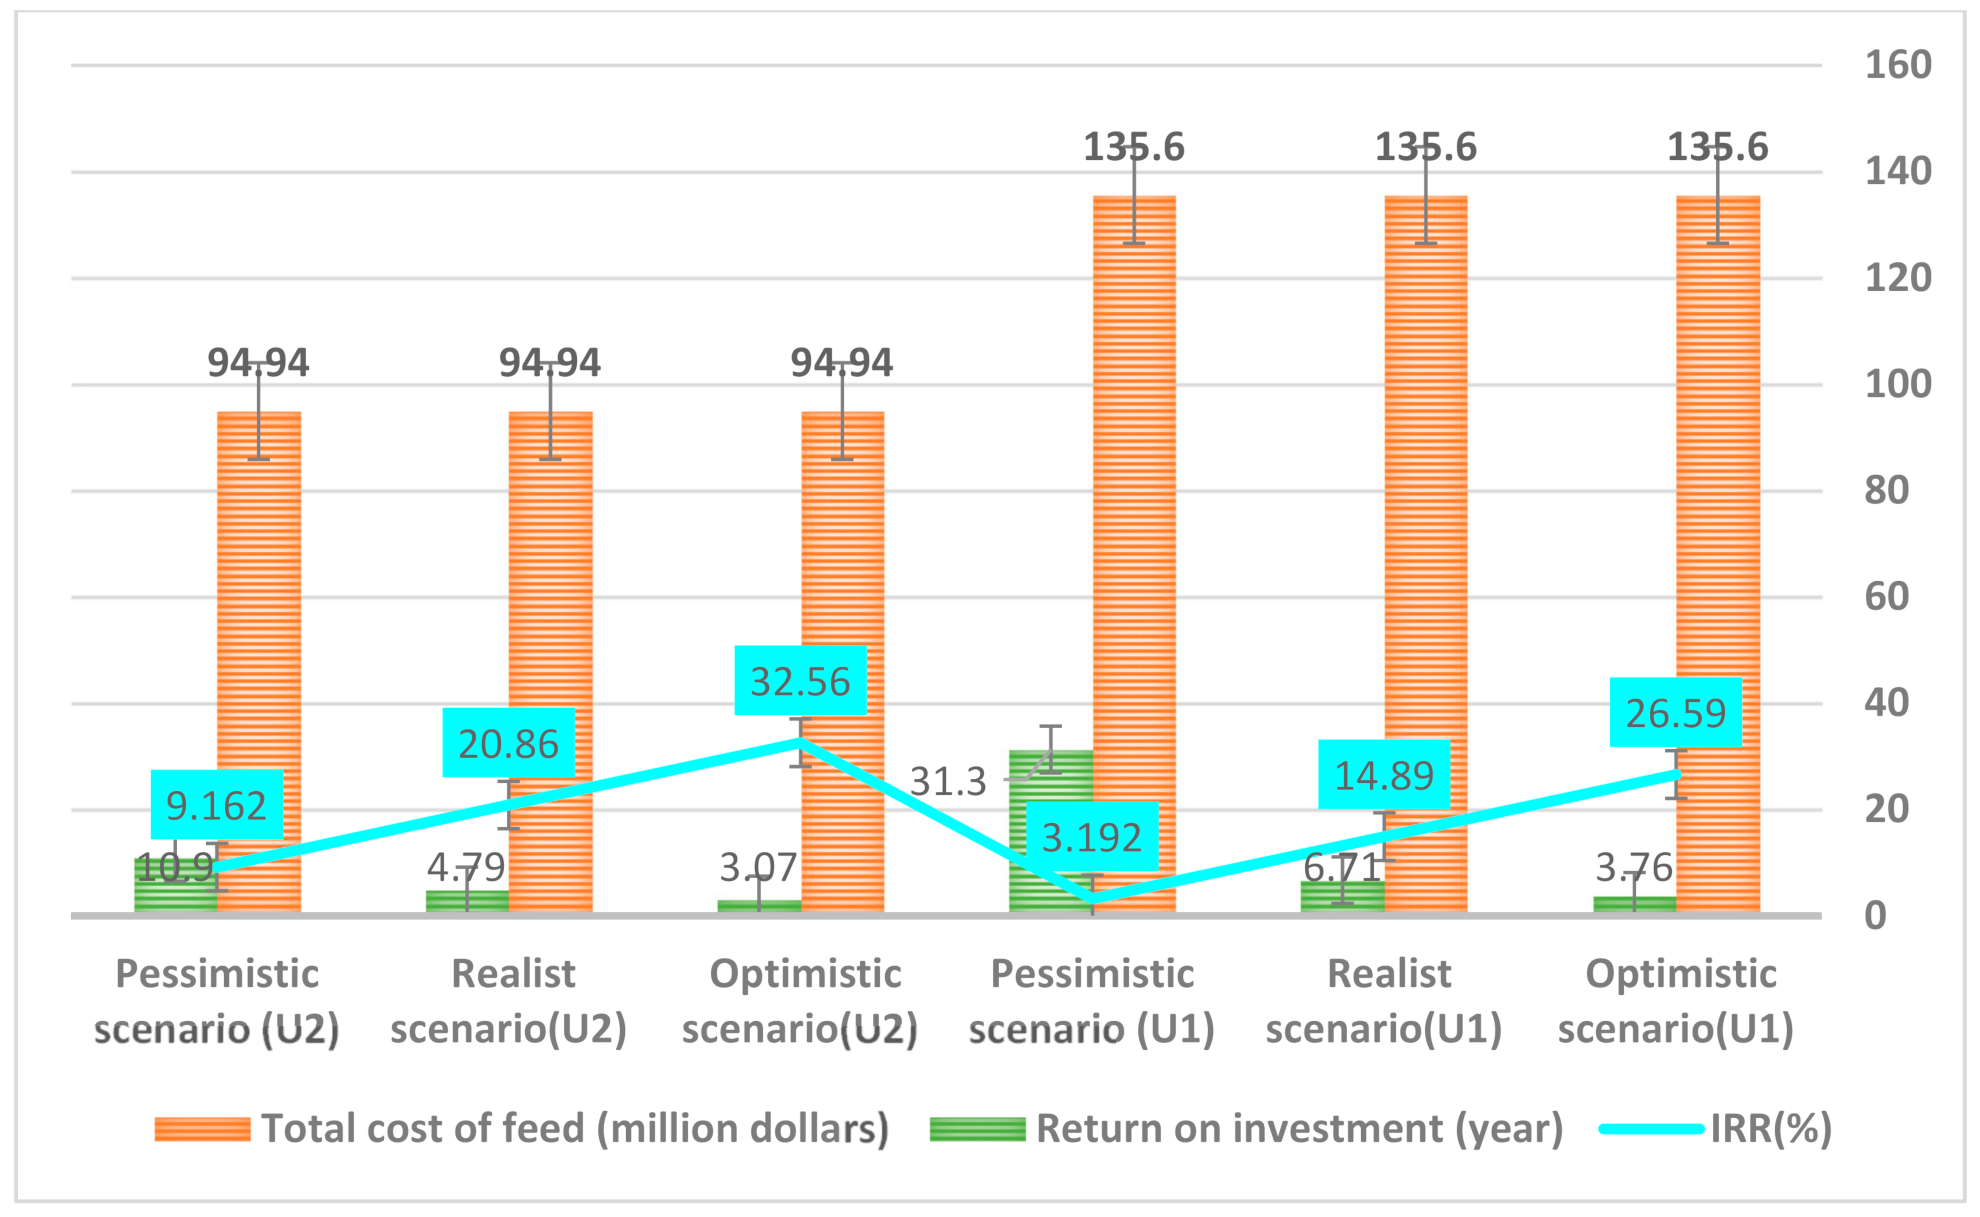
4.1.4. Natural Gas to Methanol Conversion Unit (GTM) without Feed Discount (Unit 1)
- The decline in oil and gas prices and their effects on feed and fuel prices.
- US–China trade war and decreasing Chinese methanol imports from the US.
- Drop-in methanol price (leading to eliminating players who have had low-profit margins so far).
- Increase in the level of methanol production, especially in Iran.
- Expansion of methanol and its derivatives in China as fuel to 85 million liters/day over the next five years (85 million liters is equivalent to 24 million tons of methanol/year).
- Reducing global demand for methanol derivatives, especially formaldehyde, in the European automotive industry.
- Shipping price changes from the implementation of new IMO 2020 pollution regulations.
- Expansion of methanol consumption as a ship fuel due to the new IMO 2020 pollution regulations.

| Item | Pessimistic Scenario | Realistic Scenario | Optimistic Scenario |
|---|---|---|---|
| Methanol production capacity (thousand tons per year) | 1566 | 1566 | 1566 |
| Fixed investment cost (million dollars) [98,99] | 733 | 733 | 733 |
| Amount of natural gas consumed (billion cubic meters) [104] | 1.356 | 1.356 | 1.356 |
| Unit price of natural gas consumed (cents per cubic meter) [101] | 10 | 10 | 10 |
| Total cost of feed (million dollars) | 135.6 | 135.6 | 135.6 |
| Labor (million dollars) [104] | 1.170 | 1.170 | 1.170 |
| Utility (million dollars) [104] | 9.509 | 9.509 | 9.509 |
| Depreciation (million dollars) [104] | 3.143 | 3.143 | 3.143 |
| Factory overhead costs (million dollars) [104] | 10.840 | 10.840 | 10.840 |
| Total production cost (million dollars) [104] | 160.359 | 160.359 | 160.359 |
| Cost of methanol production (dollars per ton) | 102.4 | 102.4 | 102.4 |
| Estimated selling price of methanol in 2023 (dollars per ton) | 118.8 | 179 [104] | 239.2 |
| Total gross sales (million dollars) | 186.07 | 280.31 | 374.58 |
| Total net sales (million dollars) | 25.711 | 119.95 | 214.22 |
| Tax (million dollars) | 2.314 | 10.79 | 19.28 |
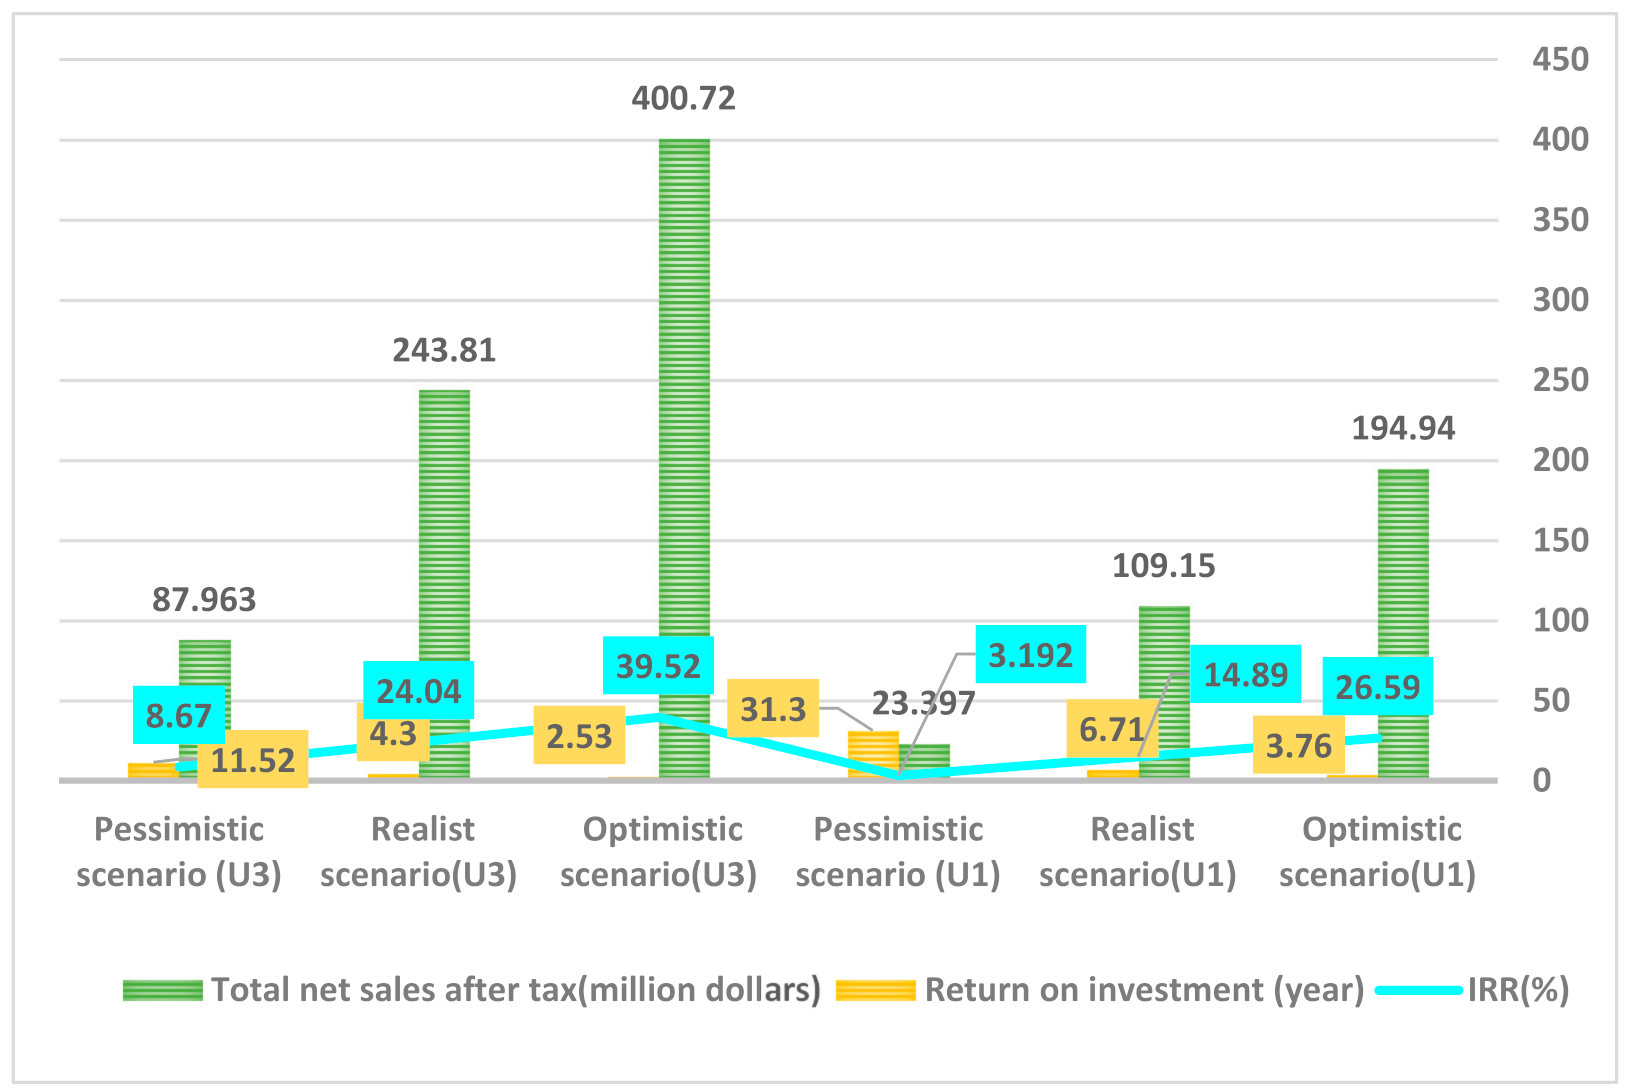
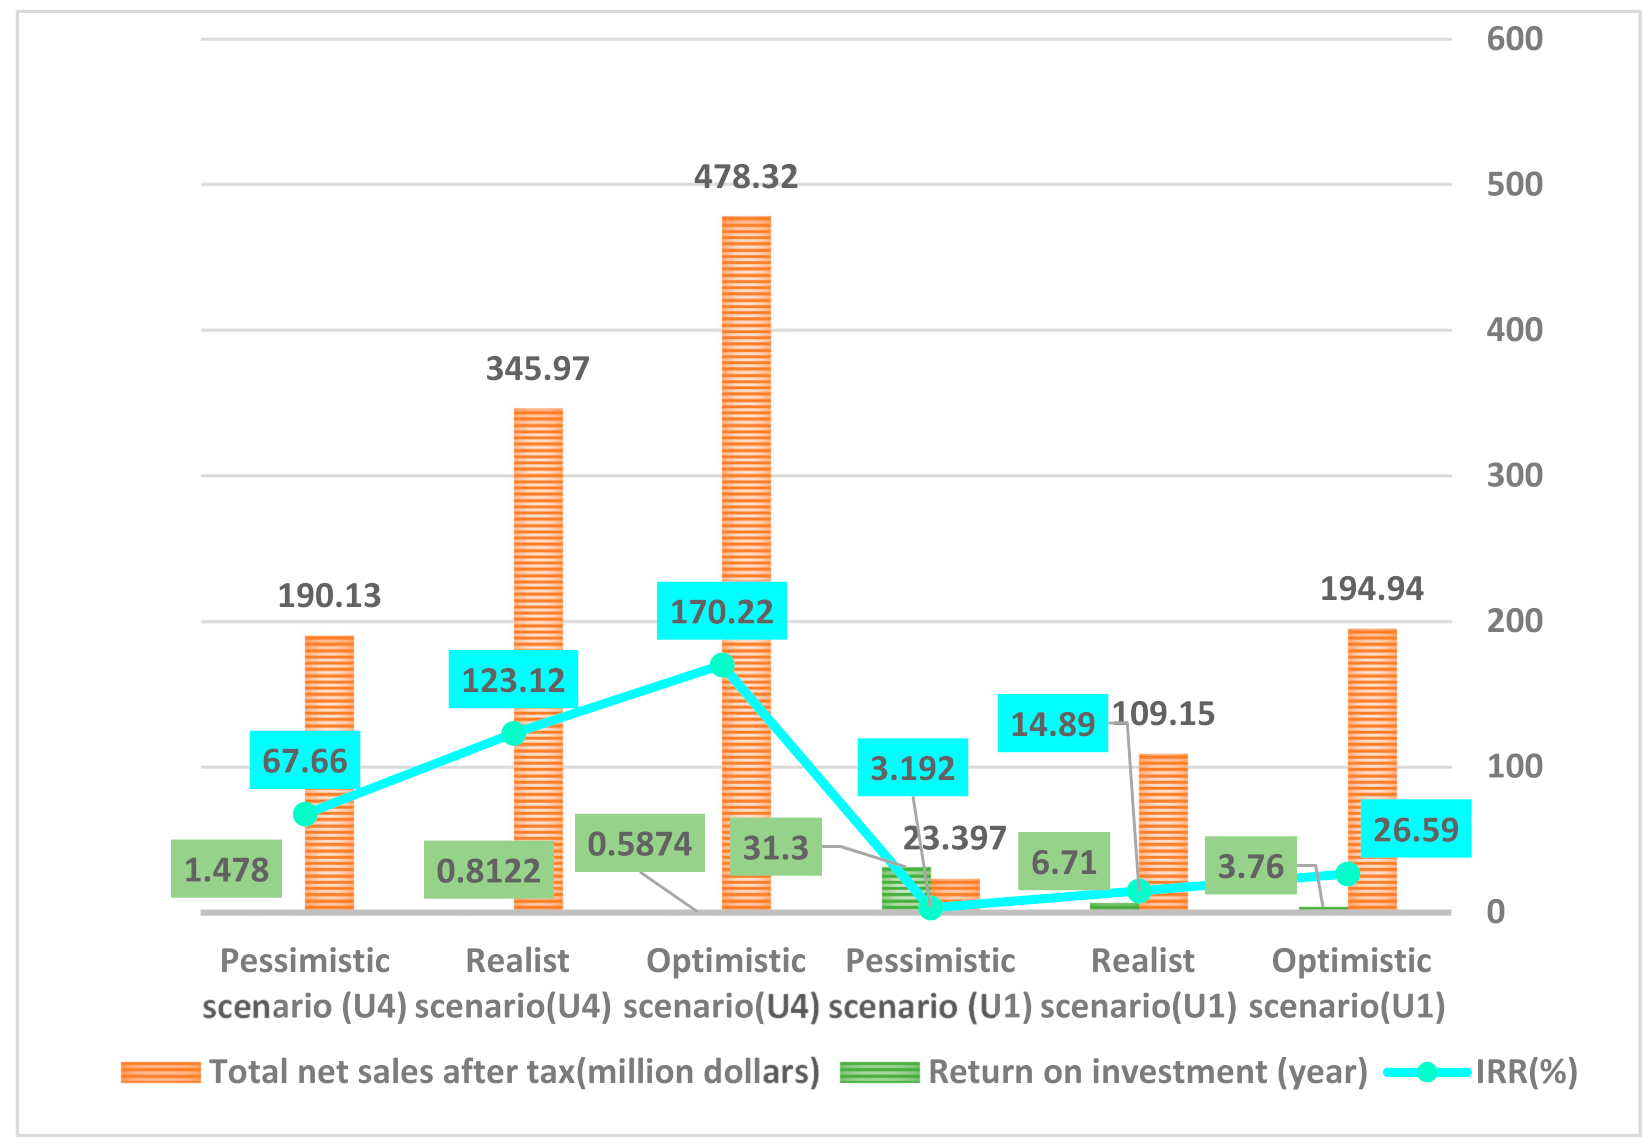
| Total net sales after tax (million dollars) | 23.397 | 109.15 | 194.94 |
| IRR (%) | 3.192 | 14.89 | 26.59 |
| Return on investment (year) | 31.3 | 6.71 | 3.76 |
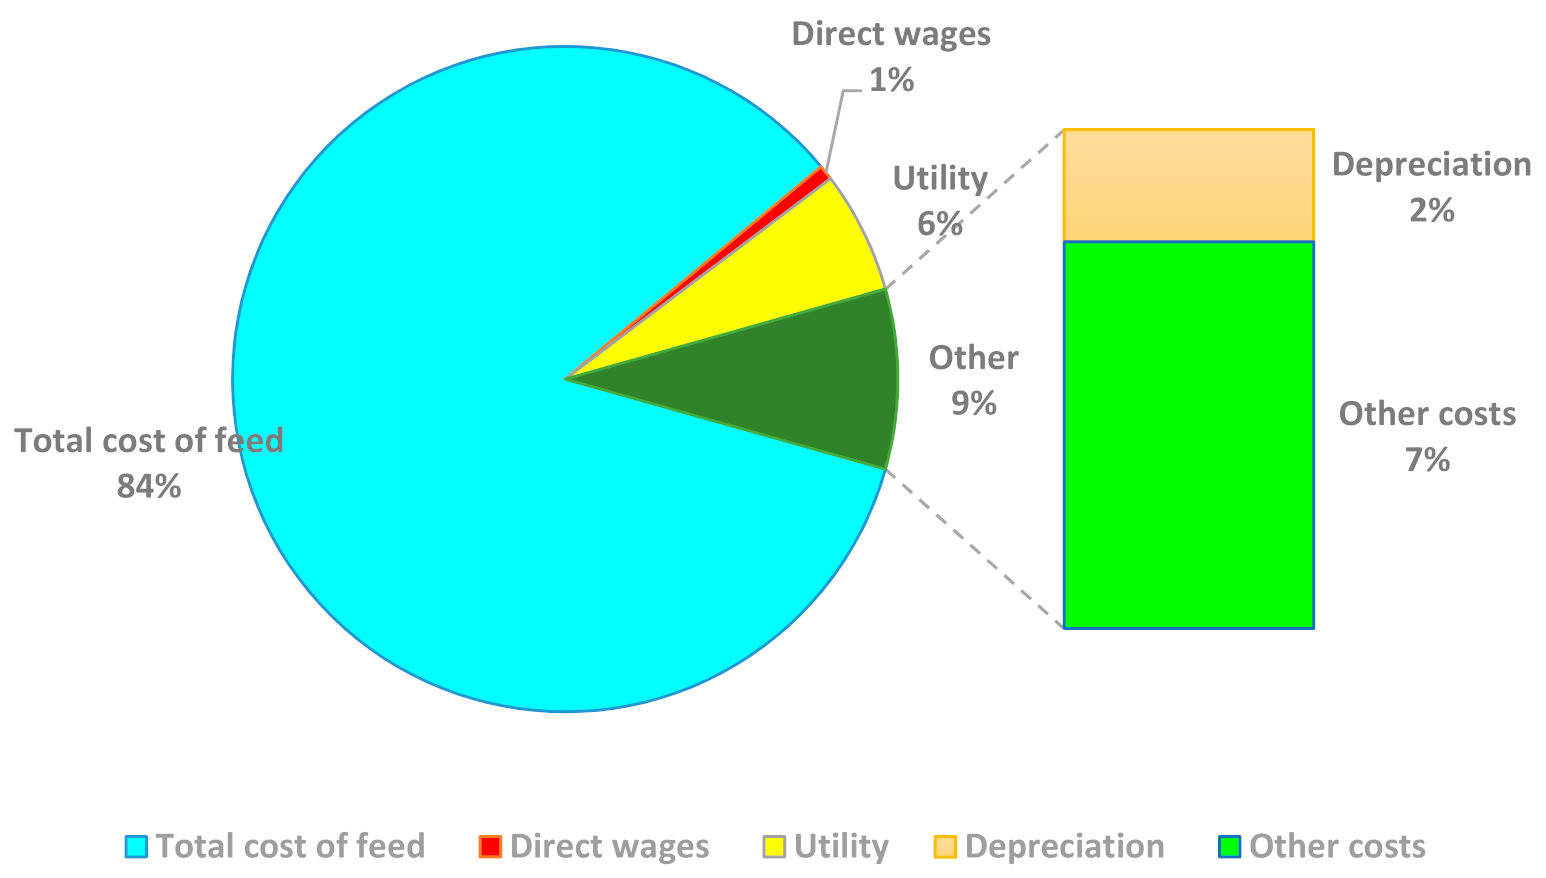
4.1.5. Natural Gas to Methanol Conversion Unit (GTM) with 30% Feed Discount (Unit 2)
| Item | Pessimistic Scenario | Realistic Scenario | Optimistic Scenario |
|---|---|---|---|
| Methanol production capacity (thousand tons per year) | 1566 | 1566 | 1566 |
| Fixed investment cost (million dollars) [98,99] | 733 | 733 | 733 |
| Amount of natural gas consumed (billion cubic meters) [104] | 1.356 | 1.356 | 1.356 |
| Unit price of natural gas consumed (cents per cubic meter) [101] | 7 | 7 | 7 |
| Total cost of feed (million dollars) | 94.94 | 94.94 | 94.94 |
| Direct wages (million dollars) | 0.819 | 0.819 | 0.819 |
| Utility (million dollars) [104] | 6.658 | 6.658 | 6.658 |
| Depreciation (million dollars) [104] | 2.208 | 2.208 | 2.208 |
| Other costs (million dollars) [104] | 7.598 | 7.598 | 7.598 |
| Total production cost (million dollars) [104] | 112.27 | 112.27 | 112.27 |
| Cost of methanol production (dollars per ton) | 71.70 | 71.70 | 71.70 |
| Estimated selling price of methanol in 2023 (dollars per ton) | 118.8 | 179 [104] | 239.2 |
| Total gross sales (million dollars) | 186.07 | 280.31 | 374.58 |
| Total net sales (million dollars) | 73.8 | 168.04 | 262.31 |
| Tax (million dollars) | 6.642 | 15.12 | 23.61 |
| Total net sales after tax (million dollars) | 67.158 | 152.92 | 238.70 |
| IRR (%) | 9.162 | 20.86 | 32.56 |
| Return on investment (year) | 10.9 | 4.79 | 3.07 |
4.1.6. Natural Gas to Propylene Conversion Unit (Unit 3)
| Item | Pessimistic Scenario | Realistic Scenario | Optimistic Scenario |
|---|---|---|---|
| Propylene production capacity (thousand tons per year) [104] | 452 | 452 | 452 |
| Ethylene production capacity (thousand tons per year) [104] | 21.725 | 21.725 | 21.725 |
| LPG production capacity (thousand tons per year) [104] | 16.746 | 16.746 | 16.746 |
| Gasoline production capacity (thousand tons per year) [104] | 170.63 | 170.63 | 170.63 |
| Fixed investment cost (million dollars) [40,41] | 1014 | 1014 | 1014 |
| Amount of natural gas consumed (billion cubic meter) [104] | 1.356 | 1.356 | 1.356 |
| Unit price of natural gas consumed (cents per cubic meter) [101] | 7 | 7 | 7 |
| Amount of methanol consumed (one thousand tons per year) | 1566 | 1566 | 1566 |
| Unit price of methanol consumed (dollars per ton) [104] | 71.70 | 71.70 | 71.70 |
| Total cost of feed (million dollars) | 207.21 | 207.21 | 207.21 |
| Direct wages (million dollars) [104] | 1.789 | 1.789 | 1.789 |
| Utility (million dollars) [104] | 14.53 | 14.53 | 14.53 |
| Depreciation (million dollars) [104] | 4.803 | 4.803 | 4.803 |
| Other costs (million dollars) [104] | 16.56 | 16.56 | 16.56 |
| Total production cost (million dollars) | 245.04 | 245.04 | 245.04 |
| Unit production cost (dollars per ton) | 370 | 370 | 370 |
| Cost of production of propylene (dollars per ton) | 253 | 253 | 253 |
| Estimated selling price of propylene in 2023 (dollars per ton) | 545 | 821 [103] | 1097 |
| Estimated selling price of ethylene in 2023 (dollars per ton) | 531 | 800 [103] | 1069 |
| Estimated selling price of LPG in 2023 (dollars per ton) | 260.87 | 393 [103] | 525.12 |
| Estimated selling price of gasoline in 2023 (dollars per ton) | 465.68 | 691 [103] | 923.3 |
| Total gross sales (million dollars) | 341.70 | 512.96 | 685.40 |
| Total net sales (million dollars) | 96.663 | 267.92 | 440.36 |
| Tax (million dollars) | 8.700 | 24.12 | 39.63 |
| Total net sales after tax (million dollars) | 87.963 | 243.81 | 400.72 |
| IRR (%) | 8.67 | 24.04 | 39.52 |
| Return on investment (year) | 11.52 | 4.30 | 2.53 |
4.1.7. Methanol to Propylene Conversion Unit (Unit 4)
| Item | Pessimistic Scenario | Realistic Scenario | Optimistic Scenario |
|---|---|---|---|
| Propylene production capacity (thousand tons per year) [104] | 452 | 452 | 452 |
| Ethylene production capacity (thousand tons per year) [104] | 21.725 | 21.725 | 21.725 |
| LPG production capacity (thousand tons per year) [104] | 16.746 | 16.746 | 16.746 |
| Gasoline production capacity (thousand tons per year) [104] | 170.63 | 170.63 | 170.63 |
| Fixed investment cost (million dollars) [40,41] | 281 | 281 | 281 |
| Amount of methanol consumed (one thousand tons per year) [104] | 1566 | 1566 | 1566 |
| Unit price of methanol consumed (dollars per ton) | 71.70 | 71.70 | 71.70 |
| Total cost of methanol consumed (million dollars) | 112.27 | 112.27 | 112.27 |
| Direct wages (million dollars) [104] | 0.969 | 0.969 | 0.969 |
| Utility (million dollars) [104] | 7.873 | 7.873 | 7.873 |
| Depreciation (million dollars) [104] | 2.602 | 2.602 | 2.602 |
| Other costs (million dollars) [104] | 8.975 | 8.975 | 8.975 |
| Total production cost (million dollars) | 132.77 | 132.77 | 132.77 |
| Unit production cost (dollars per ton) | 200.86 | 200.86 | 200.86 |
| Cost of production of propylene (dollars per ton) | 137.35 | 137.35 | 137.35 |
| Estimated selling price of propylene in 2023 (dollars per ton) | 545 | 821 [103] | 1097 |
| Estimated selling price of ethylene in 2023 (dollars per ton) | 531 | 800 [103] | 1069 |
| Estimated selling price of LPG in 2023 (dollars per ton) | 260.87 | 393 [103] | 525.12 |
| Estimated selling price of gasoline in 2023 (dollars per ton) | 465.68 | 691 [103] | 923.3 |
| Total gross sales (million dollars) | 341.70 | 512.96 | 685.40 |
| Total net sales (million dollars) | 208.93 | 380.19 | 525.63 |
| Tax (million dollars) | 18.80 | 34.22 | 47.31 |
| Total net sales after tax (million dollars) | 190.13 | 345.97 | 478.32 |
| IRR (%) | 67.66 | 123.12 | 170.22 |
| Return on investment (year) | 1.478 | 0.8122 | 0.5874 |
4.2. Comparison of the Economic Results of Propylene with That of Other Researchers
4.3. Economic Sensitivity Analysis
4.3.1. Investigating the Effect of Natural Gas Price on the Profitability of Methanol Production Units (Units 1 and 2)
4.3.2. Inspecting the Effect of Natural Gas Prices on the Profitability of GTM and GTP Units
4.3.3. Examining the Effect of Feed Price on the Profitability of GTM and MTP Units
5. Conclusions
6. Suggestions
- In policy making, natural gas pricing should be amended in such a way that the profitability of units converting natural gas to propylene is always higher than methanol units (the natural gas feed price for new methanol production units should be increased to the export gas price and the discount should only be conditioned on propylene production). This action will preclude the sale of crude methanol and expand the value chain of propylene production from natural gas.
- For a balanced development of the entire propylene value chain, it is crucial to determine the gas feed price of petrochemical units depending on the type of final output product from the unit (the gas feed price should be based on the output product of downstream propylene units such as polypropylene, acrylonitrile, acrylic acid, propylene, etc.). Today, approximately 95% of the propylene produced in Iran is converted to polypropylene, and only 5% is converted to 2-Ethylhexanol in the Shazand Arak Petrochemical Complex. In other words, the investment cost of acrylonitrile and acrylic acid unit is higher than polypropylene, which makes it less attractive to investors.
- Because of the lack of progress in projects such as GTP and GTM, it is recommended that the licenses of unfinished and not yet started projects (with less than 30% physical progress) should be reviewed and their gas feed pricing reconsidered.
- As mentioned, many valuable products in the propylene value chain are supplied through imports for various reasons, including the lack of sufficient propylene in the country and the high investment cost necessary for the development and construction of propylene value chain units. Thence, it can be concluded that “it is necessary to regulate the gradual reduction of petrochemical industry feeds, subject to part 4 of article 4”, and the annexation law of articles regulating part of the government’s financial regulations (2) approved in 2014 should be revised based on indicators such as applying a commensurate discount with the added value of downstream products and reducing imports and meeting domestic needs.
- Provisioning support for investment costs, such as grants for facilities from the National Development Fund at low-interest rates or with more extended reimbursement periods, can also increase investors’ willingness to complete the propylene value chain.
Author Contributions
Funding
Institutional Review Board Statement
Informed Consent Statement
Data Availability Statement
Conflicts of Interest
Nomenclature
| MTP | Methanol to propylene |
| GTP | Gas to propylene |
| GTPP | Gas to polypropylene |
| GTM | Gas to methanol |
| PTPP | Propylene to polypropylene |
| MTO | Methanol to olefin |
| LPG | Liquefied petroleum gas |
| LNG | Liquefied natural gas |
| PG | Polymer grade |
| CG | Chemical grade |
| RG | Refinery grade |
| IRR | Internal rate of return |
| MIRR | Minimum return on investment |
| SR | Stoichiometric ratio |
| ICI | Imperial Chemical Industries |
| ARC | Axial radial converter |
| FCC | Fluid Catalytic Cracking |
| SRM | Steam reforming of methane |
| DME | Dimethyl ether |
| TCI | Total capital investment |
| FCI | Fixed capital investment |
| WCI | Working capital investment |
| TPC | Total Production Cost |
| CR | Cost of raw material |
| CU | Cost of utilities |
| CL | Cost of raw labor |
| CFO | Cost of factory overhead |
| CDE | Cost of depreciation |
| NPV | Net present value |
| CI | Cash inflow of year t |
| CO | Cash outflow of year t |
References
- Chen, H.; Heidari, A.A.; Chen, H.; Wang, M.; Pan, Z.; Gandomi, A.H. Multi-population differential evolution-assisted Harris hawks optimization: Framework and case studies. Future Gener. Comput. Syst. 2020, 111, 175–198. [Google Scholar] [CrossRef]
- Wang, M.; Chen, H. Chaotic multi-swarm whale optimizer boosted support vector machine for medical diagnosis. Appl. Soft Comput. 2020, 88, 105946. [Google Scholar] [CrossRef]
- Xu, Y.; Chen, H.; Luo, J.; Zhang, Q.; Jiao, S.; Zhang, X. Enhanced Moth-flame optimizer with mutation strategy for global optimization. Inf. Sci. 2019, 492, 181–203. [Google Scholar] [CrossRef]
- Zhao, Y.; Lu, J.; Yang, S.; Lai, L.; Xu, L. Research on Cell Manufacturing Facility Layout Problem Based on Improved NSGA-II. Comput. Mater. Contin. 2020, 62, 355–364. [Google Scholar] [CrossRef]
- Zhu, J.; Zhou, B.; Ma, B.; Dui, G.; Yang, S.; Xin, L. Optimization Design of RC Ribbed Floor System Using Eagle Strategy with Particle Swarm Optimization. Comput. Mater. Contin. 2020, 62, 365–383. [Google Scholar] [CrossRef]
- Shi, X.; Li, Y.; Xie, H.; Yang, T.; Zhang, L.; Liu, P.; Zhang, H.; Liang, Z. An openflow-based load balancing strategy in sdn. Comput. Mater. Contin. 2020, 62, 385–398. [Google Scholar] [CrossRef]
- Liu, C.; Li, K.; Li, K. A Game Approach to Multi-Servers Load Balancing with Load-Dependent Server Availability Consideration. IEEE Trans. Cloud Comput. 2021, 9, 1–13. [Google Scholar] [CrossRef]
- Liu, C.; Li, K.; Li, K.; Buyya, R. A New Service Mechanism for Profit Optimizations of a Cloud Provider and Its Users. IEEE Trans. Cloud Comput. 2021, 9, 14–26. [Google Scholar] [CrossRef]
- Xiao, G.; Li, K.; Chen, Y.; He, W.; Zomaya, A.Y.; Li, T. CASpMV: A Customized and Accelerative SpMV Framework for the Sunway TaihuLight. IEEE Trans. Parallel Distrib. Syst. 2021, 32, 131–146. [Google Scholar] [CrossRef]
- Energy Information Administration. International Energy Statistics-Proved Reserves of Natural Gas; Energy Information Administration: Washington, DC, USA, 2016.
- Zhao, X.; Zhang, X.; Cai, Z.; Tian, X.; Wang, X.; Huang, Y.; Chen, H.; Hu, L. Chaos enhanced grey wolf optimization wrapped ELM for diagnosis of paraquat-poisoned patients. Comput. Biol. Chem. 2019, 78, 481–490. [Google Scholar] [CrossRef]
- Li, C.; Hou, L.; Sharma, B.Y.; Li, H.; Chen, C.; Li, Y.; Zhao, X.; Huang, H.; Cai, Z.; Chen, H. Developing a new intelligent system for the diagnosis of tuberculous pleural effusion. Comput. Methods Programs Biomed. 2018, 153, 211–225. [Google Scholar] [CrossRef]
- Wang, M.; Chen, H.; Yang, B.; Zhao, X.; Hu, L.; Cai, Z.; Huang, H.; Tong, C. Toward an optimal kernel extreme learning machine using a chaotic moth-flame optimization strategy with applications in medical diagnoses. Neurocomputing 2017, 267, 69–84. [Google Scholar] [CrossRef]
- Duan, M.; Li, K.; Li, K.; Tian, Q. A Novel Multi-task Tensor Correlation Neural Network for Facial Attribute Prediction. ACM Trans. Intell. Syst. Technol. 2021, 12, 3:1–3:22. [Google Scholar] [CrossRef]
- Chen, C.; Li, K.; Teo, S.G.; Zou, X.; Li, K.; Zeng, Z. Citywide Traffic Flow Prediction Based on Multiple Gated Spatio-temporal Convolutional Neural Networks. ACM Trans. Knowl. Discov. Data 2020, 14, 42:1–42:23. [Google Scholar] [CrossRef]
- Zhou, X.; Li, K.; Yang, Z.; Gao, Y.; Li, K. Efficient Approaches to k Representative G-Skyline Queries. ACM Trans. Knowl. Discov. Data 2020, 14, 58:1–58:27. [Google Scholar] [CrossRef]
- Janakiraman, B.; Arumugam, S. Personalized Nutrition Recommendation for Diabetic Patients Using Optimization Techniques. Intell. Autom. Soft Comput. 2019, 26, 269–280. [Google Scholar] [CrossRef]
- Krishna, R.; Kumar, S.S. Color image segmentation using soft rough fuzzy-c-means and local binary pattern. Intell. Autom. Soft Comput. 2020, 26, 281–290. [Google Scholar] [CrossRef]
- Juang, L.-H.; Zhao, Y.-H. Intelligent Speech Communication Using Double Humanoid Robots. Intell. Autom. Soft Comput. 2020, 26, 291–301. [Google Scholar] [CrossRef]
- Eyupoglu, C. A Two-Level Morphological Description of Bashkir Turkish. Comput. Syst. Sci. Eng. 2019, 34, 113–121. [Google Scholar] [CrossRef]
- Kumar, C.R.; Jayanthi, V. A Novel Fuzzy Rough Sets Theory Based CF Recommendation System. Comput. Syst. Sci. Eng. 2019, 34, 123–129. [Google Scholar] [CrossRef]
- Oliva, A.F.; Pérez, F.M.; Berná-Martinez, J.V.; Ortega, M.A. Non-deterministic outlier detection method based on the variable precision rough set model. Comput. Syst. Sci. Eng. 2019, 34, 131–144. [Google Scholar] [CrossRef]
- Xia, J.; Chen, H.; Li, Q.; Zhou, M.; Chen, L.; Cai, Z.; Fang, Y.; Zhou, H. Ultrasound-based differentiation of malignant and benign thyroid Nodules: An extreme learning machine approach. Comput. Methods Programs Biomed. 2017, 147, 37–49. [Google Scholar] [CrossRef] [PubMed]
- Chen, H.; Wang, G.; Ma, C.; Cai, Z.-N.; Liu, W.-B.; Wang, S.-J. An efficient hybrid kernel extreme learning machine approach for early diagnosis of Parkinson’s disease. Neurocomputing 2016, 184, 131–144. [Google Scholar] [CrossRef] [Green Version]
- Shen, L.; Chen, H.; Yu, Z.; Kang, W.; Zhang, B.; Li, H.; Yang, B.; Liu, D. Evolving support vector machines using fruit fly optimization for medical data classification. Knowl.-Based Syst. 2016, 96, 61–75. [Google Scholar] [CrossRef]
- Zhou, S.; Ke, M.; Luo, P. Multi-camera transfer GAN for person re-identification. J. Vis. Commun. Image Represent. 2019, 59, 393–400. [Google Scholar] [CrossRef]
- Yin, B.; Wei, X. Communication-Efficient Data Aggregation Tree Construction for Complex Queries in IoT Applications. IEEE Internet Things J. 2019, 6, 3352–3363. [Google Scholar] [CrossRef]
- Li, W.; Liu, H.; Wang, J.; Xiang, L.; Yang, Y. An improved linear kernel for complementary maximal strip recovery: Simpler and smaller. Theor. Comput. Sci. 2019, 786, 55–66. [Google Scholar] [CrossRef]
- Gui, Y.; Zeng, G. Joint learning of visual and spatial features for edit propagation from a single image. Vis. Comput. 2019, 36, 469–482. [Google Scholar] [CrossRef]
- Li, W.; Xu, H.; Li, H.; Yang, Y.; Sharma, P.K.; Wang, J.; Singh, S. Complexity and Algorithms for Superposed Data Uploading Problem in Networks With Smart Devices. IEEE Internet Things J. 2020, 7, 5882–5891. [Google Scholar] [CrossRef]
- Wei, W.; Yongbin, J.; Yanhong, L.; Ji, L.; Xin, W.; Tong, Z. An Advanced Deep Residual Dense Network (DRDN) Approach for Image Super-Resolution. Int. J. Comput. Intell. Syst. 2019, 12, 1592–1601. [Google Scholar] [CrossRef] [Green Version]
- Gu, K.; Wu, N.; Yin, B.; Jia, W.J. Secure Data Query Framework for Cloud and Fog Computing. IEEE Trans. Netw. Serv. Manag. 2020, 17, 332–345. [Google Scholar] [CrossRef]
- Song, Y.; Zeng, Y.; Li, X.; Cai, B.; Yang, G. Fast CU size decision and mode decision algorithm for intra prediction in HEVC. Multimed. Tools Appl. 2016, 76, 2001–2017. [Google Scholar] [CrossRef]
- Zhang, D.; Liang, Z.; Yang, G.; Li, Q.; Li, L.; Sun, X. A robust forgery detection algorithm for object removal by exemplar-based image inpainting. Multimed. Tools Appl. 2018, 77, 11823–11842. [Google Scholar] [CrossRef]
- Hu, L.; Hong, G.; Ma, J.; Wang, X.; Chen, H. An efficient machine learning approach for diagnosis of paraquat-poisoned patients. Comput. Biol. Med. 2015, 59, 116–124. [Google Scholar] [CrossRef] [PubMed]
- Xu, X.; Chen, H.-L. Adaptive computational chemotaxis based on field in bacterial foraging optimization. Soft Comput. 2013, 18, 797–807. [Google Scholar] [CrossRef]
- Zhang, Y.; Liu, R.; Wang, X.; Chen, H.; Li, C. Boosted binary Harris hawks optimizer and feature selection. Eng. Comput. 2020, 1–30. [Google Scholar] [CrossRef]
- Cao, D.; Zheng, B.; Ji, B.; Lei, Z.; Feng, C. A robust distance-based relay selection for message dissemination in vehicular network. Wirel. Netw. 2020, 26, 1755–1771. [Google Scholar] [CrossRef]
- Gu, K.; Yang, L.; Yin, B. Location Data Record Privacy Protection based on Differential Privacy Mechanism. Inf. Technol. Control 2018, 47, 639–654. [Google Scholar] [CrossRef] [Green Version]
- Luo, Y.-S.; Yang, K.; Tang, Q.; Zhang, J.; Xiong, B. A multi-criteria network-aware service composition algorithm in wireless environments. Comput. Commun. 2012, 35, 1882–1892. [Google Scholar] [CrossRef]
- Xia, Z.; Hu, Z.; Luo, J. UPTP Vehicle Trajectory Prediction Based on User Preference under Complexity Environment. Wirel. Pers. Commun. 2017, 97, 4651–4665. [Google Scholar] [CrossRef]
- Long, M.; Chen, Y.; Peng, F. Simple and Accurate Analysis of BER Performance for DCSK Chaotic Communication. IEEE Commun. Lett. 2011, 15, 1175–1177. [Google Scholar] [CrossRef]
- Zhou, S.; Tan, B. Electrocardiogram soft computing using hybrid deep learning CNN-ELM. Appl. Soft Comput. 2020, 86, 105778. [Google Scholar] [CrossRef]
- Zhang, Y.; Liu, R.; Heidari, A.A.; Wang, X.; Chen, Y.; Wang, M.; Chen, H. Towards augmented kernel extreme learning models for bankruptcy prediction: Algorithmic behavior and comprehensive analysis. Neurocomputing 2021, 430, 185–212. [Google Scholar] [CrossRef]
- Zhao, D.; Liu, L.; Yu, F.; Heidari, A.A.; Wang, M.; Liang, G.; Muhammad, K.; Chen, H. Chaotic random spare ant colony optimization for multi-threshold image segmentation of 2D Kapur entropy. Knowl.-Based Syst. 2021, 216, 106510. [Google Scholar] [CrossRef]
- Tu, J.; Chen, H.; Liu, J.; Heidari, A.A.; Zhang, X.; Wang, M.; Ruby, R.; Pham, Q.-V. Evolutionary biogeography-based whale optimization methods with communication structure: Towards measuring the balance. Knowl.-Based Syst. 2021, 212, 106642. [Google Scholar] [CrossRef]
- Siirola, J.J. The impact of shale gas in the chemical industry. AIChE J. 2014, 60, 810–819. [Google Scholar] [CrossRef]
- BP Statistical Review of World Energy Globally Consistent Data on World Energy Markets. 2020, p. 66. Available online: https://www.bp.com/content/dam/bp/business-sites/en/global/corporate/pdfs/energy-economics/statistical-review/bp-stats-review-2020-full-report.pdf (accessed on 29 August 2021).
- Salkuyeh, Y.K.; Adams, T. A novel polygeneration process to co-produce ethylene and electricity from shale gas with zero CO2 emissions via methane oxidative coupling. Energy Convers. Manag. 2015, 92, 406–420. [Google Scholar] [CrossRef]
- Zhao, Z.; Liu, Y.; Wang, F.; Li, X.; Deng, S.; Xu, J.; Wei, W. Life cycle assessment of primary energy demand and greenhouse gas (GHG) emissions of four propylene production pathways in China. J. Clean. Prod. 2017, 163, 285–292. [Google Scholar] [CrossRef]
- Shan, W.; Qiao, Z.; Heidari, A.A.; Chen, H.; Turabieh, H.; Teng, Y. Double adaptive weights for stabilization of moth flame optimizer: Balance analysis, engineering cases, and medical diagnosis. Knowl.-Based Syst. 2021, 214, 106728. [Google Scholar] [CrossRef]
- Yu, C.; Chen, M.; Cheng, K.; Zhao, X.; Ma, C.; Kuang, F.; Chen, H. SGOA: Annealing-behaved grasshopper optimizer for global tasks. Eng. Comput. 2021, 1–28. [Google Scholar] [CrossRef]
- Hu, J.; Chen, H.; Heidari, A.A.; Wang, M.; Zhang, X.; Chen, Y.; Pan, Z. Orthogonal learning covariance matrix for defects of grey wolf optimizer: Insights, balance, diversity, and feature selection. Knowl.-Based Syst. 2021, 213, 106684. [Google Scholar] [CrossRef]
- Davarpanah, A.; Mirshekari, B. Experimental Investigation and Mathematical Modeling of Gas Diffusivity by Carbon Dioxide and Methane Kinetic Adsorption. Ind. Eng. Chem. Res. 2019, 58, 12392–12400. [Google Scholar] [CrossRef]
- Hu, X.; Xie, J.; Cai, W.C.; Wang, R.; Davarpanah, A. Thermodynamic effects of cycling carbon dioxide injectivity in shale reservoirs. J. Pet. Sci. Eng. 2020, 195, 107717. [Google Scholar] [CrossRef]
- Davarpanah, A.; Shirmohammadi, R.; Mirshekari, B.; Aslani, A. Analysis of hydraulic fracturing techniques: Hybrid fuzzy approaches. Arab. J. Geosci. 2019, 12, 402. [Google Scholar] [CrossRef]
- Mazarei, M.; Davarpanah, A.; Ebadati, A.; Mirshekari, B. The feasibility analysis of underground gas storage during an integration of improved condensate recovery processes. J. Pet. Explor. Prod. Technol. 2018, 9, 397–408. [Google Scholar] [CrossRef] [Green Version]
- Davarpanah, A.; Mirshekari, B. Experimental study of CO2 solubility on the oil recovery enhancement of heavy oil reservoirs. J. Therm. Anal. Calorim. 2020, 139, 1161–1169. [Google Scholar] [CrossRef]
- Davarpanah, A.; Mazarei, M.; Mirshekari, B. A simulation study to enhance the gas production rate by nitrogen replacement in the underground gas storage performance. Energy Rep. 2019, 5, 431–435. [Google Scholar] [CrossRef]
- Zhao, X.; Li, D.; Yang, B.; Ma, C.; Zhu, Y.; Chen, H. Feature selection based on improved ant colony optimization for online detection of foreign fiber in cotton. Appl. Soft Comput. 2014, 24, 585–596. [Google Scholar] [CrossRef]
- Yu, H.; Li, W.; Chen, C.; Liang, J.; Gui, W.; Wang, M.; Chen, H. Dynamic Gaussian bare-bones fruit fly optimizers with abandonment mechanism: Method and analysis. Eng. Comput. 2020, 1–29. [Google Scholar] [CrossRef]
- Cao, Y.; Dhahad, H.A.; Farouk, N.; Xia, W.F.; Rad, H.N.; Ghasemi, A.; Kamranfar, S.; Sani, M.M.; Shayesteh, A.A. Multi-objective bat optimization for a biomass gasifier integrated energy system based on 4E analyses. Appl. Therm. Eng. 2021, 196, 117339. [Google Scholar] [CrossRef]
- Mei, C.; Wen, P.; Liu, Z.; Liu, H.; Wang, Y.; Yang, W.; Xie, Z.; Hua, W.; Gao, Z. Selective production of propylene from methanol: Mesoporosity development in high silica HZSM-5. J. Catal. 2008, 258, 243–249. [Google Scholar] [CrossRef]
- Hu, Z.; Zhang, H.; Wang, L.; Zhang, H.; Zhang, Y.; Xu, H.; Shen, W.; Tang, Y. Highly stable boron-modified hierarchical nanocrystalline ZSM-5 zeolite for the methanol to propylene reaction. Catal. Sci. Technol. 2014, 4, 2891–2895. [Google Scholar] [CrossRef]
- Yaripour, F.; Shariatinia, Z.; Sahebdelfar, S.; Irandoukht, A. Conventional hydrothermal synthesis of nanostructured H-ZSM-5 catalysts using various templates for light olefins production from methanol. J. Nat. Gas Sci. Eng. 2015, 22, 260–269. [Google Scholar] [CrossRef]
- Advanced Value Chain Development Center. Available online: http://oil.vcdcenter.com/ (accessed on 19 February 2021).
- Firoozi, M.; Baghalha, M.; Asadi, M. The effect of micro and nano particle sizes of H-ZSM-5 on the selectivity of MTP reaction. Catal. Commun. 2009, 10, 1582–1585. [Google Scholar] [CrossRef]
- Zhao, G.; Teng, J.; Xie, Z.; Jin, W.; Yang, W.; Chen, Q.; Tang, Y. Effect of phosphorus on HZSM-5 catalyst for C4-olefin cracking reactions to produce propylene. J. Catal. 2007, 248, 29–37. [Google Scholar] [CrossRef]
- Losch, P.; Boltz, M.; Louis, B.; Chavan, S.; Olsbye, U. Catalyst optimization for enhanced propylene formation in the methanol-to-olefins reaction. C. R. Chim. 2015, 18, 330–335. [Google Scholar] [CrossRef]
- Barros, Z.D.S.; Zotin, F.M.Z.; Henriques, C.A. Conversion of natural gas to higher valued products: Light olefins production from methanol over ZSM-5 zeolites. Adv. Pharmacol. 2007, 167, 255–260. [Google Scholar] [CrossRef]
- Ehlinger, V.; Gabriel, K.; Noureldin, M.; El-Halwagi, M.M. Process Design and Integration of Shale Gas to Methanol. ACS Sustain. Chem. Eng. 2014, 2, 30–37. [Google Scholar] [CrossRef] [Green Version]
- Tian, P.; Wei, Y.; Ye, M.; Liu, Z. Methanol to Olefins (MTO): From Fundamentals to Commercialization. ACS Catal. 2015, 5, 1922–1938. [Google Scholar] [CrossRef]
- Hadi, N.; Niaei, A.; Nabavi, S.R.; Farzi, A.; Shirazi, M.N. Development of a new kinetic model for methanol to propylene process on Mn/H-ZSM-5 catalyst. Chem. Biochem. Eng. Q. 2014, 28, 53–63. [Google Scholar]
- Mokrani, T.; Scurrell, M. Gas Conversion to Liquid Fuels and Chemicals: The Methanol Route-Catalysis and Processes Development. Catal. Rev. 2009, 51, 1–145. [Google Scholar] [CrossRef]
- Xu, A.; Ma, H.; Zhang, H.; Ying, W.; Fang, D. Conversion of Methanol to Propylene over a High Silica B-HZSM-5 Catalyst. Int. J. Chem. Mol. Nucl. Mater. Metall. Eng. 2013, 7, 179–184. [Google Scholar]
- Mentzel, U.V.; Højholt, K.T.; Holm, M.S.; Fehrmann, R.; Beato, P. Conversion of methanol to hydrocarbons over conventional and mesoporous H-ZSM-5 and H-Ga-MFI: Major differences in deactivation behavior. Appl. Catal. A Gen. 2012, 417, 290–297. [Google Scholar] [CrossRef]
- Stöcker, M. Methanol-to-hydrocarbons: Catalytic materials and their behavior. Microporous Mesoporous Mater. 1999, 29, 3–48. [Google Scholar] [CrossRef]
- Koempel, H.; Liebner, W. Lurgi’s Methanol to Propylene (MTP®) Report on a successful commercialisation. Adv. Pharmacol. 2007, 167, 261–267. [Google Scholar] [CrossRef]
- Jeffrey, B.; Keith, B.; Paul, D.; Benjamin, H.; Bruno, M.; Robert, P.; Julian, W. Critical Care Toxicology: Diagnosis and Management of the Critically Poisoned Patient; Springer: Berlin/Heidelberg, Germany, 2017. [Google Scholar] [CrossRef] [Green Version]
- Sun, J.; Liu, C.; Wang, Y.; Martin, K.V. Process and Catalyst for Conversion of Acetic Acid into Isobutene and Propylene. U.S. Patent 9,580,365, 28 February 2015. [Google Scholar]
- Grubbs, R.H.; Daniel, J. Handbook of Metathesis, Volume 2: Applications in Organic Synthesis; John Wiley Sons: Hoboken, NJ, USA, 2015. [Google Scholar]
- Nawaz, Z. Light alkane dehydrogenation to light olefin technologies: A comprehensive review. Rev. Chem. Eng. 2015, 31, 413–436. [Google Scholar] [CrossRef]
- Iran’s Hydrocarbon Balance Sheet Published by the Iranian Ministry of Oil. Available online: http://ifco.ir/images/97/hamlonaghl/Hydrocarbon.pdf (accessed on 19 February 2021).
- Iran Energy Balance published by the Ministry of Energy of Iran. Available online: http://www.satba.gov.ir/suna_content/media/image/2020/01/8026_orig.pdf (accessed on 19 February 2021).
- Tehran Department of Commerce, Industries, Mines and Agriculture. Available online: http://www.tccim.ir/ (accessed on 12 October 2020).
- Yang, H.; He, C.; Fu, L.; Huo, J.; Zhao, C.; Li, X.; Song, Y. Capture and separation of CO2 on BC3 nanosheets: A DFT study. Chin. Chem. Lett. 2021. [Google Scholar] [CrossRef]
- Ren, T.; Patel, M.K. Basic petrochemicals from natural gas, coal and biomass: Energy use and CO2 emissions. Resour. Conserv. Recycl. 2009, 53, 513–528. [Google Scholar] [CrossRef]
- Ren, T.; Patel, M.K.; Blok, K. Steam cracking and methane to olefins: Energy use, CO2 emissions and production costs. Energy 2008, 33, 817–833. [Google Scholar] [CrossRef] [Green Version]
- Han, Y.; Zhang, F.; Huang, L.; Peng, K.; Wang, X. Does industrial upgrading promote eco-efficiency?—A panel space estimation based on Chinese evidence. Energy Policy 2021, 154, 112286. [Google Scholar] [CrossRef]
- Kung, H.H. Methanol production and use chemical industries. Choice Rev. Online 1995, 32, 32–3898. [Google Scholar] [CrossRef]
- Løvik, I. Modelling, Estimation and Optimization of the Methanol Synthesis with Catalyst Deactivation; Norwegian University of Science and Technology: Trondheim, Norway, 2001. [Google Scholar]
- Jasper, S.; El-Halwagi, M.M. A Techno-Economic Comparison between Two Methanol-to-Propylene Processes. Processes 2015, 3, 684–698. [Google Scholar] [CrossRef]
- Turton, R.; Bailie, R.C.; Whiting, W.B.; Shaeiwitz, J.A. Analysis, Synthesis and Design of Chemical Processes; Pearson Education: Cranbury, NJ, USA, 2008. [Google Scholar]
- Sinnott, R.K. Chemical Engineering Design; Elsevier: Amsterdam, The Netherlands, 2014. [Google Scholar]
- Methanol to Olefins, Process Economics Program Report 261. 2007. Available online: https://ihsmarkit.com/products/chemical-technology-pep-methanol-to-olefins-2007.html (accessed on 19 February 2021).
- Basell’s Multizone Circulating Reactor (MZCR) Process, PEP Review 99-1. 2003. Available online: https://ihsmarkit.com/products/chemical-technology-pep-reviews-basells-multizone-circulating-2003.html (accessed on 19 February 2021).
- Chemical, I. Polypropylene Via Basells Multizone Circulating Reactor (MZCR) Process. 2003. Available online: https://ihsmarkit.com/products/chemical-technology-pep-reviews-basells-multizone-circulating-2003.html (accessed on 19 February 2021).
- Banking Profit Rates Banks’ Lending Rates for Transaction Contracts. 2018. Available online: https://www.cbi.ir/page/1494.aspx (accessed on 29 August 2021).
- Advanced Value Chain Development Center. The Latest Prices of Chemical, Polymer and Petroleum Products. Available online: http://oil.vcdcenter.com/product-price/ (accessed on 10 July 2021).
- IRAN IPRCOTIRO. Investigating Energy Subsidies in Industry, Mining and Petrochemicals. Available online: https://rc.majlis.ir/fa/news/show/1309766 (accessed on 10 July 2021).
- Székely, G.; Gil, M.; Sellergren, B.; Heggie, W.; Ferreira, F.C. Environmental and economic analysis for selection and engineering sustainable API degenotoxification processes. Green Chem. 2012, 15, 210–225. [Google Scholar] [CrossRef]
- Zhang, C.; Jun, K.-W.; Gao, R.; Kwak, G.; Park, H.-G. Carbon dioxide utilization in a gas-to-methanol process combined with CO2/Steam-mixed reforming: Techno-economic analysis. Fuel 2017, 190, 303–311. [Google Scholar] [CrossRef]
- Salman, C.A.; Naqvi, M.R.; Thorin, E.; Yan, J. Impact of retrofitting existing combined heat and power plant with polygeneration of biomethane: A comparative techno-economic analysis of integrating different gasifiers. Energy Convers. Manag. 2017, 152, 250–265. [Google Scholar] [CrossRef]
- Yang, Q.; Zhang, D.; Zhou, H.; Zhang, C. Process simulation, analysis and optimization of a coal to ethylene glycol process. Energy 2018, 155, 521–534. [Google Scholar] [CrossRef]
- Yang, Q.; Zhu, S.; Yang, Q.; Huang, W.; Yu, P.; Zhang, D.; Wang, Z. Comparative techno-economic analysis of oil-based and coal-based ethylene glycol processes. Energy Convers. Manag. 2019, 198, 111814. [Google Scholar] [CrossRef]
- Xiang, D.; Qian, Y.; Man, Y.; Yang, S. Techno-economic analysis of the coal-to-olefins process in comparison with the oil-to-olefins process. Appl. Energy 2014, 113, 639–647. [Google Scholar] [CrossRef]
- Cao, Y.; Doustgani, A.; Salehi, A.; Nemati, M.; Ghasemi, A.; Koohshekan, O. The economic evaluation of establishing a plant for producing biodiesel from edible oil wastes in oil-rich countries: Case study Iran. Energy 2020, 213, 118760. [Google Scholar] [CrossRef]
- Salehi, A.; Karbassi, A.; Ghobadian, B.; Ghasemi, A.; Doustgani, A. Simulation process of biodiesel production plant. Environ. Prog. Sustain. Energy 2019, 38, e13264. [Google Scholar] [CrossRef]
- Ghasemi, A.; Shayesteh, A.A.; Doustgani, A.; Pazoki, M. Thermodynamic assessment and optimization of a novel trigeneration energy system based on solar energy and MSW gasification using energy and exergy concept. J. Therm. Eng. 2021, 7, 349–366. [Google Scholar]
- Ghasemi, A.; Moghaddam, M. Thermodynamic and environmental comparative investigation and optimization of landfill vs. Incineration for municipal solid waste: A case study in Varamin, Iran. J. Therm. Eng. 2020, 6, 226–246. [Google Scholar] [CrossRef]
- Wu, B.; Jin, C.; Monfort, A.; Hua, D. Generous charity to preserve green image? Exploring linkage between strategic donations and environmental misconduct. J. Bus. Res. 2021, 131, 839–850. [Google Scholar] [CrossRef]
- Miao, R.; Ma, J.; Liu, Y.; Liu, Y.; Yang, Z.; Guo, M. Variability of Aboveground Litter Inputs Alters Soil Carbon and Nitrogen in a Coniferous–Broadleaf Mixed Forest of Central China. Forests 2019, 10, 188. [Google Scholar] [CrossRef] [Green Version]
- Hu, P.; Cao, L.; Su, J.; Li, Q.; Li, Y. Distribution characteristics of salt-out particles in steam turbine stage. Energy 2019, 192, 116626. [Google Scholar] [CrossRef]
- Zhang, C. Control Force Characteristics of Different Control Strategies for the Wind-Excited 76-Story Benchmark Building Structure. Adv. Struct. Eng. 2016, 17, 543–559. [Google Scholar] [CrossRef]
- Sun, M.; Hou, B.; Wang, S.; Zhao, Q.; Zhang, L.; Song, L.; Zhang, H. Effects of NaClO shock on MBR performance under continuous operating conditions. Environ. Sci. Water Res. Technol. 2021, 7, 344–396. [Google Scholar] [CrossRef]
- Jiang, L.; Zhang, B.; Han, S.; Chen, H.; Wei, Z. Upscaling evapotranspiration from the instantaneous to the daily time scale: Assessing six methods including an optimized coefficient based on worldwide eddy covariance flux network. J. Hydrol. 2021, 596, 126135. [Google Scholar] [CrossRef]
- Han, X.; Wei, Z.; Zhang, B.; Li, Y.; Du, T.; Chen, H. Crop evapotranspiration prediction by considering dynamic change of crop coefficient and the precipitation effect in back-propagation neural network model. J. Hydrol. 2021, 596, 126104. [Google Scholar] [CrossRef]
- Fan, P.; Deng, R.; Qiu, J.; Zhao, Z.; Wu, S. Well Logging Curve Reconstruction Based on Kernel Ridge Regression. Arab. J. Geosci. 2021, 14. [Google Scholar] [CrossRef]
- Luo, J.; Li, M.; Liu, X.; Tian, W.; Zhong, S.; Shi, K. Stabilization analysis for fuzzy systems with a switched sampled-data control. J. Frankl. Inst. 2020, 357, 39–58. [Google Scholar] [CrossRef]
- Xie, W.; Zhang, R.; Zeng, D.; Shi, K.; Zhong, S. Strictly dissipative stabilization of multiple-memory Markov jump systems with general transition rates: A novel event-triggered control strategy. Int. J. Robust Nonlinear Control 2020, 30, 1956–1978. [Google Scholar] [CrossRef]
- Sun, J.; Aslani, F.; Wei, J.; Wang, X. Electromagnetic absorption of copper fiber oriented composite using 3D printing. Constr. Build. Mater. 2021, 300, 124026. [Google Scholar] [CrossRef]
- Valizadeh, K.; Farahbakhsh, S.; Bateni, A.; Zargarian, A.; Davarpanah, A.; Alizadeh, A.; Zarei, M. A parametric study to simulate the non-Newtonian turbulent flow in spiral tubes. Energy Sci. Eng. 2020, 8, 134–149. [Google Scholar] [CrossRef] [Green Version]


| Item | TCF (Million Dollars) | Production Cost (USD/to) |
|---|---|---|
| This research | 281 | 137.35 |
| Steam cracking | 2197 | 896.3 |
| RGP splitter | 89 | 611.3 |
| CB&I CATOFIN PDH | 492 | 468.5 |
| UOP Oleflex PDH | 506 | 475.9 |
| Uhde STAR PDH | 525 | 531.1 |
| Siemens CTP | 3171 | 1398.2 |
| Lurgi MTP | 308 | 668.9 |
| JGC/MCC DTP | 316 | 693.7 |
| CB&I OCT | 161 | 812.8 |
| Lurgi MTP-NG | 1660.8 |
Publisher’s Note: MDPI stays neutral with regard to jurisdictional claims in published maps and institutional affiliations. |
© 2021 by the authors. Licensee MDPI, Basel, Switzerland. This article is an open access article distributed under the terms and conditions of the Creative Commons Attribution (CC BY) license (https://creativecommons.org/licenses/by/4.0/).
Share and Cite
Syah, R.; Davarpanah, A.; Elveny, M.; Ghasemi, A.; Ramdan, D. The Economic Evaluation of Methanol and Propylene Production from Natural Gas at Petrochemical Industries in Iran. Sustainability 2021, 13, 9990. https://0-doi-org.brum.beds.ac.uk/10.3390/su13179990
Syah R, Davarpanah A, Elveny M, Ghasemi A, Ramdan D. The Economic Evaluation of Methanol and Propylene Production from Natural Gas at Petrochemical Industries in Iran. Sustainability. 2021; 13(17):9990. https://0-doi-org.brum.beds.ac.uk/10.3390/su13179990
Chicago/Turabian StyleSyah, Rahmad, Afshin Davarpanah, Marischa Elveny, Amir Ghasemi, and Dadan Ramdan. 2021. "The Economic Evaluation of Methanol and Propylene Production from Natural Gas at Petrochemical Industries in Iran" Sustainability 13, no. 17: 9990. https://0-doi-org.brum.beds.ac.uk/10.3390/su13179990