
Towards Micro-Level Green Growth: A Framework to Recognize Corporate Growth Status, Path and Adopt Eco-Innovations


1
School of Management, Zhejiang University, Hangzhou 310058, China
2
National Institute of Innovation Management, Zhejiang University, Hangzhou 310058, China
3
Polytechnic Institute, Zhejiang University, Hangzhou 310015, China
4
Department of Industrial and System Engineering, Zhejiang University, Hangzhou 310027, China
*
Author to whom correspondence should be addressed.
Sustainability 2021, 13(18), 10021; https://0-doi-org.brum.beds.ac.uk/10.3390/su131810021
Submission received: 18 July 2021
/
Revised: 29 August 2021
/
Accepted: 31 August 2021
/
Published: 7 September 2021
(This article belongs to the Topic Toward the New Era of Sustainable Design, Manufacturing and Management)
Abstract
:Despite the substantial attention paid to green growth in recent years, how to achieve green growth is still underexamined because it is usually advocated as a political motto or development scheme at the macro level. This study aims to scrutinize the meanings of green growth, growth statuses, and growth paths at the corporate level. Meanwhile, eco-process, eco-product, and eco-system innovations were reviewed, and an adoption strategy that involves the concept of life cycle was put forward to support the choice of suitable eco-innovations and to realize micro-level green growth. Finally, 54 enterprises out of the top 500 enterprises in China were used for a multi-case study. The results demonstrate that the improvements in energy consumption were better than those of greenhouse gas (GHG) emissions in the sample enterprises. However, only five firms achieved continuous green growth. For the majority of the enterprises, their significant economic growth was not certainly related to evident drops in unit energy consumption and GHG emissions. In addition, four firms obtained continuous grey growth, and the enterprises in manufacturing sectors exhibited inferior eco-efficiency. Corporate growth statuses and paths should not only be determined by considering a single environmental or economic measure. Enterprises in manufacturing sectors must develop specific eco-innovations that can greatly enhance their environmental performance. This study adds to the literature by expounding micro-level green growth as well as its relation to eco-innovations. This study also offers a quantitative and integrated view to advance corporate eco-innovations and green development.
1. Introduction
Green growth has recently gained considerable interest [1,2]. As a subset of sustainable development, green growth is envisioned to integrate the economic and environmental pillars into one policy planning process [3]. It is also assumed to sustain economic growth while lessening or maintaining the related environmental burdens at a satisfactory level [4,5,6]. At present, green growth is typically adopted as a development scheme at the macro level. Existing studies center on the projected direction of green growth, but they are inadequate, owing to the complex environment–economy system and distinct views [7]. The link between green growth and its expected outcomes also warrants clarification [8,9,10]. Barriers from multiple perspectives should be addressed by identifying the breakthrough point.
To attain sustainability in both business and society, green growth must be actualized at the enterprise level [11,12]. Different from the universal concept of green growth at the macro level, this study introduced the term micro-level green growth to denote the vision of corporate green development. The transition toward macro-level green growth cannot be achieved without micro-level green growth [13]. Measurable criteria for what passes as green growth and for guiding corporate practices are difficult to specify at the macro level [1]. Investigating green growth at the enterprise level is thus crucial, and two gaps in the literature must be filled urgently.
Though green development at the enterprise level has been widely promoted, studies on micro-level green growth are scant. First, corporate operations take into account environmental concerns such as sustainability and corporate social responsibility. Nonetheless, many enterprises simply intend to meet legal requirements although doing so could compromise their economic profits [14]. This practice is inconsistent with the intention of boosting green growth. Second, the related literature concentrates on explicit technical and business development to advance corporate green growth [12,15]. Such a focus may lead to confusion and may even be deceiving because specific understanding on whole growth statuses and paths is lacking. Third, inspired by the concepts of circular economy, industrial ecology, and industrial symbiosis, the term of green enterprise is introduced to represent the micro-level constituent unit [16]. However, these enterprises are generally bound up in a closed industrial system, and a dynamic and independent view is lacking to recognize these emerging entities. Moreover, related concepts such as corporate sustainability are also proposed in some studies, yet at the enterprise level, this philosophy is mainly used to promote macro-level governance [17]. This cannot directly guide corporate green development. In conclusion, a comprehensive knowledge architecture of micro-level green growth is a prerequisite to inform and design corporate growth strategies.
Green growth through the adoption of eco-innovations remains challenging. Eco-innovations deliver new drivers for environmental improvements, and they are viewed as key methods of realizing green growth [9,18,19]. However, these innovations should be appropriate to move green growth beyond the eco-centric angles of past sustainability paradigms, thus necessitating a stabilization of economic activity. The literature deeply explores individual eco-innovation programs and related factors such as determinants, drivers, and barriers [12,20]. To the best of the authors’ knowledge, no study examines eco-innovations specifically in the context of achieving micro-level green growth. A systematic adoption strategy is required to support decision makers in understanding and conducting eco-innovations.
To address the aforementioned gaps, this study scrutinized the meanings of green growth along with its growth statuses and paths at the enterprise level. A total of three types of eco-innovations were reviewed systematically, and an eco-innovation adoption strategy was put forward while accounting for the concept of life cycle. A multi-case study based on 54 leading Chinese companies was then performed to verify the applicability of the proposed framework.
This study offers three major contributions. First, the meanings of micro-level and macro-level green growth were carefully juxtaposed. With this comparison, a bridge from regional (macro) green development to industrial (micro) green growth is established. Second, a comprehensive understanding of micro-level green growth was presented to help corporate decision makers quantitatively determine growth statuses and detail growth paths. Third, eco-innovations were integrated into micro-level green growth by devising an adoption strategy, which then provides an environment–economy view for realizing eco-innovations.
2. Materials and Methods
Green growth is advocated by top multilateral organizations and is considered to be a national or international policy. Green growth at the macro level is not explored deeply in this study because of its intricacies and debates. Rather, this study focuses on micro-level green growth, which is at the enterprise level. Green growth is promoted to achieve resource-efficient, clean, and resilient growth processes in the long term [3]. Simply put, green growth signifies a developmental status in which economic and environmental performances must be balanced within a specified period. Corporate economic and environmental performances are concurrently focused on. To accurately define micro-level green growth and corporate growth statuses and paths, the following three quantitative indicators were introduced:
- (a)
- Total Net Profits of Enterprise (CP): Corporate investment costs, incomes, and net profits are usually used to denote corporate economic performance [21]. CP during a specified period represents the ultimate earnings of an enterprise, so it was viewed as the primary indicator to represent corporate economic growth.
- (b)
- Total Environmental Impacts of Enterprise (EF): Environmental performance can be quantified by keeping track of all environmental consumption and emission, such as energy consumption, non-product output, material use, and pollutant release within a specified period [22]. These indicators can reflect the environmental problems caused by enterprises, but they do not amount to actual environmental impacts. In this study, EF was used to represent the absolute environmental performance of enterprises. The standard of life cycle assessment (LCA) states that the EF value can be computed by considering the characterization and normalization factors of each kind of energy, material consumption, and environmental emission from all of the production and operational processes of one enterprise [23]. Taking material use as an example, the EF value can be calculated by accumulating the environmental impacts of material production, transport, processing, and even final disposal. It is noted that all related processes should be considered if possible, and the environmental impacts of each process can be acquired from background databases (e.g., ecoinvent, Gabi) or actual measurements.
- (c)
- Corporate Eco-Efficiency (CEE): Eco-efficiency is a typical measurement of sustainability. High eco-efficiency means generating more economic profits with less environmental impact [24]. CEE is the economic profit per unit of environmental impact [25]. It was introduced here to indicate corporate growth quality from an environment–economy perspective.
Through a detailed literature review, the specific meanings of micro-level and macro-level green growth were discerned on the basis of the three aforementioned indicators. Accounting for the possible values of the three indicators, different growth statuses and paths were listed and classified. Three types of eco-innovation were then thoroughly reviewed by referring to the circulated review articles in the past ten years. Based on the concept of life cycle, an eco-innovation adoption strategy was put forward from the perspective of balancing corporate economic and environmental performances.
The applicability of the proposed framework in identifying growth statuses and paths and adopting eco-innovations was validated. A total of 54 Chinese enterprises were chosen out of the top 500 enterprises in 2020 for a multi-case study. The basic information and dominant indicators of the selected enterprises are presented in Tables S1–S3 in the Supplementary Materials. There are five points that must be noted. First, the listed enterprises realized substantial economic growth, and most of them remain on the list of the top 500 enterprises every year. Whether they also attained green growth is unexplored, though. They are thus representative cases for validating the proposed framework. Second, the remaining 446 enterprises were excluded because their continuous environmental performance could not be accessed. Third, descriptions of the eco-innovations adopted by the selected enterprises are available, but distinguishing their contributions to corporate economic and environmental performance is difficult. All of the implemented eco-innovations were merely qualitatively analyzed and encapsulated in the case study. Fourth, as the thorough and continuous environmental reports of most enterprises were published by 2016, the development status of every enterprise of that year was used as a reference to explore their growth statuses and paths during 2017–2020. Finally, the CP, energy consumption, and greenhouse gas (GHG) emissions were the key performance indicators to obtain the assessment results in the case study because no enterprises disclosed all of their consumption and emission data. Therefore, the EF indicator is simply represented as energy consumption and GHG emissions in the case study.
3. Results
This section interprets the research results in three parts. The first part provides the meanings of micro-level green growth and the growth statuses and paths of enterprises. The second part reviews the adoption strategy of eco-innovations. The third part explains the growth situations of the chosen enterprises.
3.1. Micro-Level Green Growth
To the best of the authors’ knowledge, micro-level green growth has not yet been systematically and explicitly defined. The meanings of micro-level green growth are expounded through a literature review and through a comparative analysis with macro-level green growth. Growth is an increase in wealth that is estimated in terms of income, production, or living conditions. Green growth can be achieved when economic benefits are gained through environmentally friendly means [4,5]. Green growth is thus the fast growth of green sectors and the degrowth of others [19]. The debate on advocating for growth or degrowth has yet to reach a consensus, but it is inconsequential in the corporate context. Accumulating economic profits is a necessity for the majority of enterprises, so the CP value must be positive when pushing for micro-level green growth. An important distinction is that enterprises should gain acceptable economic profits rather than the hurried pursuit of economic growth. To align with the expectations of macro-level green growth, the idea of micro-level green growth does not necessitate an incessant growth of corporate net profits. A positive CP value is the basic constraint for realizing micro-level green growth.
Another key constraint for attaining economic growth is guaranteeing that natural assets continue to provide the ecosystems the services on which the well-being of people depends [25]. In the context of macro-level green growth, the most widely accepted solution is to prevent the squalor of the natural environment [6]. For example, the total reduction of carbon dioxide is a crucial task for all economies [9]. In the context of micro-level green growth, though, environmental performance should be analyzed from a relative perspective. On the one hand, preventing environmental problems and achieving ecological restoration are the ideal outcomes rather than the requirements at enterprise level. Production without any harmful environmental impacts is nearly impossible [26]. On the other hand, the fundamental goal of promoting micro-level green growth is to improve the CEE value [25]. The absolute reduction of EF may not be ideal. The reduced EF value may be simply considered to be a case of greenwashing when the CEE value does not increase.
From the above discussion, micro-level green growth means a corporate development status in which enterprises can gain reasonable economic profits while alleviating the related environmental burdens or increasing the CEE value. These visions must be considered from a time perspective, as an appropriate period should be set that is based on the actual corporate situation. Green growth entails a long-term commitment; therefore, short-term investments and disadvantageous growth status are tolerable [3].
The foundation for realizing green growth is to precisely determine past growth status [1]. With the conceptual meanings of micro-level green growth as basis, corporate growth status can be quantitatively determined by comparing the values of the three indicators during a specified period. Specifically, CEE should be compared with the average corporate eco-efficiency (ACEE) in the same industry or that of the corporation before the specified period. Micro-level green growth is not an instantaneous state related to a temporal interval. Thus, the real growth status of enterprises can only be identified when the values of the corporate economic and environmental performance are established. Upon learning of the past growth status, the future growth status can be more or less predicted.
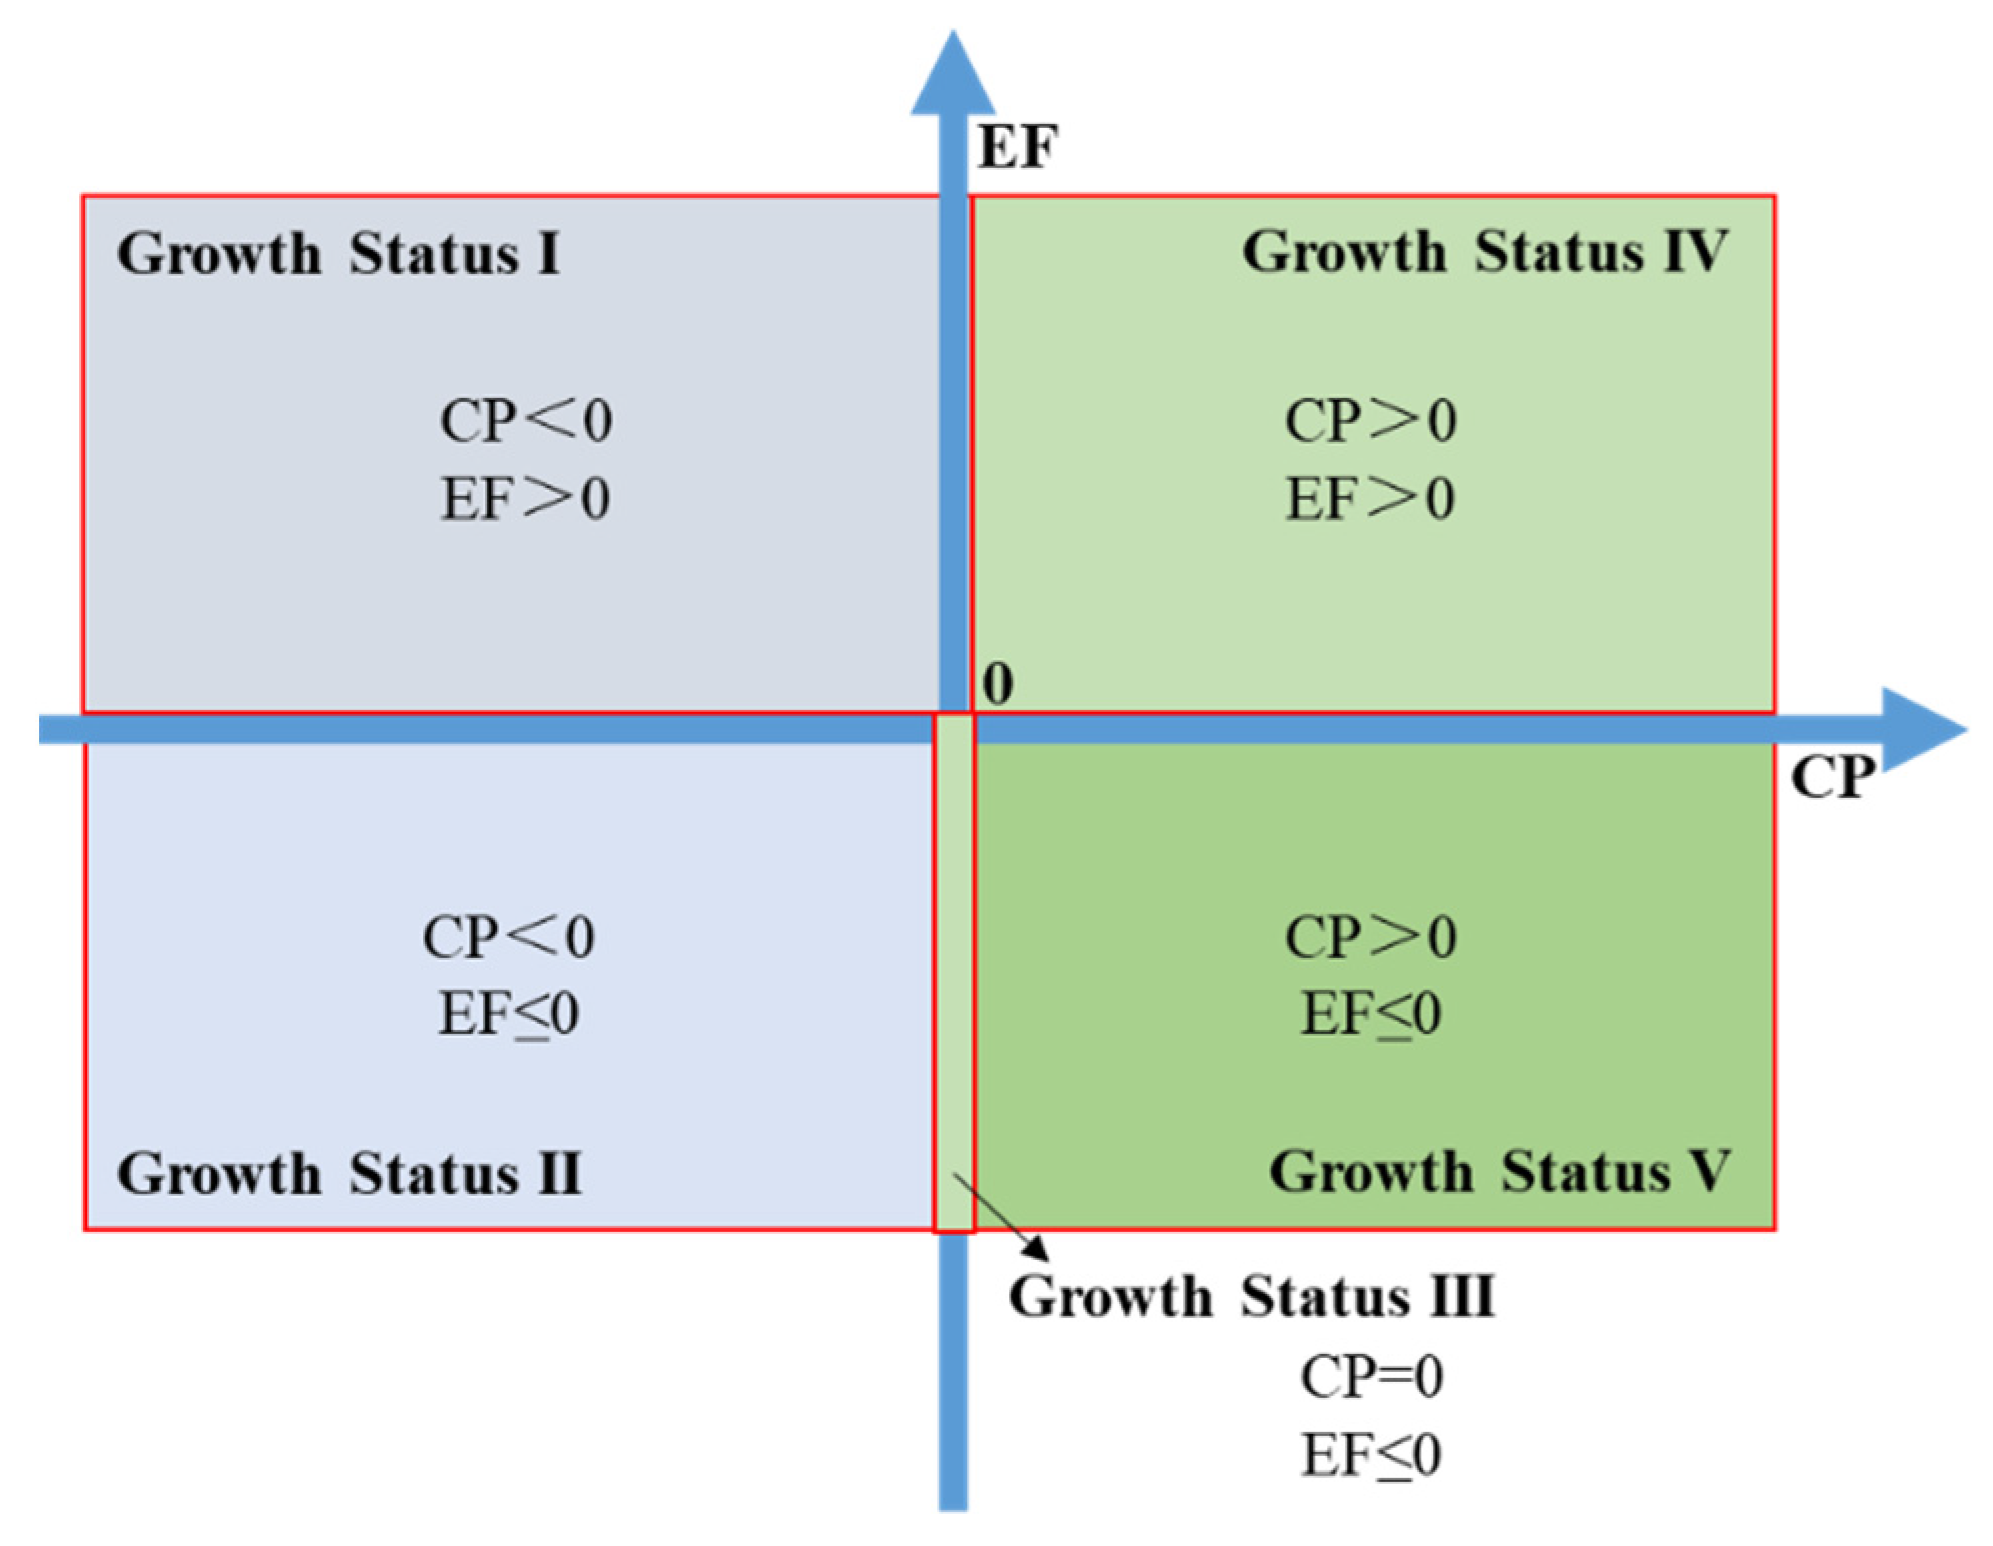
After comparing the possible CP, EF, CEE, and ACEE values in various scenarios, the following five growth statuses were classified (see Figure 1):
- (a)
- Growth Status I: Enterprises do not generate any profits (Status I-2) and even incur economic losses (Status I-1) and cause environmental impacts. This growth status is impracticable, except in cases when it is a transient state where huge economic investments are justifiable.
- (b)
- Growth Status II: Enterprises incur economic losses but do not cause any environmental burdens (Status II-1) and even realize environmental improvements (Status II-2). Corporate activities are environmentally friendly in this growth status, but it is also infeasible because of the economic losses.
- (c)
- Growth Status III: The economic profits are equal to zero, but there are no environmental burdens (Status III-1), and environmental improvements are even achieved (Status III-2). This feasible and environmentally friendly growth status is typical for non-profit entities. This status is akin to the concept of degrowth at the macro level, that is, to reduce environmental problems and social production levels [10,14].
- (d)
- Growth Status IV: Enterprises generate economic profits and cause environmental impacts. In this scenario, CEE and ACEE are important to determine the actual growth status. If the CEE value is less than that of ACEE, then this growth status is regarded as grey growth (Status IV-1). Otherwise, it is green growth (Status IV-2), given that the corporate green degree is beyond than average.
€ Growth Status V: Enterprises gain economic profits by preventing undesirable environmental outcomes (Status V-1) and even enhancing environmental performance (Status V-2). This is the best and greenest growth status, and it is commonly perceived as genuine green growth. Enterprises can conduct profitable production without any adverse environmental impacts [1].
The above five growth statuses exemplify the static development situation of an enterprise within a specified period. To attain green growth, enterprises must sustain their green growth status or progress from a low-order growth status to a high-order one. Figure 1 depicts five growth statuses (Status I to V) and ten sub-statuses in past and future growth scenarios, respectively. Likewise, CP, EF, CEE, and ACEE are the determinants of corporate growth paths. Table 1 lists seven growth paths by comparing the values of these indicators in past and future scenarios. Different sub-paths also arise in each classified growth path, and they make distinct contributions to the growth outcomes (e.g., weak or strong) and duration (e.g., continuous or jumping transitions between low-order and high-order growth statuses).
By comparing the differences between past and future growth statuses, the following seven growth paths were proposed:
- (a)
- Genuine Green Growth Path: This path consists of two sub-paths. The best growth path is to reach Status V from any other growth status. Here, enterprises can generate reasonable economic profits, prevent any environmental problems, and even realize ecological restoration, such as carbon sequestration. Another one is to achieve Status III from Status I or II, which implies turning a profit for lossmaking enterprises. Enterprises continue to pursue profitable growth means, but no environmental problem will arise in the future growth scenario.
- (b)
- Green Growth Path: This path highlights the transitions from a non-profitable status to profitable one or to transitions from a profitable status to another profitable status. The CEE value in the future scenario can be higher than in the past scenario. This growth path is a likely development direction for most enterprises and governments, as constant CEE improvements are more practical and feasible [11,12].
- (c)
- Acceptable Growth Path: Non-profitable enterprises that are willing to prevent serious environmental problems and who are even willing to undergo ecological restoration take this path. In this study, this growth path is viewed “acceptable” because it is not a desirable path for enterprises in pressing need of gaining economic profits.
- (d)
- Unnecessary Growth Path: This path characterizes the transition from green and genuine green growth statuses to Status III. It is “unnecessary” because changing to a zero-growth path despite environmental improvements is pointless.
- (e)
- Grey Growth Path: This path represents non-green development means of generating economic profits while harming the environment. More economic profits bring about more serious environmental problems as well.
- (f)
- Infeasible Growth Path: This path is the total opposite of the profit earning goals of most corporations. Nevertheless, environmental problems can be alleviated in this path.
- (g)
- Uncertain Growth Path: In this path, the relationships between the values of CP, EF, CEE, and ACEE are undefined. Owing to the existing uncertainty, this growth path can be only determined after comparing the actual values of key economic and environmental indicators. Once the relationships are recognized, this growth path can be any of the aforementioned six paths.
3.2. Eco-Innovations for Micro-Level Green Growth
Most studies indicate that eco-innovations include process and product innovations as well as other defined innovations, such as service, business model, management, marketing, and organizational innovations [27]. Apart from process and product innovations, the other mentioned innovations have no clear boundaries. They integrate corporate internal processes and even the external activities of another group, which can be viewed as integrated and systematic innovations. In this study, eco-innovations were categorized as eco-process innovations, eco-product innovations, and eco-system innovations.
- (a)
- Eco-process innovation: The application of innovative ideas to reduce the consumption of energy and raw materials and hazardous emissions when conducting internal activities [28]. Process innovations are typically divided into clean and end-of-pipe technologies [29]. Green growth can be reached by saving costs from individual processes and by alleviating related environmental burdens.
- (b)
- Eco-product innovation: The application of innovative ideas for the design, manufacturing, and marketing of new products and the greenness of which greatly outperforms that of conventional products [28,30]. This eco-innovation covers actions for environmental protection such as creating products with less polluting and toxic materials and recyclable or decomposable products [31]. Eco-product innovations are immersed in internal and even external corporate activities during the product life cycle.
- (c)
- Eco-system innovation: Involves identifying, implementing, and monitoring groundbreaking ideas that strengthen the environmental performance and competitiveness of corporations and even virtual organizations (e.g., supply chain) [30]. Eco-system innovation pertains to technological systems and developments involving the market and even behavioral changes. Substantial attention is paid to green supply chain management, new manufacturing paradigms (e.g., smart manufacturing), and new business models such as product service systems [32,33].
In the context of micro-level green growth, eco-innovations are expected to boost sales and profits on top of environmental improvements [25]. Adopting eco-innovations to attain micro-level green growth is an efficient and long-term practice that is challenging for most corporate decision makers. Figure 2 illustrates the general strategy of adopting eco-innovations to realize micro-level green growth.
Referring to Figure 2, the main steps for adopting eco-innovations are formulated. First, corporate decision makers must identify past growth statuses by determining the values of CP, EF, CEE, and even ACEE within a specified period. Second, it is possible that not all enterprises need to realize green growth urgently. As past growth statuses can also impact future development focuses of corporations, decision makers should come up with future growth goals on the basis of identifying past growth statuses. Third, by associating the past growth statuses with future growth goals, decision makers can determine if eco-innovations are required to accomplish these future growth goals. If they are necessary, the following steps can be subsequently conducted. Otherwise, the strategy ends.
Each enterprise has its distinctive characteristics, such as technical levels and innovative skills, and these characteristics determine the options of alternative eco-innovations. Therefore, decision makers should focus on the types of eco-innovations that are available. Various growth scenarios with distinct eco-innovations must be distinguished to proactively identify a possible growth path. Table 2 encapsulates the predicted economic and environmental performances of the three types of eco-innovations. If all of the alternative eco-innovations are infeasible, then the strategy ends.
Based on the aforementioned steps, corporate decision makers can choose and apply the appropriate eco-innovations into their business practices. After a certain amount of time, a performance measurement is conducted to determine whether the eco-innovations can fulfill the expected growth goal and what the degree of green growth is. The economic performance of eco-innovations mostly relies on investment costs and gained economic profits. Current cost accounting is extended from the life cycle perspective and now concerns investment costs, operating costs, and environmental costs during a product’s estimated lifetime [33]. Hence, a cost–benefit analysis of various eco-innovations should take the concept of life cycle into account in order to quantitatively and completely verify whether economic growth can be achieved by adopting eco-innovations. Likewise, LCA should also be adopted to measure environmental performance. LCA is a comprehensive method that quantifies the environmental impacts of a product, process, or system by tracking the material and energy flows from raw material extraction through the manufacturing process and use to the end of life [35]. There are three points that must be noted here. First, the results of cost–benefit analysis and LCA on eco-innovations can be transformed into actual CP and EF values. Second, short- and long-term performances must be reconciled when adopting eco-innovations to realize green growth [3]. Third, rebound effects, such as additional demands for goods and services, should be measured to gauge the progress of eco-innovations toward achieving green growth [36].
3.3. Results of the Case Study
3.3.1. Implemented Eco-Innovations
To improve environmental performance, the 54 enterprises conducted various eco-innovations in recent years. These eco-innovations were briefly mentioned in their social responsibility or sustainable development reports. Recognizing the contributions of these eco-innovations to green growth from the qualitative descriptions is difficult. Nevertheless, three findings were derived. First, eco-process innovations are the dominant methods used to attain environmental performance improvements for the selected enterprises. By contrast, the eco-product and eco-system innovations that were introduced are relatively few. The reason for this may be that their design and implementation are more challenging. Second, the implemented eco-innovations mainly belong to category of incremental innovations, which are improved schemes rather than disruptive technologies and management and business models. Third, an increasing number of enterprises have begun to adopt new information and communication technology (ICT) to develop innovative products and services and to convert to green industries.
3.3.2. Growth Trends of the Three Indicators
With the public data as a base (see Tables S1–S3), the growth statuses and paths of the 54 enterprises (denoted as C1 to C54) were analyzed and compared. Based on the statistical analysis of the economic and environmental performance of the enterprises, the growth trends of the three indicators are presented in Table S4 in the Supplementary Materials. It is noted that the public economic data represent the total net profits of one enterprise within one year, and the public environmental data represent the total energy consumption and GHG emissions from all of the counted processes of one enterprise within one year.
Table S4 presents four important findings. First, most of the enterprises exhibited strong profitability in the last five years. Only five enterprises (C20, C33, C44, C45, and C51) gained negative profits that specific time frame. A total of 19 enterprises gained continuous economic growth from 2016 to 2020, and 35 enterprises had significant growth trends in CP in recent years. Second, 26 enterprises have made their energy consumption and GHG emissions public simultaneously. Among them, 13 enterprises had the same growth trends of those two indicators in recent years. Thus, corporate energy consumption is closely linked with GHG emissions in industrial practices. Third, only 10 enterprises had increased energy consumption in recent years. There were 21 enterprises that had a significant decrease in their energy consumption in recent years. Around half of the enterprises has increased GHG emissions in recent years. Evidently, the outcomes of reducing energy consumption are better than those of reducing GHG emissions in the selected enterprises. Finally, eight enterprises had the same growth trends for their CP and energy consumption, and fourteen enterprises had the same growth trends for their CP and GHG emissions. The growth trends of the three indicators are inconsistent in other enterprises. Jointly, these findings imply that substantial economic growth and the implementation of eco-innovations do not necessarily lead to green growth, which heavily relies on an enterprise’s actual situation. Corporate growth status and path should not only be determined by accounting for a single economic or environmental indicator.
3.3.3. Growth Statuses of the Selected Enterprises
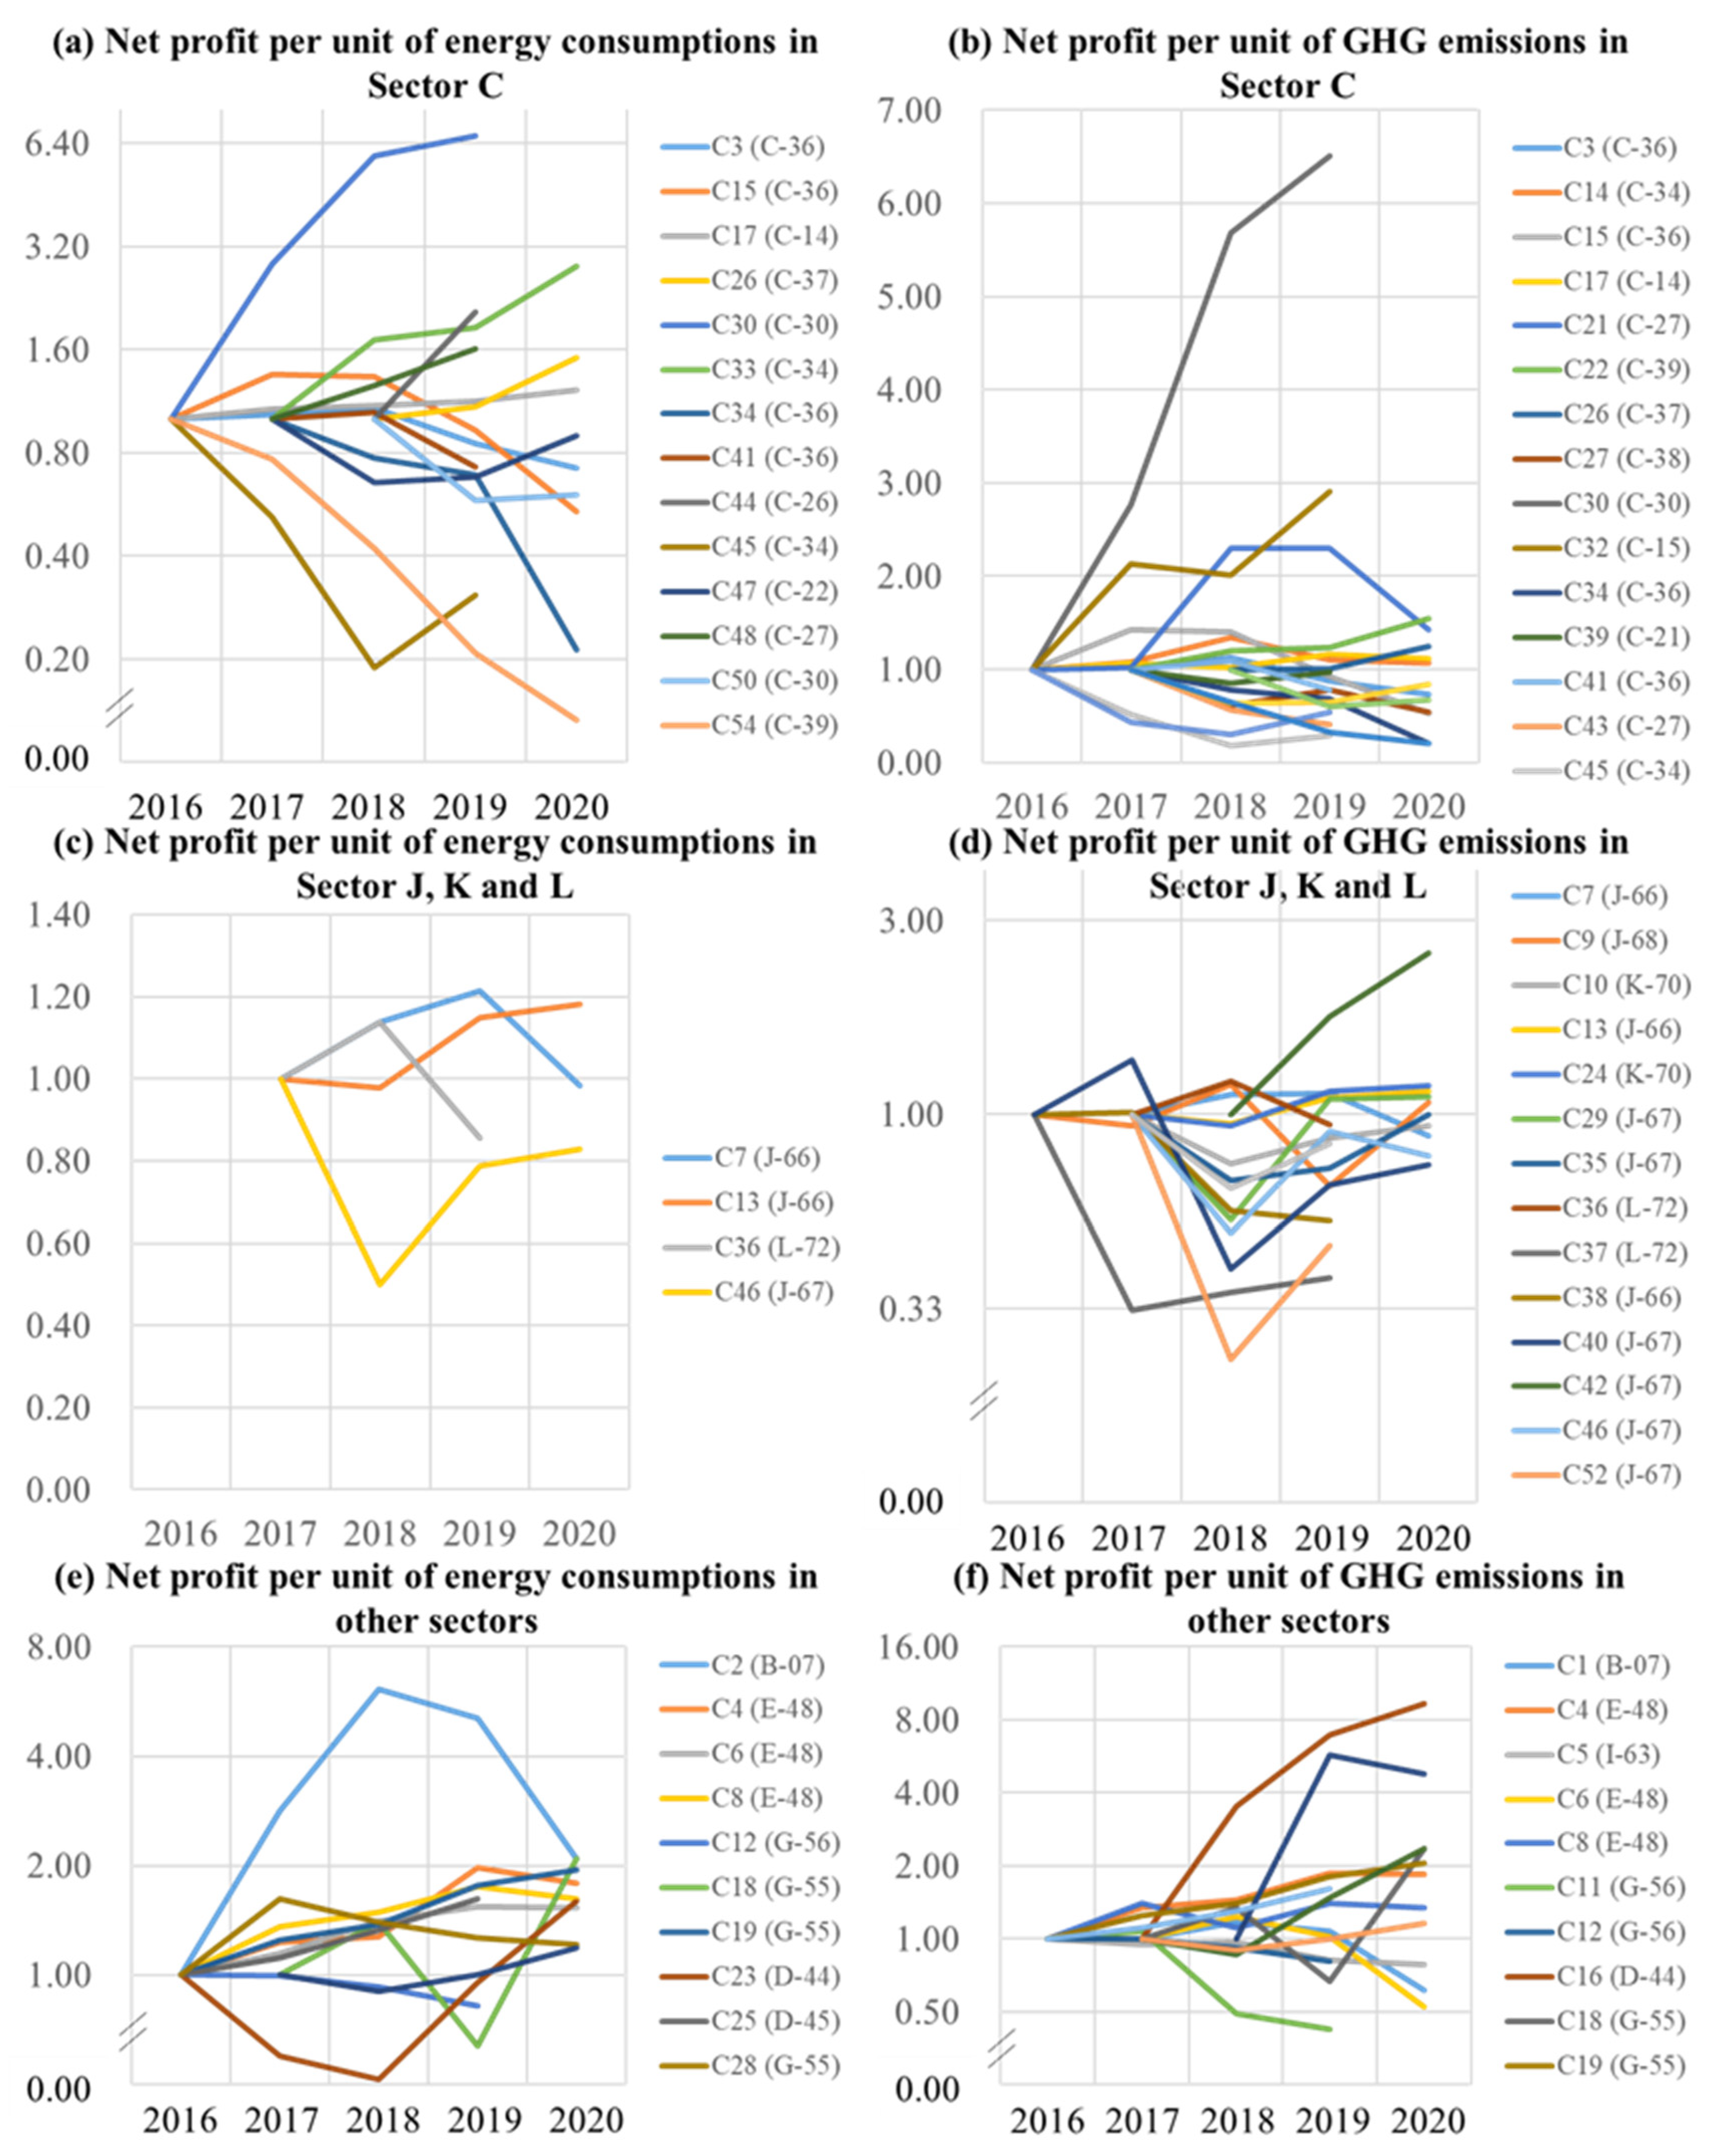
C20, C33, C44, C45, and C51 incurred negative profits, consumed energy, and caused GHG emissions in specific years. Based on the categorized corporate growth statuses in Figure 1, their growth statuses in those years are Status I-1 (see Figure 1), whereas their growth statuses in other years are Status IV. Moreover, most of the enterprises generated economic profits, consumed energy, and caused GHG emissions in every year. The annual growth status of these enterprises is Status IV. Their annual growth status is unchanged, but the specific growth paths of each enterprise differ according to the three indicators and their size relationships. In particular, CEE was used to identify the growth paths of the 54 enterprises. Owing to data availability, two kinds of CEE, rather than a comprehensive CEE, were separately calculated. These are the net profits per unit of energy consumption (CEEENERGY) and the net profits per unit of GHG emissions (CEEGHG). The annual values of CEEENERGY and CEEGHG of each enterprise are listed separately in Tables S5 and S6 in the Supplementary Materials. The recent trends are depicted in Figure 3. Enterprises from Sectors J (financial sector), K (real estate sector), and L (leasing and business service sector) had higher eco-efficiency. Most of the enterprises are from Sector C (manufacturing sector). The values of CEEENERGY and CEEGHG greatly varied among the remaining enterprises from the other sectors. Therefore, the 54 enterprises were divided into three categories in Figure 3. Less than 40% of the enterprises achieved continuous growth of either CEEENERGY or CEEGHG in recent years. Only four enterprises (C19, C25, C26, and C30) attained continuous growth of CEEENERGY and CEEGHG simultaneously. The profitable enterprises have not exhibited the same level of green growth continuously.
3.3.4. Growth Paths of the Selected Enterprises
Table 1 presents three growth paths, i.e., grey, green, and uncertain growth paths, changing from Status I-1 or Status IV to Status IV, and changing from Status I-1 to Status I-1. In addition, an infeasible growth path is noted when changing from Status IV to Status I-1. The uncertain growth paths can be recognized by comparing the CEEENERGY and CEEGHG values of the enterprises. Table 3 encapsulates the growth paths of the 54 enterprises in combination with the calculated values of CEE (see Tables S5 and S6). There are three conclusions that can be drawn after a comparative analysis of the growth paths in Table 3. First, the enterprises have achieved green growth slightly more often than grey growth in recent years. A high degree of fluctuation is observed in realizing green growth, and this finding is validated by analyzing the trends of CEEENERGY and CEEGHG in Figure 3. Second, taking CEEENERGY into account, only C17, C19, C25, C30, and C33 have achieved green growth in recent years. There are five enterprises (C12, C15, C28, C34, and C54) that have continuously achieved grey growth. In terms of CEEGHG, C4, C16, C19, C22, C25, and C30 have realized green growth in recent years, whereas C12, C15, C34, and C54 have continuously achieved grey growth. There are three green enterprises (i.e., C19, C25, and C30) and four grey ones (i.e., C12, C15, C34 and C54) that can consistently be identified based on the proposed framework. The green enterprises are from non-manufacturing sectors, whereas the grey ones are from manufacturing sectors. Third, the eco-efficiency and growth results of the green and grey enterprises are greatly affected by the fluctuations in economic growth. The green enterprises generated more profits with increased energy consumption and GHG emissions. The net profits of the grey enterprises have continuously decreased in recent years, but their energy consumption and GHG emissions have not. Other eco-innovations must be proposed to completely improve the environmental performance of enterprises.
4. Discussion
4.1. Relationships between Macro-Level and Micro-Level Green Growth
Undeniably, green growth deserves to be advocated from the view of sustainable development. Macro-level green growth provides essential requirements to promote related investment, innovation, and regulation formulations, in which sustaining certain economic growth and reducing environmental problems are expected to occur simultaneously. Some innovations, investments, and incentives can benefit the environment, but their impact on actual growth remains uncertain and insignificant in the short term [37]. Macro-level green growth does not tend to achieve the expected outcomes owing to the complexity of the system and weak links with enterprises.
By contrast, micro-level green growth is a corporate development status. It pertains to the anticipated economic and environmental performances within a specified period. On the one hand, real economic profit is required at the micro level unlike at the macro level, where degrowth may be satisfactory [6,7]. On the other hand, the complete reduction of environmental burdens at the macro level matters, of course, but only in terms of an optimal solution for enterprises toward micro-level green growth. Higher eco-efficiency rather than the complete reduction of environmental burdens is acceptable as well [24].
Obviously, these definitions of green growth at different levels should be understood by policy makers and related corporate decision makers. Additionally, coordination within all sectors and entities is more important in prompting macro-level green growth. On the one hand, the vision of micro-level green growth should be widely disseminated and advocated by governments because this can ensure that more sectors and enterprises start to regard green growth as a long-term development strategy. For example, more government incentives and approval should be provided to green enterprises instead of to all of the profitable enterprises when macro-level green growth is the goal [8]. On the other hand, governments and enterprises should seek to establish green industries and expand the cooperation within the ecosystem of green industries because this can ensure that the accumulative economic and environmental performances from individual sectors and enterprises can meet the unified requirements of macro-level green growth.
4.2. Achievement of Micro-Level Green Growth
Enterprises, particularly manufacturing enterprises, are integral parts of modern societies and are interrelated units in attaining macro-level green growth. Green growth should be achieved at an early stage to avoid potential consumption and costs in the long term [18]. Therefore, this study analyzed corporate growth statuses and paths, which are the prerequisites for realizing micro-level green growth. First, Growth Status I, II, and III are unacceptable for most for-profit enterprises; it is also unrealistic for these enterprises to focus on environmental performance improvements. As a result, it is not easy for enterprises at low-order growth statuses to be regarded as key entities for prompting macro-level green growth. Second, most enterprises are in Growth Status IV, which has been also exemplified in the case study. These enterprises should put more effort towards constant CEE improvements and even towards the transition to Growth Status V, which is an ideal and challenging growth status. Genuine green growth is also possible when corporate consumption and environmental emissions can be offset by productions, absorption, and final disposals. This status actually signifies the rapid growth of green sectors and the degrowth of others [19].
Eco-innovations are the main methods for realizing green growth. They set the preferences for launching investments and regulations. Several issues must be addressed when adopting eco-innovations to attain micro-level green growth. First, eco-innovations intend to solve environmental problems while moving beyond eco-centric perspectives. Second, different types of eco-innovations result in varied contributions to corporate economic and environmental performance. For example, developing and using renewable energy sources is suitable for natural resource savings and emission reduction, but these methods do not generate economic profits [9,37]. Developing a product service system can offer a new engine to boost economic growth while also avoiding the extra environmental burdens caused by producing new products [33]. The judgement step determines whether the eco-innovations in the proposed adoption strategy are needed and are suitable for achieving future growth goals. Third, eco-process and eco-product innovations are the fundamentals of improving environmental performance, so technological investment should be directed toward greener technologies [26]. Technological capability at firm level is positively related to the performance of eco-innovations. Therefore, enterprises should emphasize the accumulation of related abilities. Fourth, eco-system innovations concerning non-technical factors are important for eco-process and eco-product innovations to succeed. Decision makers always need to question whether the related innovations can be left to the market [12,25]. Moreover, this case study reveals that individual environmental improvements, such as energy savings or emission reductions, may not represent real growth statuses or paths. The concept of a life cycle must be considered in the designs, adoptions, and evaluations of eco-innovations.
5. Conclusions
This study conducted a systematic analysis on green growth and eco-innovations from the view of enterprises in order to fill in the knowledge gaps between green growth and eco-innovations. Different from the concept of macro-level green growth, more attention should be paid to the improvement of corporate eco-efficiency in the context of micro-level green growth. Gaining reasonable economic profits rather than advocating degrowth is addressed in the corporate context. Meanwhile, eco-innovations need to be recognized by moving beyond eco-centric, short-term, and partial perspectives. Alternative eco-innovations should be adopted based on the guidelines of micro-level green growth.
The proposed corporate growth statuses and paths and adoption strategy of eco-innovations can be also applied to some managerial practices. First, policy makers and corporate decision makers should expand the monitoring range of environmental performance. The improvements of individual environmental indicators are not enough and can even mislead the judgment of real growth status. Second, the proposed methods should be adopted to prove or authorize corporate growth quality, which represents more rational ideas and objective measure of leading enterprises. In addition, more eco-innovations need to be introduced to improve corporate eco-efficiency and to even change corporate growth paths in the long term.
This study has three major limitations, which can be improved in the future research. First, though the adopted indicators can reflect the most pressing concern of micro-level green growth, they cannot precisely and completely reflect corporate economic and environmental performance. The boundaries and scopes of evaluating corporate growth statuses, paths, and eco-innovations should be expanded so as to make sustainable growth decisions. Additionally, significant impact factors should be identified and introduced to ensure the robustness of assessment results. Second, to fill the gap in the literature, this study focused on micro-level green growth. The findings of this study can support corporate green development, but they are not ideal to directly meet the expectations of macro-level green growth. As a result, the joint exploration of macro-level and micro-level green growth should be stressed. Finally, the proposed eco-innovation adoption strategy was not validated in this case study though due to the limitation of using secondary data. Whether the adoption strategy can be applied in practice lacks evidence and/or support. With the fast development of the new generation of ICT, the acquisition, implementation, and evaluation of eco-innovations can be remodeled to break current and traditional barriers.
Supplementary Materials
The following are available online at https://0-www-mdpi-com.brum.beds.ac.uk/article/10.3390/su131810021/s1, Table S1: Total net profits of the selected enterprises, Table S2: Total energy consumption of the selected enterprises, Table S3: Total greenhouse gas emissions of the selected enterprises, Table S4: Growth trends of the three indicators of the selected enterprises, Table S5: Net profits per unit of energy consumption of the selected enterprises, Table S6: Net profits per unit of GHG emissions of the selected enterprises.
Author Contributions
Conceptualization, W.Z.; methodology, W.Z.; validation, F.G.; formal analysis, F.G.; investigation, W.Z.; data curation, W.Z.; writing—original draft preparation, W.Z.; writing—review and editing, F.G. All authors have read and agreed to the published version of the manuscript.
Funding
This study was financially supported by the National Natural Science Foundation of China (nos. 71671180 and 71901194) and the China Postdoctoral Science Foundation (no.2020M671775).
Data Availability Statement
The data are available from the first author upon reasonable request.
Conflicts of Interest
The authors declare no conflict of interest.
References
- Stoknes, P.E.; Rockström, J. Redefining green growth within planetary boundaries. Energy Res. Soc. Sci. 2018, 44, 41–49. [Google Scholar] [CrossRef]
- Capasso, M. Degrowth or Green Growth: A Reflection on the Recent Public Discourse in Norway. Sustainability 2021, 13, 698. [Google Scholar] [CrossRef]
- Hallegatte, S.; Heal, G.; Fay, M.; Treguer, D. From growth to green growth-a framework. Policy Res. Work. Papers 2011, 17841, 1–38. [Google Scholar] [CrossRef] [Green Version]
- Dercon OECD. Towards Green Growth: Monitoring Progress; OECD: Paris, France, 2011. [Google Scholar]
- World Bank. Inclusive Green Growth: The Pathway to Sustainable Development; World Bank: Washington, DC, USA, 2012. [Google Scholar]
- Sandberg, M.; Klockars, K.; Wilén, K. Green growth or degrowth? Assessing the normative justifications for environmental sustainability and economic growth through critical social theory. J. Clean. Prod. 2019, 206, 133–141. [Google Scholar] [CrossRef]
- Jakob, M.; Edenhofer, O. Green growth, degrowth, and the commons. Oxf. Rev. Econ. Policy 2014, 30, 447–468. [Google Scholar] [CrossRef]
- Zhang, D.; Rong, Z.; Ji, Q. Green innovation and firm performance: Evidence from listed companies in China. Resour. Conserv. Recycl. 2019, 144, 48–55. [Google Scholar] [CrossRef]
- Hao, L.N.; Umar, M.; Khan, Z.; Ali, W. Green growth and low carbon emission in G7 countries: How critical the network of environmental taxes, renewable energy and human capital is? Sci. Total Environ. 2020, 752, 141853. [Google Scholar] [CrossRef] [PubMed]
- Sun, Y.; Ding, W.; Yang, Z.; Yang, G.; Du, J. Measuring China’s regional inclusive green growth. Sci. Total Environ. 2020, 713, 136367. [Google Scholar] [CrossRef]
- Song, S.; Hossin, M.A.; Yin, X.; Hosain, M.S. Accelerating Green Innovation Performance from the Relations of Network Potential, Absorptive Capacity, and Environmental Turbulence. Sustainability 2021, 13, 7765. [Google Scholar] [CrossRef]
- Fernando, Y.; Jabbour, C.J.C.; Wah, W.X. Pursuing green growth in technology firms through the connections between environmental innovation and sustainable business performance: Does service capability matter? Resour. Conserv. Recycl. 2019, 141, 8–20. [Google Scholar] [CrossRef]
- Qu, Y.; Yu, Y.; Appolloni, A.; Li, M.; Liu, Y. Measuring green growth efficiency for Chinese manufacturing industries. Sustainability 2017, 9, 637. [Google Scholar] [CrossRef] [Green Version]
- Khmara, Y.; Kronenberg, J. Degrowth in business: An oxymoron or a viable business model for sustainability? J. Clean. Prod. 2018, 177, 721–731. [Google Scholar] [CrossRef]
- Machiba, T. Eco-innovation for enabling resource efficiency and green growth: Development of an analytical framework and preliminary analysis of industry and policy practices. Int. Econ. Resour. Effic. 2011, 7, 371–394. [Google Scholar] [CrossRef]
- Romero, D.; Molina, A. 2012. Green virtual enterprise breeding environments: A sustainable industrial development model for a circular economy. In Working Conference on Virtual Enterprises; Springer: Berlin/Heidelberg, Germany, 2012; pp. 427–436. [Google Scholar]
- Wilshusen, P.R.; MacDonald, K.I. Fields of green: Corporate sustainability and the production of economistic environmental governance. Environ. Plan. A Econ. Space 2017, 49, 1824–1845. [Google Scholar] [CrossRef]
- Aghion, P.; Hemous, D.; Veugelers, R. No green growth without innovation. In Bruegel Policy Brief; Bruegel: Bruegel, Brussels, 2009. [Google Scholar]
- Jänicke, M. “Green growth”: From a growing eco-industry to economic sustainability. Energy Policy 2012, 48, 13–21. [Google Scholar] [CrossRef]
- Pichlak, M. The Drivers of Technological Eco-Innovation—Dynamic Capabilities and Leadership. Sustainability 2021, 13, 5354. [Google Scholar] [CrossRef]
- Henri, J.F.; Journeault, M. Eco-control: The influence of management control systems on environmental and economic performance. Account. Organ. Soc. 2010, 35, 63–80. [Google Scholar] [CrossRef]
- Saufi, N.A.A.; Daud, S.; Hassan, H. Green growth and corporate sustainability performance. Procedia Econ. Financ. 2016, 35, 374–378. [Google Scholar] [CrossRef] [Green Version]
- ISO. ISO14040: Environmental Management—Life Cycle Assessment—Principles and Framework; British Standards Institution: London, UK, 2016. [Google Scholar]
- Mavi, R.K.; Saen, R.F.; Goh, M. Joint analysis of eco-efficiency and eco-innovation with common weights in two-stage network DEA: A big data approach. Technol. Forecast. Soc. Chang. 2018, 144, 553–562. [Google Scholar] [CrossRef]
- Beltramello, A.; Haie-Fayle, L.; Pilat, D. Why new business models matter for green growth. In OECD Green Growth Paper; OECD: Paris, France, 2013. [Google Scholar] [CrossRef]
- Lorek, S.; Spangenberg, J.H. Sustainable consumption within a sustainable economy–beyond green growth and green economies. J. Clean. Prod. 2014, 63, 33–44. [Google Scholar] [CrossRef]
- Tseng, M.L.; Wang, R.; Chiu, A.S.; Geng, Y.; Lin, Y.H. Improving performance of green innovation practices under uncertainty. J. Clean. Prod. 2013, 40, 71–82. [Google Scholar] [CrossRef]
- Wong, S.K.S. The influence of green product competitiveness on the success of green product innovation: Empirical evidence from the Chinese electrical and electronics industry. Eur. J. Innov. Manag. 2012, 15, 468–490. [Google Scholar] [CrossRef]
- Triguero, A.; Moreno-Mondéjar, L.; Davia, M.A. Drivers of different types of eco-innovation in European SMEs. Ecol. Econ. 2013, 92, 25–33. [Google Scholar] [CrossRef]
- Abdullah, M.; Zailani, S.; Iranmanesh, M.; Jayaraman, K. Barriers to green innovation initiatives among manufacturers: The Malaysian case. Rev. Manag. Sci. 2016, 10, 683–709. [Google Scholar] [CrossRef]
- Cheng, C.C.; Yang, C.L.; Sheu, C. The link between eco-innovation and business performance: A Taiwanese industry context. J. Clean. Prod. 2014, 64, 81–90. [Google Scholar] [CrossRef] [Green Version]
- Jaggernath, R.; Khan, Z. Green supply chain management. World J. Entrep. Manag. Sustain. Dev. 2015, 11, 37–47. [Google Scholar] [CrossRef]
- Zhang, W.; Guo, J.; Gu, F.; Gu, X. Coupling life cycle assessment and life cycle costing as an evaluation tool for developing product service system of high energy-consuming equipment. J. Clean. Prod. 2018, 183, 1043–1053. [Google Scholar] [CrossRef]
- Green, K.W.; Zelbst, P.J.; Meacham, J.; Bhadauria, V.S. Green supply chain management practices: Impact on performance. Supply Chain Manag. Int. J. 2012, 17, 290–305. [Google Scholar] [CrossRef]
- Zhang, W.; Gu, F.; Guo, J. Can smart factories bring environmental benefits to its products? A case study of household refrigerators. J. Ind. Ecol. 2019, 23, 1381–1395. [Google Scholar] [CrossRef]
- Rosenbaum, E. Green Growth—Magic Bullet or Damp Squib? Sustainability 2017, 9, 1092. [Google Scholar] [CrossRef] [Green Version]
- Yan, Z.; Zou, B.; Du, K.; Li, K. Do renewable energy technology innovations promote China’s green productivity growth? Fresh evidence from partially linear functional-coefficient models. Energy Econ. 2020, 90, 104842. [Google Scholar] [CrossRef]
Figure 1.
Corporate growth statuses categorized by economic and environmental performance.

Figure 2.
General strategy of adopting eco-innovations to realize micro-level green growth.

Figure 3.
Recent trends of every enterprise’s eco-efficiency.


Table 1.
Corporate growth paths during a specified period.
| Future | Status I-1 | Status I-2 | Status II-1 | Status II-2 | Status III-1 | Status III-2 | Status IV-1 | Status IV-2 | Status V-1 | Status V-2 | |
|---|---|---|---|---|---|---|---|---|---|---|---|
| Past | |||||||||||
| Status I-1 | Uncertain | Uncertain | Uncertain | Genuine green | Grey | Green | Genuine green | ||||
| Status I-2 | Infeasible | Infeasible | |||||||||
| Status II-1 | Infeasible | Uncertain | |||||||||
| Status II-2 | |||||||||||
| Status III-1 | Infeasible | Acceptable | |||||||||
| Status III-2 | |||||||||||
| Status IV-1 | Uncertain | ||||||||||
| Status IV-2 | Unnecessary | Uncertain | |||||||||
| Status V-1 | |||||||||||
| Status V-2 | |||||||||||
Table 2.
Predicted economic and environmental performances of eco-innovations.
| Eco-Innovations | Expected Economic Performance | Expected Environmental Performance | References | |
|---|---|---|---|---|
| Process | Clean technology | Saving costs due to higher production, energy efficiency, and avoidance of end treatment. | Reducing environmental impacts of individual activity due to higher production efficiency and less wastes. | [20,29] |
| EOP technology | Saving costs due to materials, energy recycling, and emissions reduction. | Reducing environmental impacts by the recovery and final disposal of waste and emissions. | ||
| Product | New product with low consumption and emissions | Gaining higher profits due to higher sales; saving costs by recovering products; obtaining public subsidies and fiscal incentives. | Reducing the environmental impact of a product during its life cycle. | [28,31] |
| Recyclable or decomposable product | Reducing environmental impacts by the substitution of secondary materials, parts, and components. | |||
| System | Green supply chain management | Saving costs associated with supply chain collaboration; gaining higher profits due to greater supply chain competitiveness. | Reducing environmental impacts due to efficiency improvements, business innovations, creating value from “waste”, and so forth. | [32,34] |
| Business model innovation | Gaining higher profits by attracting more customers and by delivering valuable functionality and services. | |||
| Manufacturing paradigm innovation | Gaining higher profits due to improved procedure, management, product, and service. | |||
Table 3.
Growth paths of the selected enterprises.
| Growth Paths | Grey Growth Path | Green Growth Path | Infeasible Growth Path | |
|---|---|---|---|---|
| Time | ||||
| CEEENERGY is taken as assessment reference | 2017 | C12, C23, C45, C54 | C2, C3, C4, C6, C8, C15, C17, C19, C20, C25, C28, C30, C44 | |
| 2018 | C12, C13, C15, C23, C28, C31, C34, C45, C46, C47, C54 | C2, C3, C4, C6, C7, C8, C17, C18, C19, C25, C30, C33, C36, C41, C48 | C51 | |
| 2019 | C2, C3, C12, C15, C18, C28, C34, C36, C41, C50, C54 | C4, C6, C7, C8, C13, C17, C19, C20, C23, C25, C26, C30, C31, C33, C44, C45, C46, C47, C48, C51 | ||
| 2020 | C2, C3, C4, C6, C7, C8, C15, C20, C28, C34, C54 | C13, C17, C18, C19, C23, C26, C31, C33, C46, C47, C50 | ||
| CEEGHG is taken as assessment reference | 2017 | C5, C9, C12, C37, C45, C49 | C4, C8, C11, C14, C15, C17, C19, C21, C25, C30, C32, C38, C40 | |
| 2018 | C8, C10, C11, C12, C13, C15, C17, C23, C24, C27, C29, C31, C32, C34, C35, C38, C39, C40, C43, C45, C46, C47, C49, C52, C53, C54 | C1, C3, C4, C5, C6, C7, C9, C14, C16, C18, C19, C21, C22, C25, C30, C36, C37, C41 | C51 | |
| 2019 | C1, C3, C5, C6, C9, C11, C12, C14, C15, C18, C21, C34, C36, C38, C41, C43, C50, C54 | C4, C7, C8, C10, C13, C16, C17, C19, C20, C22, C23, C24, C25, C26, C27, C29, C30, C31, C32, C35, C37, C39, C40, C42, C45, C46, C47, C49, C51, C52, C53 | ||
| 2020 | C1, C3, C4, C5, C6, C7, C8, C14, C15, C17, C20, C21, C27, C34, C46, C54 | C9, C10, C13, C16, C18, C19, C22, C23, C24, C26, C29, C31, C35, C40, C42, C47, C50 |
Publisher’s Note: MDPI stays neutral with regard to jurisdictional claims in published maps and institutional affiliations. |
© 2021 by the authors. Licensee MDPI, Basel, Switzerland. This article is an open access article distributed under the terms and conditions of the Creative Commons Attribution (CC BY) license (https://creativecommons.org/licenses/by/4.0/).
Share and Cite
MDPI and ACS Style
Zhang, W.; Gu, F. Towards Micro-Level Green Growth: A Framework to Recognize Corporate Growth Status, Path and Adopt Eco-Innovations. Sustainability 2021, 13, 10021. https://0-doi-org.brum.beds.ac.uk/10.3390/su131810021
AMA Style
Zhang W, Gu F. Towards Micro-Level Green Growth: A Framework to Recognize Corporate Growth Status, Path and Adopt Eco-Innovations. Sustainability. 2021; 13(18):10021. https://0-doi-org.brum.beds.ac.uk/10.3390/su131810021
Chicago/Turabian StyleZhang, Wujie, and Fu Gu. 2021. "Towards Micro-Level Green Growth: A Framework to Recognize Corporate Growth Status, Path and Adopt Eco-Innovations" Sustainability 13, no. 18: 10021. https://0-doi-org.brum.beds.ac.uk/10.3390/su131810021
Note that from the first issue of 2016, this journal uses article numbers instead of page numbers. See further details here.