
Tandem Design of Bus Priority Based on a Pre-Signal System

1
College of Transportation, Nanling Campus, Jilin University, Changchun 130022, China
2
Ganzhou Transportation Bureau, Jiangxi 341000, China
*
Author to whom correspondence should be addressed.
Sustainability 2021, 13(18), 10109; https://0-doi-org.brum.beds.ac.uk/10.3390/su131810109
Submission received: 14 July 2021
/
Revised: 26 August 2021
/
Accepted: 6 September 2021
/
Published: 9 September 2021
(This article belongs to the Special Issue Sustainable Urban Mobility Systems Management and Public Transport Development)
Abstract
:Giving buses priority is an important measure to improve the attractiveness of public transport and to reduce urban traffic congestion. Reducing bus service delays as much as possible will have a positive impact on urban traffic. Based on the pre-signal system, a bus at an intersection with a left-turn special phase is optimized by “tandem design”. The design model is applied to the entrance of an intersection to study the process of vehicle arrival and departure at the main signal and pre-signal, and to calculate and analyze the delay changes of buses, straight social vehicles (meaning vehicles other than those required to be open to traffic) and left-turn vehicles before and after the adoption of “tandem design”. The results show that when the vehicle capacity at the intersection is saturated, the delays to buses and the delays of left-turn vehicles will be significantly reduced once the “tandem design” is adopted at the entrance of a cross intersection with a special left-turn phase. However, it has little effect on the delay of straight-on vehicles; with this system, the total delay experienced by straight vehicles will be reduced to one cycle.
1. Introduction
The road-planners of Paris, France first put forward the concept of “bus priority”, which is related to the historical background of French economic development. The rapid development of the French economy after the Second World War led to a sharp increase in the number of motor vehicles, accompanied by increasingly serious urban traffic congestion and environmental pollution. At this point, the French government began to realize the importance of the development of public transport, and the public transport priority policy came into being [1]. The development of urban transportation in China is similar to that in Western developed countries. China’s economy is developing rapidly, the number of motor vehicles is surging, urban traffic problems are increasing, and environmental pollution is becoming more and more serious [2]. In the face of these problems, many cities in China have put forward the concept of “bus priority”, which aims to alleviate current urban traffic congestion and improve urban traffic flow.
The bus lane system is the primary measure of urban public transport priority. Special bus lanes have been built in many cities in China, so that buses have an independent right of way, and their purpose is to reduce the mutual interference between buses and social vehicles in the process of traffic operation. Setting up a special bus lane can effectively solve the problem of bus service operation in the road section and improve the buses’ running speed and service level. The bus lanes in most cities terminate in front of the guide lanes at intersections, and there is no exclusive right of way for buses to pass through the intersections. This leads to an increase in delays for buses at the intersections, and the delays caused by buses at intersections are more serious than those in other road sections [3]. The intersection is the main bottleneck of traffic operation on the road; bus vehicles and social vehicles are in competition at the intersection; in addition to setting up special bus lanes to ensure the smooth operation of public transport, if we can use certain technology to achieve bus priority at the intersection, it can improve the overall operational efficiency and satisfaction level of bus services.
Therefore, this paper puts forward the idea of tandem design for the entrance road, combined with the pre-signal system, carrying on the main pre-signal timing design, in order to realize the priority of bus vehicles at signalized intersections in space and time, improve the operation efficiency and service level of bus vehicles on urban roads and, finally, effectively alleviate the problem of urban road traffic congestion and promote the healthy development of urban traffic.
2. Literature Review
The phrase “bus priority” refers to the measures taken in time or space to ensure the priority of bus traffic on the road and to improve the efficiency of bus operation that is, giving buses the right priority. The methods of public transport priority can be divided into time priority and space priority. Time priority refers to the realization of bus priority through signal timing at intersections; space priority refers to the setting up of bus lanes in road sections and designing bus priority entrances to intersections to achieve bus priority [4]. This paper studies the strategy of realizing public transport priority on the basis of the above two methods.
Bus priority is also one of the strategies needed to improve the reliability of transit. Xumei Chen, Lei Yu et al. evaluated the impact of bus priority treatment on the reliability of bus services, and the results show that the service reliability of bus routes that include bus signal priority is higher than that of other routes with bus lanes, especially those without bus lanes. The provision of an exclusive bus lane can effectively enhance bus service quality through improved reliability. Meanwhile, bus preferential treatment, such as providing more exclusive bus lanes, extending bus lane hours, and implementing transit signal priority on more routes, is recommended [5]. Jie Lin, Peng Wang, and others have shown through their research that the standard deviations of longer running times and headways are also consistently larger than those of the shorter ones. These findings are to be expected, as buses running behind schedule are often the result of uncontrollable factors such as traffic congestion, whereas bus drivers have better control when running ahead of schedule [6]. Time reliability problems are unavoidable, owing to the stochastic context within which bus services are operated. Measuring time reliability is technologically feasible using automatic vehicle location (AVL) systems, which can collect disaggregated data on the delivered service and disclose information on its performance. Benedetto Barabino, Di Francesco and Massimo di Francesco proposed the first offline framework that is applicable to any bus route in order to accurately characterize the bus stops and identify those time periods in which service reliability is insufficient, to disclose the systematic unreliability sources from collected AVL data and select preventive strategies, accordingly. The framework is tested on the real case study of a bus route, using about 40,000 AVL data records provided by the bus operator CTM in Cagliari, Italy. The experimentation shows that this framework can be adopted by transit managers elsewhere for accurate reliability analysis [7]. Benedetto Barabino and Cristian Lai proposed two novel time reliability metrics: the percentage of passengers receiving regular service (PPR), and the percentage of passengers receiving punctual service (PPP), for regularity and punctuality evaluations, respectively. They are determined by a methodology that collects and handles AVL data, computes passenger patterns from passenger arrival data, and integrates AVL data and patterns. A comparison with traditional metrics shows that PPR and PPP provide a more careful evaluation by using the passenger as a normalization basis for their outcomes [8].
The realization of bus priority combined with pre-signal setting is a typical form of bus priority control, one that has been studied by many scholars around the world. Based on a pre-signal with double parking lines, some European countries have begun to apply pre-signal bus priority control technology. The British Department for Transport first put forward the concept of a pre-signal in 1991. The application of a pre-signal can achieve bus priority and improve operation efficiency, and the delays from buses passing through intersections can be significantly reduced [9]. Michael Eichler et al. proposed the use of intermittent bus lanes, whereby the road capacity is not significantly reduced, so they analyzed the method of bus signal priority control by using intermittent bus lanes at the entrances of intersections and established a signal timing optimization model [10]. Zhao analyzed the actual traffic situation of a downstream intersection at the confluence of a main road and branch road and adopted pre-signal control, to improve vehicle operation efficiency and reduce delays [11]. According to the prediction of bus arrival times, Jinwoo Lee and Amer Shalaby put forward several methods to realize bus priority, such as a green light extension, red light early break, green light early break, and a queue-emptying control [12]. Daganzo analyzed the influence of the pre-signal control method on the capacity of signalized intersections, and the results show that the use of pre-signal control can improve the capacity of signalized intersections [13]. Johan Wahlstedt established an adaptive bus priority control model and analyzed the changes of bus priority, bus service delays, and social vehicle delays [14]. Zhuang and others studied the operation of vehicles on those road sections with U-turn junctions and proposed that the use of pre-signal control can reduce vehicle delay. The effectiveness of this method is verified by actual intersection simulation [15]. Monica and others evaluate the benefits of series intersections, and take delay as the objective function, propose a method of signal timing optimization and lane allocation. The research shows that this method can reduce vehicle delay and significantly improve the capacity of intersections [16]. Zhou et al. studied the potential capacity of intersections using pre-signals, calculated the length of the waiting area of the main pre-signal according to the relationship between capacity and arrival rate, and explored the influence of the pre-signal method on intersections. The final results show that the use of the pre-signal method can improve the capacity of intersections and reduce vehicle delay [17]. Jos Viegas and Baichuan Lu carried out a study on intermittent bus lanes, choosing delays as the objective function to optimize the signal timing of intersections. The results show that intermittent bus lanes can achieve bus priority, reduce bus delays, and have no significant impact on social vehicle delay [18]. Jianping Wu [19] studied the bus priority system under three different pre-signal conditions. Hu Zhang and Shidong Liang [20] proposed a pre-control method to improve the balance of service intervals at downstream stops, through an adjustment of green light time for buses passing, by which priority and delays of traffic for buses to pass through can be achieved. K Long [21] analyzed the bus priority control at a single intersection, using the average delay and per capita delay as the evaluation index. S I Guler [16] gave the delay calculation equation of cars and buses using the pre-signal through applying queuing theory, and its effectiveness was demonstrated with an example. H He [22] proposed a pre-signal adaptive control algorithm to meet the needs of real-time cars and public transportation, to realize public transport priority. Shao Jun [23] studied the traffic design and analysis of zigzag bus-priority entrance roads. Zhang Wei-hua [24] studied the bus priority-setting method using a pre-signal. Zhang Wei-hua and Lu Huapu [25] improved upon the basis of the existing coordination relationship of the main pre-signal and then drew up the arrival and departure curves of the vehicle according to the rules of arrival and departure of the vehicles at the main signal. This paper puts forward a method for calculating the delay changes of public transport vehicles and social vehicles before and after setting the pre-signal. Zhang Bin-hua [26] optimized the main signal and pre-signal coordination control strategy and simulated different situations using VISSIM software.
To sum up, at present, scholars have conducted a great deal of research on the setting up of bus priority entrance roads, pre-signal setting, and benefit evaluations of bus priority, which improve the efficiency of bus operation to a great extent and reduce the waiting delay of buses at intersections. A series of results have been achieved. The main contents are as follows:
- A summary of the existing research on bus priority lanes at intersections, including special bus entrance lanes, zigzag entrance lanes and intermittent bus priority lanes, and so on. Although much research has been performed on the setting up of bus priority entrance roads, the research on lane adjustment directions for the purpose of bus priority at intersections has not yet been carried out.
- At present, most of the studies on pre-signal settings focus on bus priority at intersections, changing lanes, left-turn control at intersections, and improving the capacity of intersections. However, research on the joint design of bus priority entrance roads and bus priority pre-signal systems has not as yet been detailed in the literature.
With the backdrop of advocating public transport, finding ways to improve the attractiveness of public transport is an urgent problem that needs to be solved. On the basis of the existing public transport priority research, this paper puts forward a public transport priority strategy based on tandem design to realize the priority of public transport, alleviate traffic congestion at intersections, and improve the public transport service level. It is the ultimate goal of this research to make conventional public transportation a more attractive mode of travel than private cars. The tandem design bus priority strategy adopted in this paper can encourage all kinds of vehicles to make full use of lanes, reduce the delays through intersections, improve the bus-sharing rate, and advocate for a bus travel strategy.
3. Materials and Methods
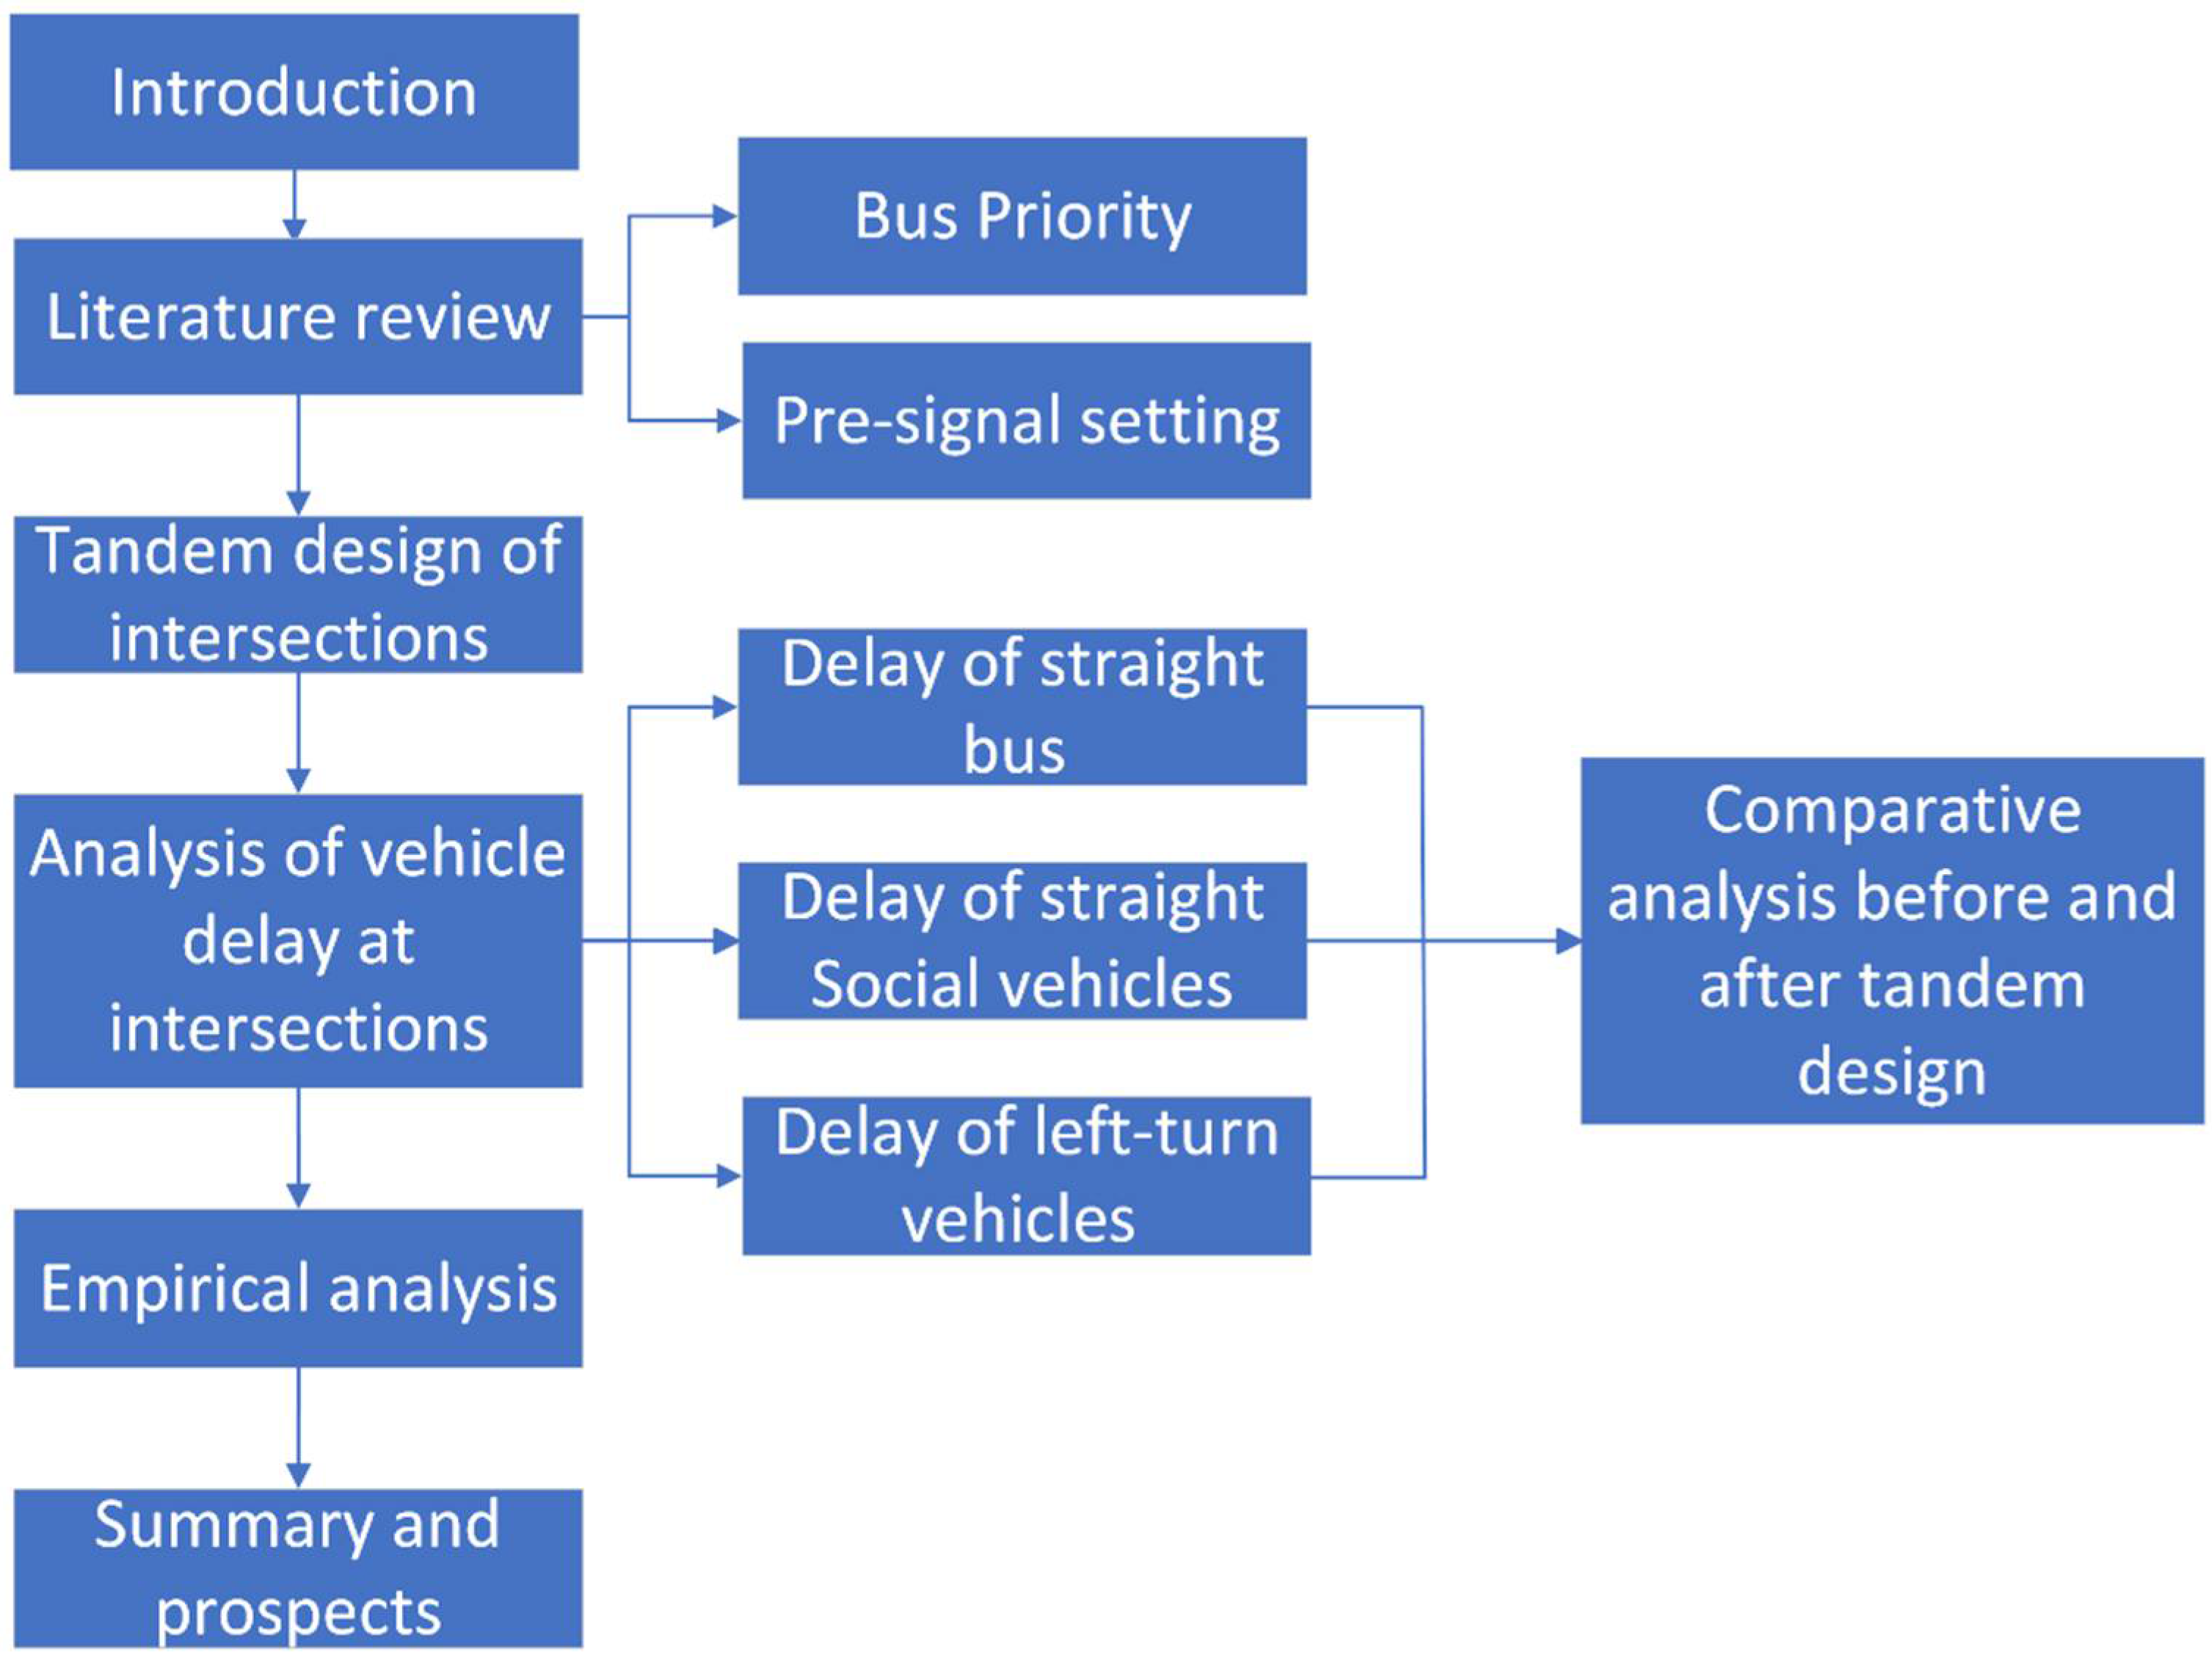
The flow chart can be displayed as Figure 1:
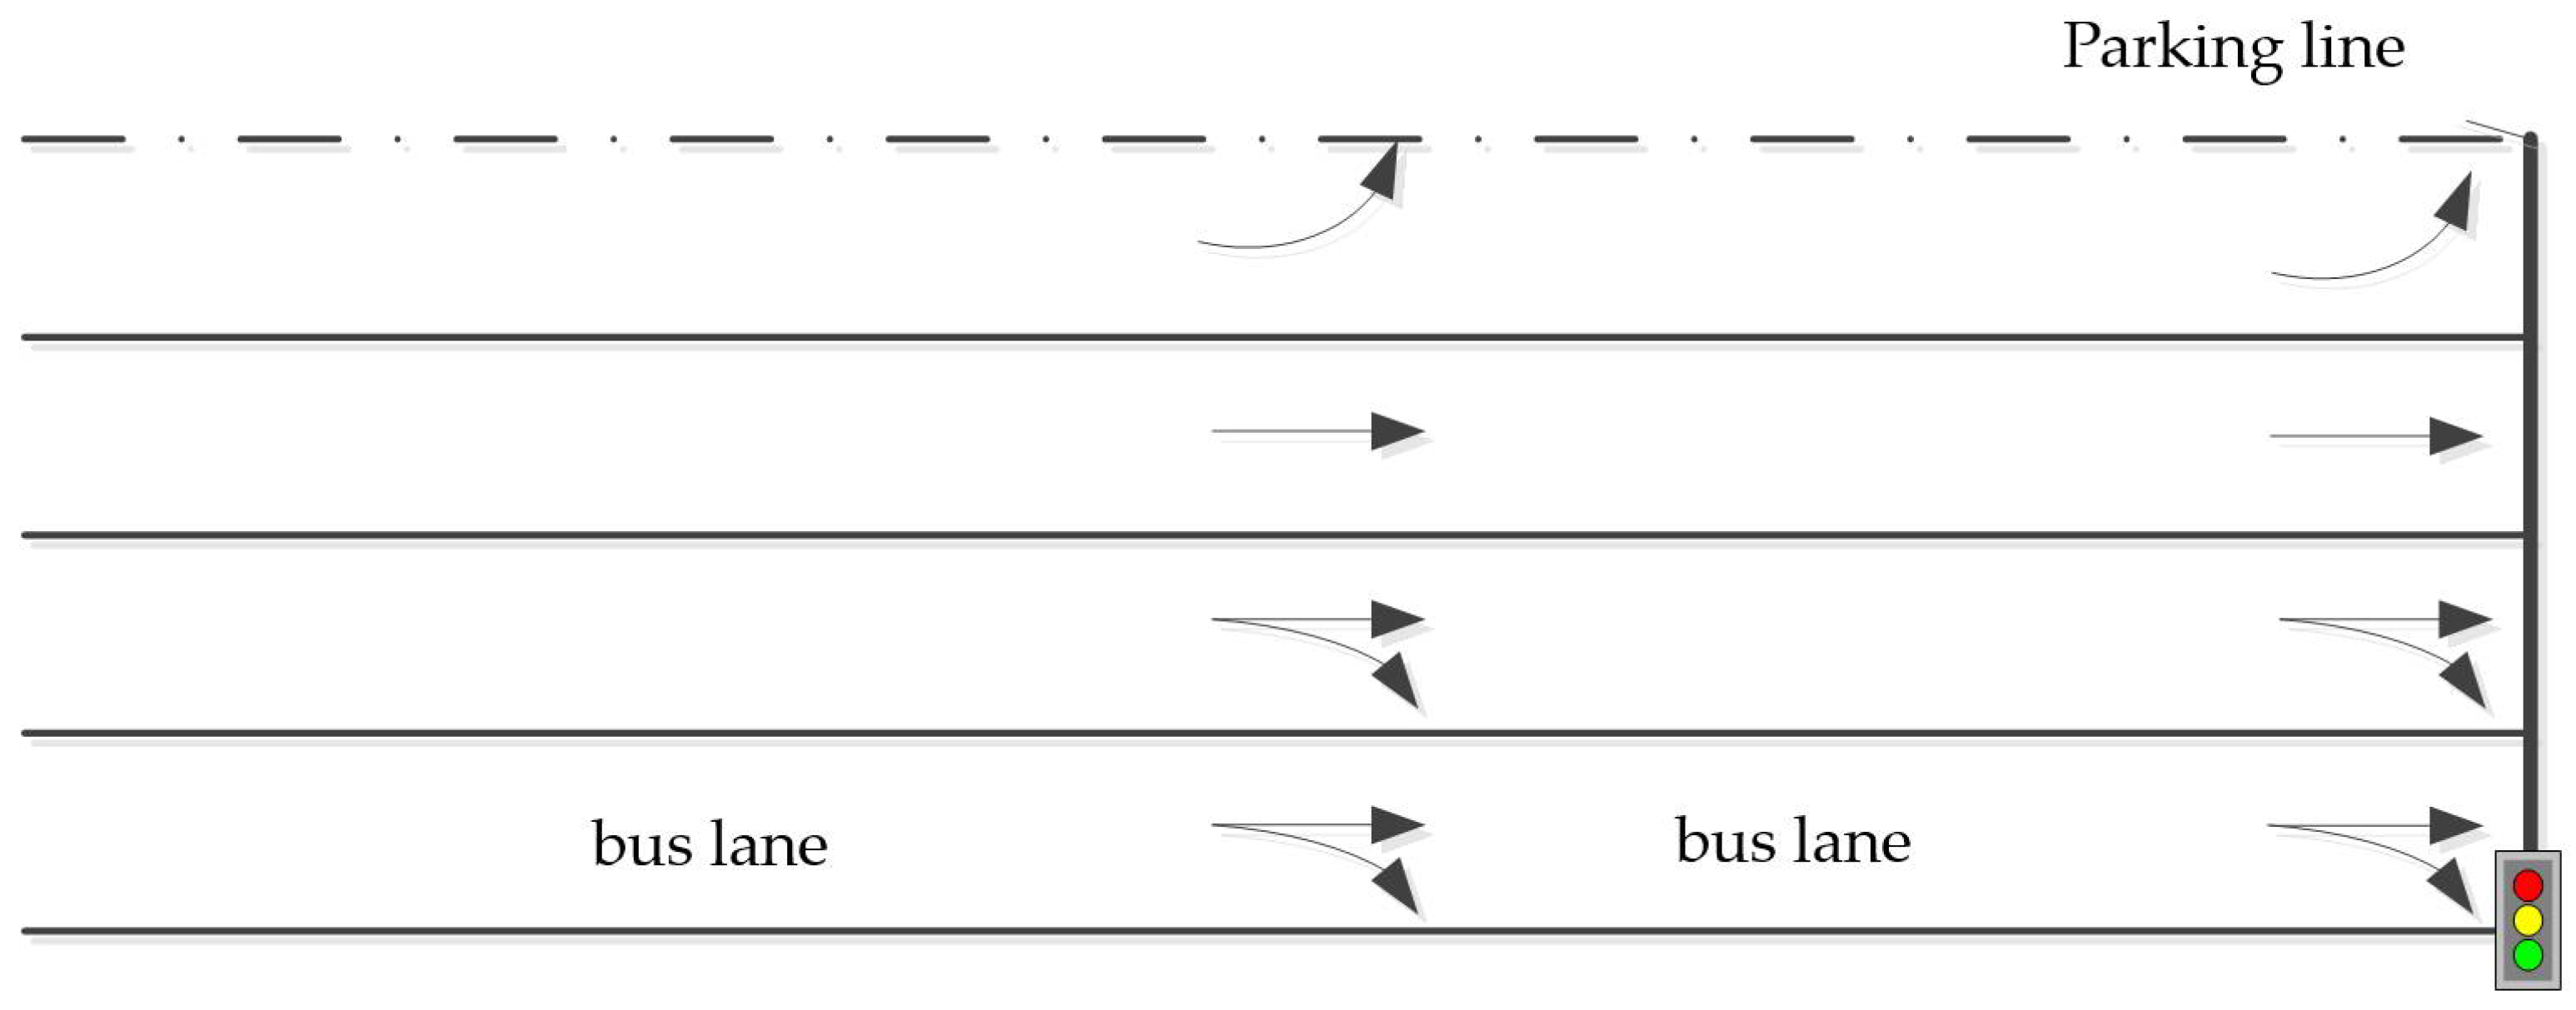
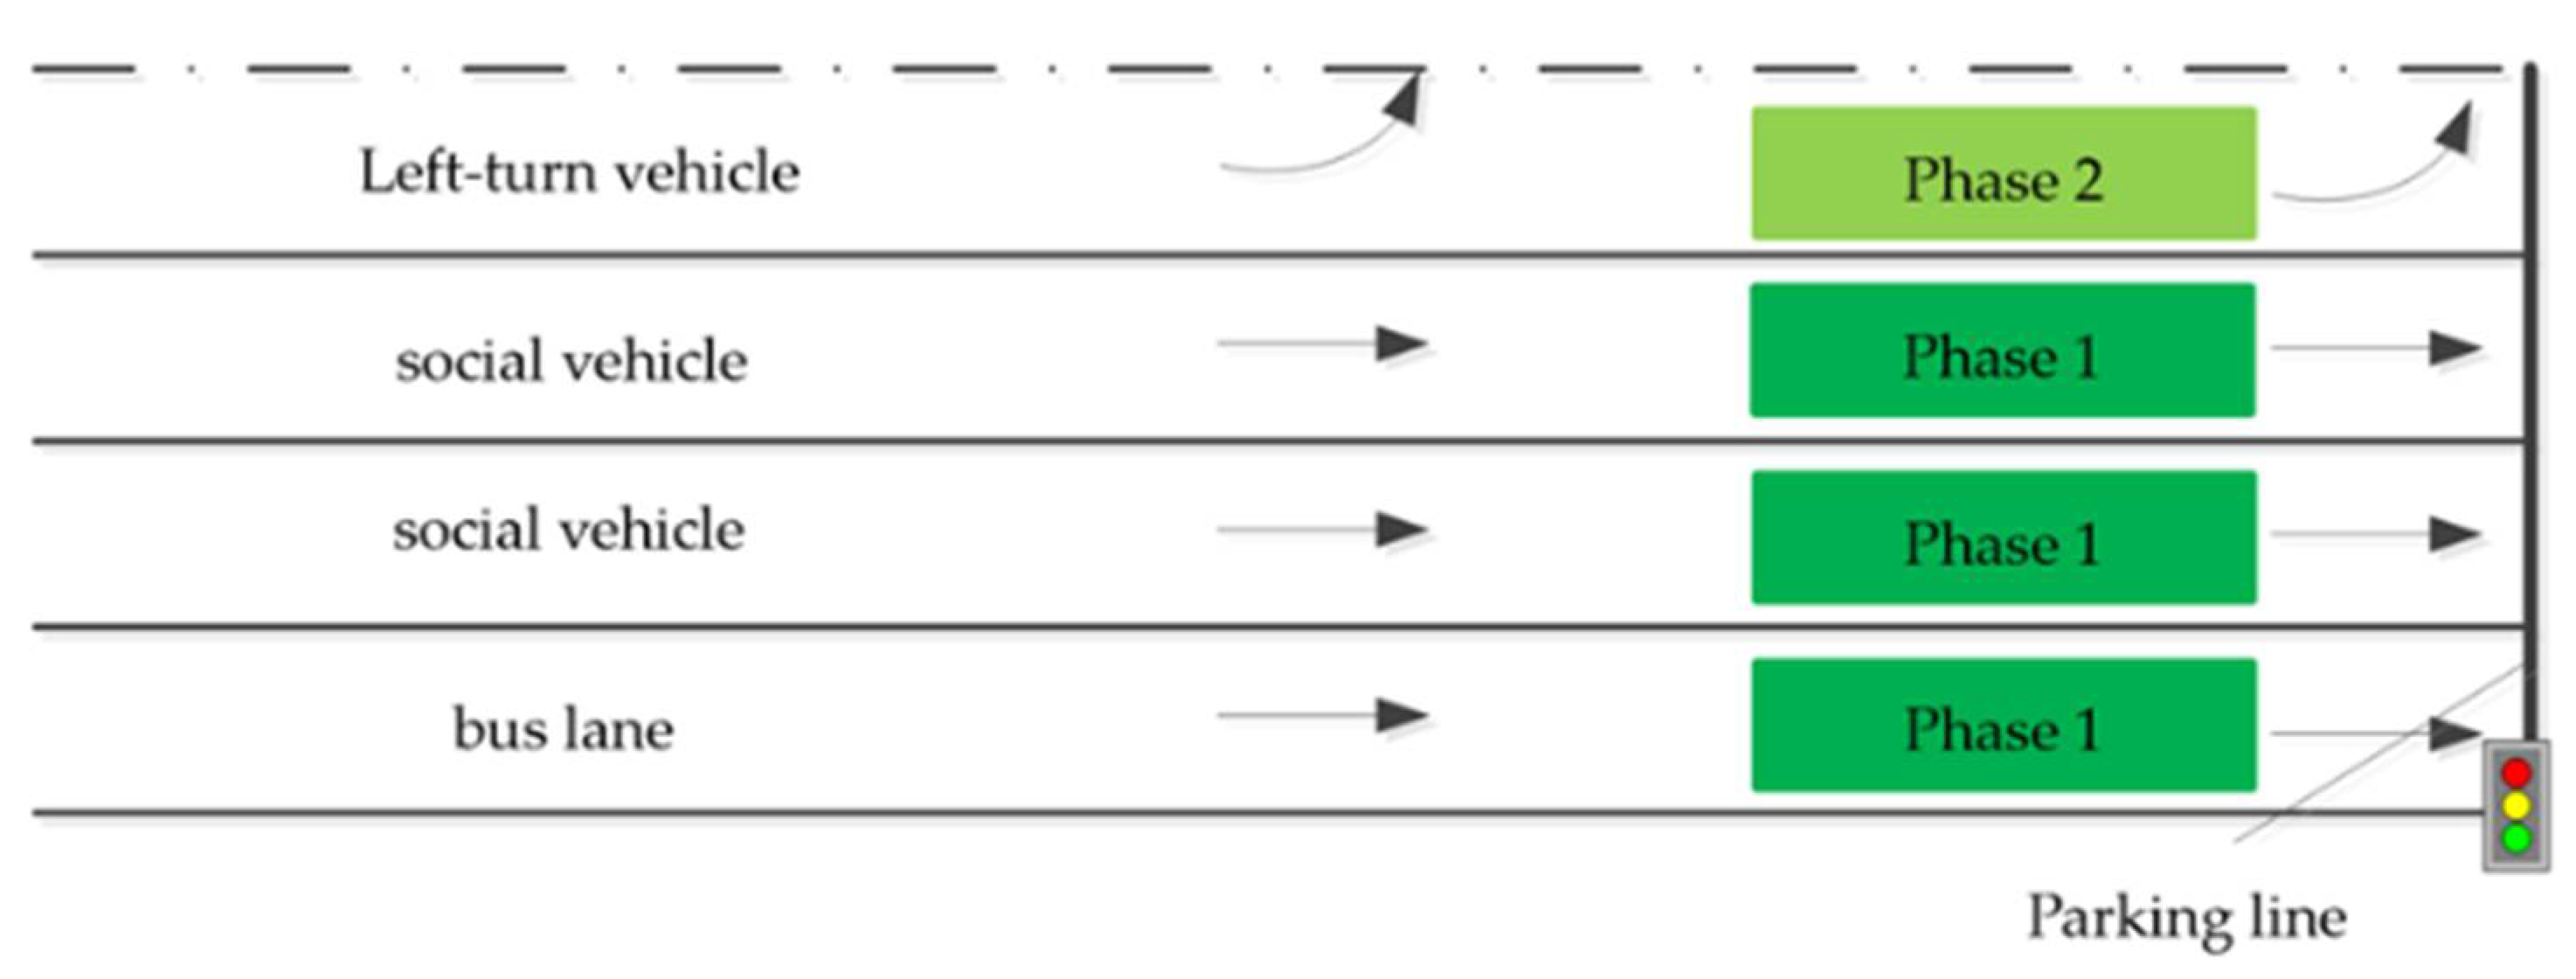
Using as an example an intersection with a left-turn special phase, in a system where cars drive on the right side of the road, this paper puts forward a design method that can not only satisfy the bus priority at the intersection but also make full use of each lane of the entrance road. This method does not need to carry out large-scale construction and transformation of the existing traditional intersections, it only needs to introduce the pre-signal system; at the same time, the intersection entrance lane arrow marking should be re-marked, and the design should be deployed on a single entrance road. There are mainly three types of bus lanes: roadside type, road medium type, and secondary road type [27], as shown in Figure 2, Figure 3 and Figure 4.
The roadside bus lane means that the bus lane is set on the outermost side of the road, as shown in Figure 2. This type of bus lane not only provides priority for buses turning right but also makes it convenient for buses to stop at bus stops and to turn right; however, straight-on bus vehicles will conflict with right-turning social vehicles when passing through intersections, and left-turning public vehicles and executive social vehicles will produce conflict points, so it is necessary to optimize phase setting and signal timing to reduce the occurrence of conflict points.
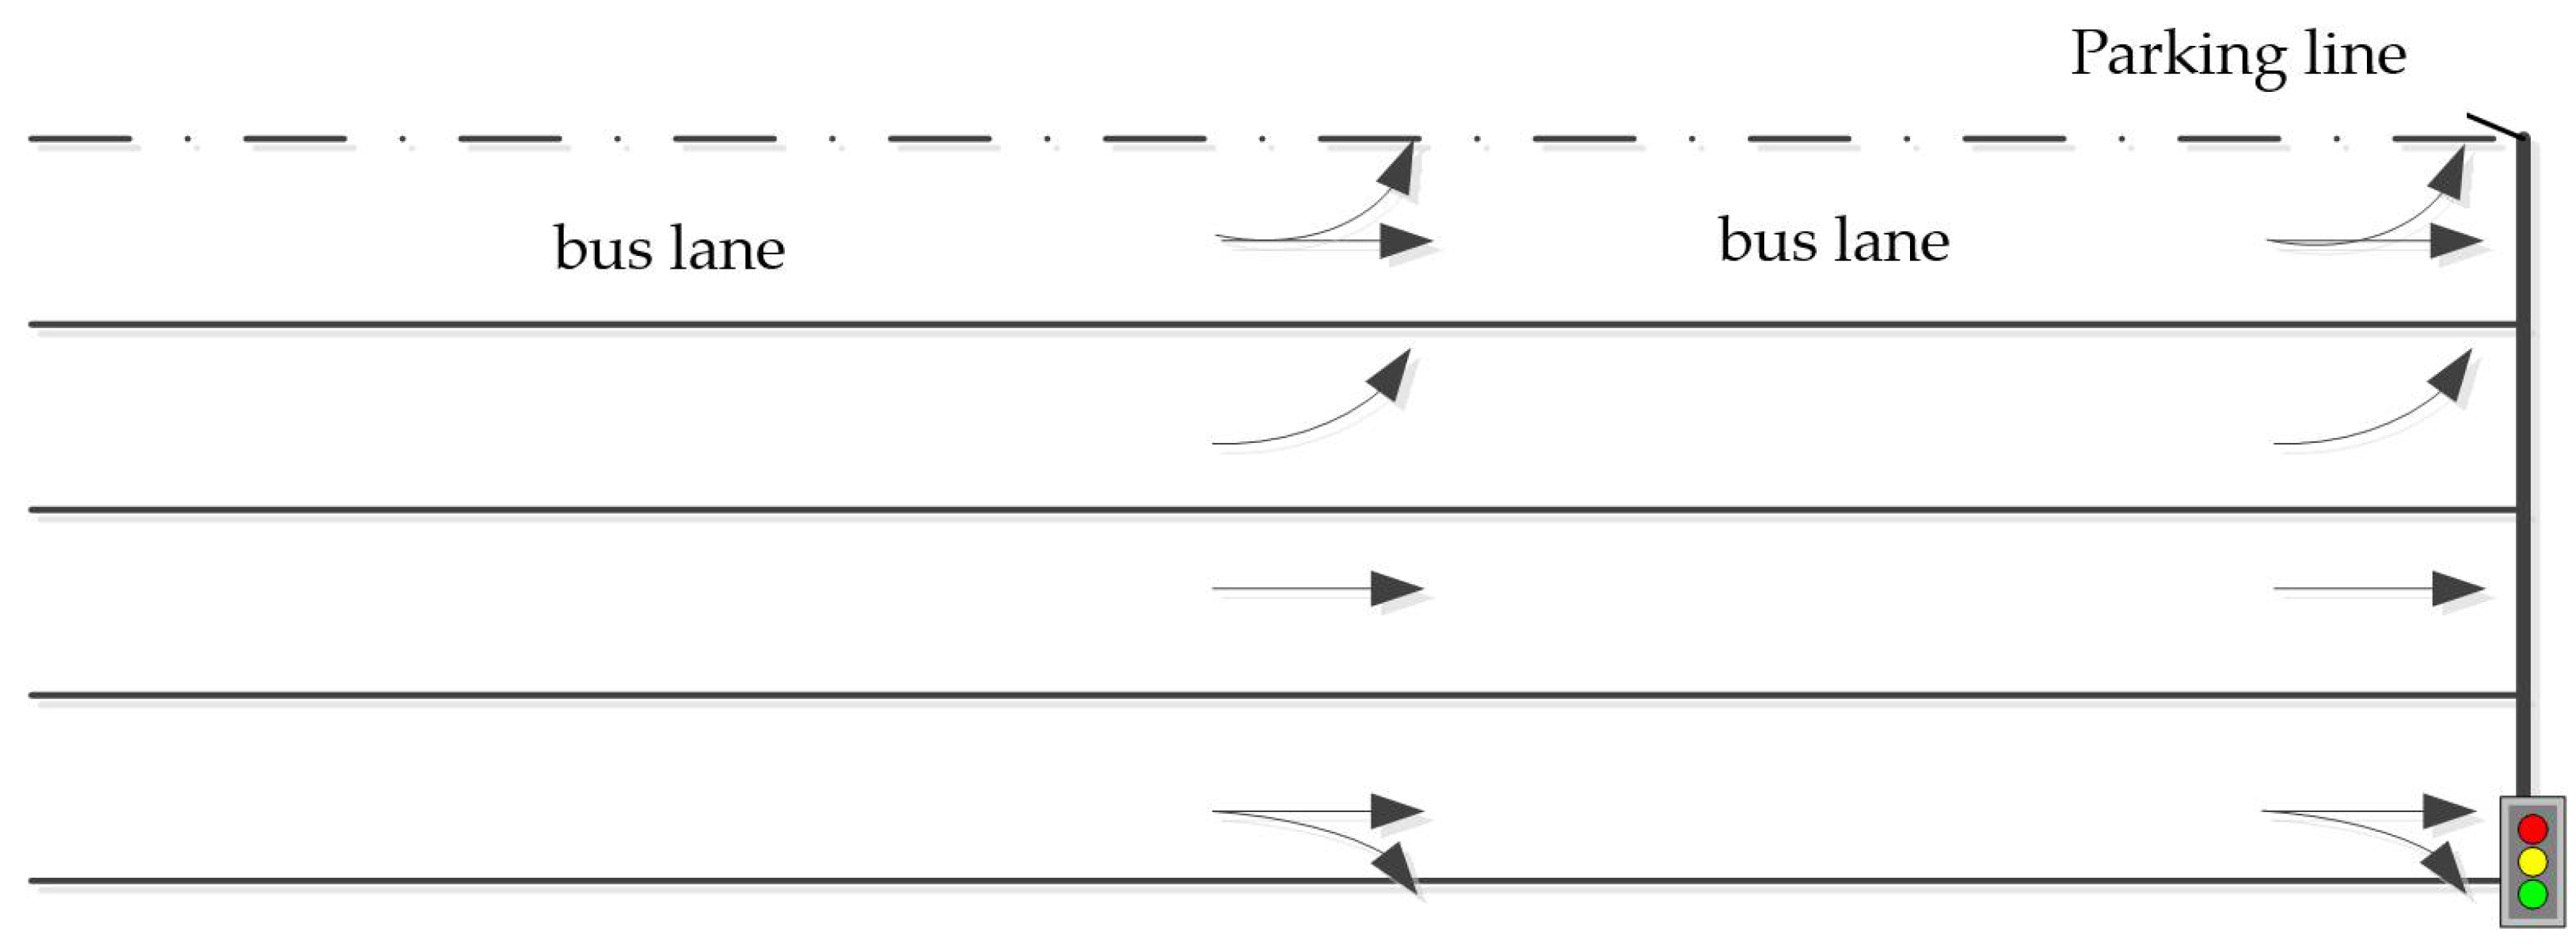
The medium bus lane model means that the bus lane is set in the middle of the road, as shown in Figure 3. The independence of this type of special bus lane is strong, and the journeys of buses are less affected by social vehicles, but it is not easy for buses to stop at bus stops, and there is a conflict between straight buses and left-turning social vehicles moving in the same entrance direction. In this scenario, by setting the straight bus vehicles and left-turning social vehicles in different phases, the conflict points can be avoided by separating the conflict points in time. In addition, a medium-sized bus lane is set up, and buses turning right will need to change into the right lane ahead of time.
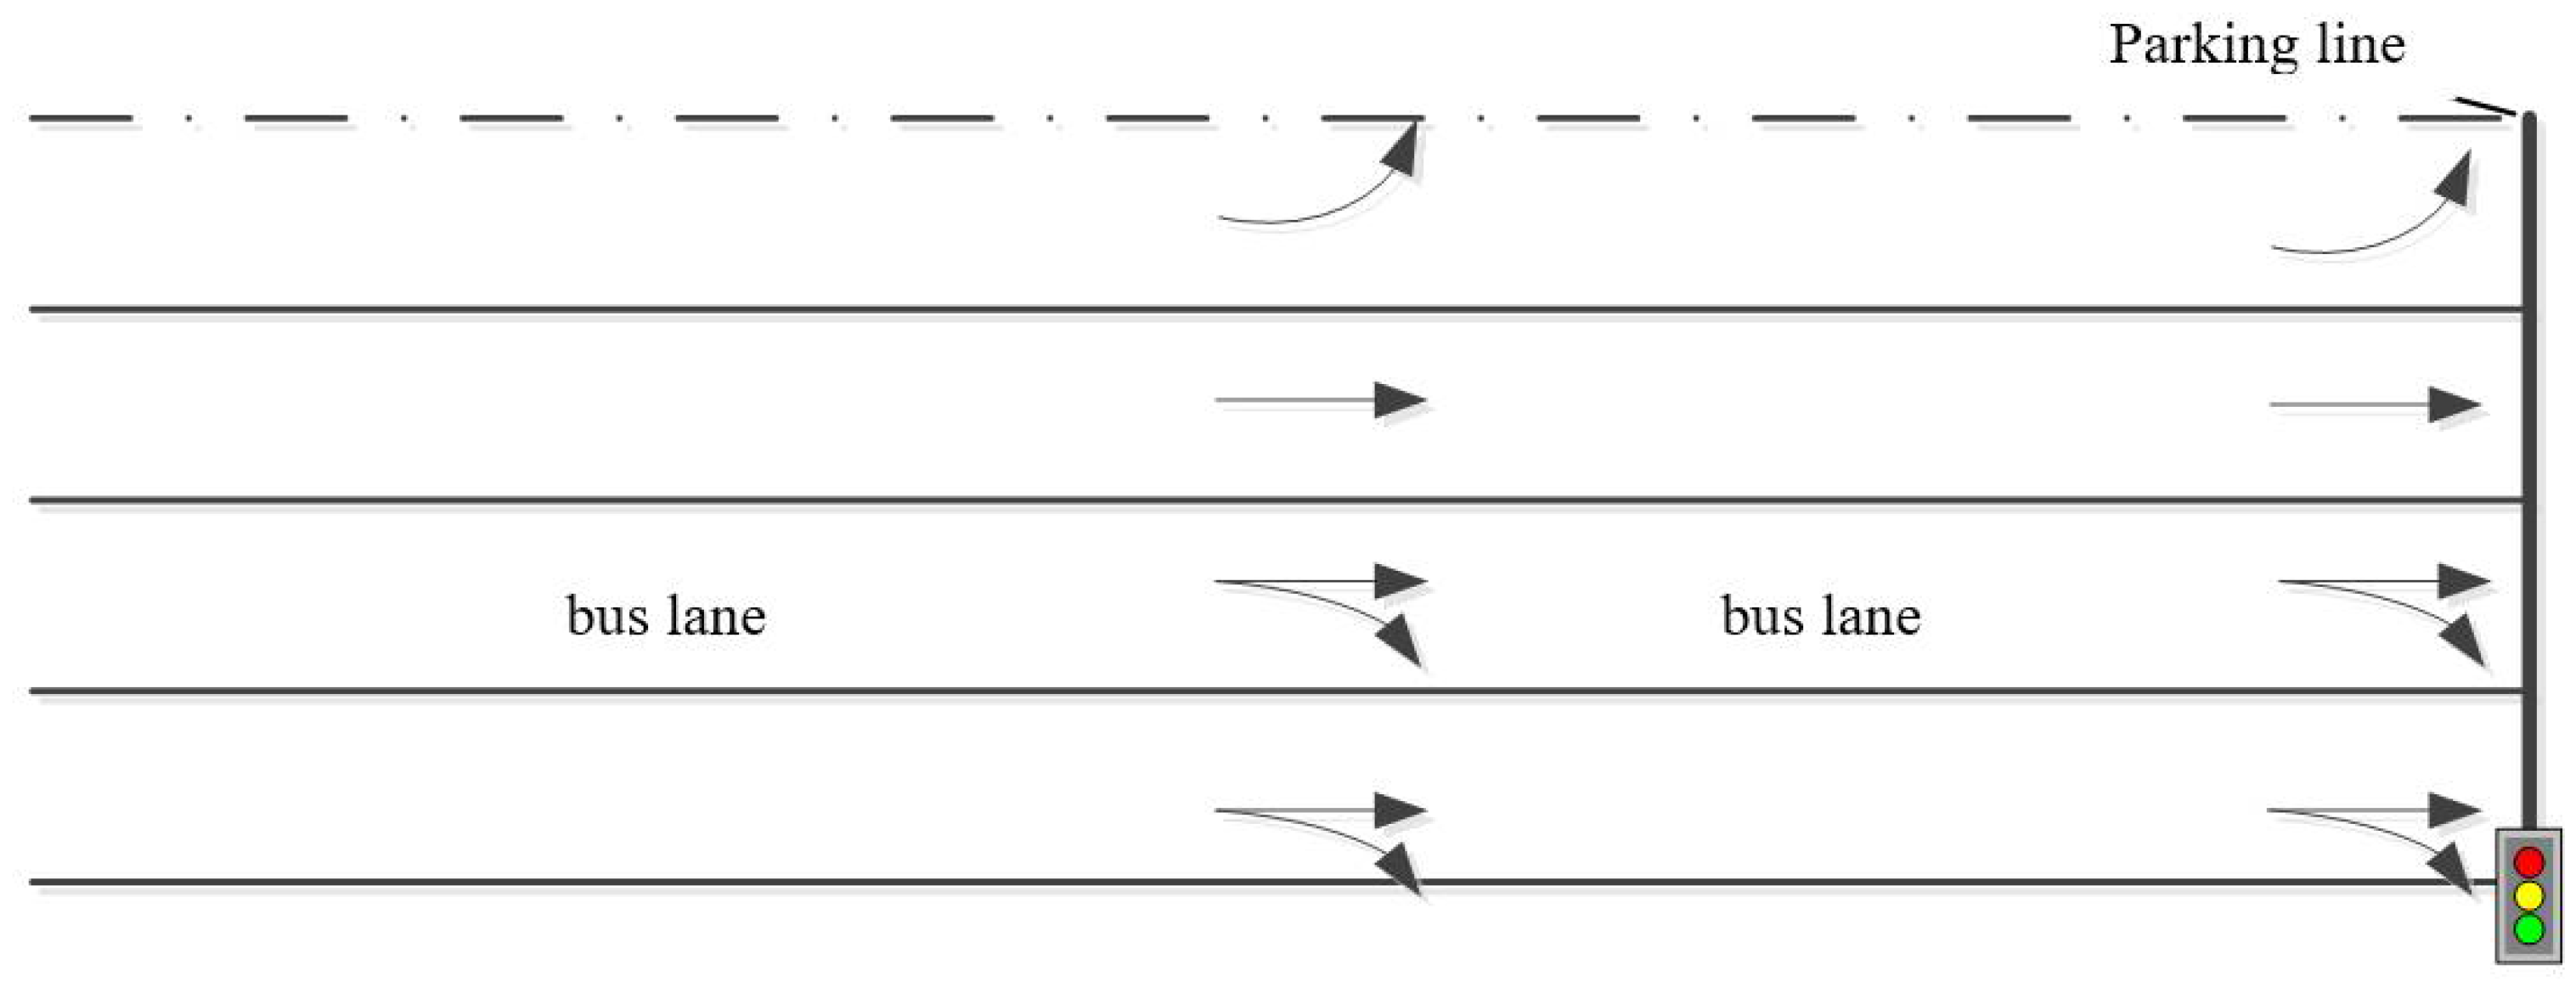
The secondary bus lane model means that the bus lane is set on the side of the secondary road, which is the second lane nearest the curb, as shown in Figure 4. Setting up a secondary bus lane requires that left-turn bus vehicles need to enter the left-turn lane in advance to avoid conflict with straight social vehicles.
Yanyan Chen, Guannan Chen, and others built a dynamic simulation model of the Sanhuan expressway in southwest China, based on Paramics [28]. Quadstone Paramics [28] is one of the top microscopic traffic simulation softwares. Through the simulation model, the scheme design of bus lanes was simulated and pre-evaluated. According to the simulation result, this shows that bus lanes avoid the interference of social vehicles for public transport, can significantly improve the speed of the buses, and shorten the travel time. Due to the lower operating efficiency in a medial road position rather than a roadside arrangement, the average speed of buses traveling on the medium bus lanes is lower compared with the roadside bus lanes. At the same time, it shows that bus lanes are set up so that the number of lanes is reduced, leading to social vehicle density increase, speed decrease and travel time increase. The buses on the medium bus lanes will interfere with the social vehicles while moving in and out of the main road, meaning that the speed of social vehicles is lower than that when using the roadside lanes. No matter which form of bus lane will lead to social vehicle peak-hour traffic volume decline, the main issue is the lanes’ reduction, resulting in reduced capacity and the disruption of buses moving in and out of the main road. Having the buses on medium bus lanes in and out of the main road will bring significantly more interference with social vehicles. However, the setting up of bus lanes can significantly reduce travel time per person, increase the efficiency of travel in the road network overall, and effectively improve transit service levels and turnover capacity. Benedetto Barabino, Michela Bonera and others also show that the right-of-way priority strategy reduces the crash frequency risk occurrence because it separates the different traffic flows on the streets. Although all these routes have a limited percentage of paths along a priority lane, this percentage does not seem to be enough. Therefore, the PTC (Public Transport Company) is advised to increase the percentages of bus priority lanes along each route. In addition, despite the non-significance of this factor in the severity model, it might be recommended that networks adopt with-flow bus lanes instead of contraflow ones, to reduce the risk of crashes. Their results suggest reorganizing the road space by deviating routes along roads with sidewalks and giving priority to buses through the replacement of on-street parking with bus priority lanes [29].
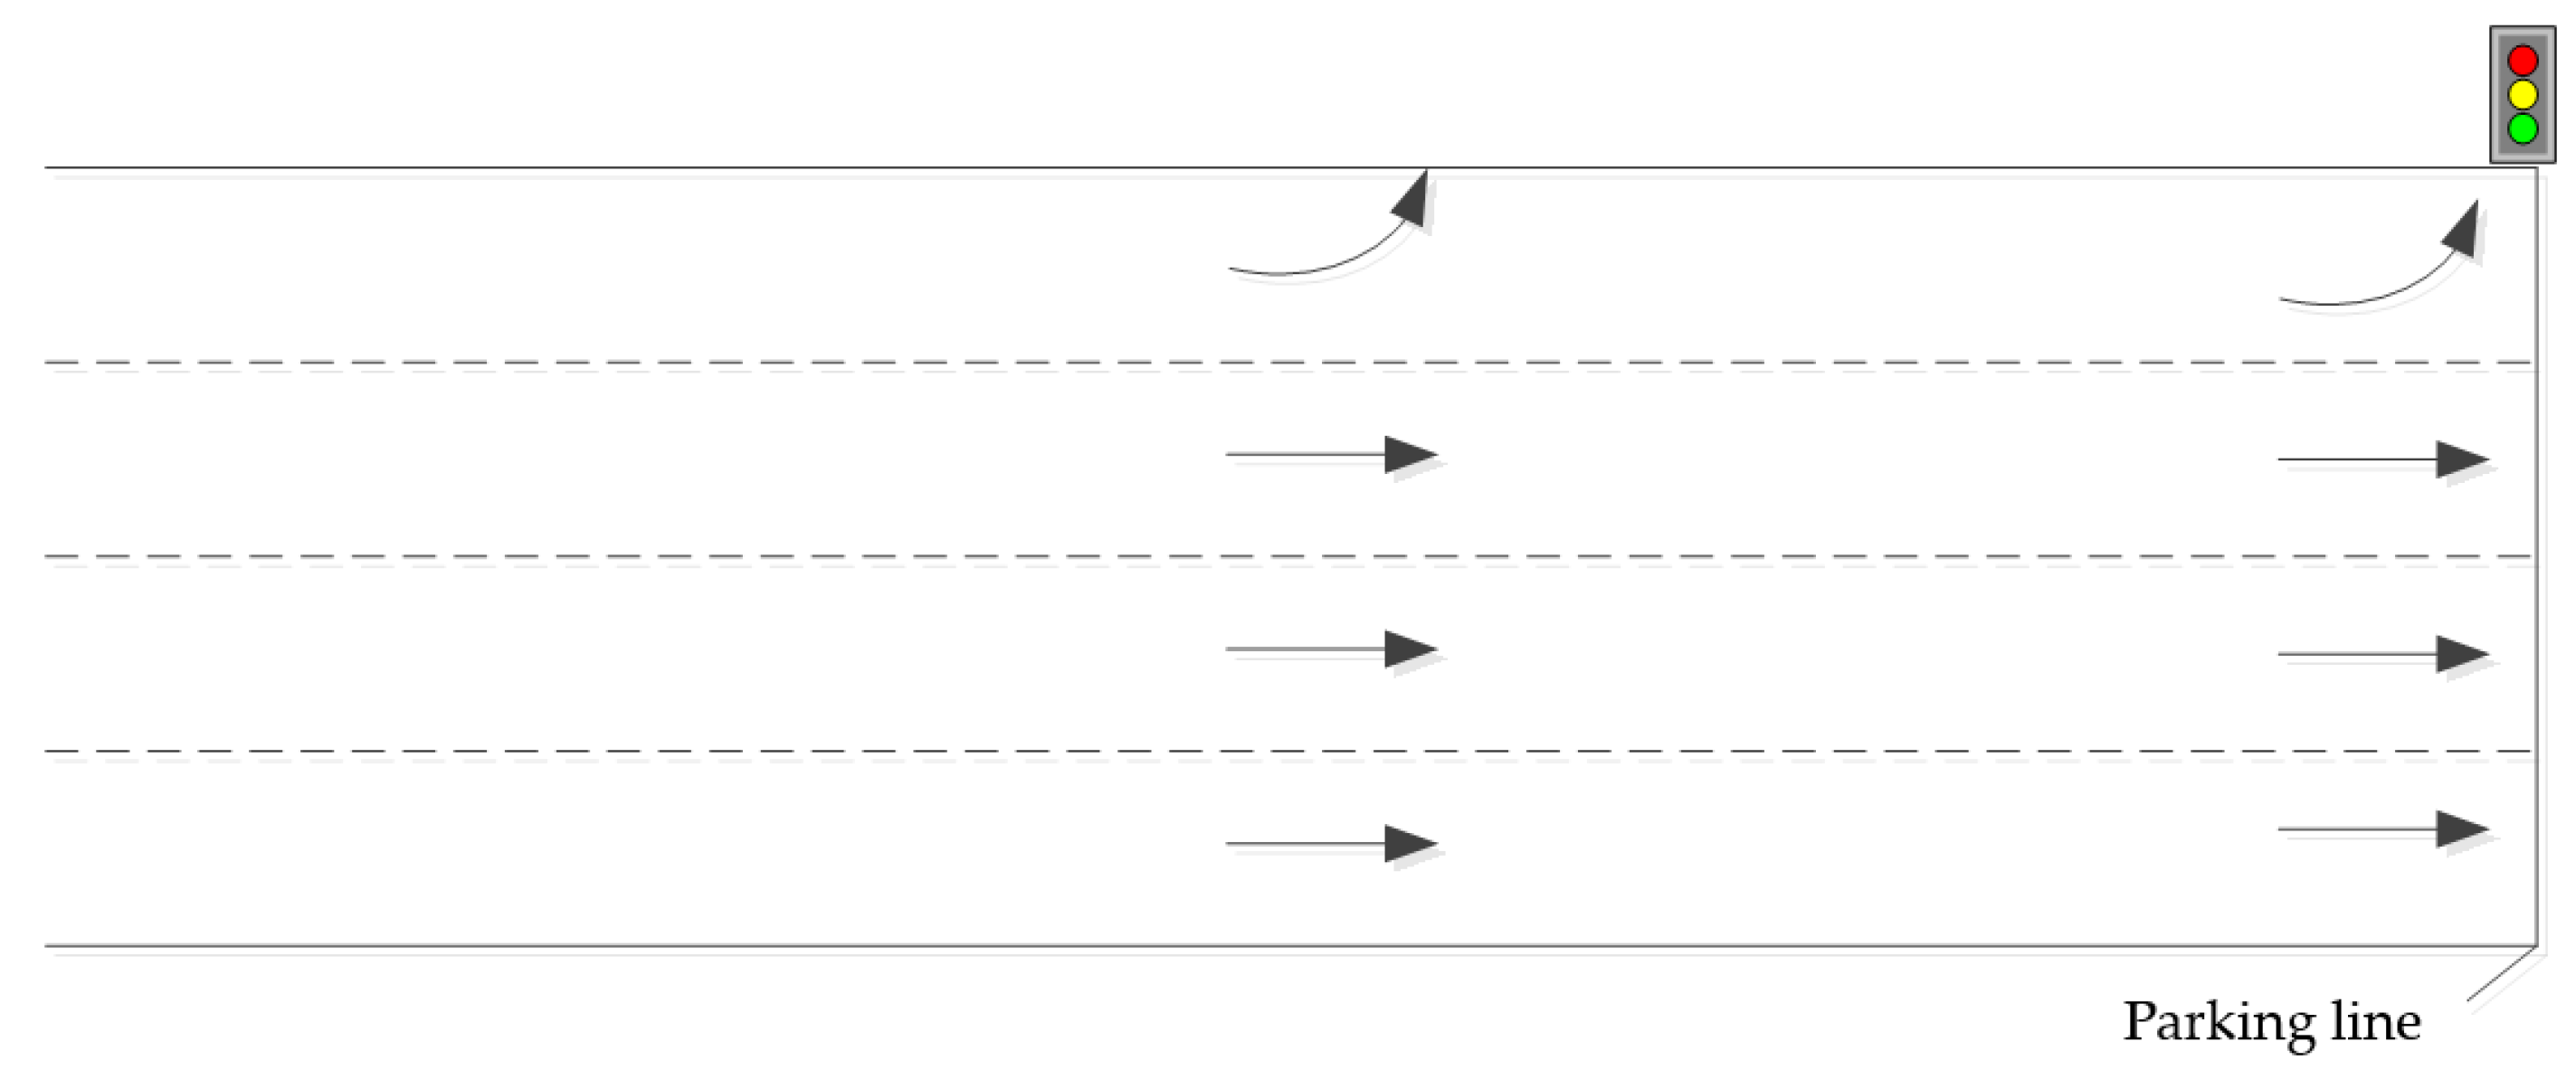
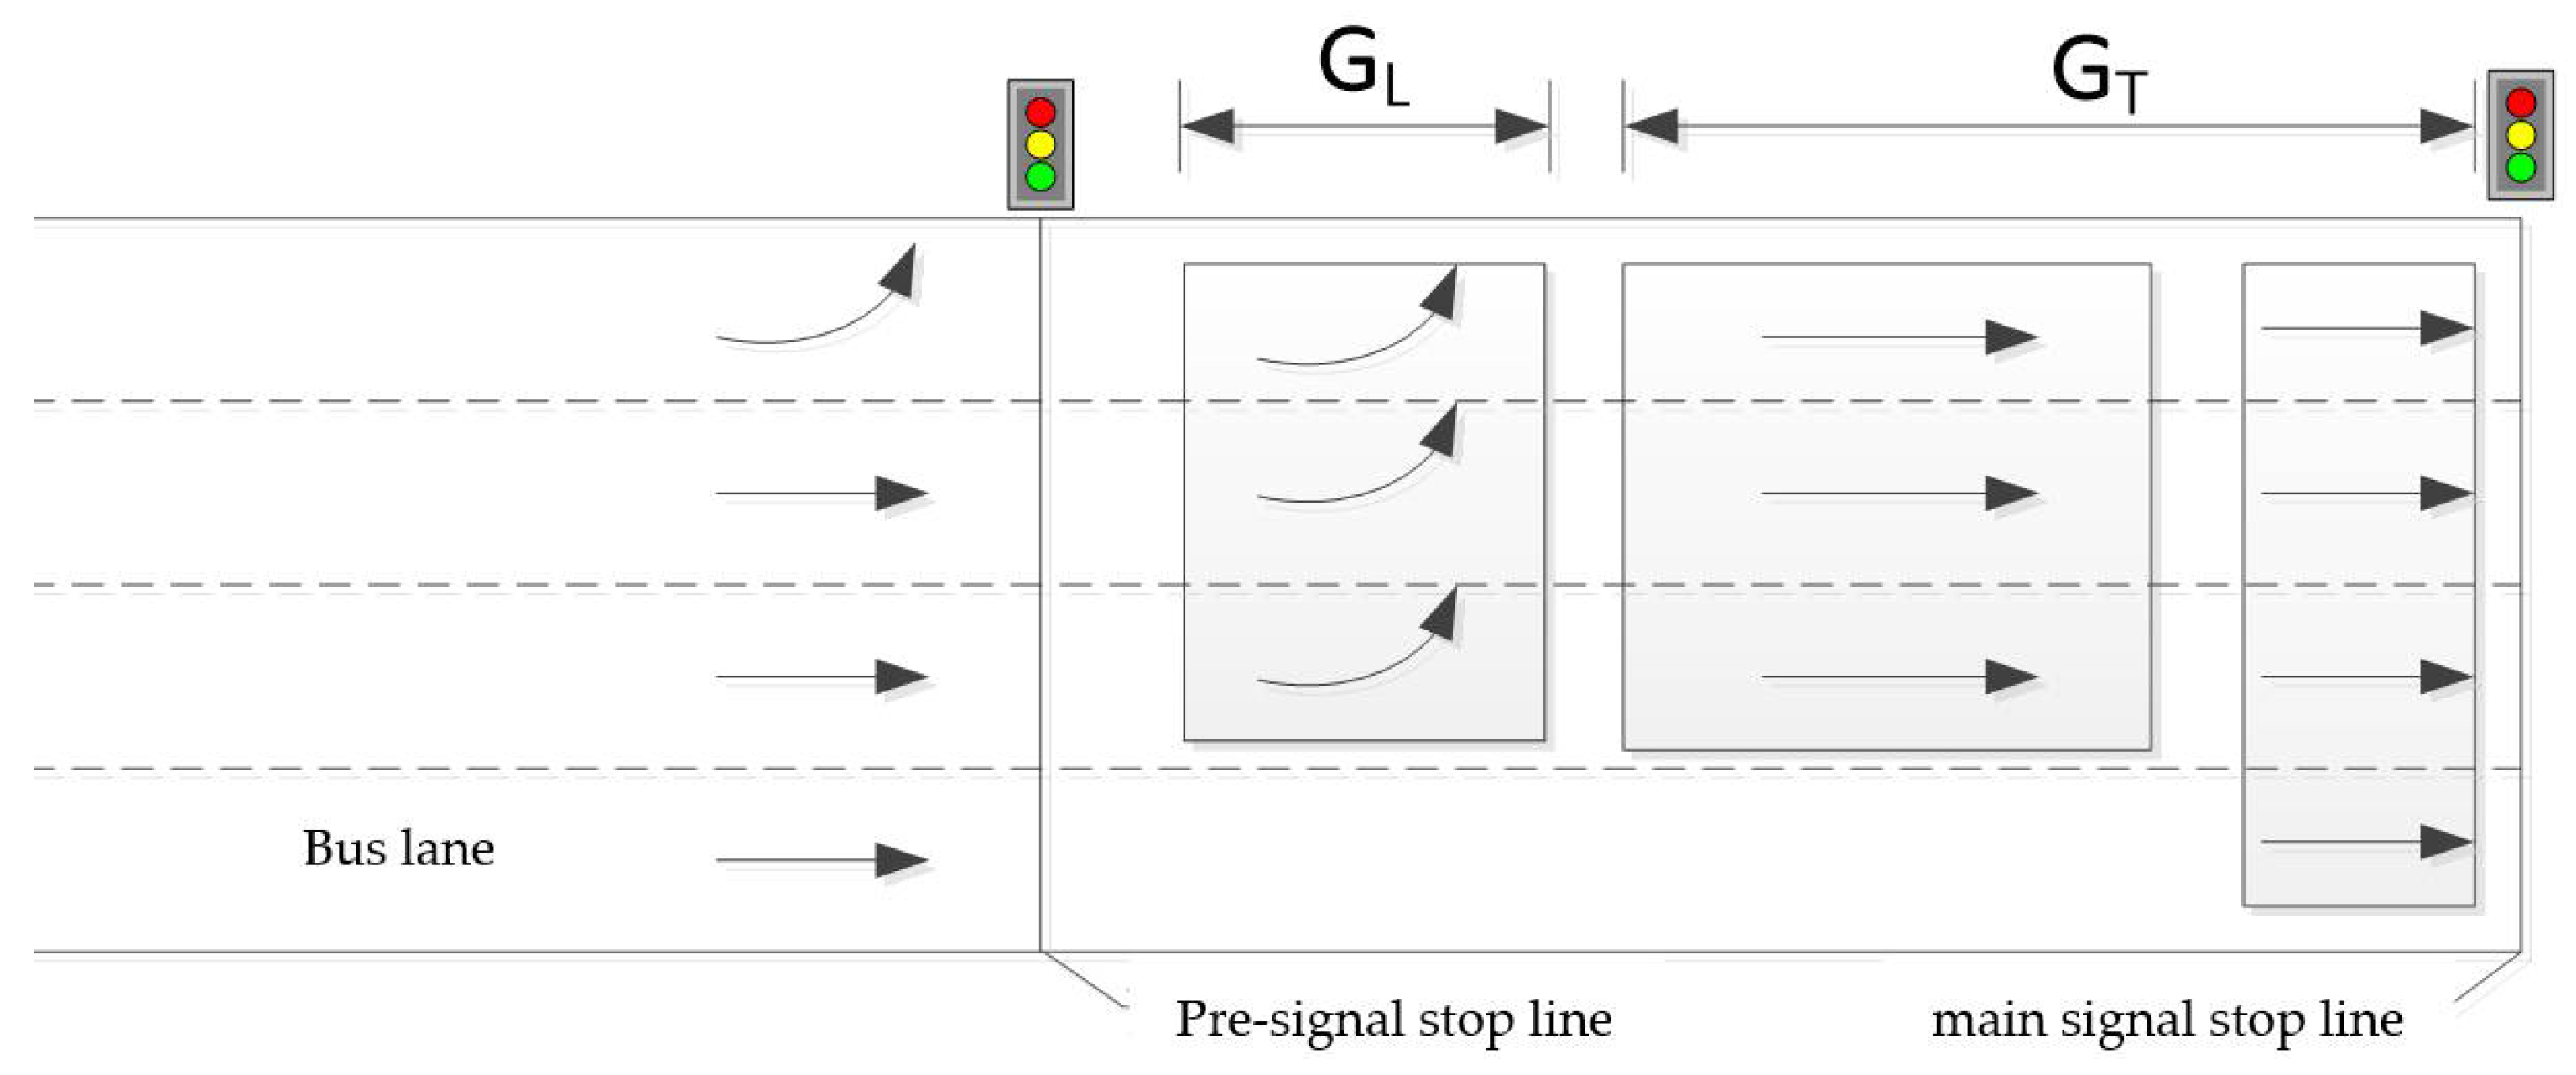
The layout of an entrance road without a tandem design is shown in Figure 5; its signal control chart is shown in Figure 6. The layout of the entrance road using this design is shown in Figure 7, which is marked with the main signal and the pre-signal stop line, and the area between the two stop lines is called the “sorting area”. The advance signal upstream lane arrow marks the function of each lane; that is, left-turning vehicles and straight vehicles are driving in different lanes. To simplify the illustration, the right-turning vehicle is not shown in the figure. When the main signal is red, all types of vehicles waiting are rearranged under the control of the pre-signal. The vehicles upstream of the pre-signal enter the “sorting area” according to category; the first ones to enter are buses, followed by straight social vehicles and left-turn vehicles. The area can accommodate temporarily queued vehicles generated by the pre-signal control, and the length of the sorting area is long enough to ensure that the queue does not overflow back to the advance signal. This kind of design is called “tandem design” [13].
The working principle of “tandem design” is shown in Figure 7: buses are lined up in front of other vehicles while making full use of lanes other than bus lanes, so as to achieve bus priority and make more buses pass smoothly through intersections; then straight vehicles and left-turn vehicles will enter the “sorting area” in turn, making full use of each lane, so as to improve lane utilization and reduce vehicle delay.
The workflow of “tandem design” is as follows: when the main signal of the intersection starts to turn red, the first advance signal is given to the bus green light; the straight-on and left-turn vehicles wait at the pre-signal stop line, and the bus first enters the “sorting area”. Vehicles can make full use of all lanes and wait at the main signal stop line. Next, the pre-signal gives the green light to the straight vehicles, the left-turn vehicles wait at the pre-signal stop line, and the straight vehicles enter the “sorting area” and line up behind the bus to make full use of all lanes; finally, the pre-signal is given to the left-turn vehicles’ green light, the straight vehicles wait at the pre-signal stop line and the left-turn vehicles enter the “sorting area” and line up behind the straight vehicles, to make full use of all lanes. This pre-signal phase setting mode enables all types of vehicles to be reorganized in the “sorting area”. When the main signal of the intersection is green, all kinds of vehicles can use all lanes to pass through the intersection effectively.
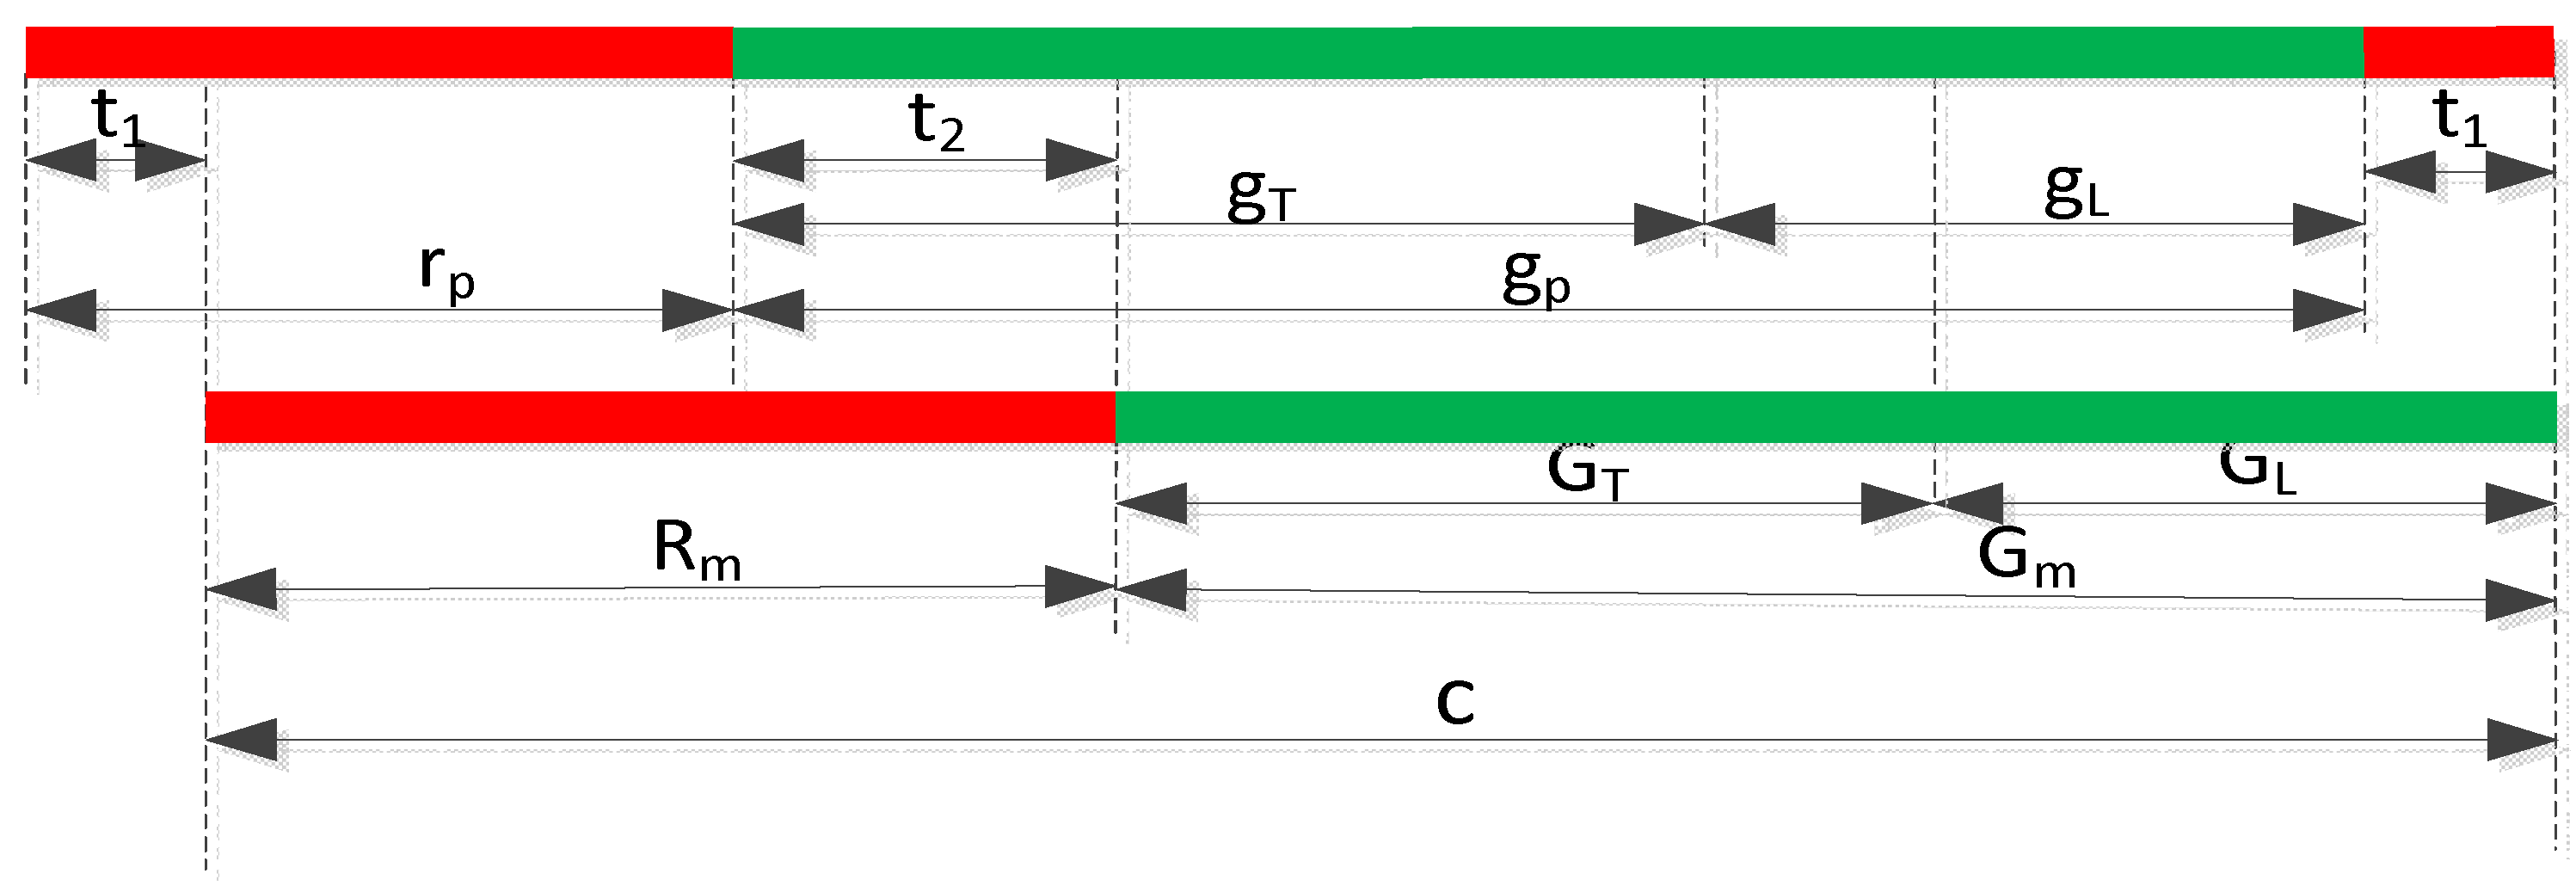
The pre-signal system adopts the “red-first-green” control mode, that is, the pre-signal red light turns on t1, ahead of the main signal red light, and the pre-signal green light turns on t2, ahead of the main signal green light. The timing coordination relationship between the main signal and the pre-signal at the intersection is shown in Figure 8. C represents the period length, rp is the pre-signal red time, and gp is the pre-signal green time, which is composed of gT and gL, where gT and gL are the pre-signal straight green time and the pre-signal left-turn green time, respectively. Rm is the main signal red light length, Gm main signal green time, which is composed of GT and GL, in which GT and GL represent the main signal straight green time and main signal left-turn green time, respectively.
In this paper, the benefits of an intersection with a tandem design are analyzed, and the delay is selected as the evaluation index to analyze the delays of bus vehicles, straight social vehicles, and left-turn vehicles, respectively. Finally, the changes of delay before and after the use of tandem design are compared and analyzed.
There are two kinds of vehicle delays at intersections: total vehicle delay and average vehicle delay. The total vehicle delay refers to the sum of the delays of all vehicles passing through the intersection, and the average vehicle delay is the ratio of the total vehicle delay to the number of vehicles passing through. The average delay of vehicles is an important index to evaluate the performance of intersections. At present, the most widely used delay calculation formulas are the HCM2008 delay formula and Webster delay formula. However, using these two formulas to calculate the delay is too complex, and there are many conditions to be considered. This paper will calculate the vehicle delay through the delay triangle, according to the arrival and departure curve of the vehicle [26].
The basic assumptions of intersection delay analysis after adopting a “tandem design” are as follows:
- There is a bus lane, and only a direct bus is allowed on the bus lane (only direct bus priority is considered in this article);
- The arrival and departure of all vehicles conform to the linear law;
- All kinds of vehicles entering the “sorting area” within the green time of the pre-signal can all pass through the intersection within the green time of the main signal;
- The left-turn vehicles mentioned below include left-turn social vehicles and left-turn bus vehicles, that is, they are indistinguishable and are collectively referred to as left-turn vehicles;
- The “sorting area” is long enough to accommodate queued vehicles that are generated by the pre-signal control.
3.1. Delay Analysis of Straight Buses with the “Tandem Design”
The pre-signal system is adopted at the intersection in “tandem design”. The straight bus will not cause delay at the pre-signal stop line, and it can enter the “sorting area” controlled by the main signal smoothly. Therefore, it is only necessary to analyze the delay caused by the straight bus passing through the main signal stop line.
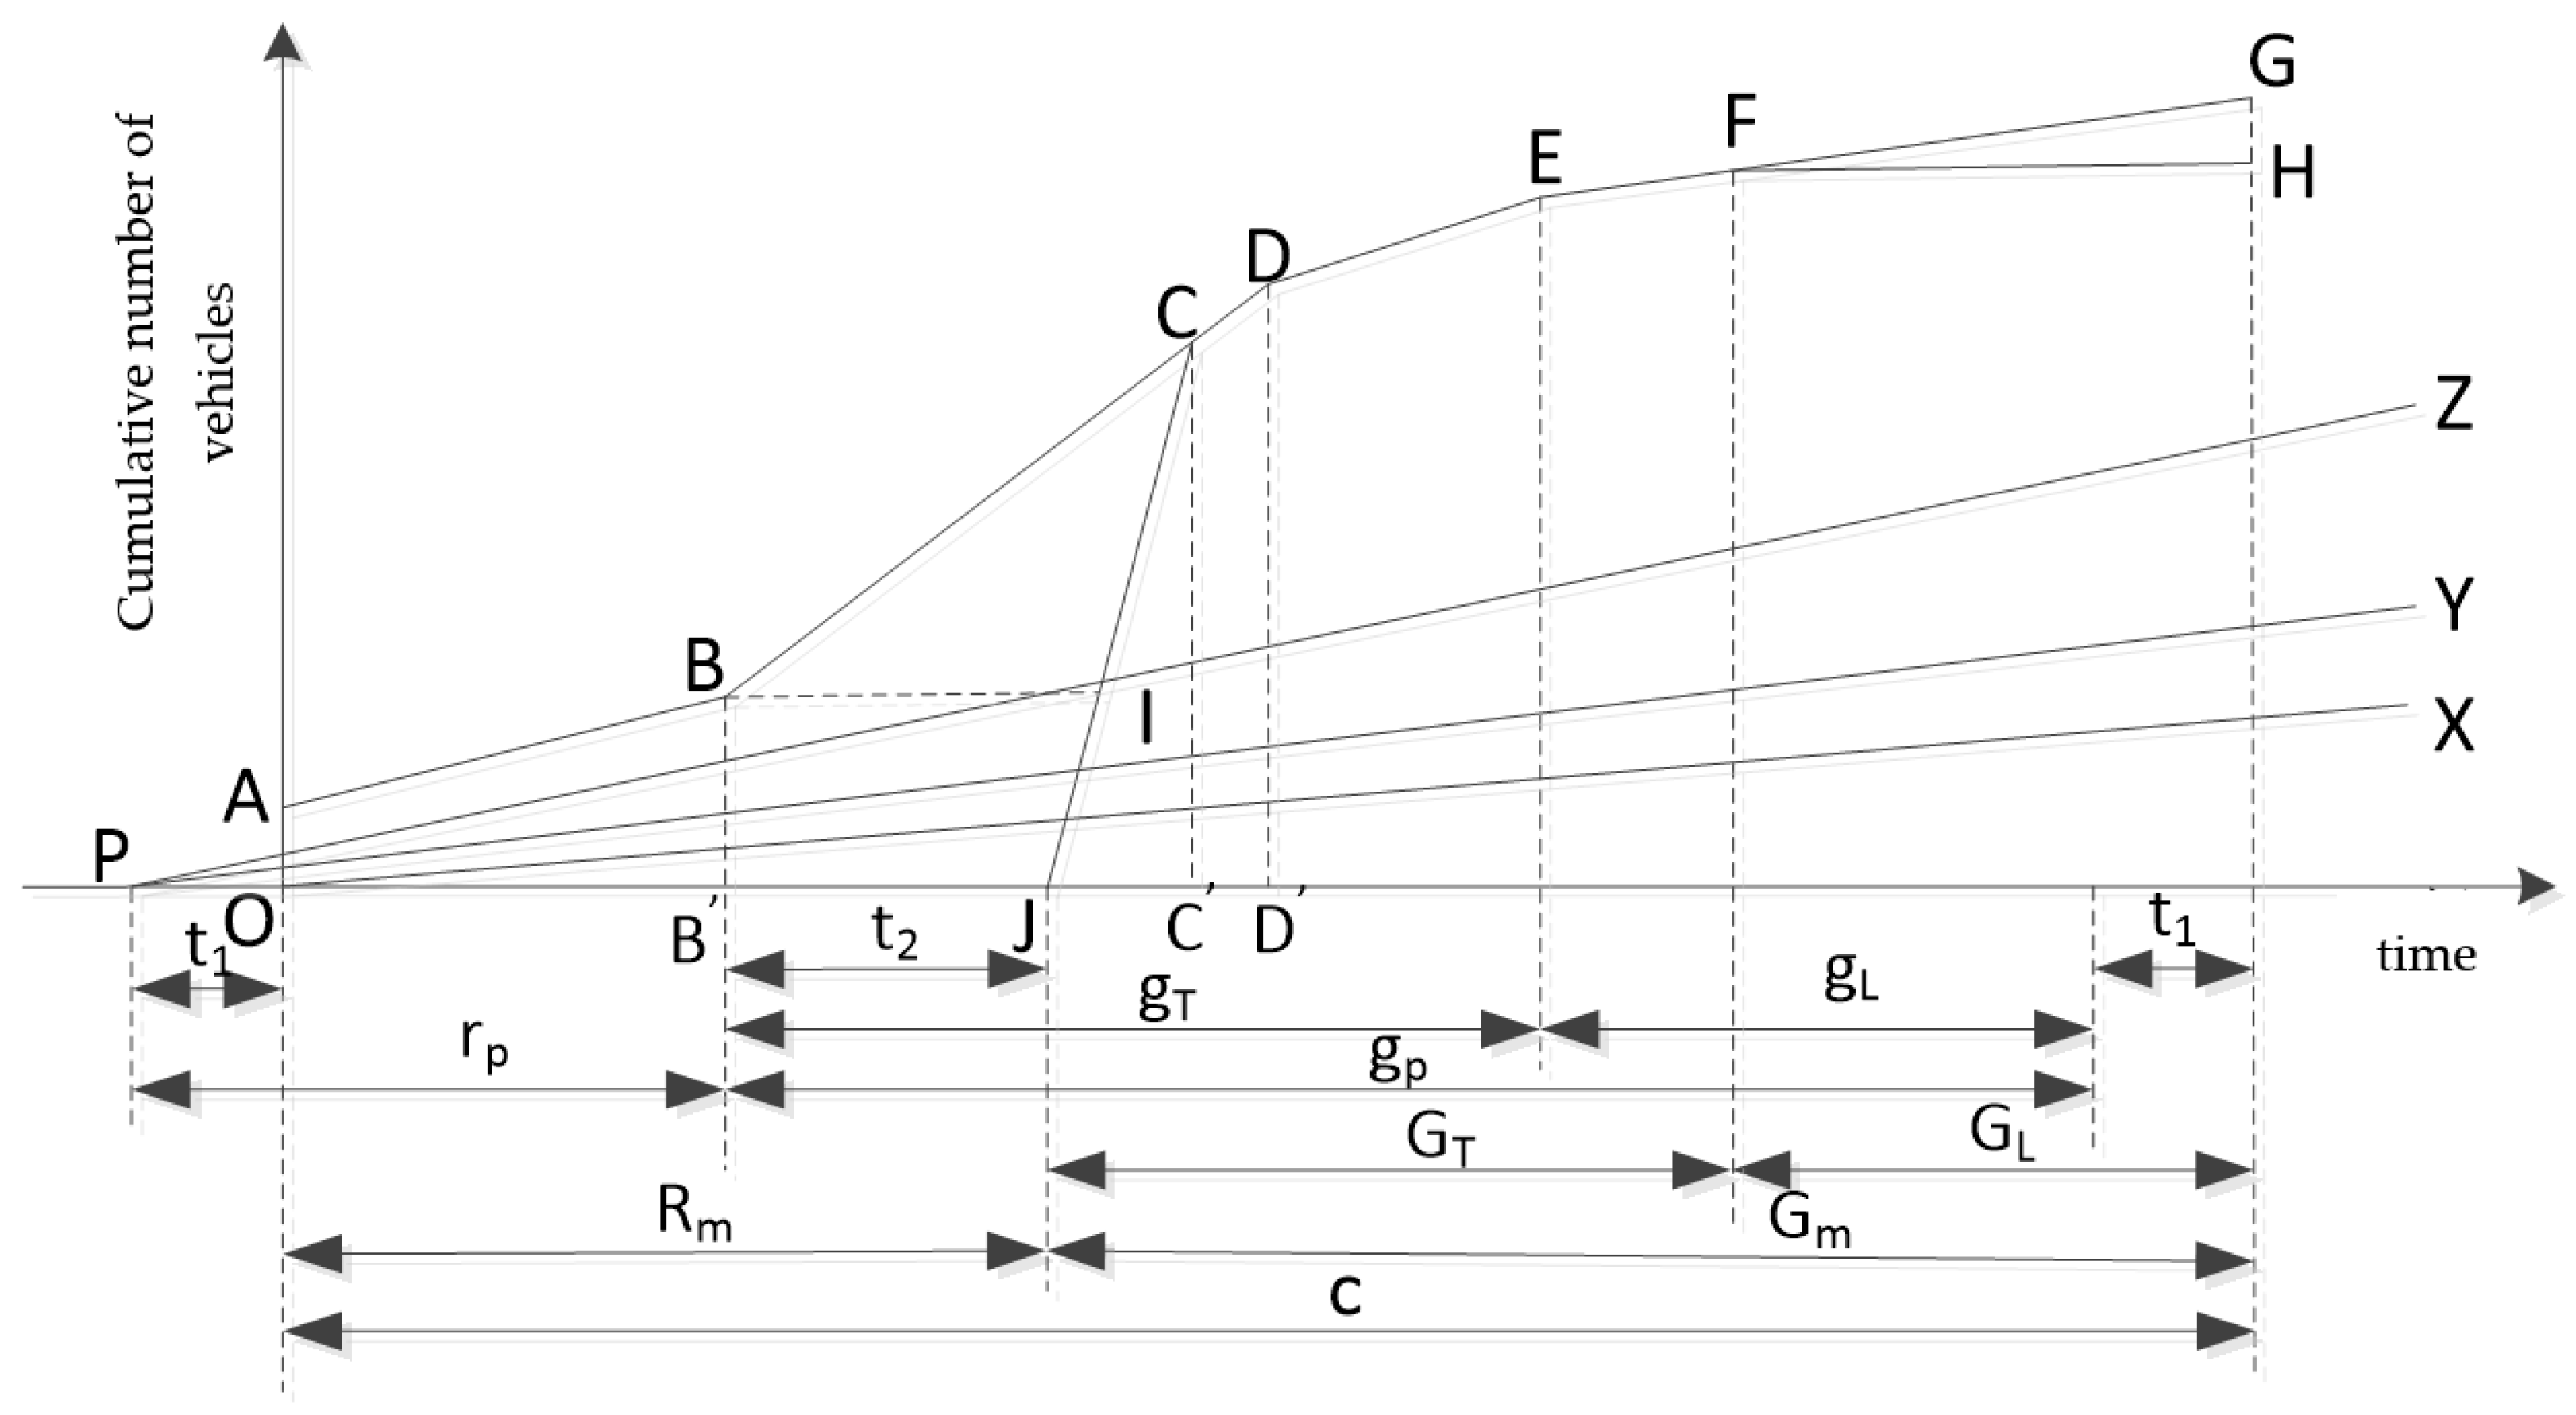
Figure 9 shows the process of the arrival and departure of straight vehicles at the main signal. The slope of the straight line, OX, is the arrival rate of the straight bus, the slope of the straight line, PY, is the arrival rate of the left-turn vehicle, and the slope of the straight line, PZ, is the arrival rate of the straight social vehicle.
The process of arrival and departure of straight vehicles at the main signal is analyzed as follows:
- The broken line ABCDEG indicates the process of vehicle arrival. At first, there are several buses waiting in line at the main signal before the red light of the main signal is on, the number used is the number of straight bus vehicles that arrive at the main signal along the bus lane, within the time frame when the main signal turns left at the green light in the previous week, that is, the OA section; in the AB phase, before the warning signal goes straight to the green light, only straight buses arrive at the main signal, and the vehicle arrival rate is the arrival rate of bus vehicles. In the BD phase, the pre-signal straight green light is on, and t2 is lit ahead of the main signal green light. The straight social vehicles waiting at the pre-signal enter the “sorting area” at the saturated flow rate until the queue dissipates, while the straight buses arriving during this period enter the “sorting area” along the bus lane. In the DE phase, the pre-signal is still in the state of straight green light, and the vehicle arrival rate at the main signal is the sum of the arrival rate of straight social vehicles and bus vehicles, which lasts until the end of the straight green light of the pre-signal. In the EG phase, the pre-signal left turns on the green light, and the straight social vehicles wait in line at the pre-letter signal. In this stage, only the straight buses arrive at the main signal along the bus lane until the green light turns left at the main signal. During this period, the arrival rate of the straight vehicles at the main signal is the arrival rate of the straight buses;
- The broken line JCDEFH indicates the departure process of the straight vehicle, whereby in the JC phase, the main signal straight green light is on, and the straight queued vehicles at the main signal will leave the intersection at the saturated flow rate until the straight queue at the main signal dissipates, and the dissipation time is the line segment JC in Figure 9. In the CD and DE stages, the main signal and the pre-signal are in the straight green state, and the vehicle departure rate is equal to the sum of the arrival rates of the straight bus vehicles and the straight social vehicles. In the EF stage, the pre-signal straight green light ends, the main signal is still in the straight green state, and the vehicle departure rate is equal to the bus arrival rate. In the FH phase, the main signal turns left, and the green light turns on, and the straight bus vehicles wait at the main signal along the bus lane; during this period, no direct traffic passes through the intersection. In the BD phase, all the straight social vehicles waiting at the warning signal enter the “sorting area” at the saturated flow rate until the queue dissipates, that is:
In Equation (1), is the entrance number of straight social vehicles at the pre-signal number at the intersection of “tandem design” (); S is the lane saturation flow rate (); is the queue dissipation time (s), of straight social vehicles at the pre-signal number, that is, the middle section of Figure 9.
From Equation (1):
In the JC phase, the sum of the straight buses and social vehicles queuing at the main signal is the number of queued vehicles dissipating at the saturated flow rate, that is:
In Equation (3), is the number of entrance lanes at the main signal of the intersection (); at the main signal, the queue dissipation time (s), of straight vehicles at the main signal, that is, the line segment JD’ of Figure 9.
From Equation (3):
The sum of polygonal OABIJ and triangular FGH areas in Figure 9 represents the total delay of straight traffic at the main signal in a cycle. Among them, only the straight bus arrives at the main signal in the AB stage, so the polygonal OABCJ area indicates the delay of the straight bus during this period; after the pre-signal straight green light is on, the straight bus and the straight social vehicle mix together to reach the main signal, so the triangular BCI area is the sum of the delay of the straight bus and the straight vehicle. After the green light is turned on at the left of the pre-signal, only the straight bus vehicles arrive at the main signal along the bus lane, and after the green light is turned on at the left of the main signal, the straight bus vehicles wait in line at the main signal, so the triangular FGH area indicates the delay of the straight bus.
Therefore, the total delay of the straight bus at the intersection is the sum of partial triangular BCI area, triangular FGH area and polygonal OABIJ area:
where is the total delay of the straight bus at the main signal (); is the quadrilateral BCI area (); is the triangular FGH area (); is the polygonal OABIJ area (); is the arrival rate of the straight bus (); is the arrival rate of straight social vehicles ().
Among them, is the proportion of the total number of vehicles arriving at the main signal during the period when the straight green light of the advance signal is turned on and the queue at the main signal dissipates, and the straight bus vehicles arriving at the main signal account for the total number of vehicles arriving at the main signal during this period. The partial triangular BCI area, triangular FGH area, and polygonal OABIJ area are calculated with Equations (6)–(8):
Therefore, the average delay of straight buses is:
3.2. Delay Analysis of Straight Social Vehicles with the “Tandem Design”
When double-stop lines are set up at intersections with the “tandem design”, the delay of straight social vehicles will occur at both the pre-signal and the main signal, so the delay is composed of two parts.
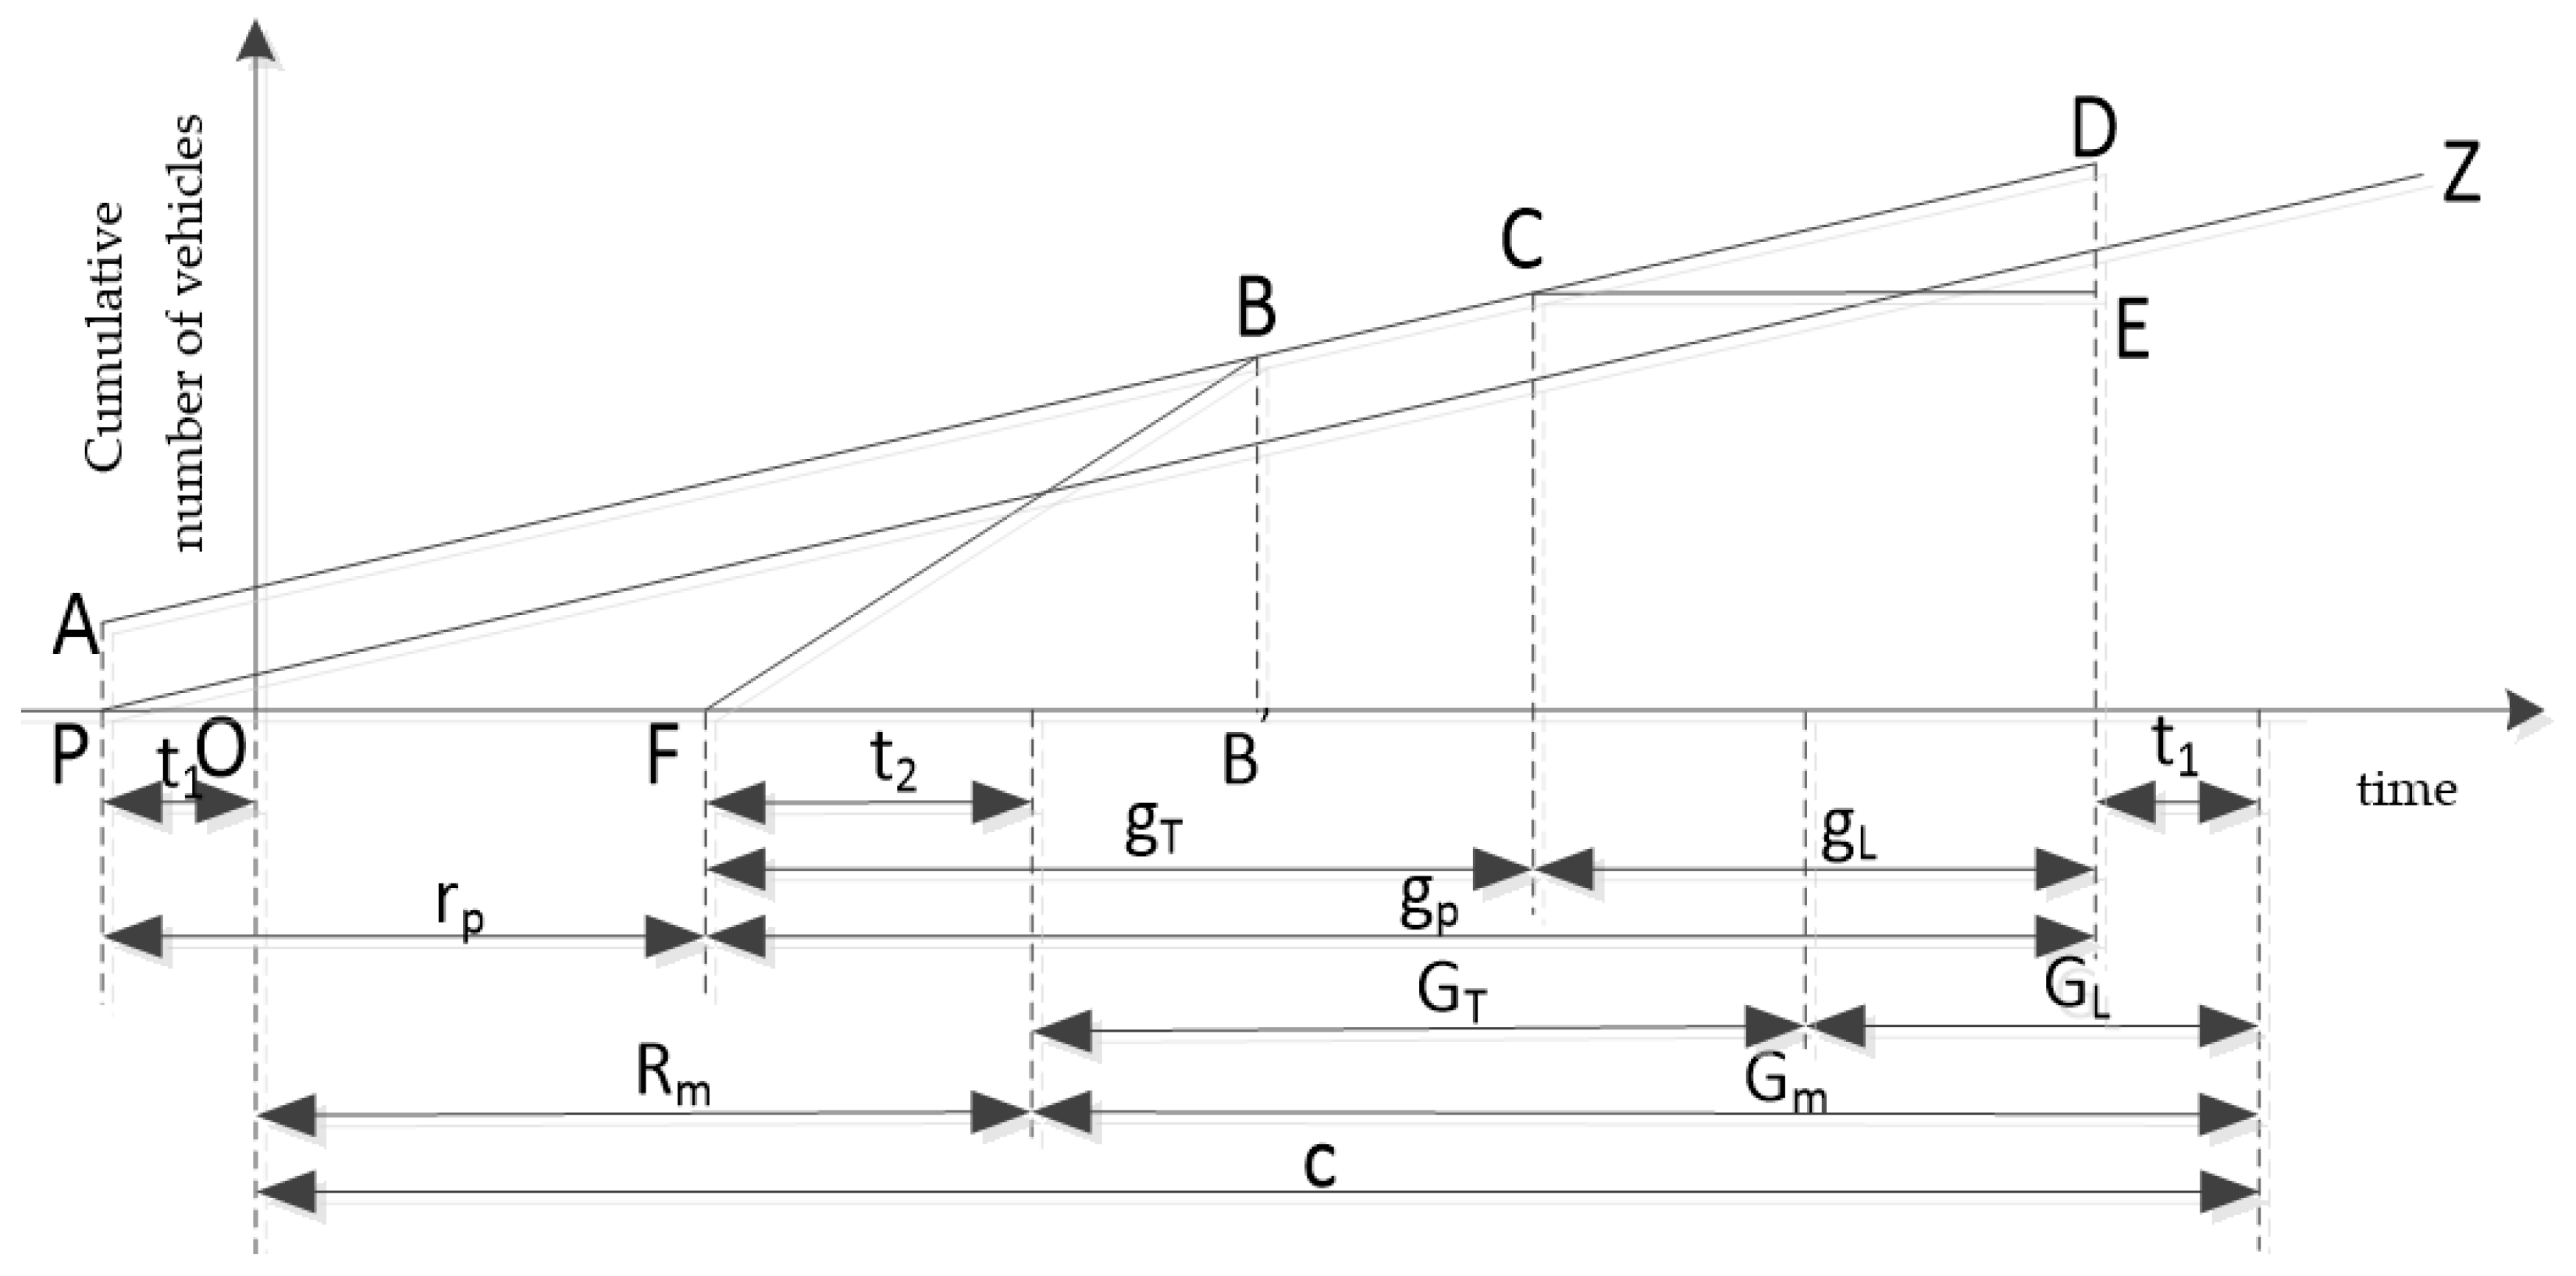
Figure 10 shows the process of arrival and departure of straight social vehicles at the advance signal.
The analysis of the arrival and departure process of the direct social vehicles at the pre-letter number is as follows:
- The straight line, AD, indicates the arrival process of the straight social vehicles, whereby several straight social vehicles have lined up at the pre-signal before the red light is on, and its number is the number of straight social vehicles arriving at the pre-signal during the green light and turning left in the previous cycle, that is, the PA section. In the AD stage, i.e., the whole pre-signal cycle, the straight social vehicles evenly reach the pre-signal, i.e., the straight-line AD slope is the arrival rate of straight social vehicles;
- The broken-line, FBCE, indicates the departure process of the straight social vehicle, whereby in the FB phase, the straight green light of the pre-signal turns on t2 ahead of the direct green light of the main signal, and the straight social vehicle enters the “sorting area” at the saturation flow rate, during which the queue of the straight social vehicle at the pre-signal signal dissipates. In the BC phase, the pre-signal is still in the state of straight green light, and the departure rate of the straight social vehicle is equal to its arrival rate until the end of the straight green light of the pre-signal. In the CE phase, the pre-signal turns left, the green light turns on, and the straight social vehicles wait in line at the pre-letter number.
The delay of the straight social vehicle at the advance signal is the sum of the area of the polygonal PABF and the triangular CDE in Figure 10, and the delay at the main signal is part of the quadrilateral BCDI area in Figure 9, so the total delay of the straight social vehicle is the sum of the polygonal PABF, triangular CDE, and part of the quadrilateral BCDI area:
where is the total delay of straight social vehicles at the entrance road (); is the polygonal PABF area (); is the triangular CDE area ()
Among them, is the time when the straight green light of the advance signal is turned on until the straight queue vehicles at the main signal dissipate, and the proportion of the straight social vehicles arriving at the main signal accounts for the total number of vehicles arriving at the main signal during this period.
It can be derived from Equation (2) that the queue dissipation time of straight social vehicles at the pre-signal number is , that is, the line segment FB’ of Figure 10, so the areas of polygonal PABF and triangular CDE are calculated by Equations (11) and (12), respectively:
Therefore, the average delay of straight social vehicles can be calculated as:
3.3. Delay Analysis of Left-Turn Vehicles with the “Tandem Design”
Double-parking lines are set up at the intersection with the “tandem design”, and the left-turn vehicle will cause delay at both the pre-signal and the main signal, so the delay is composed of two parts.
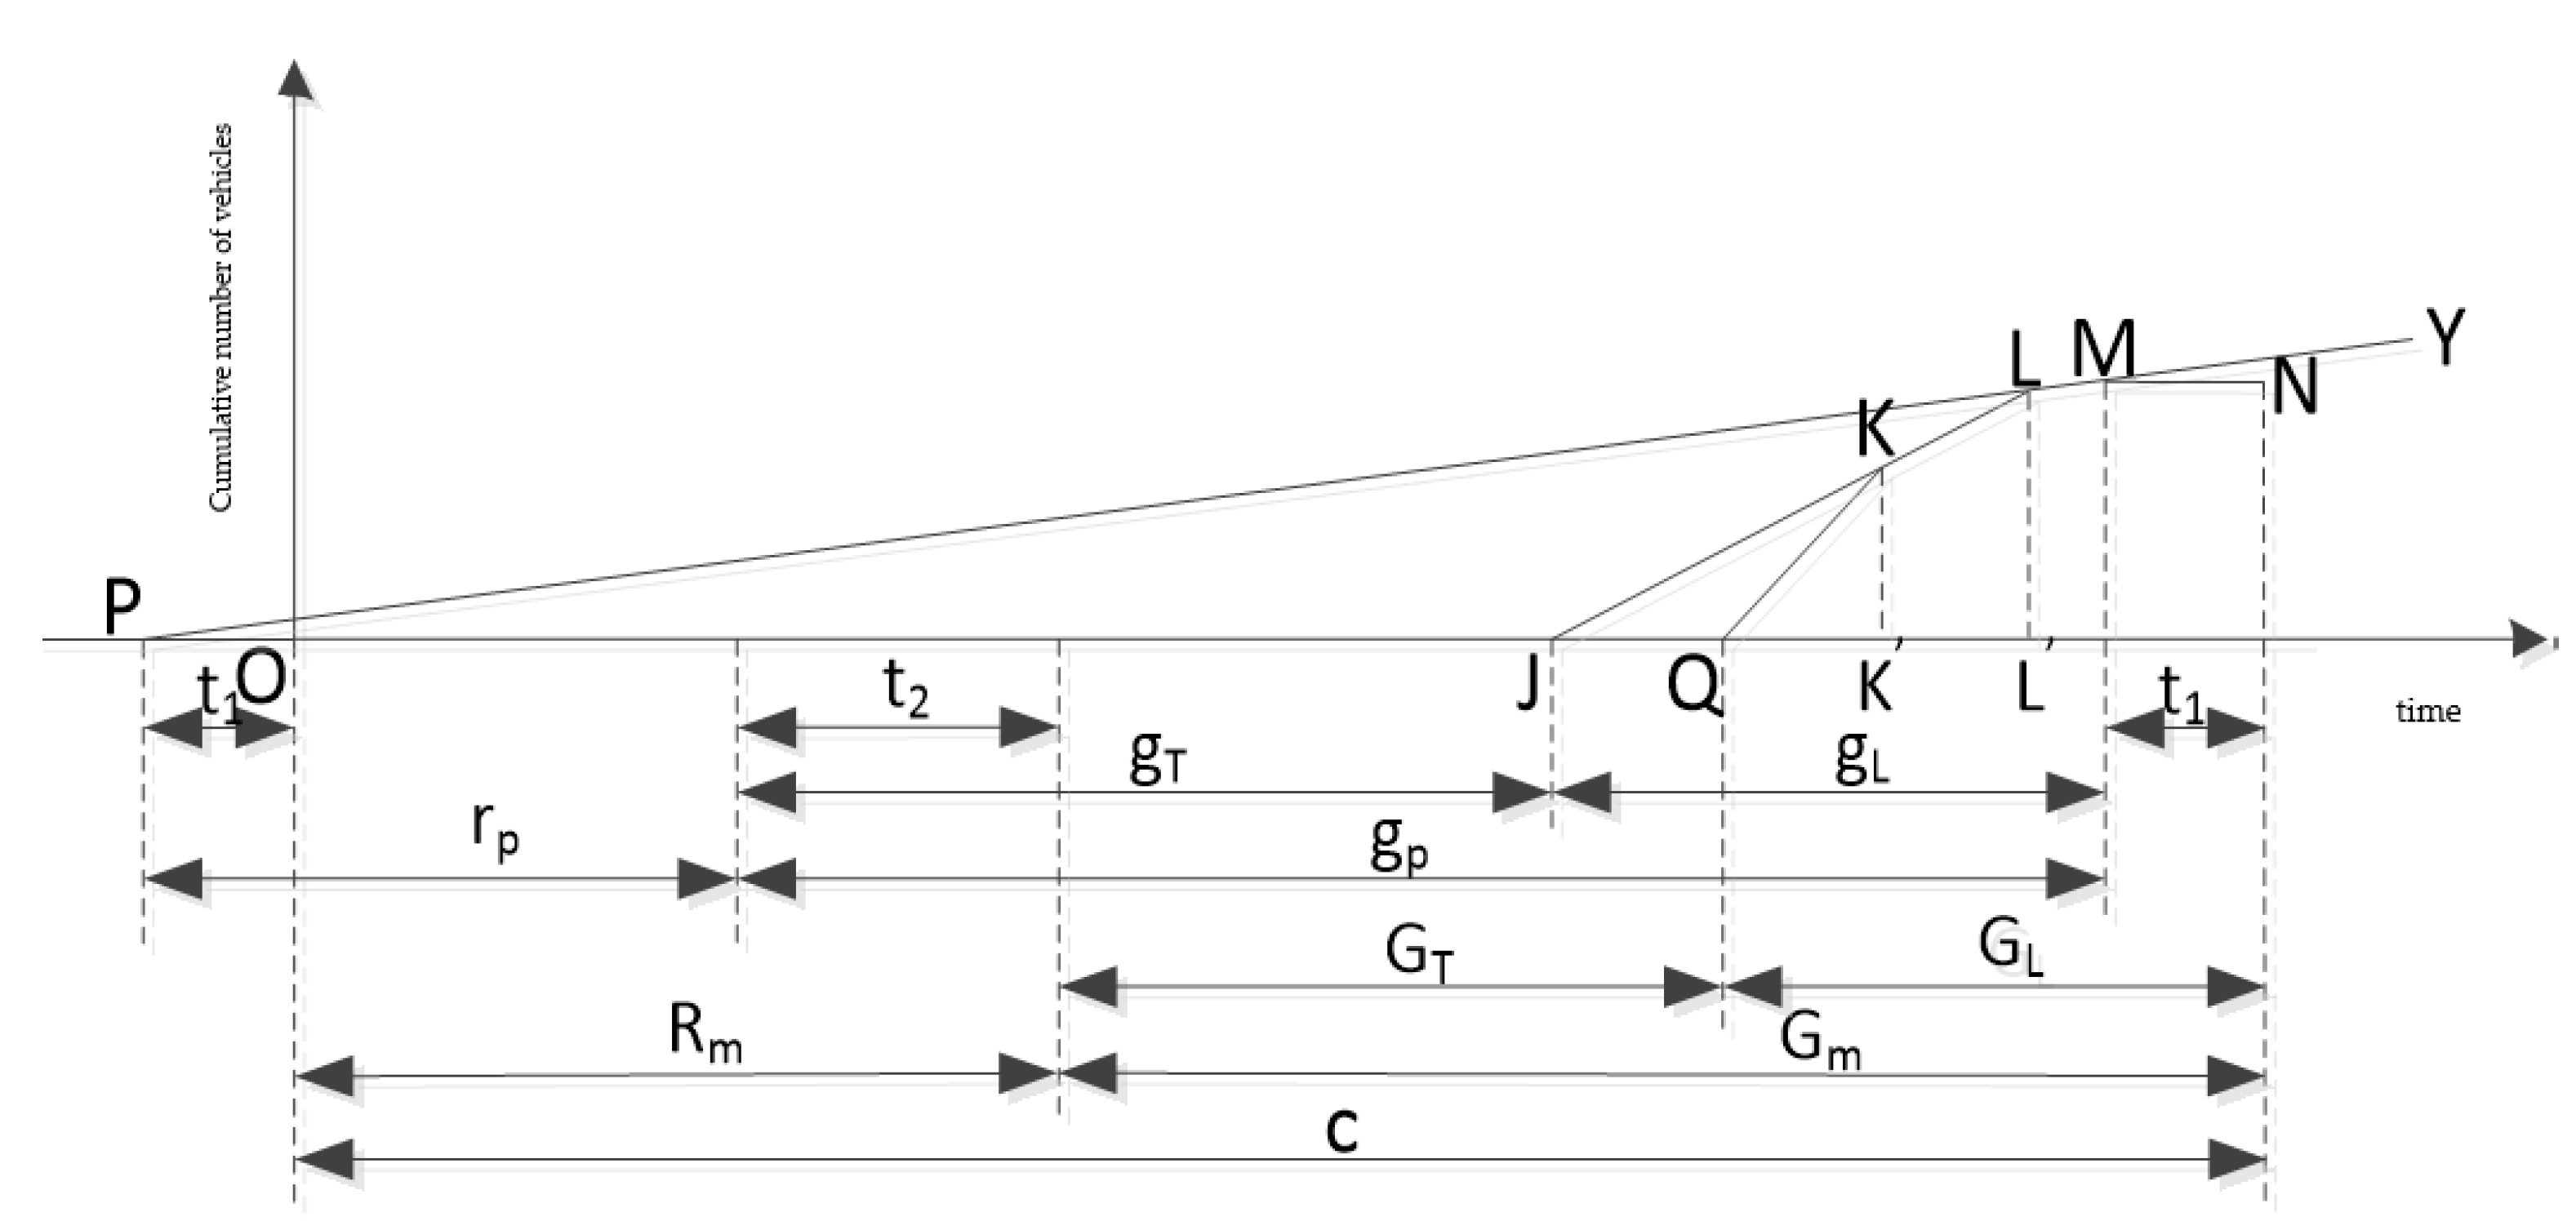
Figure 11 shows the arrival and departure process of the left-turn vehicle at the main signal.
The arrival and departure process of the left-turn vehicle at the main signal is analyzed as follows:
- The broken line, JLMN, indicates the vehicle arrival process, whereby in the JL stage, i.e., the left-turn green light of the pre-signal is on, and the left turn vehicles queuing at the advance signal enter the “sorting area” at the saturated flow rate. During this period, the left-turn vehicles queue at the pre-signal dissipates, i.e., in the LM stage of the central section of Figure 11, the pre-signal is still left-turn green, and the vehicle arrival rate at the main signal is equal to the left-turn green rate, which continues until the end of the left-turn green light of the pre-signal. In the MN phase, the pre-signal left-turn green light ends, and the pre-signal red light turns on t1 ahead of the main signal red light, while the left-turn vehicles wait in line at the pre-signal signal, and no left-turn vehicles arrive at the main signal at this stage;
- The broken line. QKLMN. indicates the departure process of the vehicle, wherein the left-turn green light is turned on at the QK stage, during which the left turn vehicle passes through the intersection at a saturated flow rate until the queue dissipates, i.e., in the middle section of Figure 11 QK’. In the KL and LM stages, the main signal and the pre-signal are both left-turn green, and the vehicle departure flow rate at the main signal is equal to the left-turn vehicle arrival rate, which continues until the end of the green light of the pre-signal. In the MN stage, the main signal is still left-turn green, but the pre-signal left-turn green light ends, and at this stage, no left-turn vehicles arrive at the main signal, i.e., no left-turn vehicles leave at the main signal, which is equivalent to emptying the “sorting area”.
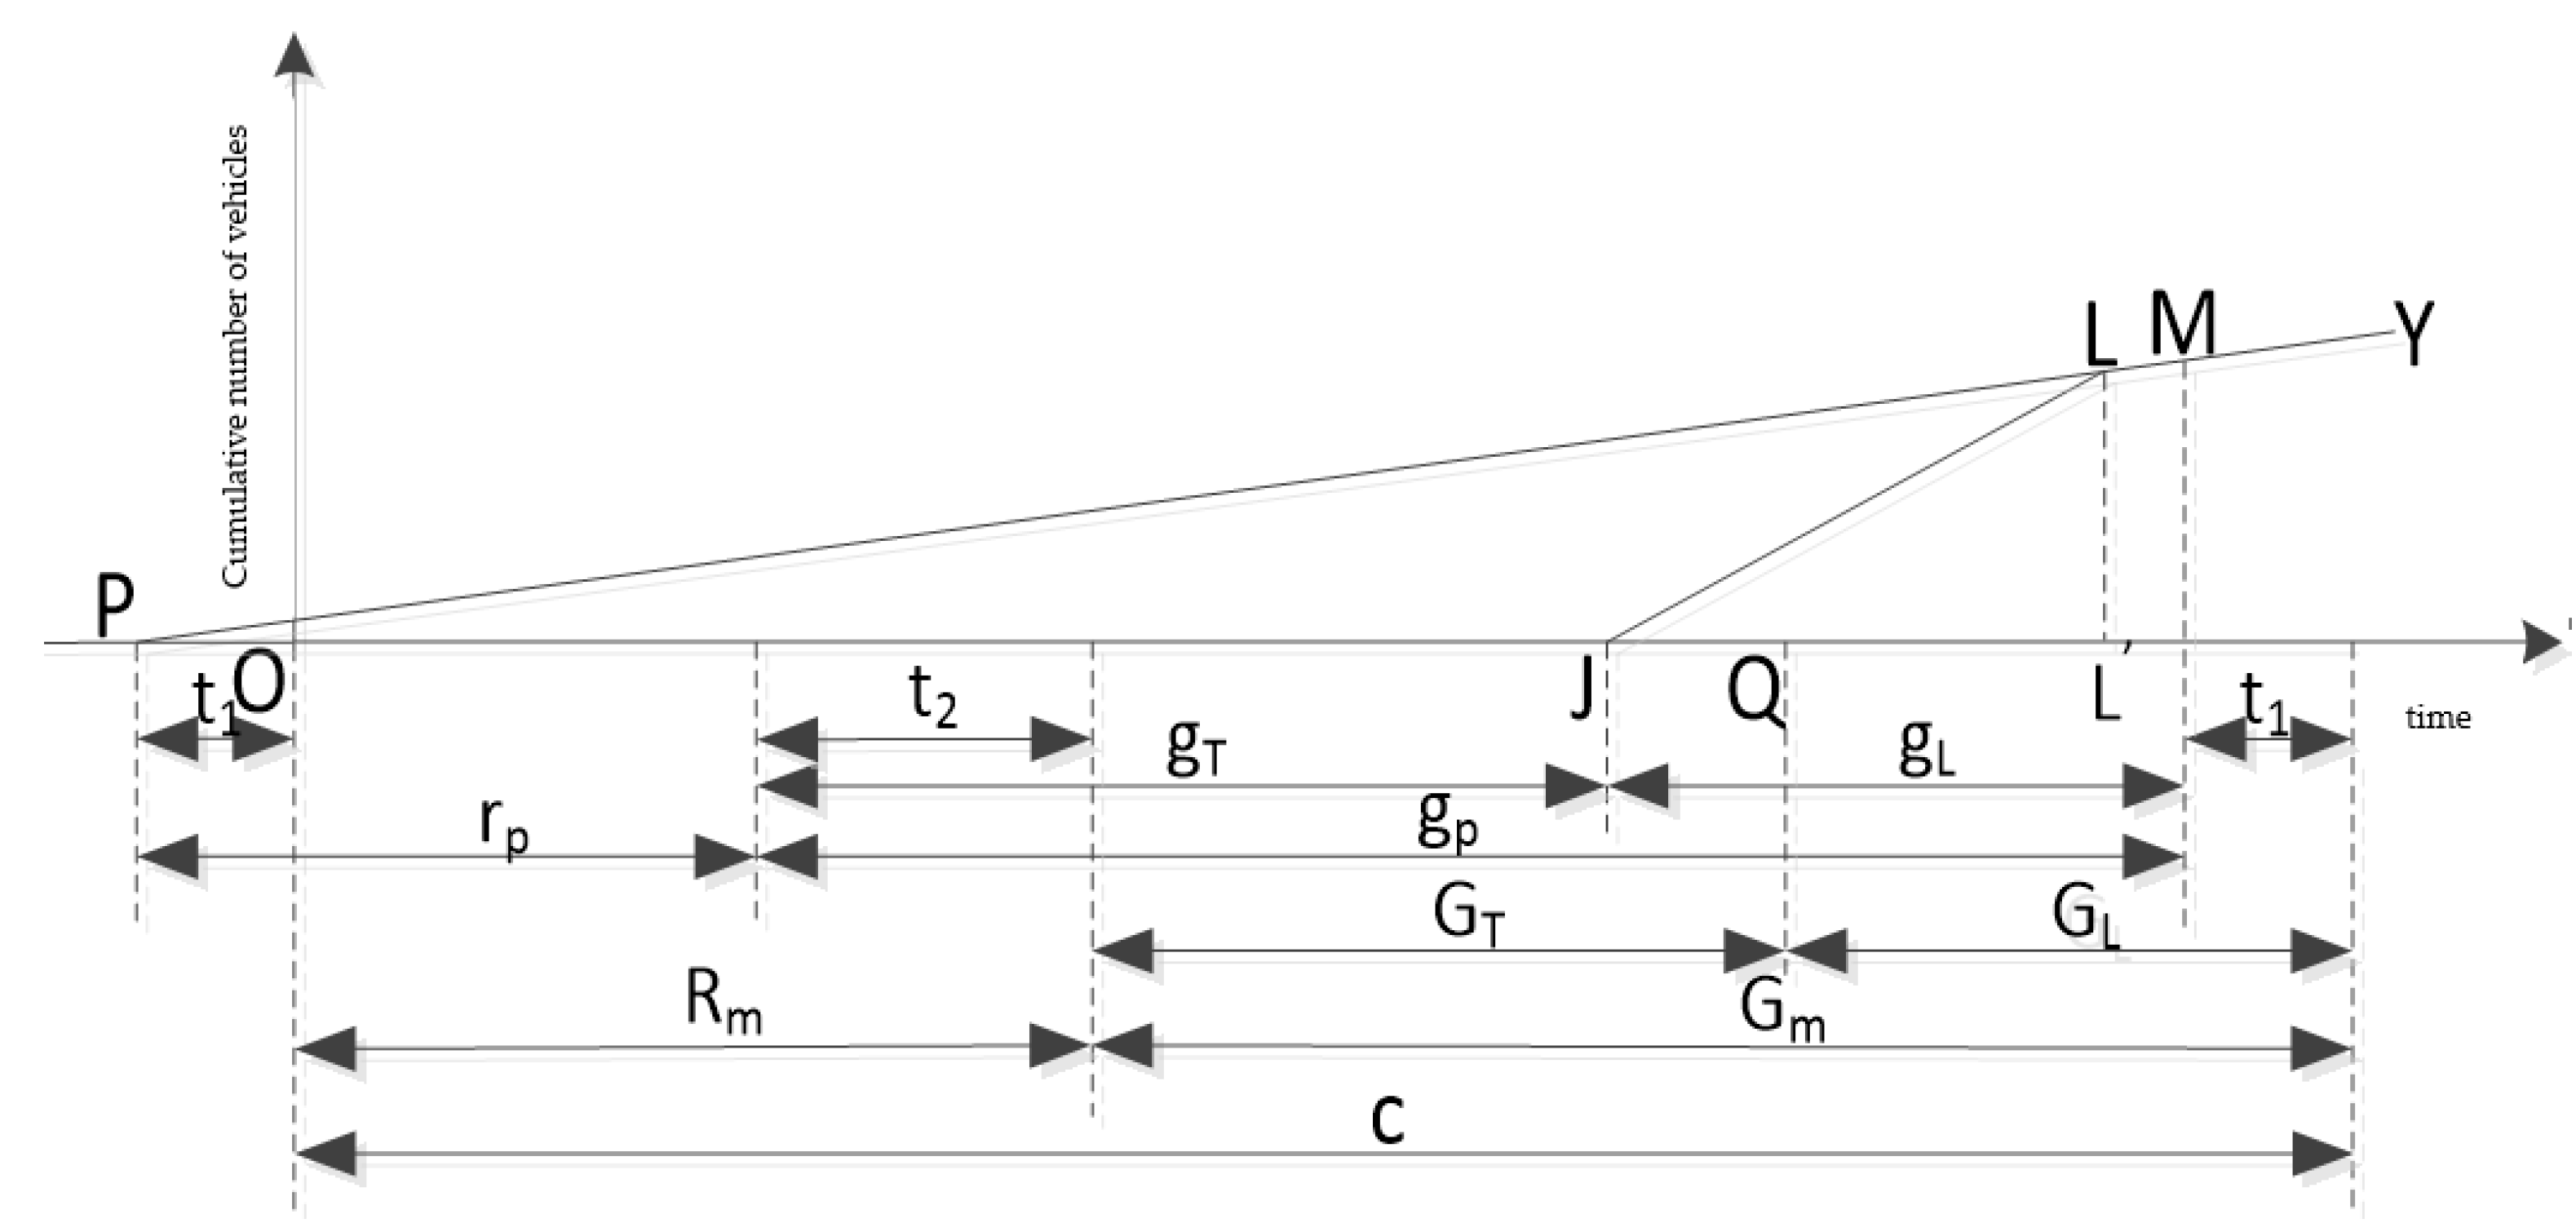
Figure 12 shows the arrival and departure of the left-turn vehicles at the warning signal.
Analysis of the Arrival and Departure Process of Left-Turn Vehicles at the Pre-Signal
- The straight line, PM, represents the vehicle arrival process, whereby in the PM stage, i.e., the whole pre-signal cycle, the left-turn vehicle reaches the pre-signal uniformly, i.e., the straight-line PM slope is the arrival rate of the left-turn vehicle;
- The broken line, JLM, indicates the vehicle departure process, whereby in the JL stage, the left-turn green light turns on; during this period the left turn vehicle passes through the pre-signal stop line at a saturated flow rate until the left turn queue vehicle dissipates at the advance signal, i.e., the JL’. The middle section of Figure 12 is in the LM stage, the pre-signal is still green, and the left-turn vehicle departure rate at the pre-signal is equal to the left-turn vehicle arrival rate until the end of the pre-signal left-turn green light.
The delay of left-turn vehicles at the main signal is the triangular JKQ area in Figure 11, and the delay at the advance signal is the triangular PLJ area in Figure 12, so the total delay of left-turn vehicles at the intersection is the sum of triangular JKQ and triangular PLJ areas is:
where is the total delay of the left-turning vehicle at the entrance, (); JKQ S is the triangular JKQ area (); is the triangular PLJ area ().
In the JL phase, the number of left-turn vehicles waiting at the pre-signal is the number of left-turn queuing vehicles entering the “sorting area”:
In Equation (15), is the number of left-turn vehicle entrance lanes at the pre-signal of “tandem design” intersection (); is the queue dissipation time (s) of left-turn vehicles at the pre-signal, i.e., JL’, in the middle section of Figure 12.
From Equation (15):
In the QK phase, the number of left-turn vehicles queuing at the main signal is the total number of left-turn queuing vehicles dissipating:
In Equation (17), is the number of left-turn vehicle entrance lanes at the “tandem design” intersection main signal (); is the main signal left-turn queuing vehicle dissipation time (s), i.e., Figure 11 midline QK’.
From Equation (17):
Therefore, the triangular JKQ area and triangular PLJ area can be calculated by Equations (19) and (20), respectively:
Therefore, the average delay of left-turn vehicles is as follows:
4. Results
The analysis of the change of intersection delay before and after adopting the “tandem design” is as follows.
Before the “tandem design” has been adopted at the intersection, the mixture of buses and social vehicles reaches the intersection evenly. During the period of straight green light and left-turn green light, bus vehicles and social vehicles have the same right to pass through the intersection; that is, the average delay is the same. At this point, the delay analysis of straight vehicles and left-turn vehicles without “tandem design” intersections is carried out.
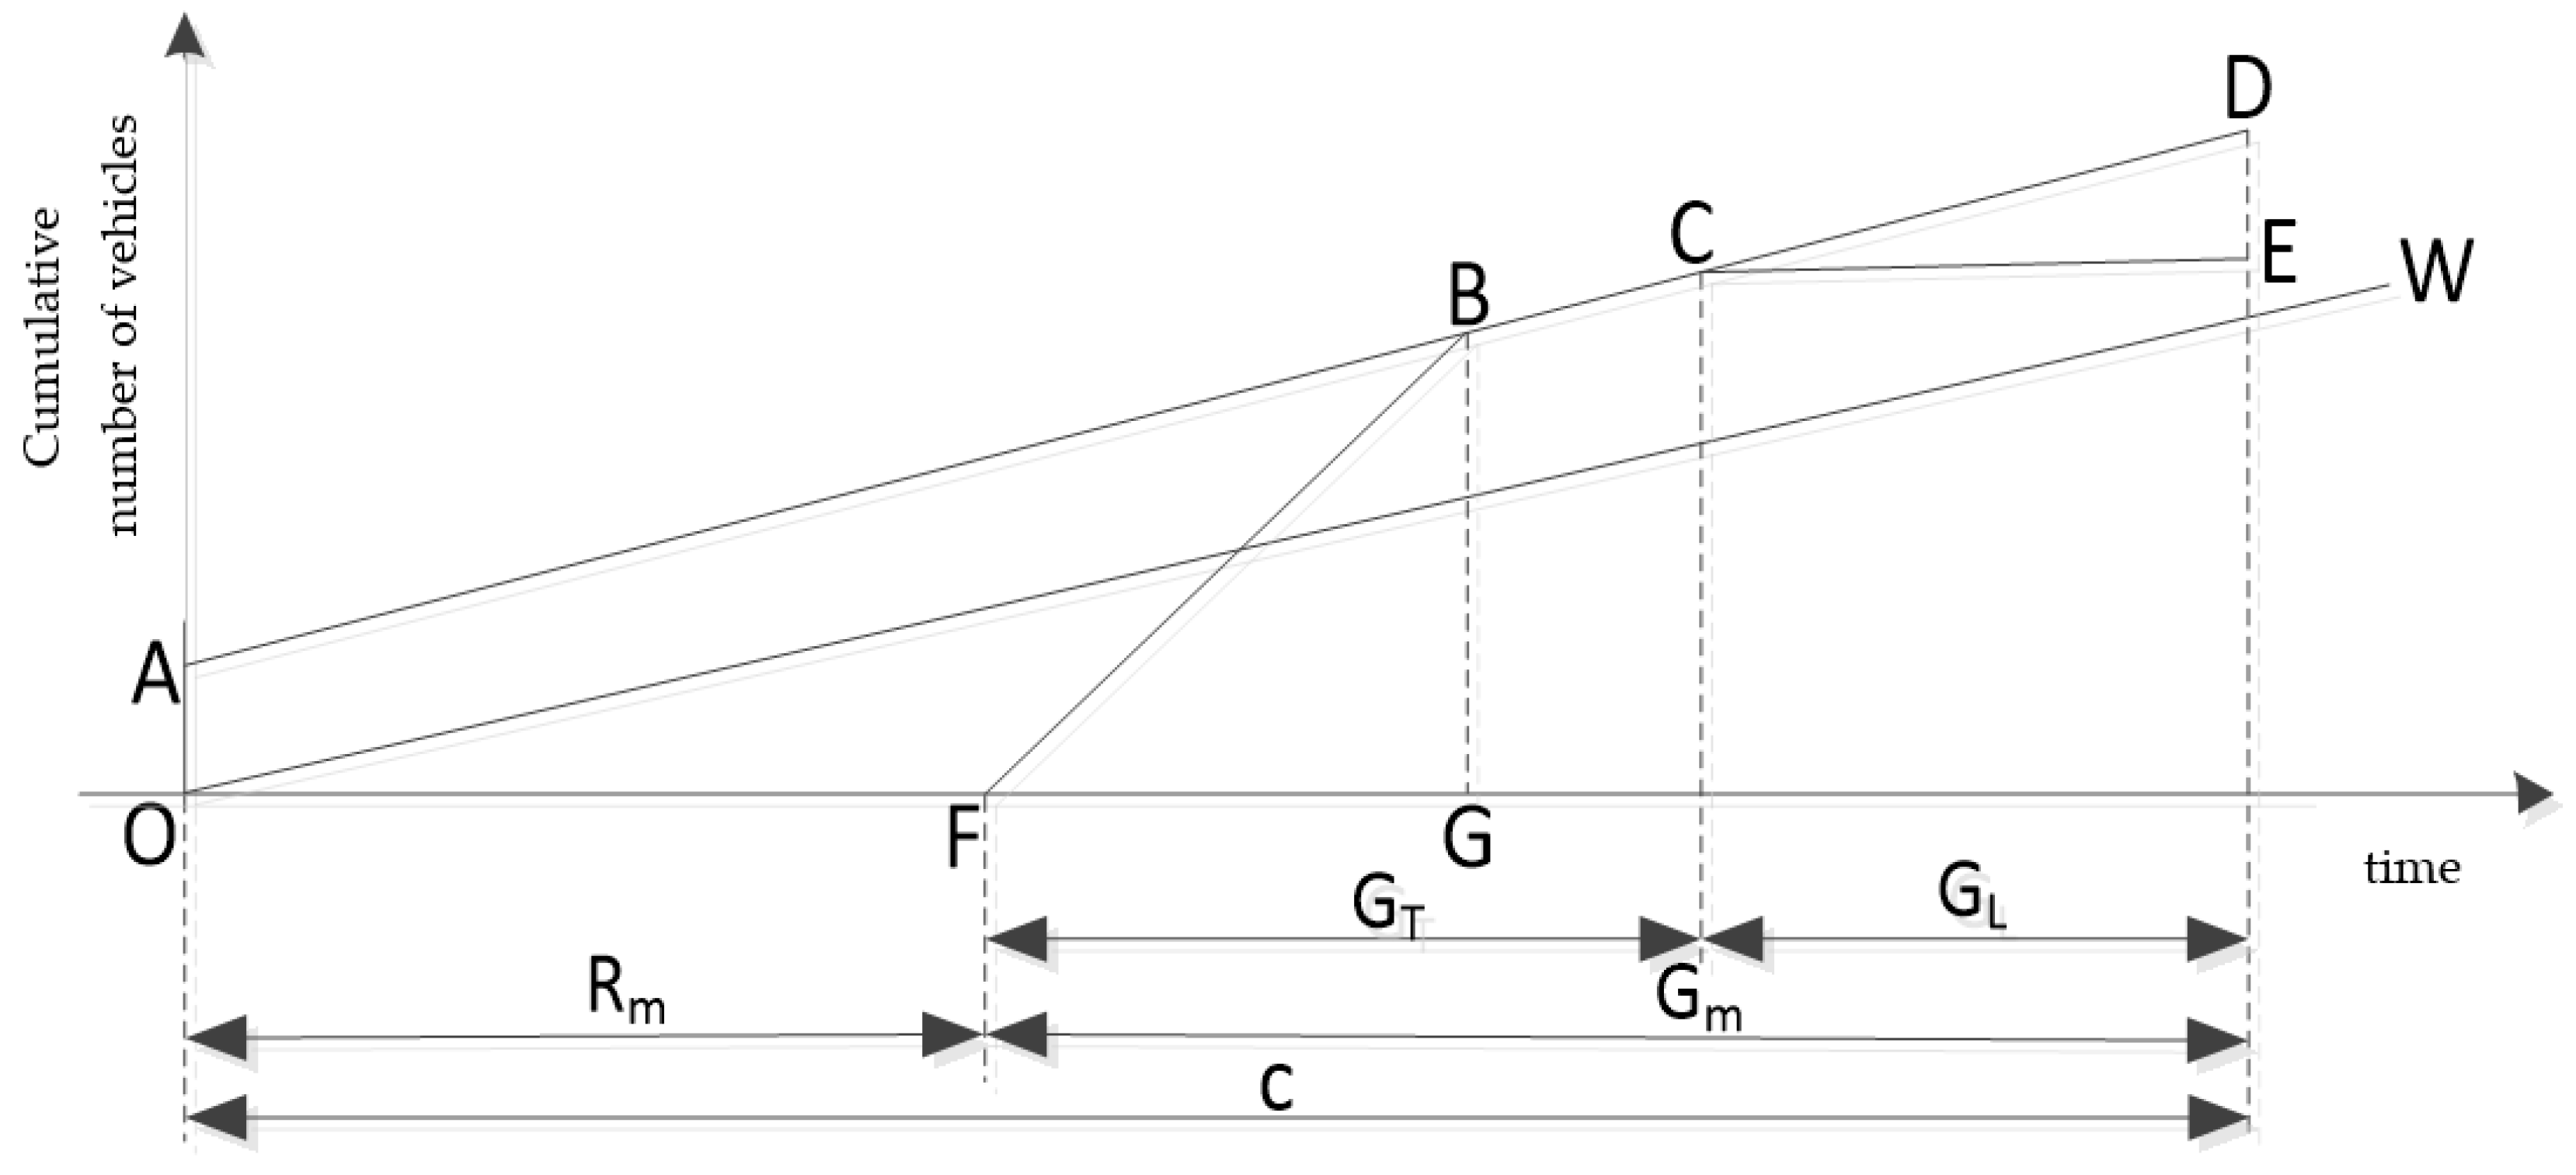
Figure 13 shows the arrival and departure process of straight vehicles at intersections without a “tandem design”. The slope of the straight line OW is the arrival rate of straight vehicles, that is, the sum of the arrival rates of straight social vehicles and straight buses. The straight line, AD, is the arrival process of straight vehicles, and the straight vehicles reach the intersection evenly. The difference between the two is that line AD has the initial cumulative number of vehicles while line OW does not. The broken line, FBCE, is the departure process of straight vehicles, whereby the straight green light is on at the intersection, and the vehicle passes through the intersection at a saturated flow rate until the queue dissipates at the FB stage. In the BC phase, the signal is still in the state of a straight green light, during which the departure rate of straight vehicles at the intersection is equal to the arrival rate of straight vehicles, and this continues until the end of the straight green light. In the CE phase, when the left-turn green light is on, straight vehicles wait in line at the intersection.
The delay of straight vehicles at the intersection is the sum of the area of the polygonal OABF and the triangular CDE in Figure 13:
In Formula (22), is the total delay of straight vehicles at the intersection without “tandem design” at the entrance road (); is the polygonal OABF area (); is the triangular CDE area ().
In the FB phase, the number of straight-line vehicles waiting in line at the intersection is the total number of straight-line vehicles dissipated:
In Formula (23), is the number of straight vehicle entrances at the intersection without a “tandem design” (); is the straight queue vehicle dissipation time (s), i.e., the central section FG of Figure 13.
From Equation (23):
The OABF area of polygons and the CDE area of triangles can be calculated using Equations (25) and (26), respectively.
Therefore, the average delay of straight vehicles without “tandem design” intersections is:
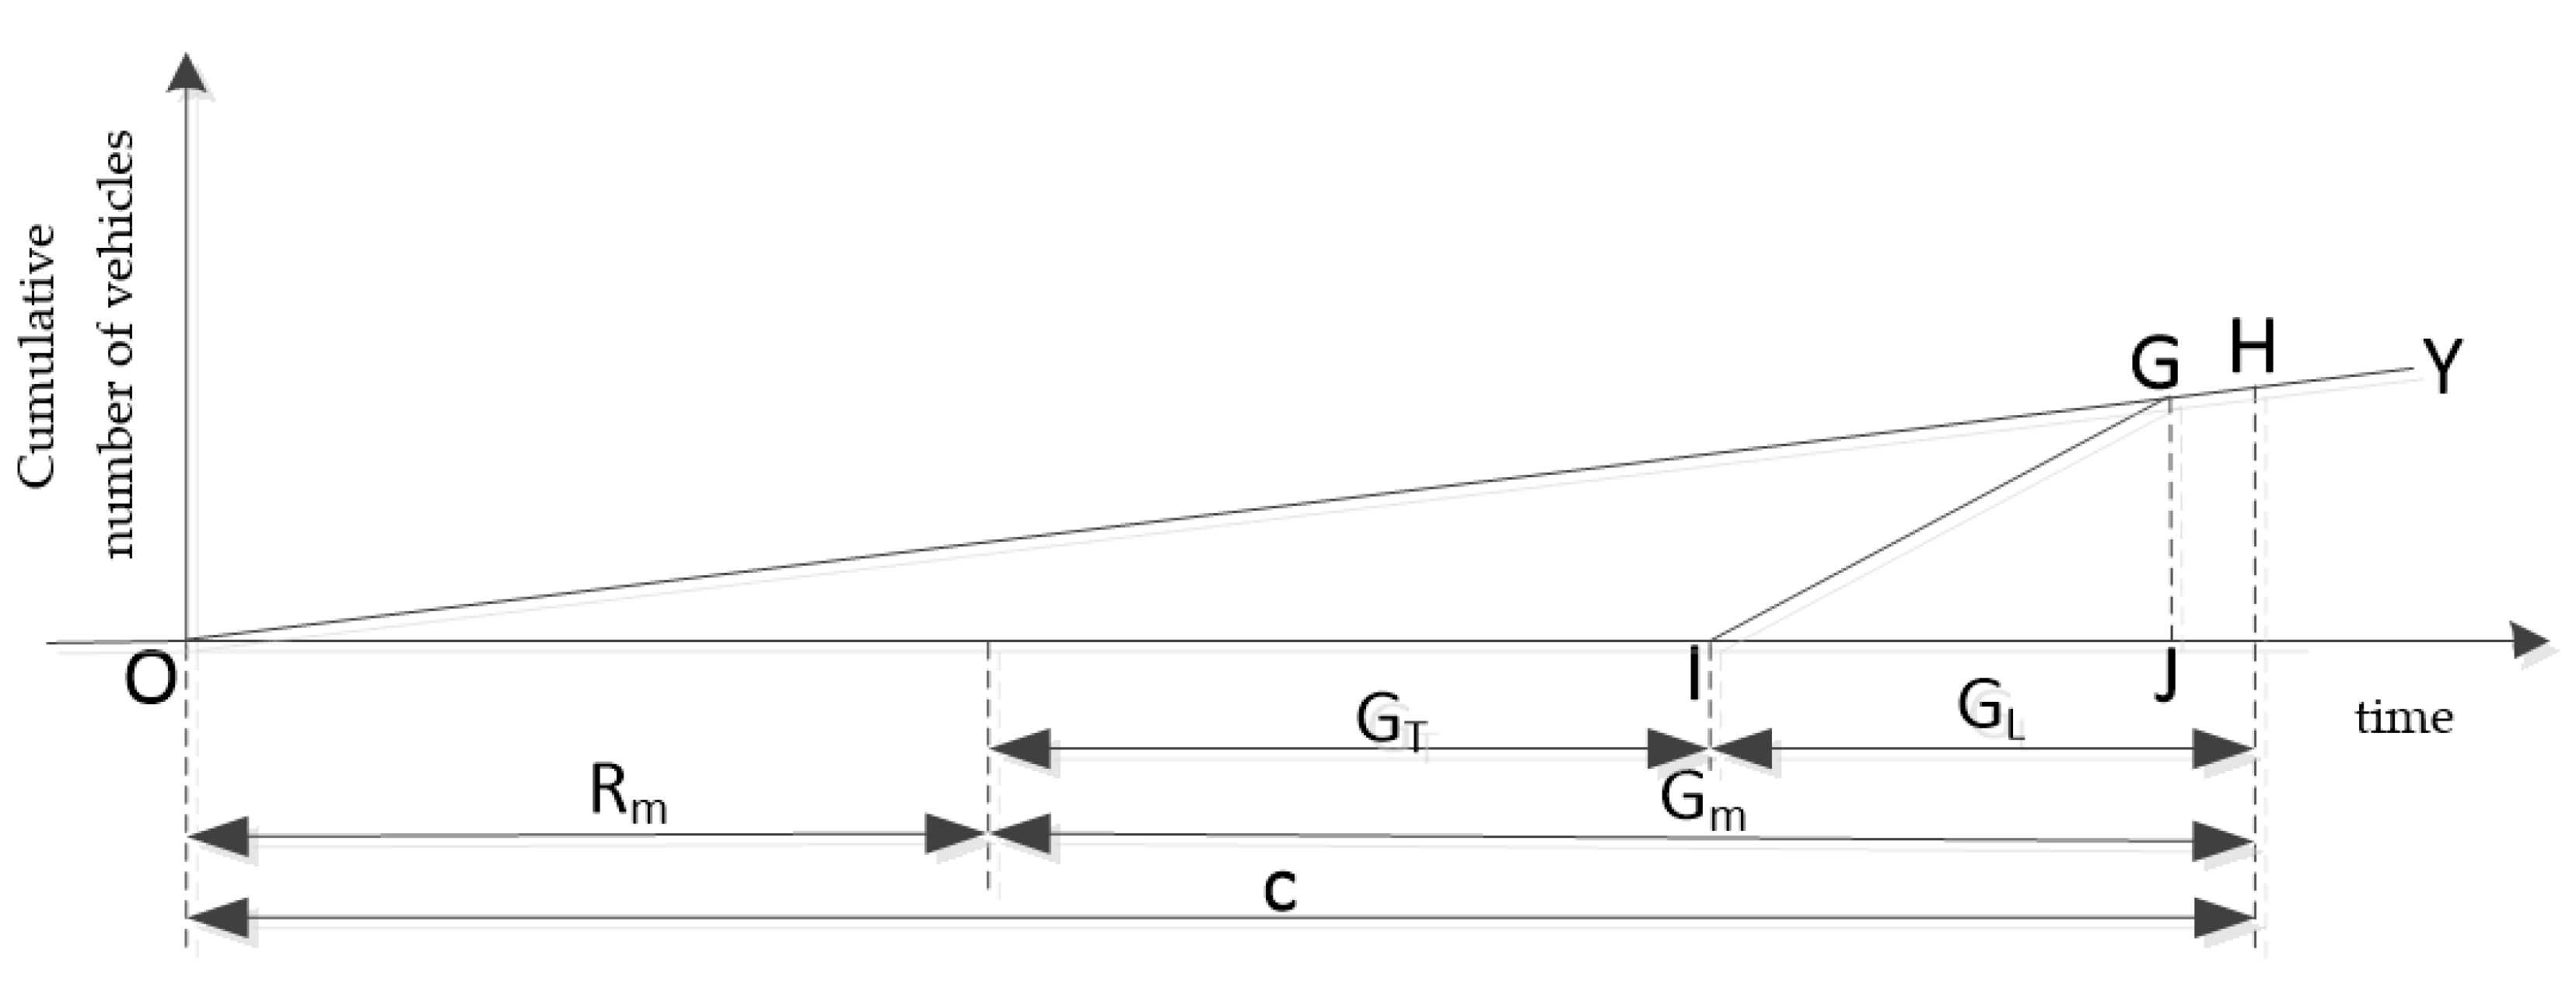
Figure 14 shows the arrival and departure process of left-turn vehicles at intersections without using the “tandem design”. The straight-line OY slope represents the arrival rate of left-turn vehicles. The straight line, OH, indicates the arrival process of the left-turn vehicle, and the left-turn vehicle arrives at the intersection evenly; the broken line, IGH, indicates the departure process of the left-turn vehicle, whereby in the IG phase, the left-turn green light turns on at the intersection, and the vehicle passes through the intersection at saturated flow rate until the queue dissipates. In the GH phase, the signal light is still in a left-turn green state, during which time the left-turn vehicle departure rate is equal to the left-turn vehicle arrival rate and continues until the left-turn green light ends.
In Formula (28), indicates the total delay of left-turn vehicles at the intersection without “tandem design” at that entrance road (); represents triangular OGI area ().
In the IG phase, the number of left-turn vehicles queuing at intersections is the number of left-turn queuing vehicles dissipating, that is,
In Formula (29), is the number of left-turn vehicle entrance lanes at the intersection without “tandem design” (); is the time (s), of the left-turn queue waiting for the vehicle to dissipate at the intersection, that is, IJ in the middle section of Figure 14.
From Formula (29):
The area of the triangle OGI can be calculated by Formula (31).
Therefore, the average delays of left-turn vehicles without “tandem design” intersections are as follows:
This paper analyzes the change of total human delay in one cycle of straight vehicles before and after adopting the “tandem design”. It is assumed that the average number of passengers carried by buses (converting buses into standard cars) is (person·pcu-1), and the average number of passengers carried by social vehicles is (person pcu-1). The change value of the total human delay in a cycle of straight vehicles is:
There is a signalized intersection with a special left-turn phase in a certain area, and the entrance road is four lanes. If we suppose that = 0.1 , = 0.4 ,=0.15 , signal period Cure 120 s, lane saturation flow rate S = 0.4 , and assume that the average number of passengers carried by public vehicles is = 30 person ·pcu−1, and social vehicles, the average number of passengers carried by = 2 person ·pcu−1.From the above basic data, the key parameters needed for the intersection to adopt “tandem design” can be determined in Table 1, and the result of delays can be shown in Table 2.
According to the results of the example, it can be concluded that after adopting the “tandem design” at an intersection, the bus delay is reduced by 27.9%, the straight social vehicle delay is slightly reduced by 0.5%, and the left-turn vehicle delay is reduced by 5.9%. In one cycle, the total delay of straight vehicles is reduced by 4051.2 s, and the per capita delay is reduced by 8.9 s.
When the “tandem design” is adopted on the entrance road, the calculation results show that the bus delay is significantly reduced, and the straight social vehicle delay is slightly reduced, which will not significantly affect the driving efficiency of the straight social vehicle, and the left-turn vehicle delay is reduced. The calculation results verify the effectiveness of the “tandem design” method at the entrance of the intersection.
5. Conclusions
The development of urban public transport is an important measure to alleviate urban congestion, improve the environment, and improve the efficiency of urban traffic operations. As an important part of urban transport, it is particularly important to improve the attractiveness of public transport, so the concept of “public transport priority” has been put forward, and many scholars around the world have carried out research on the realization of public transport priority in terms of time and space. This article is based on this context, taking an intersection with a left-turn special phase as the research object. On the basis of its fixed timing, the intersection adopts a “tandem design”, divides the “sorting area” in its upstream lane, and reorganizes the traffic in the upstream lane. All kinds of vehicles can make full use of all lanes of the entrance road and also enable buses to pass through the intersection first. Then, the delay changes of straight buses, straight social vehicles, and left-turn vehicles at intersections before and after adopting “tandem design” are analyzed, and an example is given to demonstrate the design. The results show that the demonstrated design can significantly reduce bus delays. The effect of straight social vehicle delay is not obvious, the left-turn vehicle delay is reduced, and the per capita delay is reduced. Based on the assumption that there is a linear relationship between vehicle arrival and departure, this paper analyzes the vehicle delay when the intersection signal timing is fixed, and the author will further optimize the intersection signal timing with the goal of maximizing the traffic benefit at the intersection.
Compared with the traditional intersection design method, the advantage of the proposed “tandem design” method is that the bus can be given priority to enter the intersection, and all types of vehicles can make full use of all lanes and improve the lane utilization rate. At the same time, the phase duration of the main signal and pre-signal can vary according to the proportion of left-turn vehicles. However, there are drawbacks: this paper only studies the priority of straight buses and does not consider the priority of left-turn buses. Establishing ways to realize the priority of a left-turn bus needs to be further studied. When analyzing the delay at intersections, this paper is based on the assumption that the arrival and departure of vehicles are linear, which has a certain deviation from the actual situation. The next step is to make a more in-depth study of the laws of vehicle arrival and departure and to draw a more realistic vehicle arrival and departure curve. This paper takes a single intersection as the research object; ways to extend the research object to adjacent intersections and the coordination of adjacent intersections need to be further explored.
Author Contributions
Methodology, validation, formal analysis, investigation, data curation, writing—original draft preparation, visualization, Y.S.; conceptualization, J.L. and Y.S.; software, resources, X.W.; writing—review and editing, Y.S., J.L. and Y.J.; supervision, J.L. and Y.J. All authors have read and agreed to the published version of the manuscript.
Funding
This research received no external funding.
Institutional Review Board Statement
Not applicable.
Informed Consent Statement
Not applicable.
Data Availability Statement
Not applicable.
Conflicts of Interest
The authors declare no conflict of interest.
References
- Zhang, T. Design and Simulation of Urban Bus Priority Signal Control Scheme; Southwest Jiaotong University, 2016. Available online: https://kns.cnki.net/KCMS/detail/detail.aspx?dbname=CMFD201602&filename=1016907368.nh (accessed on 18 August 2021).
- Zhang, Y. Research and Simulation of Signal Control of Urban Intersection Based on Bus Priority; Dalian Jiaotong University: Dalian, China, 2018; Available online: https://kns.cnki.net/KCMS/detail/detail.aspx?dbname=CMFD201901&filname=1019039022.nh (accessed on 20 August 2021).
- Yang, S. Research on Bus Priority Setting Method at Signalized Intersection; Beijing Jiaotong University: Beijing, China, 2010; Available online: https://kns.cnki.net/KCMS/detail/detail.aspx?dbname=CMFD2010&filename=2010120605.nh (accessed on 20 August 2021).
- Xu, M. Study on the Optimization Method of Urban Ground Bus Signal Priority. 2018. Available online: https://kns.cnki.net/KCMS/detail/detail.aspx?dbname=CDFDLAST2018&filename=1018260005.nh (accessed on 23 August 2021).
- Chen, X.; Yu, L.; Zhang, Y.; Guo, J. Analyzing urban bus service reliability at the stop, route, and network levels. Transp. Res. Part A. 2009, 43, 722–734. [Google Scholar]
- Lin, J.; Wang, P.; Barnum, D.T. A quality control framework for bus schedule reliability. Transp. Res. Part E 2007, 44, 1086–1098. [Google Scholar]
- Barabino, B.; Di Francesco, M.; Mozzoni, S. An Offline Framework for the Diagnosis of Time Reliability by Automatic Vehicle Location Data. IEEE Trans. Intell. Transp. Syst. 2017, 18, 583–594. [Google Scholar] [CrossRef]
- Barabino, B.; Lai, C.; Casari, C.; Demontis, R.; Mozzoni, S. Rethinking Transit Time Reliability by Integrating Automated Vehicle Location Data, Passenger Patterns, and Web Tools. IEEE Trans. Intell. Transp. Syst. 2017, 18, 756–766. [Google Scholar] [CrossRef]
- Transit Signal Priority: A Planning and Implementation Handbook. Available online: https://trid.trb.org/View/772546 (accessed on 1 August 2021).
- Eichler, M.; Daganzo, C.F. Bus lanes with intermittent priority: Strategy formulae and an evaluation. Transp. Res. Part B 2006, 40, 744. [Google Scholar]
- Zhao, J.; Wu, J. Application of Microscopic Simulation Technology in a Pre-Signal Control Method at a Complex Intersection; Asme Press: New York, NY, USA, 2010. [Google Scholar]
- Lee, J.; Shalaby, A. Rule-based transit signal priority control method using a real-time transit travel time prediction model. Can. J. Civ. Eng. 2013, 40, 68–75. [Google Scholar]
- Xuan, Y.; Daganzo, C.F.; Cassidy, M.J. Increasing the capacity of signalized intersections with separate left turn phases. Transp. Res. Part B Methodol. 2011, 45, 769–781. [Google Scholar]
- Wahlstedt, J. Impacts of Bus Priority in Coordinated Traffic Signals. Procedia Soc. Behav. Sci. 2011, 16, 578–587. [Google Scholar]
- Zhou, Y.; Zhuang, H. The optimization of lane assignment and signal timing at the tandem intersection with pre-signal. J. Adv. Transp. 2014, 48, 362–376. [Google Scholar]
- Guler, S.I.; Menendez, M. Analytical formulation and empirical evaluation of pre-signals for bus priority. Transp. Res. Part B Methodol. 2014, 64, 41–53. [Google Scholar]
- Zhou, Y.P.; Zhuang, H.B. Traffic Performance of Signalized Intersections with Protected Pre-Signal Established Upstream. Appl. Mech. Mater. 2013, 253–255, 1299–1306. [Google Scholar]
- Viegas, J.; Lu, B. The Intermittent Bus Lane signals setting within an area. Transp. Res. Part C Emerg. Technol. 2004, 12, 453–469. [Google Scholar]
- Wu, J.; Hounsell, N. Bus Priority Using pre-signals. Transp. Res. Part A Policy Pract. 1998, 32, 563–583. [Google Scholar]
- Zhang, H.; Liang, S.; Han, Y.; Ma, M.; Leng, R. Pre-Control Strategies for Downstream Bus Service Reliability with Traffic Signal. IEEE Access 2020, 8, 148853–148864. [Google Scholar]
- Long, K. Bus Priority Signal Control at Isolated Intersection. In Proceedings of the International Conference on Intelligent Computation Technology and Automation, Changsha, China, 20–22 October 2008; pp. 234–237. [Google Scholar]
- He, H.; Guler, S.I.; Menendez, M. Adaptive control algorithm to provide bus priority with a pre-signal. Transp. Res. Part C Emerg. Technol. 2016, 64, 28–44. [Google Scholar]
- Shao, J.; Yang, X.; Shi, C. Traffic design and analysis of partial zigzag bus priority entrance. J. Tongji Univ. (Nat. Sci. Ed.) 2001, 29, 1175–1180. [Google Scholar]
- Zhang, W.; Wang, W. Study on the pre-signal setting method of intersection based on bus priority traffic. Road Traffic Technol. 2004, 21, 101–104. [Google Scholar]
- Zhang, W.; Lu, H. Bus priority pre-signal control intersection vehicle delay analysis. China Highw. J. 2005, 18, 78–82. [Google Scholar]
- Zhang, B.; Cheng, W. Study on the coordination control strategy of pre-signal bus priority intersection. Roads Mot. Transp. 2016, 5, 28–32. [Google Scholar]
- Chen, X. Research on Bus Priority Control Method at Urban Intersection; Fuzhou University: Fuzhou, China, 2014; Available online: https://kns.cnki.net/KCMS/detail/detail.aspx?dbname=CMFD201602&filename=1015349704.nh (accessed on 23 August 2021).
- Chen, Y.; Chen, G.; Wu, K. Evaluation of Performance of Bus Lanes on Urban Expressway Using Paramics Micro-simulation Model. Procedia Eng. 2016, 137, 523–530. [Google Scholar]
- Barabino, B.; Bonera, M.; Maternini, G.; Olivo, A.; Porcu, F. Bus crash risk evaluation: An adjusted framework and its application in a real network. Accid. Anal. Prev. 2021, 159, 106258. [Google Scholar]
Figure 1.
Flowchart scheme.

Figure 2.
Roadside bus lane.

Figure 3.
Medium bus lane.

Figure 4.
Secondary bus lane.

Figure 5.
The layout of the entrance at the intersection where “tandem design” is not adopted.

Figure 6.
The signal control chart of the entrance road at the intersection where “tandem design” is not adopted.
Figure 6.
The signal control chart of the entrance road at the intersection where “tandem design” is not adopted.

Figure 7.
The layout of the entrance at the intersection where “tandem design” is adopted.

Figure 8.
Coordinate relationship between the main signals and pre-signal.

Figure 9.
The curve of through vehicles arriving and leaving at main signals.

Figure 10.
Curve of through-cars arriving and leaving at pre-signals.

Figure 11.
Curve of left-turning vehicles arriving and leaving at main signals.

Figure 12.
Curve of left-turning vehicles arriving and leaving at pre-signals.

Figure 13.
Curve of through-vehicles arriving and leaving at the intersection where a “tandem design” is not adopted.
Figure 13.
Curve of through-vehicles arriving and leaving at the intersection where a “tandem design” is not adopted.

Figure 14.
Curve of left-turning vehicles arriving and leaving at the intersection where the “tandem design” is not adopted.
Figure 14.
Curve of left-turning vehicles arriving and leaving at the intersection where the “tandem design” is not adopted.


Table 1.
Signal timing parameters.
| Rm | GT | GL | rp | gT | gL | t1 | t2 |
|---|---|---|---|---|---|---|---|
| 35s | 45s | 40s | 10s | 65s | 45s | 2s | 27s |
Table 2.
Traffic delays before and after adopting a “tandem design”.
| Type of Delay | Delay Object | Before “Tandem Design” | After “Tandem Design” | Reduced Delay | Reduce Proportion |
|---|---|---|---|---|---|
| Total vehicle delay(s·pcu) | Bus | 482.4 | 348.0 | 134.4 | 27.9% |
| Straight social vehicle | 1929.6 | 1920.0 | 9.6 | 0.5% | |
| Left-turn vehicle | 768.6 | 723.6 | 42 | 5.9% | |
| All vehicles | 3180.6 | 2991.6 | 189 | 5.9% | |
| Average vehicle delay(s) | Bus | 40.2 | 29.0 | 11.2 | 27.9% |
| Straight social vehicle | 40.2 | 40.0 | 0.2 | 0.5% | |
| Left-turn vehicle | 42.7 | 40.2 | 2.5 | 5.9% | |
| All vehicles | 40.8 | 38.4 | 2.4 | 5.9% | |
| Total pedestrian delay(s) | Bus | 14,472 | 10,440 | 4032 | 27.9% |
| Straight social vehicle | 3859.2 | 3840 | 19.2 | 0.5% | |
| All vehicles | 18,331.2 | 14,280 | 4051.2 | 22.1% | |
| Average pedestrian delay(s) | Bus | 40.2 | 29.0 | 11.2 | 27.9% |
| Straight social vehicle | 40.2 | 40.2 | 0.2 | 0.5% | |
| All vehicles | 40.2 | 31.3 | 8.9 | 22.1% |
Publisher’s Note: MDPI stays neutral with regard to jurisdictional claims in published maps and institutional affiliations. |
© 2021 by the authors. Licensee MDPI, Basel, Switzerland. This article is an open access article distributed under the terms and conditions of the Creative Commons Attribution (CC BY) license (https://creativecommons.org/licenses/by/4.0/).
Share and Cite
MDPI and ACS Style
Sun, Y.; Li, J.; Wei, X.; Jiao, Y. Tandem Design of Bus Priority Based on a Pre-Signal System. Sustainability 2021, 13, 10109. https://0-doi-org.brum.beds.ac.uk/10.3390/su131810109
AMA Style
Sun Y, Li J, Wei X, Jiao Y. Tandem Design of Bus Priority Based on a Pre-Signal System. Sustainability. 2021; 13(18):10109. https://0-doi-org.brum.beds.ac.uk/10.3390/su131810109
Chicago/Turabian StyleSun, Yutong, Jin Li, Xiaozhong Wei, and Yuling Jiao. 2021. "Tandem Design of Bus Priority Based on a Pre-Signal System" Sustainability 13, no. 18: 10109. https://0-doi-org.brum.beds.ac.uk/10.3390/su131810109
Note that from the first issue of 2016, this journal uses article numbers instead of page numbers. See further details here.