Article

The Role of Renewable Energy Sources in Dynamics of Energy-Related GHG Emissions in the Baltic States

by
Vaclovas Miškinis
,
Arvydas Galinis
,
Inga Konstantinavičiūtė
,
Vidas Lekavičius
* and
Eimantas Neniškis
Lithuanian Energy Institute, Breslaujos 3, LT-44403 Kaunas, Lithuania
*
Author to whom correspondence should be addressed.
Sustainability 2021, 13(18), 10215; https://0-doi-org.brum.beds.ac.uk/10.3390/su131810215
Submission received: 27 August 2021 / Revised: 9 September 2021 / Accepted: 10 September 2021 / Published: 13 September 2021
(This article belongs to the Special Issue Towards Sustainability: Energy and Carbon Efficiency)

Abstract

:
The deployment of renewable energy sources (RES) is an essential strategic objective of sustainable energy development in Estonia, Latvia and Lithuania. Their growing contribution to the total primary energy supply can significantly facilitate the transition to a low-carbon economy. The paper provides findings from an in-depth comparative analysis of RES deployment trends during 2010–2019 in the Baltic countries in the context of energy policy documents of the European Union (EU). The dynamics of targeted RES indicators according to the Renewables Directive 2009/28/EC and National Programmes and the role of renewable energies in mitigating climate change are analysed. A key role of the heating and cooling sector in deploying RES is highlighted and a necessity to implement radical changes in the transport sector of the Baltic countries is revealed. The paper examines changes in energy-related greenhouse gas (GHG) emissions and the impact of driving factors in Estonia, Latvia, Lithuania and other countries of the Baltic Sea Region (BSR). The Kaya identity and the logarithmic mean Divisia index (LMDI) method are used for the decomposition analysis. Based on the analysis conducted, the impact of population change, economic growth, decline of energy intensity, RES deployment and reduction of emission intensity on change of GHG emissions in countries of the BSR and, on average, in the EU-27 during 2010–2019 is revealed.

1. Introduction

Mitigation of climate change and reduction of greenhouse gas (GHG) emissions are the key components of the long-term strategy adopted by the EU Commission. This strategy contains a target for European economies to become climate-neutral by 2050, transforming them into modern, resource-efficient, and competitive [1]. Currently, all member states must implement long-term national strategies based on coherent principles of the EU’s energy and climate change policies. Thus, assessing the real potential for deploying renewable energy sources (RES) and reducing GHG emissions and the effectiveness and sustainability of the measures developed in Estonia, Latvia and Lithuania are important and relevant. These three Baltic countries have inherited primary energy supply and transformation systems from their Soviet past, dependent on fossil fuels and their imports from Russia. Therefore, the continuous increase of contribution from RES in the consumption of primary and final energies is an important strategic objective of sustainable energy development in all three countries.
Researchers and economists focus on investigating various factors that impact changes in energy consumption across countries: efficiency and structure of the energy transformation sector, technological and social factors, climate variation, and demographic changes. However, the growing interest in climate change mitigation has stimulated efforts focused on monitoring progress in the deployment of RES, reducing energy-related GHG emissions, and the impact of the main factors influencing these trends. Analysis of sustainable energy development in the Baltic states in 1990–2002 has been provided by Streimikiene et al. [2]. Overview of policies and measures implemented in the Baltic states, aiming to support the use of RES and the increase of energy efficiency, was presented by Klevas et al. [3]. The decoupling of environmental impact from economic growth in the New Eastern EU member states was analysed by Juknys et al. [4]. A detailed analysis of changes in energy consumption and energy intensity in Latvia was performed by Timma et al. [5]. The environmental performance index for the Lithuanian economy was analysed by Baležentis et al. [6] by employing the data envelopment analysis. The decreasing energy intensity was identified as the main driver of the energy use and GHG emission change. However, the analysis focused on agriculture, transport, manufacturing, and the services sectors over 1995–2009. The RES penetration in selected sectors over this period was comparatively low. Therefore, the residential sector, the energy transformation sector, and some manufacturing and services sectors were excluded from the analysis. Additionally, international comparisons for separate sectors were not provided.
The objective of sustainable energy development was declared in many national energy policy documents and was promoted through various regulatory instruments and support measures. Driving factors stimulating and limiting the deployment of RES in the Baltic States were discussed by Miskinis et al. [7], including the analysis of appropriate energy policy documents in each country. Deployment of RES in all three countries is stimulated considering its many advantages: (a) increase in RES consumption provides reliability on energy supply and reduces dependence on energy import; (b) larger use of RES is an important measure for the reduction of GHG emissions; and (c) deployment of RES creates additional employment, stimulates regional economic development, and contributes to the implementation of modern technologies.
An important factor for the rapid deployment of RES in the Baltic states was the 2009 Renewables Directive 2009/28/EC [8] with foreseen indicative national targets. An overview of energy policies and measures implemented in the Baltic states to support RES and trends for sustainable energy development was presented in [9,10,11]. A detailed analysis of the progress in the development of electricity generation from RES in the Baltic countries was compared by Cross et al. [12] with corresponding national indicators in Finland and Sweden, including analysis of possibilities to meet targets foreseen by member states in their National Renewable Energy Action Plans (NREAPs) [13,14,15].
The use of forest biomass resources in countries of the BSR increases, considering their role in climate change mitigation. Based on applying the Landscape Simulation and Ecological Assessment tool and the energy model MESSAGE, analysis of biomass potential in Lithuania was assessed by Pang et al. [16]. Therefore, valuable insights on the relationship between supply and demand of forest bioenergy were presented, and a possible shortage of domestic resources was defined.
Another important aspect of sustainable energy development in the Baltic states is the contribution to the EU targets for reducing GHG emissions. Based on the analysis presented by Ross et al. [17], an increase in the RES share and the energy efficiency improvement were identified as the main tools for fulfilling these targets. Furthermore, the need for in-depth analysis and implementation of new policies and technological changes was revealed by Miskinis et al. [18].
This study contributes to the existing scientific literature by providing an integrated analysis of RES deployment and trends of energy-related GHG emissions in Estonia, Latvia, Lithuania, and other countries of the BSR over the period between the global economic recession and the pandemic crisis. This analysis was conducted to reveal factors stimulating and limiting the use of RES in Baltic countries by sectors and by fuels considering favourable environment for economic growth and implementing energy policies for sustainable development. To assess the impact of population change, economic growth, increased energy efficiency, deployment of RES, and decline of emission intensity on changes of GHG emissions in countries of the BSR and, on average, in the EU-27, an extended Kaya identity and the LMDI method was employed. The methodology and results of this research describe its scientific novelty. This methodology allowed us to conduct an in-depth quantitative and qualitative analysis, provide an international comparison of the RES deployment, and reveal the impact of the main influencing factors on the change of energy-related GHG emissions.
To have an in-depth comparison of actual RES deployment in separate sectors, detailed data obtained from statistical offices of Estonia, Latvia and Lithuania were examined. Additionally, the harmonisation of data from national statistics was performed, considering differences in each country’s energy balance construction principles, which were revealed in [18]. The harmonised data enabled us to prove their comparability across three countries and sectors of the national economies.
Research aims are as follows:
  • to provide an in-depth analysis of RES deployment trends in Estonia, Latvia, Lithuania, and other countries of the BSR over 2010–2019;
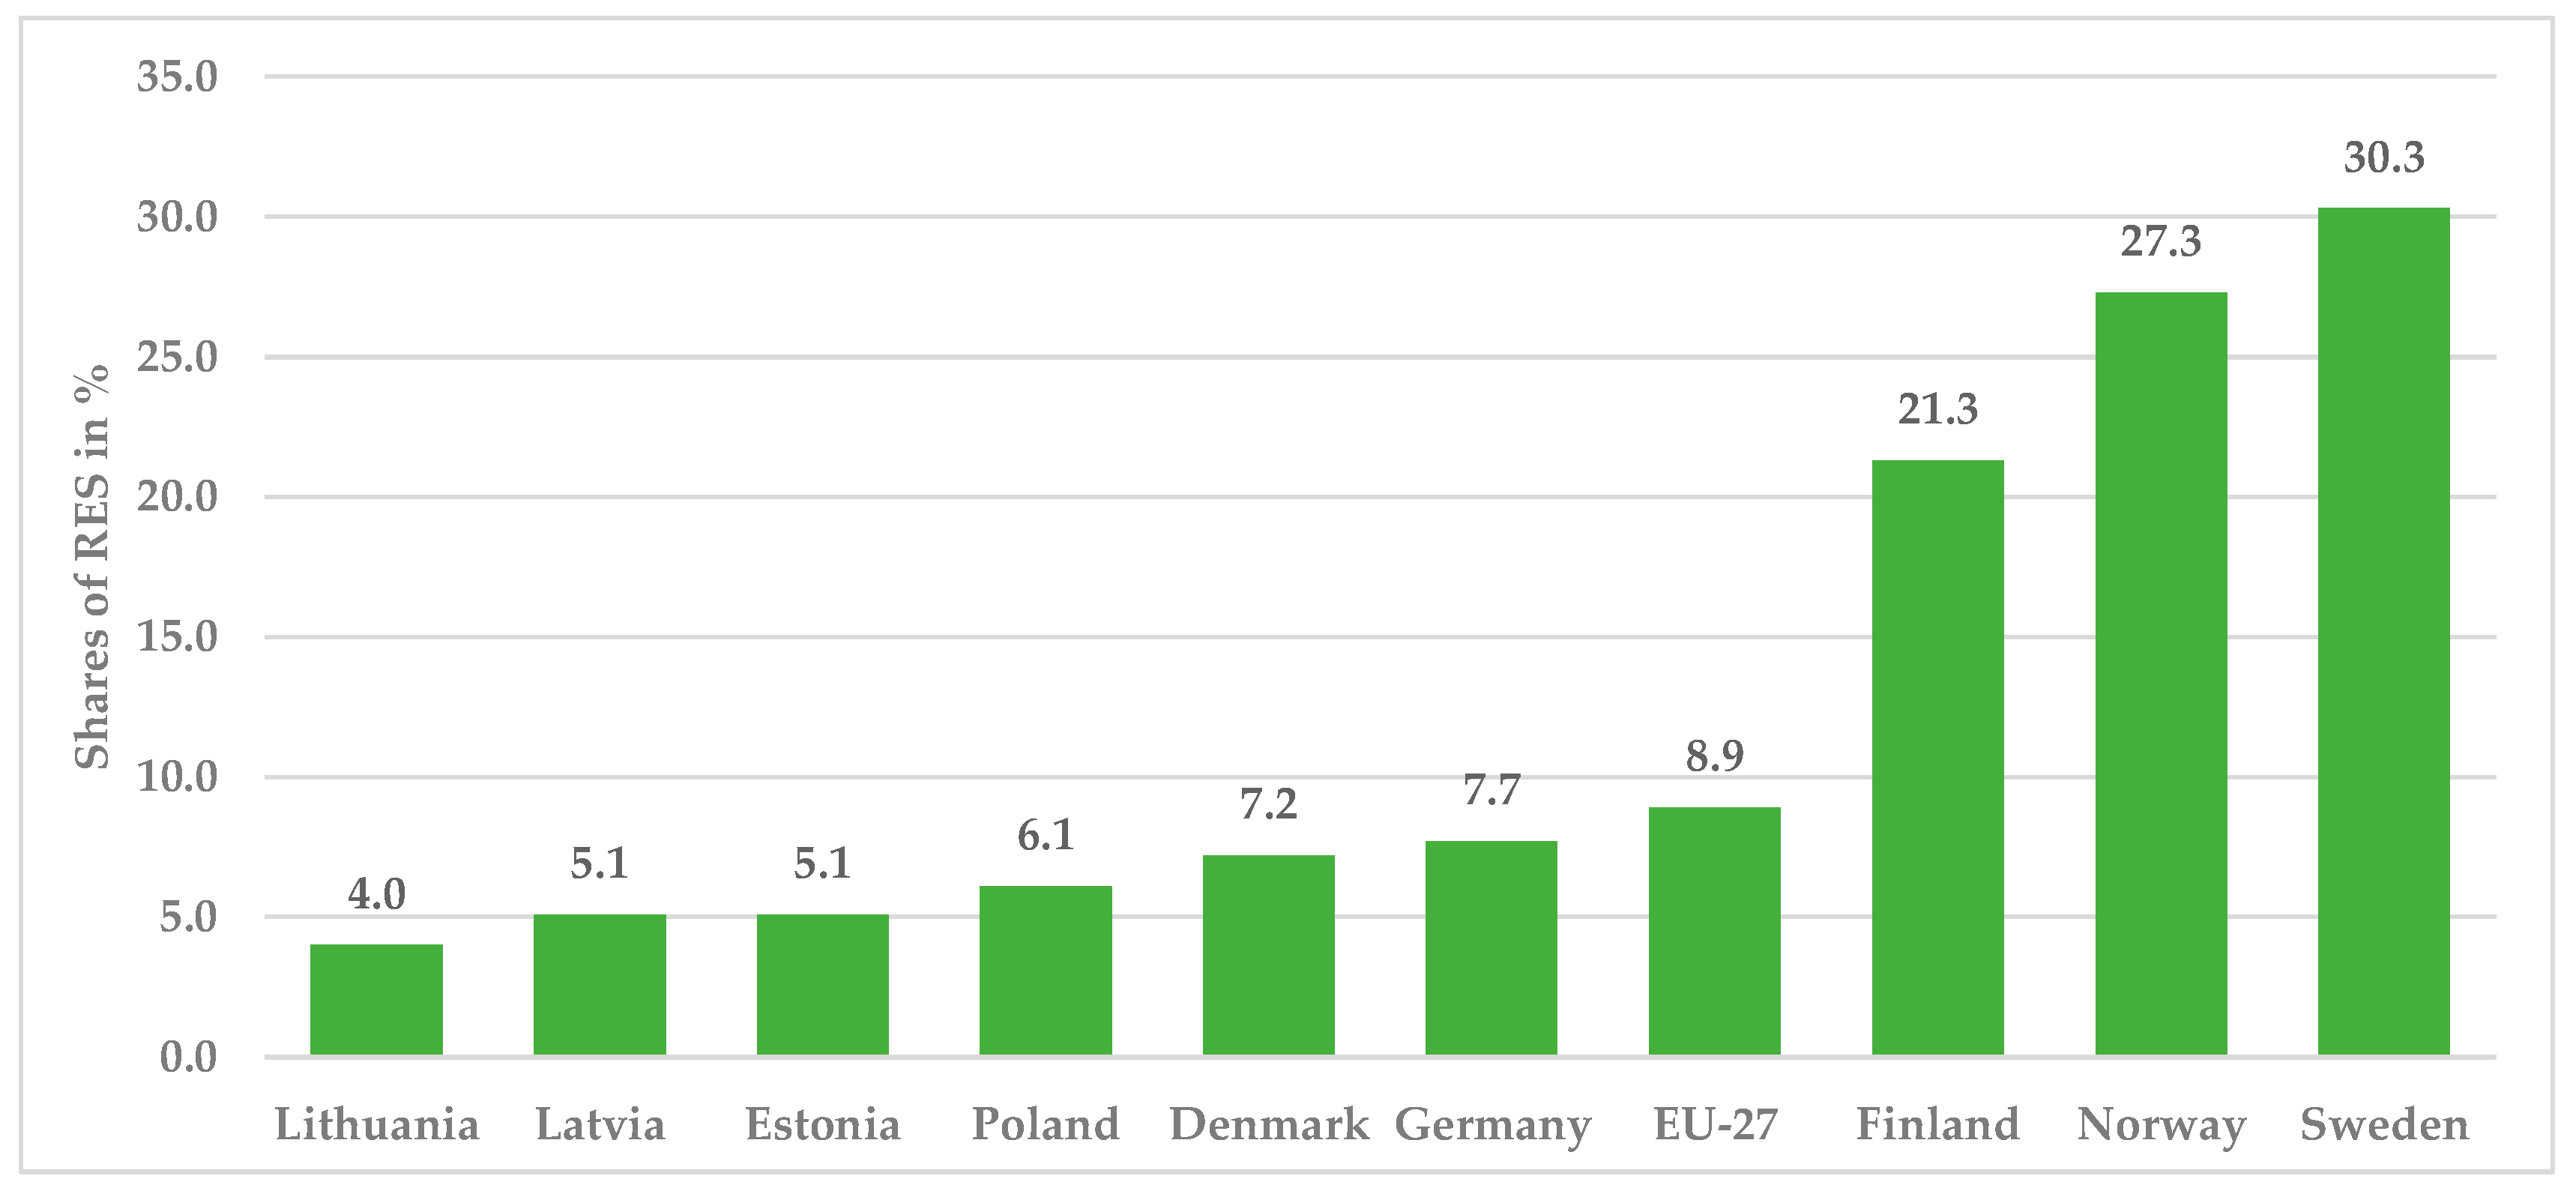
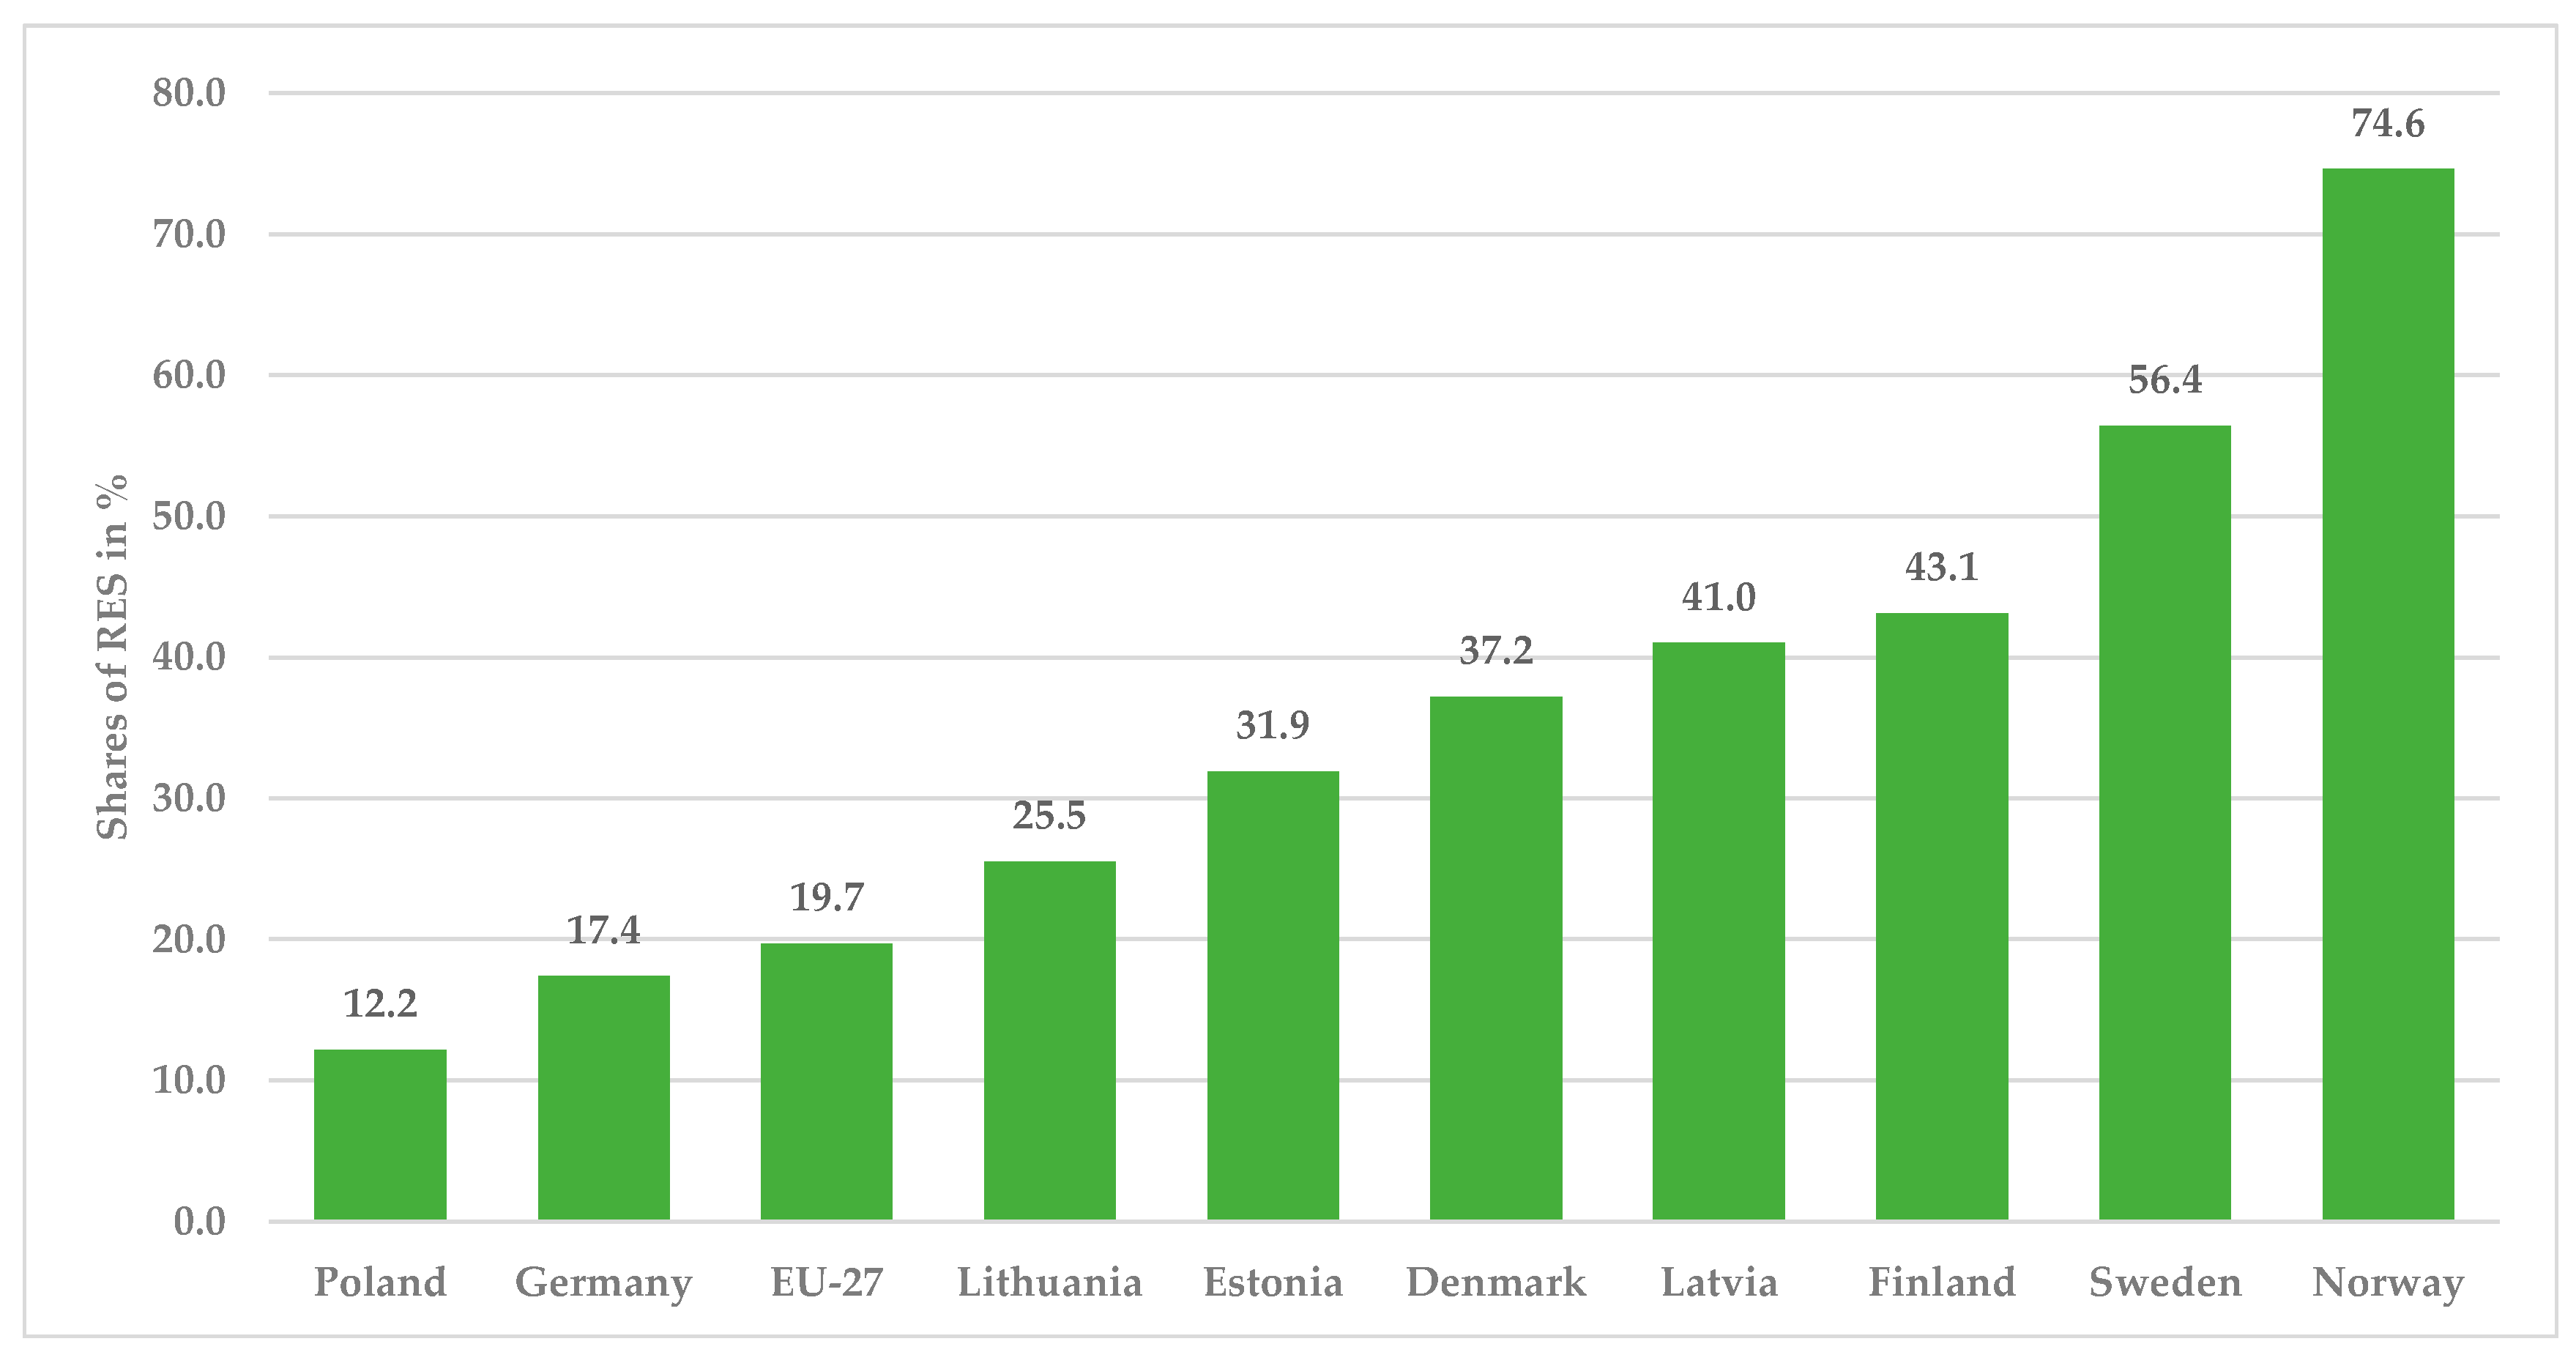
  • to provide a comparison of aggregated targeted indicators of RES deployment in countries of the BSR and with average indicators in the EU-27;
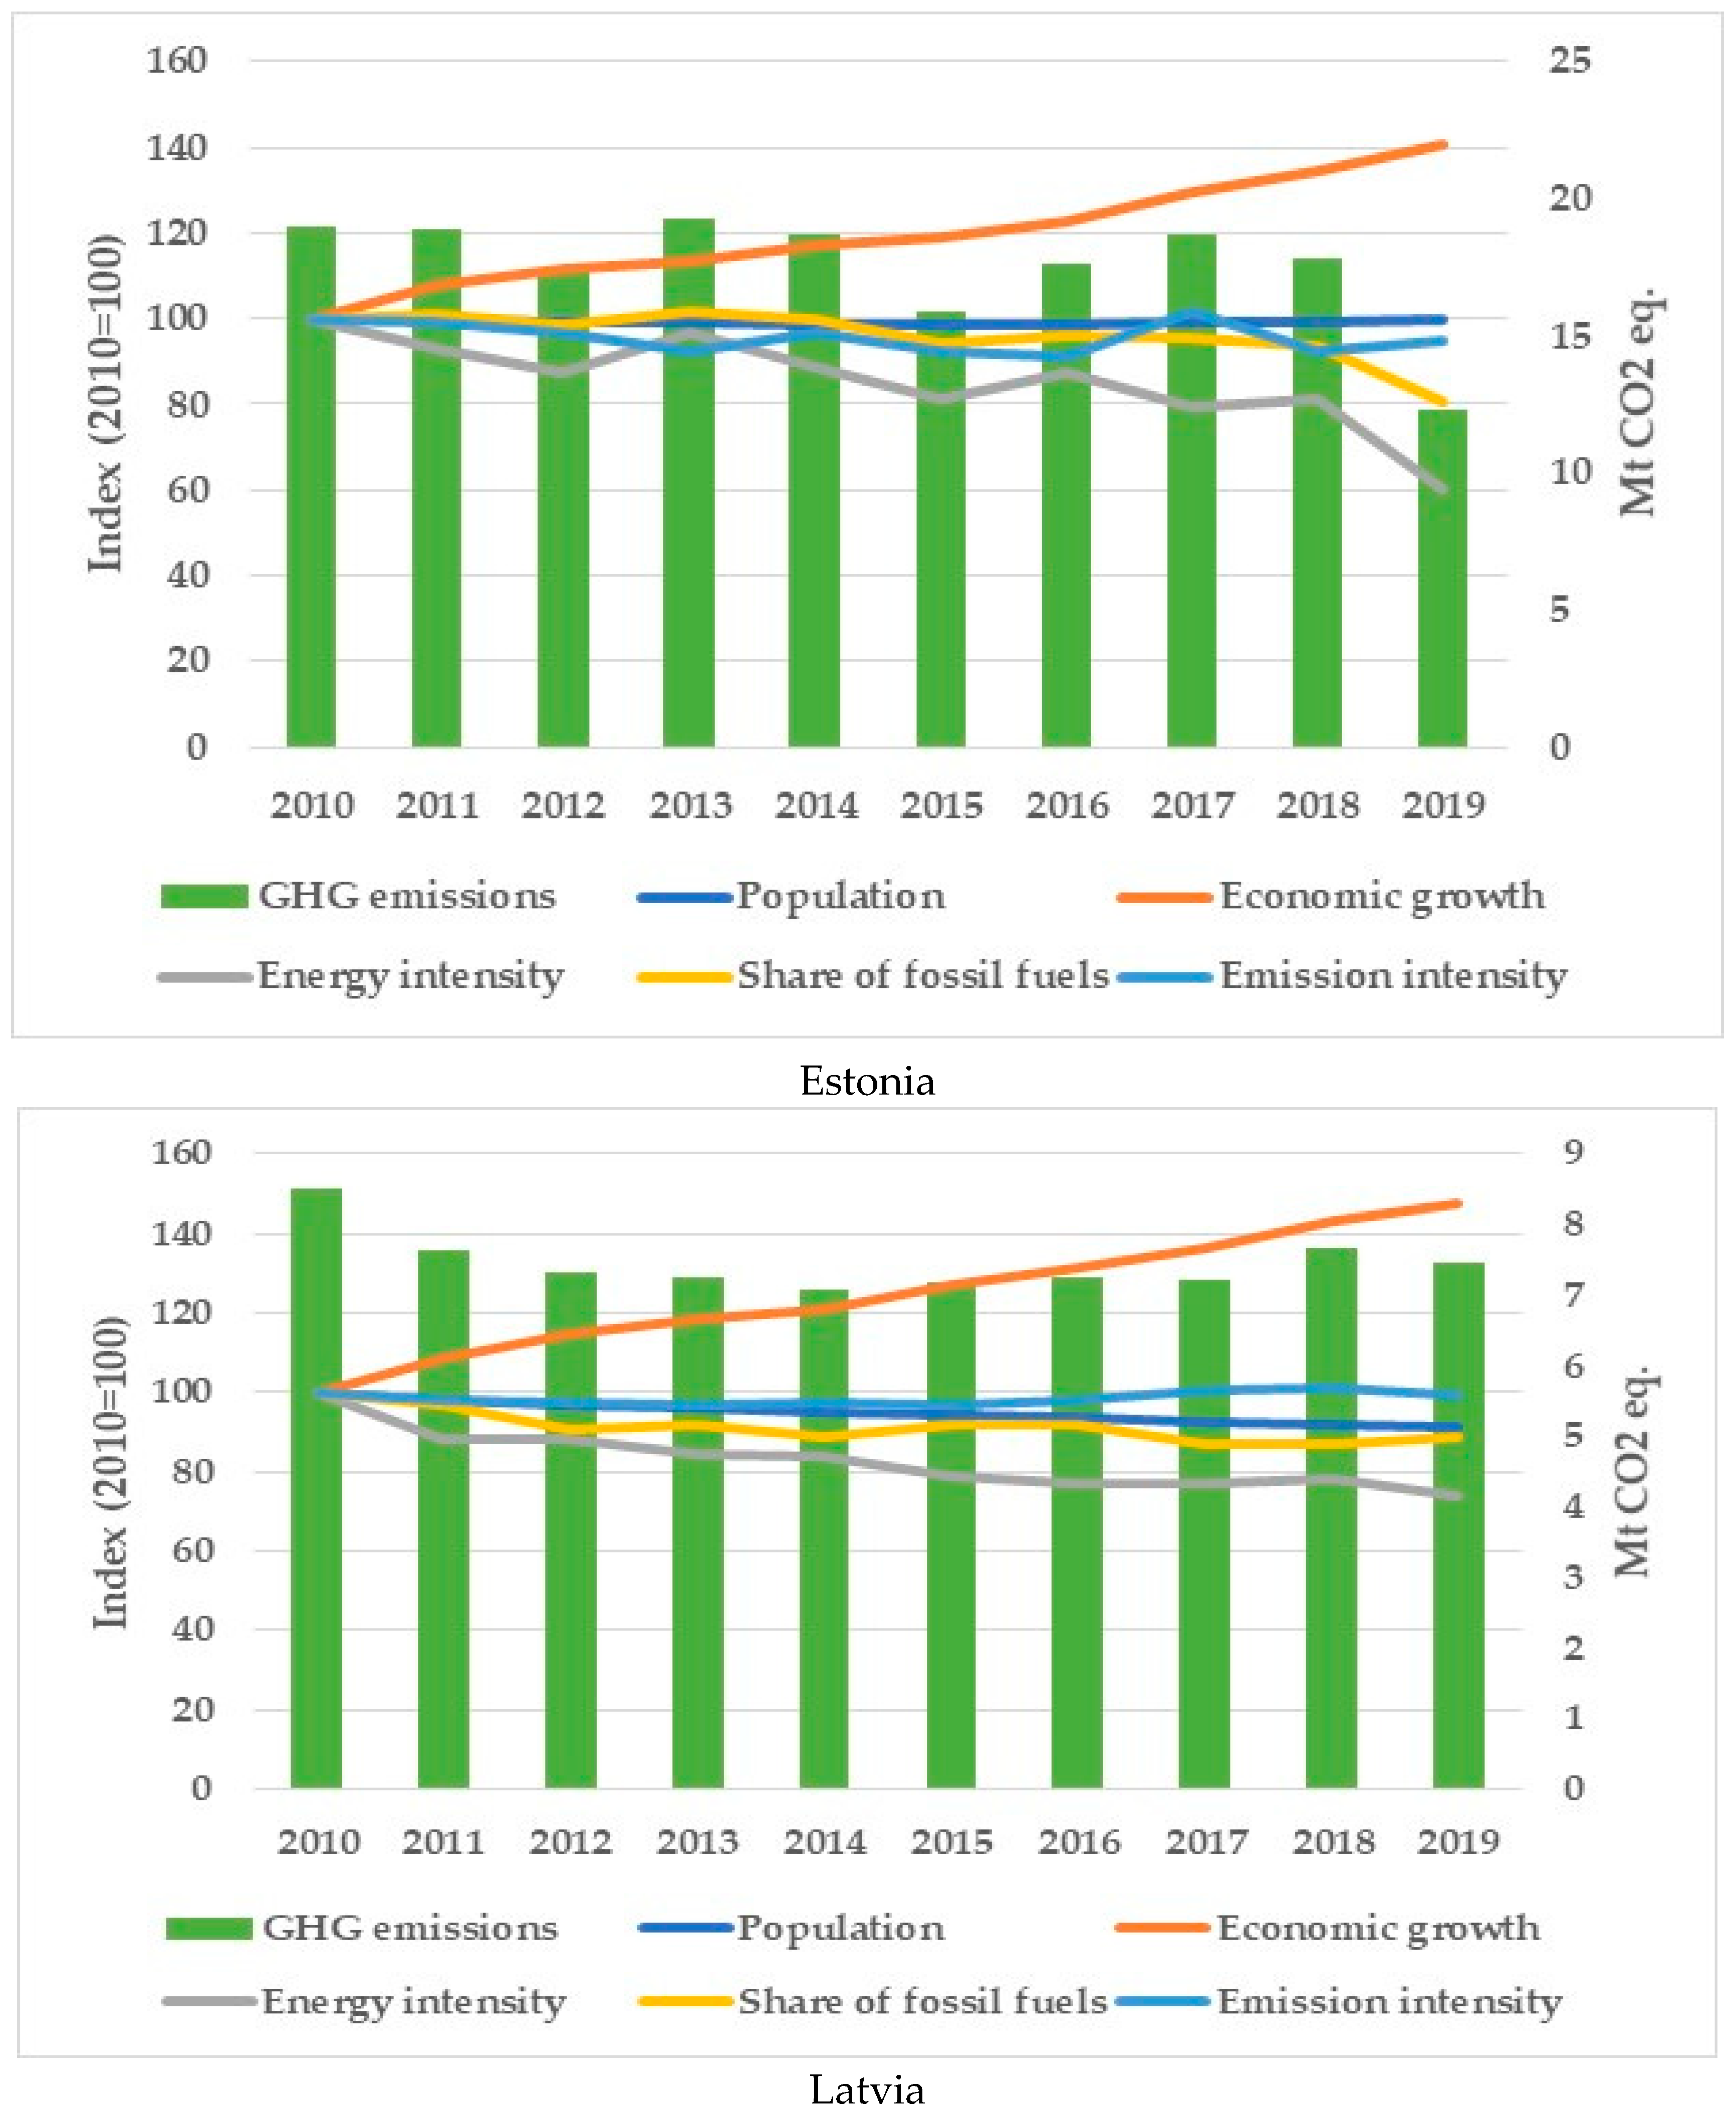
  • to examine effects of population change, economic growth, a decline of energy intensity, deployment of RES, and changes in emission intensity underlying the decline of energy-related GHG emissions in the Baltic countries;
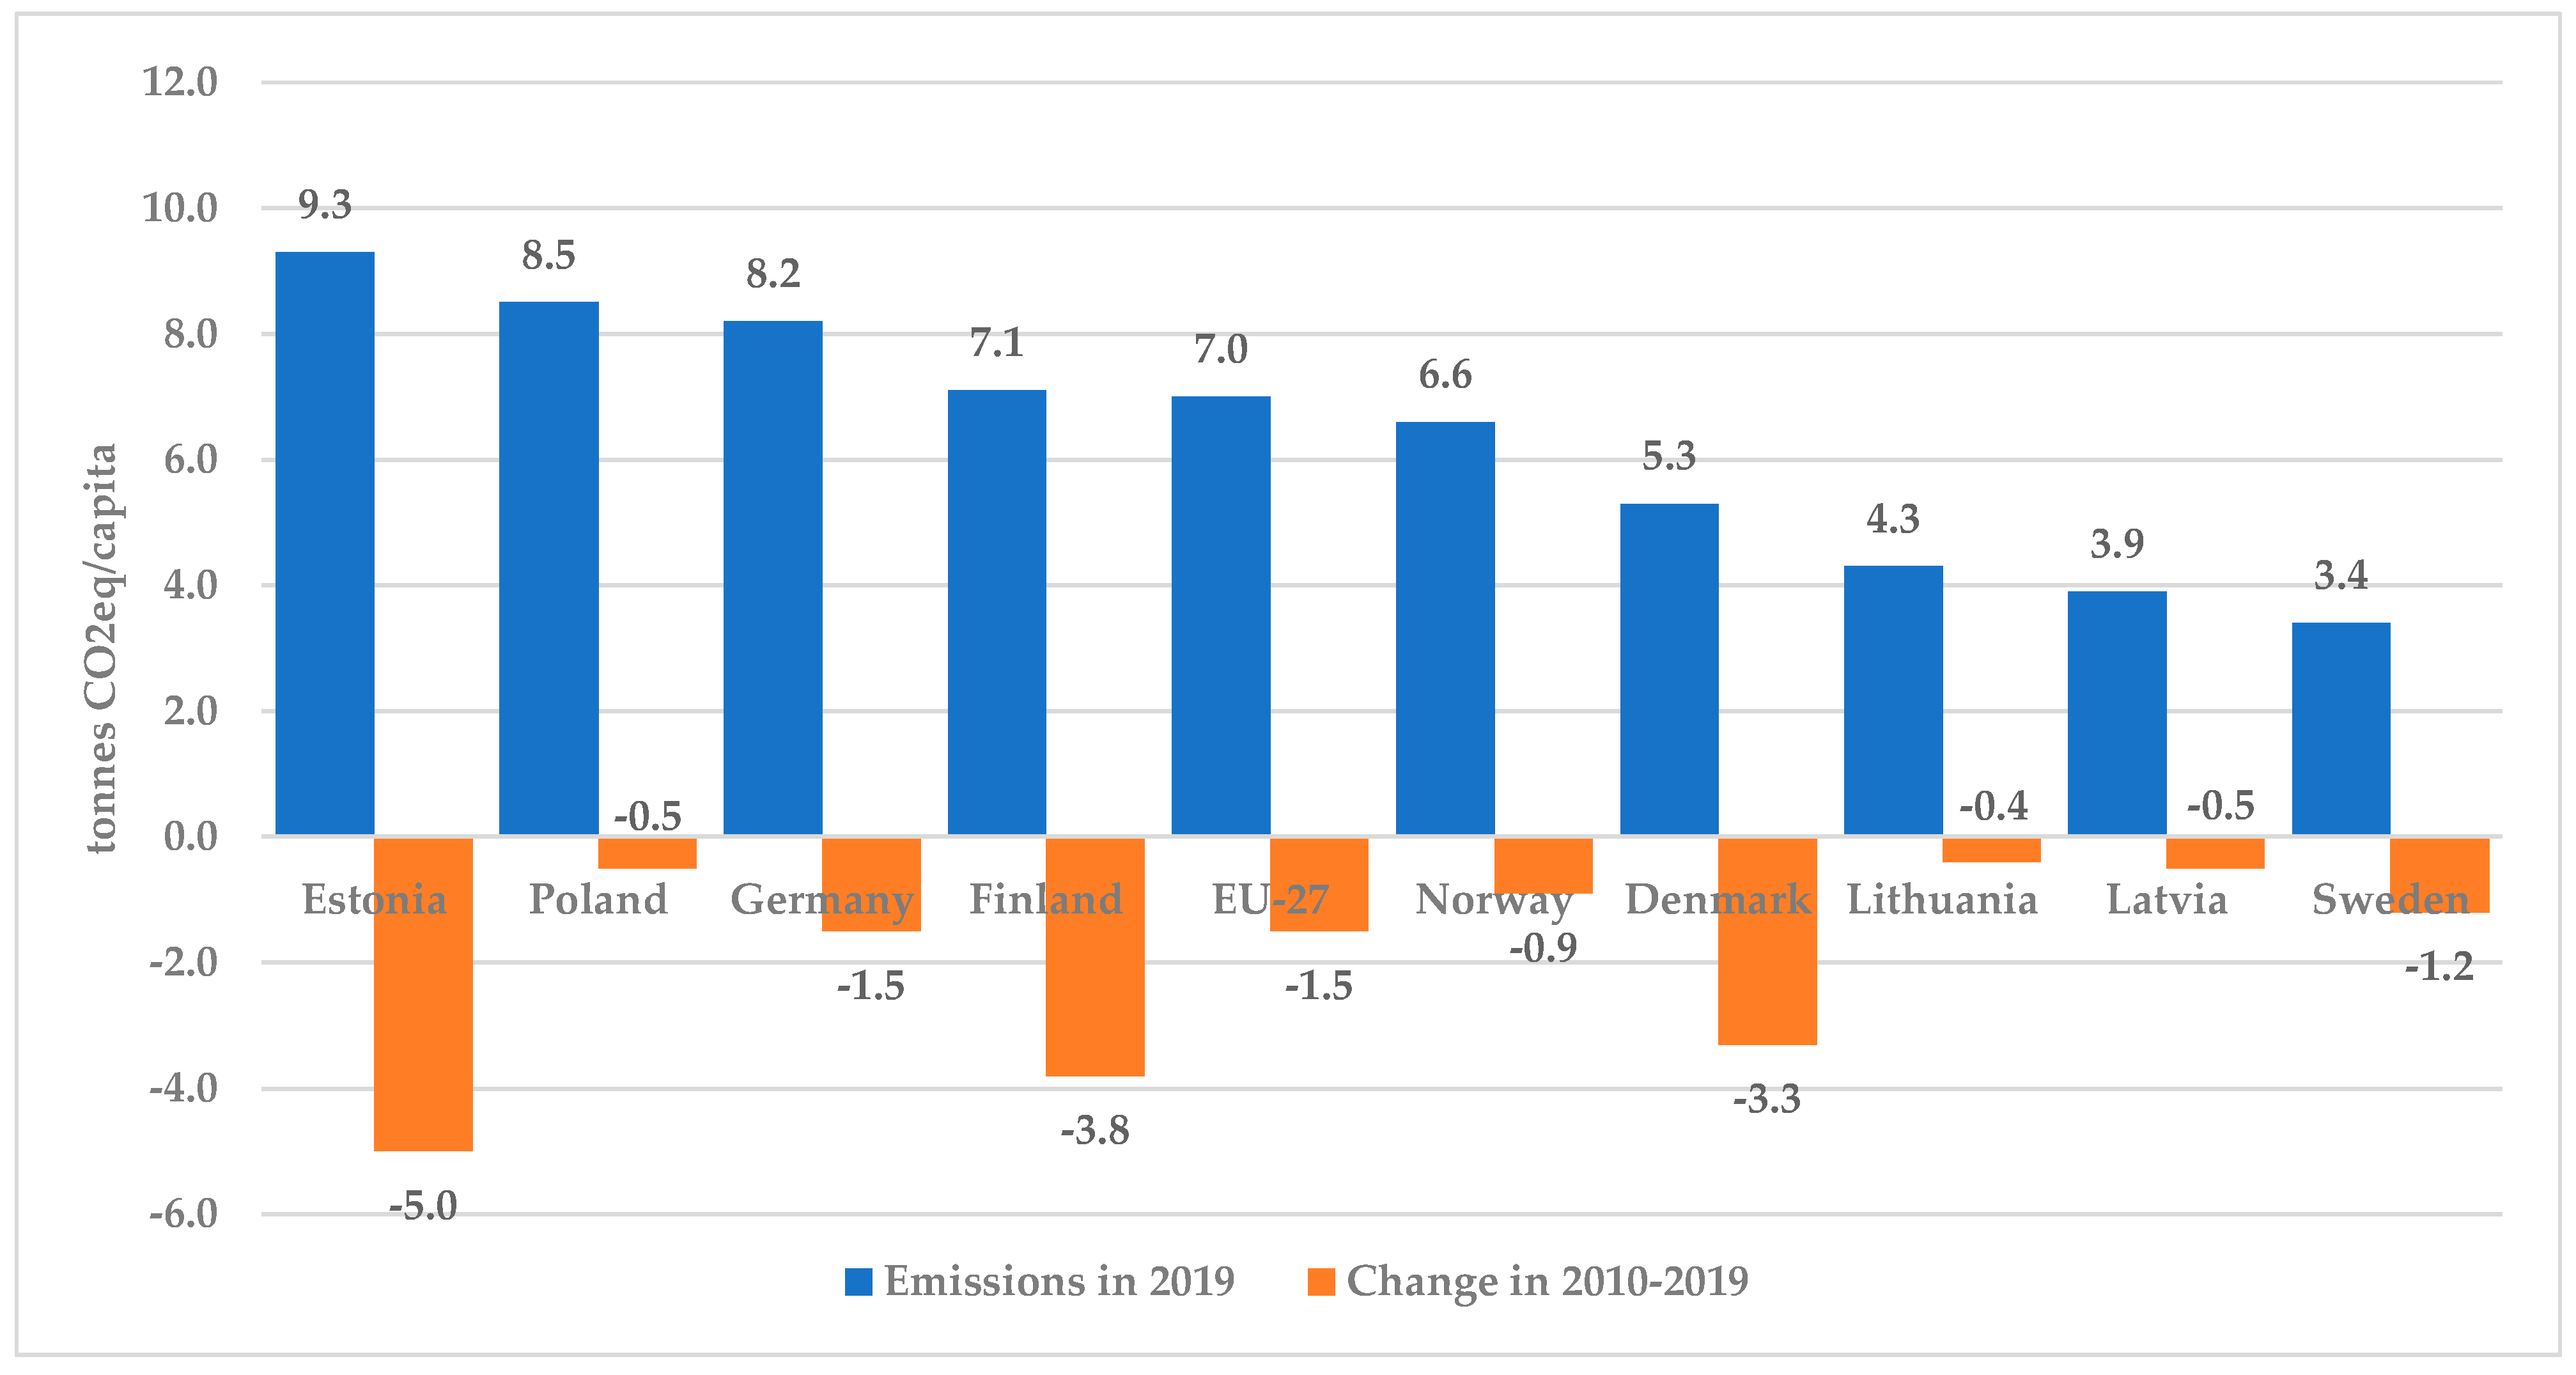
  • to provide a comparison of the decline in energy-related GHG emissions and driving factors in other countries of the BSR, and, on average, in the EU-27;
  • to reveal the contribution of RES deployment on reducing energy-related GHG emissions in the BSR and, on average, in the EU-27.
The paper is organised as follows: In Section 2 we review the relevant literature, Section 3 presents the methodology used and sources of information invoked to prepare this research. Section 4 presents findings from the analysis of RES deployment in the Baltic states and other countries of the BSR, dynamics of electricity and district heat generation from RES and targeted indicators according to the Directive 2009/28/EC and National Programmes, provides the analysis of possibilities to meet new national objectives on the deployment of RES, and factors stimulating and limiting their further increase in the Baltic countries. Section 5 presents findings from the analysis of energy-related GHG emission trends and the impact of driving factors and a comparative analysis of their role in the Baltic states and other countries of the BSR. Concluding remarks are presented in Section 6.

2. Literature Review

2.1. Deployment of RES

The relationship between RES consumption, economic growth, and other factors has been analysed in many studies employing diverse approaches. A long-run equilibrium relationship between real gross domestic product (GDP), renewable energy consumption, real gross fixed capital formation, and the labour force in twenty countries of the Organisation for Economic Co-operation and Development (OECD) over 1985–2005 was investigated by Apergis and Payne [19]. The bidirectional causality between renewable energy consumption and economic growth in the short- and long-term was based on the Granger-causality test.
The growth of RES consumption in China since the end of the 1970s was an important factor for researchers to examine their role in the country’s energy policy and economy. The Granger-causality test was employed to investigate the relationship between renewable energy consumption and economic growth over 1977–2011, and the long-term causality was proved by Lin and Moubarak [20]. The active promotion of RES consumption by increasing investment into production and distribution capacities was recommended for the Chinese governments, considering the impact of the renewable energy deployment. The role of renewable energy consumption in the economic welfare of China over 1978–2008 was examined by Fang [21] using the Cobb–Douglas type production functions. The high correlation between the various variables of economic welfare and renewable energy consumption was proved.
Modelling the relationship between energy consumption and economic indicators in various regions and separate countries is an active area for researchers. Long-term causal relationships between economic growth, renewable and non-renewable energy consumption in 15 developed countries of the EU over 1990–2011 were investigated by Ucan et al. [22]. A positive impact on economic growth from the increase of RES consumption was defined in the study, and, conversely, an increase of non-renewable energy consumption has stipulated a decrease in real GDP. Furthermore, the impact of renewable energy consumption on economic growth in 38 countries with the largest use of RES over 1991–2012 was examined by Bhattacharya et al. [23]. Based on this investigation, it was proven that the consumption of RES positively impacts the economic growth for 57% of the analysed countries.
A long-term equilibrium relationship between economic growth and renewable energy consumption in 29 European countries over 1995–2016 was examined by Kasperowicz et al. [24]. A significant positive impact of RES deployment on economic growth was revealed. Additionally, the favourable effect of promoting RES on economic growth, reducing GHG emissions, and sustainable development was proved. The causal relationship between renewable energy consumption and economic growth in the G7 countries over 1990–2011 was examined, and specific differences for separate countries were revealed by Chang et al. [25]. The long-term relationship between renewable energy consumption and economic growth in Pakistan was examined by Shahbaz [26] using Cobb–Douglas production function and quarterly data over 1972–2011. The positive impact of renewable energy consumption on economic growth was defined. The assessment of the causality relationship by Bobinaitė et al. [27] indicated the positive effect of renewable energy consumption on economic growth in Lithuania.
The econometric analysis by Bersalli et al. [28] confirmed the effectiveness of renewable energy policies in 20 Latin American and 30 European countries over 1995–2015. The positive impact of promotion policies was the main driver for RES deployment in Europe and Latin America. The relationship between renewable energy consumption and economic growth in 25 European countries over 2007–2016 was investigated by Ntanos et al. [29]. Based on the statistical analysis, a correlation between RES consumption and economic growth in countries with high indicators of GDP per capita was found to be higher than in economies with low GDP per capita.
A significant positive long-term equilibrium relationship between renewable energy consumption and economic growth in the 28 EU countries over 1995–2015 was proven by Saint Akadiri et al. [30]. Real gross fixed capital formation, carbon emissions, and other environmental factors were defined as the main determinants of long-term economic growth in the EU. Additionally, a long-term bidirectional causal relationship was identified between renewable energy consumption, economic growth, and other growth determinants.
The short- and long-term causality relationships between economic growth and electricity consumption from renewable and non-renewable sources for Turkey were investigated by Dogan [31].
Numerous researchers were focused on investigating renewable energy policy instruments. Using panel data in 50 US states during 1991–2007, the effects of state policies on the penetration of renewable electricity sources, including wind, biomass, geothermal, and solar photovoltaic, were estimated by Shrimali and Kniefel [32]. The significant impact of renewable portfolio standards on the penetration of all types of renewable energies and differences of this impact depended on the type of RES was highlighted.
The effectiveness of renewable policy instruments focused on RES, implemented in 27 EU countries and 50 US states over 1990–2008, was investigated by Kilinc-Ata [33]. Feed-in tariffs, tenders, and tax incentives were revealed as effective mechanisms stimulating RES for electricity generation. The effectiveness of feed-in tariffs, tradable certificates, renewable portfolio standards, tax incentives, and production quotas on renewable energy deployment in South Korea, China, the UK, and Germany was analysed by Shokri and Heo [34]. It was revealed that feed-in tariffs were the most effective energy policy instrument in advanced countries. The role of a clean development mechanism to achieve ambitious targets of RES deployment in China was analysed by Wang and Chen [35]. The barriers related to implementing this mechanism and appropriate opportunities for the promotion of RES were identified. A comparison of the effects of feed-in tariffs and renewable portfolio standards as two renewable energy policy instruments implemented in many countries was presented by Sun and Nie [36]. The existing barriers to renewable energy development in the Iranian wind and solar energy sectors were determined and some recommendations to eliminate these barriers were presented by Nasr et al. [37].
A review of articles on sustainable energy policy for promoting RES in Germany, Denmark, China, the UK, and the US was conducted by Lu et al. [38]. Recommendations were provided, and the study’s key conclusion was that governments and stakeholders must actively promote the deployment of RES and effective policy incentives and provide appropriate policy control. The evolution of renewable energy policy in Romania, critical analysis of the existing regulatory framework, and the assessment of the impact of policy changes on renewable energy producers was presented by Marinescu [39]. The challenges and shortcomings of policymaking were highlighted, and valuable insights for a more robust renewable energy policy were suggested.
The model for estimating the optimal subsidy for electricity generation from renewable energy in China was presented by Zhang et al. [40]. The stochastic process was used to describe the electricity market price, CO2 price, and investment cost. The optimal subsidy for solar photovoltaic electricity generation was derived from the project and the threshold values.
The need to perform qualitative and quantitative analysis of RES deployment considering their economic, technological, environmental, and social aspects was discussed by Ilbahar et al. [41]. Based on the detailed analysis of multi-attribute decision-making methods, the reasons, purposes, and factors of their application and the most preferred techniques for evaluating RES deployment were identified. Analytic hierarchy process and additive ratio assessment methods were employed by Štreimikienė et al. [42] to perform an integrated evaluation of technical, economic, environmental, and other aspects. The most suitable electricity generation technologies in Lithuania were identified. Multidimensional analysis methods were employed by Roussafi [43] to study energy transition and regional RES development in France over 1990–2015. Similarities and differences of RES deployment by regions and types of renewable energies were revealed, and several recommendations to promote their regional development and management were identified.
Currently, various aspects related to the growing role of RES in the transition to a low-carbon economy have become increasingly important. Based on the analysis of national plans in 26 countries, accounting for about three-quarters of the global energy demand, the potential to double the global share of RES from 18% in 2010 to 36% in 2030 was identified by Saygin et al. [44]. Three factors with the highest importance were identified to achieve such levels of RES contribution: (1) further development of technologies, (2) innovations supporting the transition towards renewable, and (3) improved cost-competitiveness of technologies. A similar role of RES in the global renewable energy scenario with their share of 34.7% in 2030 and 47.7% in 2040 was foreseen by Demirbas [45].
The crucial role of renewable energy technologies and energy efficiency was revealed by Gielen et al. [46] to accelerate energy transition to 2050, comply with the Paris Climate Agreement and limit average global surface temperature increase below 2 °C. Foreseen deployment of RES and a significant increase of capacities in the wind and solar power plants can increase their share in the total primary energy consumption by up to 63%. The study’s main conclusion—the combined contribution from the rapid growth of RES and energy intensity reduction can guarantee about 94% of total GHG emission reduction.
Based on an analysis of the renewable energy roadmap programme prepared by the International Renewable Energy Agency, valuable findings for the European power sector development were presented by Collins et al. [47]. The possibility of meeting 50% of the gross electricity demand in the EU-28 from RES by 2030 and reducing CO2 emissions by 43% in the power sector, compared to the 2005 level, was confirmed. However, significant operational challenges could be encountered to realise such potential of green electricity generation, and planners should foresee corresponding actions for the power systems.
The growing contribution of renewable energy in electricity generation can cause problems in the power systems to provide a supply and demand balance and maintain continuity of operation in unexpected situations. Solutions to respond to high fluctuation on demand and supply sides and guarantee flexibility of the power systems were discussed by Impram et al. [48]. The solutions for providing flexibility will become more complex. Operational flexibility of the power systems plays a crucial role in integrating the growing capacities of electricity generation from variable RES. Qualitative analysis of the flexibility of the power systems and comparison of different unit types was presented by Ulbig and Andersson [49].
The import of solar electricity from North Africa can be considered as an option to enhance the performance of the European power system and improve the reliability and security of the energy supply. Specific impacts and benefits on the European power system by constructing the cross-Mediterranean High Voltage Direct Current (HVDC) links for transmission of green electricity between North Africa and Europe were discussed by Benasla et al. [50]. The possibilities to improve the European power system’s dynamic performance and challenges related to the operation and control of these links were highlighted. The importance of solar power plants in the Sahara region and HVDC links was discussed by Benasla et al. [51].

2.2. Drivers of GHG Emissions

The transformation of the global economy from fossil-based to zero-carbon by 2050 requires urgent actions in all countries. To mitigate climate change and ensure continuous reduction of energy-related GHG emissions, investigating the trends and factors influencing these emissions plays a crucial role in formulating energy and environmental policies. Therefore, numerous researchers, policymakers, and international organisations are focused on analysing these issues at the global and regional levels, in separate countries, and economic sectors.
The relationship between historical energy-related CO2 emissions and influencing factors at the country level has been investigated by many researchers. Several researchers focused their investigation on China as the major contributor to global GHG emissions. A significant decrease in CO2 emissions in China over 1957–2000 was shown by Wang et al. [52]. Based on the LMDI method, the main factor of this change was energy intensity, and 95% of the total decrease was attributed to this factor. In comparison, 3.2% and 1.6% were attributed to RES penetration and the effect of the fossil fuel composition, respectively.
The LMDI method combined with the (Cobb-Douglas) C-D production function was utilised by Wang et al. [53] to study the decomposition of energy consumption and CO2 emissions in China and analyse driving factors of their changes over 1991–2011. Changes in final energy-related carbon emissions and carbon emission intensity in China during 1996–2010 and the main affecting factors were investigated by Zhang and Da [54] using the LMDI method. Additionally, the relative decoupling effect between CO2 emissions and economic growth was analysed.
Changes in energy-related CO2 emissions in China during 1997–2012 were examined by Li et al. [55]. Based on the application of the IPAT-LMDI model, the influence of CO2 emissions intensity, energy structure, energy intensity, industrial structure, economic output, and the population was investigated. Over this period, the growth of CO2 emissions was stipulated by economic output and population growth and due to changes in energy structure. Conversely, reduction of these emissions was achieved due to increased energy efficiency and change in the industrial structure.
A nonparametric meta-frontier approach was employed by Du et al. [56] to estimate the CO2 emission efficiency and emission reduction potential in 30 administrative provinces of China over 2006–2010. The technology gap (with more than half of the total potential) and managerial inefficiency were identified as the sources of potential reduction of CO2 emission. Additionally, the differences in potential emission reduction across China were identified—the technology gap is more important in central and western areas, while management inefficiency is critical in the eastern areas.
Driving factors for the change of CO2 emissions in the G20 countries over 1971–2010 were investigated by Yao et al. [57]. Their differences in the largest developed countries and emerging economies and at different stages of economic development were revealed.
Changes in CO2 emissions for Indonesia, Malaysia, Philippines, and Thailand during 1971–2013 were investigated by Chontanawat [58]. Using the Kaya identity combined with variance analysis, it was revealed that income and population growth are the main driving factors for increasing CO2 emissions in these countries. Therefore, national policies to reduce energy and emission intensity and substituting fossil fuels with alternative energy sources were recommended.
The changes of energy-related CO2 emissions and their driving forces in Ethiopia during 1990–2017 were examined by Taka et al. [59]. Based on the application of LMDI decomposition, the economic, population, and fossil fuel share effects were revealed as the main drivers of these changes. The Kaya identity was employed by Brizga et al. [60] to analyse GHG emission changes in countries of the former Soviet Union during 1990–2010. Different roles of energy intensity, affluence, energy mix, carbon intensity, and population during different periods and differences among countries were highlighted.
The drivers of changes in GHG emissions during 2004–2012 were investigated, and the feasibility to implement EU 20–20–20 targets in Estonia, Latvia and Lithuania were assessed by Štreimikiene and Balezentis [61]. The Kaya identity and Shapley value were employed for decomposition analysis. Policies directed to increase energy efficiency were highlighted as the most important drivers for reducing GHG emissions and achieving EU 20–20–20 targets in the Baltic states.
Attempts of numerous researchers were focused on the analysis of CO2 emissions in manufacturing and separate industries. Therefore, changes in the aggregate CO2 intensities in manufacturing in China, South Korea, and Taiwan were distributed by Ang and Pandiyan [62] among four causal factors: fuel CO2 emission coefficients, manufacturing production structure, fuel shares, and sectoral energy intensities. Therefore, it was concluded that the energy intensity effect significantly impacts aggregate CO2 intensities in all three countries.
An improved non-radial directional distance function was applied by Cheng et al. [63] to construct a new meta-frontier total-factor carbon emission efficiency index. Its dynamic evolution was investigated in industrial sectors of 30 provinces in China over 2005–2015. Different characteristics of the carbon emission performances in different regions and different periods were identified. Significant spatial heterogeneity and period heterogeneity were revealed. An objective for regions to seek the appropriate emission reduction paths according to their characteristics was recommended.
The drivers of carbon dioxide emissions in China’s manufacturing industry were identified by Xu and Lin [64], using the panel data of 30 provinces (during 2000–2013) and nonparametric additive regression models. The LMDI method and the extended Kaya identity were employed by Boqiang and Liu [65] to explore the influencing factors of CO2 emissions in China from heavy industry over 1991–2015. The labour productivity, energy intensity, and industry scale were revealed as the main factors affecting CO2 emissions. Weak decoupling of CO2 emissions in the heavy industry was found, and insights on the industry development pattern were presented.
The impact of the key driving factors of CO2 emissions change in China’s iron and steel industry was examined by Xu and Lin [66] using data of 30 provinces over 2000–2013. Certain differences at the regional levels were defined. New insights into regional emissions reduction in China’s steel industry were provided. The impact of the main driving factors on the growth of CO2 emissions in the iron and steel industry, as the largest contributor to China’s CO2 emissions, was investigated by Xu and Lin [67]. The analysis was based on 30 provincial panel data over 2000–2013 and the application of the nonparametric additive regression model. Based on the analysis, important policy implications were derived: (1) to adopt different measures to mitigate CO2 emissions, (2) to adopt flexible technical measures directed on reduction of energy consumption and CO2 emissions in this sector, (3) to increase research of energy-saving measures and emission reduction technologies, and (4) to expand the use of new energy sources, such as hydropower, bioenergy and nuclear energy.
Changes in energy consumption and CO2 emission trends in the Mexican iron and steel industry during 1970–2006 were analysed by Sheinbaum et al. [68]. The decomposition analysis methodology was applied to define the activity, energy efficiency, structural, and fuel share effects. Implementation of new energy efficiency measures was recommended. Trajectories of energy-related GHG emissions and the impact of driving factors in the Chinese iron and steel industry over 2001–2010 were investigated by Tian et al. [69]. The production scale effect was revealed as the main driving factor for the increase in GHG emissions. In contrast, the energy intensity and the emission factor change effects had a marginal effect.
The change in energy-related carbon dioxide emissions in the Chinese textile industry over 1986–2010 was examined by Lin and Moubarak [70]. Based on the application of the LMDI method, the impact of energy intensity, industrial activity, industrial scale, energy mix, and carbon intensity on energy consumption and emissions of carbon dioxide was investigated. Industrial activity and energy intensity were identified as the main determinants of change in carbon dioxide emissions. Furthermore, the LMDI method was employed by Lin and Long [71] to explore the most important factors of changes in carbon emissions in China’s chemical industry. Output per worker and energy intensity effects were defined as the key driving factors affecting changes in GHG emissions.
To assess energy consumption and CO2 emissions from China’s steel industry over 2010–2050, a system dynamics model and a bottom-up energy system model-TIMES were employed by Chen et al. [72]. Energy efficiency improvements due to energy-saving technologies and structural changes in steel production were the main factors influencing energy intensity and CO2 intensity reduction.
Linkages between economic growth, carbon emissions, and renewable energy consumption in the EU countries over 1995–2014 were examined by Radmehr et al. [73]. The bidirectional link between economic growth and carbon emissions and economic growth and renewable energy consumption were defined based on the application of panel spatial simultaneous equations models with a generalised spatial two-stage least-squares method.
A multi-level scenario decomposition framework was proposed by Dogan [31] to compare various emission scenarios from business-as-usual to deep decarbonisation and analyse the global GHG emission trajectories and related challenges and potential climate change mitigation opportunities.
The relationship between renewable energy consumption and carbon emissions in China over 1977–2011 was investigated by Lin and Moubarak [20]. However, due to the low share of RES in the country’s energy consumption, their contribution to reducing CO2 emissions was not fixed in this study. Currently, the consumption of RES is growing in all countries due to the need to mitigate climate change by reducing the use of fossil fuels. However, the literature on the role of renewable energy in reducing energy-related GHG emissions is still limited. Therefore, we contribute to the existing literature by conducting an in-depth analysis of factors influencing the change of these emissions in countries of BSR.

3. Methodology

Researchers use various quantitative analysis methods to assess the causal relationships between the deployment of RES and economic growth. Based on these methods, the existence of the growth hypothesis was confirmed in many studies [19,23,29]. Additionally, the conservation, feedback, and neutrality hypotheses were also validated in the literature in different countries and for different periods. Such results can be explained by choosing techniques used for modelling, different breakdowns of economic variables, peculiarities of economic development, and energy consumption in separate countries or regions. However, most quantitative research studies aim to confirm certain hypotheses based on a high correlation between economic variables and renewable energy consumption. Thus, some researchers pay little attention to factors outside the scope of the research, and quantitative data used for analysis can be incomplete. Additionally, data collection is distinct from the analysis. Economic indicators and energy consumption in databases are periodically updated. Climate fluctuations influence the volume of energy consumption, and modelling results can be affected by the shadow economy and government policies.
Currently, energy policies in most countries are focused on substituting fossil fuels with renewable energies. Effective integration of RES technologies considering their economic, technological, social, environmental, and other aspects is becoming increasingly important. Thus, applying quantitative and qualitative analysis, multi-attribute decision-making methods, and multi-criteria analysis reveal valuable insights. We conducted an in-depth quantitative and qualitative analysis and provided international comparisons to improve data quality, achieve deeper insights, better understand assumptions, and interpret results. Our analysis included additional information from special surveys, in-depth interviews with experienced experts, detailed data from databases of national statistical offices about final energy consumption by economic sectors and energy sources.
The Kaya identity [74] has been applied by many researchers to express the impact on the environment and assess the role of essential factors contributing to changes in GHG emissions. In comparison with modelling of nexus between some factors and climate change, an advantage of this tool is the possibility to quantify and interpret the impact of driving factors on the trend of GHG emissions. An important feature of the Kaya identity is the possibility to quantify total emissions as the product of 3–5 relevant causal factors. We used the extended form of the common identity, applied in various studies to describe energy-related GHG emissions at the country level. Following the Kaya identity, we related GHG emissions with the most important influencing factors by quantifying their contribution. We assessed the impact of population change, the national economic growth, the decline of energy intensity, and fossil fuel and carbon emissions intensities. Thus, to analyse the impact of these factors on changes in energy-related GHG emissions, we used the five-factor model:
C t = P o p u l a t i o n t × G D P t P o p u l a t i o n t × T P E S t G D P t × F F t T P E S t × C t F F t
and simplified as
C t = P t × G t × E t × F t × W t
where Ct represents the environmental impact from energy-related GHG emissions in each country in time t, Pt is the national population, GDPt is the country’s GDP, TPESt is the total primary energy supply, FFt is the total consumption of fossil fuels, Gt is expressed as GDP per capita and is the economic growth factor, Et expressed as the total primary energy supply per GDP is the energy intensity factor, Ft represents the share of fossil fuels in total primary energy supply and is the factor of fossil fuels, Wt expressed as the total GHG emissions per unit of fossil fuels and is the emission intensity factor.
We employed the LMDI method, which gives perfect decomposition and is used in many energy studies as the preferred method by Ang and Zhang [75,76,77] for policymaking and evaluating GHG emissions determinants. To analyse relative changes in GHG emissions between a base year 0 and the end of the period in time t, we used an additive decomposition technique. First, we decomposed absolute change of energy-related GHG emissions by the contribution of each factor:
Δ C = C t C 0 = Δ P t + Δ G t + Δ E t + Δ F t + Δ W t
where ΔPt represents the population effect, ΔGt represents the effect of economic growth, ΔEt represents the energy intensity effect, ΔFt represents the effect of reduced consumption of fossil fuels due to their substitution by RES, ΔWt represents the effect of energy-related GHG emission intensity.
The sum of changes in all decomposed factors is equal to the total change in GHG emissions. The effects associated with each respective factor were calculated considering Equations (4)–(8):
Δ P t = C t C 0 l n C t l n C 0 × ln ( P t P 0 )
Δ G t = C t C 0 l n C t l n C 0 × ln ( G t G 0 )
Δ E t = C t C 0 l n C t l n C 0 × ln ( E t E 0 )
Δ F t = C t C 0 l n C t l n C 0 × ln ( F t F 0 )
Δ W t = C t C 0 l n C t l n C 0 × ln ( W t W 0 )
Thus, we used these five driving factors in each country by introducing their impact on changes in energy-related GHG emissions.
Other methods applied in the study were graphical analysis, comparative analysis, descriptive statistics, and policy field analysis. Comparative analysis of the share of RES in electricity generation, heating and cooling, transport sector, and the gross final energy consumption in the Baltic states was performed following the methodology applied in the Eurostat database. Trends of targeted indicators were based on data prepared according to requirements of the Directive 2009/28/EC [8] (including the normalisation rule for the accounting of electricity generated by hydro and wind power plants).
The information invoked for the analysis was obtained from the National Statistics and the Statistical Bureau of the European Union (Eurostat) database. Additionally, detailed data about the current status and changes in energy production and consumption in the Baltic states were obtained from the Statistical Offices of Estonia, Latvia, and Lithuania, and aggregated indicators required for comparison with other countries of the BSR from the Eurostat database.

4. Deployment of Renewable Energy Sources

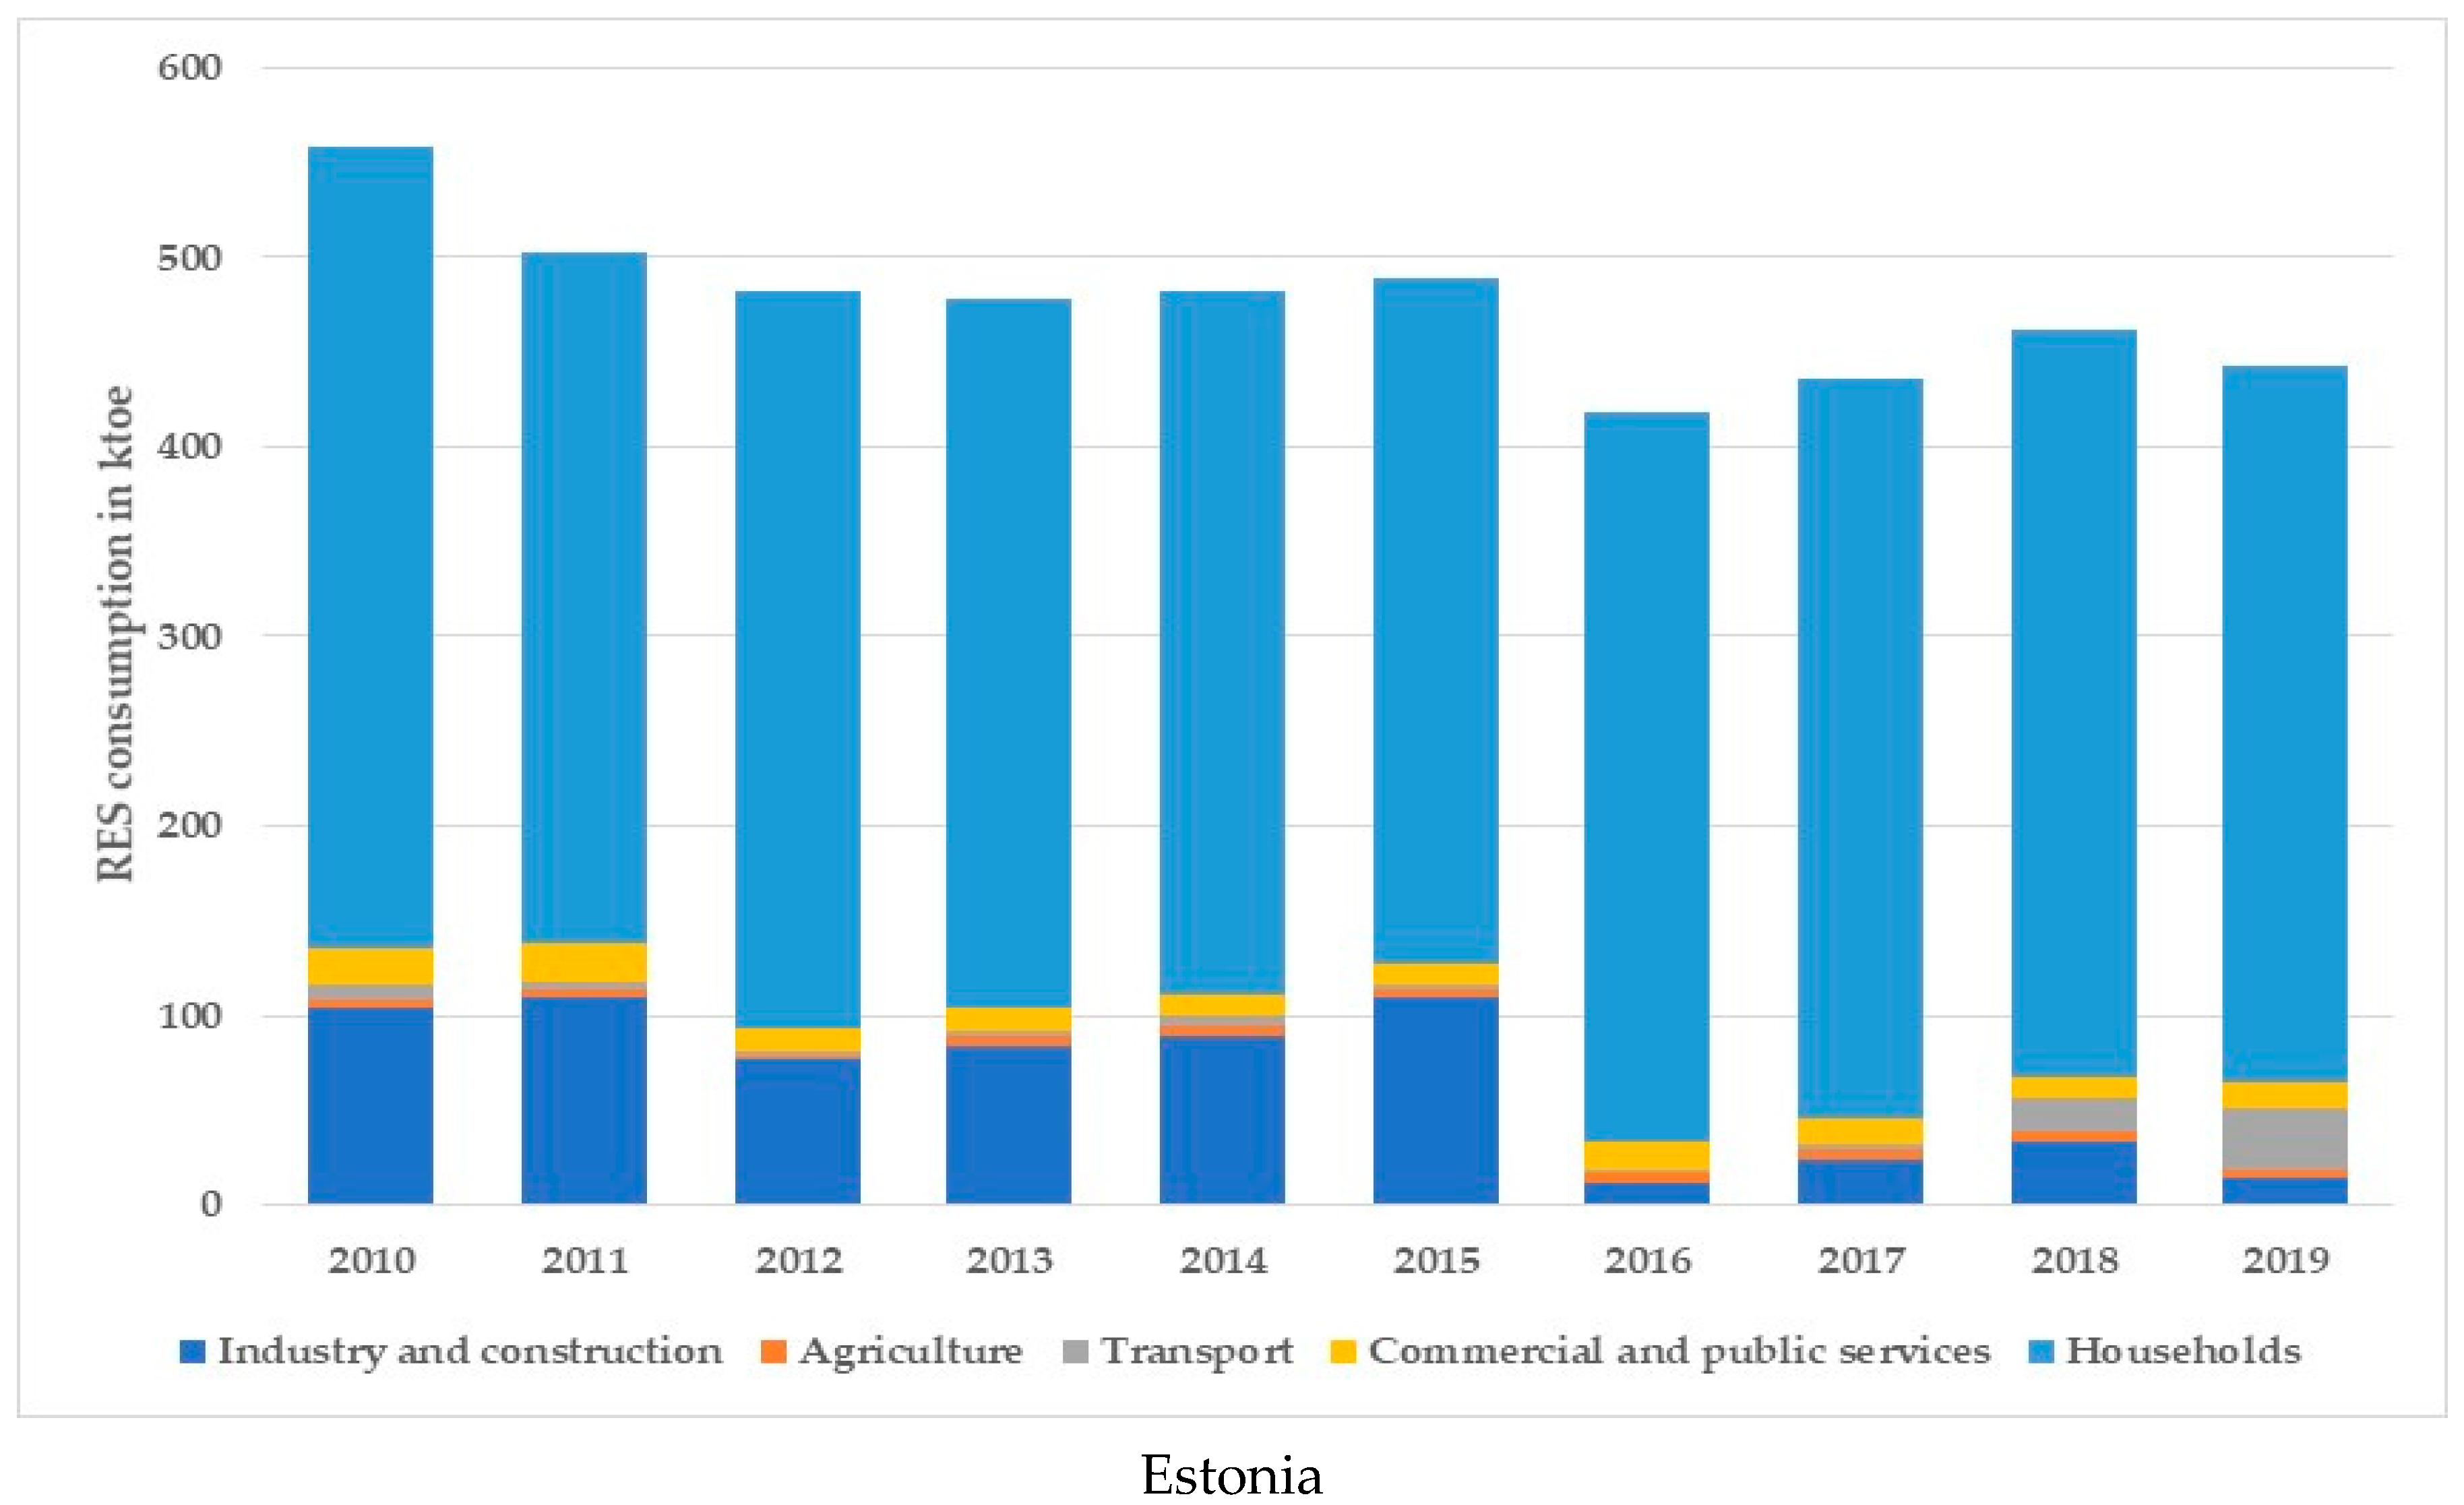
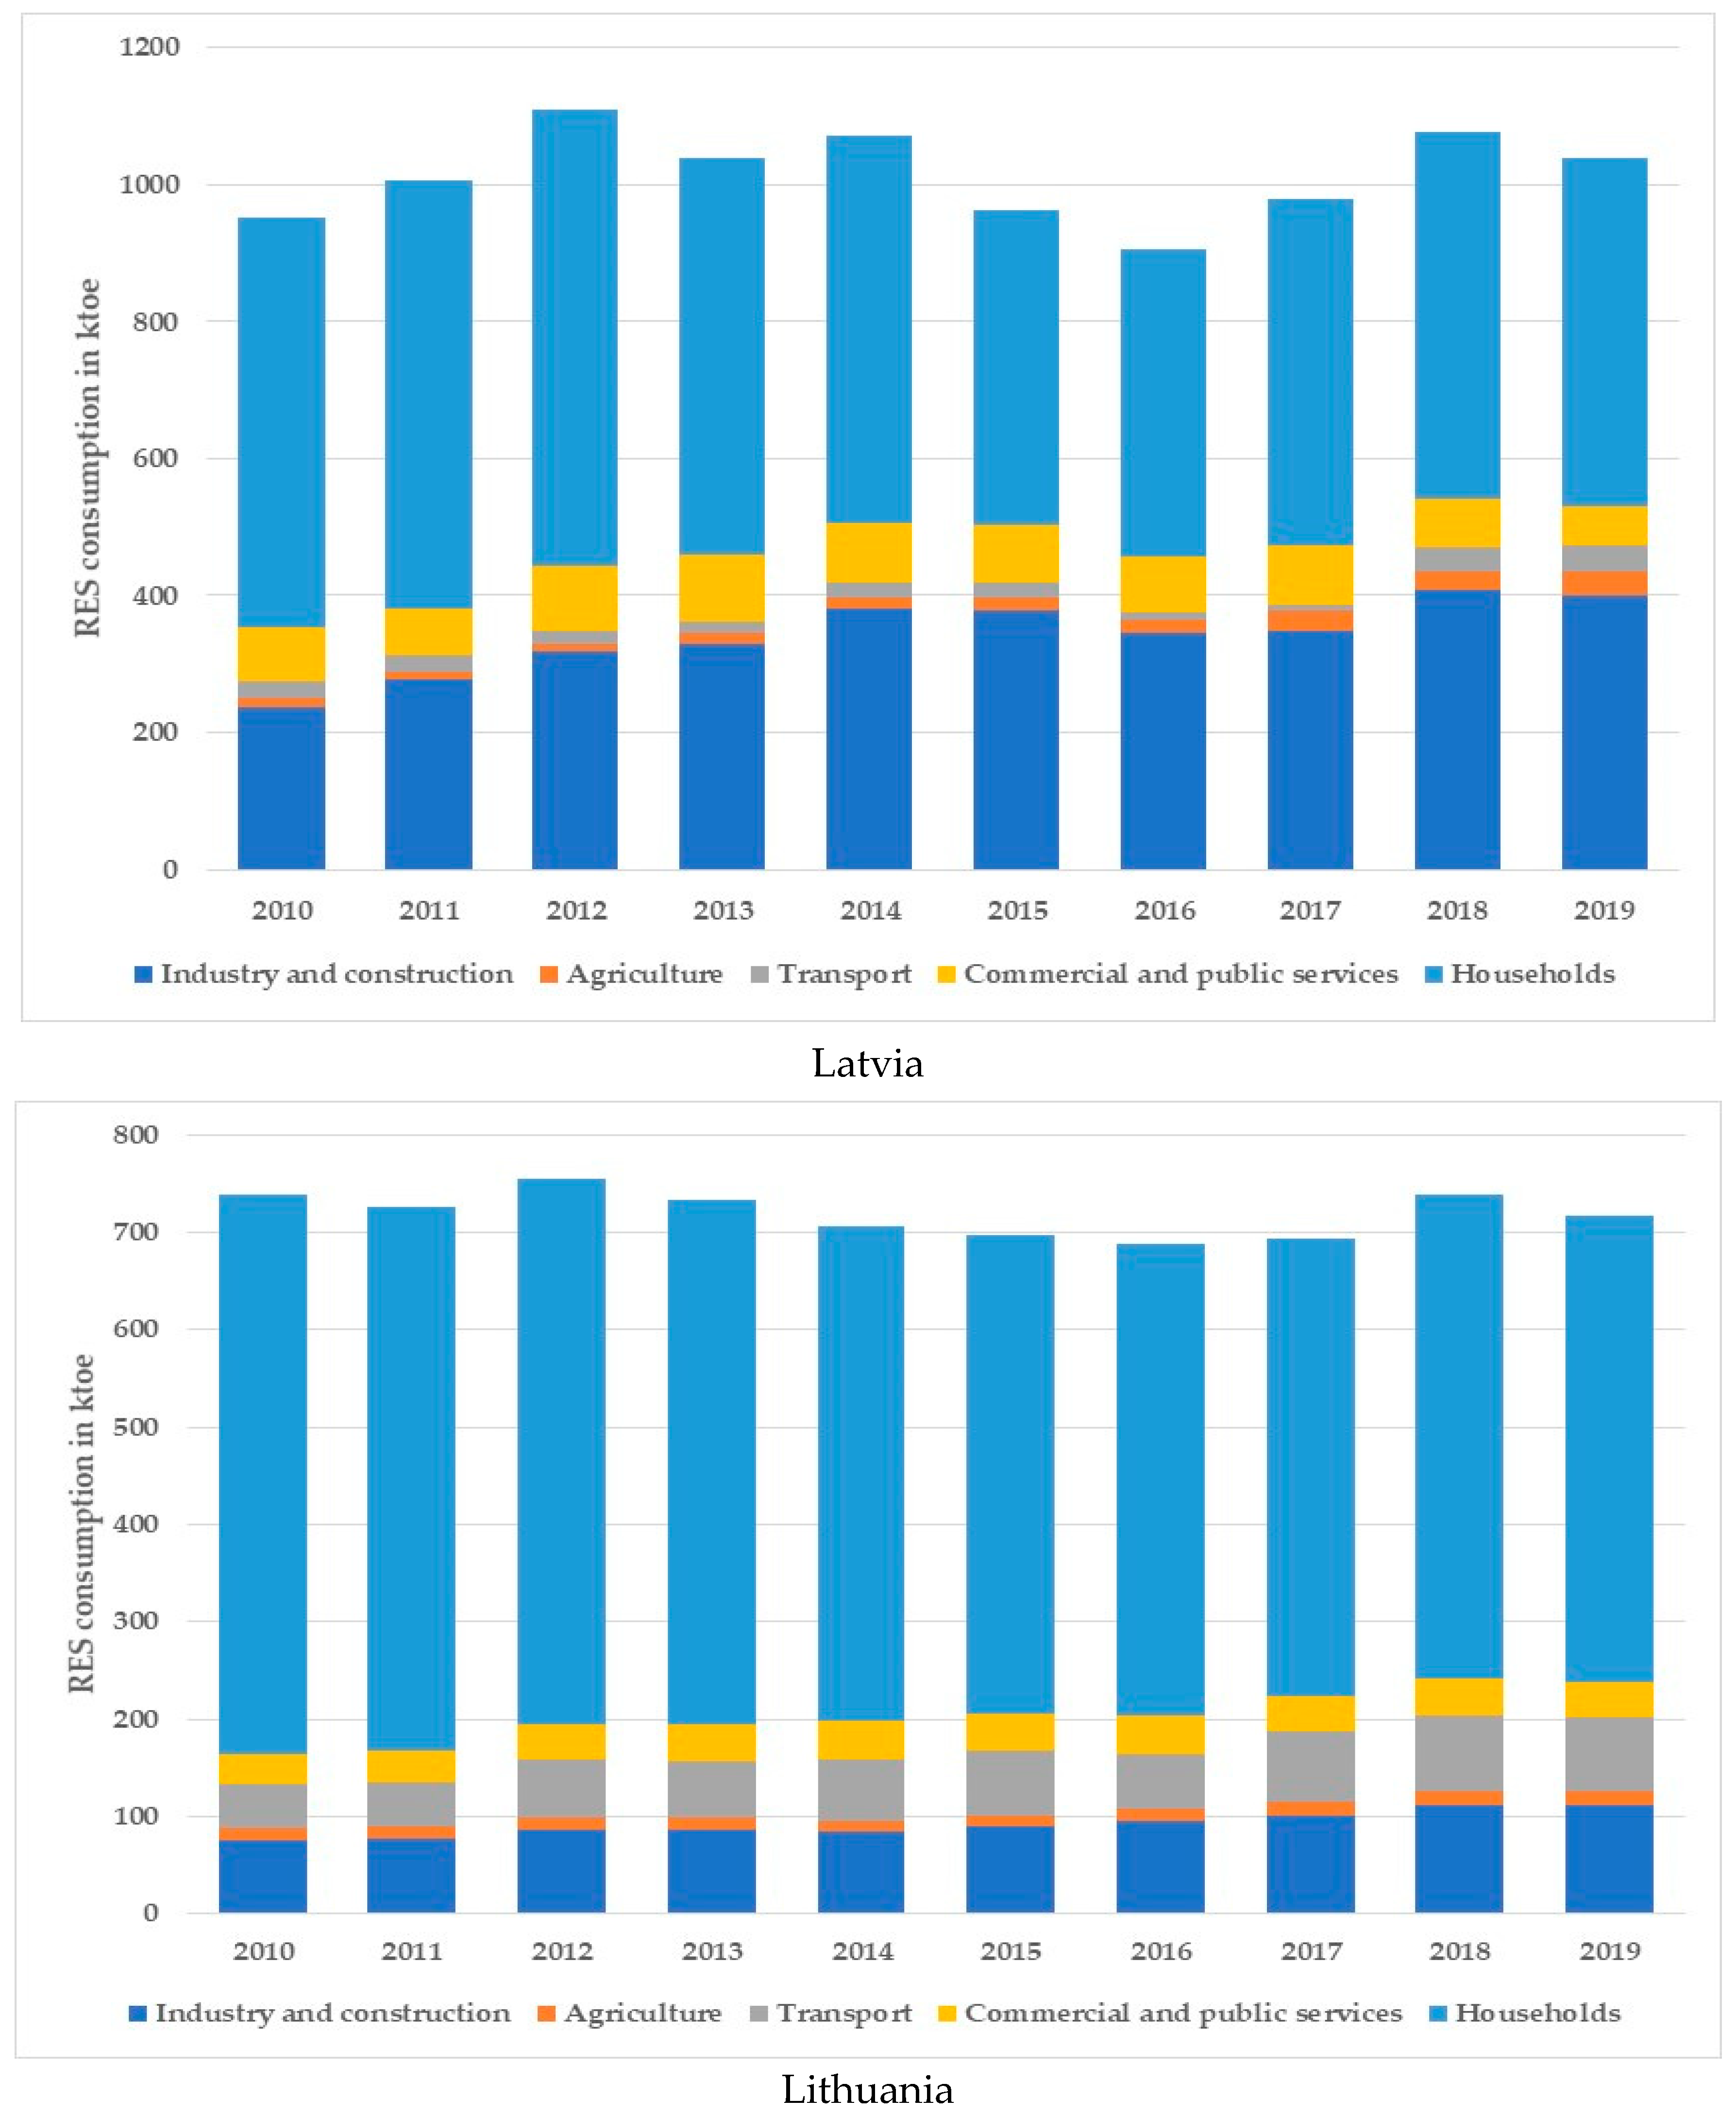
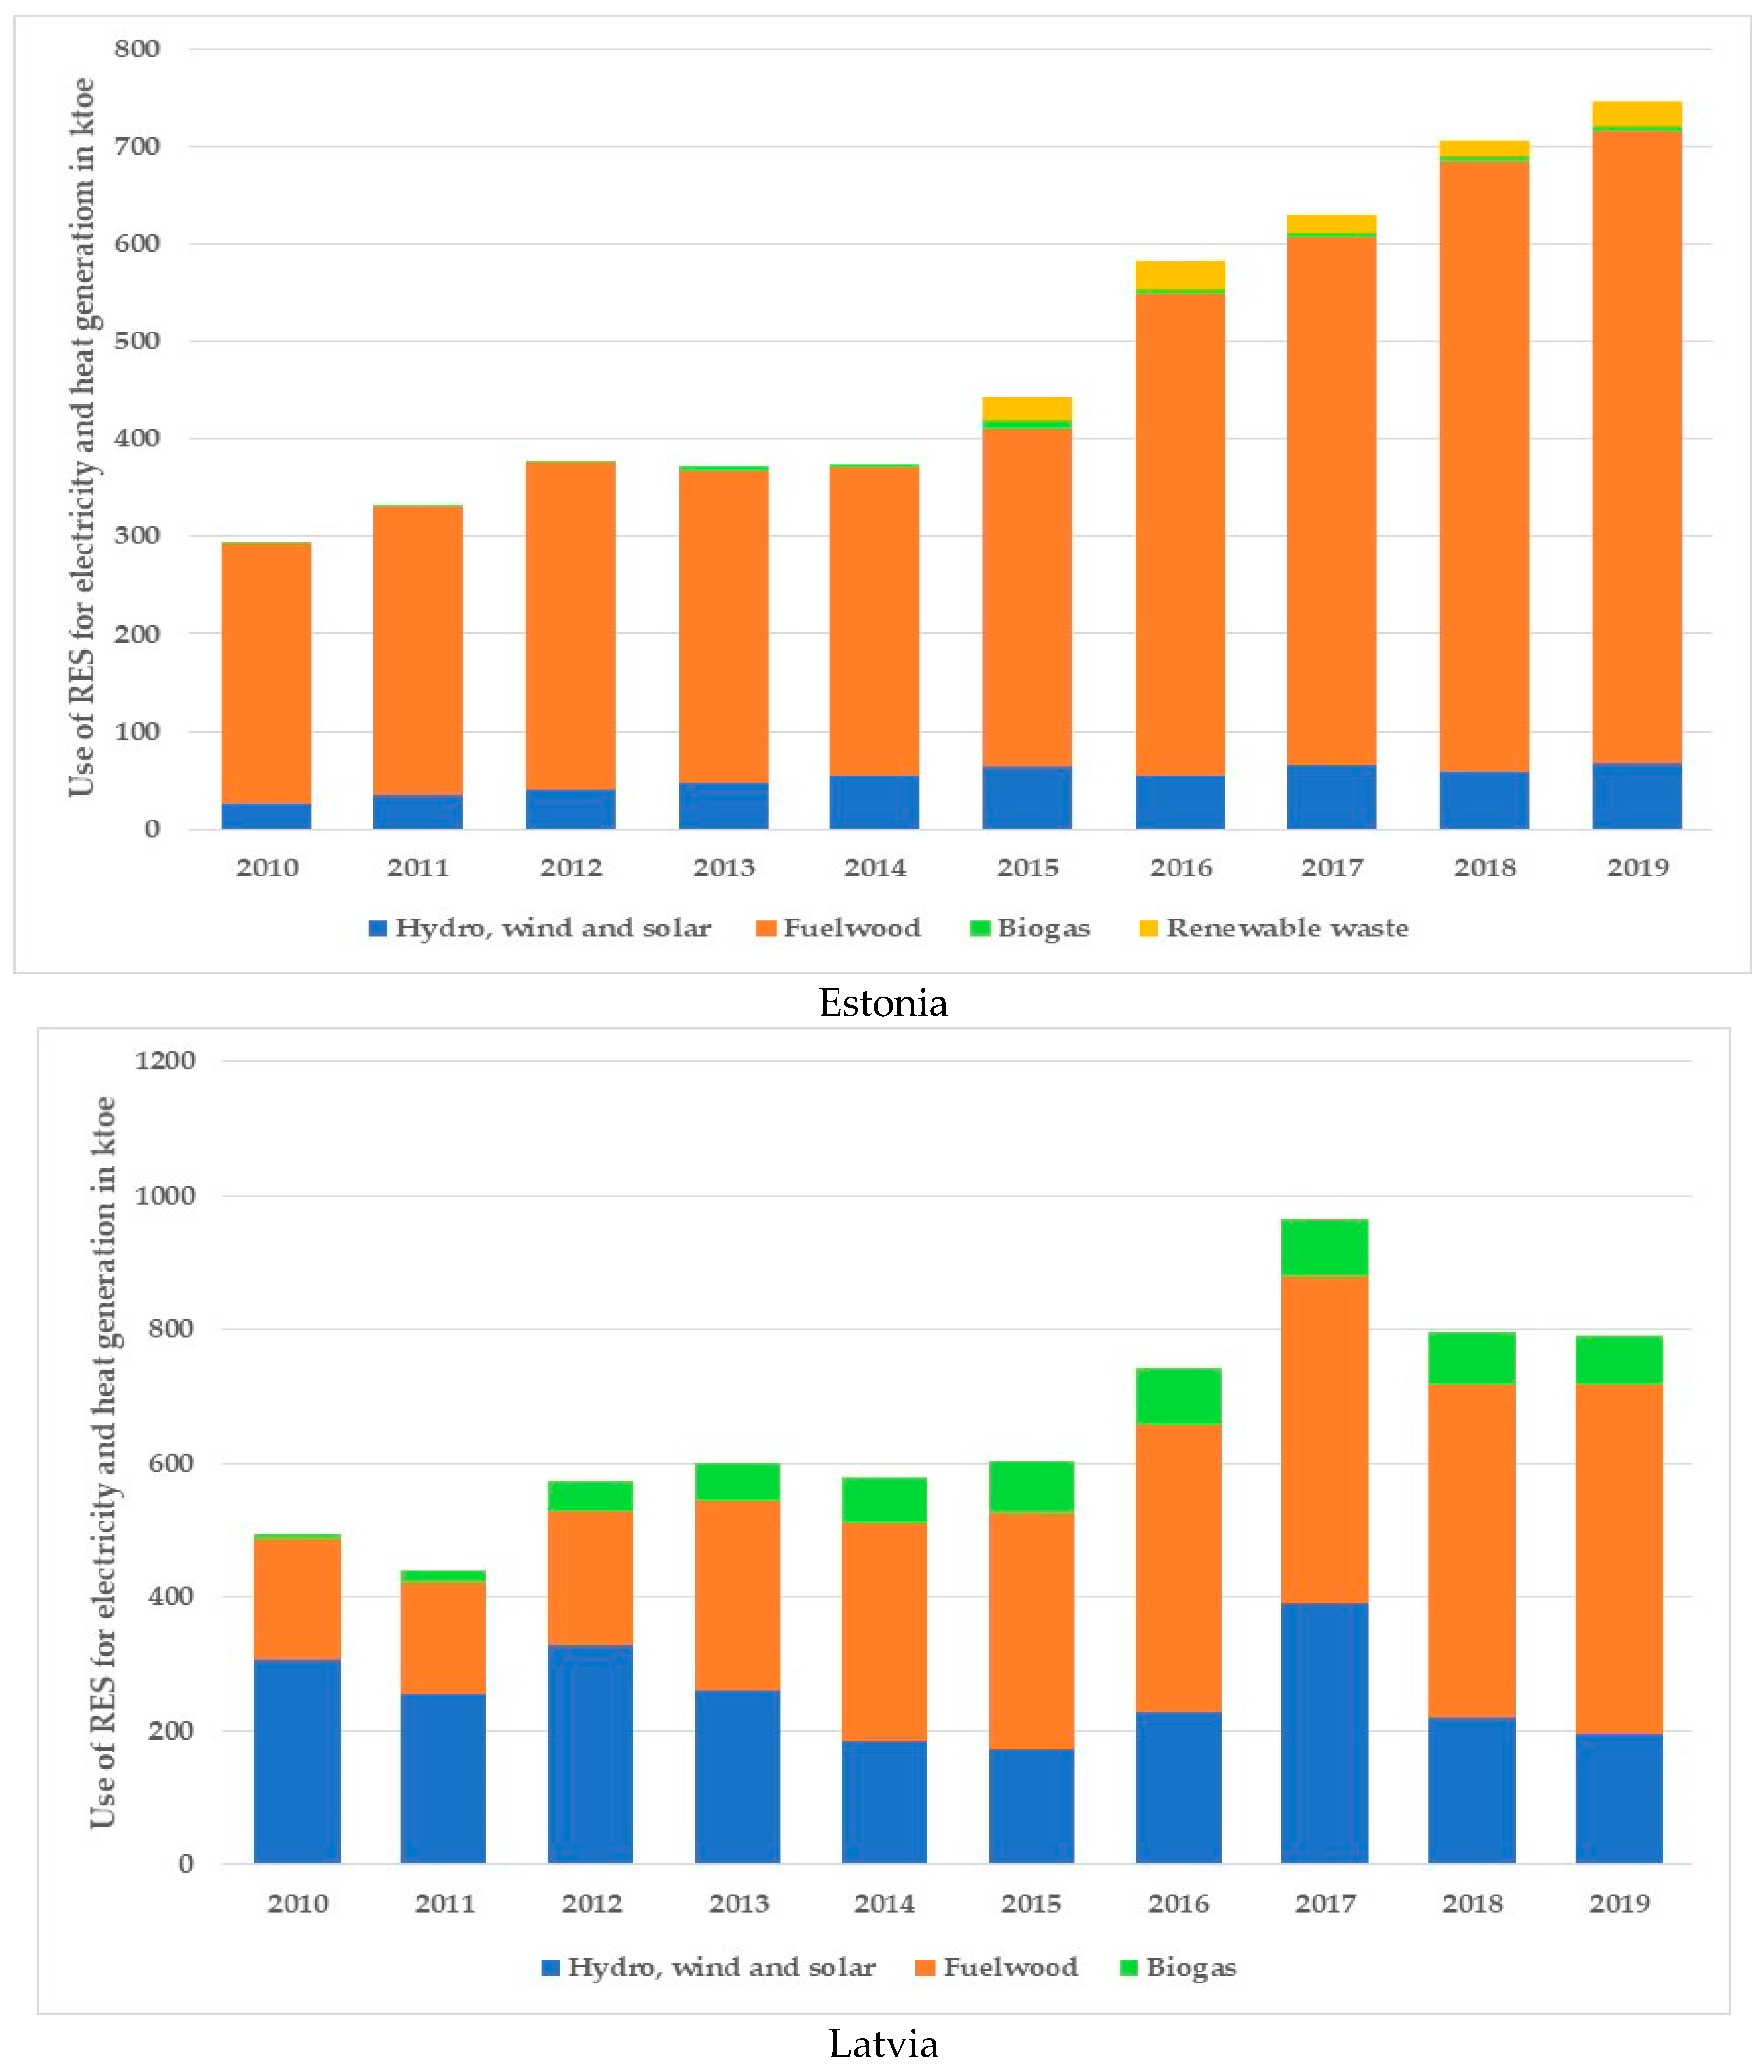
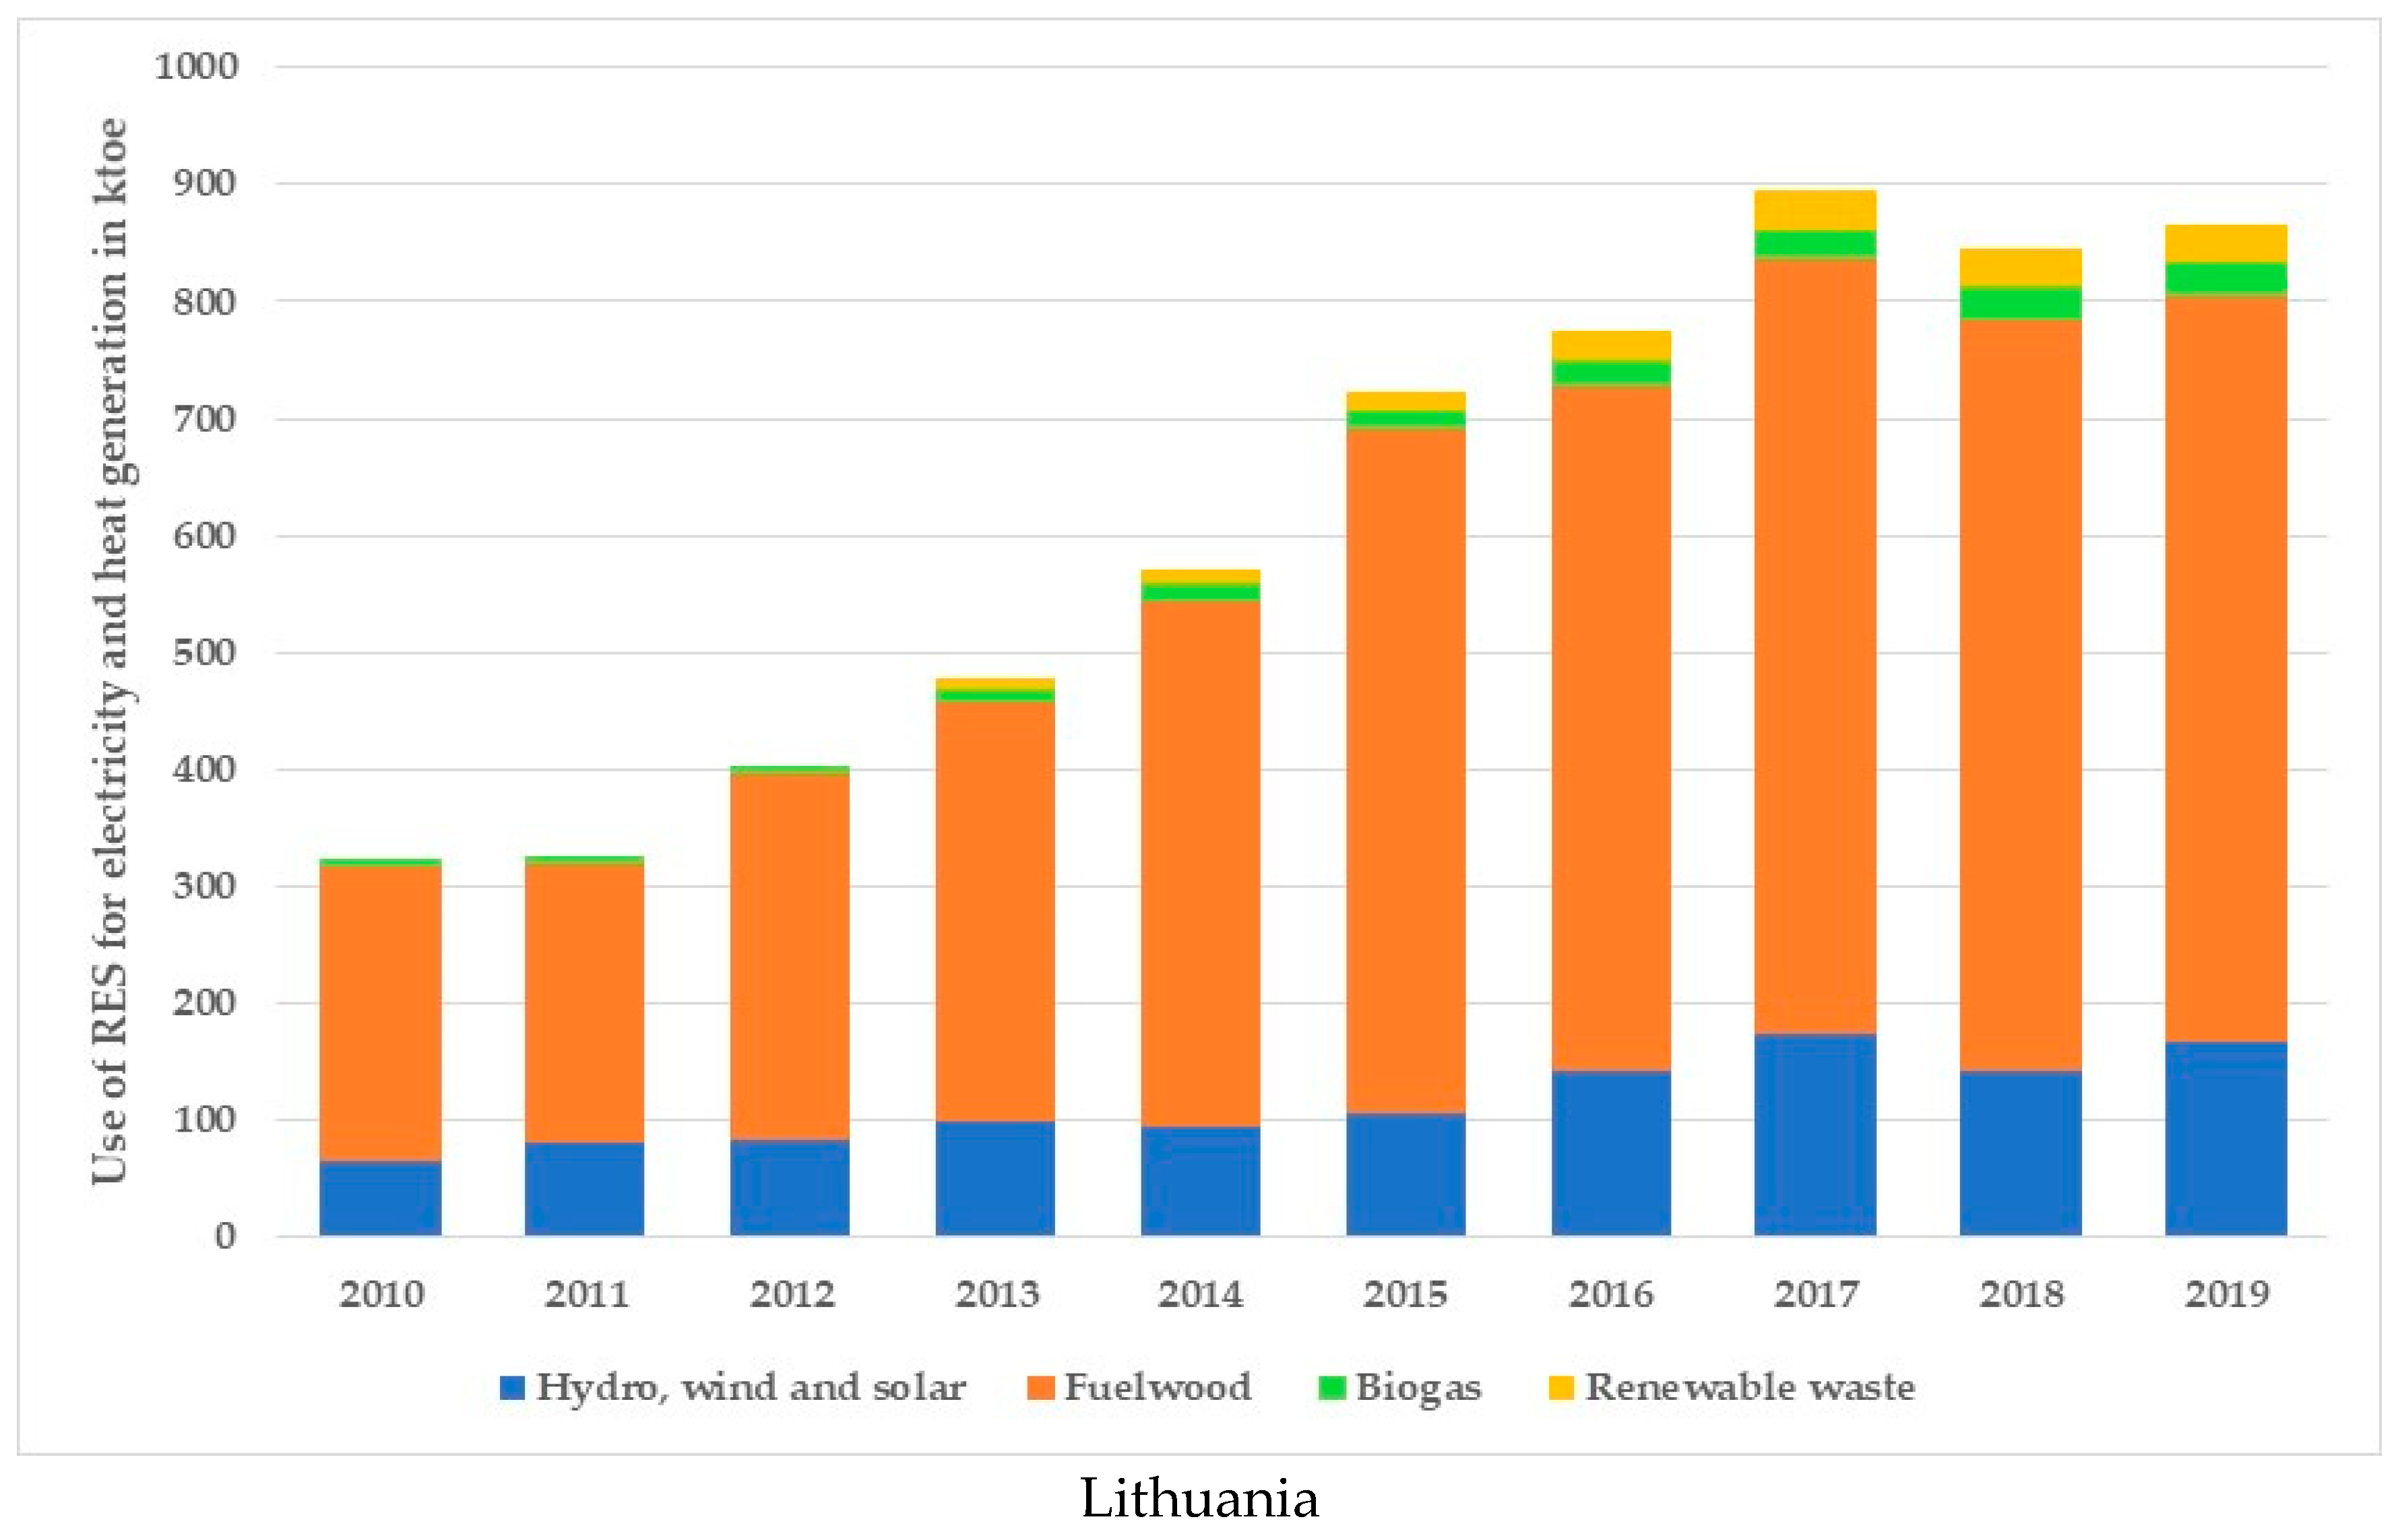
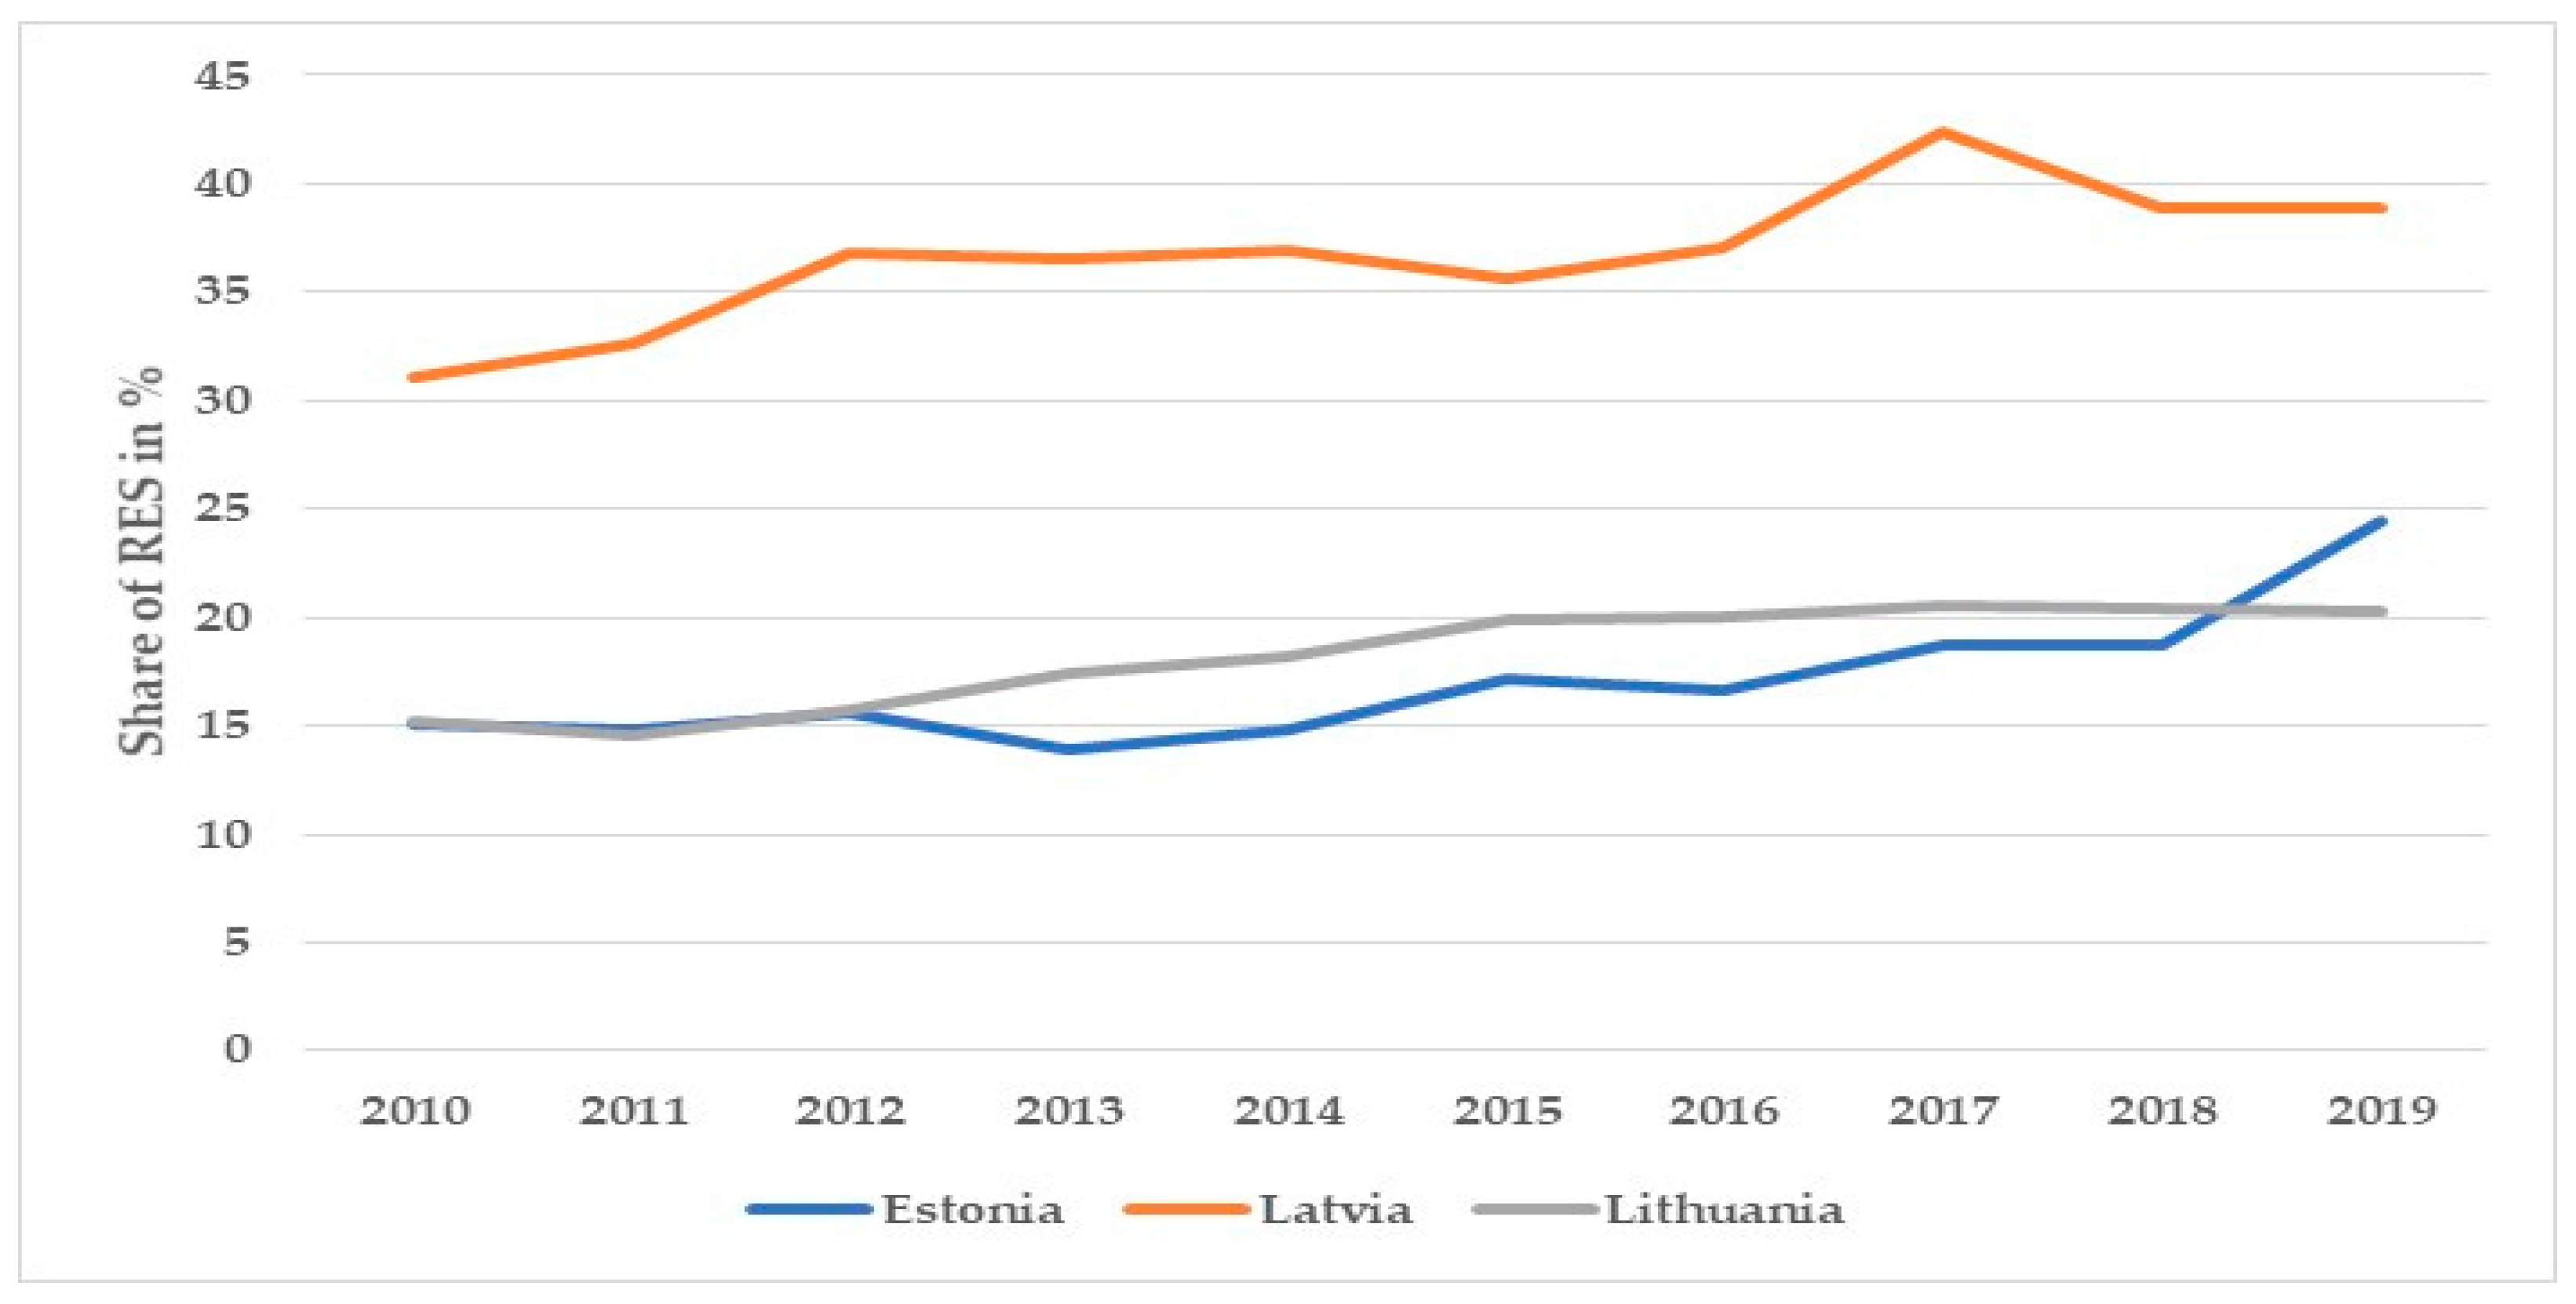
4.1. Trends in the Final Consumption of RES in the Baltic States

The increasing share of RES in the final energy consumption was expected in the previous periods by policymakers as an important alteration of conventional energy use in the Baltic States. Consequently, an objective for greater consumption of indigenous, renewable, and waste energy sources was foreseen in many energy policy documents and NREAPs, including national targets for the overall share of energy from renewable sources in the gross final consumption of energy.
As the most promising energy policy measure, the first stage was substituting imported fossil fuels with combustible renewables (firewood, waste wood, agricultural waste, wood briquettes, and other local fuels) for final consumers, who are not connected to the district heat and natural gas supply systems. Thus, coal, petroleum products, and partly natural gas were substituted gradually by fuelwood and other RES in all sectors of the national economies in all three countries.
During 2010–2019, trends of final RES consumption in the Baltic countries were different (Figure 1). Total final RES consumption decreased in Estonia on average by 2.5% and Lithuania by 0.3% annually, but it increased in Latvia by 1.0% annually. Thus, certain fluctuation in RES consumption in all three countries was observed. In 2019, the total volume of their consumption by final consumers was 9.2% higher in Latvia, but it was lower than the 2010 levels by 20.7% in Estonia and 2.8% in Lithuania.
The significant structural changes in final energy consumption and the different role of the industry sector in deploying RES should be stressed. In 2019, the final consumption of RES in this sector in Estonia had decreased by 86.0%, compared with the 2010 level. Conversely, the final consumption of RES in this sector had increased by 1.7 times in Latvia and by 1.5 times in Lithuania. Thus, the share of the industry sector in the total final consumption of RES in Estonia had decreased over this period from 18.7% to 3.3%. The role of the industry sector has increased in Latvia from 24.9% to 38.4%, and in Lithuania from 10.3% to 15.5%. These changes have been stipulated mostly by the growth of fuelwood consumption in the manufacturing of wood and wood products in Latvia and Lithuania. Since 2016, consumption of this fuel in the Estonian industry sector has decreased by almost 5 times, compared with an average over the previous period.
Reduction of final RES consumption in the residential sector of the Baltic countries should be emphasized. In 2019, the final consumption of RES in this sector had decreased by 10.6% in Estonia, 14.6% in Latvia, and 16.6% in Lithuania, compared with the 2010 level. This trend is caused mostly by the growing energy efficiency due to: (a) modernisation of single-family houses and their internal heating systems, and (b) more efficient use of wood briquettes and pelleted wood in modern boilers instead of stove heating. Certain fluctuation of fuelwood consumption for space heating was fixed also due to variation of climatic conditions. Currently, the highest share of the residential sector in the total final RES consumption is in Estonia with 85.4%. In 2019, the share of households amounted to 49.0% in Latvia, and 66.8% in Lithuania.
During 2010–2019, the total volume of RES consumed directly as fuels in three sectors—transport, agriculture, and commercial and public services—had increased by 64.0% in Estonia, 11.0% in Latvia, and 44.9% in Lithuania. However, the role of these sectors in the deployment of RES was still very low—in 2019, their share in the final RES consumption amounted to 11.3% in Estonia, 12.6% in Latvia, and 17.7% in Lithuania.
A common feature for all three countries is the dominating role of fuelwood in the final RES consumption (Figure 2). In 2019, the share of fuelwood in the final RES consumption amounted to 91.4% in Estonia, 92.8% in Latvia, and 85.6% in Lithuania. It is important to emphasise that consumption of this fuel in absolute value in Latvia is currently 2.4 times larger than in Estonia and 1.6 times larger than in Lithuania. Additionally, trends of its deployment are different. In 2019, the final consumption of fuelwood in Latvia was 6.0% higher than the 2010 level. Conversely, the final consumption over the same period had decreased by 26.3% in Estonia and 10.7% in Lithuania.
Final RES consumption by fuels is becoming more diverse, but changes are still comparatively low. In 2019, the contribution of biofuels (bioethanol and biodiesel) consumed in the transport sector was the largest in Lithuania with a share of 10.5% in the total final RES consumption. This indicator amounted to 6.2% in Estonia and 3.8% in Latvia. The share of biogas amounted to 1.8% in Estonia, 0.8% in Latvia, and 1.2% in Lithuania. Contribution from renewable waste in Estonia and Latvia and from ambient heat energy in Lithuania is minor.
Future trends of final RES consumption are dependent on: (a) expected growth of RES consumption in the transport sector; (b) further growth of RES consumption in the manufacturing sector; and (c) changes of final energy consumption in the residential sector. Considering the ambitious EU target to achieve a share of at least 32% of energy from renewable sources in the Union’s gross final consumption by 2030 [81], the most promising measure should be the growing contribution from RES in the transport sector. However, in the Baltic states, major effects are expected from the deployment of RES in the industry and the residential sectors.
Some potential for increasing the final RES consumption in all three countries can be based on further substitution of coal, oil products, and natural gas by fuelwood in the residential sector: in 2019, the share of imported fossil fuels in the final fuel consumption in this sector amounted to 15.3% in Estonia, 24.9% in Latvia, and 34.6% in Lithuania. However, the use of natural gas and oil products for space heating and cooking is preferable by end-users. Additionally, the increase in fuelwood consumption is quite limited because the total final consumption of fuels in this sector is decreasing due to the reasons discussed above.
The analysis demonstrates that petroleum products, coal, and partly natural gas in all three countries were substituted by fuelwood in industry, commercial and public services, and the residential sectors.
Structural changes in the final energy consumption should be stressed. Over 2010–2019, these changes were stipulated due to their growing role in the transport sector. Particularly, the remarkable increase of final energy consumption with 47.3% in Lithuania was fixed in this sector. It was caused by the rapid growth of economic activities in the transport sector and increased population mobility. Notably, this increase was moderate with 10.3% in Estonia and 5.5% in Latvia. Petroleum products dominate in this sector, and the contribution of bioethanol and biodiesel is still very low. Therefore, the share of biofuels is increasing slowly in the transport sector and in the balance of fuels directly consumed by end-users in all three countries.

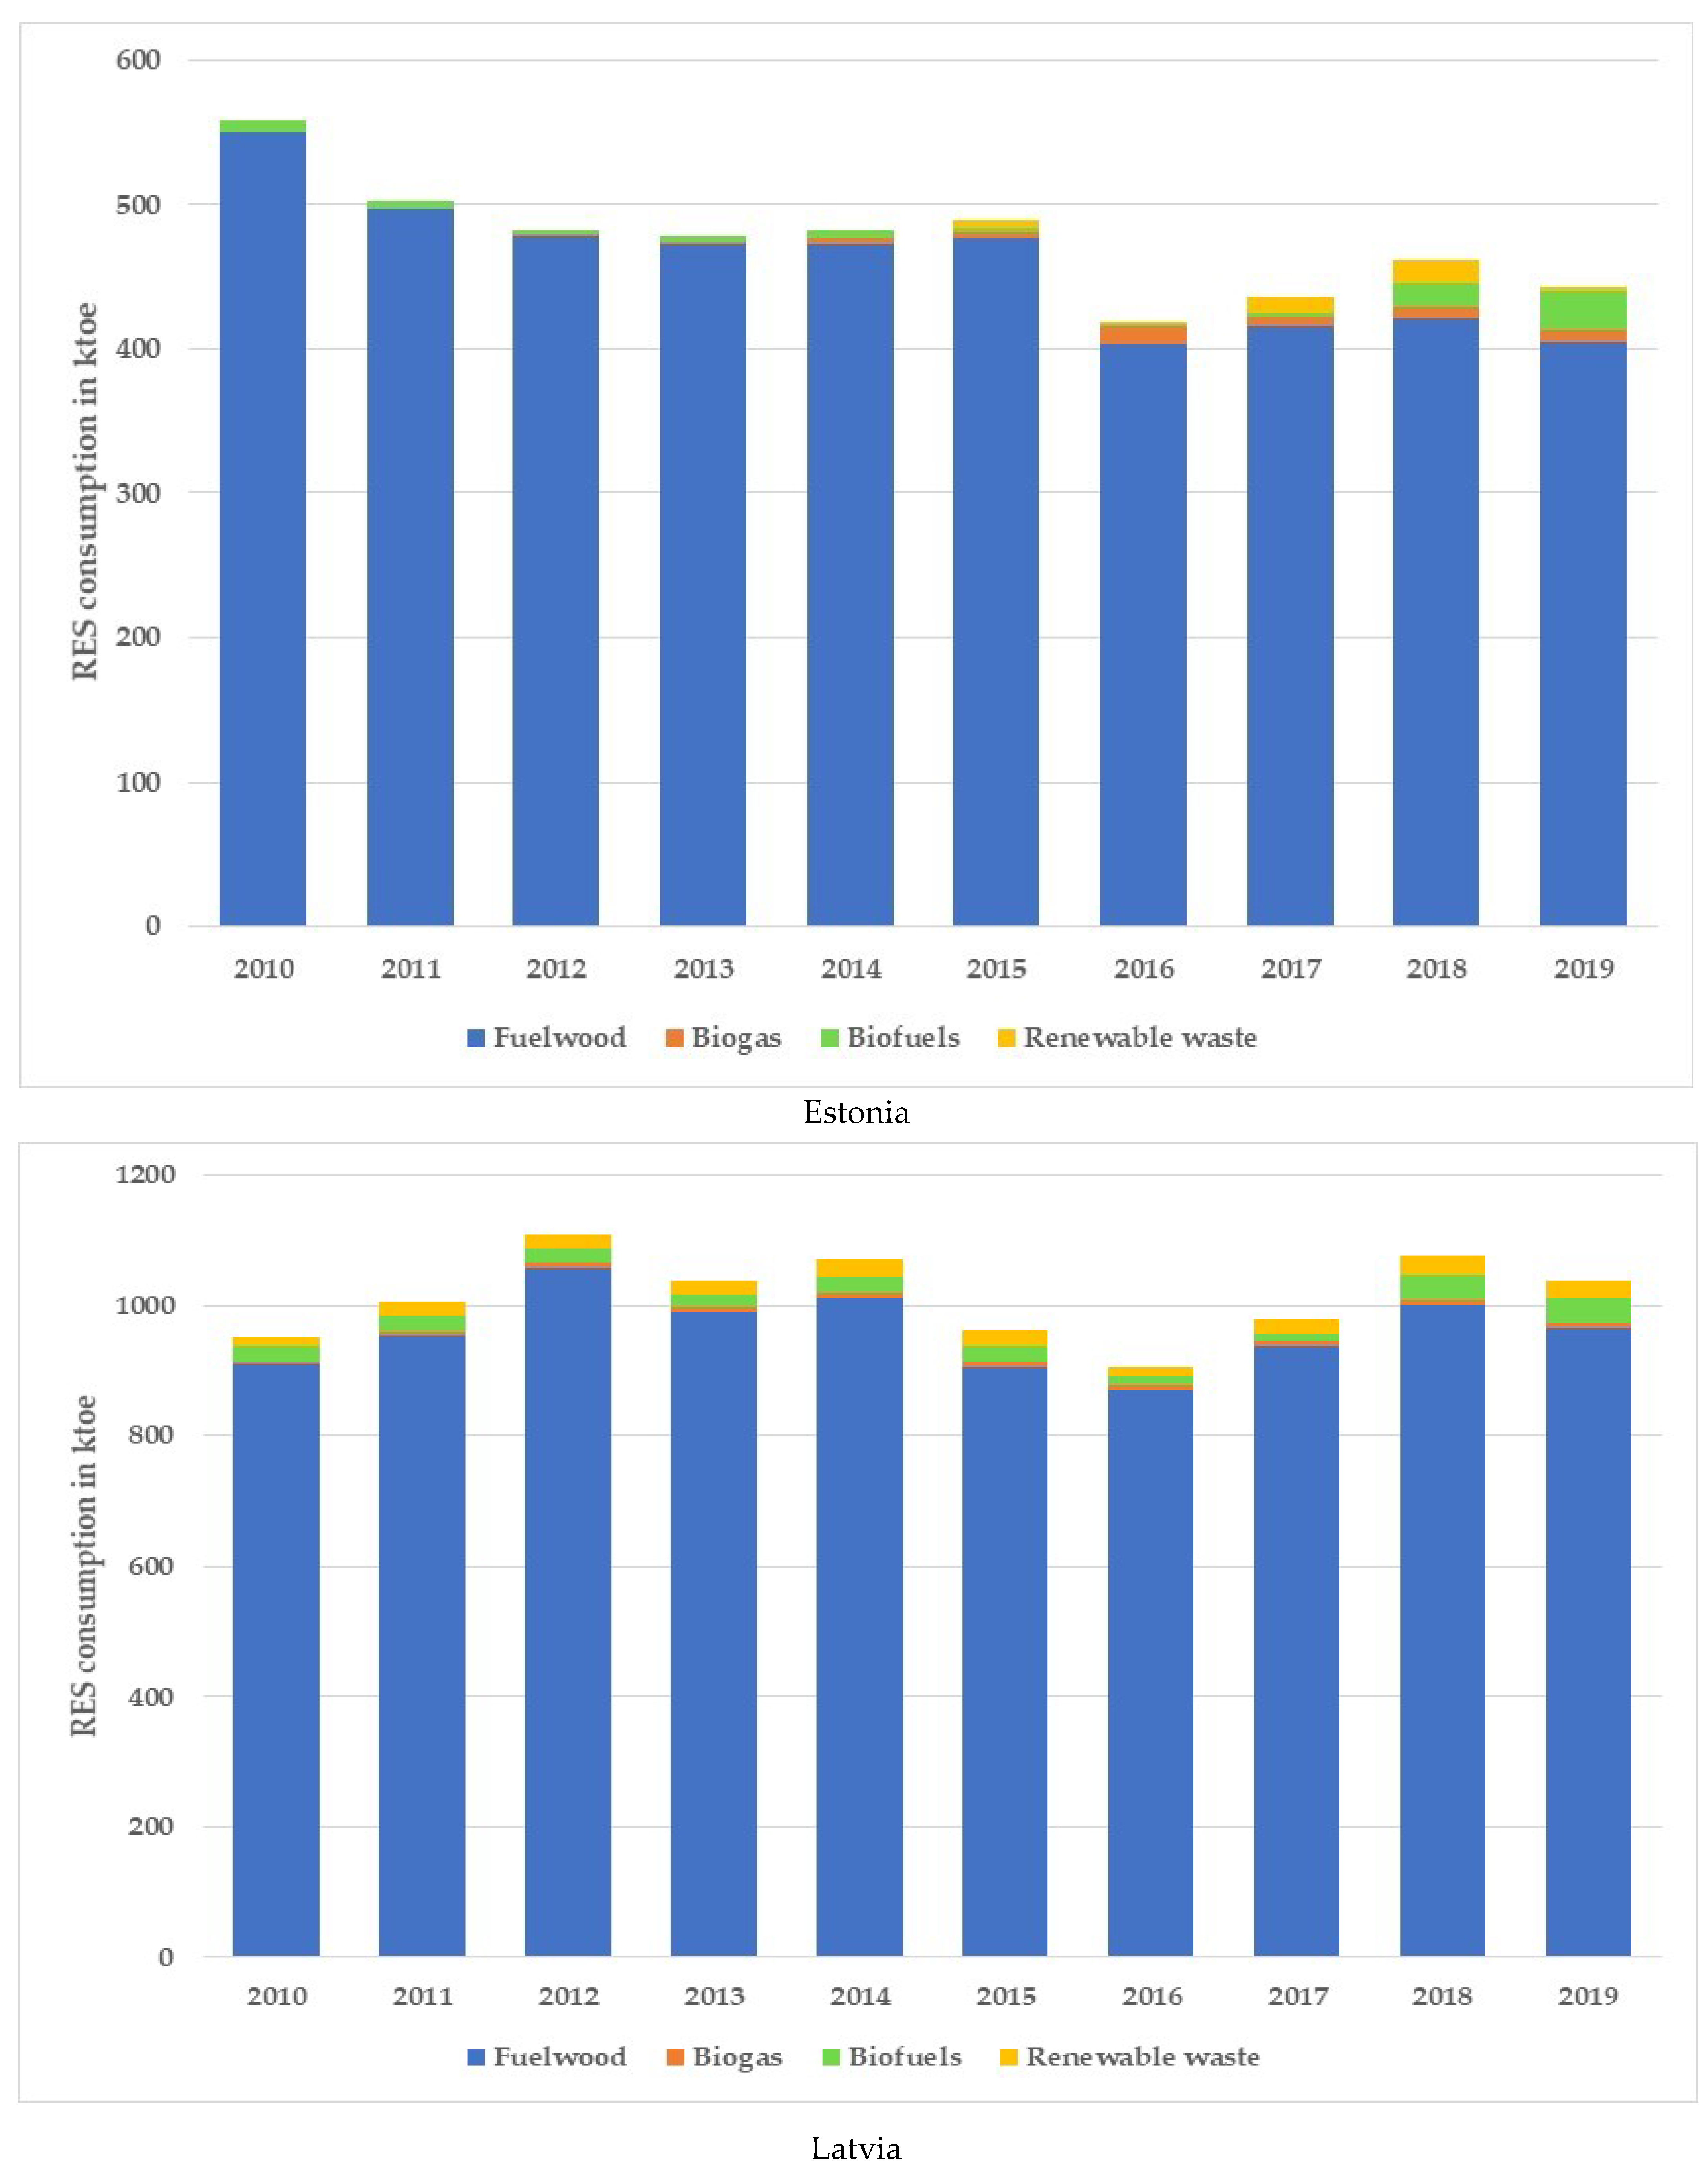
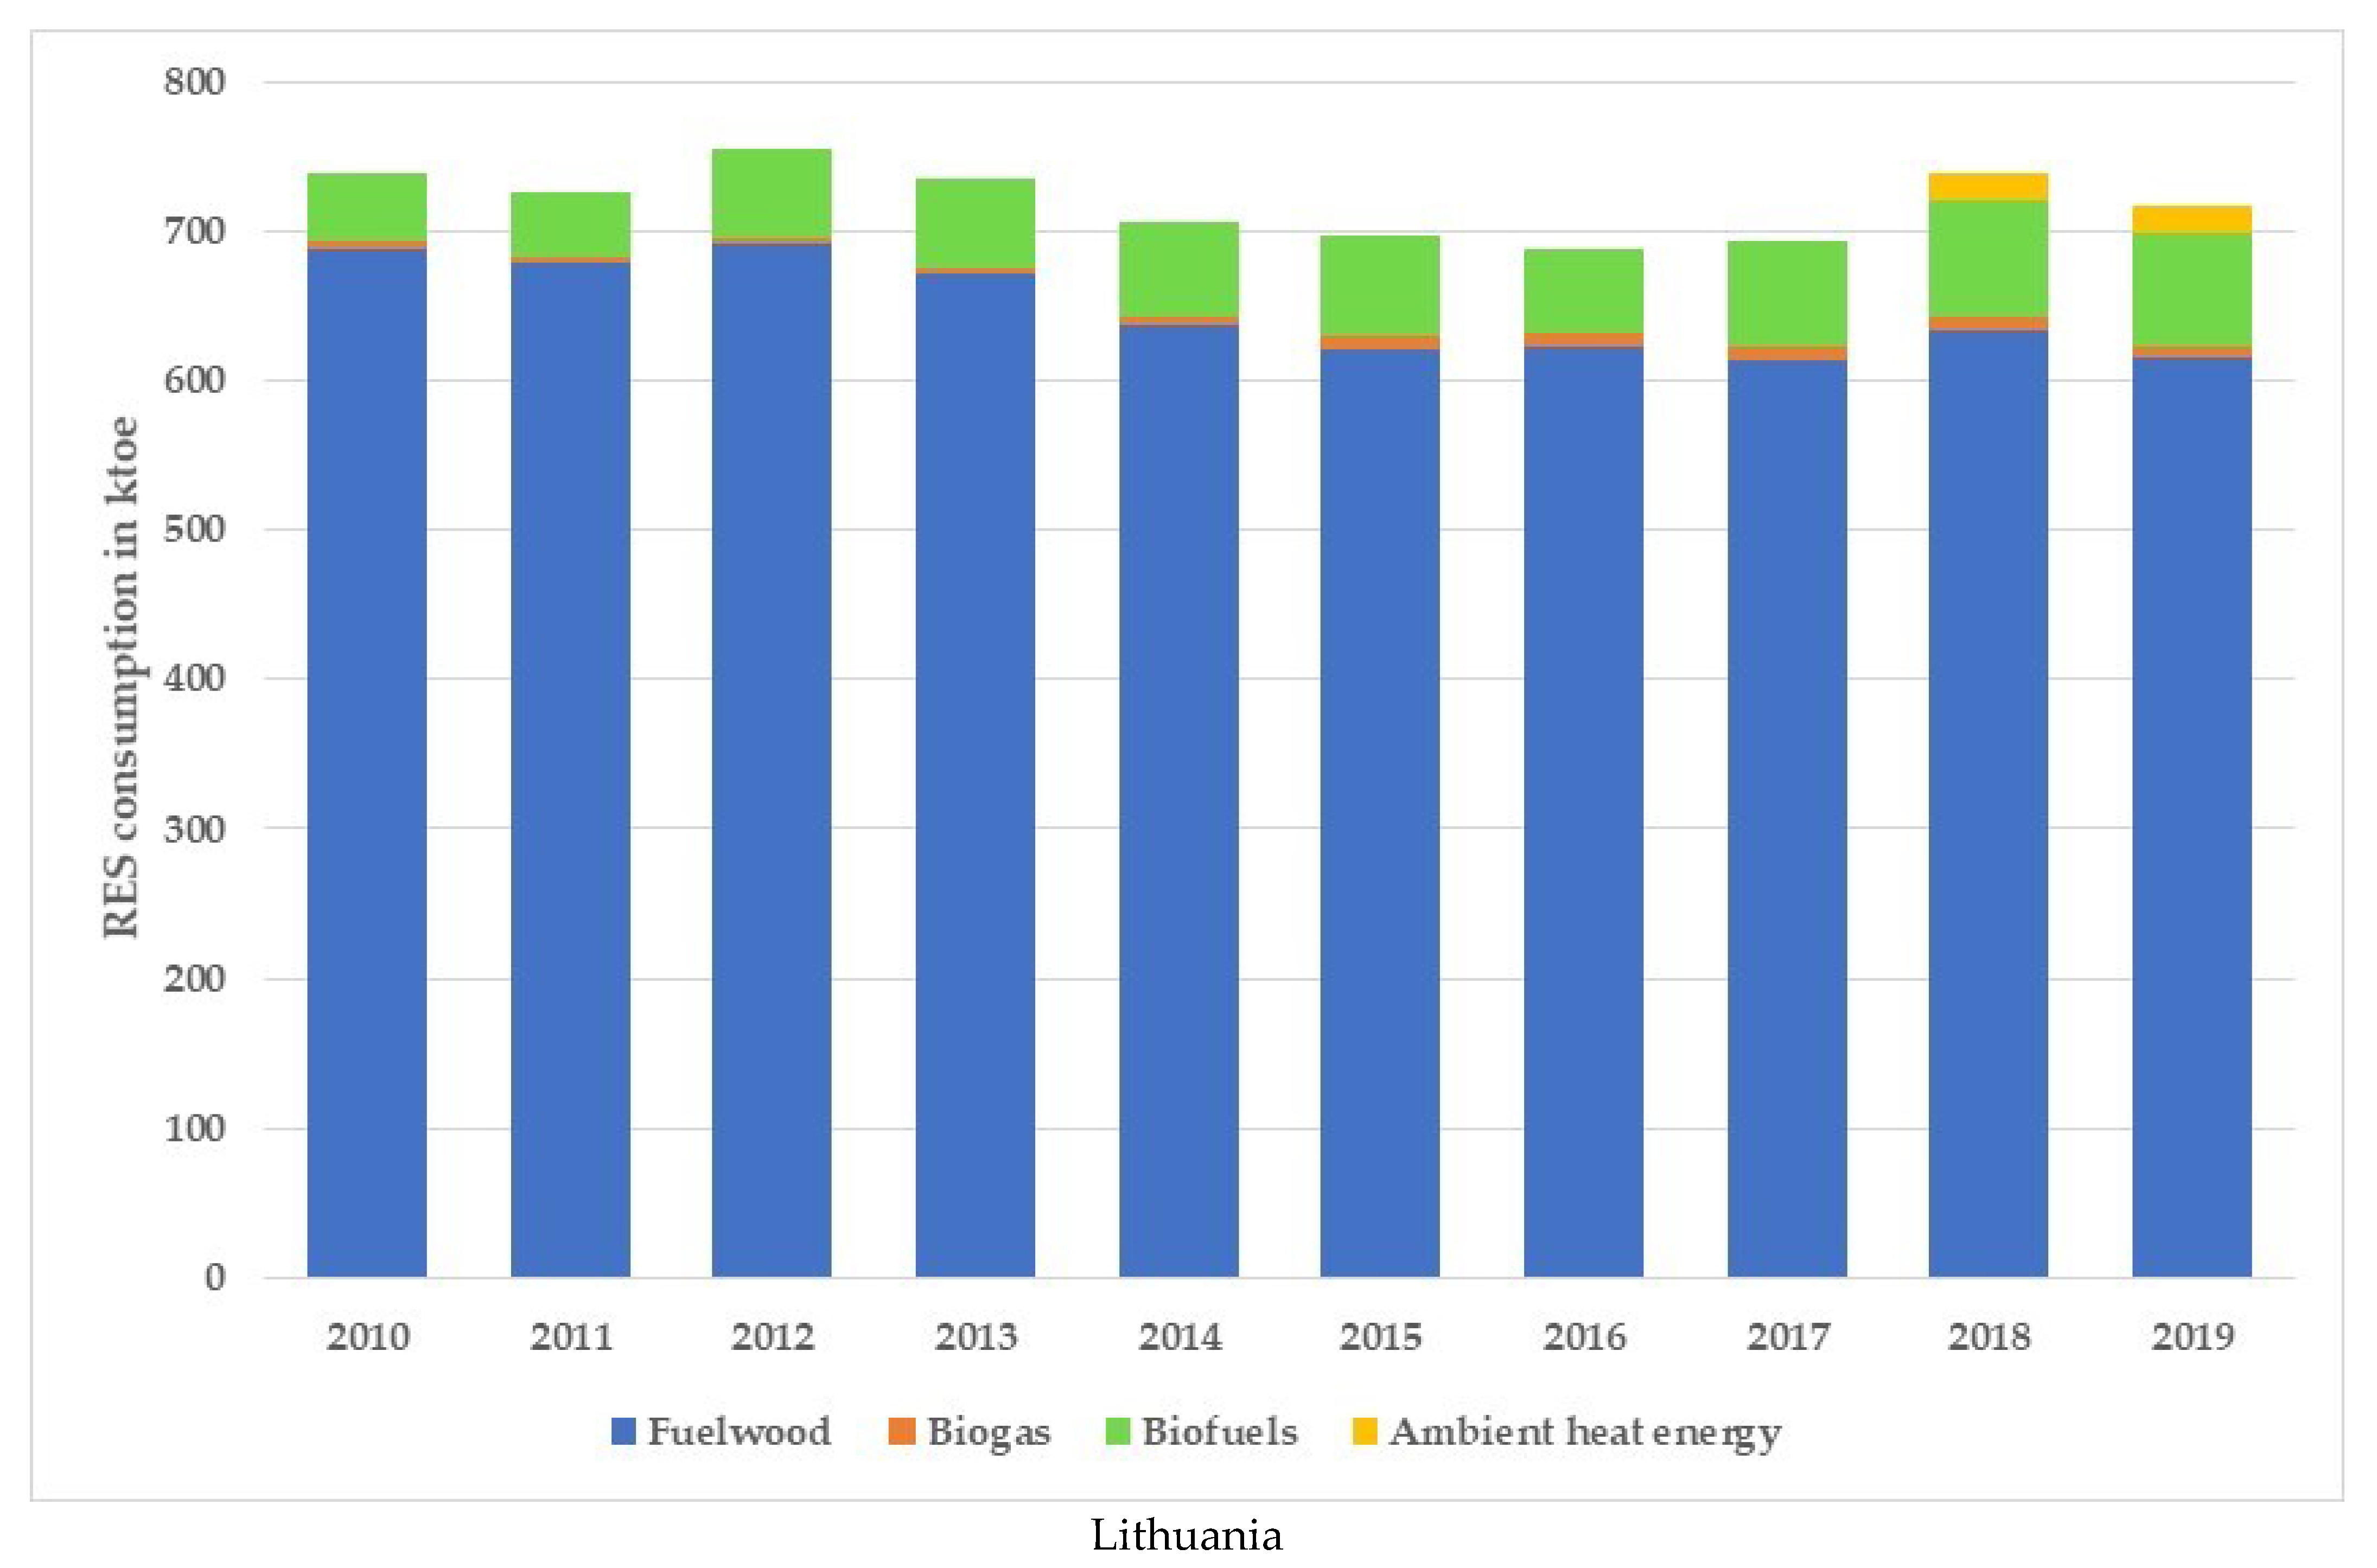
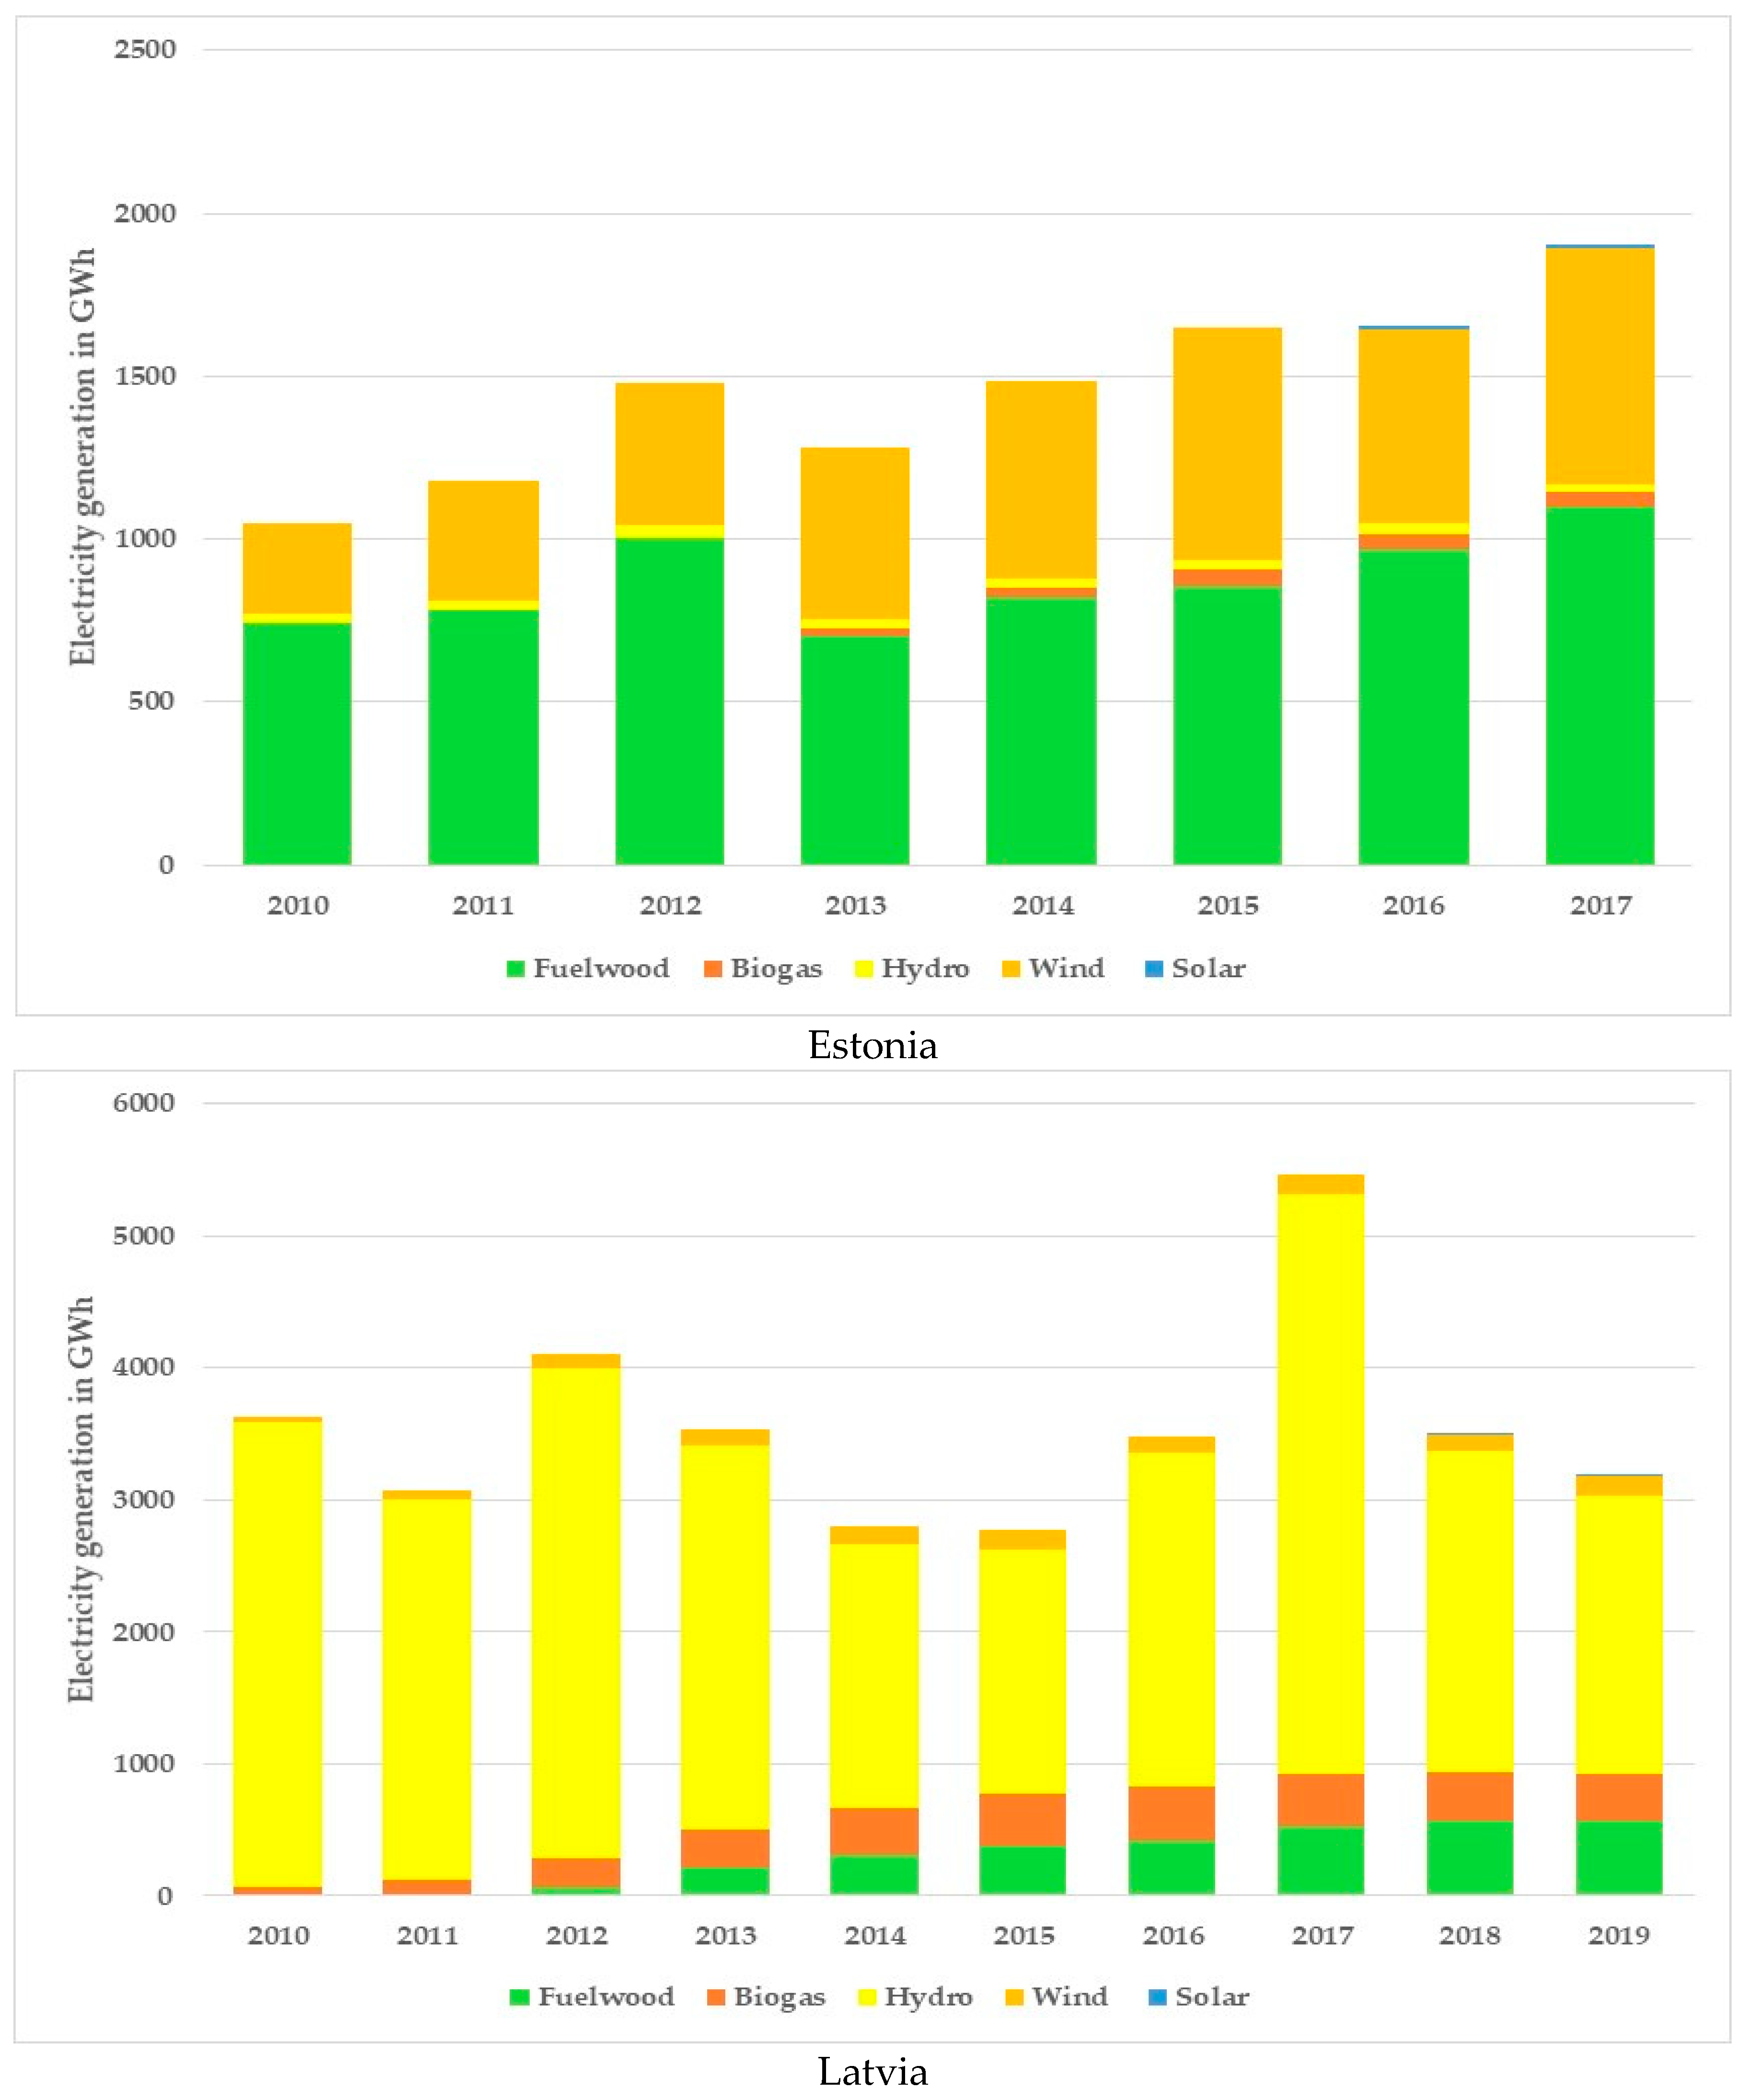
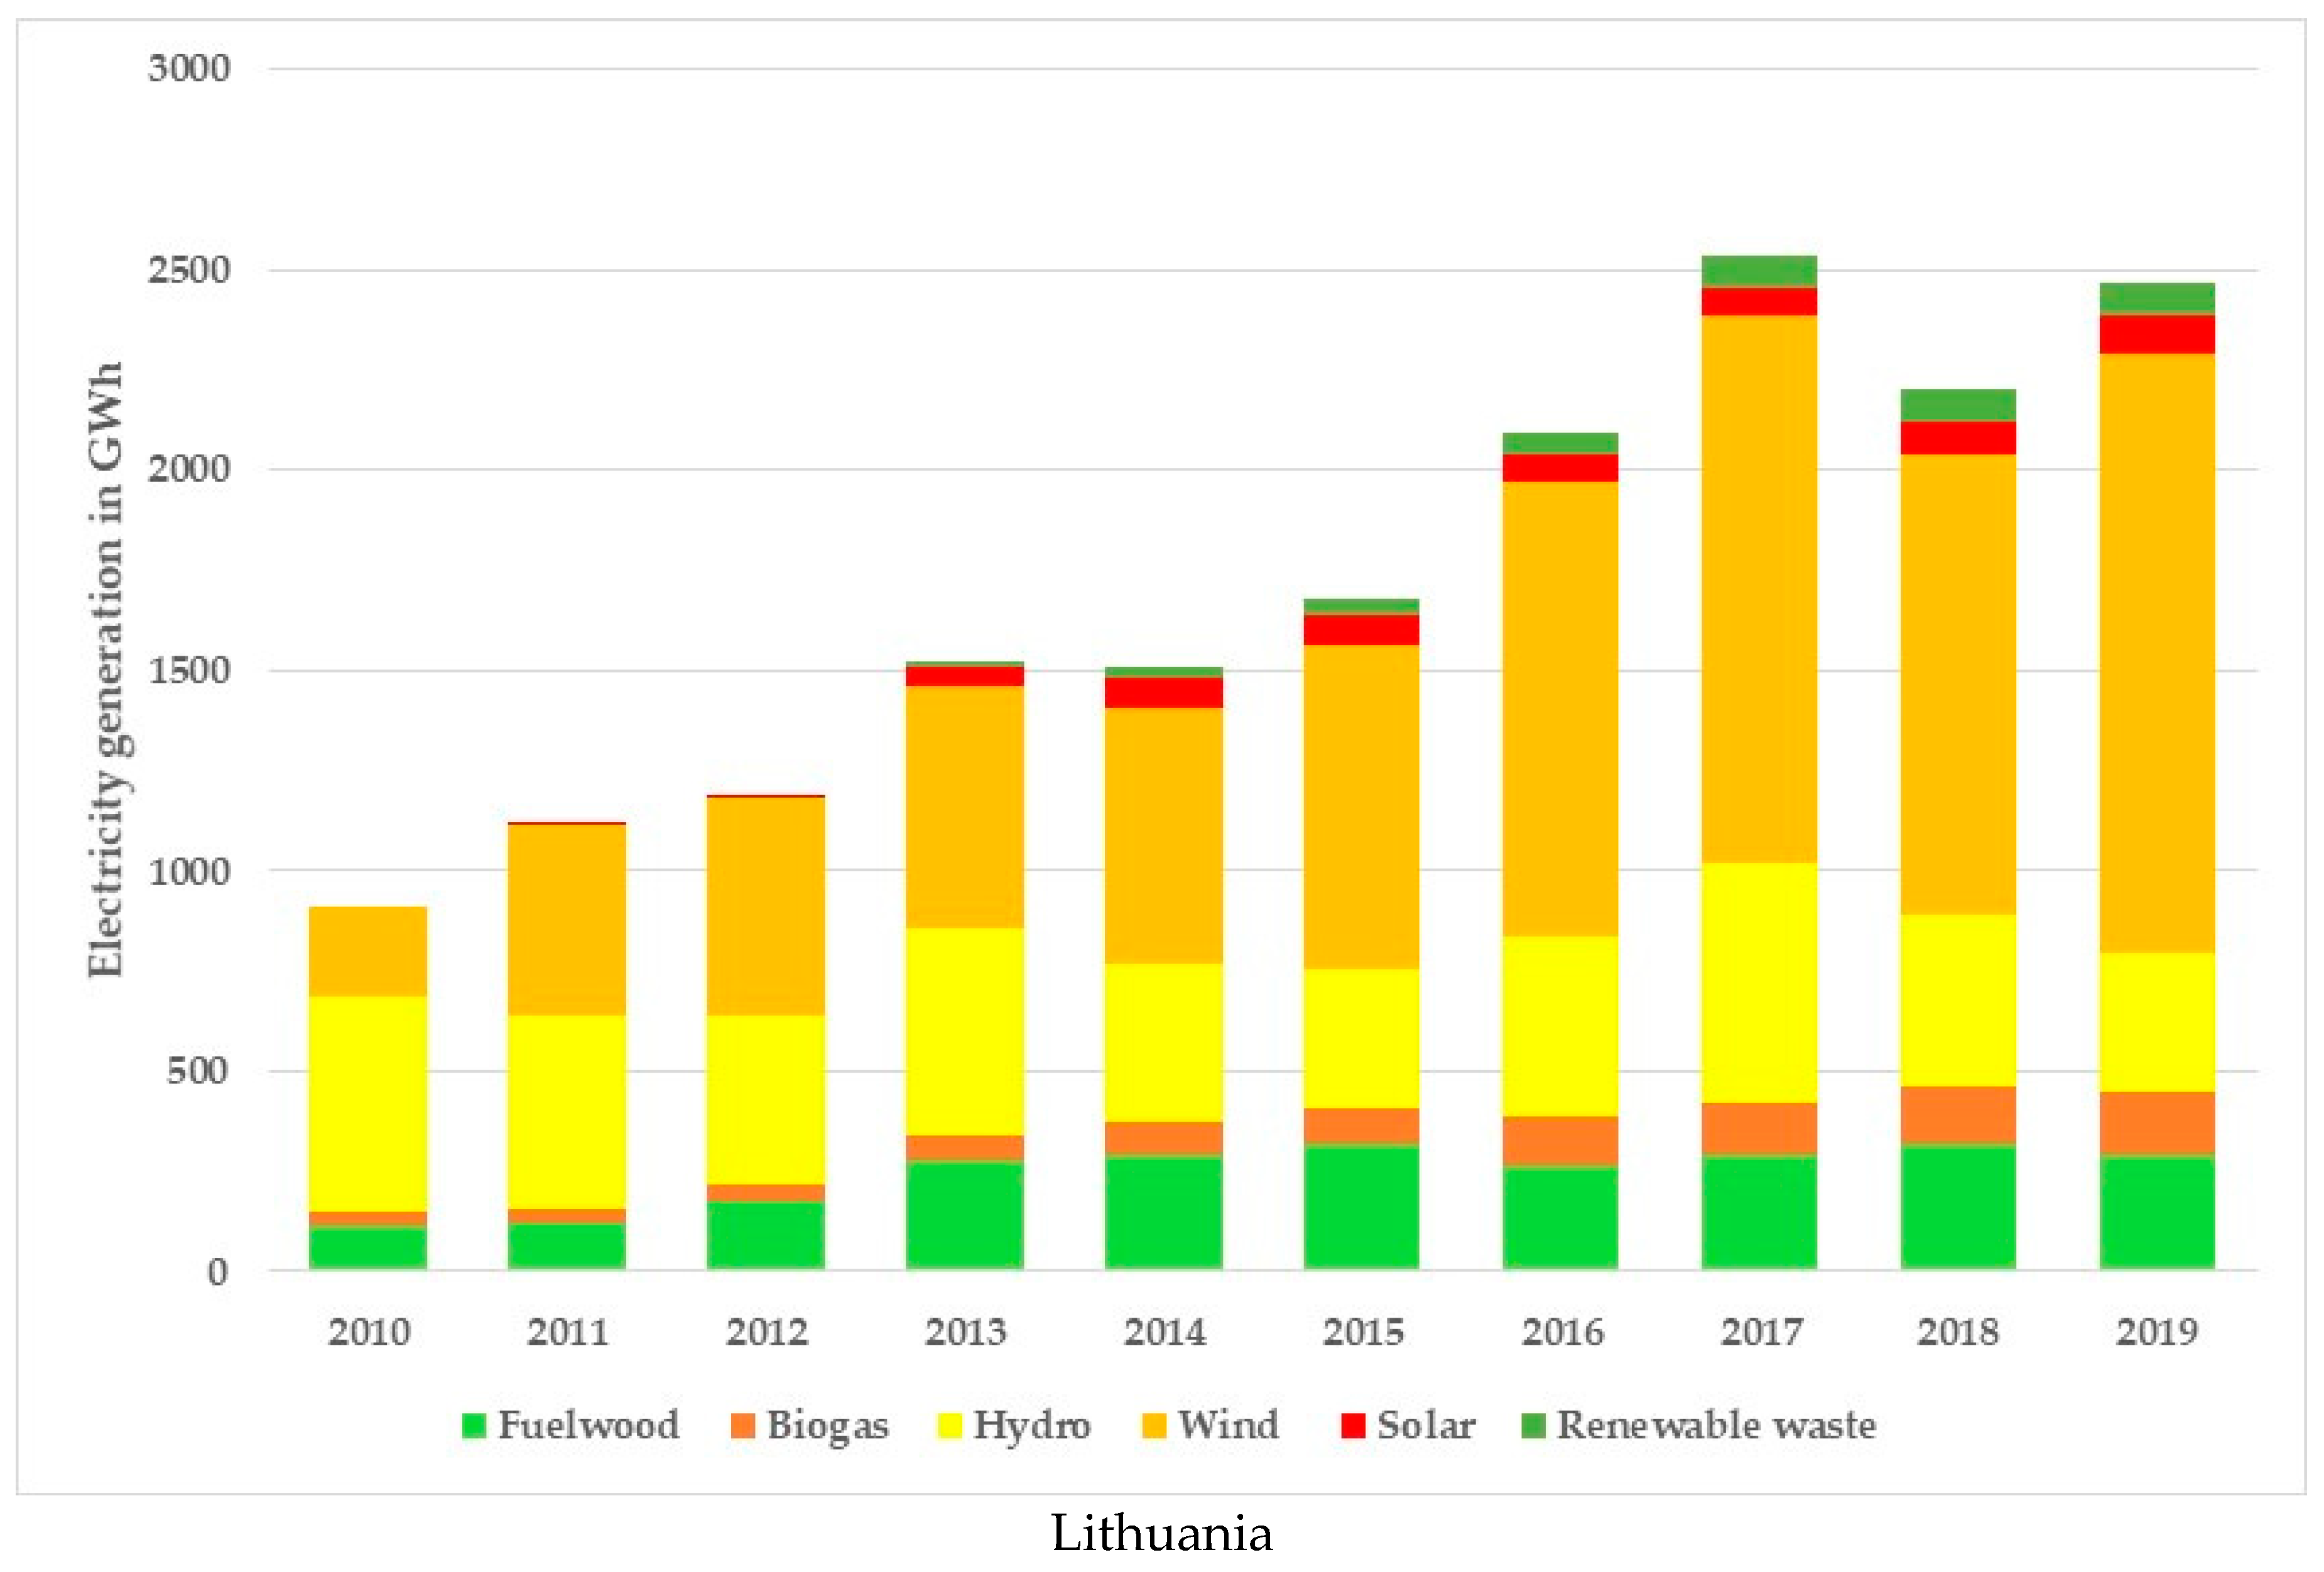
4.2. Trends in Energy Generation from RES in the Baltic States

Over the last decade, the deployment of RES in the energy transformation sector of the Baltic states was more promising than their final direct consumption by end-users. In the first stage, the growth of RES consumption for electricity generation was moderate due to economic, scientific, technical, and regulatory challenges. Electricity generated from RES was more expensive than the electricity price in the market. Based on experience in developed European countries, the progress of renewable energy technologies in electricity generation was stimulated by various support mechanisms [82,83,84]. Additionally, the integration of growing volumes of intermittent electricity from wind and solar power plants into the electricity grid requires more effort to balance supply and demand, more grid interconnections, energy storage, among others.
Several local factors were important in fostering electricity generation from RES in the Baltic states. The peculiar feature of the Estonian energy transformation sector is the extensive use of local oil shale at power plants. Additionally, it was necessary to improve the legal and economic environment, establish appropriate principles for regulating the distributed generation, define technical standards for connecting small generators to the network and remove business practice barriers [85].
Promoting RES for electricity generation in Latvia and Lithuania was based on feed-in tariffs to establish fair competition in the electricity market between RES and conventional power sources. In Estonia, electricity from renewable sources was mainly promoted through a premium tariff. Renewable energy support schemes, grid issues, policies promoting specific regulatory measures for electricity generation, heating, and cooling, and support schemes to promote RES in the transport sector in the Baltic states are summarised in [86,87,88].
It is important to emphasise that since 2010, the consumption of RES has increased rapidly in the energy transformation sector in all three countries—on average, by 10.6% in Estonia, 5.4% in Latvia, and 11.6% in Lithuania annually. Trends of RES deployment are shown in Figure 3. The most impressive results are associated with the rapid growth of RES consumption for electricity and district heat generation.
During 2010–2019, the total consumption of RES in the Estonian energy transformation sector has increased by 2.5 times. The share of RES in this sector has increased from 8.2% in 2010 to 32.5% in 2019, and the share of imported fossil fuels has decreased from 12.8% to 7.9%. However, oil shale is still dominating fuel in the structure of electricity and district heat generation with 59.6% in 2019.
Consumption of wood chips and wood waste supplemented by biogas for generation of electricity and district heat in Latvia was increasing rapidly—on average, by 13.7% annually. Despite fluctuation of contribution from hydro power plants caused by variation of climatic conditions, the share of RES in primary energy consumed by power plants and heat only boilers has increased from 33.8% in 2010 to 51.0% in 2019. Oil products, solid fuels and partly natural gas were substituted by RES, and their share in the Latvian energy transformation sector has decreased from 66.2% in 2010 to 49.0% in 2019. However, it is important to stress that natural gas is still playing an important role in the generation of electricity and district heat with a share of 49.9% in 2018 and 48.6% in 2019.
Changes in the Lithuanian energy transformation sector are extremely large. In 2010, the share of imported fossil fuels was dominating with 79.4%, but this indicator has decreased over the last decade markedly—to 22.0%. Total consumption of natural gas for electricity and district heat generation in absolute value has decreased from 1382 ktoe in 2010 to 255 ktoe in 2019. Consumption of petroleum products has decreased from 147 ktoe to 15 ktoe, respectively. Imported fossil fuels, consumed at power plants and heat plants, were substituted by RES. Total consumption of RES in the energy transformation sector has increased over this period by 2.7 times, and their share has increased from 17.0% in 2010 to 70.1% in 2019.
For decades, the district heating sector in the Baltic countries was dependent on natural gas supplied by pipeline from one source—the Russian Federation. Thus, the strategic vision was focused on creating the necessary technologies, economic conditions, and regulatory framework for a growing district heat generation from biomass, biogas, and renewable waste. District heating systems are currently modernised in all three countries, and an increase in the contribution from RES could be demonstrated by the growth of their share in the total volume of heat supplied to the network. This indicator had increased in Lithuania from 20.1% in 2010 to 74.9% in 2019. Over the same period, consumption of RES in the district heat generation had grown in other Baltic countries—their share has increased from 28.2% to 51.3% in Estonia and from 18.8% to 53.7% in Latvia.
Ambitious expectations on the rapid deployment of renewable energy are associated with the growing electricity generation from RES. Great changes in electricity generation by hydro, wind, and solar power plants and thermal power plants fired by biomass, biogas, and renewable waste were observed in all three countries (Figure 4). During 2010–2019, the total volume of electricity generation from RES had increased by 2.1 times in Estonia and 1.7 times in Lithuania. However, in 2019, this indicator in Latvia was 12.2% less than the 2010 level.
Latvia having three large hydro power plants was a strong leader in the Baltic countries in electricity production from RES with a share of 65.0% in 2010. The share of Estonia amounted to 18.7%, and the share of Lithuania to 16.3%. In 2019, due to the rapid development of wind power plants and power plants fired by biomass and biogas, the share of green electricity produced amounted to 31.4% in Lithuania, 28.0% in Estonia, and the share of Latvia shrank to 40.6%.
In 2010, the share of hydro power plants amounted to 73.1% in the structure of green electricity in the Baltic countries, electricity generated from biomass was 15.5%, wind power plants was 9.8%, and biogas power plants was 1.6%. In 2019, the structure of green electricity was quite different—the share of hydro power plants shrank to 31.4%, wind power plants contributed to the total generation by 29.7%, electricity generated from biomass was 28.7%, biogas power plants was 6.9%, solar power plants was 2.1%, and electricity from renewable waste was 1.1% only. It is important to emphasise that the volume of electricity generated by hydro power plants was fluctuating in broad range due to variation of climatic conditions. For instance, in 2017, total electricity production by hydro power plants in three Baltic countries was 65.9% higher than in 2016, but in 2018 their generation was 42.5% lower than in the previous year. Wind power plants and photovoltaics are intermittent RES due to their fluctuating nature. Therefore, existing differences in the structure of green electricity generation in Estonia, Latvia and Lithuania and the growing contribution from power plants fired by fuelwood, biogas and renewable waste are important positive factors to reduce the impact of intermittent generation on the power system operation.

4.3. Trends in the Total Deployment of RES in the Baltic States

The combined effect of RES deployment in installations at final consumers and in the energy transformation sector can be estimated by an indicator of their share in the balance of gross inland energy consumption. As shown in Figure 5, the role of RES in the total consumption of primary energy in Latvia is almost twice as large as in Estonia and Lithuania. Currently, the share of RES in Latvia in favourable climatic conditions can exceed 40%. During 2010–2015, consistent and stable growth of this indicator was observed in Lithuania, but the growth rates have decreased significantly over the last few years. However, the lowest share of RES in gross inland energy consumption over the last decade was observed in Estonia. In 2019, the sharp jump of this indicator was fixed due to the halving of electricity generation from oil shale and that imports replaced exports to the electricity market.
The deployment of RES, replacing fossil fuels used directly by installations at final consumers and for energy generation, has enabled policymakers in the Baltic countries to reduce the proportion of fossil fuels consistently in gross inland energy consumption and, simultaneously, contribute to the reduction of energy-related GHG emissions. During 2010–2019, the share of fossil fuels in gross inland energy consumption was reduced in Estonia from 89.8% to 71.7%, in Latvia from 67.4% to 59.1%, and in Lithuania from 74.5% to 66.0%. The impact of this factor on the reduction of GHG emissions is assessed based on the methodology described in Section 3.

4.4. Trends in the Development of Targeted Indicators

In Article 3 of the Directive 2009/28/EC [8], a mandatory 10% target was foreseen for all member states for the share of biofuels in all forms of transport by 2020. Thus, the rapid deployment of RES was associated with the growing consumption of biofuels in this sector. However, the progress over 2010–2019 towards this target in the Baltic states was very low—in 2019, the share of RES in the transport sector amounted to 5.15% in Estonia, 5.11% in Latvia, and 4.05% in Lithuania [89]. Progress achieved in Sweden, Norway, and Finland confirms the feasibility of implementing effective measures focused on gradual decarbonisation of the transport sector. However, a target of 10% from RES in this sector was challenging for Poland, Denmark, Germany, and the Baltic states (Figure 6). Therefore, policymakers in many member states must foresee and implement radical changes in this sector. A breakthrough could be related to the deployment of advanced biofuels, the use of green electricity, and the implementation of other priority measures identified in [90].
Currently, the generation of electricity from RES is one of the major priorities in the energy policy of the Baltic countries. However, despite the rapid growth of electricity generation by wind and biomass power plants, the share of RES in the electricity sector according to requirements of the Directive 2009/28/EC is large with 53.4% in Latvia in 2019. However, the contribution of green electricity with 22.0% in Estonia and 18.8% in Lithuania is still moderate, compared with an average indicator in the EU-27 with 34.1%. Currently, the contribution of electricity from RES in gross consumption in other countries of the BSR is also diverse: it amounts to 14.4% in Poland, 38.1% in Finland, 40.8% in Germany, 65.4% in Denmark, and 71.2% in Sweden [89].
It is important to emphasise that RES consumption for heating and cooling plays a key role in deploying energy from renewable sources in the Baltic countries. Based on the Directive 2009/28/EC requirements, each member state has submitted its NREAP to the European Commission (EC). According to data presented in these national plans, it was foreseen that the major contribution to an extension of renewable energy policies in the Baltic states should come from heating and cooling [13,14,15]. For instance, it was foreseen in national plans that the share of RES for heating and cooling consumed by end-users in 2020 would cover 70.3% in Estonia, 72.7% in Latvia and 71.3% in Lithuania. The foreseen contribution of this sector to the deployment of RES in other countries of the BSR is lower. Based on data presented in the National Renewable Energy Action Plans 2020 [90], this indicator amounted to 36.8% in Germany, 53.0% in Sweden, 55.3% in Poland, 60.6% in Denmark, and 67.9% in Finland.
The contribution from renewable sources for heating and cooling in the Baltic countries over the study period increased comparatively fast: on average, by 2.1% in Estonia, 4.0% in Latvia, 4.3% in Lithuania, while 2.9% in the EU-27 annually. Additionally, deployment of RES in this sector was substantial in other countries of the BSR: their share was increasing by 5.2% in Denmark, 3.4% in Poland, 3.0% in Finland, 2.1% in Germany, 1.4% in Sweden, and 0.9% in Norway annually [89].
Comparison of data in estimated trajectories, presented in NREAPs, and the actual deployment of RES presented in [89] confirms that the share of RES in the final consumption of energy for heating and cooling in the Baltic countries is significantly higher than was planned for the year 2019—by 35.1% in Estonia, 12.2% in Latvia, and 21.1% in Lithuania (Table 1). Consumption of RES in this sector was higher than indicators estimated in the national plans by 24.1% in Finland, 22.2% in Denmark, and 7.2% in Sweden, but in Germany it was 1.0%, and in Poland 3.1% lower than was planned.
The types of renewable energy used in the transport sector, electricity generation, and heating and cooling are considered when assessing real progress in the deployment of RES in the BSR countries. Comparative analysis of targeted indicators shows positive trends towards sustainable energy development in the BSR countries. The share of renewable energy in the gross final consumption of energy demonstrates the combined effect of RES deployment in all sectors in each country in 2019 (Figure 7).
Comparison of data from trajectories, foreseen in NREAPs, and actual indicators of RES deployment presented in [89] is shown in Table 2. The share of energy from renewable sources in the gross final consumption of energy in the Baltic states is higher than their mandatory targets in 2020, established in Annex I of Directive 2009/28/EC [8]. In 2019, this indicator was higher than their mandatory targets by 27.6% in Estonia, 10.7% in Lithuania, and 2.4% in Latvia. This indicator was higher by 24.0% in Denmark, 15.1% in Sweden, and 13.4% in Finland, but it was lower than the mandatory targets by 3.6% in Germany and 18.9% in Poland.
Based on a comparison of national obligations, estimated data from indicative trajectories, and actual data of RES deployment, it is concluded that Estonia, Latvia, and Lithuania have more energy from renewable sources than their mandatory targets. Other countries of the BSR, except Poland, also have a high potential for further deployment of RES and can set new ambitious objectives. However, the analysis showed a slowdown in deployment of RES over 2015–2019 in Lithuania and Poland. Thus, governments of these countries are strongly encouraged to undertake relevant obligations to implement new energy policy measures.
Progress in the deployment of RES in countries of the BSR is summarised in Table 3 and illustrated by indicators in each sector and their growing share in the gross final consumption of energy over 2010–2019.
The analysis concludes that the Baltic countries can meet their obligations assumed under international environmental conventions and implement requirements set following the Directive 2009/28/EC and national legal acts. However, analysis shows that the share of RES in the gross final consumption of energy in all three countries and Poland increased slowly over the last few years. Therefore, it is crucial to emphasise that ambitious national targets and more intensive activities from governments in Estonia, Latvia, Lithuania, Poland, and Germany are required to guarantee the rapid deployment of RES and to ensure their appropriate contribution to the Union’s gross final consumption of energy reaching at least 32% in 2030 [81]. Thus, energy policymakers in these countries are strongly encouraged to undertake relevant obligations and implement new measures foreseen in their integrated national energy and climate plans.

5. Changes of Energy-Related GHG Emissions and Impact of Driving Factors

Energy-related GHG emissions invoked for the analysis are extracted from National Inventory Submissions 2021 [92], while GDP data, population, total primary energy supply, and fossil fuels share are drawn from the Eurostat database [93,94,95,96] for international comparability of results.

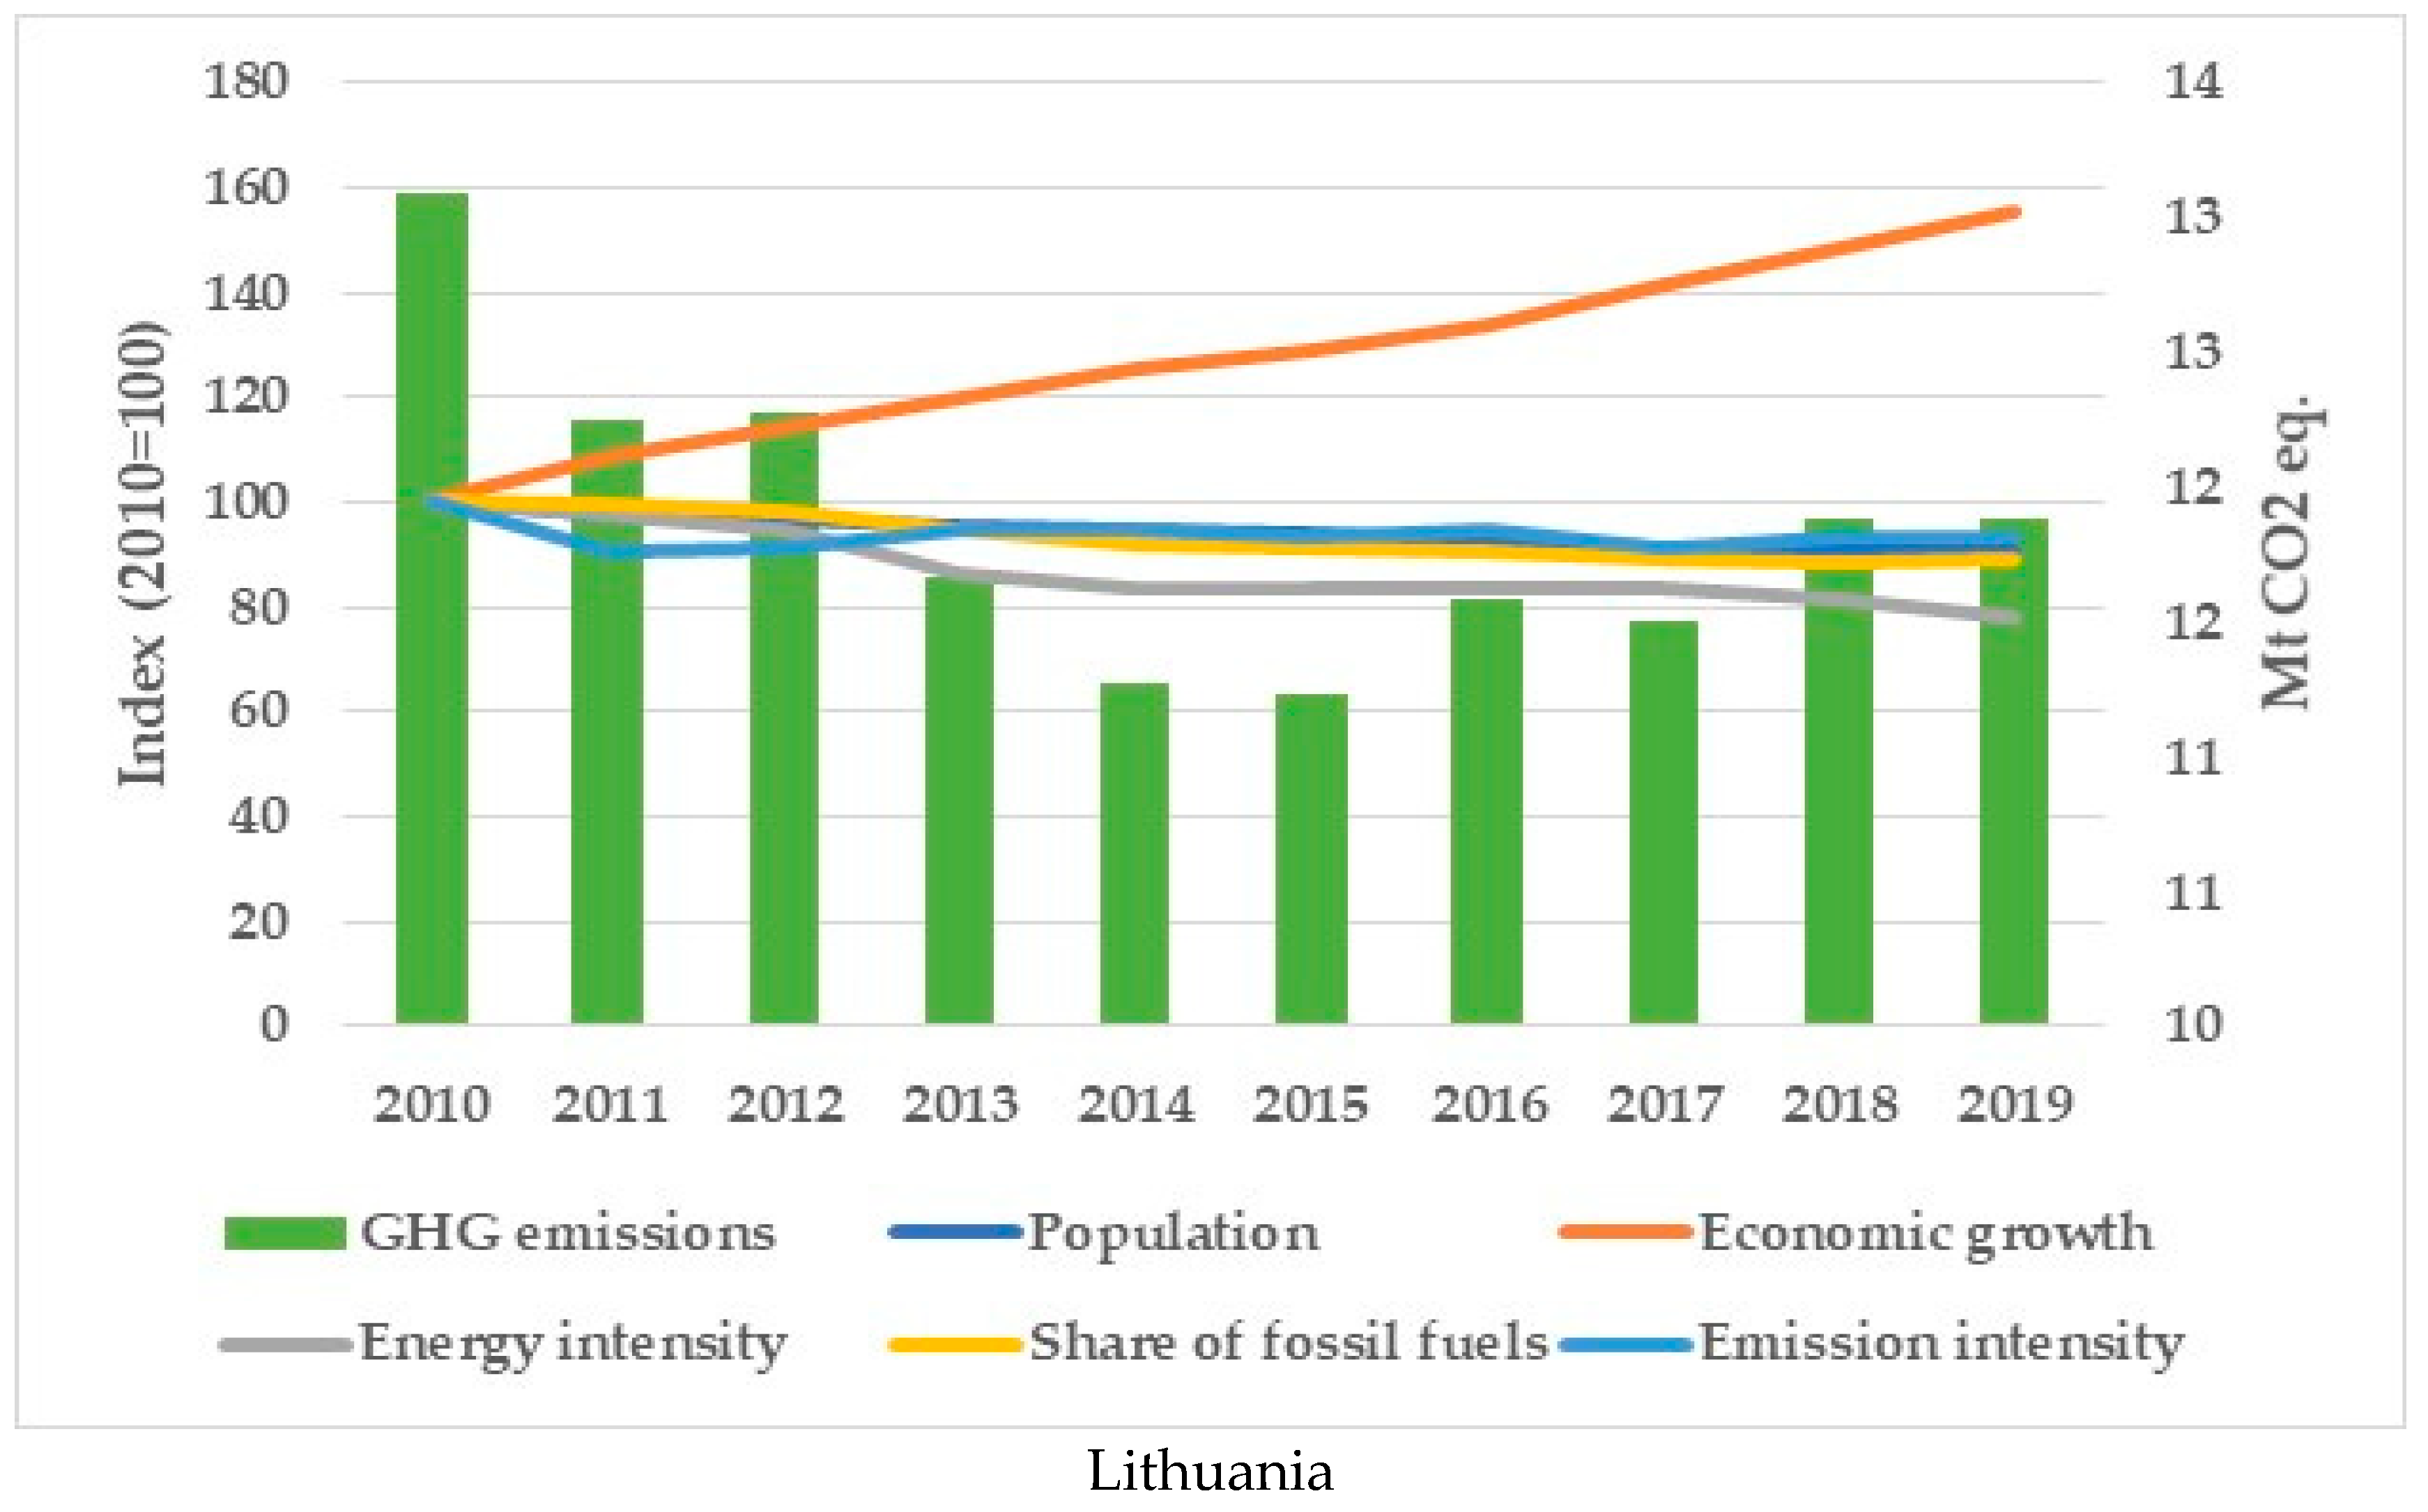
5.1. Trends in Development of GHG Emissions and Driving Factors

Changes in energy-related GHG emissions during 2010–2019 and variations of five driving factors considered in the analysis in the Baltic countries are illustrated in Figure 8. During 2010–2015, the reduction of GHG emissions despite certain fluctuation was quite similar—their total volume had decreased by 16.3% in Estonia, 15.6% in Latvia, and 14.2% in Lithuania. However, at the end of the study period, the largest reduction of GHG emissions was observed in Estonia with 35.2%. This indicator had decreased by 12.4% in Latvia and 9.2% in Lithuania, compared with the 2010 levels. This result was stipulated by the different impact of driving factors due to variations in population changes, indicators of economic growth, the decline of energy intensity, the share of fossil fuels in total primary energy supply, and reduction of emission intensity.
Rapid economic growth expressed by the GDP per capita indicator was a common feature in all three countries. This indicator increased over the study period by 40.9% in Estonia, 47.2% in Latvia, and 55.2% in Lithuania. The decline of all other driving factors was another common feature. The largest decline was fixed in energy intensity, having a strong impact on reducing GHG emissions—this indicator decreased by 39.8% in Estonia, 25.9% in Latvia, and 22.1% in Lithuania. Owing to the growing integration of renewable technologies, the share of fossil fuels in the total primary energy supply decreased by 19.4% in Estonia, 11.4% in Latvia, and 11.1% in Lithuania. Therefore, the decline of emission intensity was moderate—by 5.0% in Estonia, 0.6% in Latvia, and 6.4% in Lithuania. Population changes have a certain impact on the trend of GHG emissions. However, this impact in all three countries was comparatively small as a larger population decline during the study period was observed only in Lithuania with 9.8% and in Latvia with 8.8%. During 2010–2015, the population had decreased by 1.2% in Estonia, but it has been increasing slightly over the last few years, and at the end of the study period, it was lower by 0.3% only, compared with the 2010 level.
Changes in energy-related GHG emissions and the increase or decrease of driving factors during 2010–2019 in countries of the BSR and, on average, in the EU-27 countries are summarised in Table 4. The energy-related GHG emission reduction rate in Denmark, Finland, and Sweden was similar to Estonia. The reduction rate in Latvia and Lithuania was lower than in Germany and, on average, in the EU-27 countries, but was higher than in Poland. It is important to emphasise that GHG emissions decreased in all countries of the BSR. Thus, the analysis demonstrates absolute decoupling of energy-related GHG emissions from economic growth in all countries during the study period.
The parameter variations that affect changes in emissions were different across countries. Population in other countries of the BSR and its overall number in EU-27 has been growing slowly with only a slight decrease in Poland. Economic growth rates in the Baltic States and Poland, measured as a change of GDP in chain-linked volumes (2010) per capita, were significantly higher than in other countries of the BSR and, on average, in the EU-27 countries. The trend of rapid energy intensity reduction was evident in all countries, and this reduction rate was similar. One can distinguish Estonia, where energy intensity decreased by 5.47% per annum, and Finland, where this indicator decreased by 1.88% annually. Due to intensive RES deployment in Denmark, Finland, and Sweden, the share of fossil fuels in these countries’ total primary energy supply decreased faster than in Estonia, Latvia, and Lithuania. Contrariwise, this indicator in Germany, Poland, and, on average, in the EU-27 countries decreased slowly. Indicators of emission intensity decreased by similar rates. One can distinguish Latvia with a low reduction of this indicator and Norway, where emission intensity has increased during the study period.

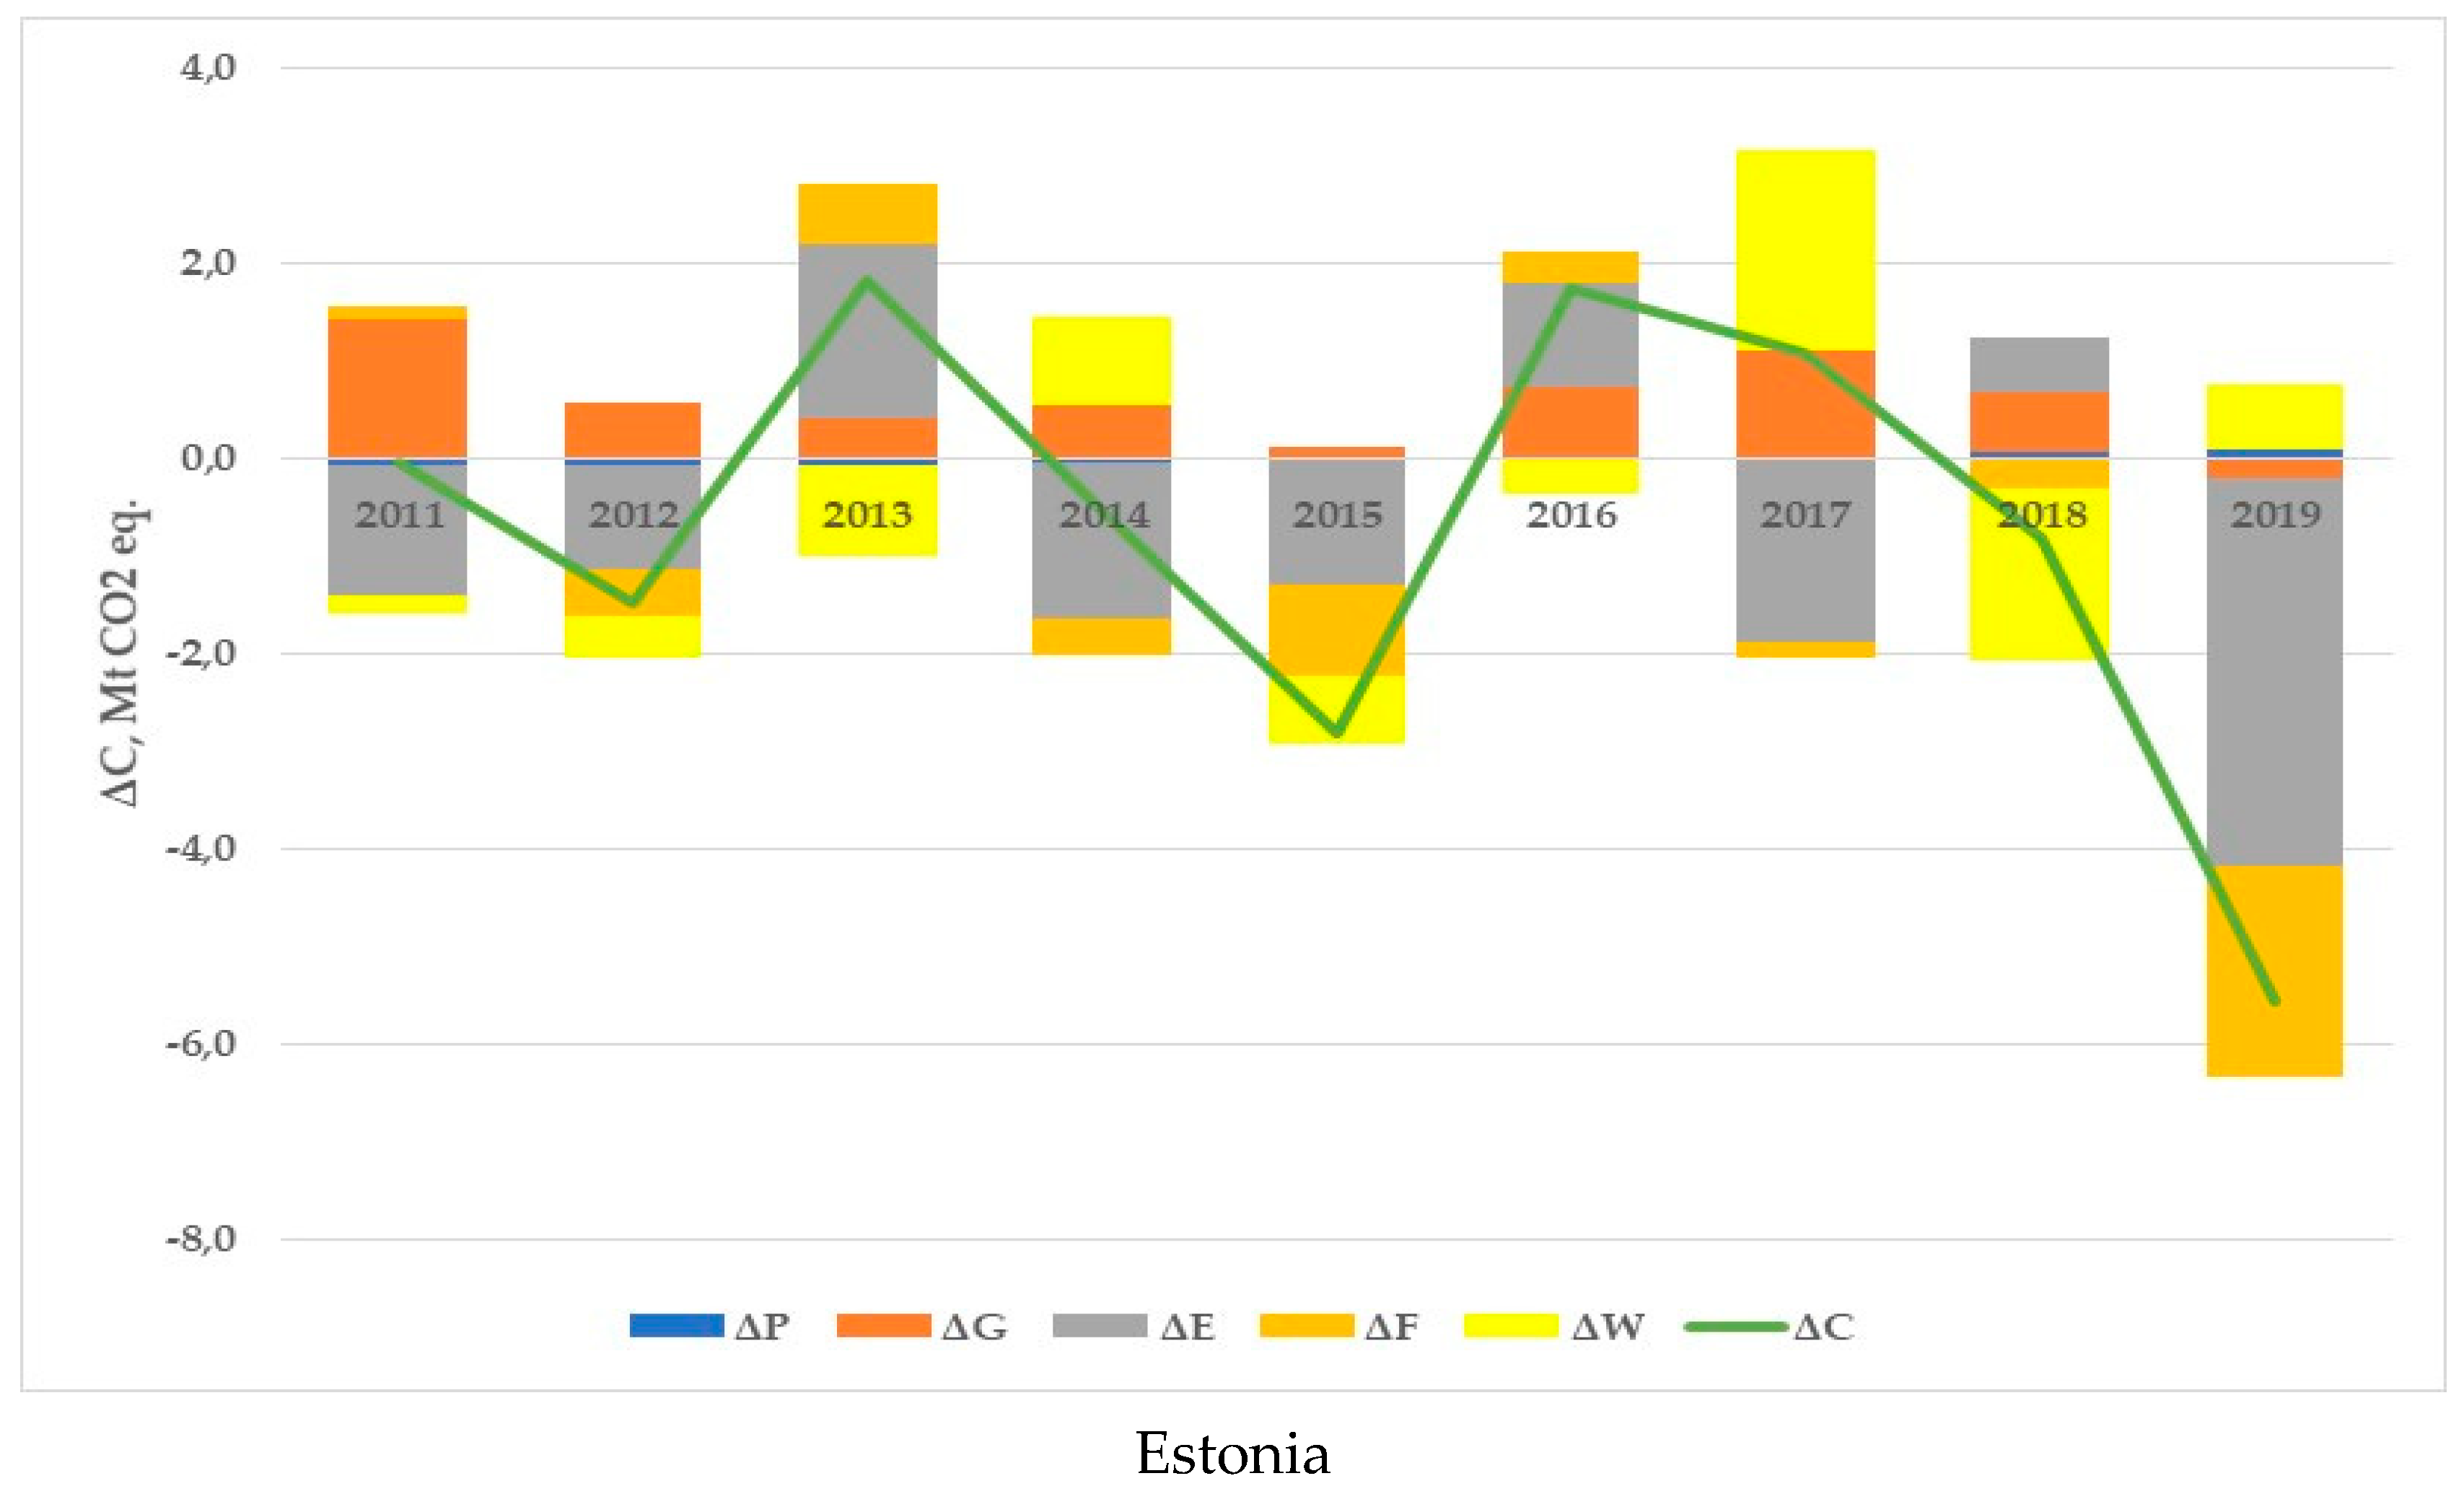
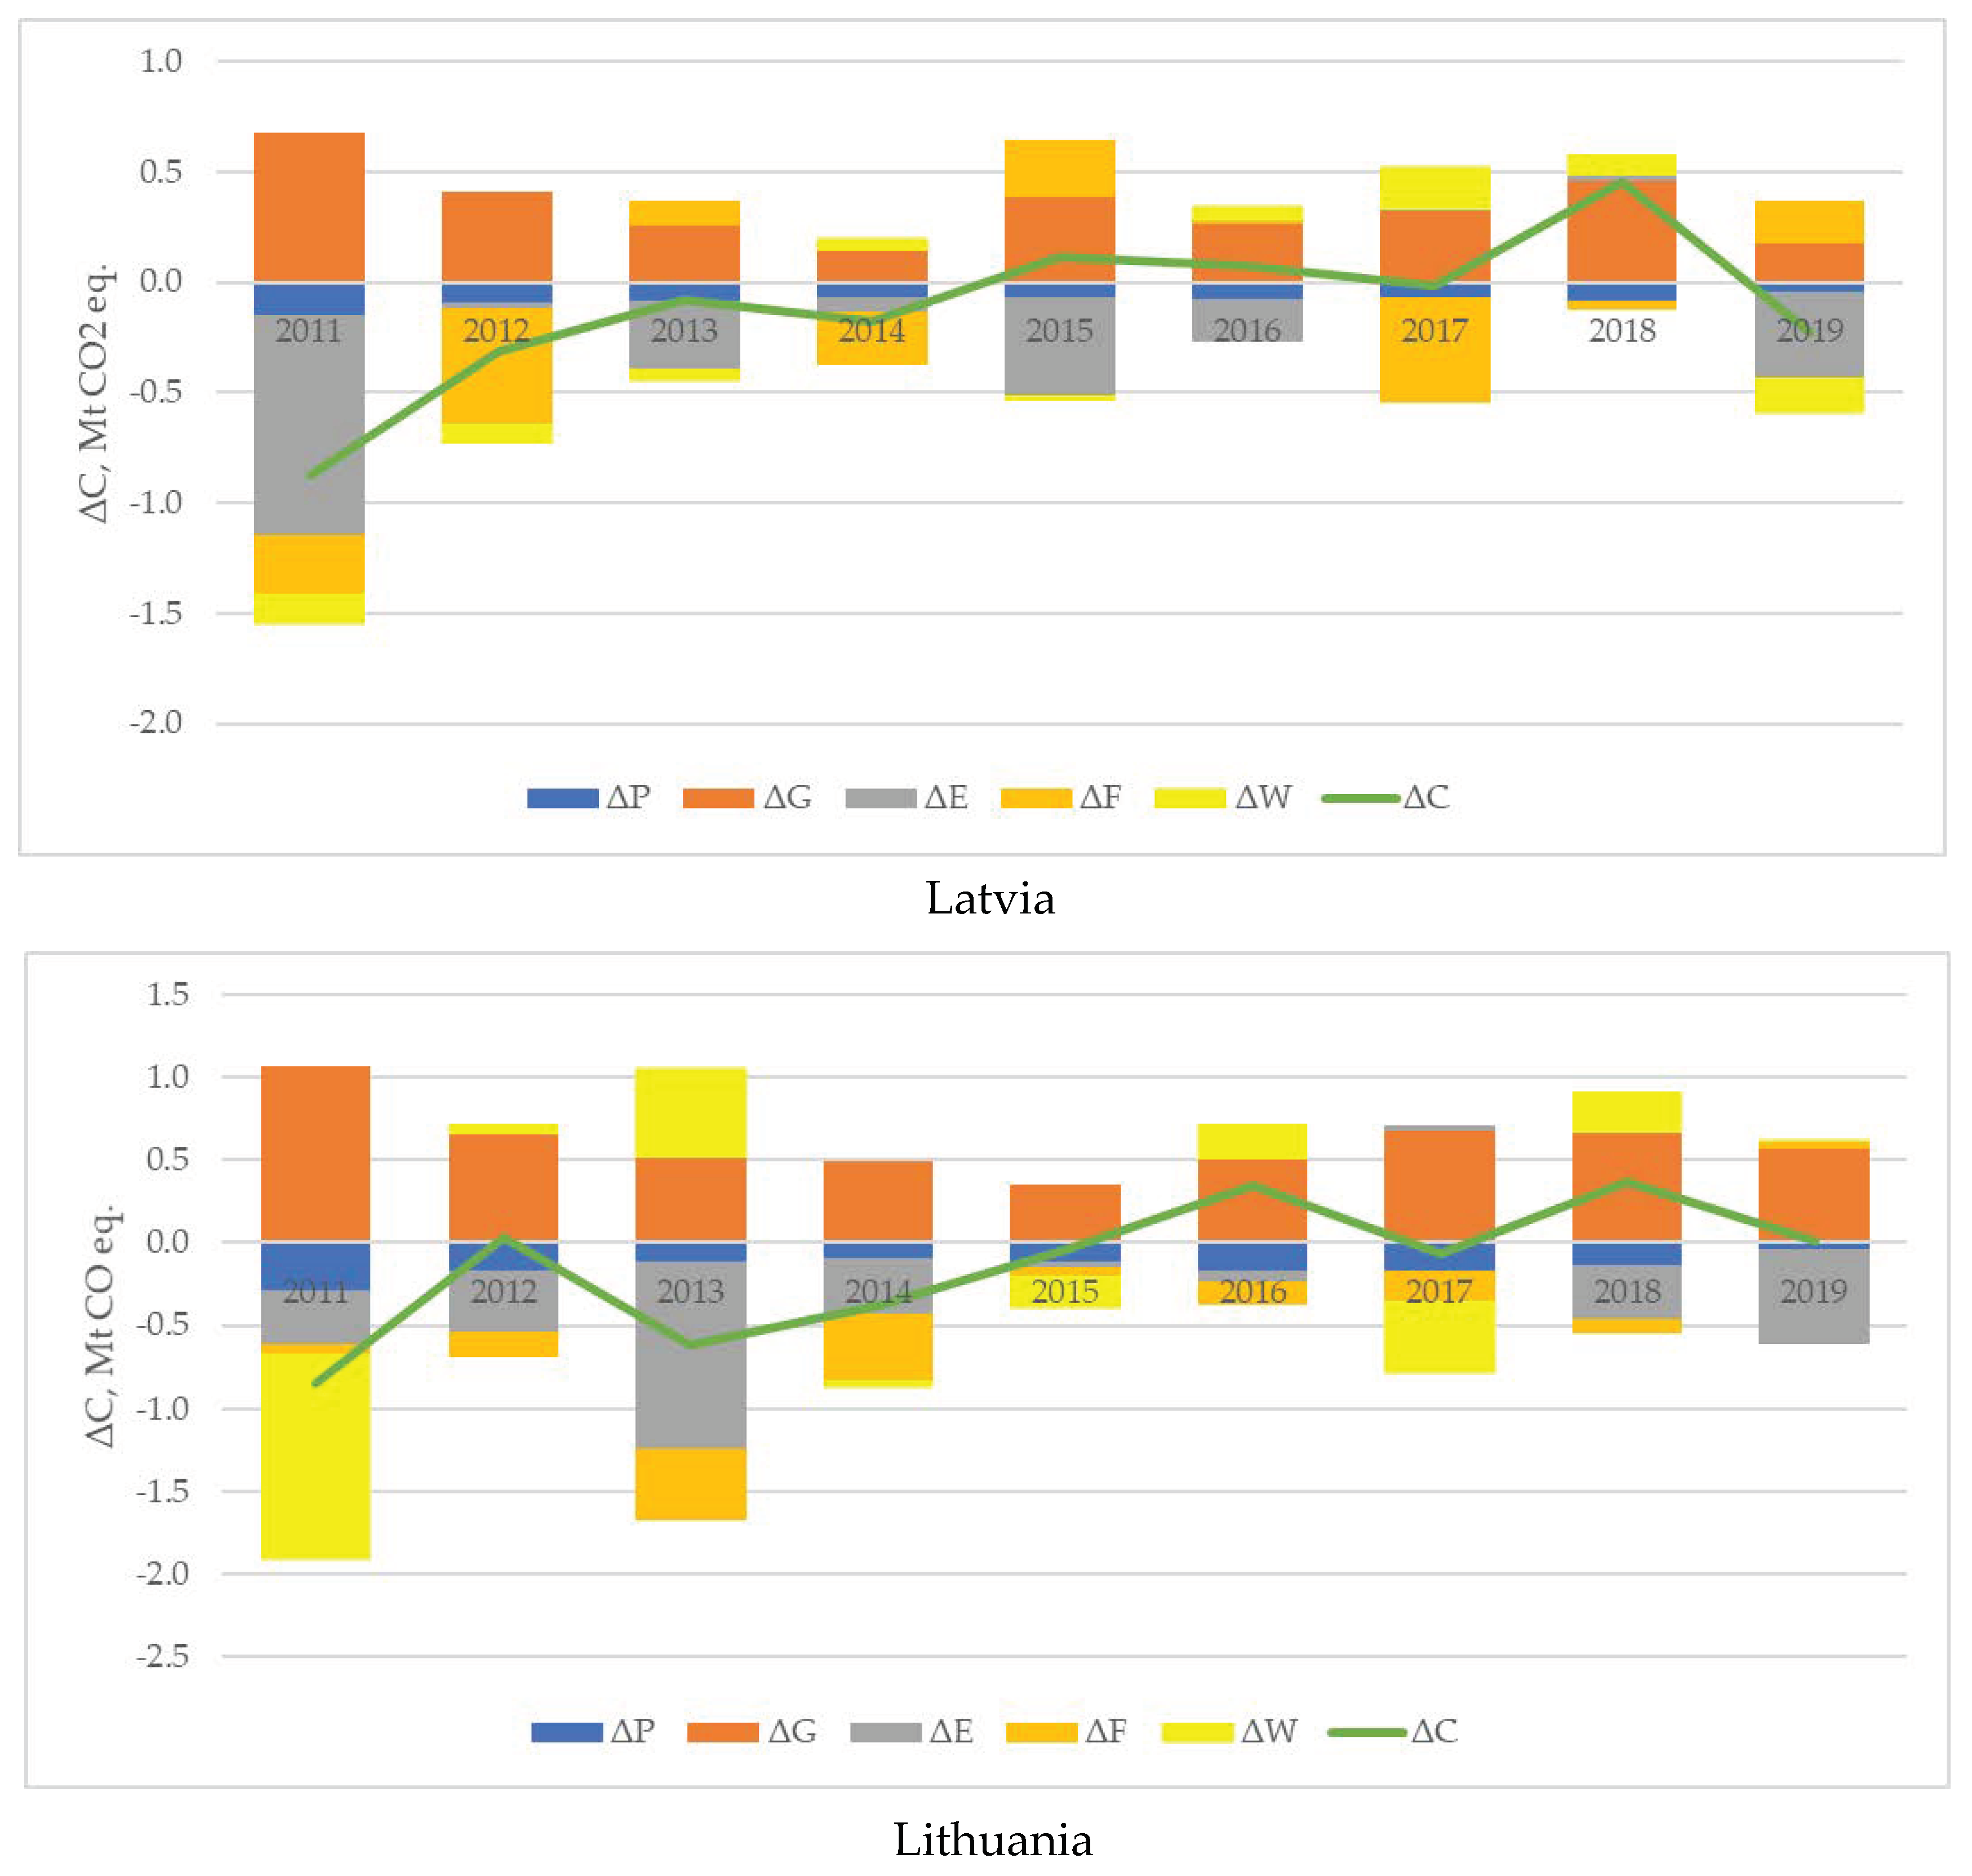
5.2. Decomposition Analysis

To understand the impact and patterns of factors influencing the change of energy-related GHG emissions, we decompose their absolute yearly change (ΔC) into five components associated with each respective factor considering Equations (4)–(8). Thus, the role of all factors in Estonia, Latvia, and Lithuania are revealed as follows: ΔP is the population effect, ΔG is the effect of economic growth, ΔE is the energy intensity effect, ΔF is the effect of RES deployment and respective substitution of fossil fuels, and ΔW is the effect of energy-related GHG emission intensity (Figure 9). These effects are demonstrated by their contribution to the total change of GHG emissions at the end of the two-year periods.
Detailed analysis revealed that despite the annual variation of economic growth and energy intensity, these two factors had the largest impact on the change of GHG emissions. During 2010–2019, energy-related GHG emissions increased in Estonia, Latvia, and Lithuania owing to continued economic growth. The decreasing energy intensity was the most important factor affecting the reduction of GHG emissions. However, the impact on the annual changes of GHG emissions from other factors in all three countries differed. For instance, an increase of energy intensity at the endpoints of two-year periods in Estonia stipulated a corresponding increase of GHG emissions in 2013, 2016, and 2018. Similarly, the increase in GHG emissions in Estonia, observed in 2013 and 2016, was caused by the decreased contribution of RES in the total primary energy supply. However, the increase in emissions in 2014, 2017, and 2019 was caused by an increase in emission intensity.
Increased GHG emissions in Latvia observed in 2013, 2015, and 2019 were stipulated by the increased share of fossil fuels, and the increase in 2014, 2016, 2017, and 2018 was caused by an increase in emission intensity. Similarly, an increase in GHG emissions in Lithuania observed in 2012, 2013, 2016, and 2018 was stipulated by increased emission intensity.
It is important to highlight that energy-related GHG emissions in absolute value have decreased during 2010–2019 in all three countries despite the rapid growth of economic activities and certain annual variation of other factors. Decomposition analysis has revealed that reducing energy intensity played the most important role explaining 65.3% in the total reduction of GHG emissions in Estonia, 57.7% in Latvia, and 46.4% in Lithuania. The growing contribution of RES has led to a decrease in the share of fossil fuels in the total primary energy supply and reducing energy-related GHG emissions in Estonia by 27.7%, Latvia by 23.4%, and Lithuania by 22.0%. The effect of population decline was relatively high with 17.7% in Latvia and 19.2% in Lithuania, but its role in Estonia was minor with 0.4%. Additionally, the positive effect from decreased emission intensity reduced GHG emissions—in Estonia by 6.6%, Latvia by 1.2%, and Lithuania by 12.3%.
To demonstrate the correct comparative results of decomposition analysis in all countries of the BSR and, on average, in the EU-27, changes in energy-related GHG emissions and the impact of each driving factor over 2010–2019 are summarised in Table 5. All parameters are presented in tonnes of CO2 eq. per capita and indicate the total increase or decrease of GHG emissions caused by the change of each factor over the study period. The largest total change of energy-related GHG emissions per capita was observed in Estonia with 5.02 t CO2 eq., Finland with 3.83 t CO2 eq., and Denmark with 3.31 t CO2 eq. The moderate reduction was fixed, on average, in the EU-27 countries with 1.50 t CO2 eq., Germany with 1.49 t CO2 eq., Sweden with 1.21 t CO2 eq., and Norway with 0.90 t CO2 eq. The smallest reduction was observed in Latvia with 0.55 t CO2 eq., Poland with 0.53 t CO2 eq., and Lithuania with 0.43 t CO2 eq. Thus, despite the small reduction of energy-related GHG emissions over the study period, Latvia and Lithuania are countries with comparatively low emissions per capita. In 2019, the best indicator of emissions per capita was observed in Sweden with 3.40 t CO2 eq., followed by Latvia with 3.90 t CO2 eq., and Lithuania with 4.25 t CO2 eq. (Figure 10). The moderate comparative indicators were fixed in Denmark with 5.25 t CO2 eq., Norway with 6.65 t CO2 eq., and Finland with 7.08 t CO2 eq. The largest emissions per capita were observed in Estonia with 9.25 t CO2 eq., Poland with 8.48 t CO2 eq., and Germany with 8.15 t CO2 eq. An average indicator in the EU-27 countries was equal to 7.0 t CO2 eq. per capita.
Based on the period-wise analysis, we emphasise that the increase of GHG emissions per capita in all countries of the BSR and, on average, in the EU-27 was mainly driven by economic growth. Contribution of this factor in three Baltic countries and Poland amounted to 100%, in the EU-27 to 88.8%, in Germany to 83.0%, in Denmark to 67.8%, in Finland to 67.2%, and in Sweden to 51.0%. Moreover, the role of this factor was very low in Norway with 13.6% only. However, the effect of population growth was the largest in Sweden with 49.0%. A smaller contribution of this factor with 32.8% was observed in Finland, 32.2% in Denmark, 24.8% in Norway, 17.0% in Germany, and, on average, 11.2% in the EU-27. Contrariwise, the effect of population decline was negative in Lithuania with 19.2%, Latvia with 17.7%, Poland with 0.5%, and Estonia with 0.4%.
The decreasing energy intensity was the major factor contributing to reducing GHG emissions per capita in all countries. The role of this factor was very important with 81.7% in Germany, 79.2% in Poland, 65.3% in Estonia, on average, 64.6% in the EU-27, in Norway with 61.7%, in Latvia with 57.7%, and in Denmark with 52.4%. A smaller effect was observed in Lithuania with 46.4%, in Sweden with 42.0%, and Finland with 32.8%. The contribution of renewable energies due to the substitution of fossil fuels was the largest in Finland with 55.2%, 46.8% in Sweden, 38.3% in Norway and 38.1% in Denmark. A smaller contribution of RES deployment was observed with 27.7% in Estonia, 23.4% in Latvia, 22.0% in Lithuania and, on average, 16.6% in the EU-27. Very low indicators of this effect were observed in Poland with 9.4% and 3.1% in Germany. Thus, the role of the emission intensity effect was moderate and rather different. The contribution of this factor to reducing GHG emissions per capita was as follows: on average, in the EU-27 countries by 18.8%, in Germany by 15.2%, in Lithuania by 12.3%, in Finland by 12.0%, in Sweden by 11.1%, in Poland by 10.9%, in Denmark by 9.6%, in Estonia by 6.6%, and in Latvia by 1.2%. Conversely, energy-related GHG emissions in Norway decreased over the study period, on average, by 1.7% annually, while total consumption of fossil fuels decreased by 3.8% annually. Thus, the indicator of emission intensity increased by 24.9%, and the total increase of GHG emissions in Norway was driven by 61.5% due to the impact of this factor.

6. Conclusions and Recommendations

An in-depth analysis of changes in the deployment of RES in the Baltic countries over 2010–2019 revealed strong points and limitations in consumption of RES by final consumers and their growing role in modernising the energy transformation sector in each country. In 2019, the share of RES in the gross final consumption of energy in all three countries was higher than the mandatory target (established in Directive 2009/28/EC for the year 2020- Annex I)—by 27.6% in Estonia, 10.7% in Lithuania and 2.5% in Latvia.
It is important to highlight that the consumption of RES for heating and cooling plays a key role in the overall deployment of energy from renewable energies in the Baltic countries. According to indicators presented in their National Renewable Energy Action Plans, it was foreseen that the major contribution (more than 70%) into an extension of renewable energy policies in all three countries would come from the heating and cooling sector. The analysis has revealed that the share of RES in the final consumption of energy for heating and cooling is significantly higher than it was planned for the year 2019—by 35.1% in Estonia, 12.2% in Latvia and 21.1% in Lithuania. Consumption of RES in this sector was higher than indicators estimated in national plans by 24.1% in Finland, 22.2% in Denmark, and 7.2% in Sweden. However, it was lower than planned indicators by 1.0% in Germany and 3.1% in Poland.
The analysis shows that the contribution of RES in the gross final consumption of energy in the transport sector was growing slowly. Currently, the share of RES in the transport sector amounts to 5.15% in Estonia, 5.11% in Latvia, and 4.05% in Lithuania. A target of 10% due to RES in 2020 was challenging for Poland, Denmark, Germany, and the Baltic States. Thus, all these countries should implement radical changes in the energy policy of this sector. A breakthrough can be related to the deployment of advanced biofuels, the rapid growth of contribution from green electricity, and other priority measures.
Comparing the estimated national targets and actual data of RES deployment confirms that the Baltic countries have more energy from renewable sources than their mandatory targets. Moreover, each country has a comparatively high potential for further deployment of RES and can set new objectives. However, analysis shows that their use in three Baltic countries and Poland increased too slowly over the last few years. Therefore, to contribute markedly to climate change mitigation, new ambitious national targets and more intensive activities from policymakers and governments in Estonia, Latvia, Lithuania, Poland, and Germany are required.
Applying the extended Kaya identity and the LMDI method allowed us to assess the role of the main determinants in reducing energy-related GHG emissions in countries of the BSR. The analysis indicates that GHG emissions decreased in all countries of the BSR and demonstrates absolute decoupling of energy-related GHG emissions from economic growth during 2010–2019.
Rapid economic growth expressed by the GDP per capita was the common feature in the Baltic countries and Poland. This indicator increased over the study period by 40.9% in Estonia, 47.2% in Latvia, 55.2% in Lithuania, and 38.4% in Poland. The decline of all other driving factors was another common feature for all these countries. The largest decline was fixed in energy intensity, which strongly impacted the reduction of GHG emissions. This indicator has decreased by 39.7% in Estonia, 25.9% in Latvia, 22.1% in Lithuania, and 26.3% in Poland. Due to the growing integration of renewable technologies, the share of fossil fuels in the total primary energy supply decreased by 19.4% in Estonia, 11.4% in Latvia, 11.1% in Lithuania, and 3.6% in Poland.
Decomposition analysis demonstrates that economic growth and decline of energy intensity, despite their annual variations, had the largest impact on the change of GHG emissions. Economic activities drove the increase in GHG emissions in the Baltic countries and Poland. Reduction of energy intensity in these countries played a major role, explaining 65.3% in the total reduction of GHG emissions in Estonia, 57.7% in Latvia, 46.4% in Lithuania, and 79.2% in Poland. Implementing policies promoting RES deployment and growing their share in total primary energy supply has stimulated decreasing use of fossil fuels. However, these policies’ contribution to reducing energy-related GHG emissions was moderate and amounted to 27.7% in Estonia, 23.4% in Latvia, 22.0% in Lithuania, and 9.4% in Poland. The positive effect from the decrease of emission intensity has had different contributions in reducing GHG emissions—by 6.6% in Estonia, 1.2% in Latvia, 12.3% in Lithuania, and 10.9% in Poland. The effect of population decline was also positive and relatively high with 17.7% in Latvia and 19.2% in Lithuania, but its role was minor with 0.4% in Estonia and 0.5% in Poland.
Based on the period-wise analysis, the increasing energy-related GHG emissions in other countries of the BSR and, on average, in the EU-27 were mainly driven by economic and population growth. The decreasing energy intensity was the major factor contributing to reducing GHG emissions—by 81.7% in Germany, on average, by 64.6% in the EU-27, 61.7% in Norway, 52.4% in Denmark, 42.0% in Sweden, and 32.8% in Finland. The contribution of RES deployment due to the substitution of fossil fuels was another important factor. Its share in the total reduction of GHG emissions amounted to 55.2% in Finland, 46.8% in Sweden, 38.3% in Norway, 38.1% in Denmark, and 3.1% in Germany. Therefore, the positive impact of the emission intensity effect was moderate in all BSR countries.
The main energy policy recommendations of the research are summarised as follows:
  • Policymakers in all countries are encouraged to focus on improving energy efficiency and faster deployment of renewable energies as two factors contributing to reducing energy-related GHG emissions.
  • Policies directed to increase energy efficiency are effective in all countries of the BSR, but progress in RES deployment is insufficient considering current aspirations of climate change mitigation.
  • Policies promoting the growing contribution of RES in Finland and Sweden are more effective in energy-related GHG emission reduction than the impact from the decline of energy intensity.
  • The contribution of RES in mitigating climate change must be increased markedly in Germany, Latvia, Lithuania, Poland, and, on average, in the EU-27, considering the slowdown of their deployment in the last five years.
  • Implementing radical energy policy changes in the transport sector in Denmark, Germany, Poland, particularly in the Baltic States, is urgently required.

Author Contributions

All authors contributed to designing and writing this paper. Specific tasks were done as follows: V.M. prepared the draft of the paper; A.G. supervised this work; V.L. performed the economic analysis and editing; I.K. and E.N. collected data and compiled the references. All authors have read and agreed to the published version of the manuscript.

Funding

This research received no external funding.

Data Availability Statement

Publicly available datasets were analyzed in this study.

Acknowledgments

The authors express their deepest gratitude to anonymous reviewers of this journal for their comments and suggestions that enhanced the merit of this work.

Conflicts of Interest

The authors declare no conflict of interest.

Abbreviations

BSRBaltic Sea Region
CO2carbon dioxide
EUEuropean Union
ECEuropean Commission
Eurostatstatistical bureau of the European Union
GWhGigawatt hours
GDPGross Domestic Product
GHGGreenhouse Gas
HVDCHigh Voltage Direct Current
IPATenvironmental impact of population, affluence and technology
ktoethousand tonnes of oil equivalent
LEILithuanian Energy Institute
LMDIlogarithmic mean Divisia index method
MESSAGEModel for Energy Supply Strategy Alternatives and their General Environmental impact
NREAPNational Renewable Energy Action Plan
OECDOrganization for Economic Co-operation and Development
RESRenewable Energy Sources
ttonne
toetonne of oil equivalent
UKUnited Kingdom
USUnited States

References

  1. EC. A Clean Planet for All; European Commission: Brussels, Belgium, 2018. [Google Scholar]
  2. Streimikiene, D.; Ciegis, R.; Grundey, D. Energy indicators for sustainable development in Baltic States. Renew. Sustain. Energy Rev. 2007, 11, 877–893. [Google Scholar] [CrossRef]
  3. Klevas, V.; Streimikiene, D.; Grikstaite, R. Sustainable energy in Baltic States. Energy Policy 2007, 35, 76–90. [Google Scholar] [CrossRef]
  4. Juknys, R.; Dagiliūtė, R.; Miškinis, V. From transition to sustainability: A comparative study. Environ. Res. Eng. Manag. 2008, 1, 61–68. [Google Scholar]
  5. Timma, L.; Zoss, T.; Blumberga, D. Life after the financial crisis. Energy intensity and energy use decomposition on sectorial level in Latvia. Appl. Energy 2016, 162, 1586–1592. [Google Scholar] [CrossRef]
  6. Baležentis, T.; Li, T.; Streimikiene, D.; Baležentis, A. Is the Lithuanian economy approaching the goals of sustainable energy and climate change mitigation? Evidence from DEA-based environmental performance index. J. Clean. Prod. 2016, 116, 23–31. [Google Scholar] [CrossRef]
  7. Miskinis, V.; Slihta, G.; Rudi, Y. Bio-energy in the Baltic States: Current policy and future development. Energy Policy 2006, 34, 3953–3964. [Google Scholar] [CrossRef]
  8. Directive 2009/28/EC of the European Parliament and of the Council of 23 April 2009 on the Promotion of the Use of Energy from Renewable Sources and Amending and Subsequently Repealing Directives 2001/77/EC and 2003/30/EC. Available online: http://eur-lex.europa.eu/legal-content/EN/TXT/HTML/?uri=CELEX:32009L0028&from=EN (accessed on 10 February 2021).
  9. Streimikiene, D.; Klevas, V. Promotion of renewable energy in Baltic States. Renew. Sustain. Energy Rev. 2007, 11, 672–687. [Google Scholar] [CrossRef]
  10. Konstantinavičiūtė, I.; Miškinis, V.; Bobinaitė, V. Trends towards sustainable energy development in Lithuania. In Proceedings of the 12th IAEE European Energy Conference “Energy Challenge and Environmental Sustainability”, Venice, Italy, 9–12 September 2012; Available online: http://www.iaeeu2012.it/pages/programmonday10.html (accessed on 2 April 2021).
  11. Bobinaite, V.; Tarvydas, D. Financing instruments and channels for the increasing production and consumption of renewable energy: Lithuanian case. Renew. Sustain. Energy Rev. 2014, 38, 259–276. [Google Scholar] [CrossRef]
  12. Cross, S.; Hast, A.; Kuhi-Thalfeldt, R.; Syri, S.; Streimikiene, D.; Denina, A. Progress in renewable electricity in Northern Europe towards EU 2020 targets. Renew. Sustain. Energy Rev. 2015, 52, 1768–1780. [Google Scholar] [CrossRef]
  13. National Renewable Energy Action Plan of Estonia for Implementing Directive 2009/28/EC. 2010. Available online: https://www.buildup.eu/sites/default/files/content/national_renewable_energy_action_plan_estonia_en.pdf (accessed on 10 January 2021).
  14. National Renewable Energy Action Plan of Latvia for Implementing Directive 2009/28/EC. 2010. Available online: https://ec.europa.eu/energy/sites/ener/files/documents/dir_2009_0028_action_plan_latvia.zip (accessed on 12 September 2021).
  15. National Renewable Energy Action Plan of Lithuania, for Implementing Directive 2009/28/EC. 2010. Available online: https://www.ena.lt/uploads/PDF-AEI/KITI-doc/EN/6a-national-renewable-energy-action-plan-lithuania-en.pdf (accessed on 4 January 2021).
  16. Pang, X.; Trubins, R.; Lekavicius, V.; Galinis, A.; Mozgeris, G.; Kulbokas, G.; Mörtberg, U. Forest bioenergy feedstock in Lithuania—Renewable energy goals and the use of forest resources. Energy Strat. Rev. 2019, 24, 244–253. [Google Scholar] [CrossRef]
  17. Roos, I.; Soosaar, S.; Volkova, A.; Streimikene, D. Greenhouse gas emission reduction perspectives in the Baltic States in frames of EU energy and climate policy. Renew. Sustain. Energy Rev. 2012, 16, 2133–2146. [Google Scholar] [CrossRef]
  18. Miskinis, V.; Galinis, A.; Konstantinaviciute, I.; Lekavicius, V.; Neniskis, E. Comparative Analysis of the Energy Sector Development Trends and Forecast of Final Energy Demand in the Baltic States. Sustainability 2019, 11, 521. [Google Scholar] [CrossRef] [Green Version]
  19. Apergis, N.; Payne, J.E. Renewable energy consumption and economic growth: Evidence from a panel of OECD countries. Energy Policy 2010, 38, 656–660. [Google Scholar] [CrossRef]
  20. Lin, B.; Moubarak, M. Renewable energy consumption—Economic growth nexus for China. Renew. Sustain. Energy Rev. 2014, 40, 111–117. [Google Scholar] [CrossRef]
  21. Fang, Y. Economic welfare impacts from renewable energy consumption: The China experience. Renew. Sustain. Energy Rev. 2011, 15, 5120–5128. [Google Scholar] [CrossRef]
  22. Ucan, O.; Aricioglu, E.; Yucel, F. Energy consumption and economic growth nexus: Evidence from developed countries in Europe. Int. J. Energy Econ. Policy 2014, 4, 411–419. [Google Scholar]
  23. Bhattacharya, M.; Paramati, S.R.; Ozturk, I.; Bhattacharya, S. The effect of renewable energy consumption on economic growth: Evidence from top 38 countries. Appl. Energy 2016, 162, 733–741. [Google Scholar] [CrossRef]
  24. Kasperowicz, R.; Bilan, Y.; Štreimikienė, D. The renewable energy and economic growth nexus in European countries. Sustain. Dev. 2020, 28, 1086–1093. [Google Scholar] [CrossRef]
  25. Chang, T.; Gupta, R.; Inglesi-Lotz, R.; Simo-Kengne, B.; Smithers, D.; Trembling, A. Renewable energy and growth: Evidence from heterogeneous panel of G7 countries using Granger causality. Renew. Sustain. Energy Rev. 2015, 52, 1405–1412. [Google Scholar] [CrossRef] [Green Version]
  26. Shahbaz, M.; Loganathan, N.; Zeshan, M.; Zaman, K. Does renewable energy consumption add in economic growth? An application of auto-regressive distributed lag model in Pakistan. Renew. Sustain. Energy Rev. 2015, 44, 576–585. [Google Scholar] [CrossRef]
  27. Bobinaite, V.; Juozapaviciene, A.; Konstantinaviciute, I. Assessment of Causality Relationship between Renewable Energy Consumption and Economic Growth in Lithuania. Eng. Econ. 2011, 22, 510–518. [Google Scholar] [CrossRef] [Green Version]
  28. Bersalli, G.; Menanteau, P.; El-Methni, J. Renewable energy policy effectiveness: A panel data analysis across Europe and Latin America. Renew. Sustain. Energy Rev. 2020, 133, 110351. [Google Scholar] [CrossRef]
  29. Ntanos, S.; Skordoulis, M.; Kyriakopoulos, G.; Arabatzis, G.; Chalikias, M.; Galatsidas, S.; Batzios, A.; Katsarou, A. Renewable Energy and Economic Growth: Evidence from European Countries. Sustainability 2018, 10, 2626. [Google Scholar] [CrossRef] [Green Version]
  30. Saint Akadiri, S.; Alola, A.A.; Akadiri, A.C.; Alola, U.V. Renewable energy consumption in EU-28 countries: Policy toward pollution mitigation and economic sustainability. Energy Policy 2019, 132, 803–810. [Google Scholar] [CrossRef]
  31. Dogan, E. The relationship between economic growth and electricity consumption from renewable and non-renewable sources: A study of Turkey. Renew. Sustain. Energy Rev. 2015, 52, 534–546. [Google Scholar] [CrossRef]
  32. Shrimali, G.; Kniefel, J. Are government policies effective in promoting deployment of renewable electricity resources? Energy Policy 2011, 39, 4726–4741. [Google Scholar] [CrossRef]
  33. Kilinc-Ata, N. The evaluation of renewable energy policies across EU countries and US states: An econometric approach. Energy Sustain. Dev. 2016, 31, 83–90. [Google Scholar] [CrossRef]
  34. Shokri, A.; Heo, E. Energy Policies to Promote Renewable Energy Technologies; Learning from Asian Countries Experiences. Available online: https://eneken.ieej.or.jp/3rd_IAEE_Asia/pdf/paper/110p.pdf (accessed on 2 April 2021).
  35. Wang, Q.; Chen, Y. Barriers and opportunities of using the clean development mechanism to advance renewable energy development in China. Renew. Sustain. Energy Rev. 2010, 14, 1989–1998. [Google Scholar] [CrossRef]
  36. Sun, P.; Nie, P.-Y. A comparative study of feed-in tariff and renewable portfolio standard policy in renewable energy industry. Renew. Energy 2015, 74, 255–262. [Google Scholar] [CrossRef]
  37. Nasr, A.K.; Kashan, M.K.; Maleki, A.; Jafari, N.; Hashemi, H. Assessment of Barriers to Renewable Energy Development Using Stakeholders Approach. Entrep. Sustain. Issues 2020, 7, 2526–2541. [Google Scholar] [CrossRef] [Green Version]
  38. Lu, Y.; Khan, Z.A.; Alvarez-Alvarado, M.S.; Zhang, Y.; Huang, Z.; Imran, M. A Critical Review of Sustainable Energy Policies for the Promotion of Renewable Energy Sources. Sustainability 2020, 12, 5078. [Google Scholar] [CrossRef]
  39. Marinescu, N. Changes in Renewable Energy Policy and Their Implications: The Case of Romanian Producers. Energies 2020, 13, 6493. [Google Scholar] [CrossRef]
  40. Zhang, M.; Zhou, D.; Zhou, P.; Chen, H. Optimal design of subsidy to stimulate renewable energy investments: The case of China. Renew. Sustain. Energy Rev. 2017, 71, 873–883. [Google Scholar] [CrossRef]
  41. Ilbahar, E.; Cebi, S.; Kahraman, C. A state-of-the-art review on multi-attribute renewable energy decision making. Energy Strat. Rev. 2019, 25, 18–33. [Google Scholar] [CrossRef]
  42. Streimikiene, D.; Šliogerienė, J.; Turskis, Z. Multi-criteria analysis of electricity generation technologies in Lithuania. Renew. Energy 2016, 85, 148–156. [Google Scholar] [CrossRef]
  43. Roussafi, F. Regional development trajectories of renewable energy: Evidence from French regions. Energy Strat. Rev. 2021, 35, 100639. [Google Scholar] [CrossRef]
  44. Saygin, D.; Kempener, R.; Wagner, N.; Ayuso, M.; Gielen, D. The implications for renewable energy innovation of doubling the share of renewable energy options and their policy implications. Energies 2015, 8, 5828–5865. [Google Scholar] [CrossRef]
  45. Demirbas, A. Global Renewable Energy Projections. Energy Sources Part B Econ. Plan. Policy 2009, 4, 212–224. [Google Scholar] [CrossRef]
  46. Gielen, D.; Boshell, F.; Saygin, D.; Bazilian, M.D.; Wagner, N.; Gorini, R. The role of renewable energy in the global energy transformation. Energy Strategy Rev. 2019, 24, 38–50. [Google Scholar] [CrossRef]
  47. Collins, S.; Saygin, D.; Deane, J.; Miketa, A.; Gutierrez, L.; Gallachoir, B.O.; Gielen, D. Planning the European power sector transformation: The REmap modelling framework and its insights. Energy Strat. Rev. 2018, 22, 147–165. [Google Scholar] [CrossRef]
  48. Impram, S.; Nese, S.V.; Oral, B. Challenges of renewable energy penetration on power system flexibility: A survey. Energy Strat. Rev. 2020, 31, 100539. [Google Scholar] [CrossRef]
  49. Ulbig, A.; Andersson, G. Analyzing operational flexibility of electric power systems. Int. J. Electr. Power Energy Syst. 2015, 72, 155–164. [Google Scholar] [CrossRef]
  50. Benasla, M.; Allaoui, T.; Brahami, M.; Denaï, M.; Sood, V.K. HVDC links between North Africa and Europe: Impacts and benefits on the dynamic performance of the European system. Renew. Sustain. Energy Rev. 2018, 82, 3981–3991. [Google Scholar] [CrossRef] [Green Version]
  51. Benasla, M.; Hess, D.; Allaoui, T.; Brahami, M.; Denaï, M. The transition towards a sustainable energy system in Europe: What role can North Africa’s solar resources play? Energy Strat. Rev. 2019, 24, 1–13. [Google Scholar] [CrossRef]
  52. Wang, C.; Chen, J.; Zou, J. Decomposition of energy-related CO2 emission in China: 1957–2000. Energy 2005, 30, 73–83. [Google Scholar] [CrossRef]
  53. Wang, W.; Liu, X.; Zhang, M.; Song, X. Using a new generalized LMDI (logarithmic mean Divisia index) method to analyze China’s energy consumption. Energy 2014, 67, 617–622. [Google Scholar] [CrossRef]
  54. Zhang, Y.-J.; Da, Y.-B. The decomposition of energy-related carbon emission and its decoupling with economic growth in China. Renew. Sustain. Energy Rev. 2015, 41, 1255–1266. [Google Scholar] [CrossRef]
  55. Li, W.; Shen, Y.-B.; Zhang, H.-X. A Factor Decomposition on China’s Carbon Emission from 1997 to 2012 Based on IPAT-LMDI Model. Math. Probl. Eng. 2015, 2015, 943758. [Google Scholar] [CrossRef]
  56. Du, K.; Lu, H.; Yu, K. Sources of the potential CO2 emission reduction in China: A nonparametric metafrontier approach. Appl. Energy 2014, 115, 491–501. [Google Scholar] [CrossRef]
  57. Yao, C.; Feng, K.; Hubacek, K. Driving forces of CO2 emissions in the G20 countries: An index decomposition analysis from 1971 to 2010. Ecol. Inform. 2015, 26, 93–100. [Google Scholar] [CrossRef]
  58. Chontanawat, J. Driving Forces of Energy-Related CO2 Emissions Based on Expanded IPAT Decomposition Analysis: Evidence from ASEAN and Four Selected Countries. Energies 2019, 12, 764. [Google Scholar] [CrossRef] [Green Version]
  59. Taka, G.N.; Huong, T.T.; Shah, I.H.; Park, H.-S. Determinants of Energy-Based CO2 Emissions in Ethiopia: A Decomposition Analysis from 1990 to 2017. Sustainability 2020, 12, 4175. [Google Scholar] [CrossRef]
  60. Brizga, J.; Feng, K.; Hubacek, K. Drivers of CO2 emissions in the former Soviet Union: A country level IPAT analysis from 1990 to 2010. Energy 2013, 59, 743–753. [Google Scholar] [CrossRef]
  61. Štreimikienė, D.; Balezentis, T. Kaya identity for analysis of the main drivers of GHG emissions and feasibility to implement EU “20–20–20” targets in the Baltic States. Renew. Sustain. Energy Rev. 2016, 58, 1108–1113. [Google Scholar] [CrossRef]
  62. Ang, B.; Pandiyan, G. Decomposition of energy-induced CO2 emissions in manufacturing. Energy Econ. 1997, 19, 363–374. [Google Scholar] [CrossRef]
  63. Cheng, Z.; Li, L.; Liu, J.; Zhang, H. Total-factor carbon emission efficiency of China’s provincial industrial sector and its dynamic evolution. Renew. Sustain. Energy Rev. 2018, 94, 330–339. [Google Scholar] [CrossRef]
  64. Xu, B.; Lin, B. Reducing CO2 emissions in China’s manufacturing industry: Evidence from nonparametric additive regression models. Energy 2016, 101, 161–173. [Google Scholar] [CrossRef]
  65. Boqiang, L.; Liu, K. Using LMDI to Analyze the Decoupling of Carbon Dioxide Emissions from China’s Heavy Industry. Sustainability 2017, 9, 1198. [Google Scholar] [CrossRef] [Green Version]
  66. Xu, B.; Lin, B. Regional differences in the CO2 emissions of China’s iron and steel industry: Regional heterogeneity. Energy Policy 2016, 88, 422–434. [Google Scholar] [CrossRef]
  67. Xu, B.; Lin, B. Assessing CO2 emissions in China’s iron and steel industry: A nonparametric additive regression approach. Renew. Sustain. Energy Rev. 2017, 72, 325–337. [Google Scholar] [CrossRef]
  68. Sheinbaum, C.; Ozawa, L.; Castillo, D. Using logarithmic mean Divisia index to analyze changes in energy use and carbon dioxide emissions in Mexico’s iron and steel industry. Energy Econ. 2010, 32, 1337–1344. [Google Scholar] [CrossRef]
  69. Tian, Y.; Zhu, Q.; Geng, Y. An analysis of energy-related greenhouse gas emissions in the Chinese iron and steel industry. Energy Policy 2013, 56, 352–361. [Google Scholar] [CrossRef]
  70. Lin, B.; Moubarak, M. Decomposition analysis: Change of carbon dioxide emissions in the Chinese textile industry. Renew. Sustain. Energy Rev. 2013, 26, 389–396. [Google Scholar] [CrossRef]
  71. Lin, B.; Long, H. Emissions reduction in China’s chemical industry- Based on LMDI. Renew. Sustain. Energy Rev. 2016, 53, 1348–1355. [Google Scholar] [CrossRef]
  72. Chen, W.; Yin, X.; Ma, D. A bottom-up analysis of China’s iron and steel industrial energy consumption and CO2 emissions. Appl. Energy 2014, 136, 1174–1183. [Google Scholar] [CrossRef]
  73. Radmehr, R.; Henneberry, S.R.; Shayanmehr, S. Renewable Energy Consumption, CO2 Emissions, and Economic Growth Nexus: A Simultaneity Spatial Modeling Analysis of EU Countries. Struct. Chang. Econ. Dyn. 2021, 57, 13–27. [Google Scholar] [CrossRef]
  74. Kaya, Y. Impact of Carbon Dioxide Emission Control on GNP Growth: Interpretation of Proposed Scenarios; IPCC Energy and Industry Subgroup, Response Strategies Working Group: Paris, France, 1990. [Google Scholar]
  75. Ang, B.; Zhang, F. A survey of index decomposition analysis in energy and environmental studies. Energy 2000, 25, 1149–1176. [Google Scholar] [CrossRef]
  76. Ang, B. Decomposition analysis for policymaking in energy: Which is the preferred method? Energy Policy 2004, 32, 1131–1139. [Google Scholar] [CrossRef]
  77. Ang, B. The LMDI approach to decomposition analysis: A practical guide. Energy Policy 2005, 33, 867–871. [Google Scholar] [CrossRef]
  78. Energy Balance Sheet by Year, Indicator and Type of fuel/energy in Estonia. Annual Statistics 2021. Available online: https://andmed.stat.ee/en/stat/majandus__energeetika__energia-tarbimine-ja-tootmine__aastastatistika/KE0240 (accessed on 17 March 2021).
  79. Energy Balance, Thousand Toe (NACE Rev.2) by Indicator in Latvia. Available online: https://data.stat.gov.lv/pxweb/en/OSP_PUB/START__NOZ__EN__ENB/ENB060/table/tableViewLayout1 (accessed on 18 March 2021).
  80. Environment and Energy in Lithuania. Available online: https://osp.stat.gov.lt/statistiniu-rodikliu-analize#/ (accessed on 18 January 2021).
  81. Directive (EU) 2018/2001 of the European Parliament and of the Council of 11 December 2018 on the Promotion of the Use of Energy from Renewable Sources. Available online: https://eur-lex.europa.eu/legal-content/EN/TXT/HTML/?uri=OJ:L:2018:328:FULL&from=EN (accessed on 11 February 2021).
  82. Frondel, M.; Ritter, N.; Schmidt, C.M.; Vance, C. Economic impacts from the promotion of renewable energy technologies: The German experience. Energy Policy 2010, 38, 4048–4056. [Google Scholar] [CrossRef] [Green Version]
  83. Haas, R.; Panzer, C.; Resch, G.; Ragwitz, M.; Reece, G.; Held, A. A historical review of promotion strategies for electricity from renewable energy sources in EU countries. Renew. Sustain. Energy Rev. 2011, 15, 1003–1034. [Google Scholar] [CrossRef]
  84. Jaraite, J.; Karimu, A.; Kazukauskas, A. Policy-Induced Expansion of Solar and Wind Power Capacity: Economic Growth and Employment in EU Countries. Energy J. 2017, 38, 197–218. [Google Scholar] [CrossRef] [Green Version]
  85. Miskinis, V.; Norvaiša, E.; Galinis, A.; Konstantinaviciute, I. Trends of distributed generation development in Lithuania. Energy Policy 2011, 39, 4656–4663. [Google Scholar] [CrossRef]
  86. Renewable Energy Policy Database and Support: Estonia. Available online: http://www.res-legal.eu/search-by-country/estonia (accessed on 10 December 2020).
  87. Renewable Energy Policy Database and Support: Latvia. Available online: http://www.res-legal.eu/search-by-country/latvia (accessed on 15 December 2020).
  88. Renewable Energy Policy Database and Support: Lithuania. Available online: http://www.res-legal.eu/search-by-country/lithuania (accessed on 8 December 2020).
  89. Eurostat Database, Share of Renewable Energy in Gross Final Energy Consumption by Sector [SDG_07_40]. Available online: https://ec.europa.eu/eurostat/databrowser/view/sdg_07_40/default/table?lang=en (accessed on 21 May 2021).
  90. Towards Clean, Competitive and Connected Mobility: The Contribution of Transport Research and Innovation to the Moability Package, SWD (2017), 223 Final. Available online: https://ec.europa.eu/transport/sites/transport/files/swd20170223-transportresearchandinnovationtomobilitypackage.pdf (accessed on 2 April 2021).
  91. National Renewable Energy Action Plans 2020. National Renewable Energy Action Plans 2020|Energy (europa.eu). Available online: https://ec.europa.eu/energy/topics/renewable-energy/directive-targets-and-rules/national-renewable-energy-action-plans-2020_en (accessed on 15 February 2021).
  92. National Inventory Submissions 2021. Available online: https://unfccc.int/ghg-inventories-annex-i-parties/2021 (accessed on 21 April 2021).
  93. Eurostat Database, GDP and Main Components (Output, Expenditure and Income). Available online: https://appsso.eurostat.ec.europa.eu/nui/show.do?dataset=nama_10_gdp&lang=en (accessed on 2 April 2021).
  94. Eurostat Database, Complete Energy Balances (Online Data Code: NRG_BAL_C). Available online: https://ec.europa.eu/eurostat/databrowser/view/nrg_bal_c/default/table?lang=en (accessed on 2 April 2021).
  95. Eurostat Database, Population on 1 January by Age and Sex [Demo_Pjan]. Available online: https://appsso.eurostat.ec.europa.eu/nui/show.do?dataset=demo_pjan&lang=en (accessed on 12 April 2021).
  96. Eurostat Database, Share of Fossil Fuels in Gross Available Energy [Nrg_Ind_Ffgae]. Available online: https://appsso.eurostat.ec.europa.eu/nui/show.do?dataset=nrg_ind_ffgae&lang=en (accessed on 5 April 2021).
Figure 1. Final consumption of renewable energy sources (RES) by sectors in the Baltic states during 2010–2019, [78,79,80].
Sustainability 13 10215 g001aSustainability 13 10215 g001b
Figure 2. Final consumption of renewable energy sources (RES) by fuel forms in the Baltic states during 2010–2019, [78,79,80].
Sustainability 13 10215 g002aSustainability 13 10215 g002b
Figure 3. Use of RES for electricity and district heat generation in the Baltic states during 2010–2019, [78,79,80].
Sustainability 13 10215 g003aSustainability 13 10215 g003b
Figure 4. Electricity generation by power plants in the Baltic states during 2010–2019, [78,79,80].
Sustainability 13 10215 g004aSustainability 13 10215 g004b
Figure 5. Share of RES in gross inland energy consumption in the Baltic states during 2010–2019, [78,79,80].
Sustainability 13 10215 g005
Figure 6. Share of RES consumption as a transport fuel in countries of the BSR in 2019, [89].
Sustainability 13 10215 g006
Figure 7. Share of RES in the gross final consumption of energy in countries of the BSR in 2019, [89].
Sustainability 13 10215 g007
Figure 8. Changes in energy-related GHG emissions and their driving factors in the Baltic countries.
Sustainability 13 10215 g008aSustainability 13 10215 g008b
Figure 9. Decomposition dynamics and changes in energy-related GHG emissions in the Baltic States during 2011–2019.
Sustainability 13 10215 g009aSustainability 13 10215 g009b
Figure 10. Per capita energy-related GHG emissions in 2019 and dynamics in the EU-27 and selected EU countries during 2010–2019, [92,95].
Sustainability 13 10215 g010
Table 1. Estimated and actual shares of RES (in %) for heating and cooling in the selected EU countries, [89,91].
Estimated2010201520192020
ActualEstimatedActualEstimatedActualEstimated
Estonia38.943.2539.749.3338.752.2838.4
Latvia45.340.7548.651.7451.557.7653.4
Lithuania27.632.5434.246.0939.147.3639.2
Denmark30.830.4536.040.2339.348.0239.8
Germany9.012.0611.713.4414.714.5515.5
Finland37.243.9742.352.6246.357.4947.5
Poland12.311.8113.714.8016.515.9817.1
Sweden57.058.4859.865.2861.766.1262.1
Table 2. Estimated and actual share of RES (in %) in the gross final consumption of energy in the selected EU countries, [89,91].
Estimated2010201520192020
ActualEstimatedActualEstimatedActualTarget
Estonia20.924.6023.628.5324.531.8925
Latvia32.730.3835.637.5438.540.9840
Lithuania15.819.6420.425.7524.425.4623
Denmark21.921.8922.630.8730.137.230
Germany10.111.6713.514.9117.717.3518
Finland28.732.2932.639.3236.843.0838
Poland9.69.311.911.8914.612.1615
Sweden43.546.6047.052.9549.656.3949
Table 3. Share of RES (in %) in the final consumption of energy for different sectors in the selected EU countries, [89].
TransportElectricityHeating and Cooling
201020192010201920102019
Estonia0.435.1510.2922.0043.2552.28
Latvia3.985.1142.0553.4240.7557.76
Lithuania3.794.057.4018.7932.5447.36
EU-275.508.9021.3034.1017.0222.10
Denmark1,157.1732.7465.3530.4548.02
Germany6.417.6818.2440.8212.0614.55
Finland4.4121.2927.6638.0743.9757.49
Poland6.646.126.6514.3611.8115.98
Sweden9.6330.3155.7771.1958.4866.12
Norway5.3727.3398.39110.8233.0835.81
Table 4. Changes in GHG emissions and relevant driving factors (in %) during 2010–2019, [92,93,94,95,96].
GHG EmissionsPopulation Economic Growth Energy IntensityShare of Fossil Fuels Emission Intensity
Estonia−4.70−0.043.89−5.47−2.36−0.57
Latvia−1.45−1.014.39−3.27−1.34−0.07
Lithuania−1.07−1.145.01−2.73−1.30−0.73
EU-27−2.130.171.32−2.32−0.60−0.68
Denmark−5.280.521.10−3.62−2.65−0.67
Germany−1.850.281.39−2.84−0.11−0.54
Finland−4.690.320.66−1.88−3.15−0.69
Norway−1.391.000.55−3.29−2.052.50
Poland−0.67−0.023.68−3.34−0.40−0.,47
Sweden−3.321.021.07−2.27−2.52−0.61
Table 5. Change of GHG emissions and impact of the driving factors, t CO2 eq./capita, modelling results.
ΔC/CapitaPopulation EffectEconomic GrowthEnergy IntensityEffect of Fossil FuelsEmission Intensity
Estonia−5.02−0.043.97−5.87−2.49−0.59
Latvia−0.55−0.381.61−1.25−0.51−0.03
Lithuania−0.43−0.461.96−1.11−0.53−0.30
EU-27−1.500.110.91−1.63−0.42−0.47
Denmark−3.310.320.67−2.25−1.64−0.41
Germany−1.490.231.10−2.31−0.09−0.43
Finland−3.830.260.53−1.51−2.55−0.55
Norway−0.900.640.35−2.13−1.321.57
Poland−0.53−0.022.84−2.67−0.32−0.37
Sweden−1.210.360.38−0.82−0.91−0.22
Publisher’s Note: MDPI stays neutral with regard to jurisdictional claims in published maps and institutional affiliations.

