1. Introduction
The Egyptian state’s plan for urban development is mainly accompanied by industrial development, which helps to expand development axes and attract inhabitants to new cities [
1]. Notably, one of the most critical problems facing urban and industrial expansion is the variety in the climate between different areas, which is hoped to be expanded particularly in the southern areas characterized by high temperatures [
2,
3]. Nowadays, there is great emphasis on reducing the pollution resulting from industrial activities and rationalizing energy consumption within the industrial environment, and indeed these issues are the most important elements when it comes to creating a sustainable design for industrial buildings [
4]. Indeed, industrial spaces are the most exposed to high temperatures, which have a harmful effect on workers, causing many diseases [
5] and damage to the machines in the factory [
6]. With the above in mind, it becomes clear that studying industrial buildings and finding appropriate solutions that create a comfortable work environment, as well as reduce energy consumption, helps to attract industrial investments.
Hence, ventilation is one of the most important elements concerning the improvement of thermal conditions inside factories and it could reduce pollution [
7]. Thus, it plays a significant role in improving the quality of the industrial environment as a whole and contributes to avoiding many damages to workers and machines [
8]. Notably, mechanical ventilation methods are the most commonly used systems in factories [
9], despite there being several types of mechanical ventilation systems that differ in terms of air distribution. Indeed, selecting the appropriate method for the type of industry and nature of the climate is one of the most important factors for obtaining effective ventilation.
Several types of forced ventilation systems are used to improve the air quality and temperature in industrial buildings, and this research study focuses on two main types of ventilation: extract ventilation and spot cooling. While the former system is based on a natural supply via trickle vents or mechanical extraction, the latter can reduce exposure to pollutants in building spaces [
10]. Notably, extract ventilation systems work by depressurizing a structure, namely the system exhausting air from the space, which in turn causes a change in pressure that pulls in the make-up from the outside via leaks in the building shell and intentional, passive vents. Indeed, exhaust ventilation systems are relatively simple and inexpensive to install [
5], with a typical exhaust ventilation system consisting of fans connected to a centrally located exhaust point [
11]. Furthermore, adjustable, passive vents through windows or walls can be installed in other rooms to introduce fresh air, thus leaks in the building’s envelope do not have to be relied upon. However, passive vents may require larger pressure differences than those induced by the ventilation fan to work properly. Notably, one concern of exhaust ventilation systems is that, along with fresh air, they may draw in pollutants, which can include radon and molds from crawlspaces, dust from the attic, fumes from the attached garage, and flue gases from the fireplace, fossil-fuel-fired water heater, or furnace [
12].
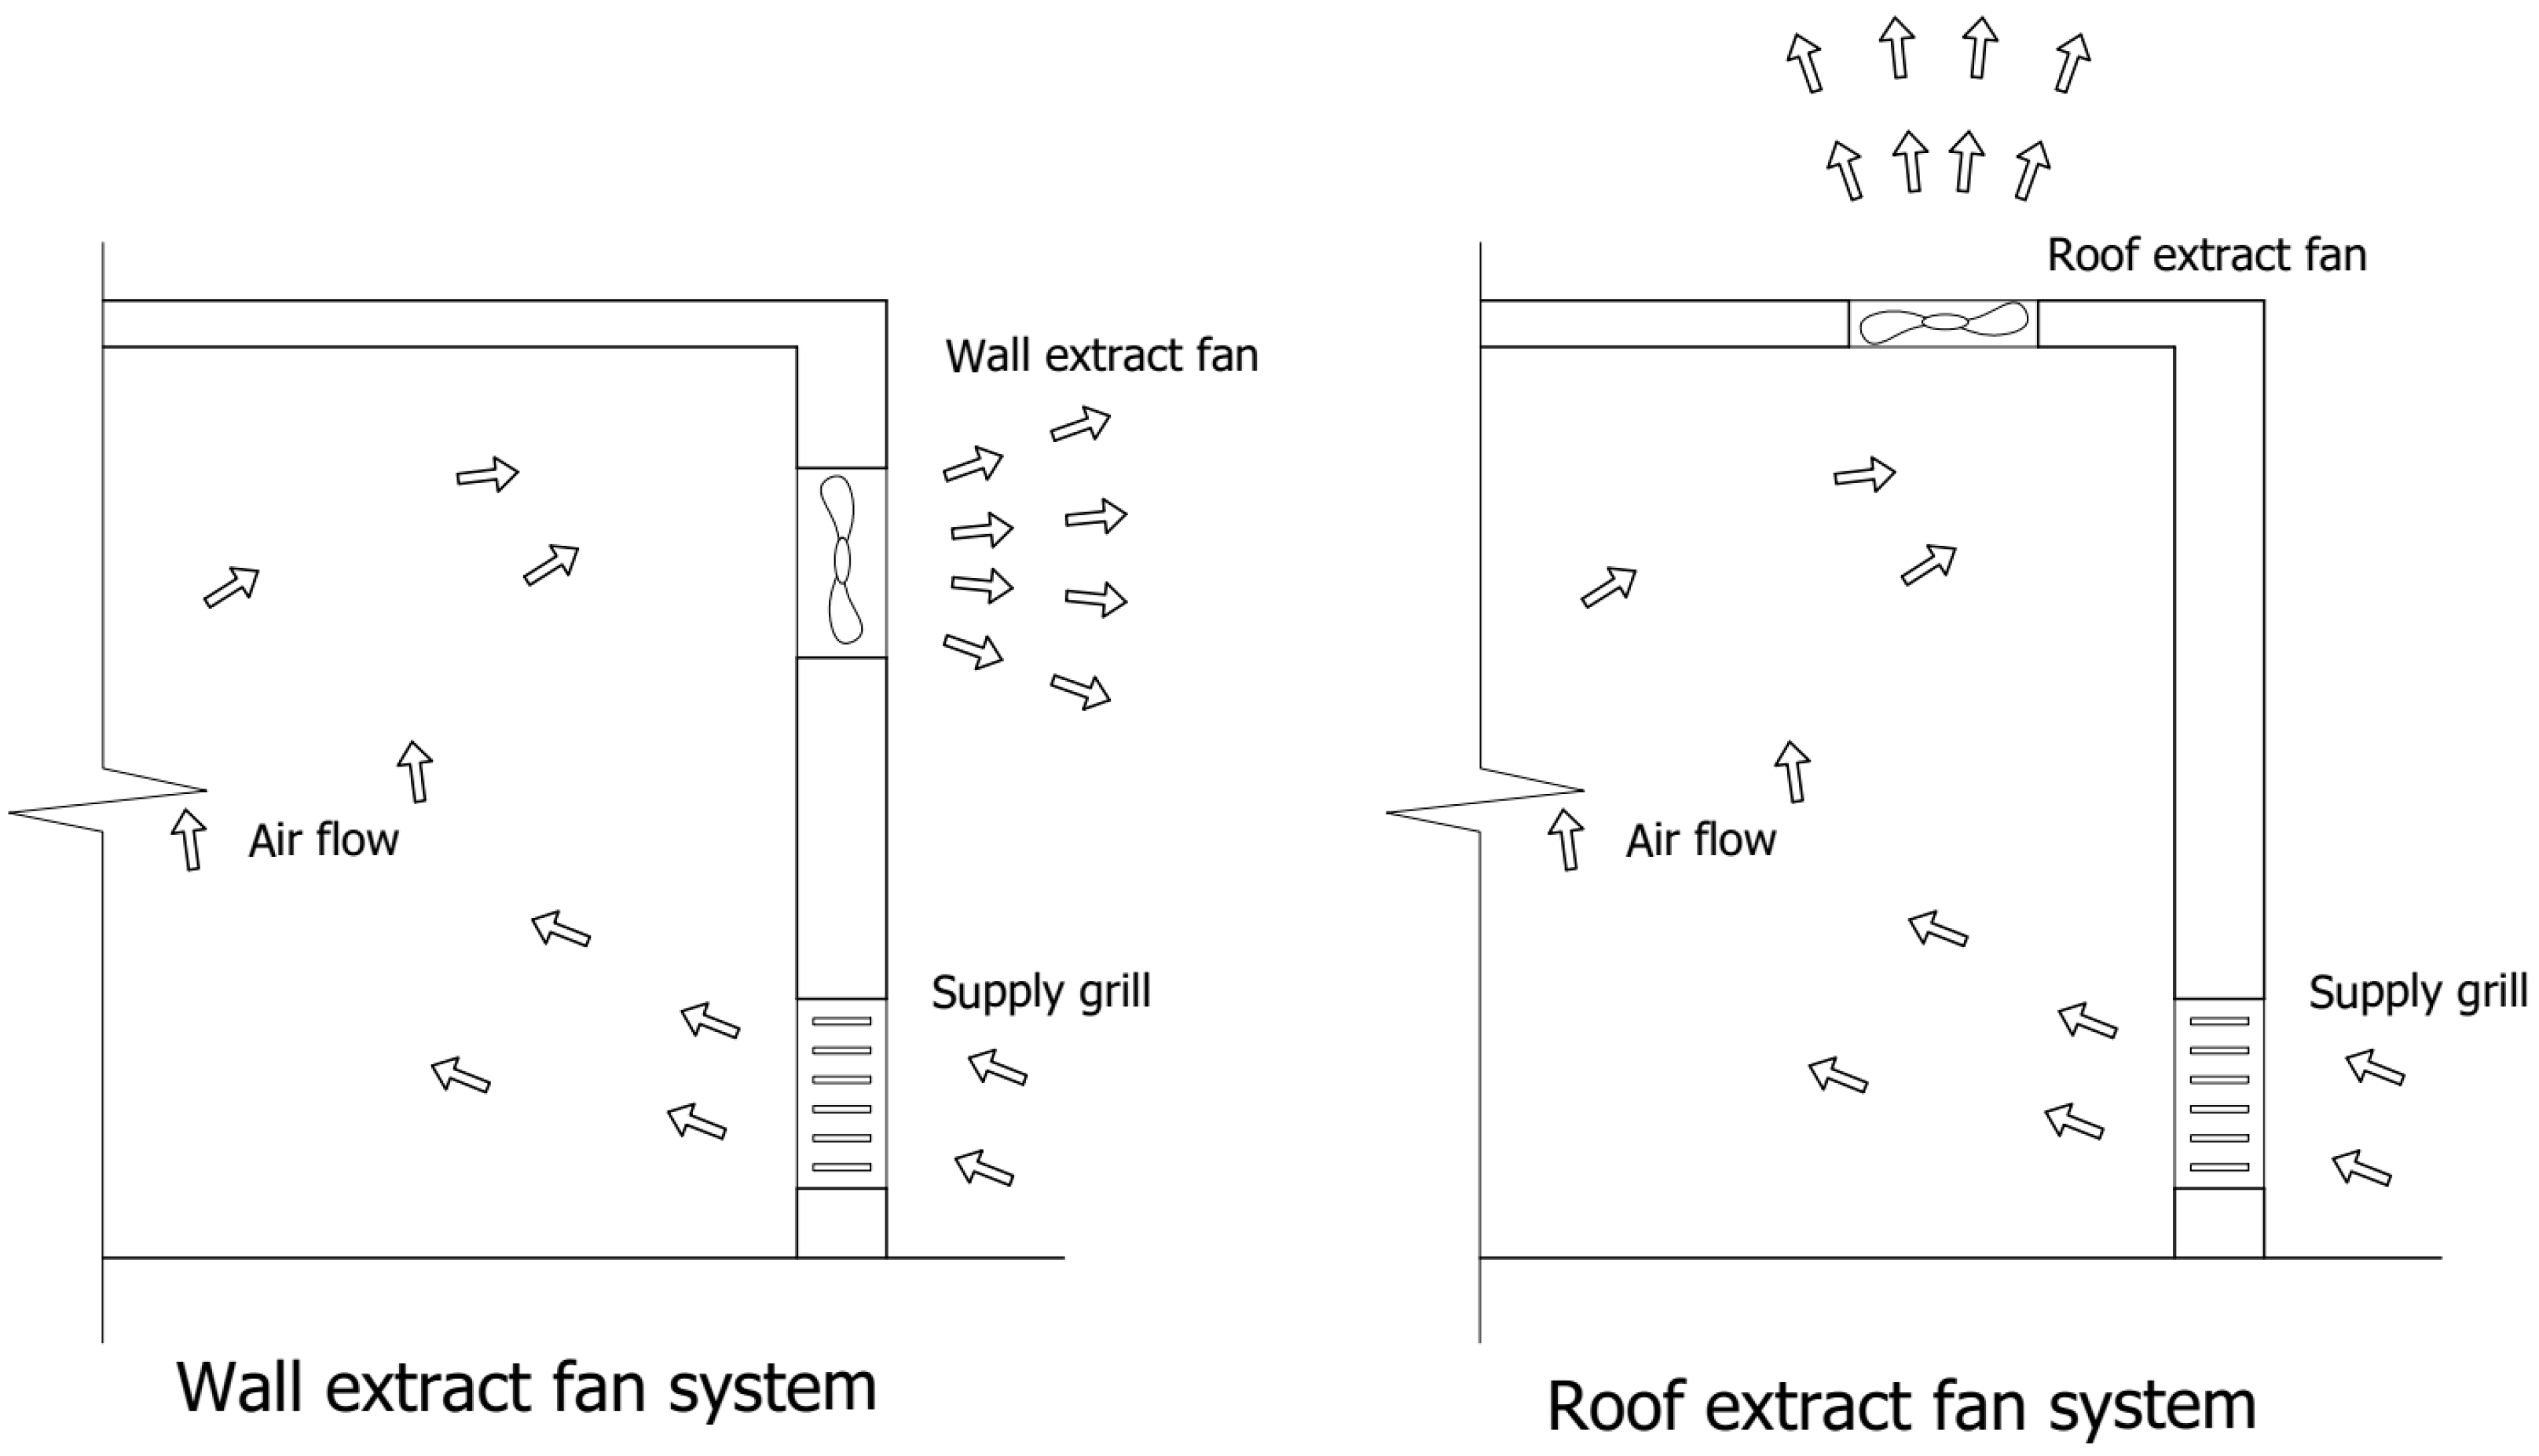
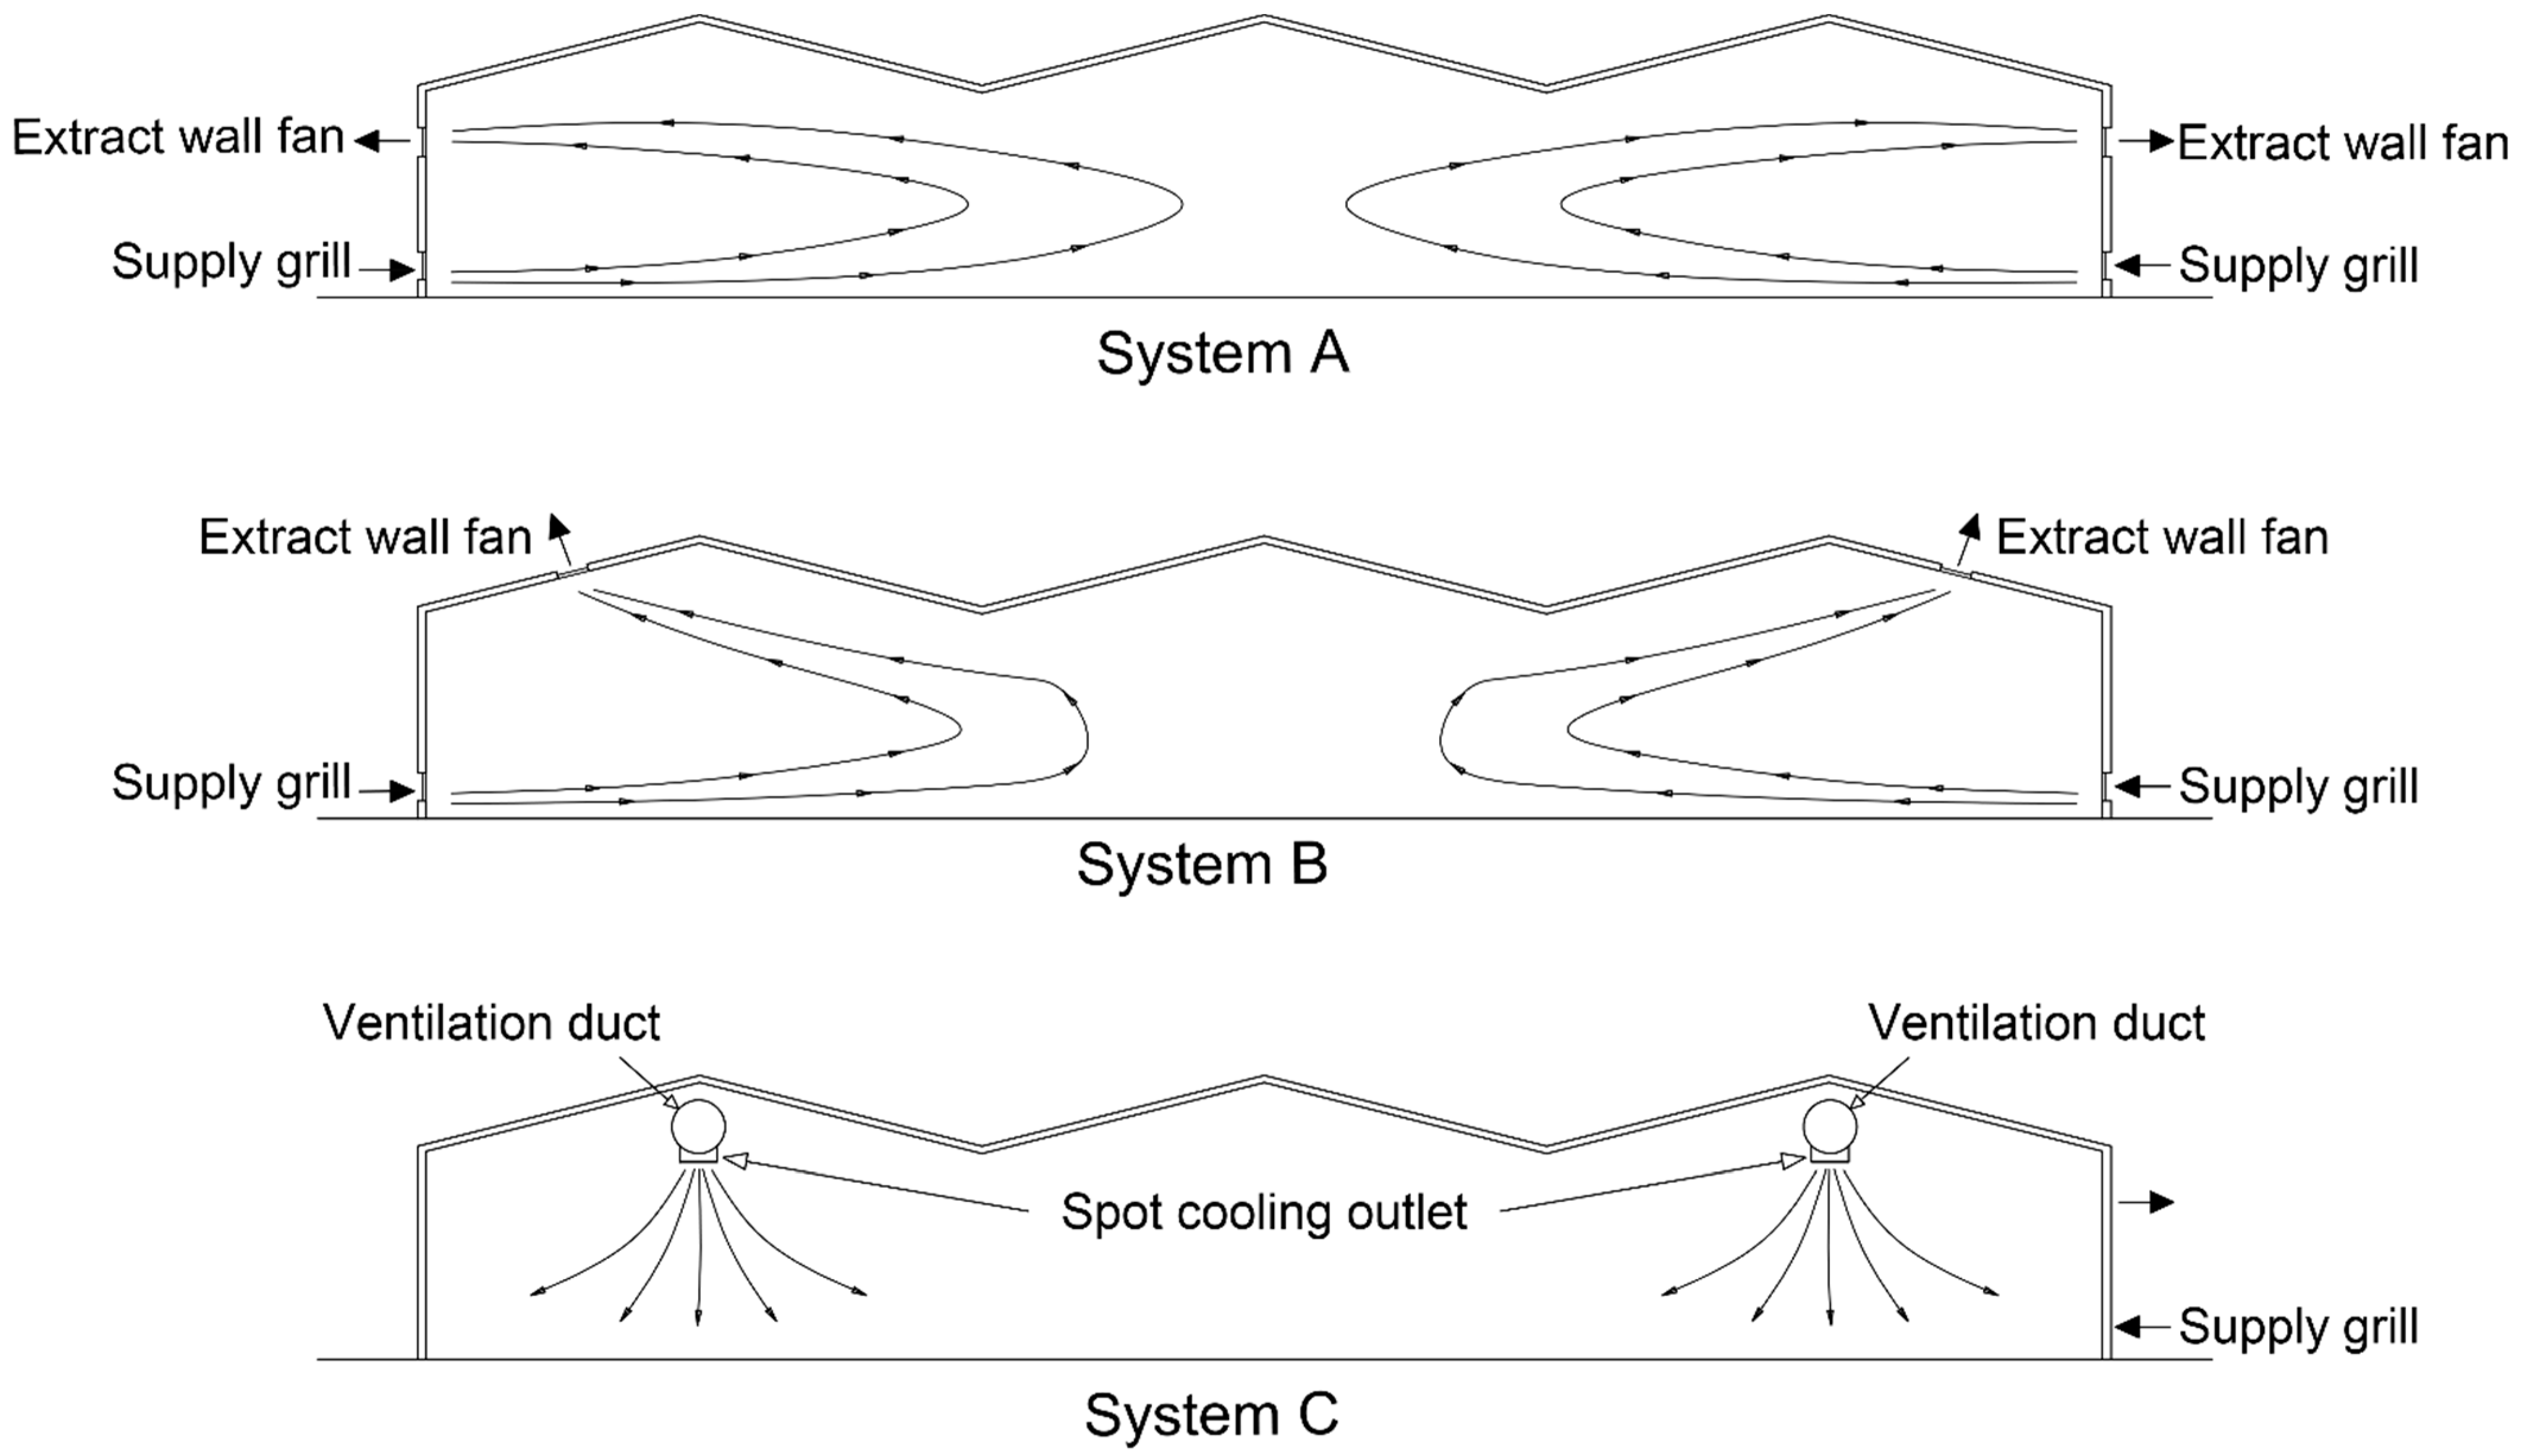
This research study aims at comparing some of the commonly used mechanical ventilation systems in Egyptian factories to reveal the most effective system in terms of providing thermal comfort and reducing energy consumption. The first two types that have been investigated in this research study are different types of extract ventilation: wall fan extract systems and roof fan extract systems, as shown in
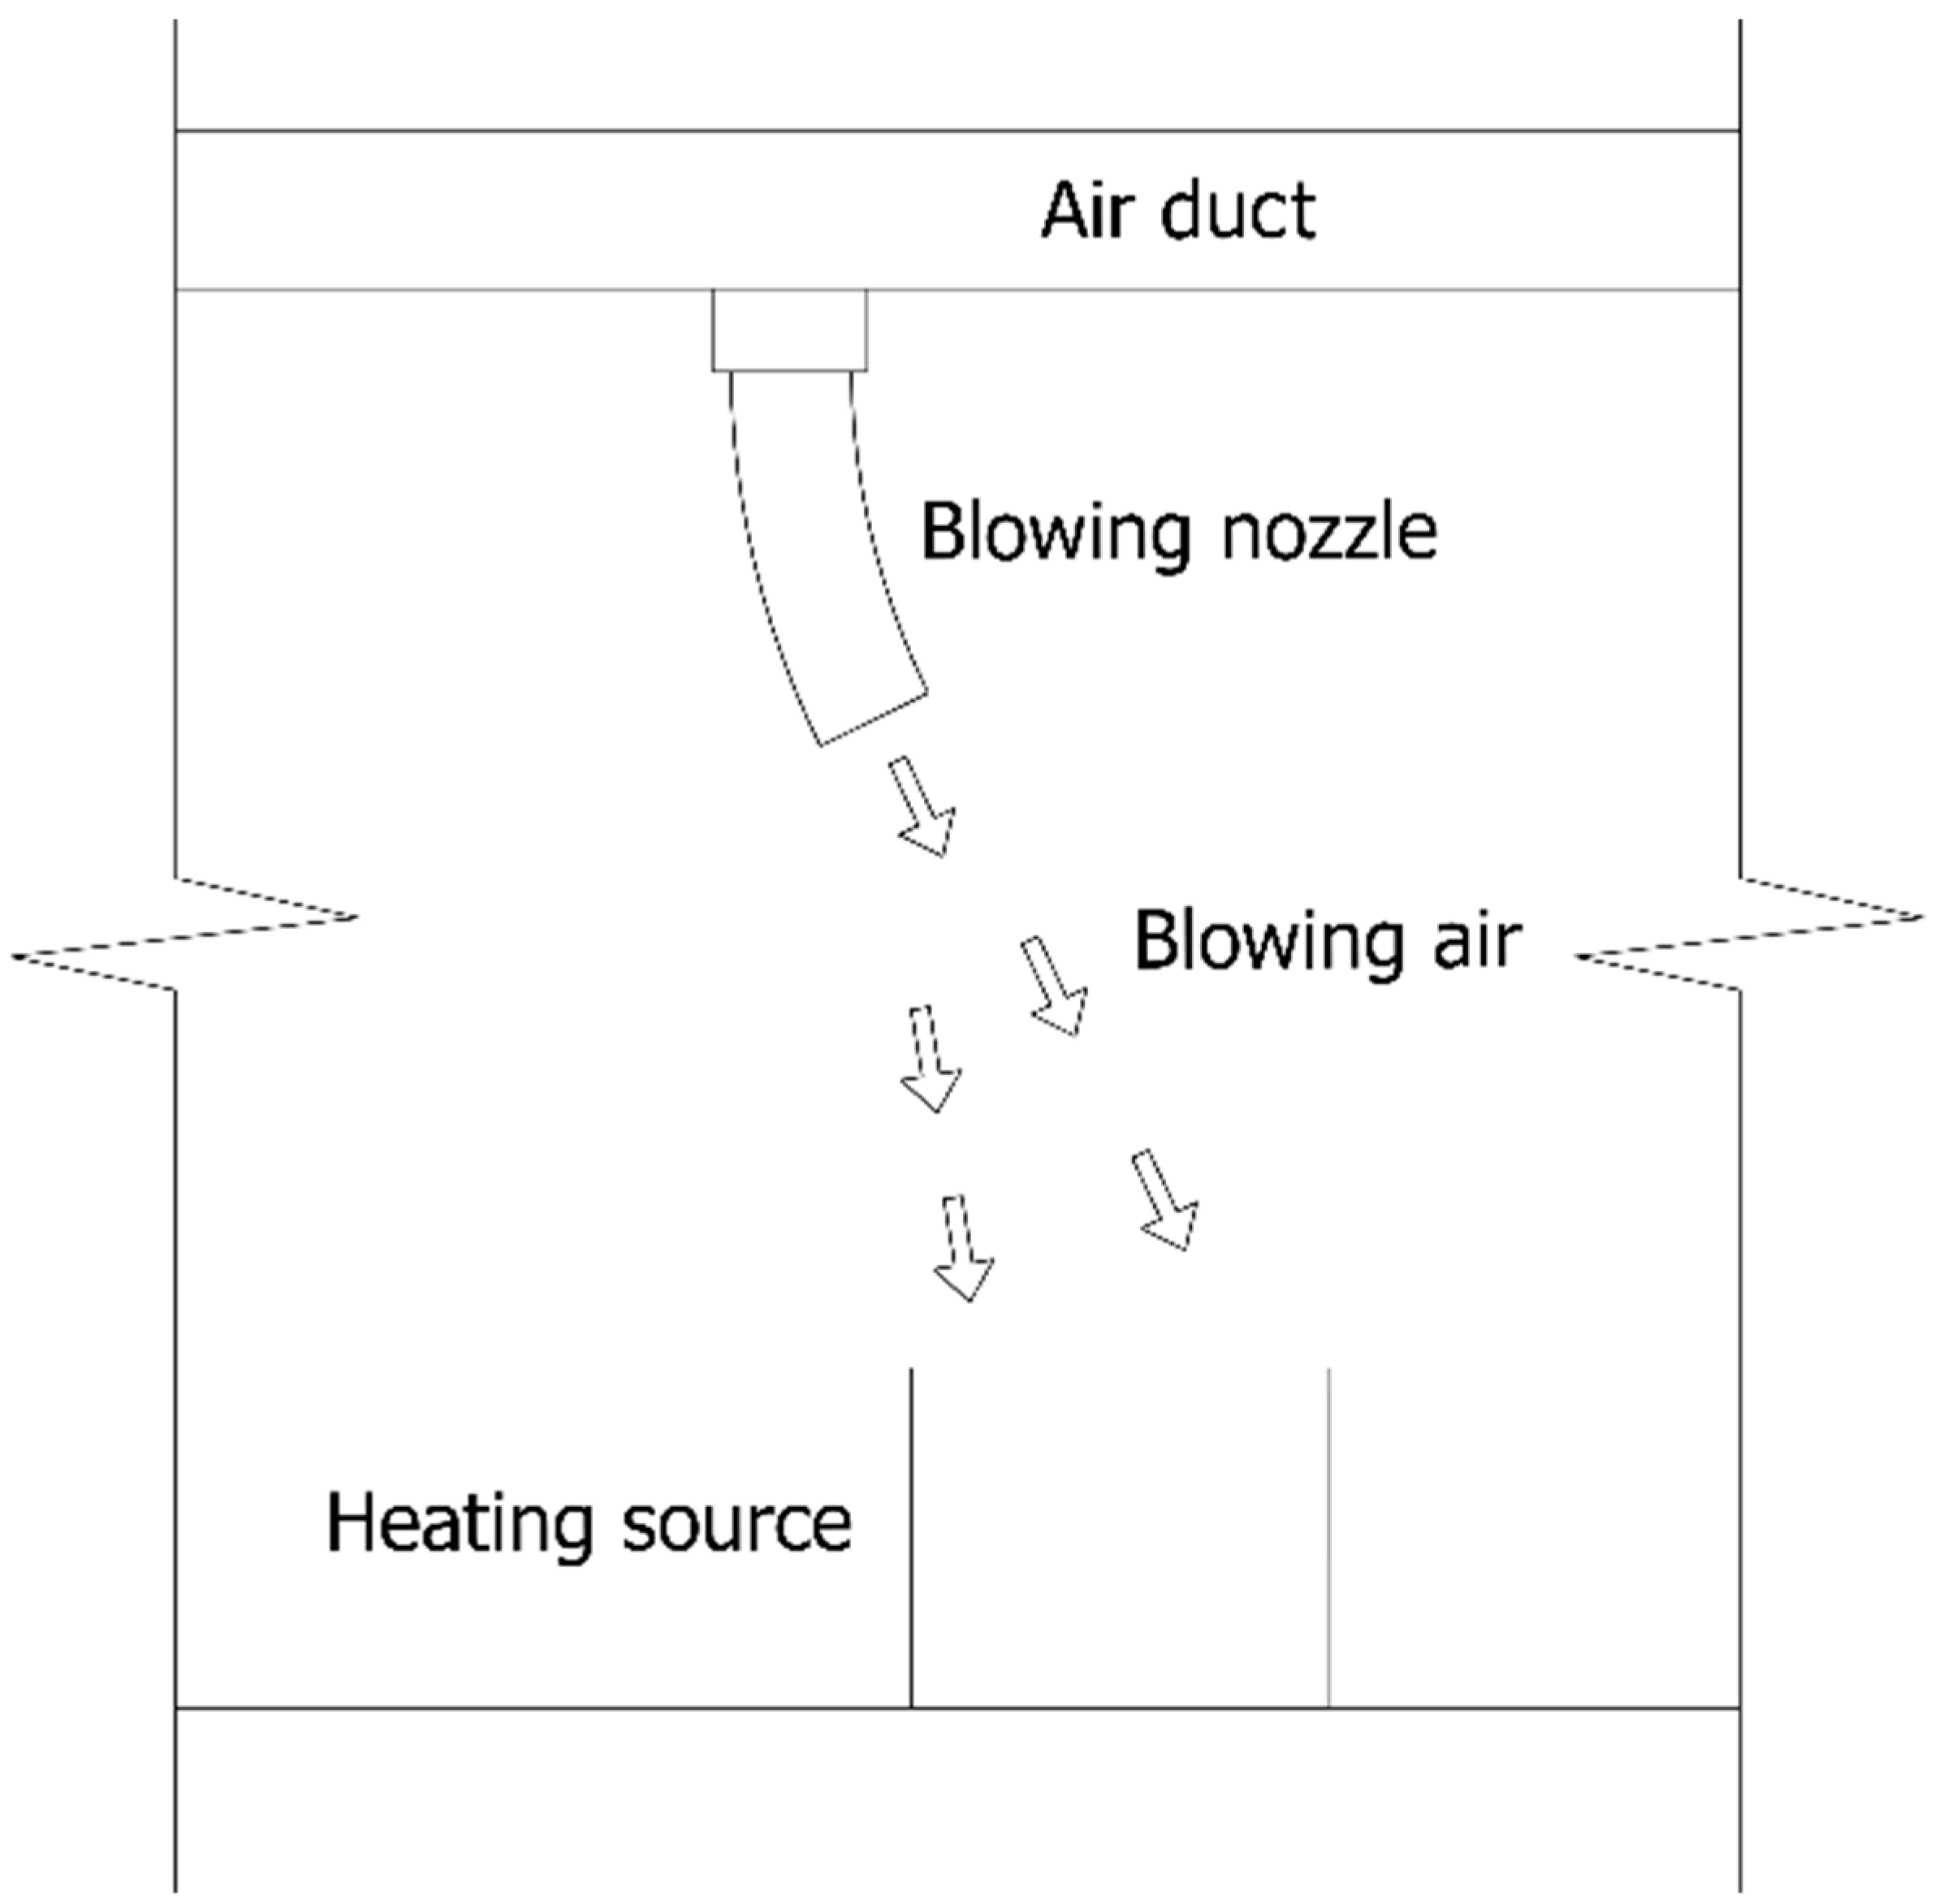
Figure 1. The third type of ventilation system that has been investigated in this research study is the spot cooling system, the concept of which focuses on cooling the occupants in a room rather than randomly dispersing the cooling air everywhere to bring down the entire room temperature, as shown in
Figure 2. Notably, spot cooling is intended to help reduce energy consumption without sacrificing consumer comfortability [
13,
14].
2. Methodology and Simulation Method
To study and analyze the ventilation systems’ performances in large building scales such as factories, there is a need for an inexpensive method for the purpose of comparing the different systems [
15]; on this note, CFD is a powerful tool for studying ventilation performance in factories, as they are inexpensive and able handle most of the thermo-fluid boundary conditions encountered in real-life scenarios [
16]. Particularly in cases whereby the airflow is represented by strong streamline curvature due to wind forces, CFD modeling is considered to be the most suitable tool for reliable airflow simulation [
17].
With this in mind, a number of researchers have used the CFD in studying and evaluating the building’s indoor mechanical and natural ventilation systems, and while CFD uses approximations, a number of previous research studies have validated the simulated results with experimental data, which approve the efficiency and reliability of CFD results [
16]. Further to this, some research studies have used the CFD in simulating the natural ventilation in different building types [
15,
17,
18,
19,
20,
21]. Additionally, mechanical ventilation has been analyzed using the CDF method in different research studies for residential and office buildings [
9,
22,
23]. Finally, a number of researchers have investigated the mechanical ventilation systems in factories using CFD and validated the results, in turn revealing the high efficiency and reliability of this method in studying such buildings [
16,
24].
This research study aims to test and evaluate the performance of different forced ventilation systems in industrial buildings by comparing three popular systems used in factories: the wall fan extract ventilation system, roof fan extract ventilation system, and spot cooling system. Notably, an oil factory production space has been selected for conducting such a comparison between the different systems.
Initially, the estimation and design for each system were done for the purpose of achieving the optimum benefit in every case, but after that, CDF simulations were done using ANSYS software, considering the different effective factors and the surrounding environment. Notably, the simulation result has been compared in consideration of the different thermal comfort items and the different systems have been compared in consideration of both the initial cost and energy consumption for each one. Consequently, multi-criteria feasibility has been conducted to help choose the appropriate system for the factories’ ventilation.
3. Simulation Work
3.1. Case Study
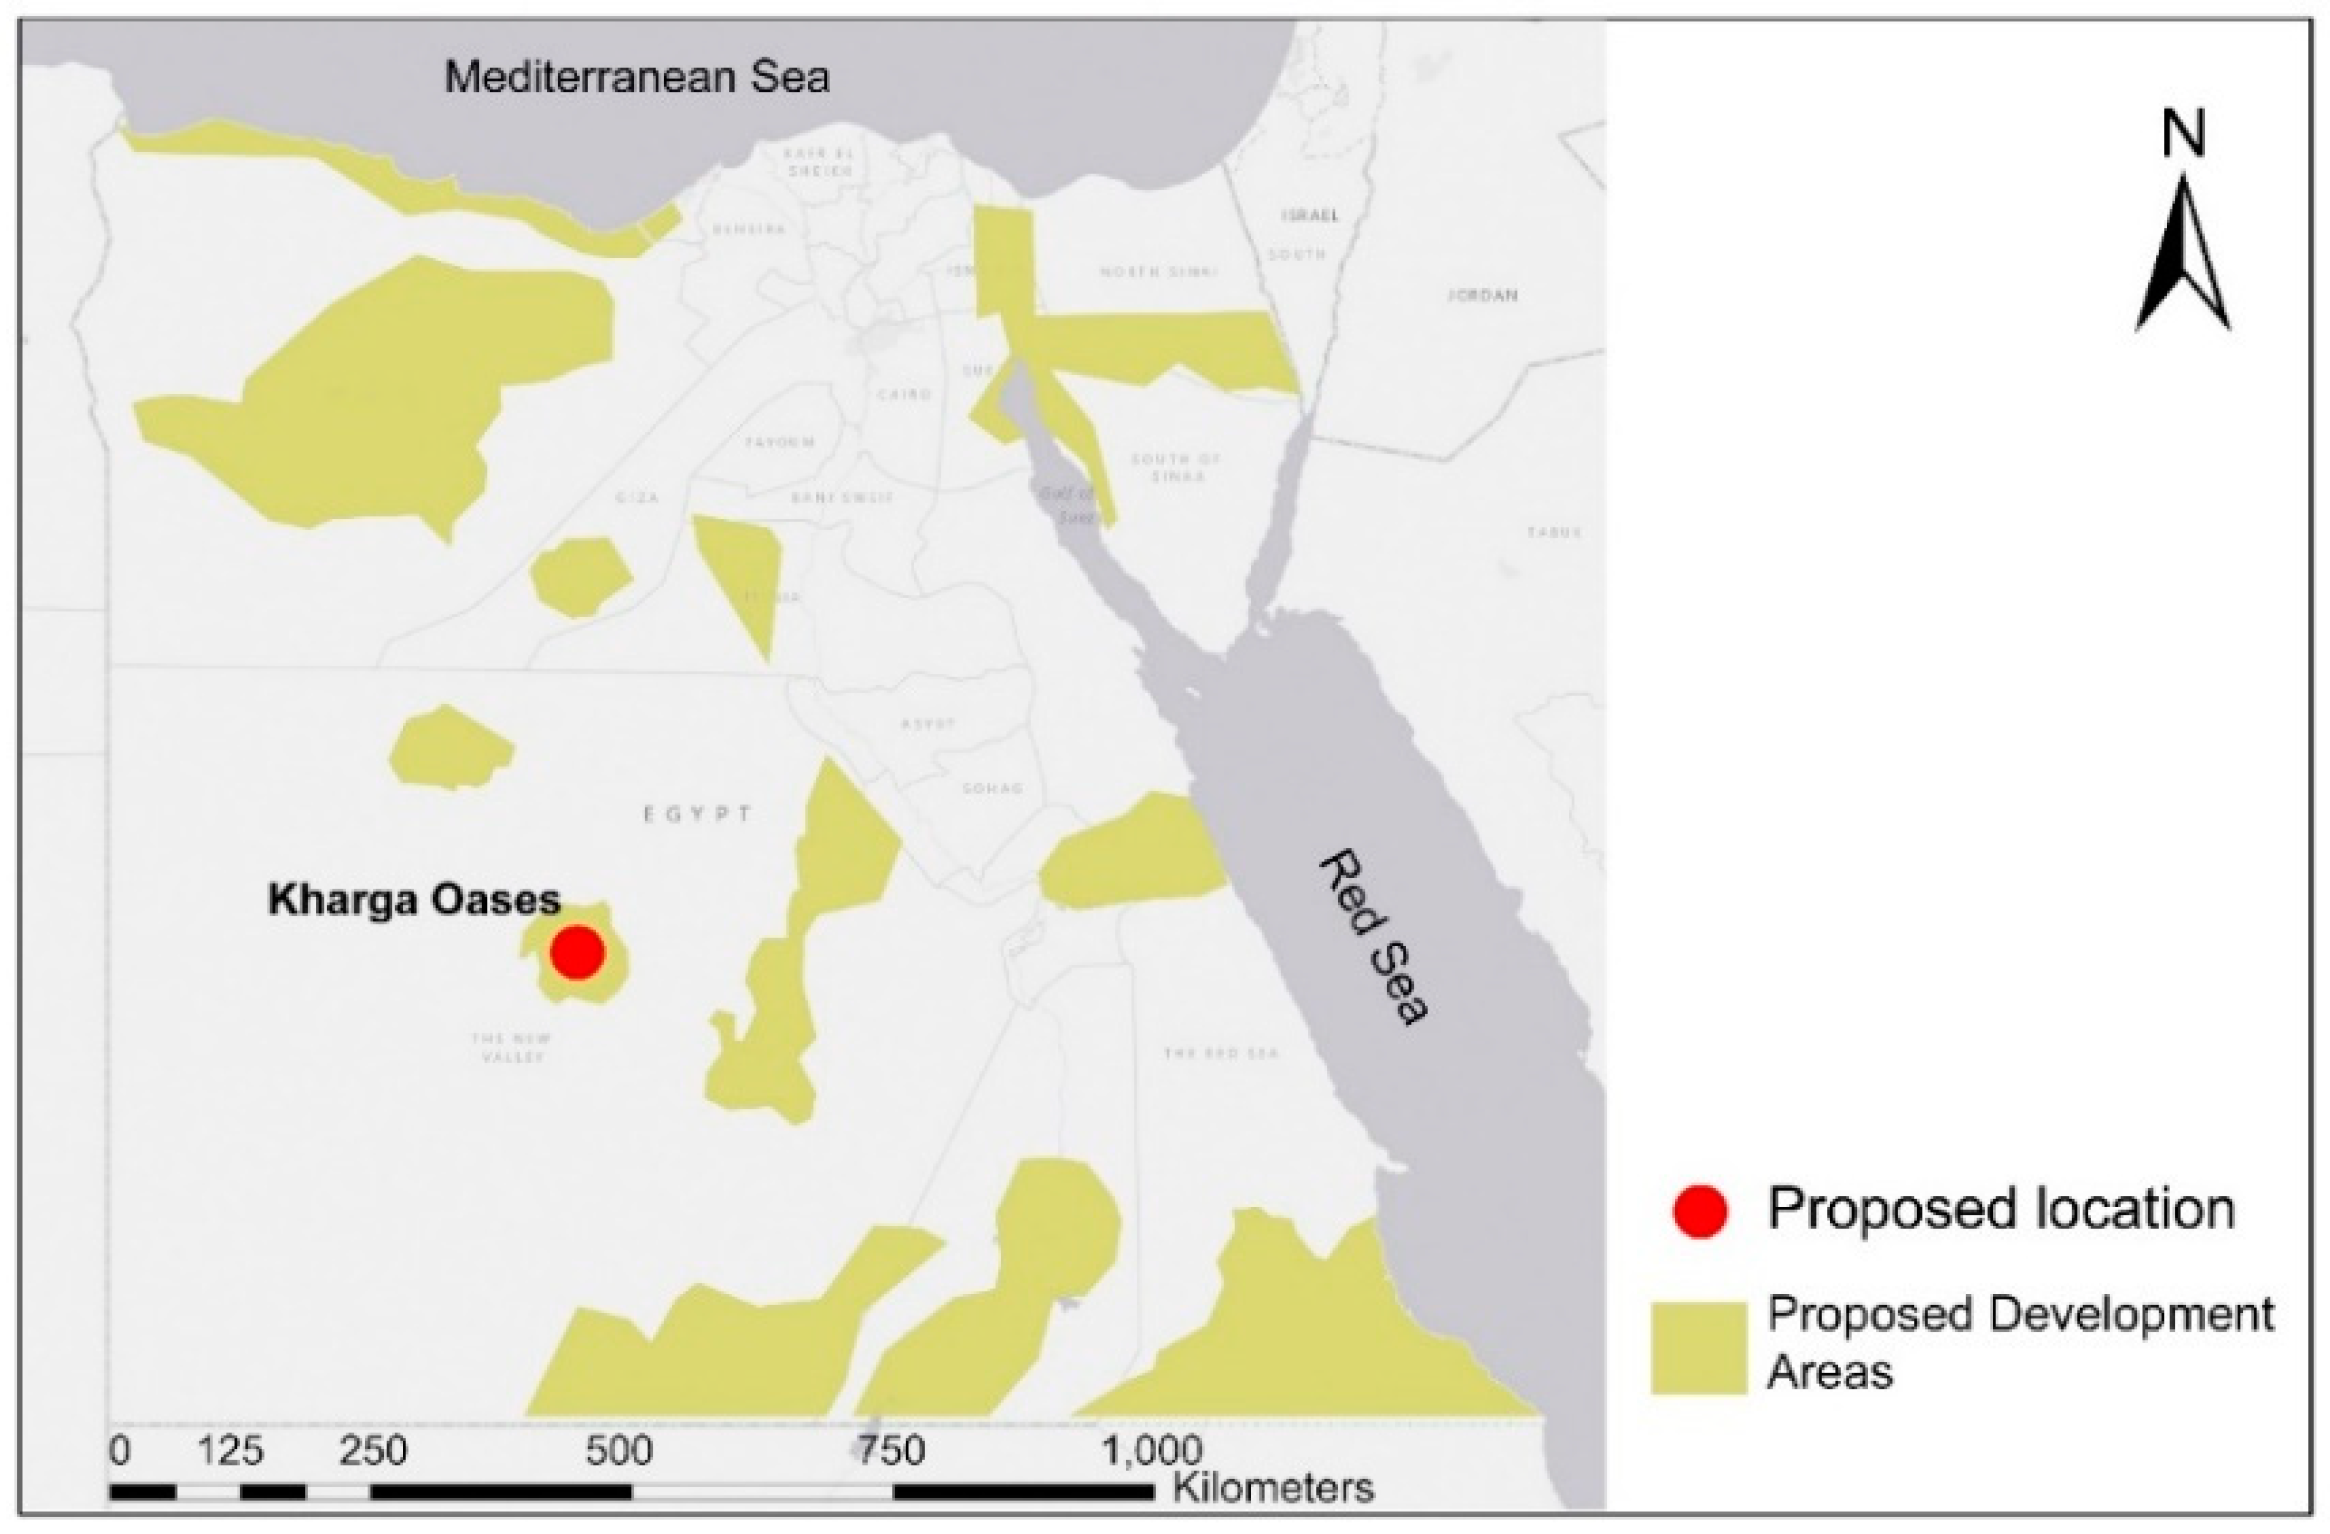
This research study discusses a comparison between the ventilation efficiency of an oil plant consisting of a number of machines operating at a capacity of 100 watts per cubic meter and located in Kharga Oases in the Western Desert of Egypt. The area’s climate is arid, with sporadic rainfall and hot temperatures during the summer months [
25]. The temperature occasionally approaches 50 °C and the mean monthly relative humidity ranges from 30% during the summer to 56% during the winter [
26]. Kharga Oases is included in the Egyptian state development plan to increase the inhabited and agricultural area, as shown in
Figure 3.
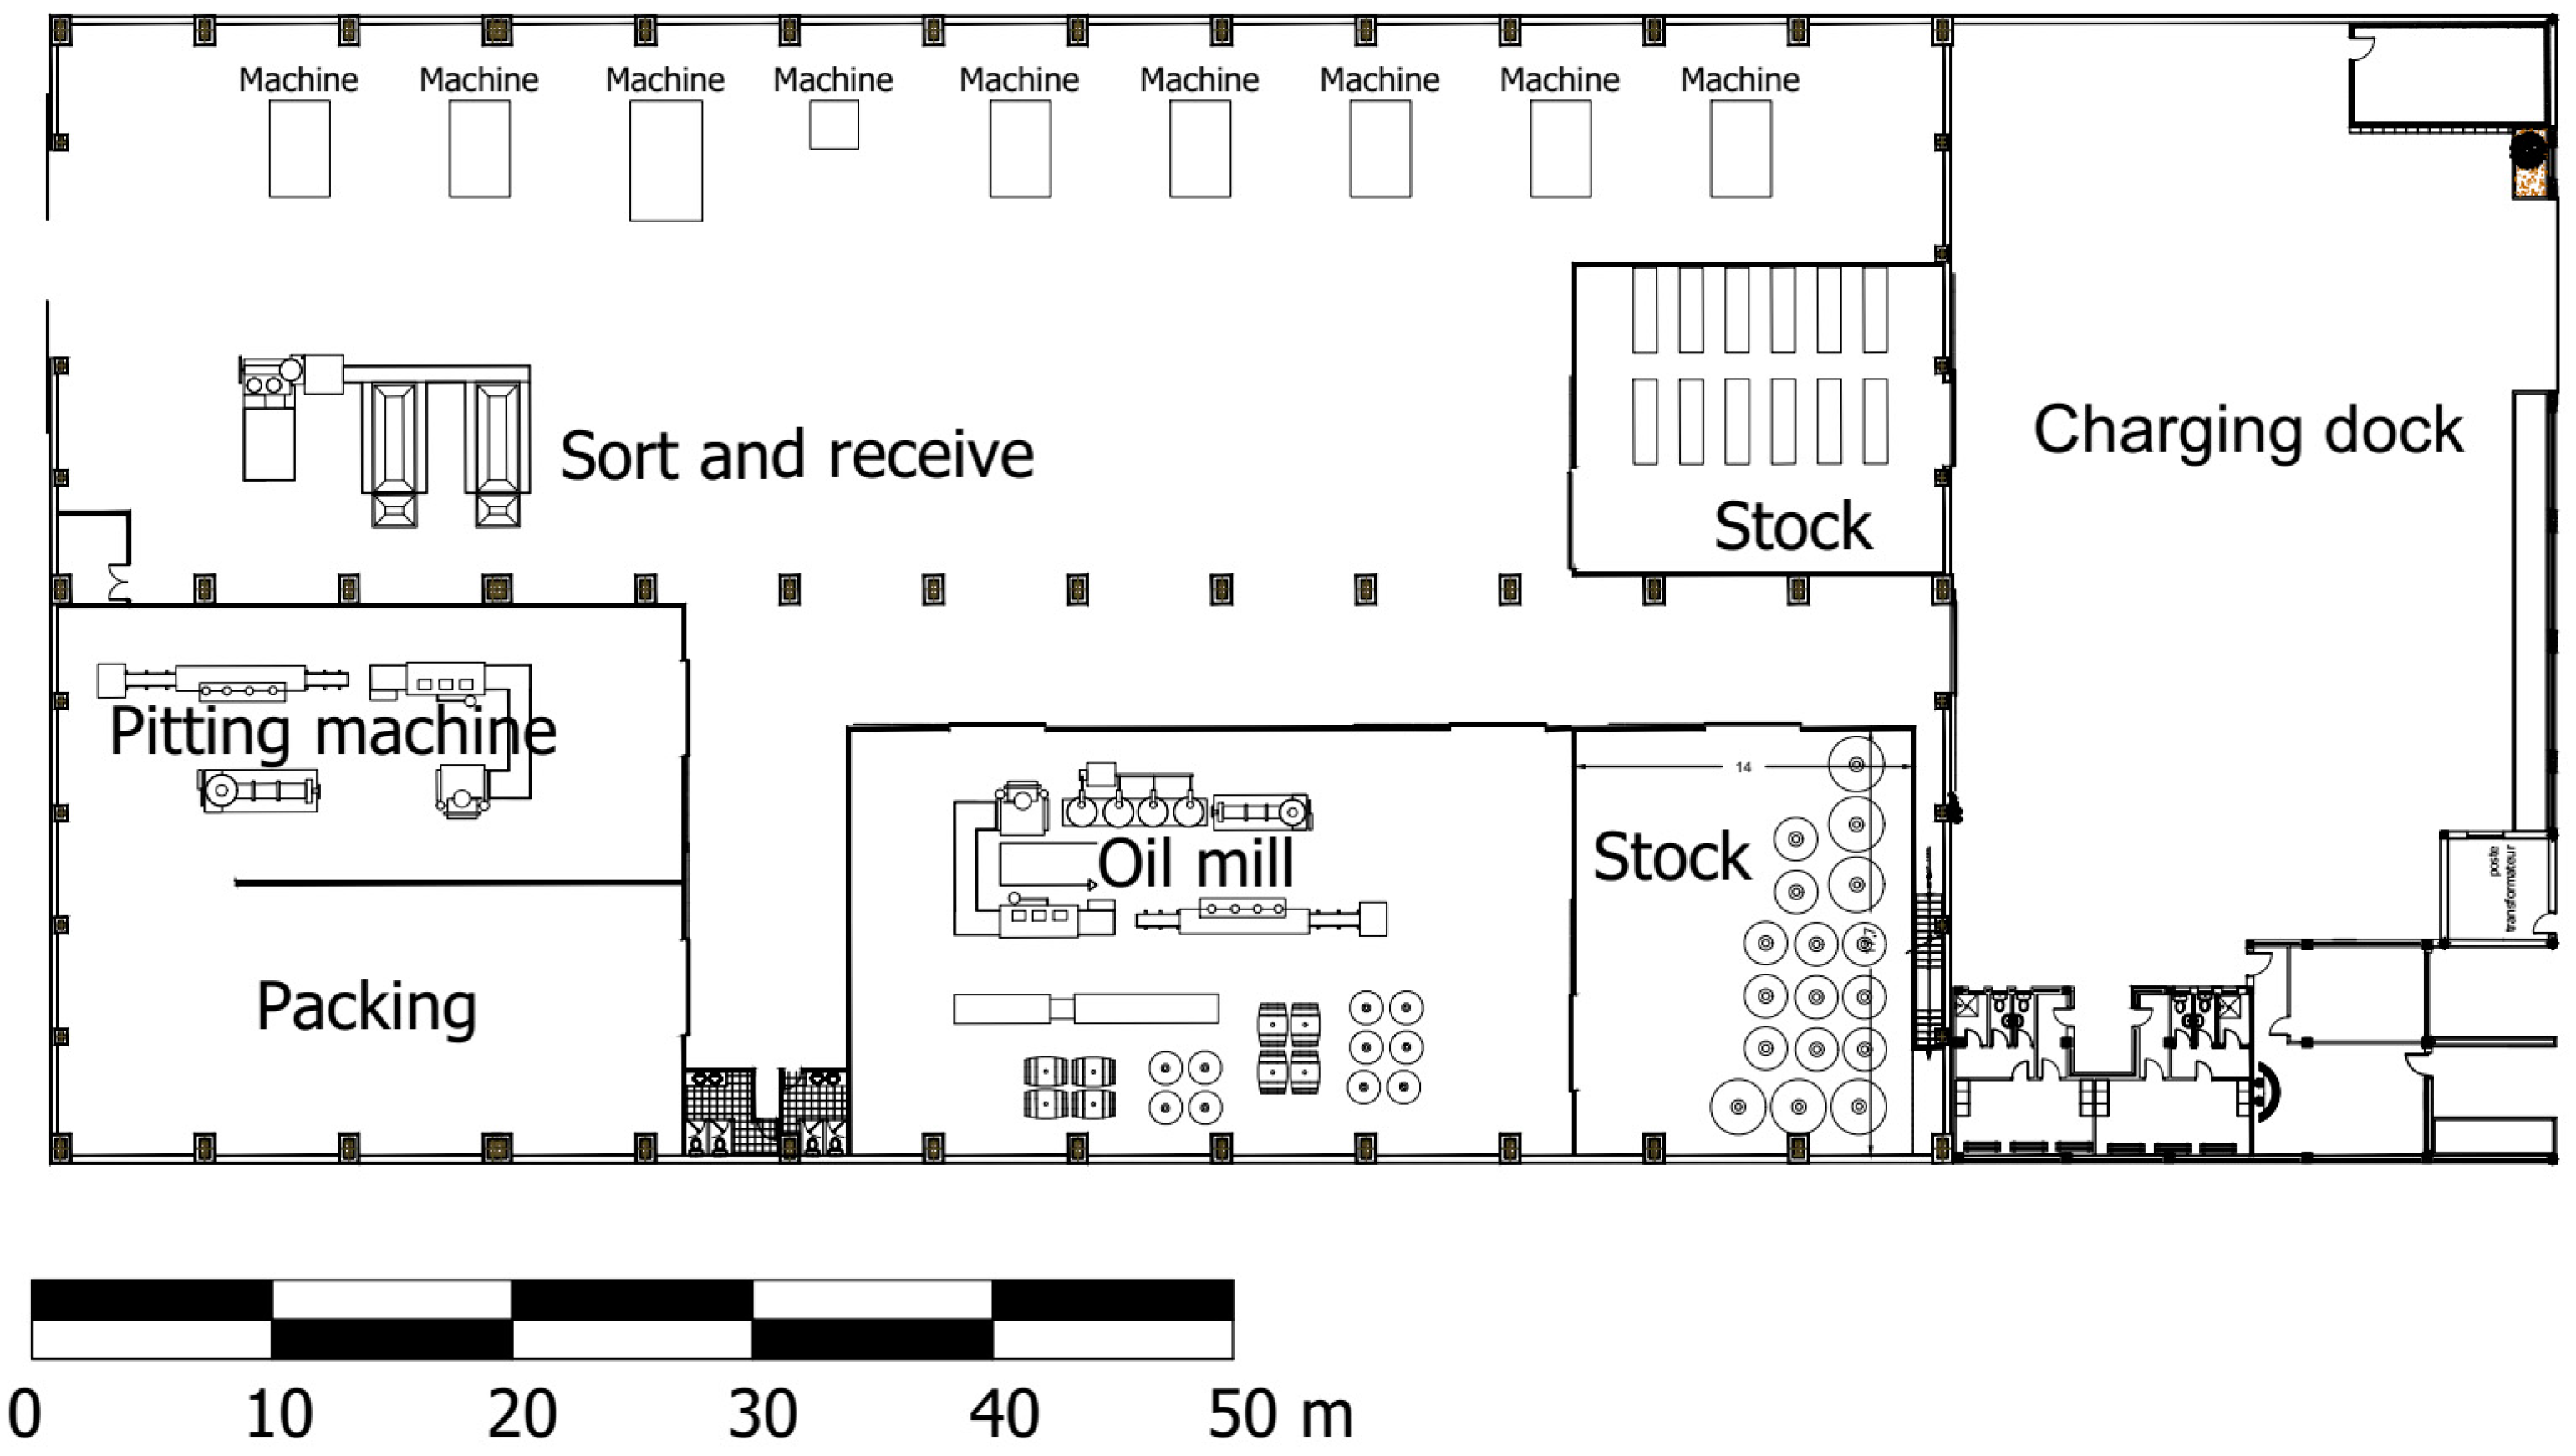
The case study factory building occupies a built area of 5000 m
2 and includes an industrial space with different workspaces and storage areas. In addition, there is a loading area and an administration building attached to the factory, as shown in
Figure 4.
The design of the three systems has been done according to the ASHRAE code (Smacna STANDARDS) and is compatible with the ventilation systems used in such buildings through experience in this field. Furthermore, the three designed systems aim to provide the appropriate indoor ventilation to achieve thermal comfort for the factory laboratories. According to ASHRAE, the aimed ventilation rate is 20 times per hour, whereas the arrangement of the fans and supply grills has been chosen according to experience in this field. The specification for each ventilation system has been reached, as indicated in
Table 1.
The first system (System A: wall fan extract ventilation) relies on the installation of exhaust wall fans at the height of three meters from the floor with a reciprocal distribution for the fans on both sides of the factory, which helps to improve the distribution of the ventilation space. Furthermore, natural air supply grills are additionally installed at the height of 0.5 m from the factory floor, with the sizes and numbers shown in
Table 1. Notably,
Figure 5 shows the installation method for the ventilation elements and illustrates the expected ventilation distribution through the adopted system: the air enters from the grills at a speed of 2.5 m/s and the velocity wall exhaust fans reach 6000 rpm.
Meanwhile, the second system (System B: roof fan extract ventilation) relies on the installation of extraction fans in the ceiling, which can improve the distribution of the air inside the space by simulating natural ventilation. Furthermore, natural air supply grills are installed at the height of 0.5 m from the factory floor, with the sizes and numbers shown in
Table 1 and
Figure 1 indicating the installation method for the ventilation elements, as well as the expected ventilation distribution through the adopted system. The specification of the grills and fans are the same as the first system.
The third system (System C: spot cooling) is based on the use of the fan sections connected to the ducks that extend the factory space’s length, with every duct being equipped with output nozzles with an outer diameter of 10 ft, which focus on the machine’s areas as the source of the heating to transmit a temperature of about 20 °C, considering that the air did not enter from the entrance doors. Notably, the fans and ducks were installed (sizes and numbers shown in
Table 1, with
Figure 4 showing the installation method for the ventilation elements and illustrating the expected ventilation distribution through the adopted system).
3.2. Simulation Method and Weather Conditions
The numerical simulation in this study has been conducted using a commercial CFD program (ANSYS Fluent) to utilize the finite volume method under steady-state conditions. Furthermore, the investigation used the Reynolds-averaged Navier Stokes equations with the renormalization group RNG k–ε model for modeling turbulent flow and the equations being discretized with the second-order upwind scheme. The pressure and velocity were coupled by the SIMPLE algorithm. See the data in
Table 2 for the weather conditions. Most of the time, the model reached a quasi-stable state after 4000–5000 iterations.
4. Simulation Results
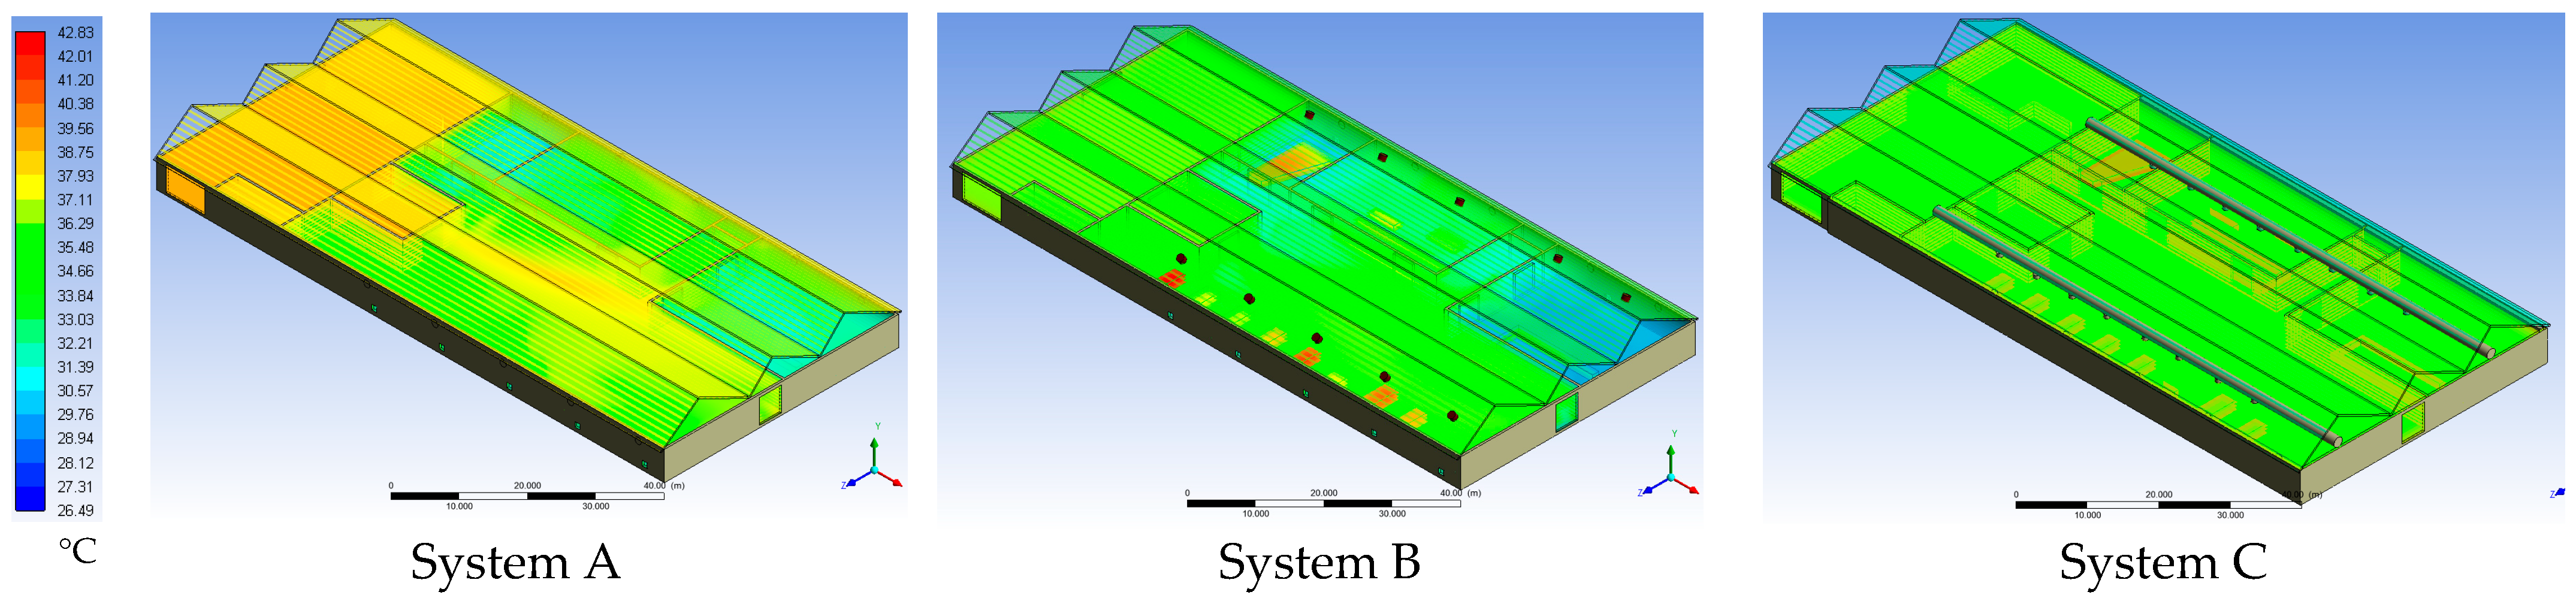
According to the CFD simulations for the three systems, the temperature disruption and airflow velocity have been conducted to compare these systems and identify the most suitable system for the provision of a suitable work environment and for the reduction of energy consumption. Notably, the temperature disruption in the space for different systems has been conducted using the CFD model, as shown in
Figure 6 and
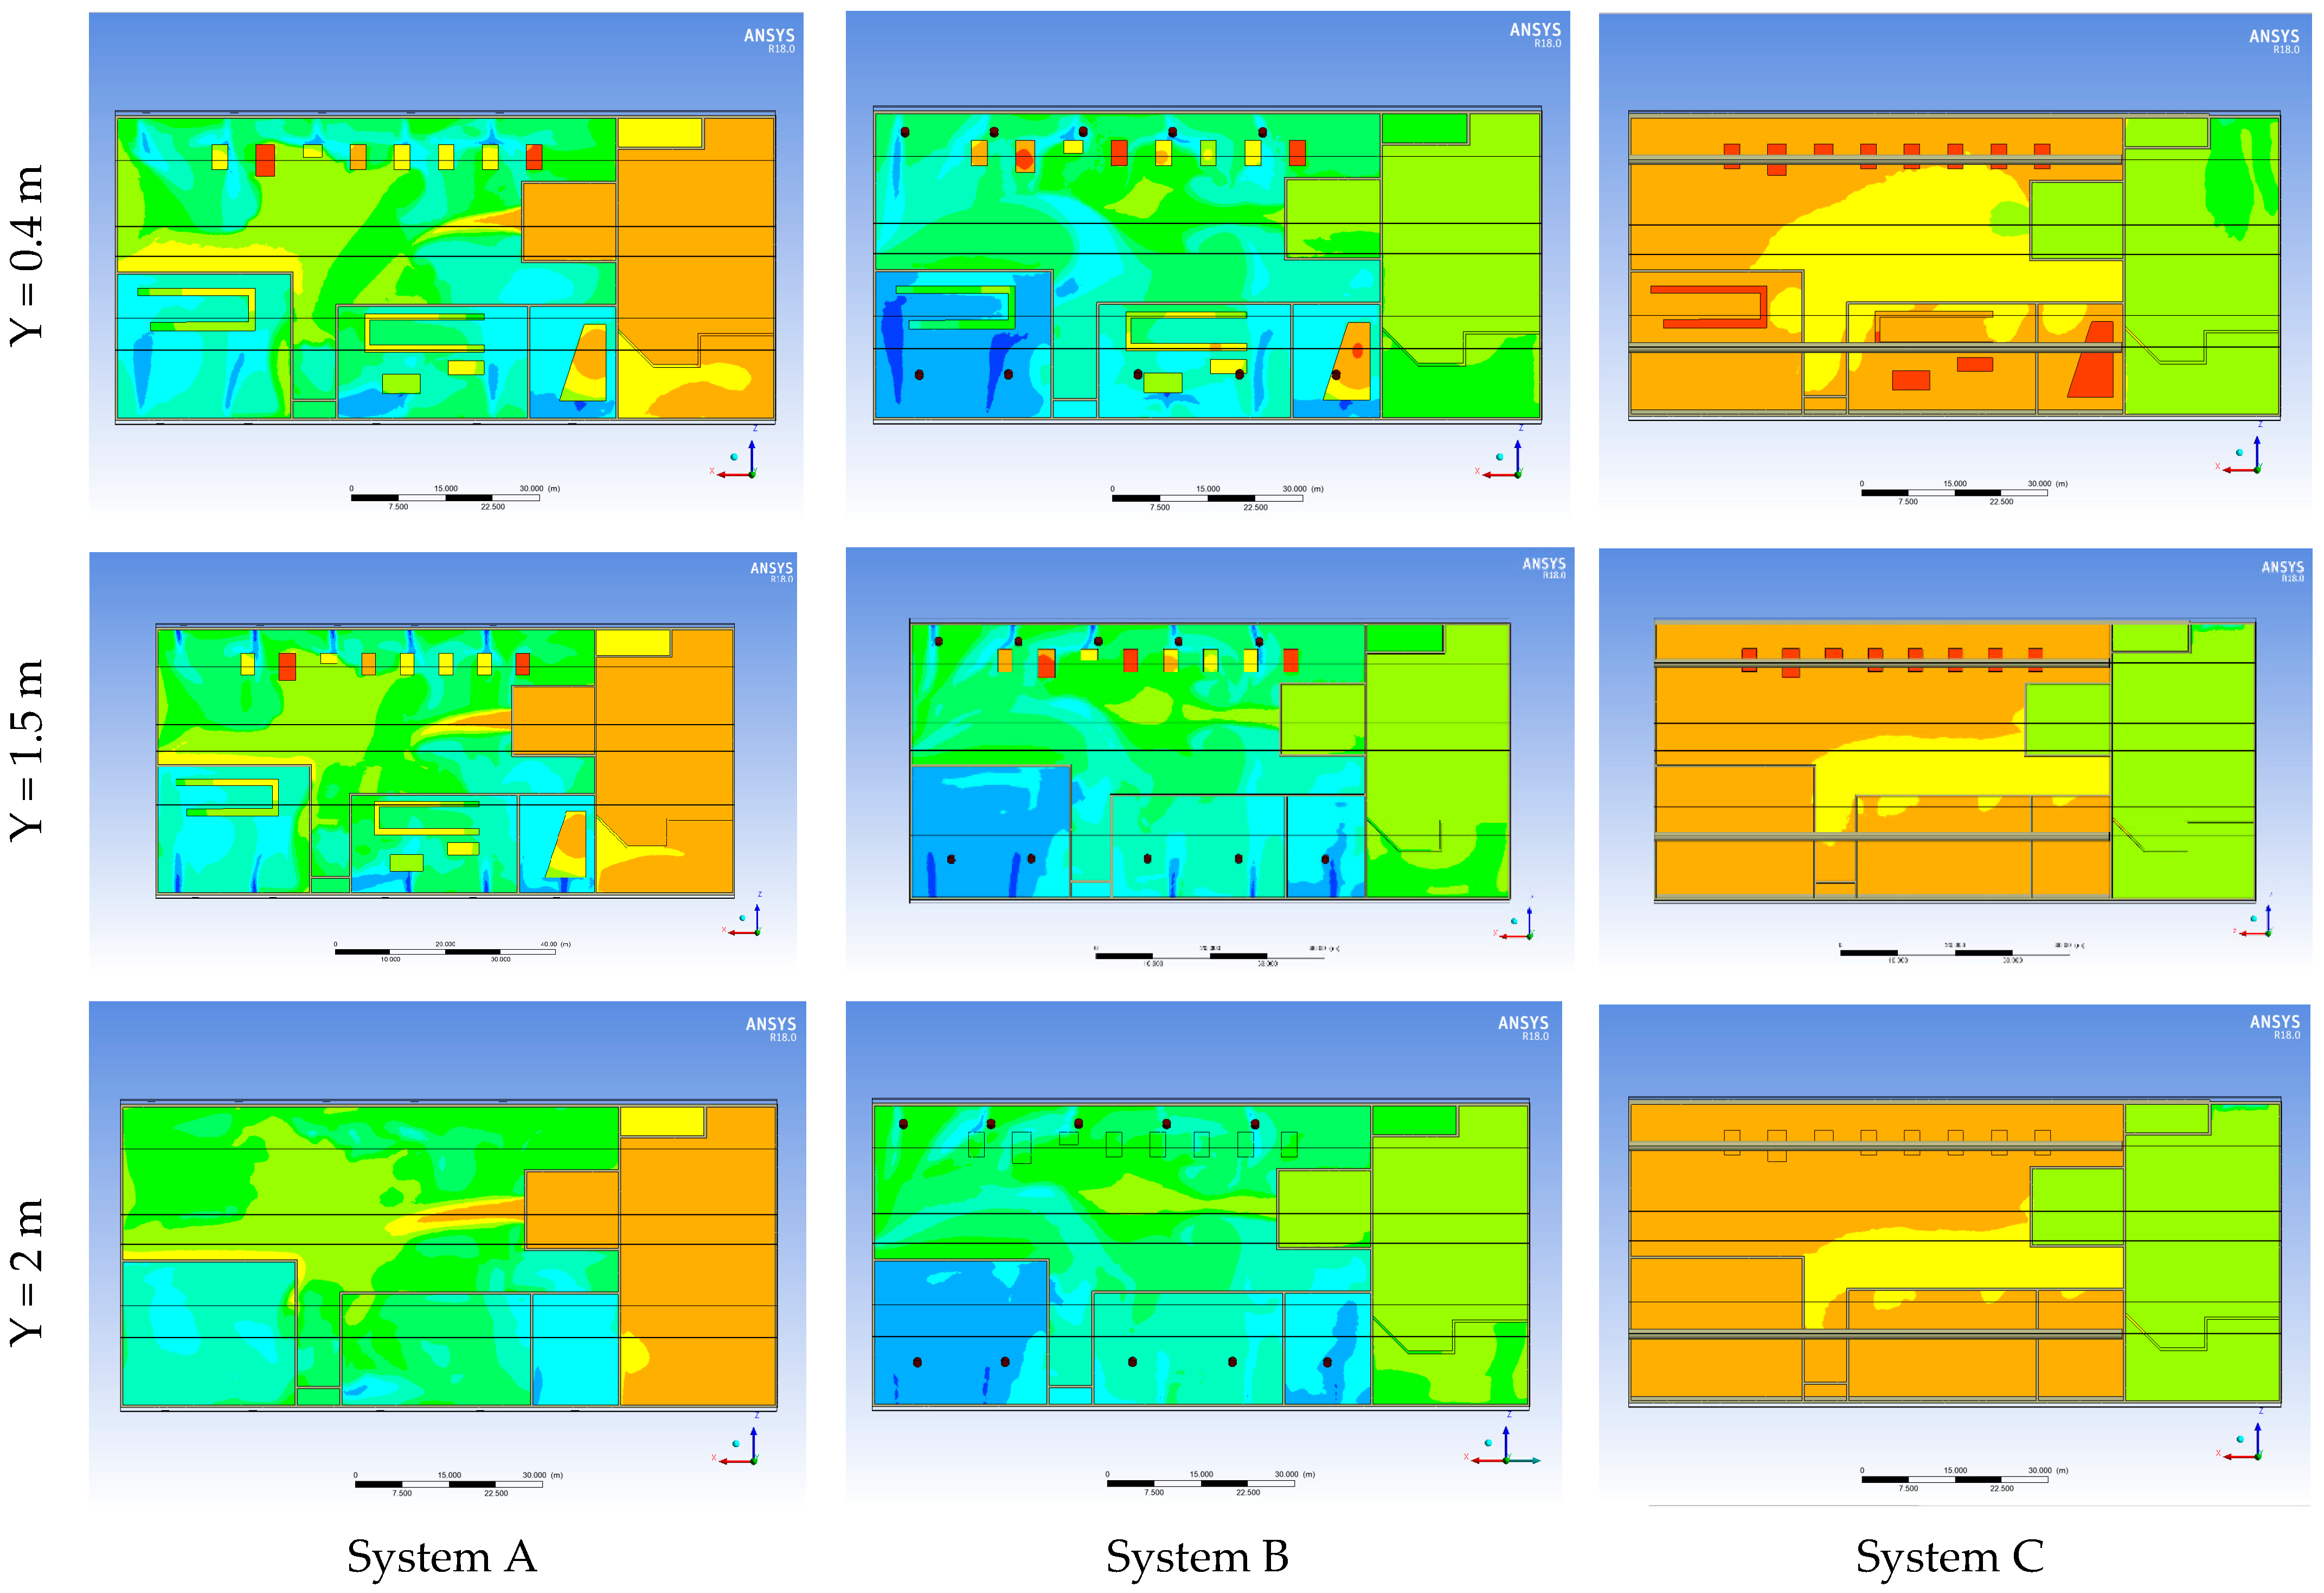
Figure 7, with the temperature volume rendered in the former revealing that for systems A and B, there was a variation in the temperature between the parts of the working area. Although some areas had a low temperature, there were other areas that recorded a high temperature. According to System C, the temperature volume rendering the homogeneity in the temperature had fairly good records over the entire factory area.
Figure 7 shows the temperature contour plan for the levels 0.4 m and 2 m, ensuring the observation in temperature volume rendering.
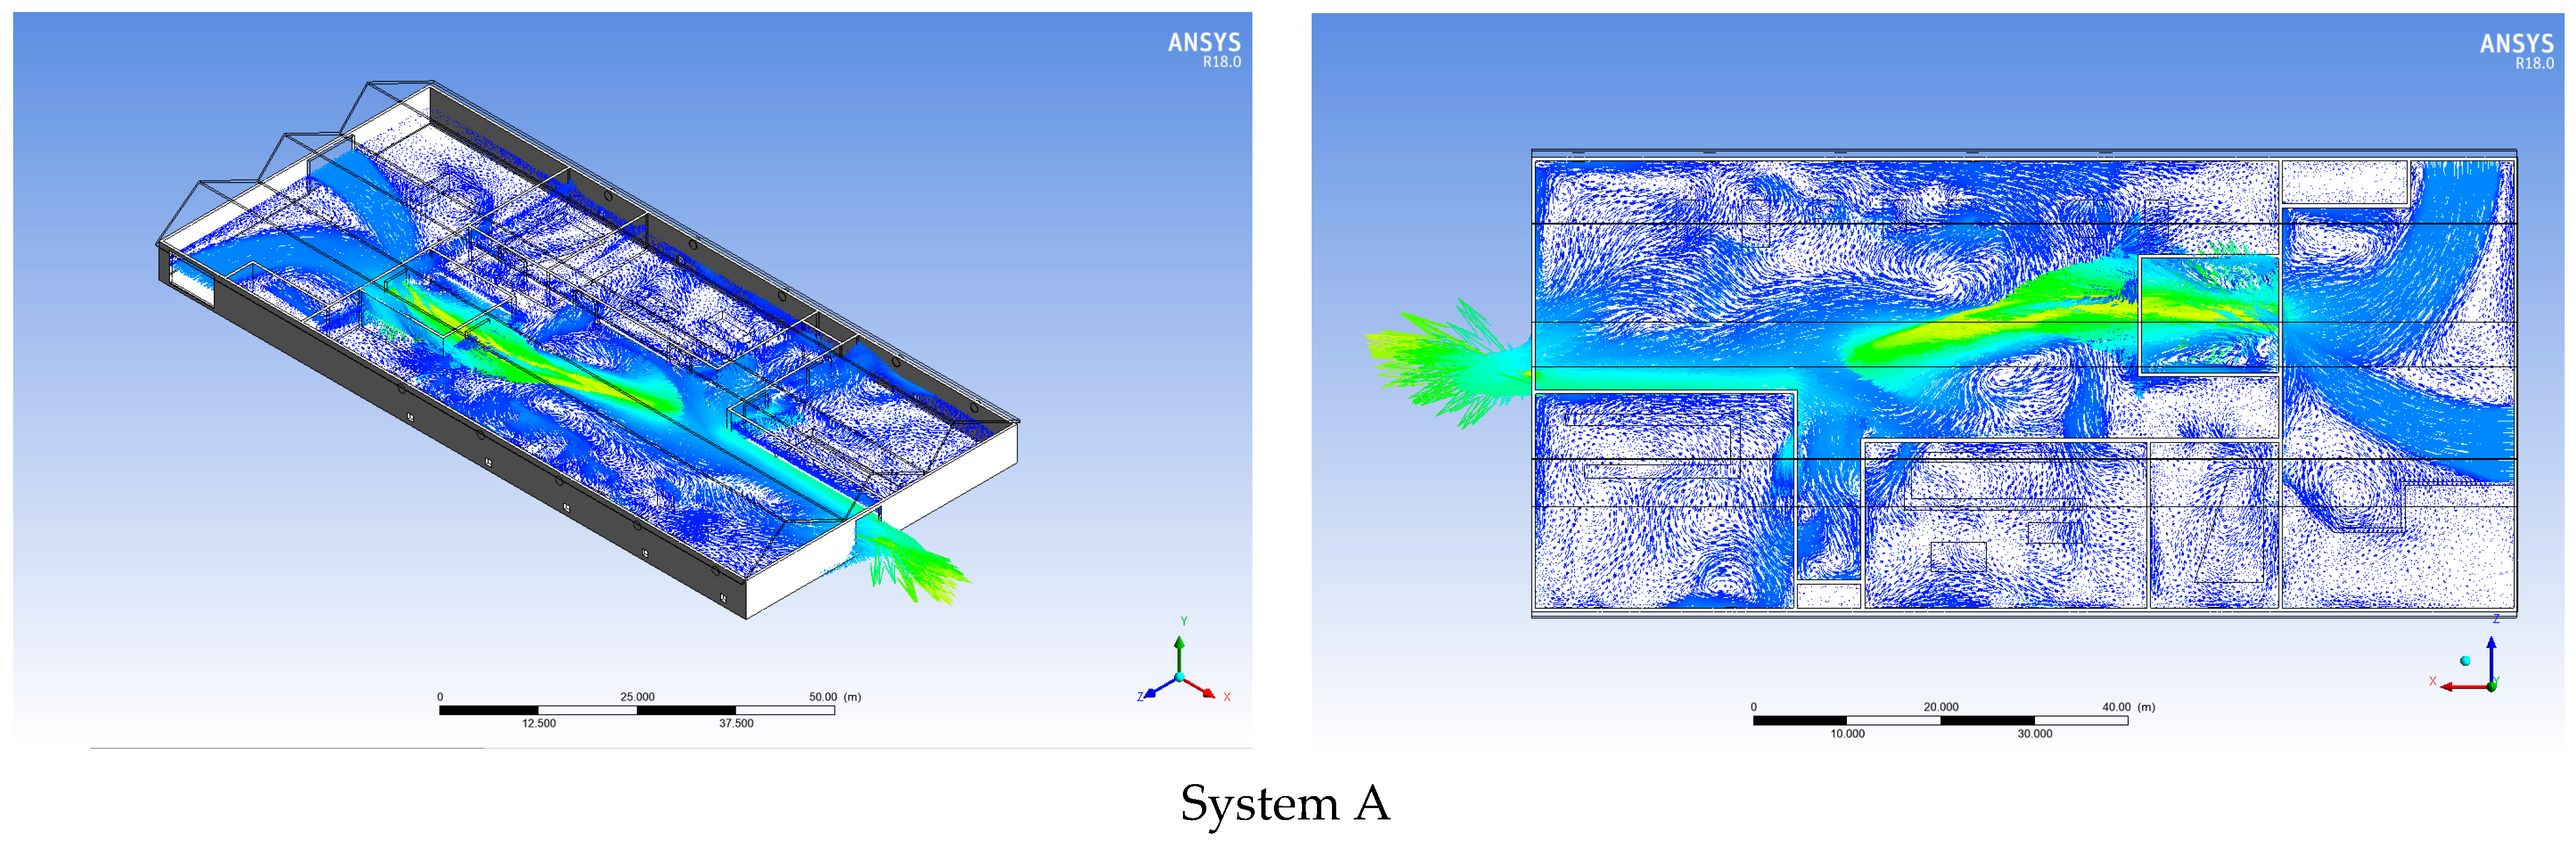
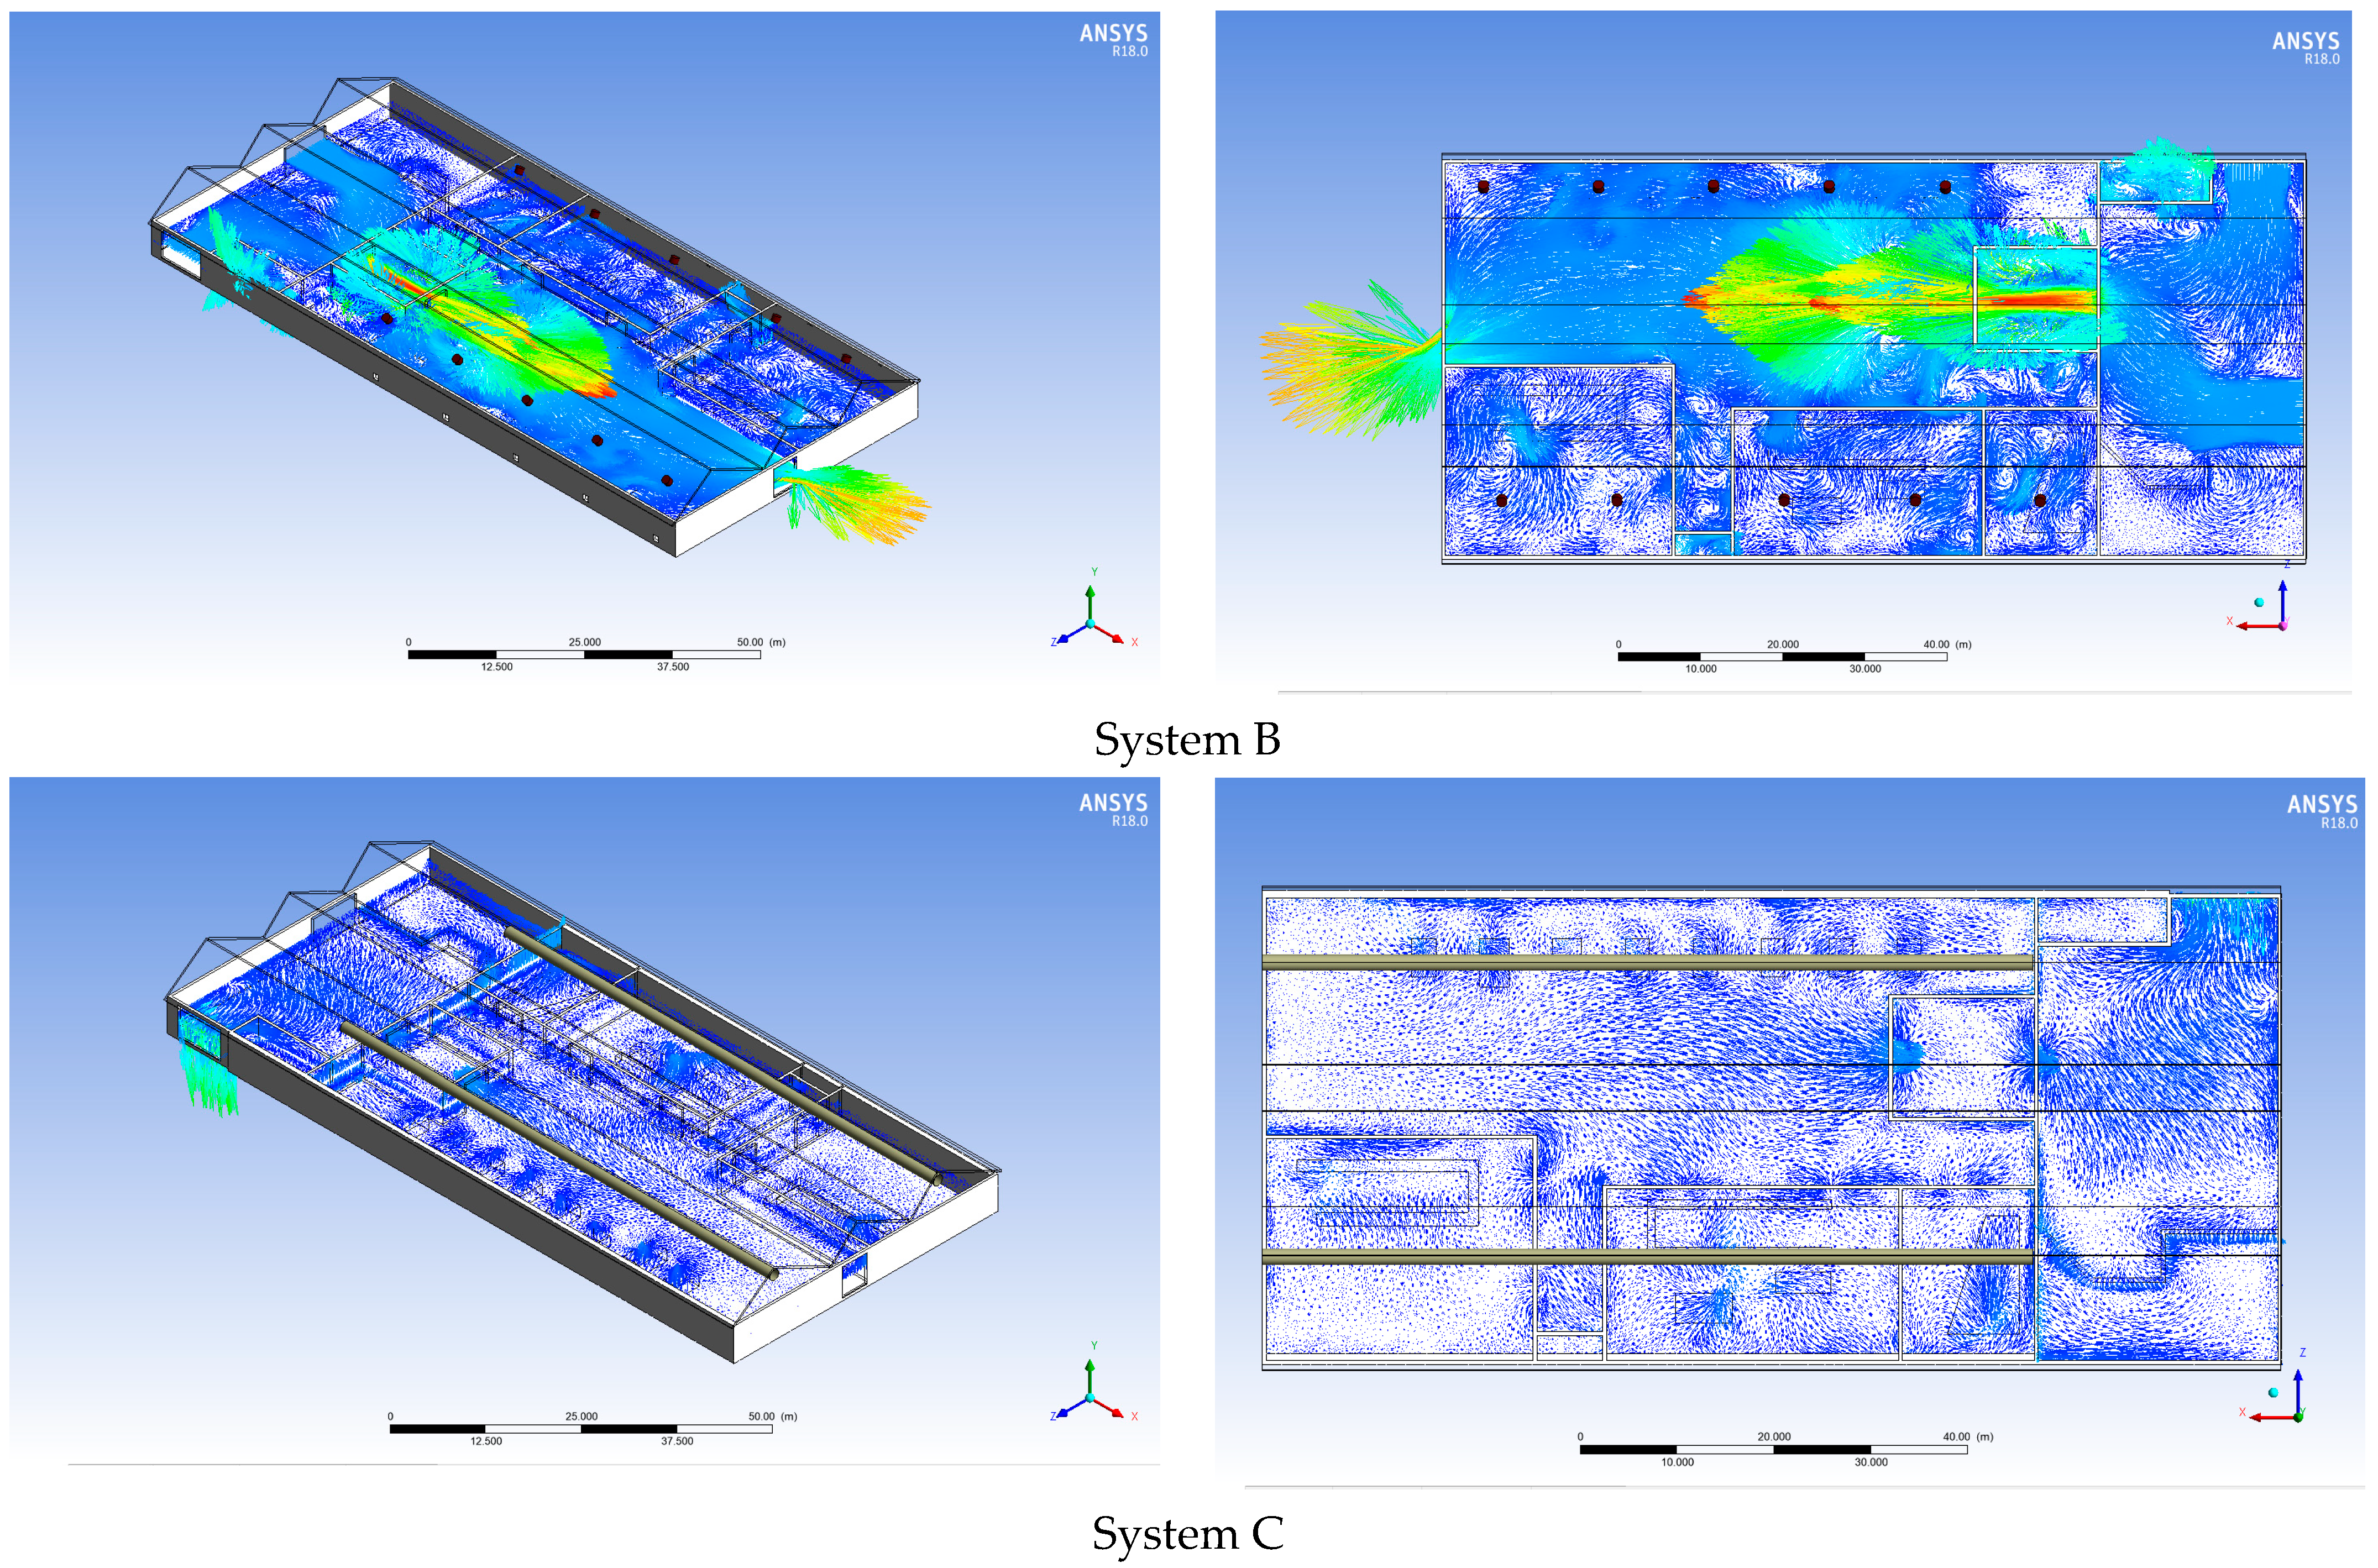
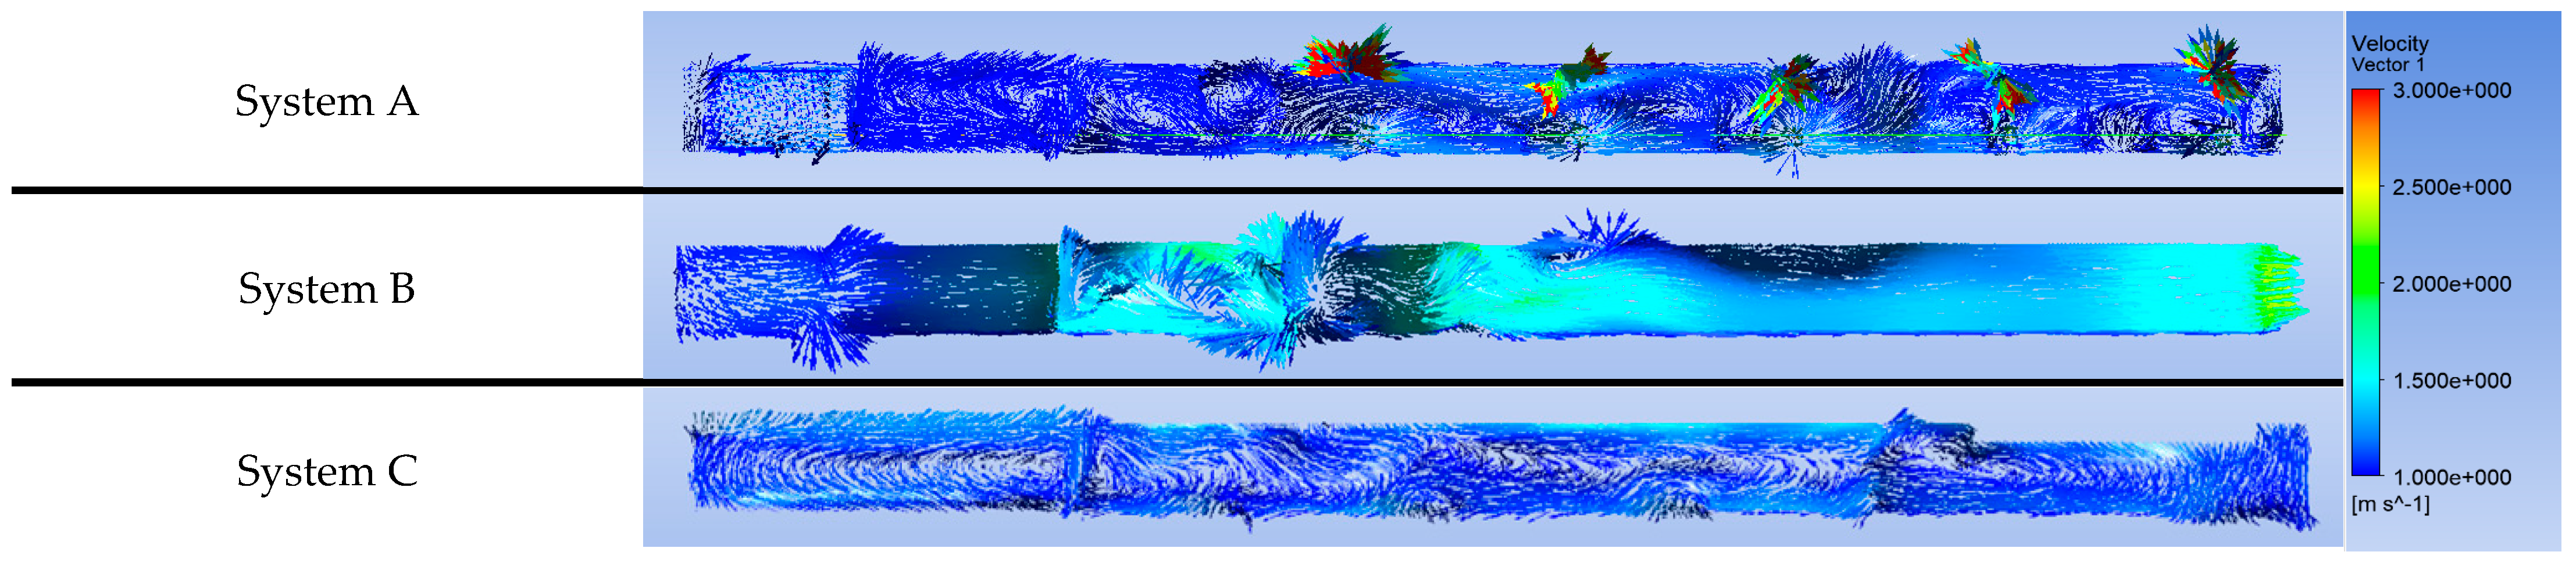
Furthermore,
Figure 8 and
Figure 9 show the airflow velocity distribution in the factory space, with that in the former showing the air velocity distribution for Systems A and B as possessing a wide range variety, in turn causing a high velocity in some areas and low velocity in others. Meanwhile, System C shows a uniform distribution of air velocity over the entire factory space. These observations are also ensured in the ventilation velocity cross-section in
Figure 9.
5. Discussion
After obtaining the simulation result, different investigations have been adopted to compare the different ventilation systems. For investigating the thermal comfort for the different systems, the Fagner equation has been used by considering the ambient air temperature, mean radiant temperature, and relative air velocity for different cases. In addition to assuming that the metabolic energy production was 2.2 met, the relative humidity was 50% and the basic clothing insulation was 1 clo. The predicted mean vote (PMV) and predicted percentage dissatisfied (PPD) have been calculated as shown in
Table 3.
According to Fagner’s values of the thermal sensation in
Table 4, the PMV values for the first two cases lay between slightly warm and warm sensations, whereas in the case of system C, the value lies between cool and slightly cool sensations.
In addition to thermal comfort investigation, the ventilation systems’ performance in the factory has been investigated using the ventilation effectiveness factor (VEF), as shown in the following equations.
Ventilation factor:
where
To is the output temperature outside the space,
Ti is the input temperature inside the space, and
Tavg is the average temperature in the space.
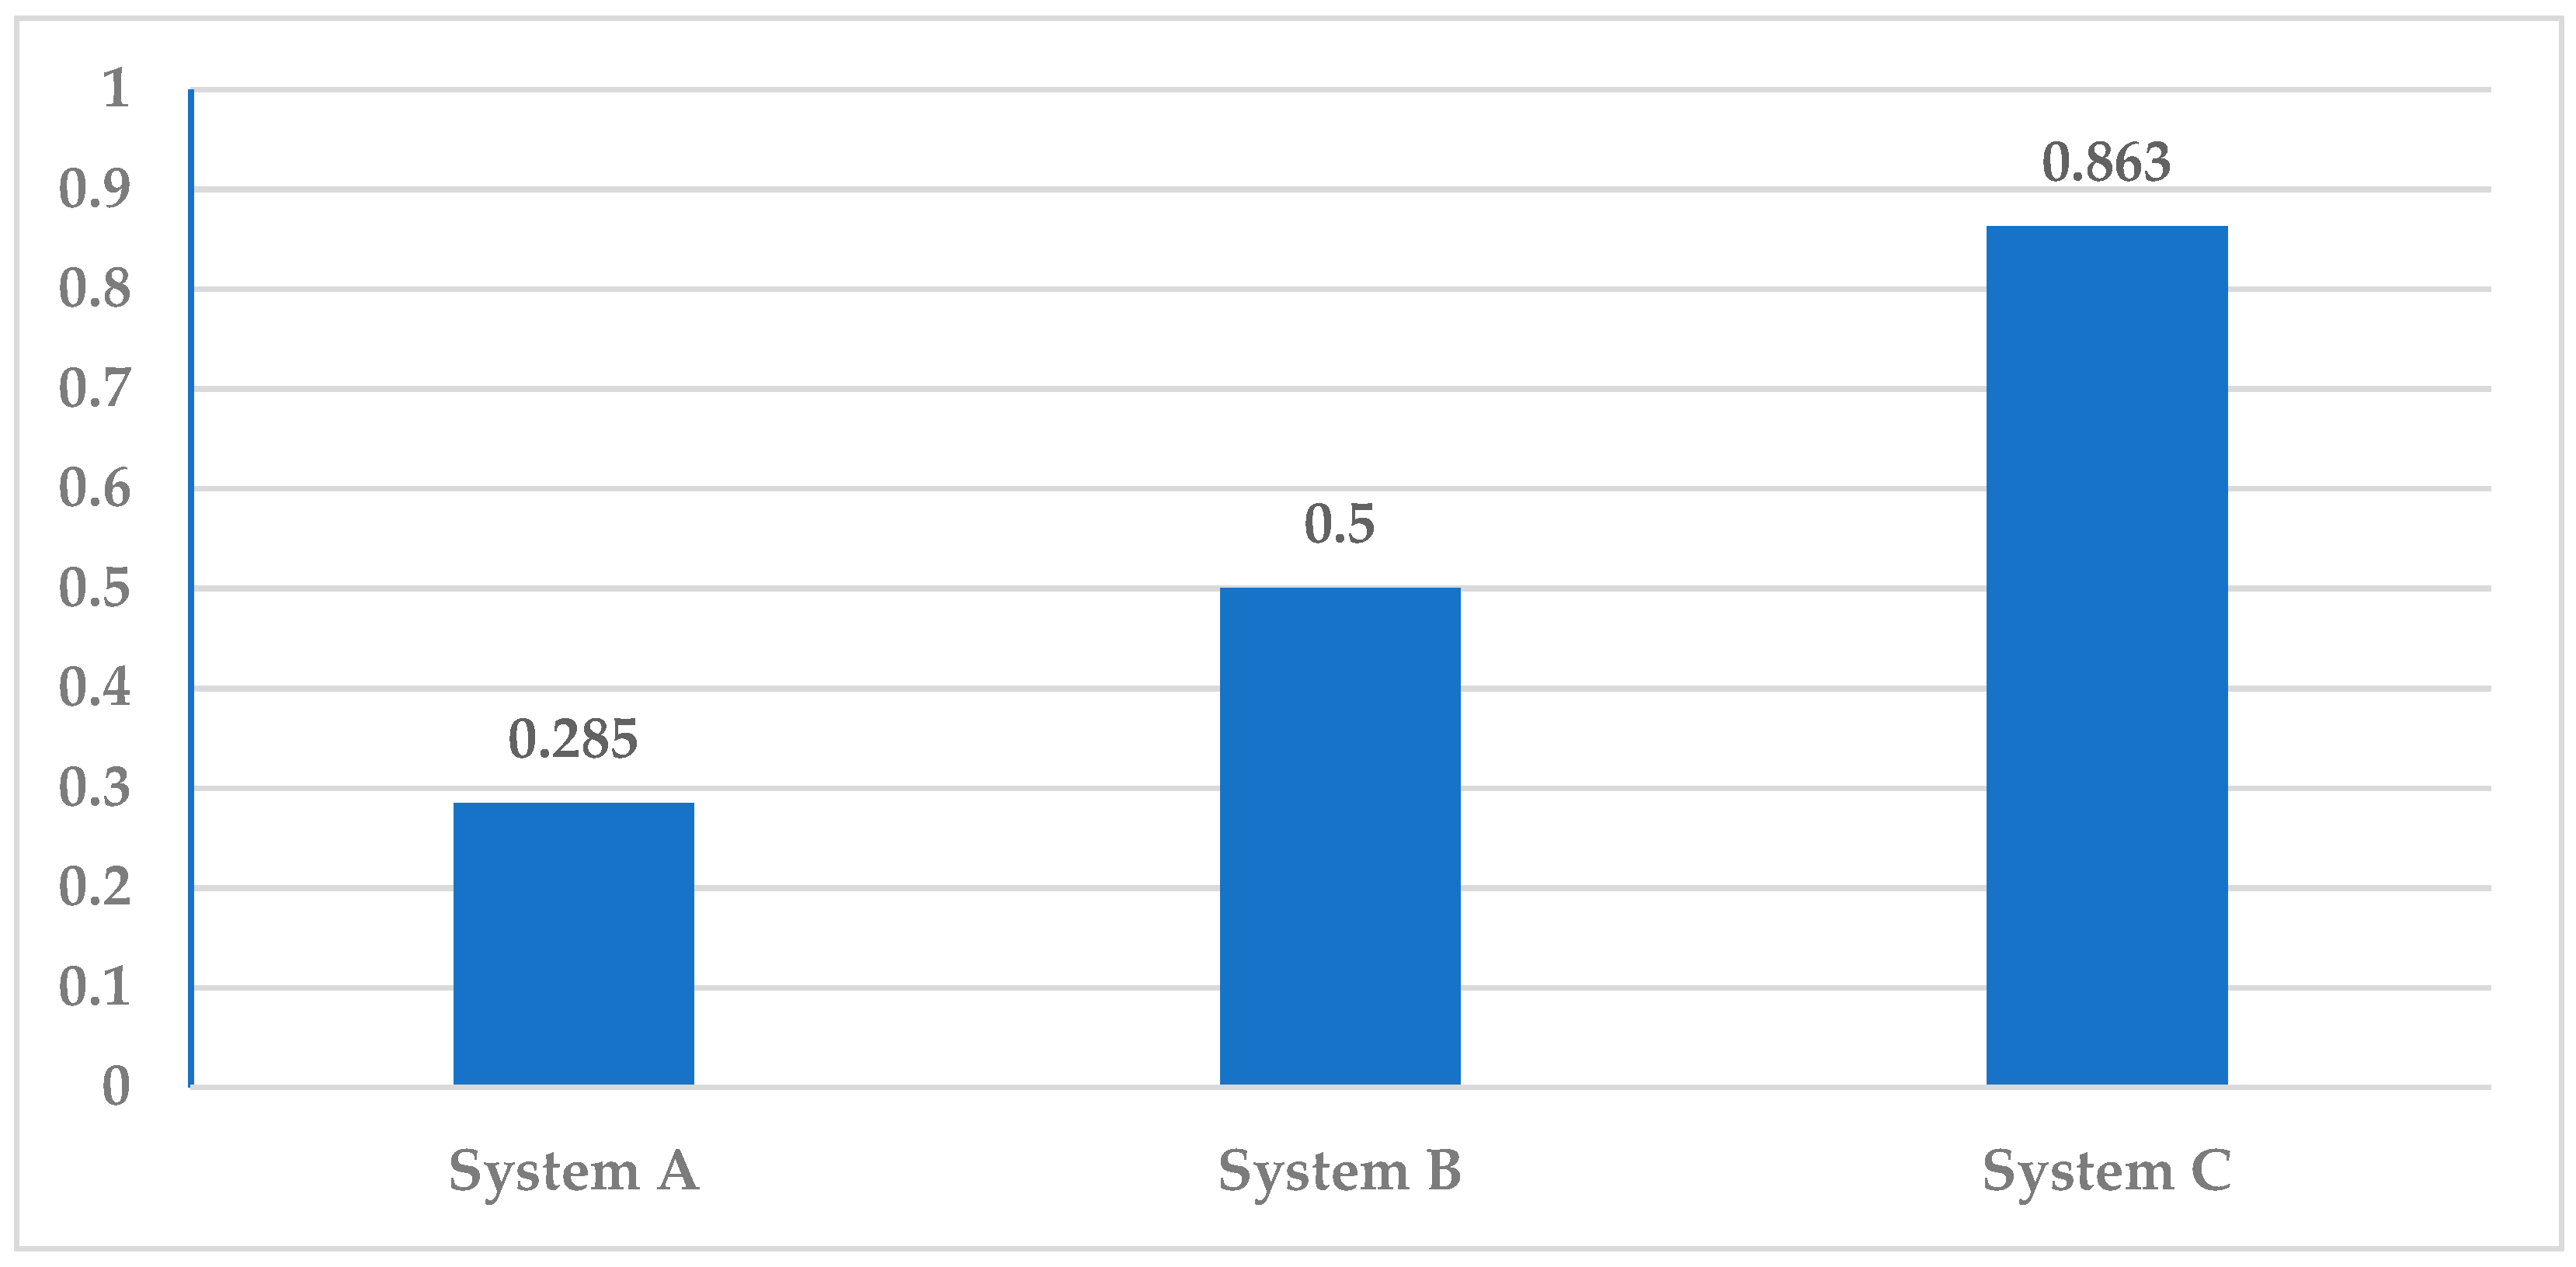
The ventilation effectiveness factor comparison for the three systems (
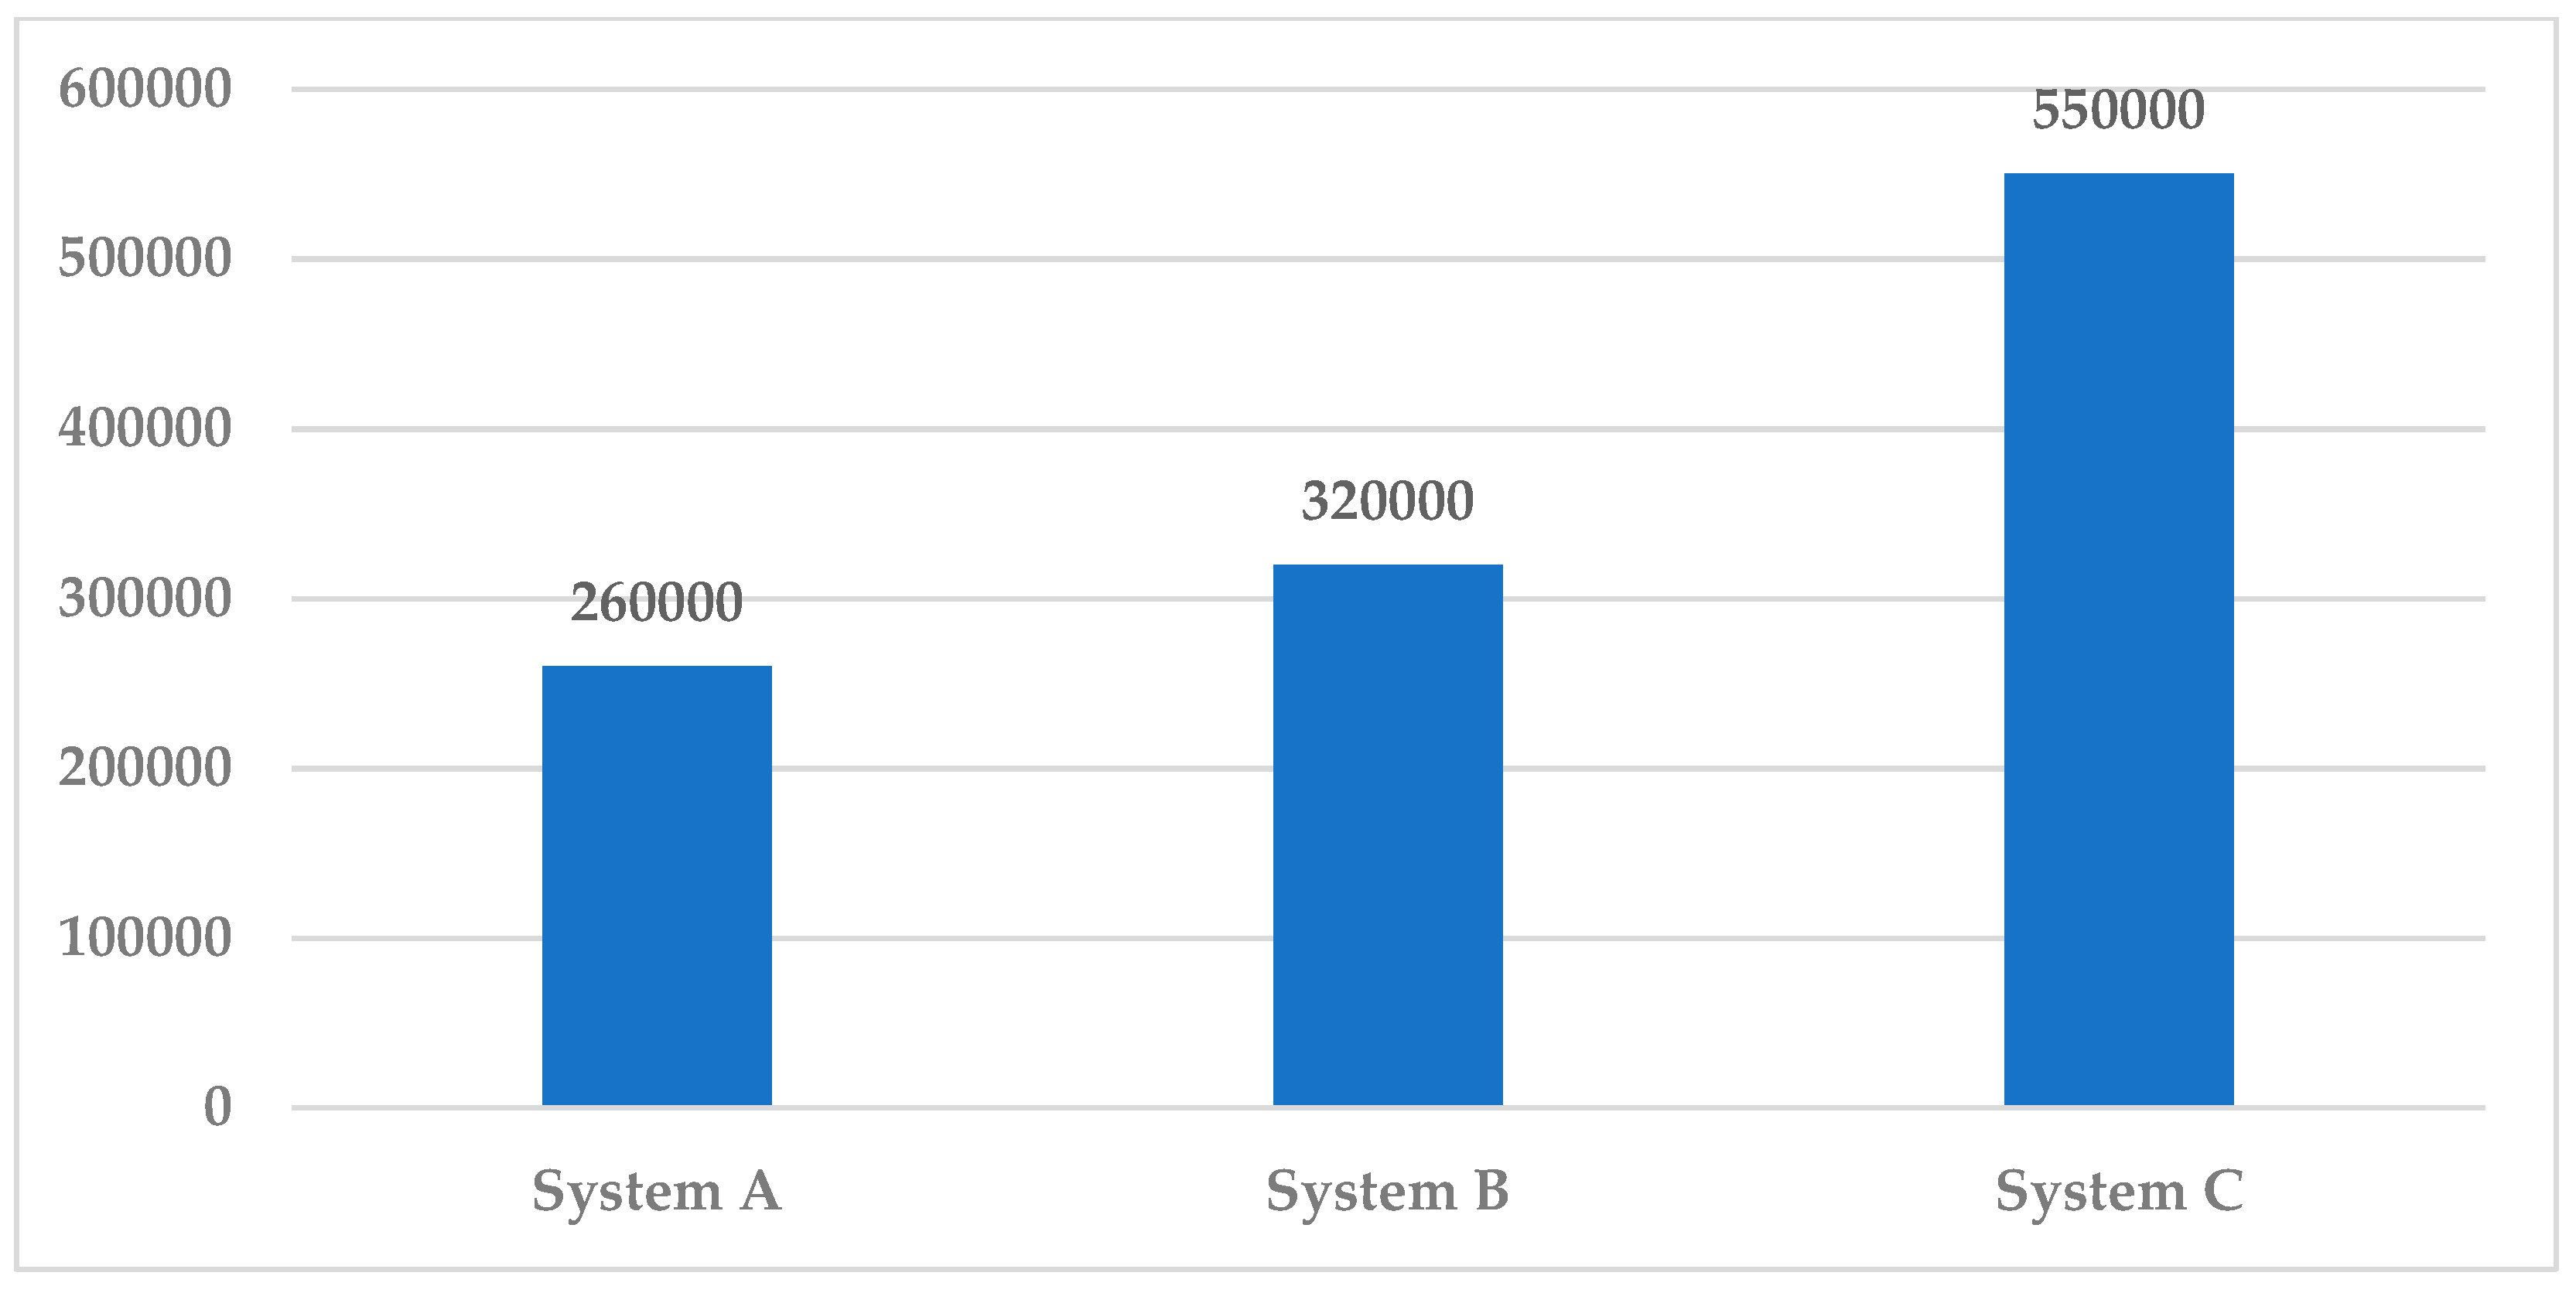
Figure 10) reveals that the most effective ventilation system is System C, which represents the spot cooling system. Furthermore, an economic comparison has been conducted between the three systems, as shown in
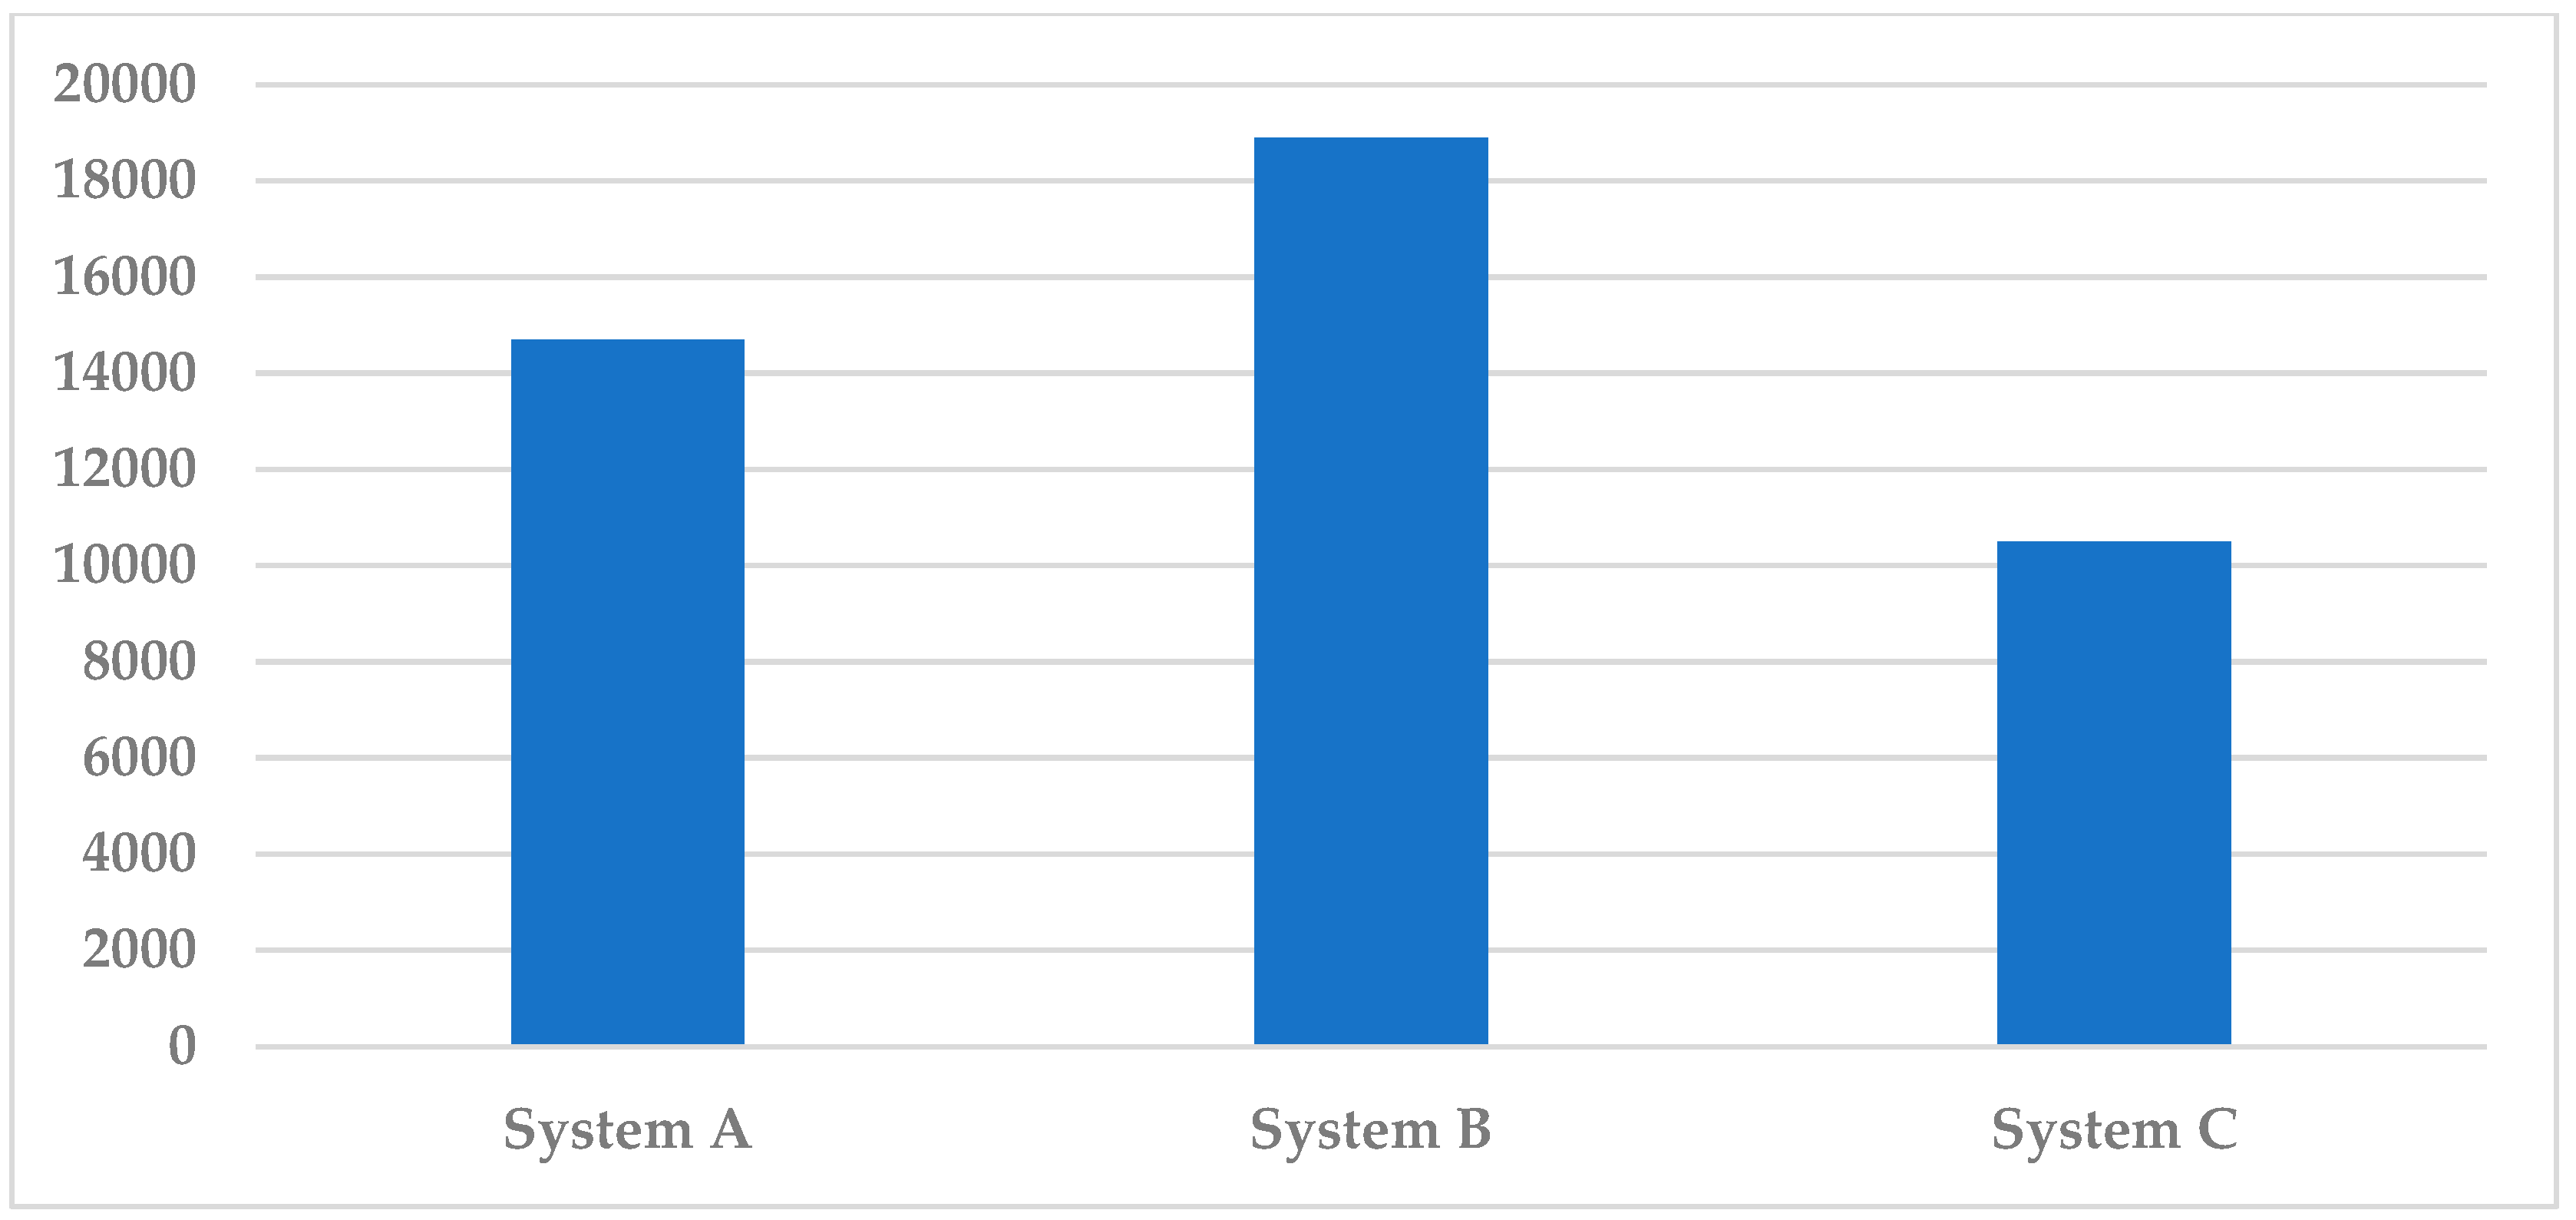
Figure 11 and
Figure 12, with the former illustrating the initial cost for the different systems. This reveals that the most expensive system is C, while the cheapest is System A, which explains the preference of most investors to use System A in factories. Meanwhile,
Figure 12 shows the annual energy consumption costs for the different systems, revealing that the most energy-saving system is System C. The energy consumption cost was conducted by estimating that the kWh costs EGP 1.15 for business use according to [
28].
Accordingly, this study found that using System C (the spot cooling system) could be the most effective in terms of its ventilation effectiveness, thermal comfort for workers, and energy consumption. Although the initial cost for System C is higher than the others, this cost could be compensated for by the higher productivity of the workers due to the provided thermal comfort and reduction of energy consumption. According to the literature, the spot cooling system is one of the most efficient ventilation systems due to the concentration of the air nozzles on the heating source, establishing it the most energy-efficient ventilation system [
27], which complies with the result in this research study.
6. Conclusions
The feasibility of the study of industrial building ventilation systems is a crucial step for ensuring the use of the most effective system in terms of providing a suitable work environment and reducing energy consumption. Indeed, traditional ventilation systems are the most commonly used in Egyptian industrial buildings due to their low initial costs and ease of installation. However, according to the type of industry and weather conditions, the chosen ventilation system should provide the most effective ventilation and ensure lower energy consumption.
In this research study, three mechanical ventilation systems have been simulated using the CFD models, considering this is the most effective and inexpensive method used and validated in several research studies to investigate indoor ventilation. The systems included in this study were the wall fan extract ventilation system, the roof fan extract ventilation system, and the spot cooling system. The three chosen systems are distinguished by their convergent costs and ease of implementation, and the comparison between the three system results reveal that the spot cooling system is the most effective system according to the ventilation factor. In addition, System B (roof extraction fans) shows an increase in ventilation efficiency compared to System A (wall extraction fans), although there is no significant difference in the cost. With this in mind, this research study recommends using the spot cooling ventilation method for its high efficiency in industrial spaces, while roof extraction fans fall in second place. Due to the high cost required to validate the results in a real factory building, it is recommended to conduct an experimental investigation for these different systems in future research. However, testing the efficiency of these systems on different industrial building sizes and different types of industries is planned to be included in future research work. In addition, studying the effect of these systems on the concentration of pollutants resulting from some types of industries can provide a comprehensive vision for choosing the best systems that save energy, provide thermal comfort, and a clean environment within such buildings.
Author Contributions
Conceptualization, M.I.E. and B.E.; methodology, M.I.E. and B.E.; software, M.I.E.; validation, B.E. and R.M.H.A.; formal analysis, B.E.; investigation, M.I.E.; resources, A.M.Y.A.; writing—original draft preparation, B.E.; writing—review and editing, B.E. and R.M.H.A.; visualization, B.E.; supervision, R.M.H.A. and A.M.Y.A.; project administration, A.M.Y.A. and R.M.H.A. All authors have read and agreed to the published version of the manuscript.
Funding
This research received no external funding.
Institutional Review Board Statement
Not applicable.
Informed Consent Statement
Not applicable.
Conflicts of Interest
The authors declare no conflict of interest.
References
- Hegazy, I.R.; Moustafa, W.S. Toward revitalization of new towns in Egypt case study: Sixth of October. Int. J. Sustain. Built Environ. 2013, 2, 10–18. [Google Scholar] [CrossRef] [Green Version]
- Agrawala, S.; Moehner, A.; Raey, M.E.; Conway, D.; Van Aalst, M.; Hagenstad, M.; Smith, J. Development and climate change in Egypt: Focus on coastal resources and the Nile. Organ. Econ. Co-Oper. Dev. 2004, 1, 1–68. [Google Scholar]
- The Strategic Plan for Urban Growth and Development and Related Development Areas; The General Organization of Physical Planning (GOPP): Cairo, Egypt, 2014. Available online: http://gopp.gov.eg/plans/ (accessed on 15 July 2021).
- Cao, Z.; Zhai, C.; Wang, Y.; Zhao, T.; Wang, H. Flow characteristics and pollutant removal effectiveness of multi-vortex ventilation in high pollution emission industrial plant with large aspect ratio. Sustain. Cities Soc. 2020, 54, 101990. [Google Scholar] [CrossRef]
- Meng, X.; Wang, Y.; Xing, X.; Xu, Y. Experimental study on the performance of hybrid buoyancy-driven natural ventilation with a mechanical exhaust system in an industrial building. Energy Build. 2020, 208, 109674. [Google Scholar] [CrossRef]
- Kang, J.H.; Lee, S.J. Improvement of natural ventilation in a large factory building using a louver ventilator. Build. Environ. 2008, 43, 2132–2141. [Google Scholar] [CrossRef]
- Murga, A.; Long, Z.; Yoo, S.-J.; Sumiyoshi, E.; Ito, K. Decreasing inhaled contaminant dose of a factory worker through a hybrid Emergency Ventilation System: Performance evaluation in worst-case scenario. Energy Built Environ. 2020, 1, 319–326. [Google Scholar] [CrossRef]
- Fletcher, B.; Johnson, A.E. Ventilation of small factory units. J. Wind Eng. Ind. Aerodyn. 1992, 40, 293–305. [Google Scholar] [CrossRef]
- Pakari, A.; Ghani, S. Comparison of different mechanical ventilation systems for dairy cow barns: CFD simulations and field measurements. Comput. Electron. Agric. 2021, 186, 106207. [Google Scholar] [CrossRef]
- Pollet, I.; Laverge, J.; Vens, A.; Losfeld, F.; Reeves, M.; Janssens, A. Performance of automated demand controlled mechanical extract ventilation systems for dwellings. J. Sustain. Eng. Des. 2013, 1, 1–8. [Google Scholar]
- Russell, M.; Sherman, M.; Rudd, A. Review of residential ventilation technologies. HVAC R Res. 2007, 13, 325–348. [Google Scholar] [CrossRef]
- U.S. Department of Energy Whole-House Ventilation|Department of Energy. Available online: https://www.energy.gov/energysaver/weatherize/ventilation/whole-house-ventilation (accessed on 21 May 2021).
- Miqdad, A.; Ali, A.; Kadir, K.; Ahmed, S.F.; Malik, M.A.A. Development of system to control air conditioner’s airflow for spot cooling. In Proceedings of the 2017 International Conference on Engineering Technology and Technopreneurship (ICE2T), Kuala Lumpur, Malaysia, 18–20 September 2017; Volume 2017, pp. 1–4. [Google Scholar] [CrossRef]
- Kabeel, A.E.; Sultan, G.I.; Zyada, Z.A.; El-Hadary, M.I. Performance study of spot cooling of tractor cabinet. Energy 2010, 35, 1679–1687. [Google Scholar] [CrossRef]
- Bangalee, M.Z.I.; Lin, S.Y.; Miau, J.J. Wind driven natural ventilation through multiple windows of a building: A computational approach. Energy Build. 2012, 45, 317–325. [Google Scholar] [CrossRef]
- Zhang, J.; Long, Z.; Liu, W.; Chen, Q. Strategy for studying ventilation performance in factories. Aerosol Air Qual. Res. 2016, 16, 442–452. [Google Scholar] [CrossRef] [Green Version]
- Stavrakakis, G.M.; Koukou, M.K.; Vrachopoulos, M.G.; Markatos, N.C. Natural cross-ventilation in buildings: Building-scale experiments, numerical simulation and thermal comfort evaluation. Energy Build. 2008, 40, 1666–1681. [Google Scholar] [CrossRef]
- Gaczoł, T. Living quarters. A natural balanced ventilation system. Simulations part 1. E3S Web Conf. 2018, 49, 00025. [Google Scholar] [CrossRef] [Green Version]
- Cheung, J.O.P.; Liu, C.H. CFD simulations of natural ventilation behaviour in high-rise buildings in regular and staggered arrangements at various spacings. Energy Build. 2011, 43, 1149–1158. [Google Scholar] [CrossRef]
- Ayad, S.S. Computational study of natural ventilation. J. Wind Eng. Ind. Aerodyn. 1999, 82, 49–68. [Google Scholar] [CrossRef]
- Pérez, M.M.; Patiño, G.L.; Jiménez, P.A.L. International journal of comparison between natural and forced air flow. Energy Environ. 2013, 4, 357–368. [Google Scholar]
- Karimipanah, T.; Awbi, H.B. Theoretical and experimental investigation of impinging jet ventilation and comparison with wall displacement ventilation. Build. Environ. 2002, 37, 1329–1342. [Google Scholar] [CrossRef]
- Kobayashi, N.; Chen, Q. Floor-supply displacement ventilation in a small office. Indoor Built Environ. 2003, 12, 281–291. [Google Scholar] [CrossRef]
- Tian, G.; Fan, Y.; Wang, H.; Peng, K.; Zhang, X.; Zheng, H. Studies on the thermal environment and natural ventilation in the industrial building spaces enclosed by fabric membranes: A case study. J. Build. Eng. 2020, 32, 101651. [Google Scholar] [CrossRef]
- Mahmod, W.E.; Watanabe, K.; Zahr-Eldeen, A.A. Analyse du débit de nappe souterraine dans une zone aride avec des données hydrogéologiques limitées utilisant le Modèle de Grey: Étude de cas du Grès Nubien, oasis de Kharga, Egypte. Hydrogeol. J. 2013, 21, 1021–1034. [Google Scholar] [CrossRef]
- Lamoreaux, P.E.; Memon, B.A.; Idris, H. Groundwater development, Kharga Oases, Western Desert of Egypt: A long-term environmental concern. Environ. Geol. Water Sci. 1985, 7, 129–149. [Google Scholar] [CrossRef]
- Pinto, N.d.M.; Xavier, A.A.d.P.; Hatakeyama, K. Thermal Comfort in Industrial Environment: Conditions and Parameters. Procedia Manuf. 2015, 3, 4999–5006. [Google Scholar] [CrossRef] [Green Version]
- Global Petrol Prices Egypt Electricity Prices. Available online: https://www.globalpetrolprices.com/Egypt/electricity_prices/ (accessed on 15 July 2021).
| Publisher’s Note: MDPI stays neutral with regard to jurisdictional claims in published maps and institutional affiliations. |
© 2021 by the authors. Licensee MDPI, Basel, Switzerland. This article is an open access article distributed under the terms and conditions of the Creative Commons Attribution (CC BY) license (https://creativecommons.org/licenses/by/4.0/).


