Article

Two-Year Non-Destructive Evaluation of Eco-Efficient Concrete at Ambient Temperature and after Freeze-Thaw Cycles

1
Department of Civil and Environmental Engineering, Rutgers, The State University of New Jersey, Piscataway, NJ 08554, USA
2
Department of Civil Engineering, The Islamic University of Gaza, Gaza P.O. Box 108, Palestine
3
School of Civil Engineering, Engineering Campus, Universiti Sains Malaysia, Gelugor 11800, Penang, Malaysia
4
Department of Construction Materials and Technologies, Budapest University of Technology and Economics, 1111 Budapest, Hungary
*
Author to whom correspondence should be addressed.
Sustainability 2021, 13(19), 10605; https://0-doi-org.brum.beds.ac.uk/10.3390/su131910605
Submission received: 9 August 2021 / Revised: 19 September 2021 / Accepted: 21 September 2021 / Published: 24 September 2021
(This article belongs to the Section Sustainable Materials)

Abstract

:
The increasing demand for eco-efficient concrete puts pressure on the industry to innovate new alternatives for its constituent materials. Coarse recycled concrete aggregates (RA) and supplementary cementitious materials (SCMs) are considered promising substitutes for coarse natural aggregates (NA) and cement, respectively. Using destructive and non-destructive testing methods, the present work aims to evaluate the effect of RA and different types of waste SCMs on the long-term performance of self-compacting high-performance concrete (SCHPC). Twenty-one mixes that were prepared with a 0.35 water-to-binder ratio were tested for their compressive strength, surface hardness, and ultrasonic pulse velocity. These tests were conducted over a two-year period at ambient temperature and again after exposure to up to 150 freeze–thaw cycles. Study findings demonstrated the possibility of developing eco-efficient SCHPC mixes using RA and waste SCMs. In addition, correlations have been introduced for predicting the compressive strength of SCHPC.

1. Introduction

Concrete is considered one of the most used materials in construction. This is owed to its versatility in application and properties. The endless demand for natural resources for concrete production creates concerns for the environment. The construction sector is responsible for the emission of CO2 at a global level [1]. Related activities include concrete mixing, cement manufacturing, and other chemicals that generate high atmospheric emissions of CO2 [2]. Thus, in the last decade, the research on using alternatives to replace conventional quarried materials is tremendously increasing [3]. On the other hand, the production of a significant amount of construction wastes increases the environmental burden. The use of recycled waste construction materials in concrete fabrication is considered a key solution that could lessen the burden placed on the environment and the economy [
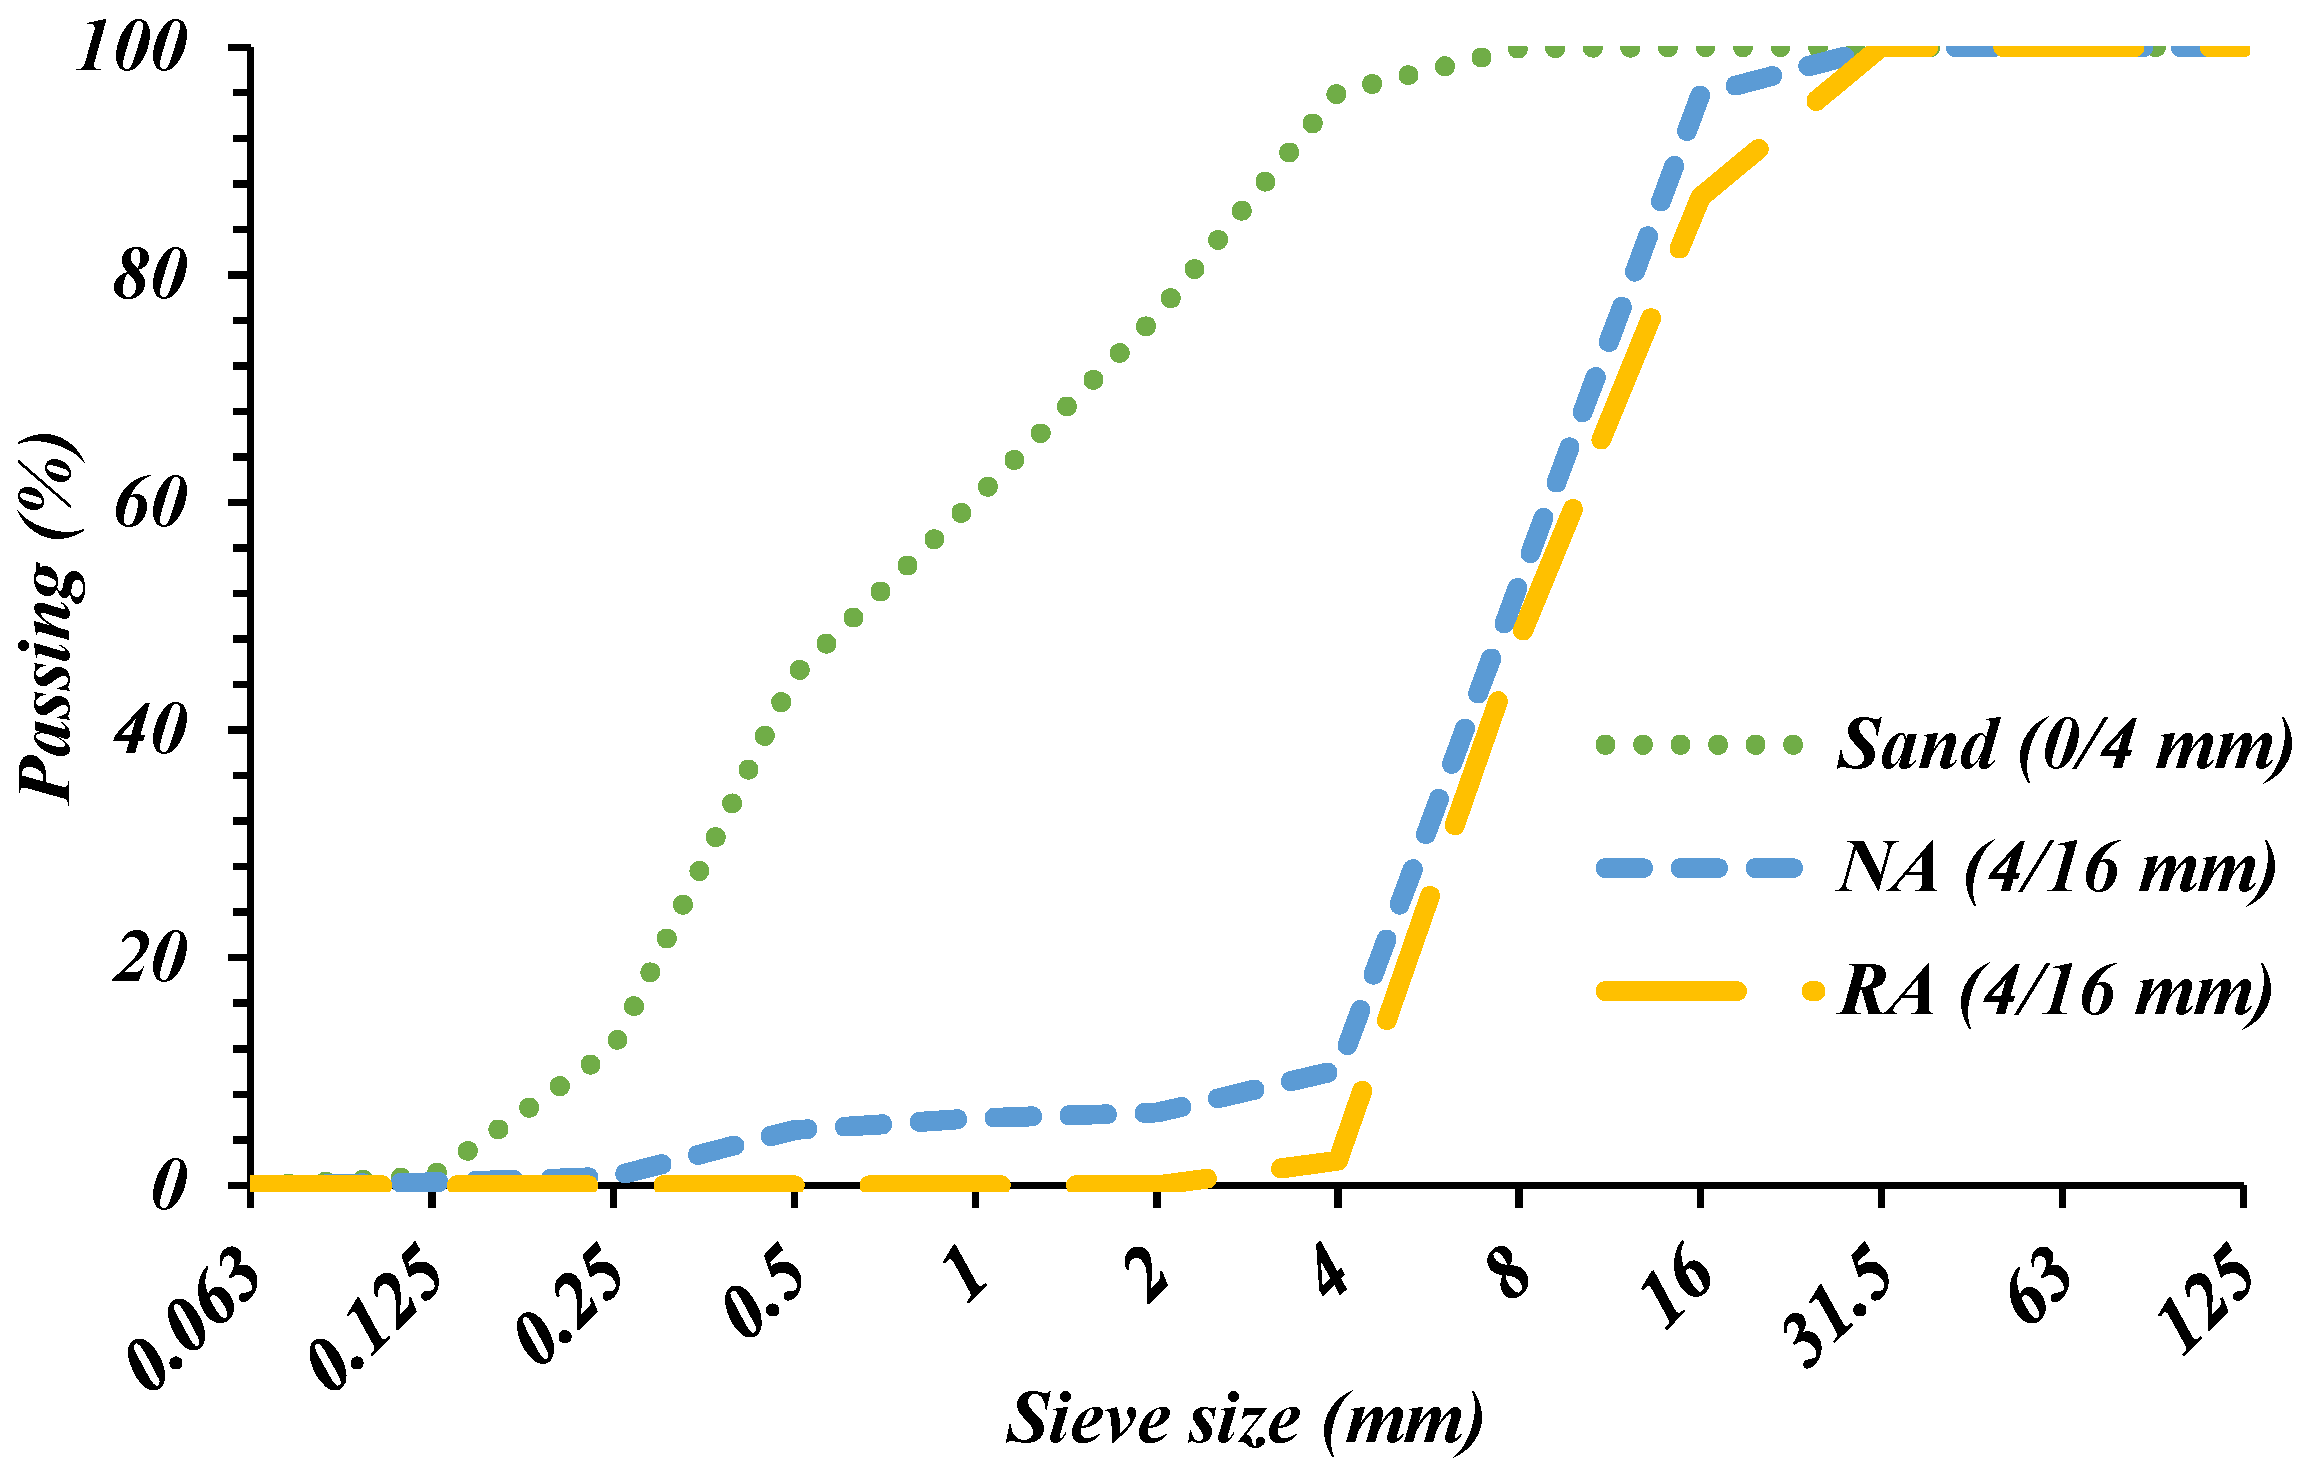
4]. Alternatives for quarried aggregates usually take the form of recycled materials (i.e., recycled concrete aggregate). These materials could alter the fresh and hardened concrete properties.
Concrete compressive strength is considered the key and main indicator of concrete quality which expresses the mechanical and durability performance of concrete. In the construction industry practice, the destructive technique is used to evaluate compressive strength using coring samples that have certain limitations in application. However, non-destructive testing methods are an effective solution for assessing compressive strength. The Schmidt hammer test, developed in the late 1940s, is considered a very popular non-destructive testing tool that has been used to assess the in situ strength of concrete [5]. Once the plunger of the Schmidt hammer is pushed against the surface of concrete, the material hardness is recorded to estimate the compressive strength of concrete. Based on regression analysis, several empirical relationships have been established between rebound values (RVs) and compressive strength measurements to predict the strength. The condition of the concrete surface has a significant impact on the RVs. Consequently, the corresponding RV is dependent on the energy absorbed in the spring. Hack and Huisman [6] showed that RVs are influenced by the tested material with a depth up to numerous inches. All factors that can affect the surface roughness and regularity must be considered during the assessment of strength with the Schmidt rebound hammer test. These factors include the type of formwork, consistency of the concrete mix, curing condition, and other factors. Earlier studies had revealed that the water-to-binder (w/b) ratio, type of aggregate, type of cement, moisture content, and carbonation are factors that can alter the surface hardness of concrete [7]. For instance, Breysse [8] states that a special calibration is needed when applying the Schmidt hammer test since the RVs differentiate with six points between careous and siliceous aggregates, with the latter being considered a harder type of aggregate.
The ultrasonic pulse velocity (UPV) test is another popular and widely used non-destructive evaluation technique used for evaluating concrete quality in situ through analyzing the homogeneity of concrete ingredients and assessing its integrity [9]. The deterioration that occurs to the concrete structures due to the harsh environment such as freeze–thaw cycles can be detected by the UPV test. UPV measurements of concrete, just like its hardened properties, are affected by the mix design, namely, the characteristics and the type of aggregates, cement type, porosity and properties of cement paste, and the bond of aggregates and cement paste [10].
It is worth mentioning that a limited number of experimental studies were performed to assess the compressive strength of recycled aggregate concrete (RAC) using non-destructive testing techniques. The physical characteristics of coarse aggregates affect the surface hardness of concrete considerably [11]. NA and RA are characterized by different physical properties including water absorption and roughness. These factors could impact the response of RVs. Kazemi et al. [12] carried out an experimental program to assess the strength of concrete specimens made utilizing RA. Their study showed that RVs of RAC were on average about 44.9% and 46.1% lower than that of the control mixes under wet and dry curing conditions, respectively. This was attributed to the porous interfacial transition zone between the new mortar and RA due to the RA’s characteristics. Thus, a poor interlock between the cement matrix and RA is achieved. Latif Al-Mufti and Fried [13] examined the early age properties of RAC compared to natural aggregate concrete. The corresponding results revealed a positive effect of RA on the RVs. This was associated with higher water absorbency of RA resulting in a harder concrete surface, compared to natural aggregate concrete. Soares et al. [14] reported that RAC mixes tend to have higher RVs than the control mixes. The superficial texture of RAC mixes and higher water absorption properties justified the cause for its harder surface. The use of RA and additives in concrete has shown their impact on UPV results [15]. Kurda et al. [16] carried out an indirect evaluation of the compressive strength of RAC with a high content of fly ash. Their experimental results indicated that UPV values worsened as the incorporation of RA and fly ash increases, owing that to the physical characteristics of RA and fly ash when compared to NA and cement, respectively. Khatib [17] evaluated the effect of using RA on the UPV of concrete mixes at various ages (1, 7, 28, and 90 days). Their results revealed that UPV measurements decreased with the increasing rate of use of RA.
The unique features of SCC led to a noticeable rise in its use in the last decade. It requires high dosages of powder materials to ensure adequate rheological properties. The use of supplementary cementitious materials (SCMs) in concrete has been promoted due to the benefits of reducing the emission of CO2 during cement fabrication. By-product materials, including fly ash, blast furnace slags, metakaolin, and silica fume are the most commonly used SCMs in the fabrication of SCC, yet these materials are not cost-effective considering their environmental impact [18]. For that reason, it is a necessity to test other types of absolute waste SCMs that could be used in the casting of SCC. The simultaneous use of RA and waste SCMs in SCC may contribute to a cleaner production of concrete, resulting in an eco-efficient SCC [19].
The widespread application of SCC on-site and in pre-casting demands a better understanding of its behavior when its mechanical properties are assessed using non-destructive testing methods. The present study investigates the performance of potentially eco-efficient self-compacting high-performance concrete (SCHPC) in a long-term period (up to two years). There is a lack in the literature of the studies which evaluate the performance of concrete incorporating RA and/or waste SCMs at ages up to a two-year period. However, waste materials could impact concrete properties at longer ages due to their proceeding hydration. Moreover, considering the aforementioned variables, the non-destructive evaluation of eco-efficient SCHPC is still not investigated, especially after such exposure environments as freeze–thaw cycles.

2. Method

2.1. Materials and Mixes

Twenty-one SCHPC mixes were produced to carry out the present work. A control mix (reference) was set, and 20 mixes were designed accordingly. The potentially eco-efficient alternative mixes were produced by partially replacing the mass of cement with waste SCMs and/or the mass of NA with RA. The materials used to produce the SCHPC were cement, quartz sand (0/4) mm, coarse aggregate (4/16), SCMs, and superplasticizer (high-range water-reducing admixture).
Type I Portland cement (CEM I 42.5 N) was provided in addition to three different types of absolute waste SCMs. Waste fly ash (WFA), waste perlite powder (WPP), and waste cellular concrete powder (WCC) were the three absolute waste SCMs that were used to replace the cement partially by 0%, 15%, and 30%. SCMs were locally supplied, where the WFA was unprocessed fly ash for a Hungarian coal power station. Meanwhile, WPP and WCC were powder materials that were provided by cutting raw perlite rock and cellular concrete masonry, respectively.
All powder materials were examined according to BS EN 196-2:2013 [20]. Table 1 presents the physical and chemical properties of the cement and SCMs, while Figure 1 and Figure 2 plot their particle size distribution and X-ray diffraction, respectively (note: WPP was produced by incorporating 50% of coarse particles of WPP (WPP-c) and the other 50% of small particles WPP (WPP-s)). Based on the activation index tested by the authors, the three used SCMs showed an increase in the activity index when they used up to 30%. Paste specimens replacing up to 60% have been tested [21].
RA, which was produced from crushed concrete with 28–33 MPa average compressive strength, was partially replacing NA at a rate of 0%, 25%, and 50%, respectively. Table 2 shows water absorption, density, and Los Angeles wear of both RA and NA, while their particle size distribution can be seen in Figure 3. At the mixing stage, the water absorbed by RA was compensated by adding an equivalent amount of water to the mix.
The used superplasticizer was a polycarboxylates aqueous solution type (Sika ViscoCrete-5 Neu) which satisfies the European guidelines for SCC [22]. It is a high-range water-reducing admixture and it has been used to achieve the required rheological properties for the SCHPC.
All mixes had a constant powder amount (500 kg/m3) and w/b ratio (0.35), and they were produced through three series (7 mixes in each series). They have been distinguished through the replacement amount of NA by RA, while within each series, the SCMs replace the cement by 0%, 15%, and 30%. Table 3 shows the mixing proportions for all mixes and their slump flow in cm, which was conducted as per European guidelines for SCC [22].

2.2. Test Methods

According to BS EN 12390-3:2009 [23], a compressive strength test was carried out on concrete specimens. The compression test was performed for multiple ages of 28, 90, 270, and 740 days; however, before conducting the compressive test on the cubic specimens, non-destructive tests were carried out to measure the RVs and UPV.
An N-Type Schmidt hammer was used to assess concrete compressive strength. This was conducted through the evaluation of surface hardness of specimens according to BS EN 12504-2:2012 [24]. Inside the compression testing machine, specimens were put and loaded with a constant force of about 15% of their ultimate compressive strength. A total of 20 impact points were applied horizontally and uniformly distributed on the two molded sides of each 150 mm cubic specimen and the results have been recorded in terms of RVs.
A pulse meter with an associated transducer pair was used to measure the UPV per the ASTM C597-97:1997 [25], for each specimen; three measurements were made. After preparing the concrete surface for proper acoustic coupling, the transmitter and receiver were placed on the surfaces of the two sides and the travel time was measured. Knowing the travel path length of the ultrasound in the specimen and the measured travel time, the pulse velocity can be calculated under 54 kHz frequency.
According to the PD CEN/TR 15177:2006 [26], the internal damage due to freeze–thaw cycles was studied, for each cycle, and the specimens were exposed to freezing at –20±4 °C for 4 h, then thawing at +20±4 °C for another 4 h. Compression, UPV, and Schmidt hammer tests were conducted after 50 and 150 freeze–thaw cycles, where their results were recorded as relative residual values. All conducted tests, their specimen sizes, and the testing ages are presented in Table 4.

3. Results at Ambient Temperature

3.1. Compressive Strength

Compressive strength of all proposed mixes at different ages up to 740 days have been investigated and presented in Table 5, and all values have been rounded to the nearest 10. Up to the age of 270 days, it was concluded that the use of up to 50% of RA enhances the performance of SCHPC; this behavior has been justified by the good quality of RA itself (high roughness, high specific surface, good control, and fit grading) and the high grade of concrete [27,28]. This agrees with other studies which evaluated the beneficial concurrent effects of RA and pozzolanic materials that enhance the strength development of concrete [29]. The pozzolanic activity is promoted once water is supplied by RA, which develops the compressive strength over time (internal curing); however, some SCMs, due to their particle porosity and irregularity characteristics, create weak points in the hardened matrix due to their pore structure [30].
Using up to 15% of WPP improved the mechanical performance of SCHPC regardless of if the used aggregate was NA or RA due to its pozzolanic activity and filler effect [31]. Meanwhile, using up to 30% of WFA had a clear positive effect in the case of RAC due to utilizing the added water, which was added to compensate for the RA’s absorption capacity [32]. WCC is proven to swell during hardening and enhances the properties of concrete if it is used with low particle sizes [33]. However, in this study, its incorporation worsened the properties of SCHPC compared to the control mix due to its large particle size. It is clear that increasing the dosage of RA increases the gaining strength at long ages which could be related to the un-hydrated cement in the adhered mortar on RA [34].
The effect of using WFA or WPP with or without RA was clear on the performance of SCHPC at long ages (up to 740 days) due to their pozzolanic effect. The effect of WFA on the RAC can be observed by the strength values for the mixes F30RA25 and F30R50, which showed an increase of 18.52% and 22.22%, respectively, compared to F15RA0. While the incorporation of 50% of RA and 30% of WPP showed a very high gain of strength, reaching up to 30.77%, which reflects the high pozzolanic effect of WPP, as well as the value of its small fraction for filling the inter-cracks of RA. It is good to mention, that despite the excellent performance of all mixes which incorporated WFA and WPP, their gaining of strength was much clearer with RA due to the internal curing effect, where a higher amount of water was added to compensate for the absorption of the RA.
A high absorption factor was noted for iron by the X-ray diffraction of the WFA as shown in Figure 2. That means completing its hydration process requires a longer time. Moreover, as proven in the literature, the pozzolanic activity of fly ash has a positive impact on long-term strength development [35]. Unlike WFA and WPP, WCC contributes to decreasing the strength of SCHPC at the age of 740 days compared to the strength gained at 270 days. Where for the mix C30RA0, after reaching the compressive strength of 19.23% at the age of 270 days, it decreased to 4.84% at the age of 740 days. This behavior can be related to the tobermorite formation of WCC, which is swelling. If it is characterized by large particle size and used in high amounts, it can cause internal micro-cracking and consequently a loss in the strength of concrete [33].
The relationships between compressive strength at the age of 28 days with respect to those strengths tested at multiple ages are shown in Figure 4. At 90 days of age, the compressive strength increased by about 10.76%, with a relatively high correlation coefficient (R2) of 0.91. For later ages of 270 and 740 days, the compressive strength reached 15.40% and 16.98%, respectively, yet with corresponding correlation coefficients R2 of 0.77 and 0.81, respectively. Due to using SCMs, the strengths gain increases as the age of concrete increases.

3.2. Rebound Values (RVs)

Figure 5 shows the RV measurements for all mixes at various ages (28, 90, 270, and 740 days), and it presents the evolution over time of the RVs’ results of mixes made with different substitution rates of cement with SCMs (0%, 15%, and 30%) and NA with RA (0%, 25%, and 50%). The corresponding RVs were in the ranges of 35–59. In general, for any particular mix, trends of the RVs were almost similar to those observed in compressive strength. Many influencing factors could alter the average RVs. Physical properties of aggregate (i.e., size, density), type of cement, age, and carbonation depth may affect to a certain extent the RVs carried out on the concrete surface [8].
Regardless of the incorporation of RA and SCMs in SCHPC mixes, the RVs’ response followed an increasing trend with time, which is an indication of the hardening of concrete as it proceeds to mature. For instance, RVs for the RA0 mix increased 2.06%, 6.75%, and 22.09% for 90, 270, and 740 days, respectively, when compared with the corresponding RV at 28 days. Similar trends are noticed when RA and SCMs were used. Such results are in agreement with the literature, which can be related to the hydration of clinker minerals in the hardened cement paste since concrete is considered a material with time-dependent properties [12,36]. Considering the influence of RA on RVs’ results, there were insignificant variations of RA on RVs with time when compared to the control mix. For example, RVs for RA50 varied from -7% to +3% as compared to the control mix along different ages. This could be attributed to the common w/b ratio, which was 0.35, utilized for all SCHPC mixes and the quality for RA when compared to NA (almost similar densities as shown in Table 2).
As expected, the incorporation of SCMs led to reduced RVs; for instance, the corresponding RV of F15RA0 decreased 3.19%, 3.88%, 10.20%, and 3.24% at 28, 90, 270, and 740 days, respectively, when compared with the control mix. The impact of SCMs was more pronounced at higher rates. For example, RVs of F30RA0 decreased 8.87%, 13.85%, 14.37%, and 11.50% at 28, 90, 270, and 740 days, respectively, when compared with RA0 control mix. This can be associated with the replacement of cement by SCMs which led to a decrease in hydration product (i.e., increase in effective w/c ratio) [37]; thus, increasing porosity of concrete mixes.
The Schmidt hammer test is sensitive to the surface condition of concrete such as moisture and carbonation [38]. Since the evaluated SCHPC mixes are characterized with low w/b ratios and high compressive strengths, the increase in the RVs due to carbonation diminishes [39], and thus, the influence of carbonation on the RVs is negligible. In the technical literature, there is no fixed empirical relationship for the assessment of concrete compressive strength by the Schmidt hammer test. Therefore, based on overall experimental results, a linear function was generated from minimum compressive strength points of the compressive strength axis, corresponding to the lowest values of compressive strength obtained between 39 and 59 RVs. The basic curve given in BS EN 13791:2019 [40] is plotted in Figure 6, where it can be realized that a positive shift along the compressive strength axis must be applied for accurate compressive strength assessment.

3.3. Ultrasonic Pulse Velocity (UPV)

The UPV test has proven to be an effective method to assess the quality and uniformity of concrete [41]. Based on Figure 7, the results of UPV of tested mixes at 28 days and over varied from 4262 to 4864 m/s, reflecting good quality of concrete. It should be noted that all mixes were designed for a high paste content, reflecting that high-strength concrete is less vulnerable to defects than normal concrete, especially when the cement content was reduced up to 30% [42]. UPV could be successfully applied to sustainable concrete mixes to assess the variations in mechanical properties [43].
The average results of UPV are plotted in Figure 7 for SCHPC mixes at the ages of 28, 90, 270, and 740 days. Along different curing ages, almost similar trends were noticed for UPV when compared to RVs’ results. The corresponding UPV is increasing with time, owing to two factors. The first is related to the hydration products that are generated from attached cement particles to RA, achieving denser mixes as a result [44]. The second reason is explained by the pozzolanic reactions between SCMs and cement hydration products, thus reaching denser mixes in the long-term than at 28 days. Several studies have investigated the incorporation of RA at different rates on the UPV of concrete [16]. There was no remarkable difference in the UPV values when the RA was used for all testing ages. For instance, the corresponding UPV for RA50 showed almost similar UPV values as compared to the control mix. This can be attributed to almost similar densities of natural and RA. However, it is worth mentioning that after 28 days, the rate of increase of UPV for SCHPC mixes incorporating RA was higher than the control mix (RA0). The old adhered cement mortar on RA contributed to additional hydration products in SCHPC mixes, resulting in denser mixes [45].
Concerning the influence of SCMs on the UPV, it can be noticed that UPV results decreased for all mixes incorporating SCM when compared to the control mix. For instance, the UPV results of C15RA0 decreased 1.61%, 2.28%, 2.15%, and 2.81% at 28, 90, 270, and 740 days, respectively, when compared with the control mix. Similarly, for RVs’ results, the impact of SCMs was more pronounced at higher rates for UPV values. For example, UPV of C30RA0 decreased 5.68%, 6.25%, 6.79%, and 6.40% at 28, 90, 270, and 740 days, respectively, when compared with the control mix. The previous study had shown similar trends [46]. This could be attributed to the effective w/c ratio changing from 0.35 to 0.41 when SCMs were incorporated up to 30% of cement content. Thus, the hydration product would be less when SCMs are used as compared to the control ones [47]. The difference between UPV of mixes incorporating WFA and control ones decreased with time. This can be attributed to the pozzolanic reaction with a low rate between cement hydration product and WFA.
The combined effect of SCMs and RA led to the following outcome. From Table 5, it can be concluded that the UPV results vary with time at different rates of RA and SCMs [48]. All experimental results for compressive strength and UPV were correlated to establish an exponential relationship between the two hardened properties (Figure 8). An increasing trend is observed when UPV and compressive strength values increase. The basic curve for UPV given in BS EN 13791:2019 [40] is plotted in Figure 8, where it can be realized that a positive shift along the compressive strength axis must be applied for accurate compressive strength assessment.

4. Results after Exposure to Freeze–Thaw Cycles

Compressive strength, as a destructive test, has been conducted on the SCHPC specimens after exposing them to 0, 50, and 150 freeze–thaw cycles. Meanwhile and prior to conducting the destructive test, two non-destructive tests have been conducted. The non-destructive tests were UPV and Schmidt hammer tests. Results are presented in the form of relative residual properties, where they are recorded as relative residual compressive strength, relative residual RVs, and relative residual UPV, respectively, i.e., relative residual UPV calculated as the residual UPV after a specific number of freeze–thaw cycles divided by the UPV value before starting the freeze–thaw cycles and together multiply by 100.

4.1. Relative Residual Compressive Strength

Increasing the number of freeze–thaw cycles will lead to a decrease in the concrete residual compressive strength, owing to the weakened bond between aggregates and paste caused by the development of internal cracks in the cement paste with repeated cycles [49]. The relative residual compressive strength for several mixes determined after 50 and 150 freeze–thaw cycles is shown in Table 6, and all values have been rounded to the nearest 10. Considering mixes that incorporate only RA, the relative residual compressive strength showed a slight decrease in all corresponding mixes, reaching the lowest value of 90% after 150 freeze–thaw cycles. This slight reduction in compressive strength for the RAC mixes only can be attributed to the variation in pore distribution caused by the use of RA [50]. Furthermore, the increase in RA content proved to slightly decrease the scaled materials from the surface scaling test, provided by the enhanced interfacial transition zone between old mortar and the RA in the case of high-performance concrete [51]. However, once any of the SCMs (15% of cement weight) were introduced, the relative residual compressive strength decreased, reaching 71%, 66%, and 91% for F15RA0, C15RA0, and P15RA0, respectively. The increase in SCM content up to 30% of the cement weight led to a remarkable decrease of 72%, 36%, and 72% in the relative residual compressive strength for F30RA0, C30RA0, and P30RA0, respectively.
Regardless of the effect of RA and SCMs, all mixes, excluding mixes with WCC, exhibited good resistance against freeze–thaw cycles. Generally, SCHPC mixes with a low w/b ratio could perform better against freeze–thaw cycles than conventional concrete [52]. It can be noticed that all SCHPC mixes without SCMs yielded the best performance, with a maximum of 94% relative residual compressive strength value for RA25 after 150 freeze–thaw cycles. However, once SCMs were incorporated in SCHPC mixes, the resistance of mixes against freeze–thaw cycles decreased, showing that the lowest relative residual compressive strength of 28% corresponds to the C30RA50 mix. It is worth mentioning that the WPP series yielded the best performance among SCMs, given that the relative residual compressive strength reached a maximum value of 91% after 150 freeze–thaw cycles. WPP confers particular benefits to the SCHPC over time, given the pozzolanic reactions and porous nature that accommodated the disruptive expansive stresses resulting from freeze–thaw attack [53,54].

4.2. Relative Residual Rebound Values (RVs)

The relative residual RVs for several mixes determined after up to 150 freeze–thaw cycles are shown in Figure 9. It can be observed that after 50 freeze–thaw cycles, the relative residual RVs of all mixes is negligible, excluding mixes with WCC. However, after 150 freeze–thaw cycles, the relative residual RVs of all mixes reached an average decrease of 19%. It can be noticed that the performance of mixes containing RA was better than those with SCMs.
Regardless of the effect of RA and SCMs, all mixes, excluding mixes with WCC, exhibited good resistance against freeze–thaw after 150 cycles. The WFA and WPP series almost yielded the best performance among SCMs, given that the relative residual RVs reached a maximum value of 96% for the P15RA0 mix. The physical characteristics of the examined material layer adjacent to the surface of tested concrete could alter the response of the RVs. The likelihood of grain crushing, micro-cracking, and pore collapse, which may be generated by a cumulative effect in freeze–thaw cycles, results in a dissipation of the impact energy from the Schmidt hammer and disruption of results. Figure 10 plots the relationship between the drop in the relative residual RVs and compressive strength after up to 150 freeze–thaw cycles. Obviously, the drop in relative residual compressive strength results is more pronounced than those of relative residual RVs. After 50 freeze–thaw cycles, RVs dropped about 29%, with a relatively high correlation coefficient (R2) of 0.90. For the later 150 cycles, the drop in RVs reached 54%, respectively, yet with corresponding correlation coefficients (R2) of 0.70.

4.3. Relative Residual Ultrasonic Pulse Velocity (UPV)

Relative residual UPV variations with respect to several replacement contents of RA and/or SCMs are illustrated in Figure 11. Minimal loss in the relative residual UPV values for all specimens can be observed after 50 freeze–thaw cycles, excluding mixes made with WCC, where the lowest relative residual UPV of 58% corresponds to C30RA50 with the highest content of RA. This reflects that almost all mixes are high freeze–thaw resistant after 50 cycles. However, with the increase of the freeze–thaw cycles, the relative residual UPV slowly decreased, reflecting the deterioration mechanism in concrete. Internal cracking of the cement paste is one of the serious deterioration mechanisms that affected the UPV measurement, and it develops with a greater number of cycles [49,53]. The performance of mixes containing only RA was significantly better than those with SCM. It can be observed that mixes containing only RA showed an insignificant decrease in the relative residual UPV values (maximum of 8%) after 150 freeze–thaw cycles. However, when SCMs were introduced to mixes (15% of the cement weight), the relative residual UPV reached a decrease of 45%, 52%, and 14% for F15RA0, C15RA0, and P15RA0, respectively. Similarly, the increase in SCM content up to 30% of the cement weight led to a decrease of 45%, 68%, and 39% in relative residual UPV for F30RA0, C30RA0, and P30RA0, respectively.
The relationships between the drop in the relative residual UPV and compressive strength after 50 and 150 freeze–thaw cycles are shown in Figure 12, respectively. Good correlations can be established between relative residual UPV with respect to the drop in the relative residual compressive strength of tested SCHPC mixes. Several researchers reported that when a reduced w/b ratio is used, the pores in the cement matrix are refined, and incorporation of waste powder additives in SCHPC could help to minimize the damaging effect of freeze–thaw cycles on concrete internal damage [55]. Consequently, the osmotic phenomenon and hydraulic pressure which are both responsible for generating micro-cracks due to freeze–thaw cycles are reduced. After 50 and 150 freeze–thaw cycles, the drop in UPV and the drop in compressive strength are linearly correlated, with correlation coefficients (R2) of 0.91 after 50 freeze–thaw cycles and 0.65 after 150 freeze–thaw cycles. As described in the previous section, specimens that correspond to the freeze–thaw test were crushed in compression after 50 and 150 cycles.

5. Conclusions

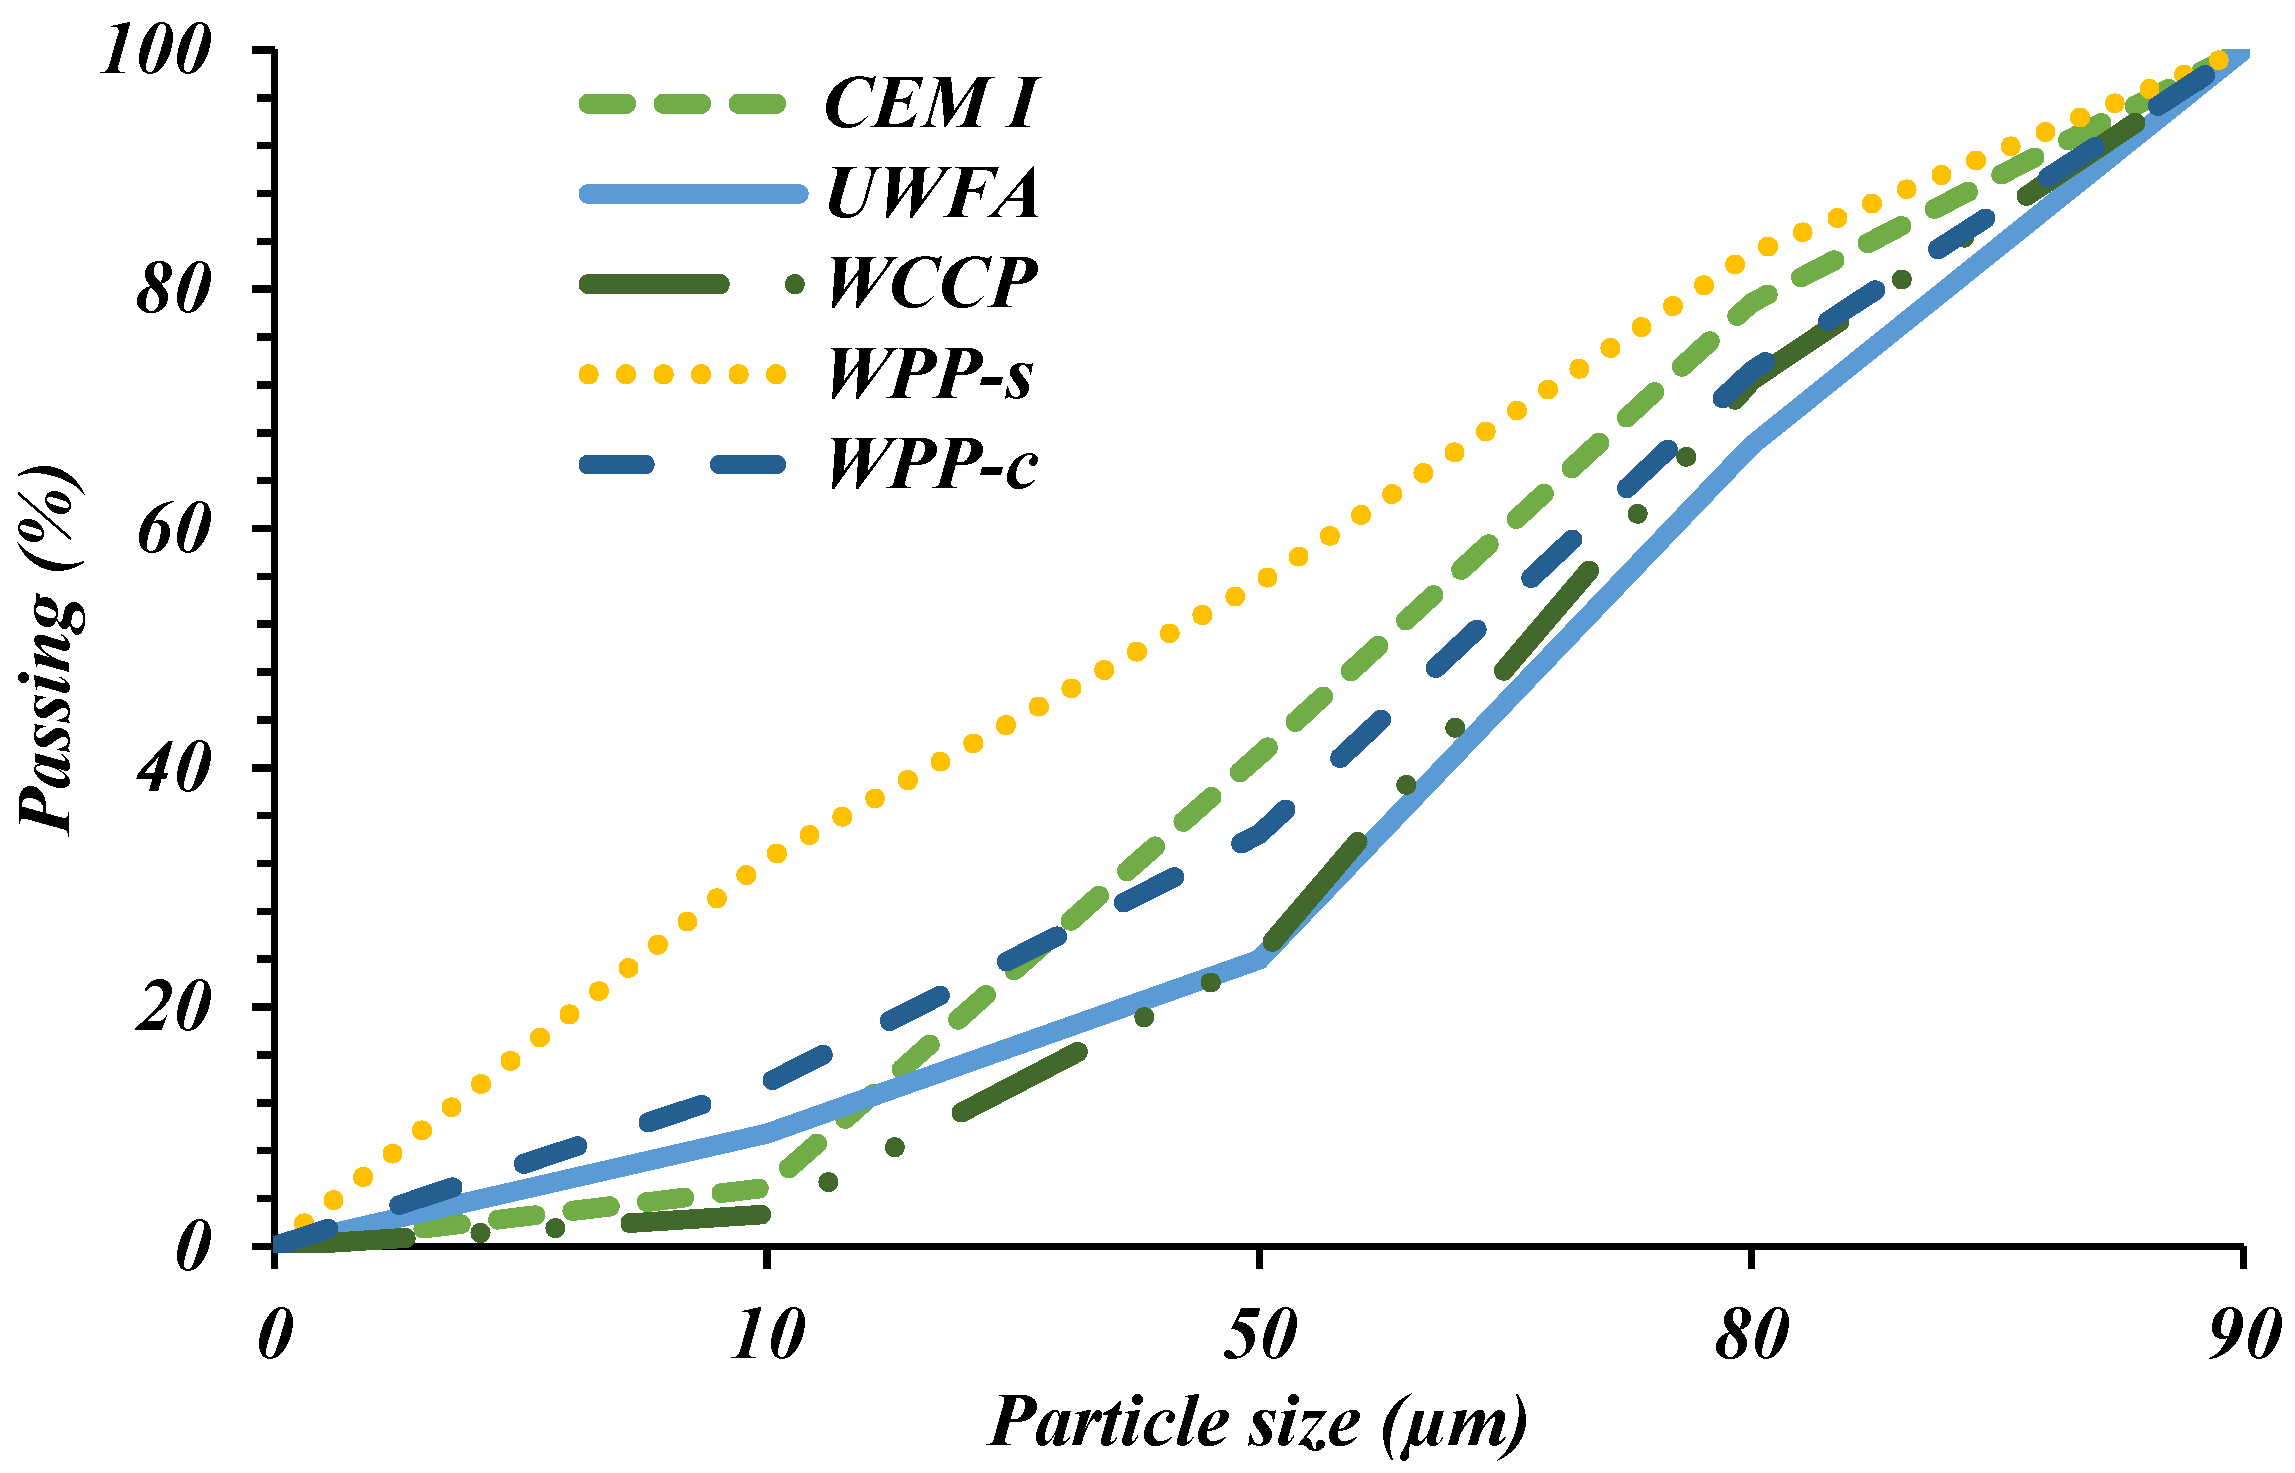
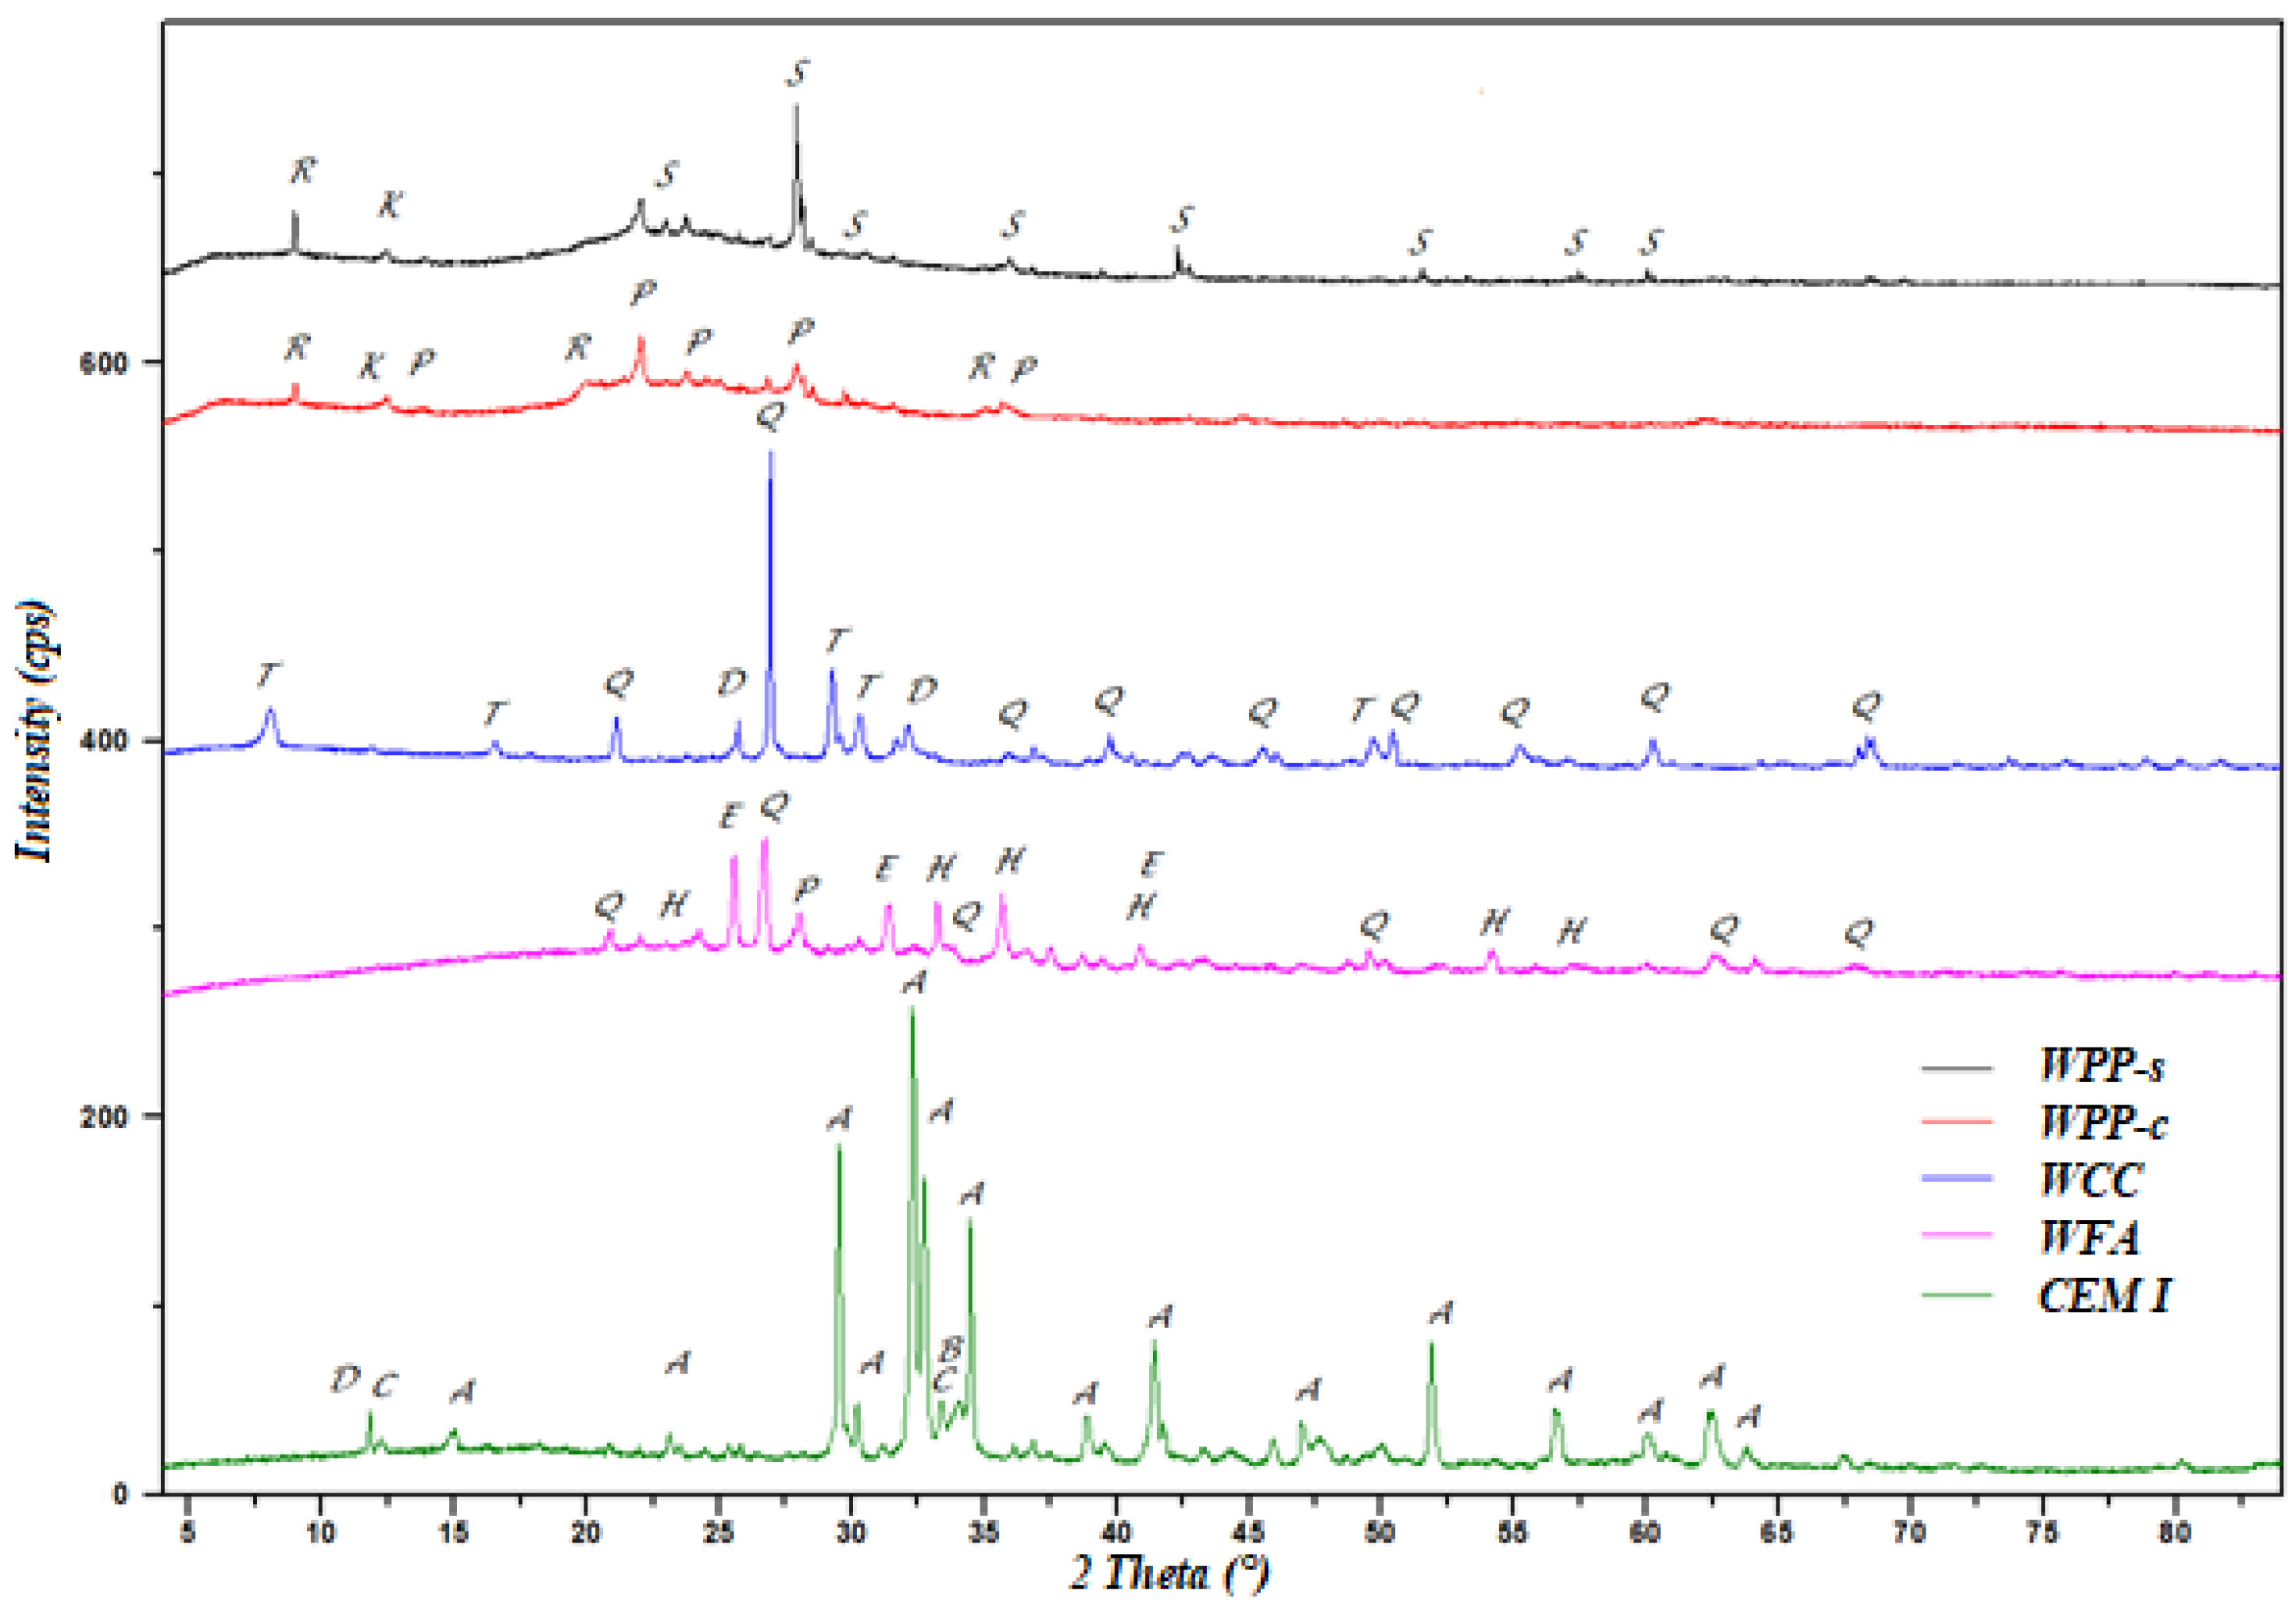
This research paper was a part of a comprehensive experimental work undertaken to evaluate the use of RA and absolute waste SCMs (WPP, WFA, and WCC) on the long-term mechanical and durability performance of potentially eco-efficient SCC (up to two years). The main objective of this work was to allow a better understanding of the non-destructive methods (RVs and UPV) of expectably eco-efficient SCHPC.
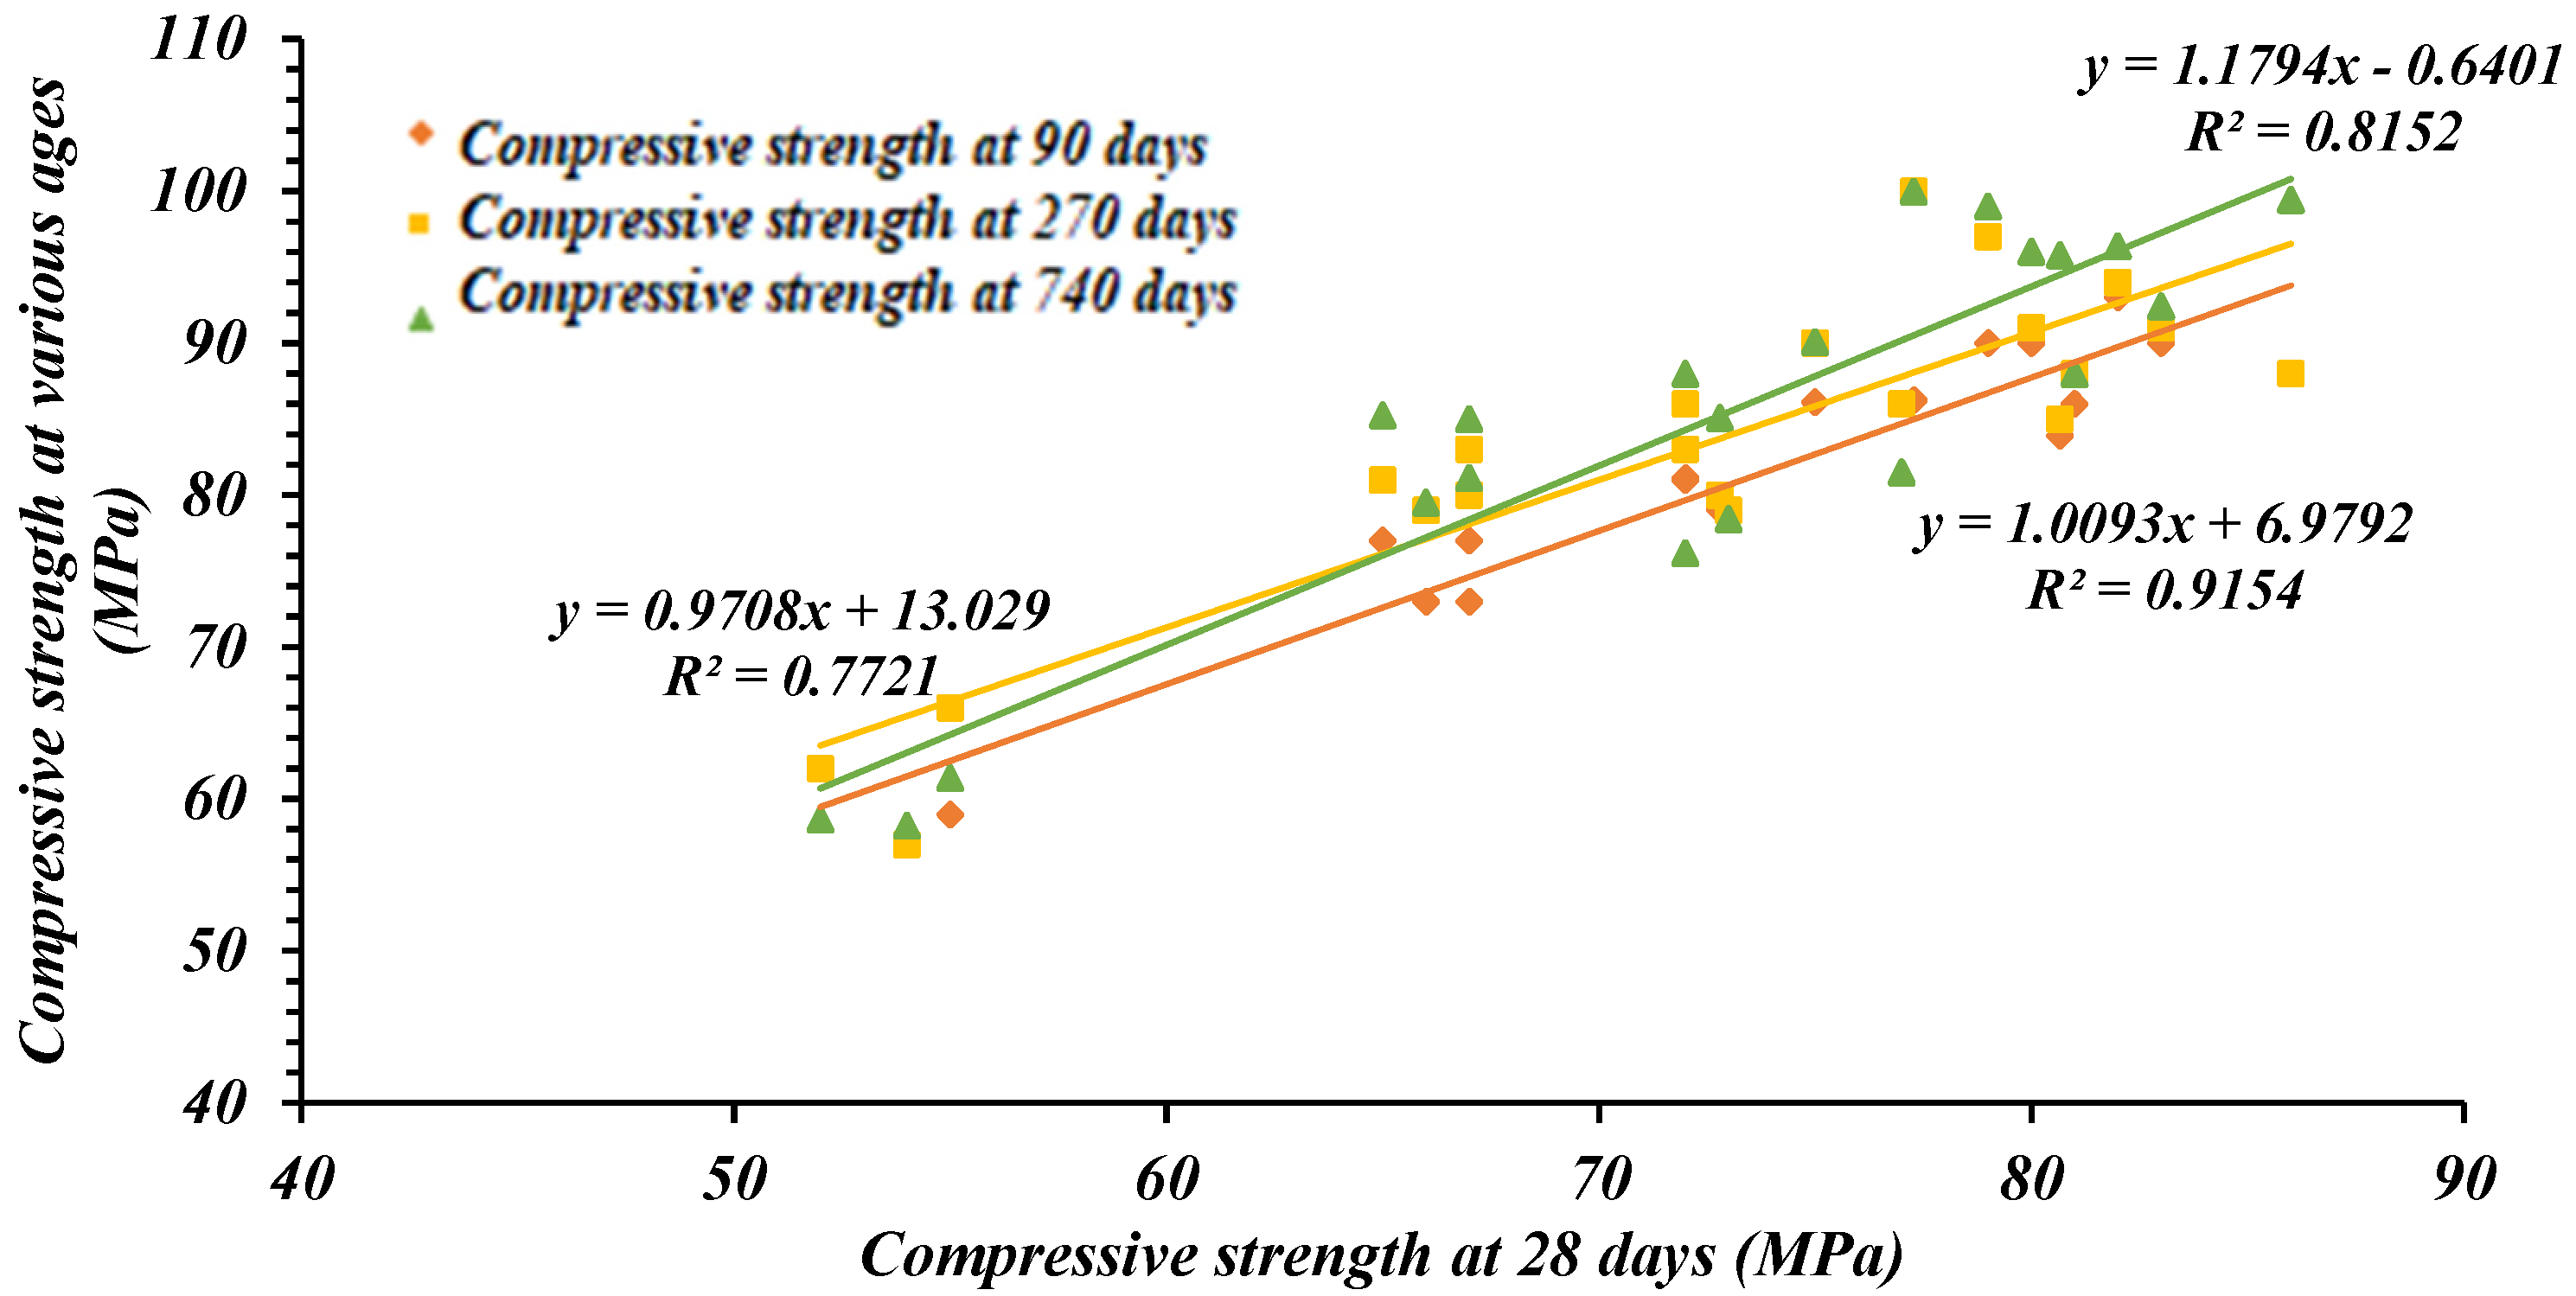
SCHPC containing RA exhibited higher compressive strength than equivalent mixes prepared with NA, as with the increase of age, mixes containing RA continue to gain strength due to the hydration of the attached mortar on the RA itself. Mixes prepared with WFA and WPP govern the compressive strength performance of SCMs, as compared to mixes prepared with WCC. This was attributed to the pozzolanic reactions promoted by these materials. In contrast, the WCC is characterized by its large particle size that causes internal micro-cracking in the concrete, supporting loss in strength with time.
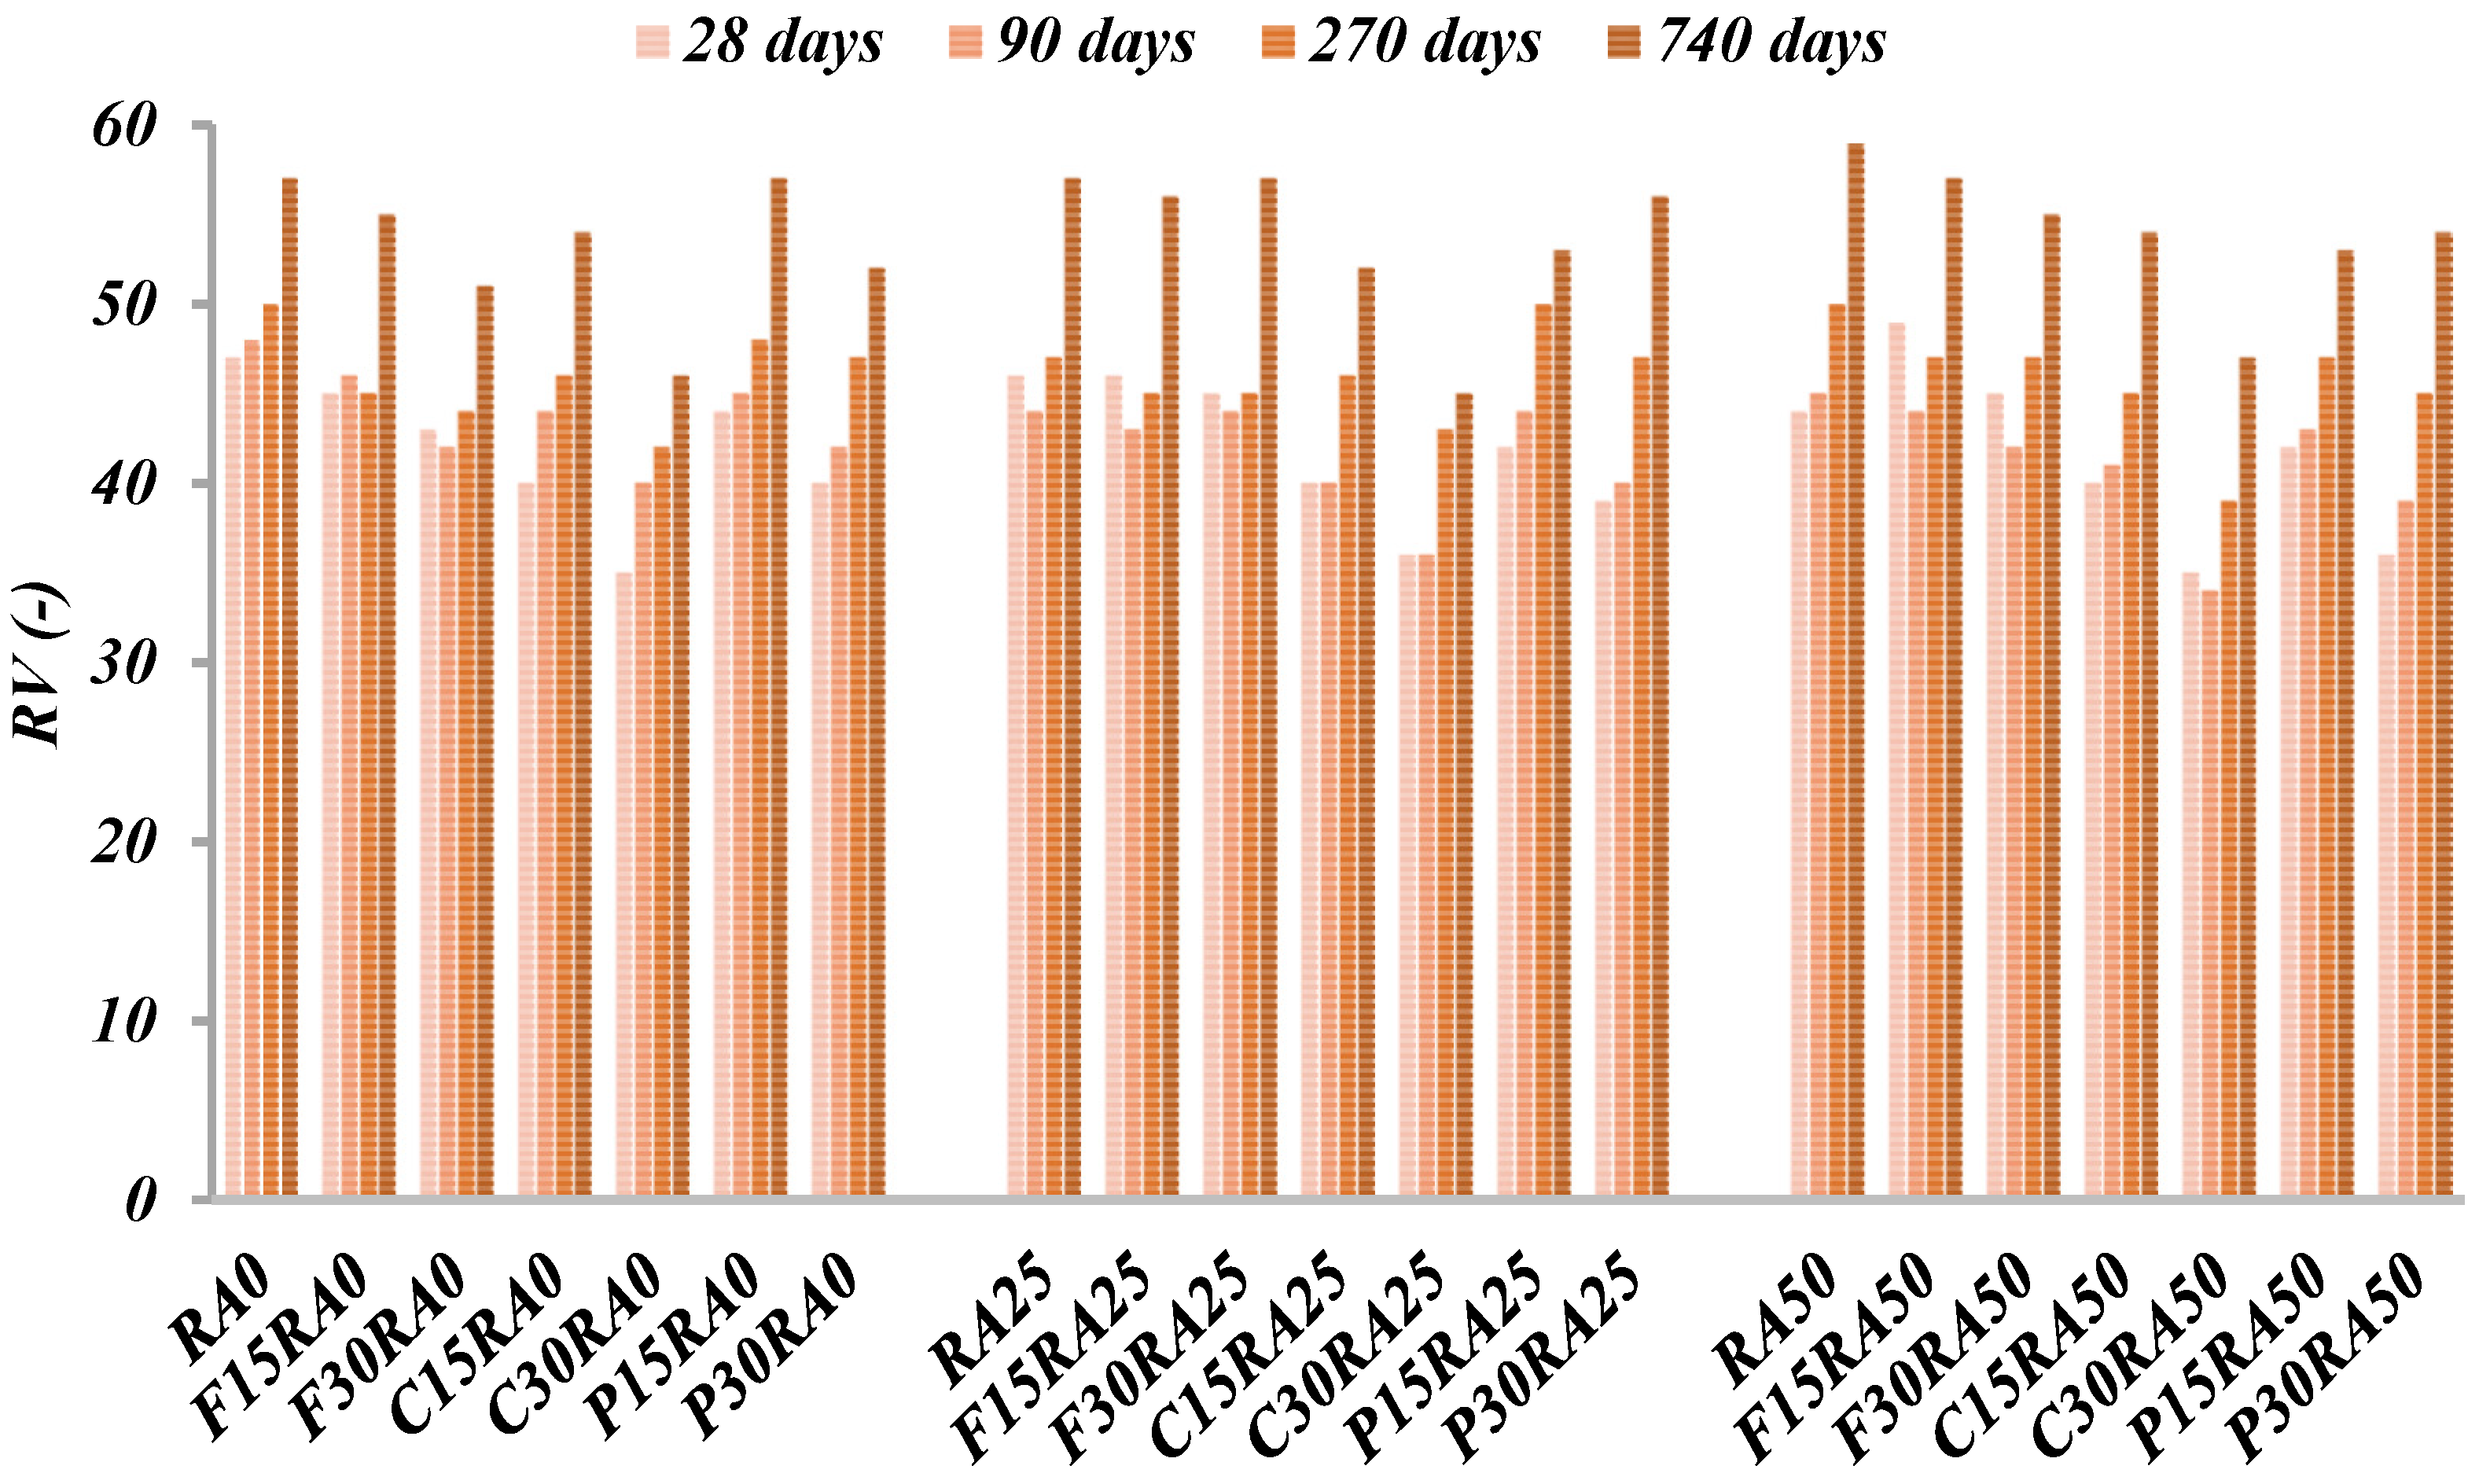
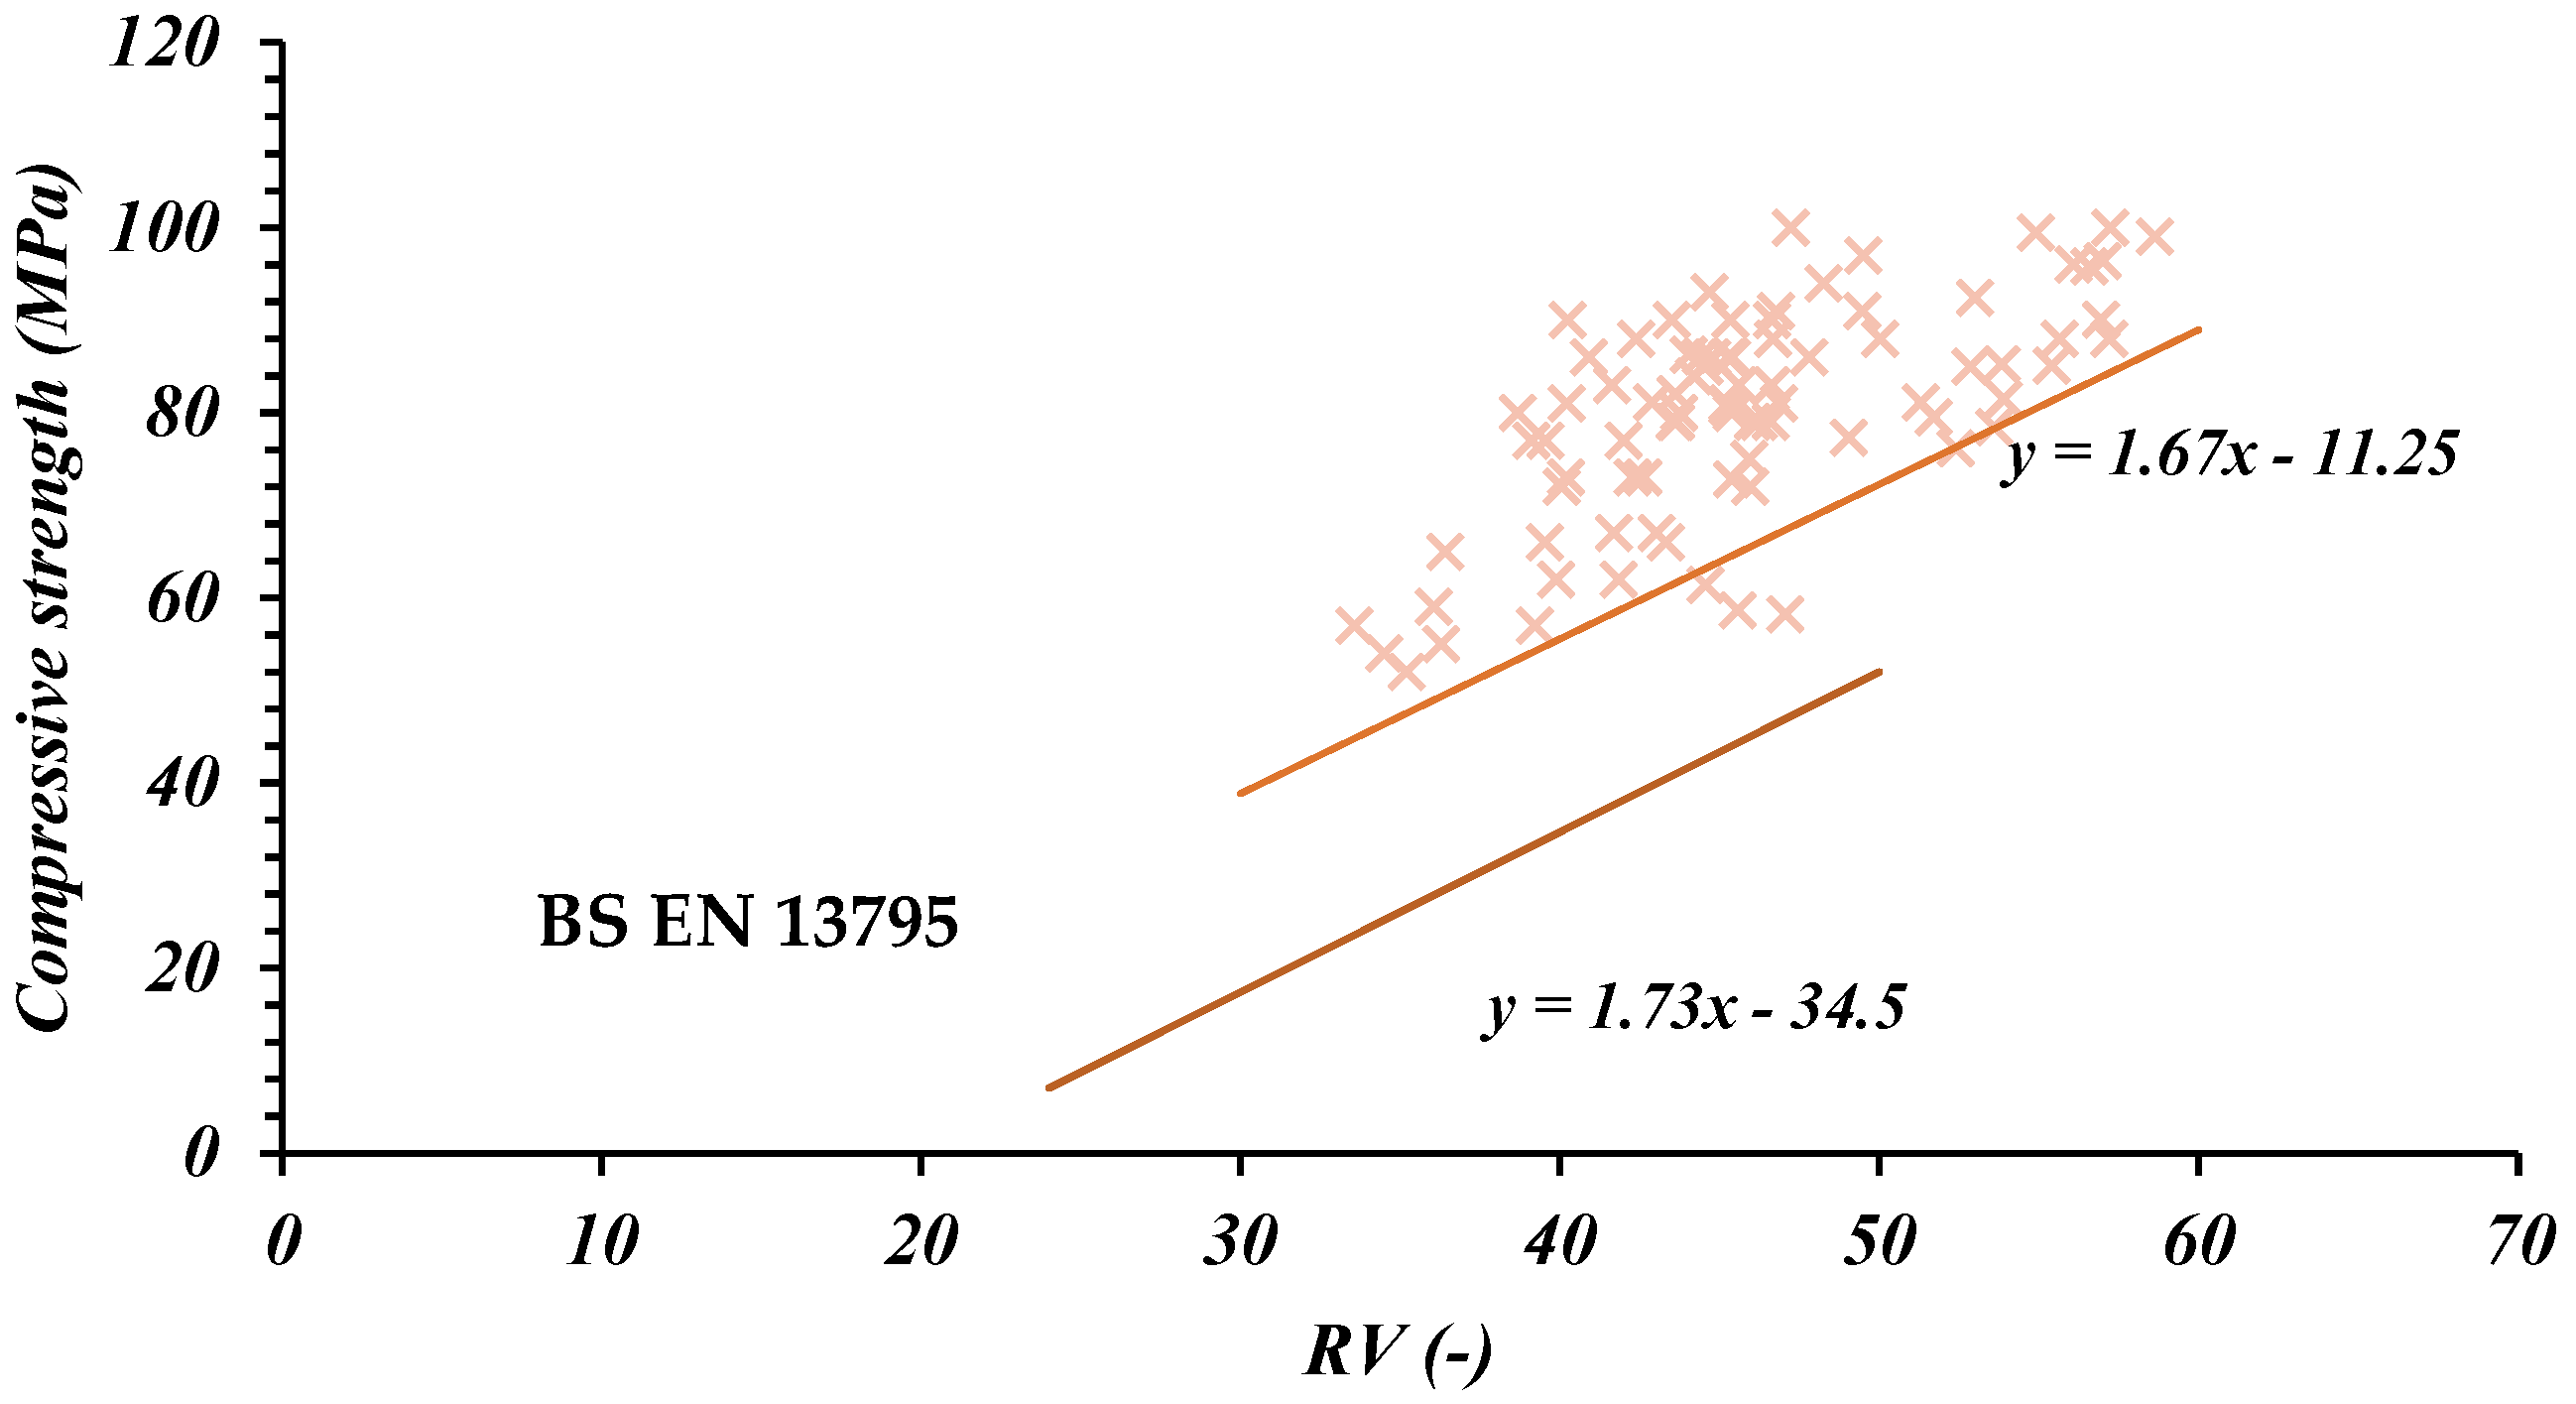
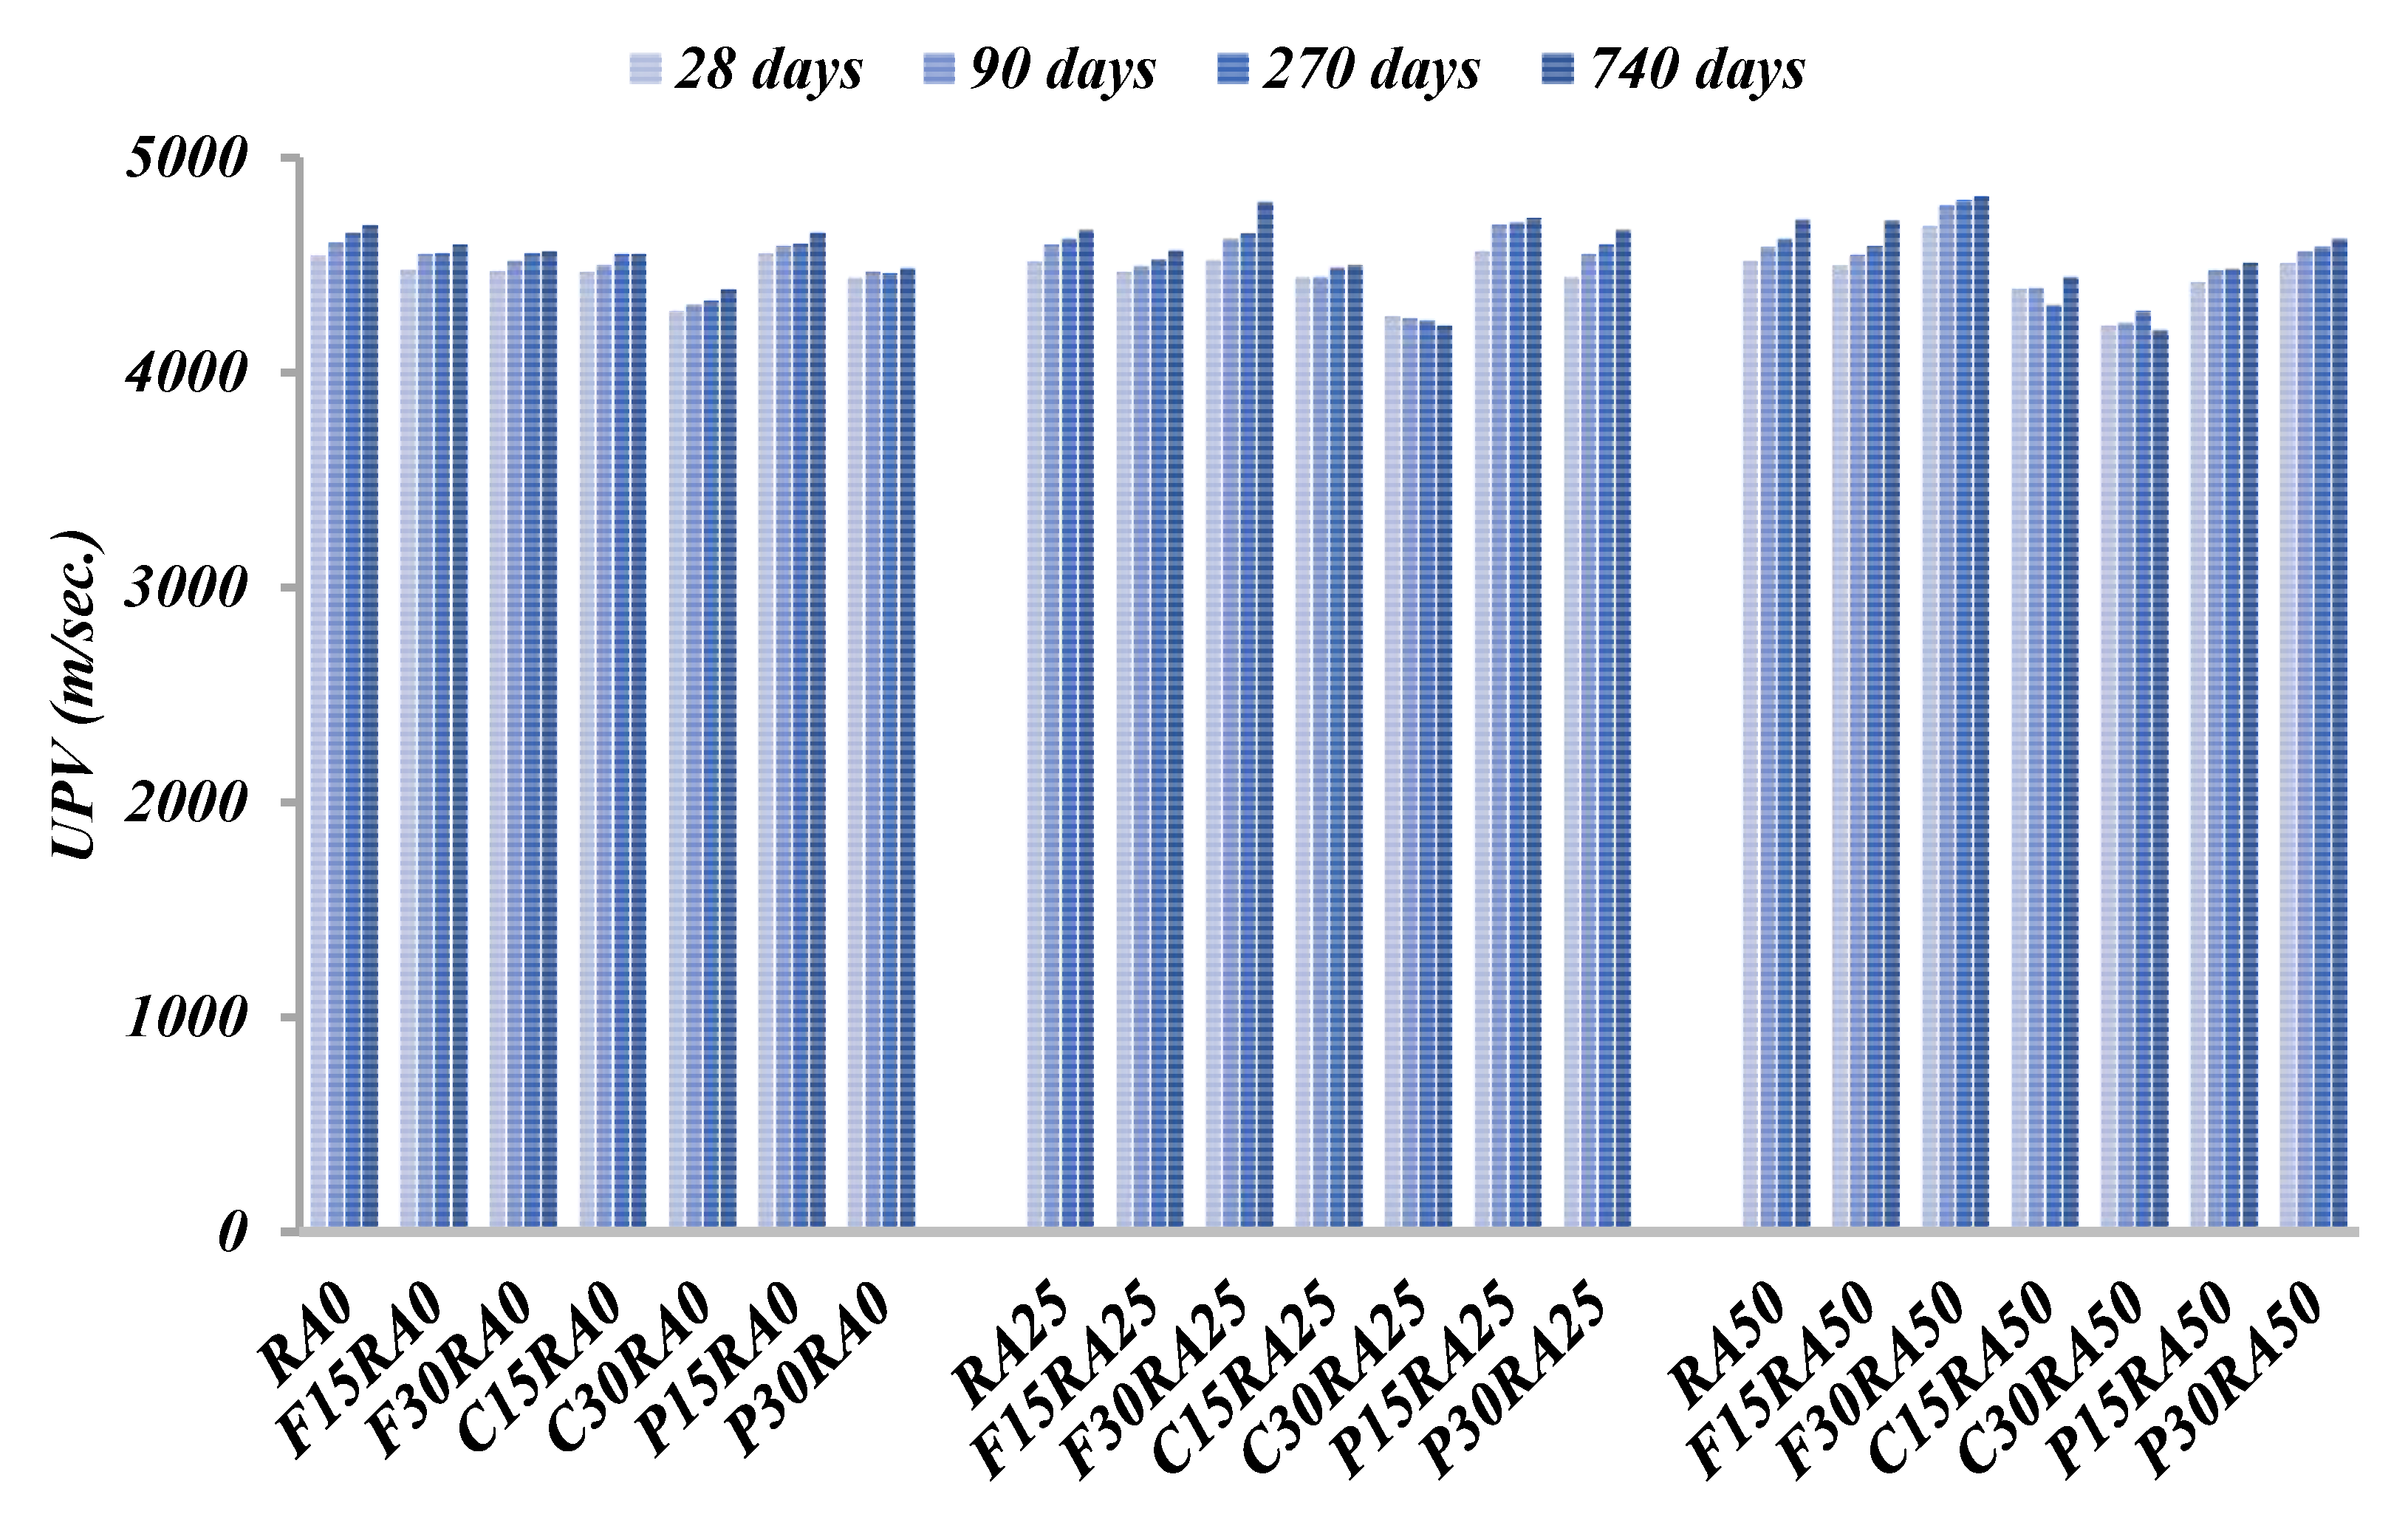
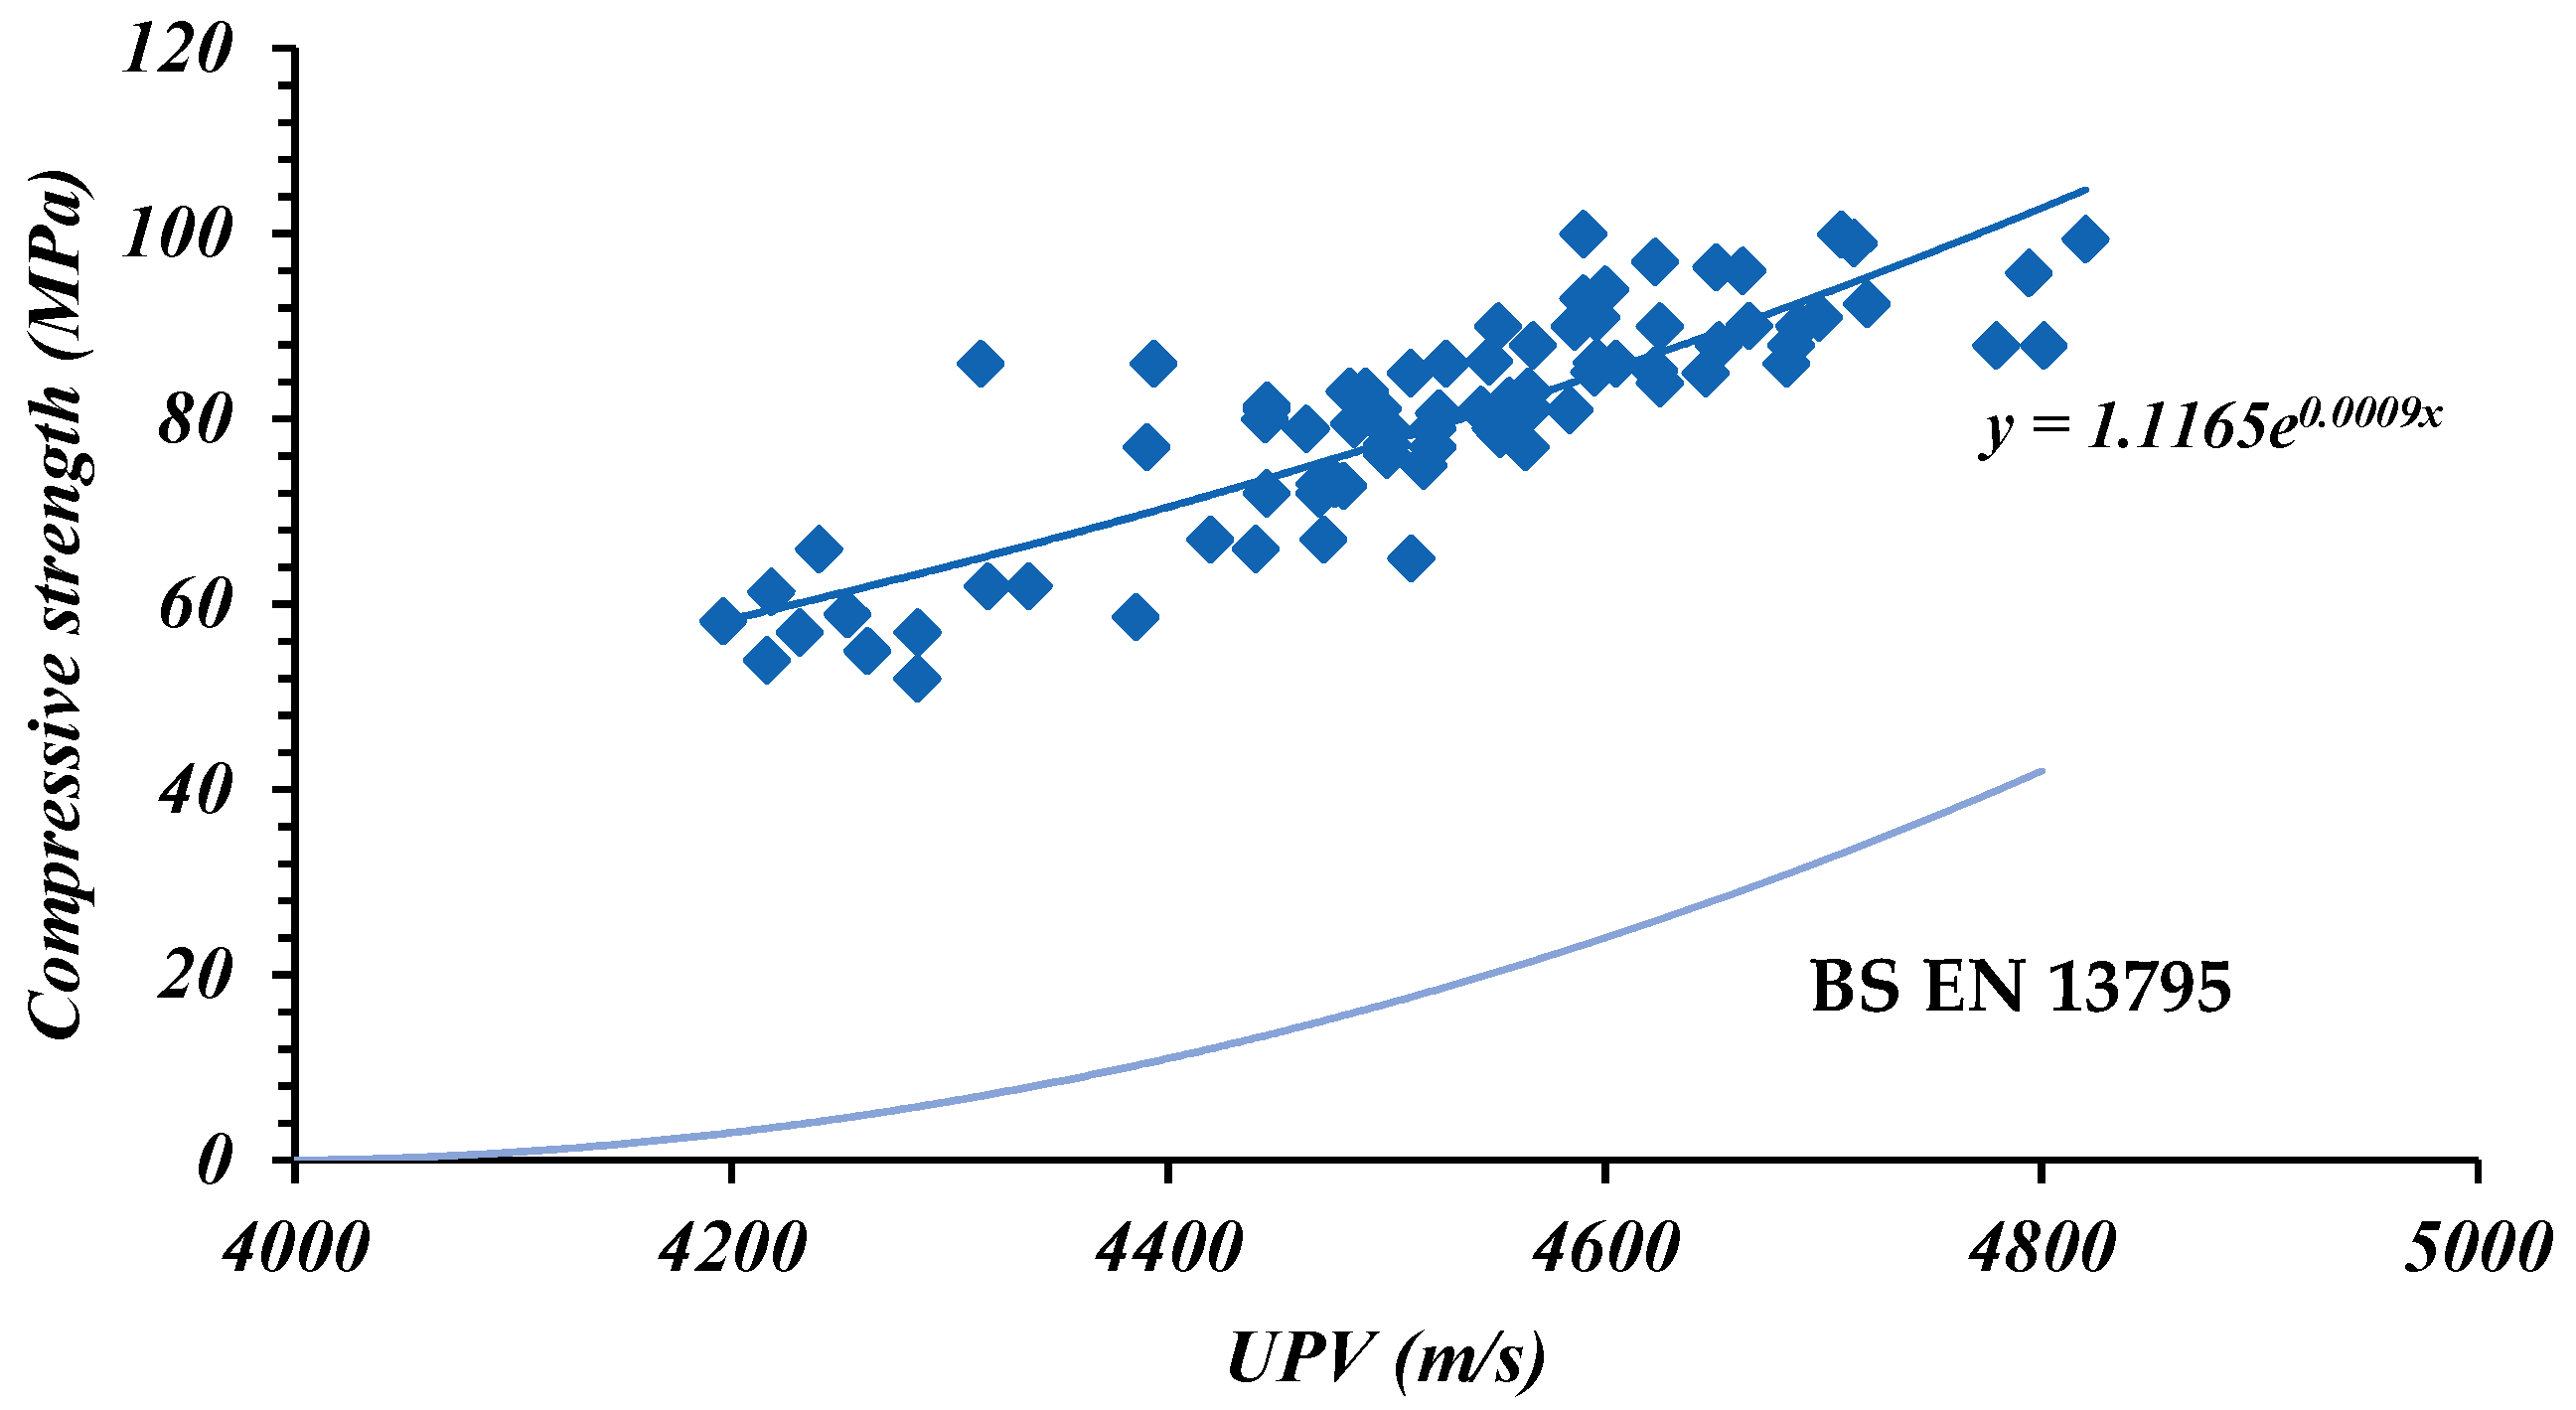
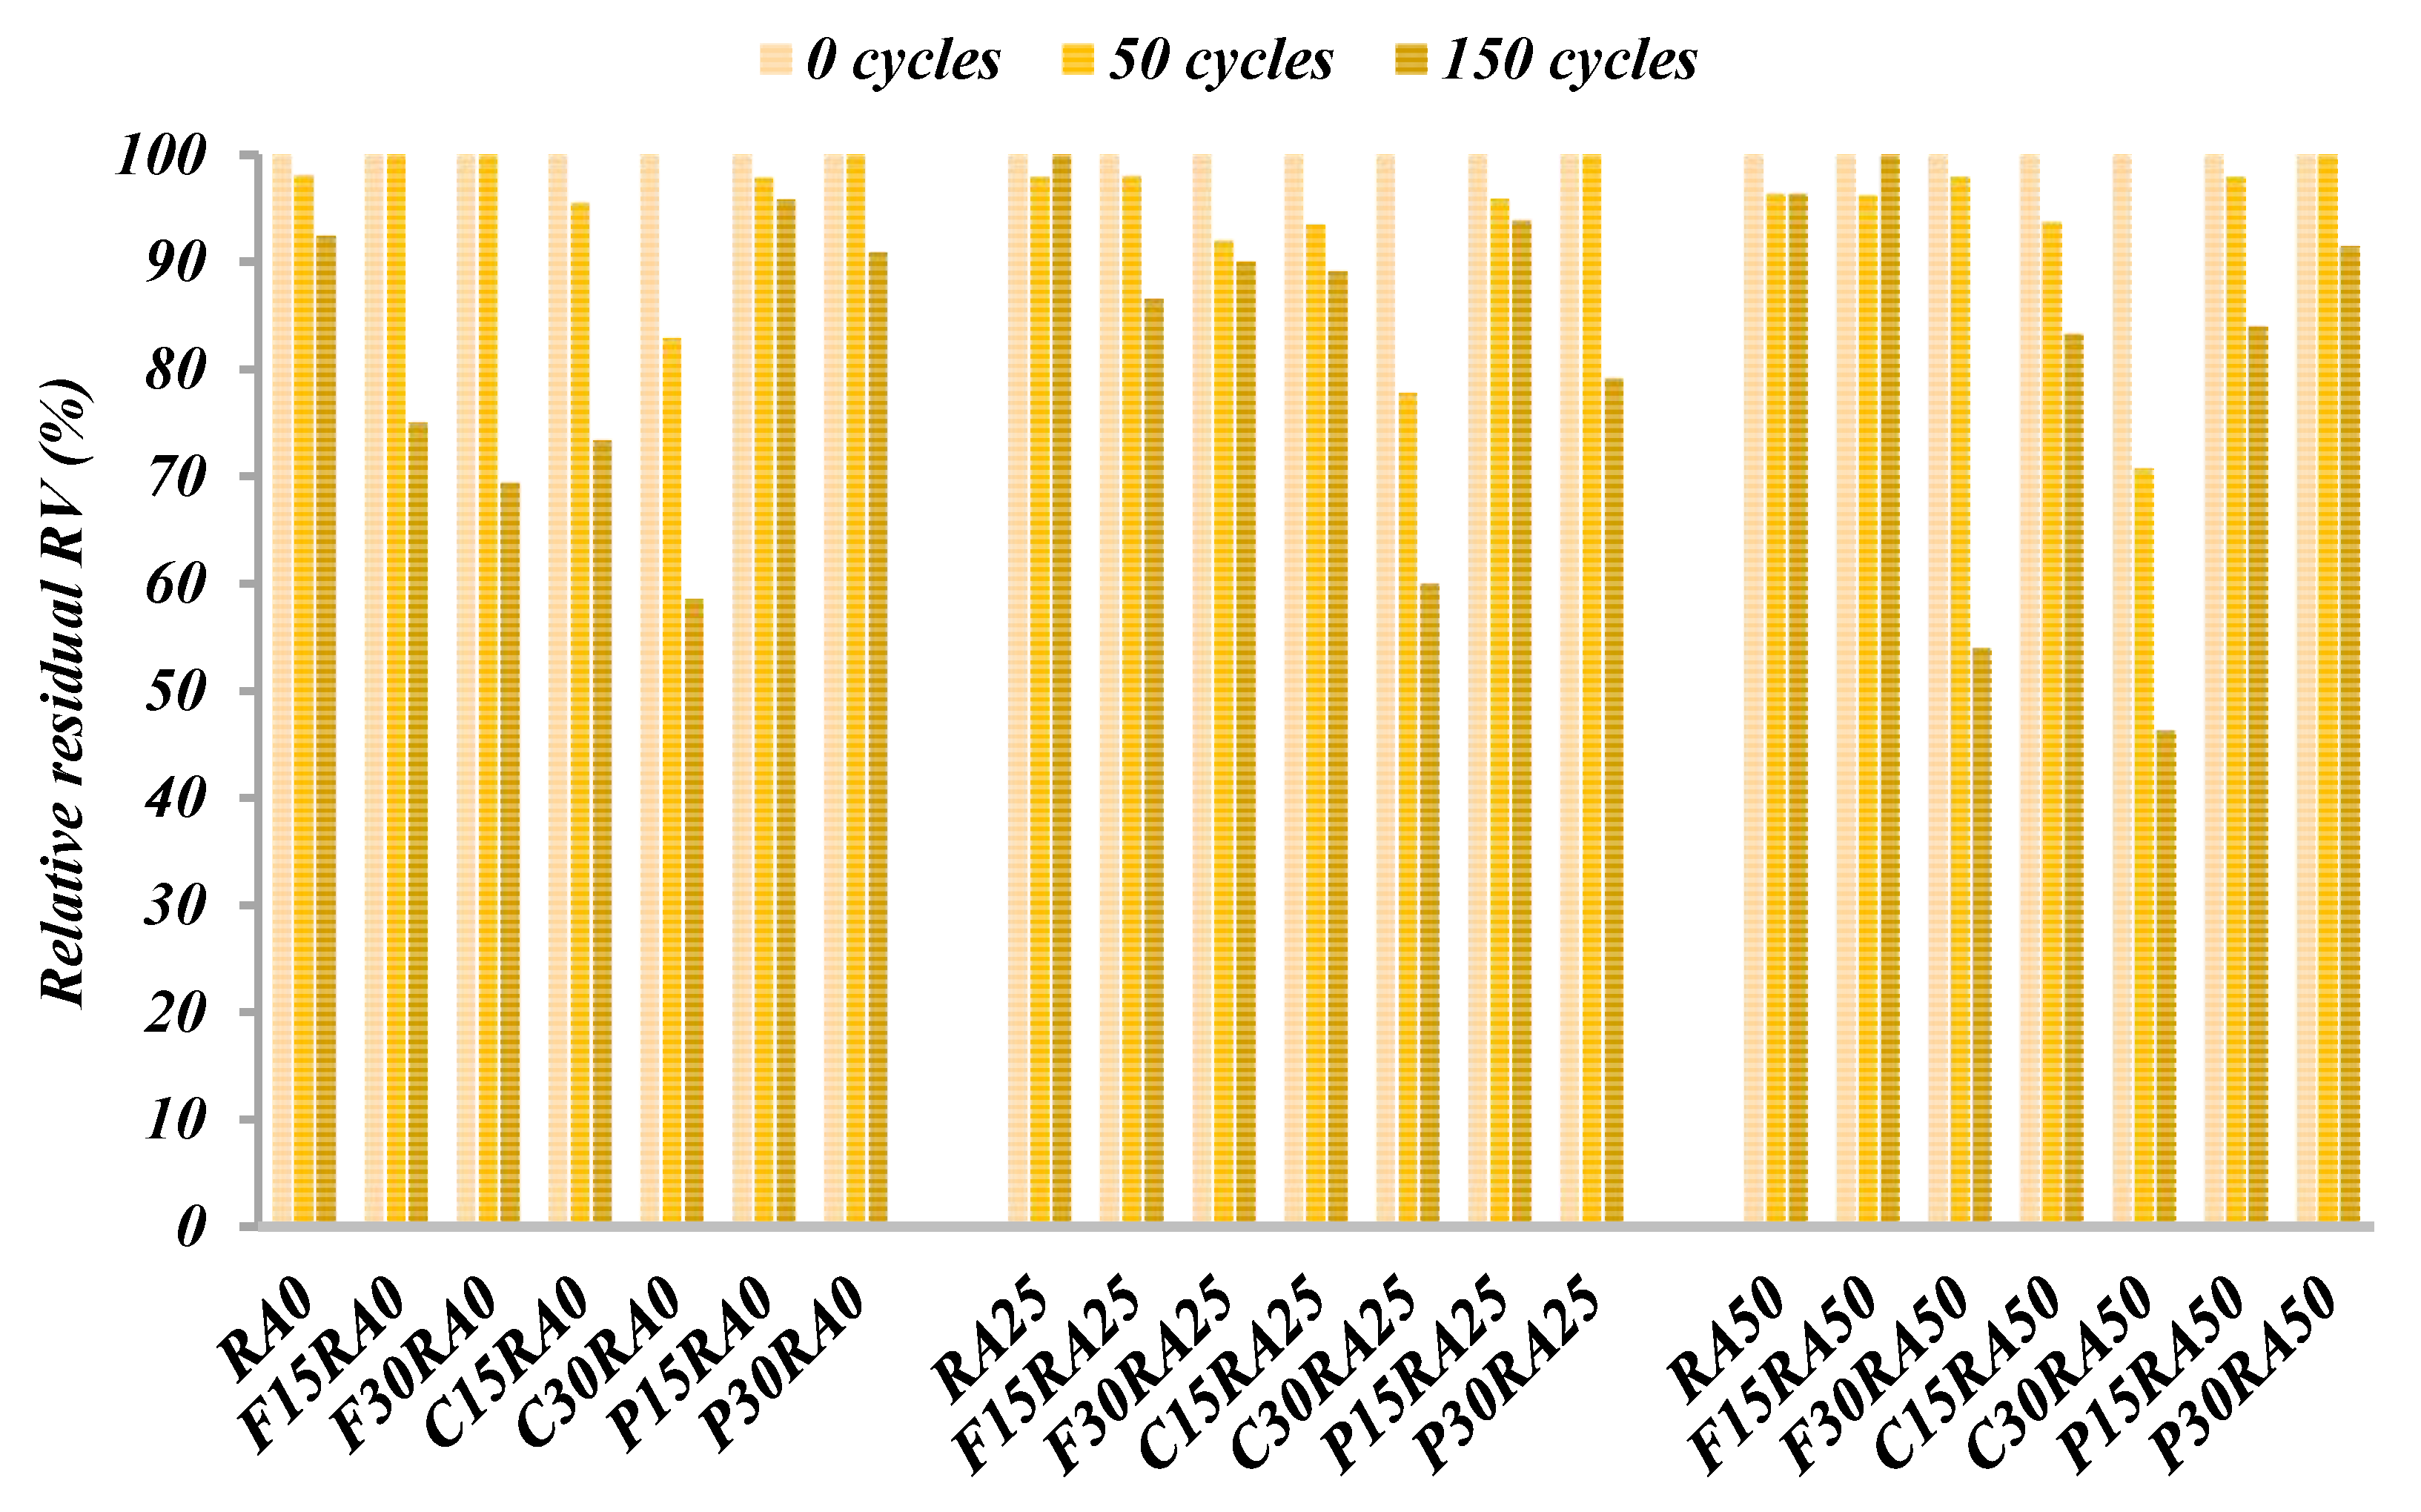
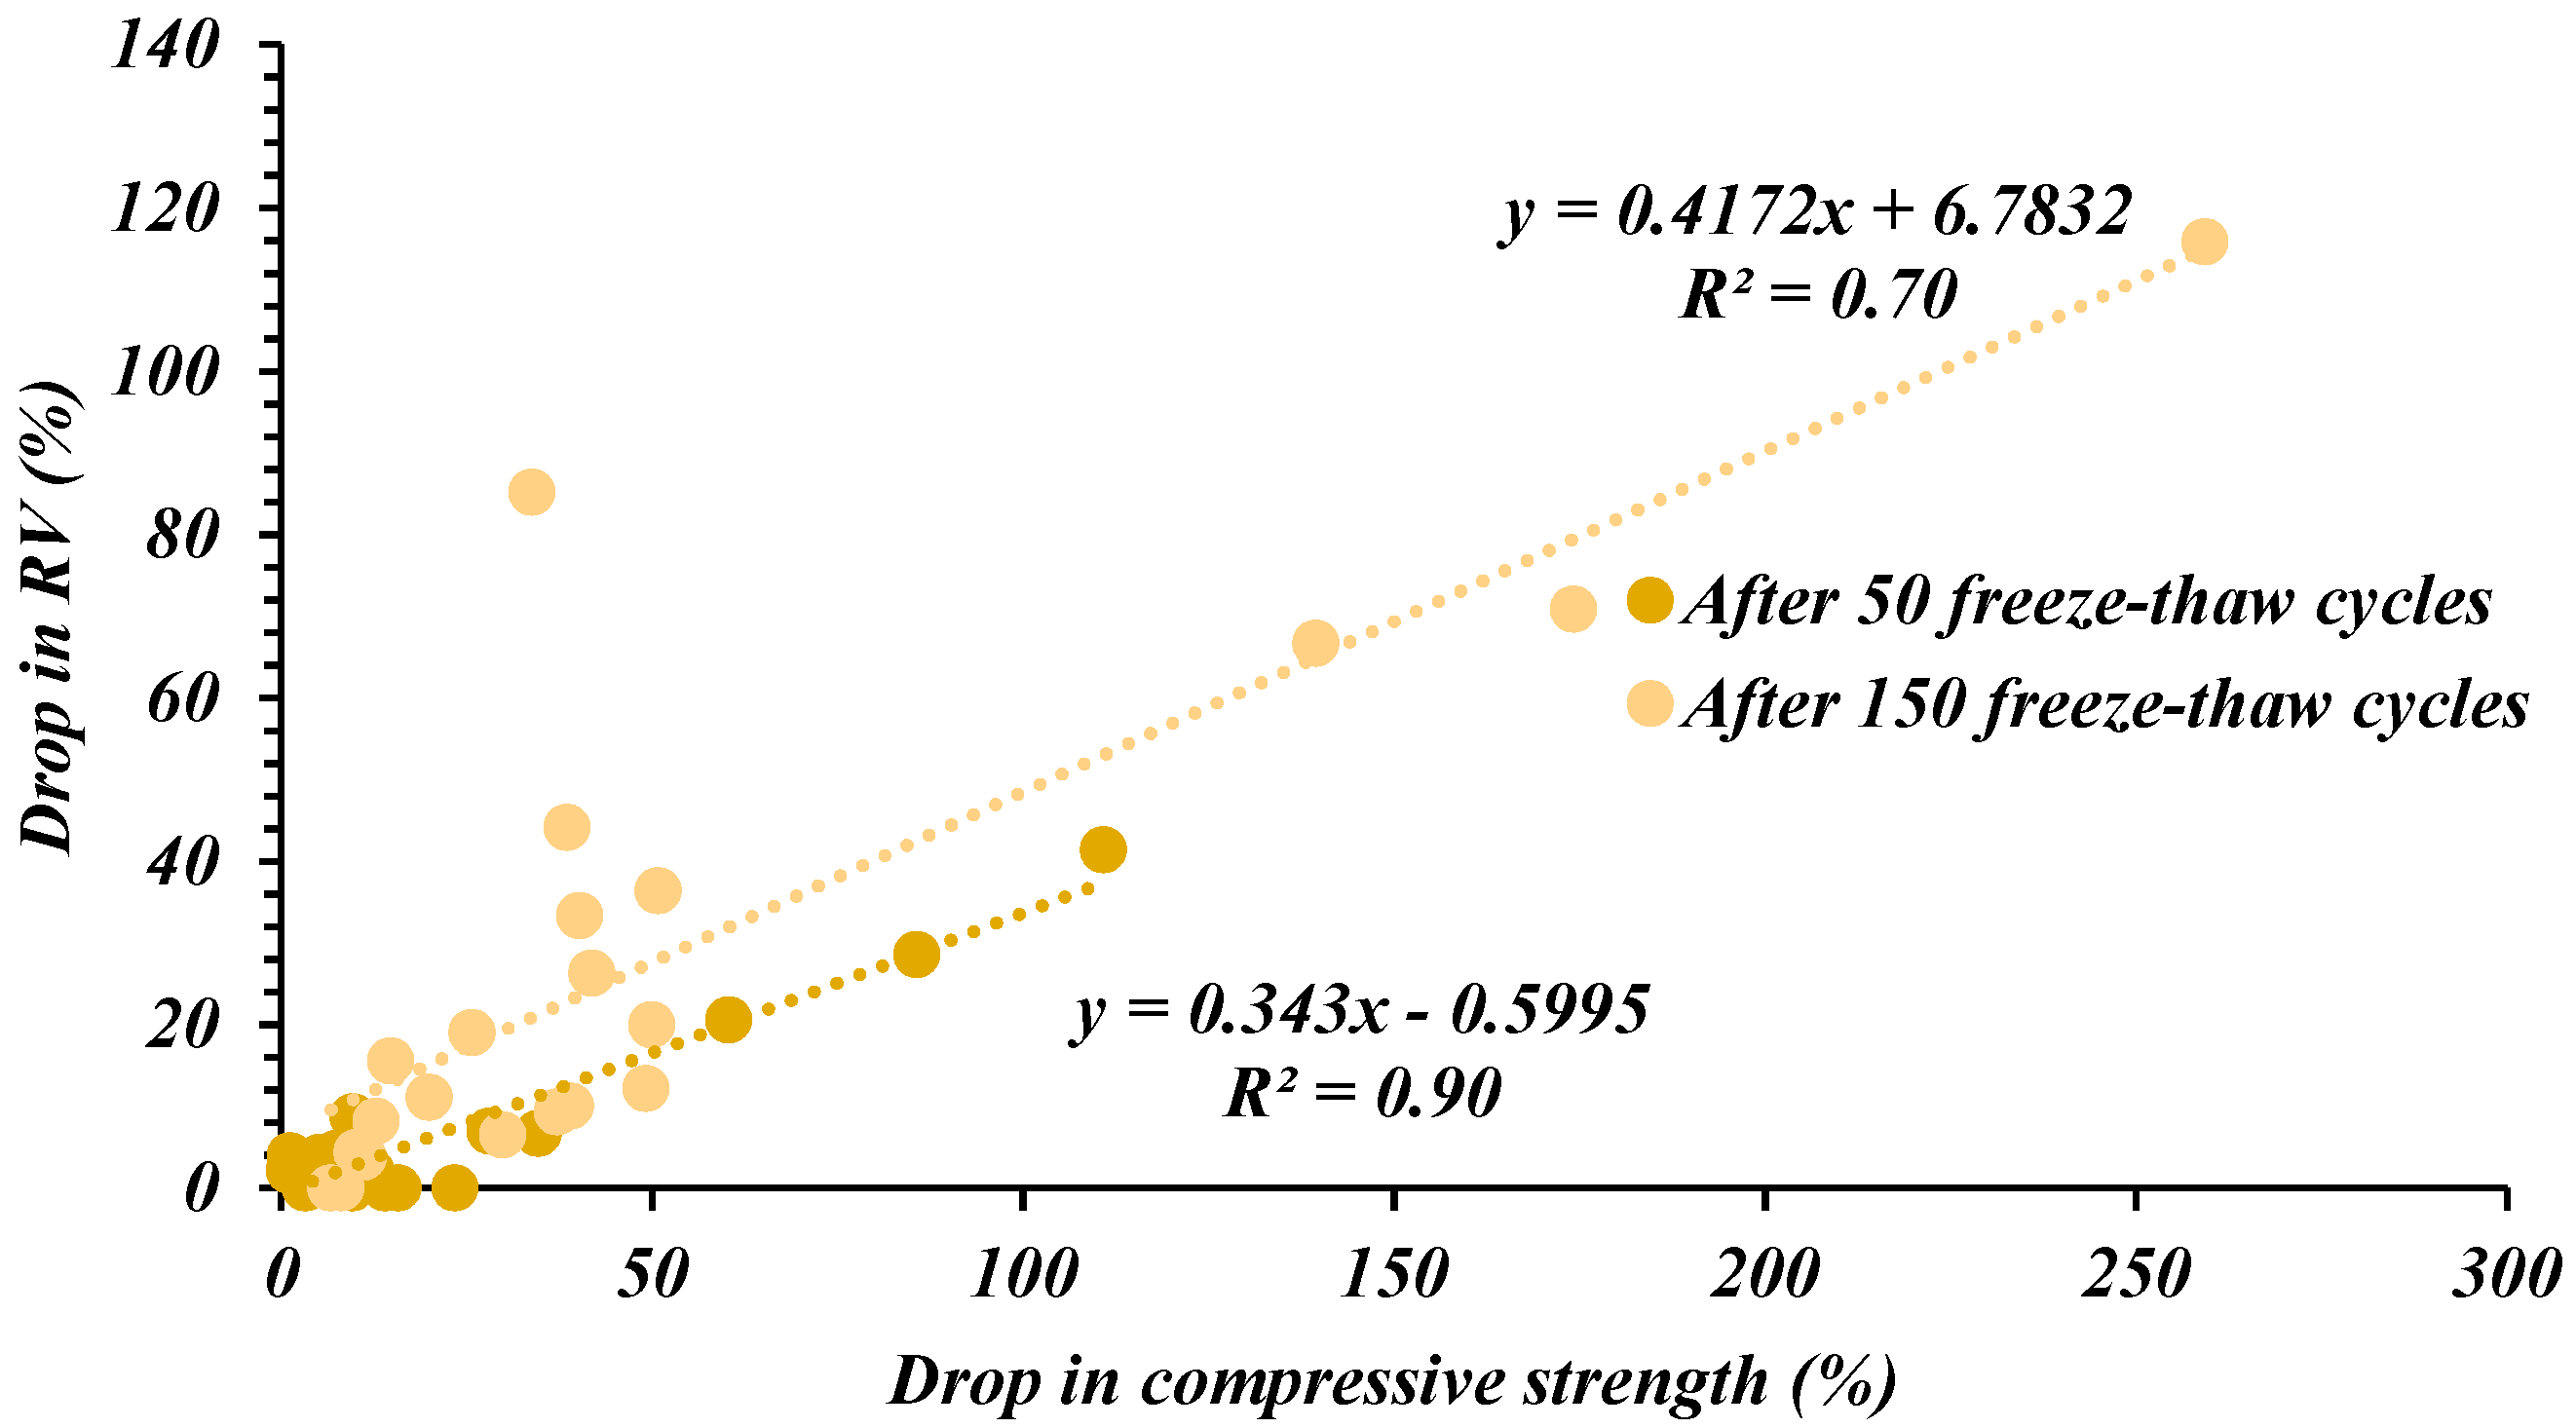
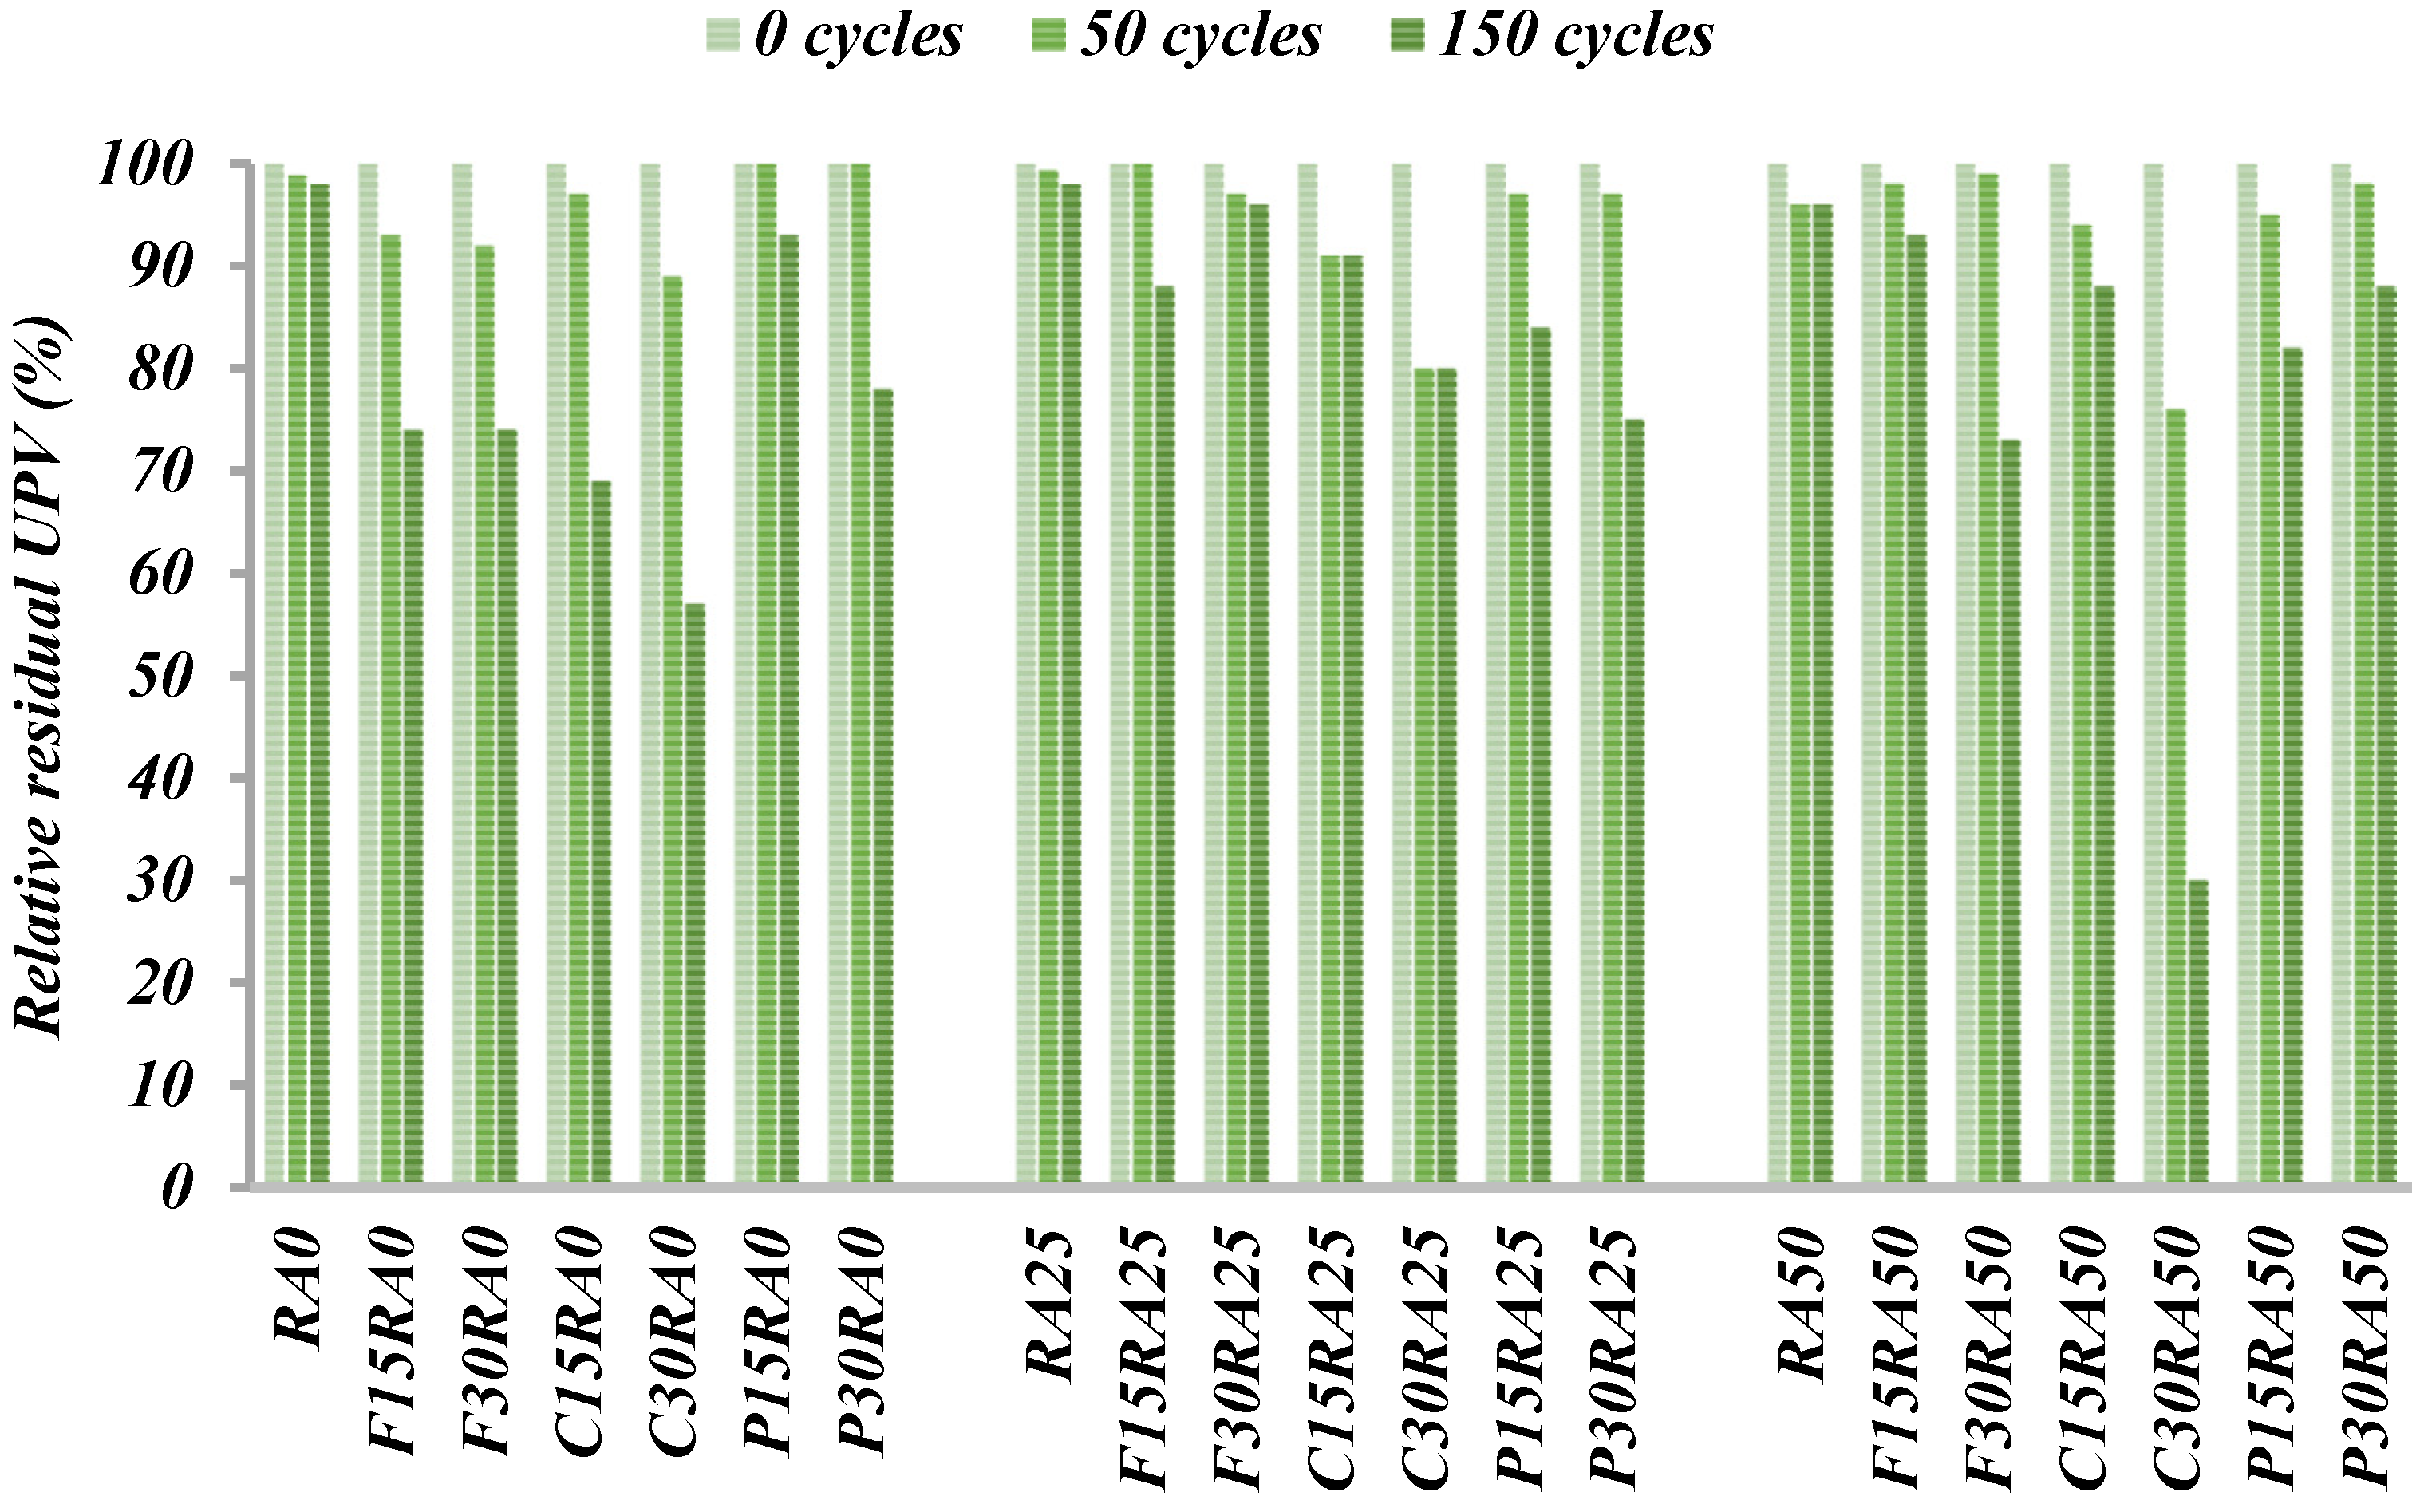
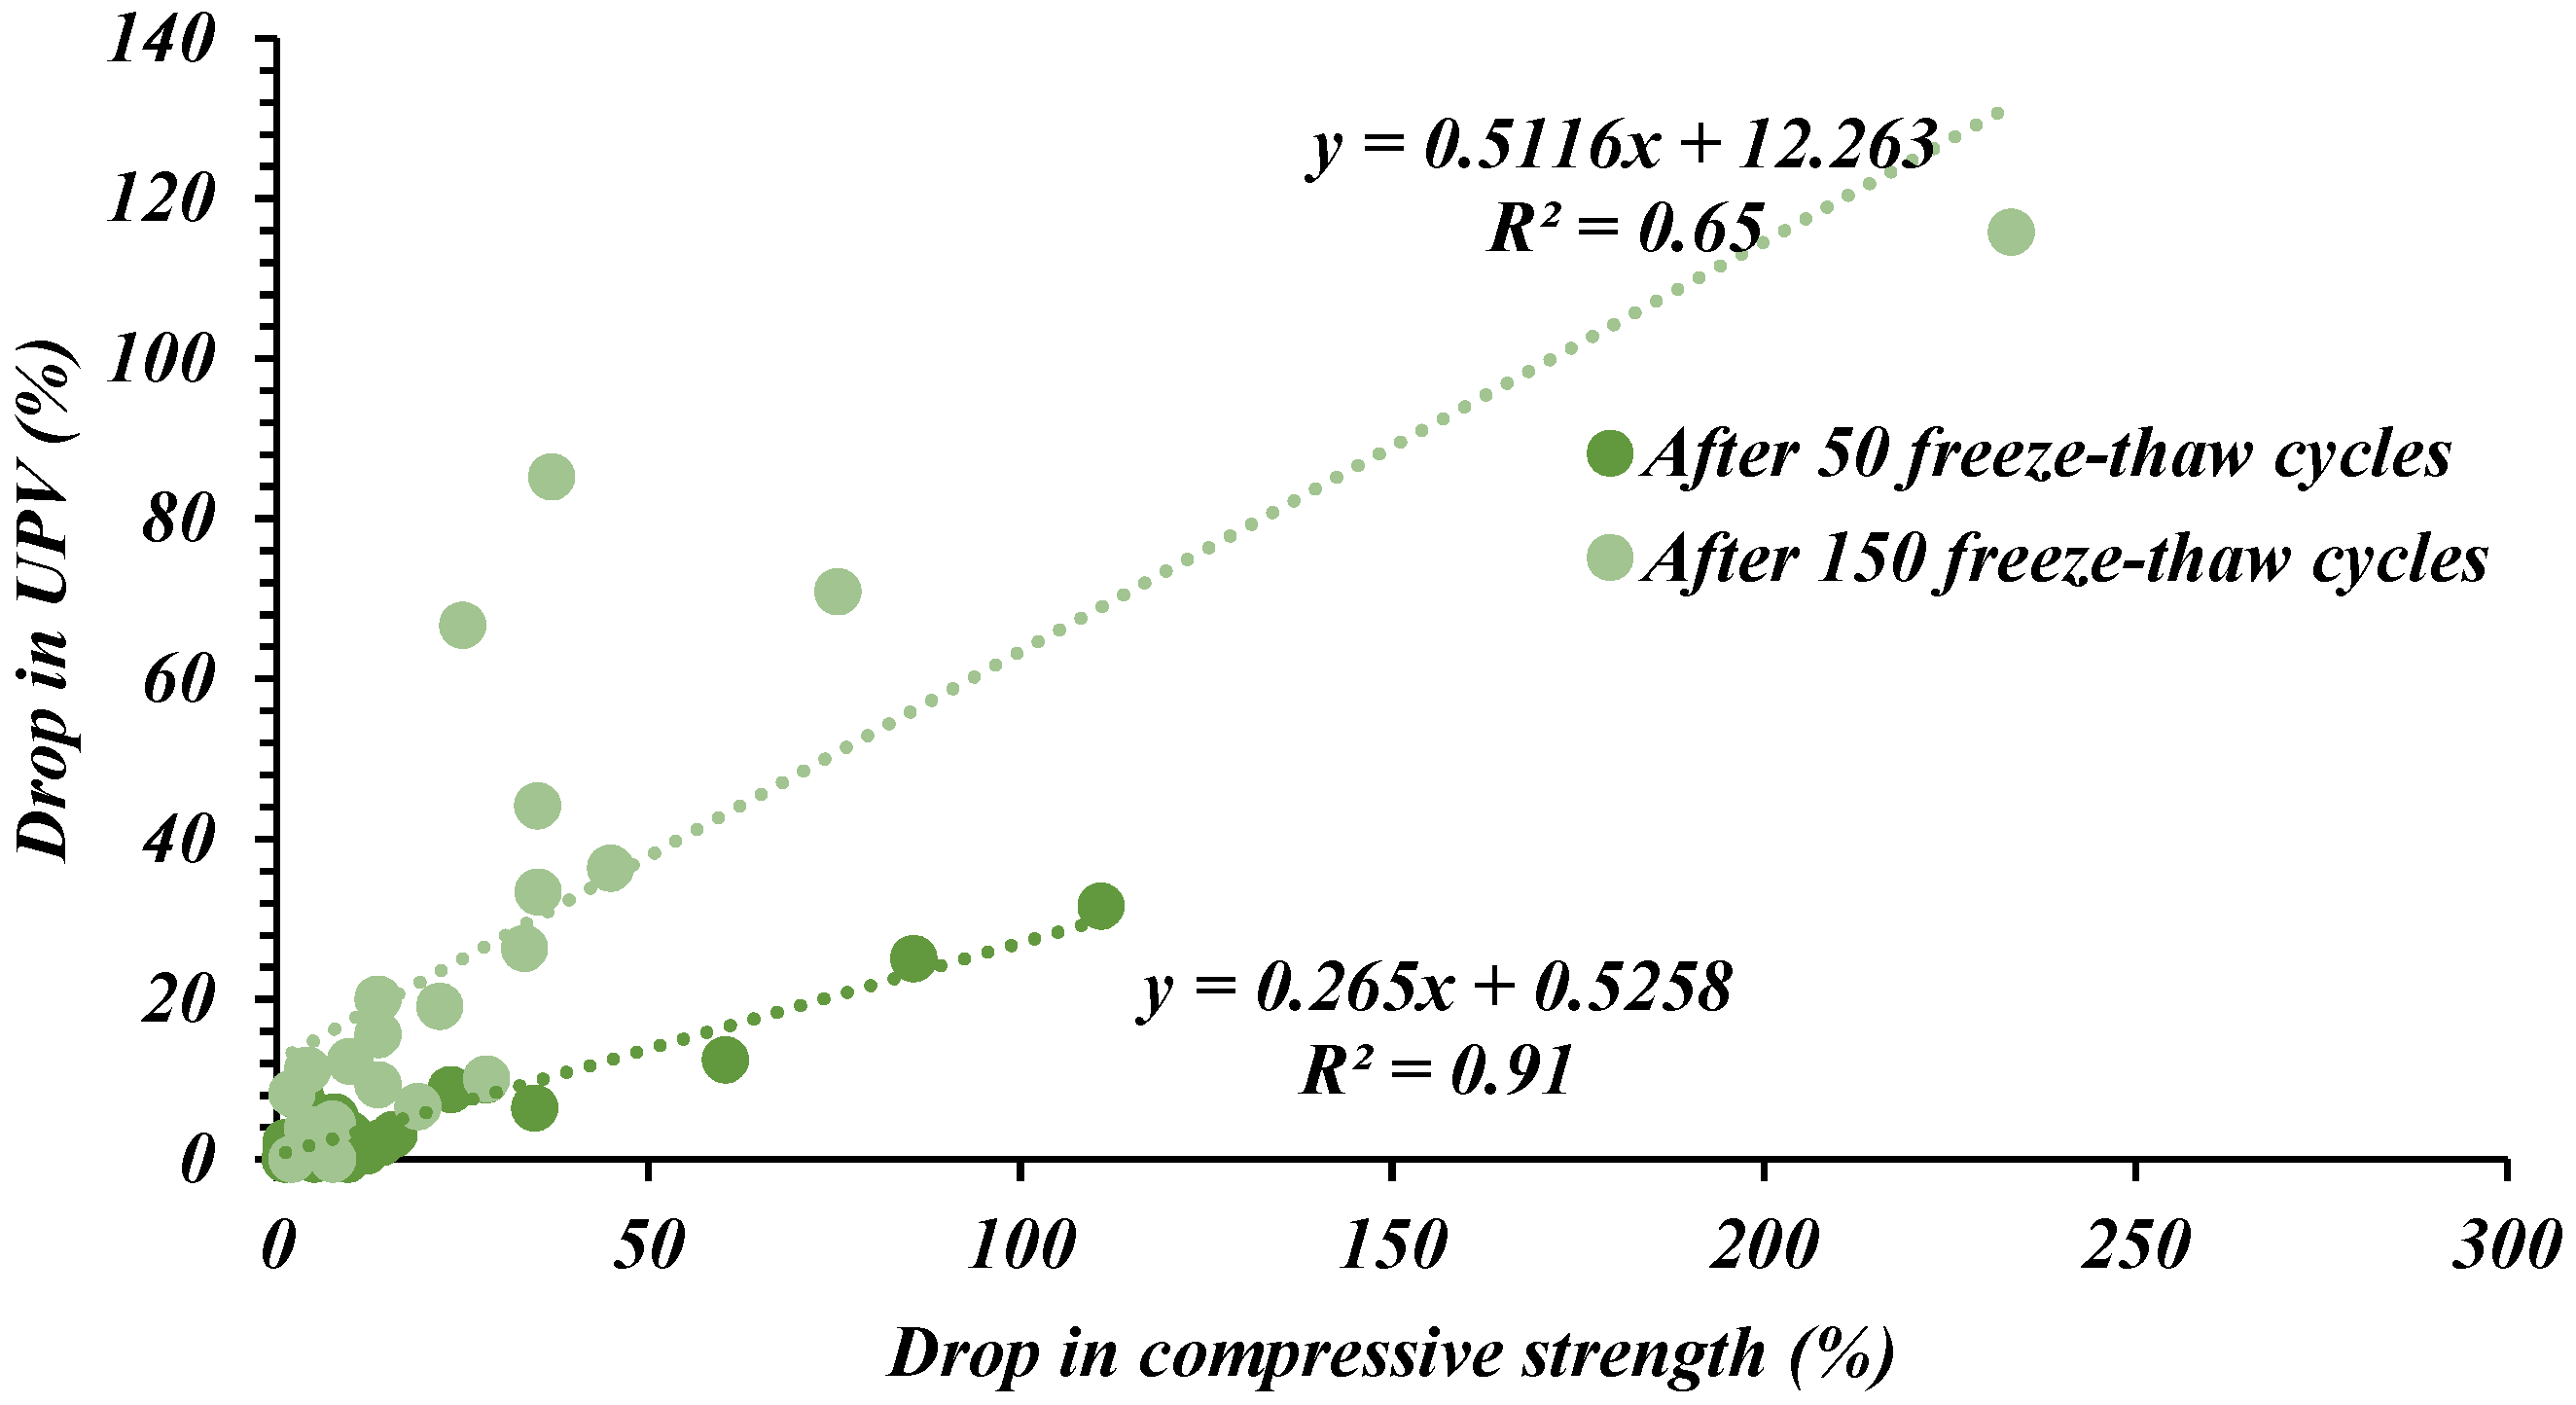
Given the fact of the good quality of RA and similarity in density with NA, mixes prepared with RA showed slight variation in RVs and UPV results. Based on the obtained results, relationships between compressive strength and RVs or UPV have been proposed to assess the compressive strength at different ages and after exposure to freeze–thaw cycles. The proposed relationships showed that BS EN 13795 [40] is conservative for predicting SCHPC compressive strength. Non-destructive evaluation methods provide an acceptable prediction for compressive strength of SCHPC at different ages and in different environments.

Author Contributions

Conceptualization, M.A.A. and R.N.; methodology, M.A.A.; validation, M.A.A. and B.A.T.; formal analysis, M.A.A.; investigation, M.A.A. and R.N.; resources, R.N.; writing—original draft preparation, M.A.A.; writing—review and editing, R.N. and B.A.T.; visualization, M.A.A. and B.H.A.B.; supervision, B.H.A.B.; project administration, M.A.A.; funding acquisition, B.H.A.B. All authors have read and agreed to the published version of the manuscript.

Funding

The authors wish to thank Universiti Sains Malaysia which supports the research under, Individual Research Grant Scheme 1001/PAWAM/8014037.

Institutional Review Board Statement

Not applicable.

Informed Consent Statement

Not applicable.

Acknowledgments

The authors would like to thank Abdulkader El Mir at University of Balamand for his endless help and support. Furthermore, the authors would like to thank the laboratory of the Department of Construction Materials and Technologies at Budapest University of Technology and Economics. Finally, the authors wish to thank Universiti Sains Malaysia which supports the research under, Individual Research Grant Scheme 1001/PAWAM/8014037.

Conflicts of Interest

The authors declare no conflict of interest.

References

  1. Sandanayake, M.; Zhang, G.; Setunge, S. Estimation of environmental emissions and impacts of building construction–A decision making tool for contractors. J. Build. Eng. 2018, 21, 173–185. [Google Scholar] [CrossRef]
  2. Thives, L.P.; Ghisi, E. Asphalt mixtures emission and energy consumption: A review. Renew. Sustain. Energy Rev. 2017, 72, 473–484. [Google Scholar] [CrossRef]
  3. Mikulčić, H.; Klemeš, J.J.; Vujanović, M.; Urbaniec, K.; Duić, N. Reducing greenhouse gasses emissions by fostering the deployment of alternative raw materials and energy sources in the cleaner cement manufacturing process. J. Clean. Prod. 2016, 136, 119–132. [Google Scholar] [CrossRef]
  4. Bai, G.; Zhu, C.; Liu, C.; Liu, B. An evaluation of the recycled aggregate characteristics and the recycled aggregate concrete mechanical properties. Constr. Build. Mater. 2020, 240, 117978. [Google Scholar] [CrossRef]
  5. Bungey, J.H.; Millard, S.G.; Grantham, M.G. Testing of Concrete in Structures, 4th ed.; CRC Press, Taylor & Francis: Abingdon, UK, 2018. [Google Scholar]
  6. Hack, R.; Huisman, M. Estimating the Intact Rock Strength of a Rockmass by Simple Means, in: Engineering Geology for Developing Countries. In Proceedings of the 9th Congress of the International Association for Engineering Geology and the Environment (IAEG), Durban, South Africa, 16–20 September 2002. [Google Scholar]
  7. Breccolotti, M.; Bonfigli, M.F.; Materazzi, A. Influence of carbonation depth on concrete strength evaluation carried out using the SonReb method. NDT E Int. 2013, 59, 96–104. [Google Scholar] [CrossRef]
  8. Breysse, D. Nondestructive evaluation of concrete strength: An historical review and a new perspective by combining NDT methods. Constr. Build. Mater. 2012, 33, 139–163. [Google Scholar] [CrossRef]
  9. Craeye, B.; van de Laar, H.; van der Eijk, J.; Gijbels, W.; Lauriks, L. On-site strength assessment of limestone based concrete slabs by combining non-destructive techniques. J. Build. Eng. 2017, 13, 216–223. [Google Scholar] [CrossRef]
  10. Mohammed, T.U.; Rahman, N. Effect of types of aggregate and sand-to-aggregate volume ratio on UPV in concrete. Constr. Build. Mater. 2016, 125, 832–841. [Google Scholar] [CrossRef]
  11. Tchamdjou, W.H.J.; Cherradi, T.; Abidi, M.L.; Pereira-De-Oliveira, L.A. Mechanical properties of lightweight aggregates concrete made with cameroonian volcanic scoria: Destructive and non-destructive characterization. J. Build. Eng. 2018, 16, 134–145. [Google Scholar] [CrossRef]
  12. Kazemi, M.; Madandoust, R.; de Brito, J. Compressive strength assessment of recycled aggregate concrete using Schmidt rebound hammer and core testing. Constr. Build. Mater. 2019, 224, 630–638. [Google Scholar] [CrossRef]
  13. Al-Mufti, R.L.; Fried, A. The early age non-destructive testing of concrete made with recycled concrete aggregate. Constr. Build. Mater. 2012, 37, 379–386. [Google Scholar] [CrossRef]
  14. Soares, D.; de Brito, J.; Ferreira, J.; Pacheco, J. In situ materials characterization of full-scale recycled aggregates concrete structures. Constr. Build. Mater. 2014, 71, 237–245. [Google Scholar] [CrossRef]
  15. Kou, S.-C.; Poon, C.S.; Agrela, F. Comparisons of natural and recycled aggregate concretes prepared with the addition of different mineral admixtures. Cem. Concr. Compos. 2011, 33, 788–795. [Google Scholar] [CrossRef]
  16. Kurda, R.; De Brito, J.; Silvestre, J.D. Indirect evaluation of the compressive strength of recycled aggregate concrete with high fly ash ratios. Mag. Concr. Res. 2018, 70, 204–216. [Google Scholar] [CrossRef]
  17. Khatib, J. Properties of concrete incorporating fine recycled aggregate. Cem. Concr. Res. 2005, 35, 763–769. [Google Scholar] [CrossRef]
  18. Justnes, H. How to Make Concrete More Sustainable. J. Adv. Concr. Technol. 2015, 13, 147–154. [Google Scholar] [CrossRef] [Green Version]
  19. Revilla-Cuesta, V.; Skaf, M.; Faleschini, F.; Manso, J.M.; Ortega-López, V. Self-compacting concrete manufactured with recycled concrete aggregate: An overview. J. Clean. Prod. 2020, 262, 121362. [Google Scholar] [CrossRef]
  20. BS EN 196-2. Method of Testing Cement. Chemical Analysis of Cement; BSI: London, UK, 2013. [Google Scholar]
  21. Abed, M.; Nemes, R. Mechanical Properties of Recycled Aggregate Self-Compacting High Strength Concrete Utilizing Waste Fly Ash, Cellular Concrete and Perlite Powders. Period. Polytech. Civ. Eng. 2019, 63, 266–277. [Google Scholar] [CrossRef] [Green Version]
  22. EFNARC. The European Guidelines for Self-Compacting Concrete Specification, Production, and Use, International Association of Experts for Specialised Construction and Concrete Systems, Europe; EFNARC: Flums, Switzerland, 2005. [Google Scholar]
  23. BS EN 12390-3. Testing hardened Concrete. Compressive Strength of Test Specimens; BSI: London, UK, 2009. [Google Scholar]
  24. BS EN 12504-2. Testing Concrete in Structures. Non-Destructive Testing. Determination of Rebound Number; BSI: London, UK, 2012. [Google Scholar]
  25. ASTM C597-97. Standard Test Method for Pulse Velocity Through Concrete; ASTM International: West Conshohocken, PA, USA, 1997. [Google Scholar]
  26. PD CEN/TR 15177. Testing the Freeze-Thaw Resistance of Concrete. Internal Structural Damage; BSI: London, UK, 2006. [Google Scholar]
  27. Elhakam, A.A.; Mohamed, A.E.; Awad, E. Influence of self-healing, mixing method and adding silica fume on mechanical properties of recycled aggregates concrete. Constr. Build. Mater. 2012, 35, 421–427. [Google Scholar] [CrossRef]
  28. Kou, S.; Poon, C.S. Enhancing the durability properties of concrete prepared with coarse recycled aggregate. Constr. Build. Mater. 2012, 35, 69–76. [Google Scholar] [CrossRef]
  29. Bui, N.K.; Satomi, T.; Takahashi, H. Effect of mineral admixtures on properties of recycled aggregate concrete at high temperature. Constr. Build. Mater. 2018, 184, 361–373. [Google Scholar] [CrossRef]
  30. Makul, N.; Sua-Iam, G. Effect of granular urea on the properties of self-consolidating concrete incorporating untreated rice husk ash: Flowability, compressive strength and temperature rise. Constr. Build. Mater. 2018, 162, 489–502. [Google Scholar] [CrossRef]
  31. Yu, L.-H.; Ou, H.; Lee, L.-L. Investigation on pozzolanic effect of perlite powder in concrete. Cem. Concr. Res. 2003, 33, 73–76. [Google Scholar] [CrossRef]
  32. Kou, S.-C.; Poon, C.S. Long-term mechanical and durability properties of recycled aggregate concrete prepared with the incorporation of fly ash. Cem. Concr. Compos. 2013, 37, 12–19. [Google Scholar] [CrossRef]
  33. Gyurkó, Z.; Szijártó, A.; Nemes, R. Cellular concrete waste as an economical alternative to traditional supplementary cementitious materials. J. Therm. Anal. Calorim. 2019, 138, 947–961. [Google Scholar] [CrossRef] [Green Version]
  34. Poon, C.; Shui, Z.; Lam, L.; Fok, H.; Kou, S. Influence of moisture states of natural and recycled aggregates on the slump and compressive strength of concrete. Cem. Concr. Res. 2004, 34, 31–36. [Google Scholar] [CrossRef]
  35. Hamood, A.; Khatib, J.; Williams, C. The effectiveness of using Raw Sewage Sludge (RSS) as a water replacement in cement mortar mixes containing Unprocessed Fly Ash (u-FA). Constr. Build. Mater. 2017, 147, 27–34. [Google Scholar] [CrossRef]
  36. Szilágyi, K.; Borosnyói, A.; Zsigovics, I. Rebound surface hardness of concrete: Introduction of an empirical constitutive model. Constr. Build. Mater. 2011, 25, 2480–2487. [Google Scholar] [CrossRef]
  37. Nicolas, R.S.; Cyr, M.; Escadeillas, G. Performance-based approach to durability of concrete containing flash-calcined metakaolin as cement replacement. Constr. Build. Mater. 2014, 55, 313–322. [Google Scholar] [CrossRef]
  38. Kovler, K.; Wang, F.; Muravin, B. Testing of concrete by rebound method: Leeb versus Schmidt hammers. Mater. Struct. 2018, 51, 138. [Google Scholar] [CrossRef]
  39. Kim, J.-K.; Kim, C.-Y.; Yi, S.-T.; Lee, Y. Effect of carbonation on the rebound number and compressive strength of concrete. Cem. Concr. Compos. 2009, 31, 139–144. [Google Scholar] [CrossRef]
  40. BS EN 13795. Assessment of In-Situ Compressive Strength in Structures and Precast Concrete Components; BSI: London, UK, 2019. [Google Scholar]
  41. Saint-Pierre, F.; Philibert, A.; Giroux, B.; Rivard, P. Concrete Quality Designation based on Ultrasonic Pulse Velocity. Constr. Build. Mater. 2016, 125, 1022–1027. [Google Scholar] [CrossRef]
  42. Chu, S. Effect of paste volume on fresh and hardened properties of concrete. Constr. Build. Mater. 2019, 218, 284–294. [Google Scholar] [CrossRef]
  43. Tesinova, P. (Ed.) Advances in Composite Materials-Analysis of Natural and Man-Made Materials; InTech: London, UK, 2011. [Google Scholar]
  44. Evangelista, L.; Guedes, M.; de Brito, J.; Ferro, A.C.; Pereira, M. Physical, chemical and mineralogical properties of fine recycled aggregates made from concrete waste. Constr. Build. Mater. 2015, 86, 178–188. [Google Scholar] [CrossRef]
  45. Gesoğlu, M. Influence of steam curing on the properties of concretes incorporating metakaolin and silica fume. Mater. Struct. 2009, 43, 1123–1134. [Google Scholar] [CrossRef]
  46. Rao, A.; Jha, K.N.; Misra, S. Use of aggregates from recycled construction and demolition waste in concrete. Resour. Conserv. Recycl. 2007, 50, 71–81. [Google Scholar] [CrossRef]
  47. Vergara, L.; Miralles, R.; Gosálbez, J.; Juanes, F.; Ullate, L.; Anaya, J.; Hernández, M.; Izquierdo, M. NDE ultrasonic methods to characterise the porosity of mortar. NDT E Int. 2001, 34, 557–562. [Google Scholar] [CrossRef]
  48. Abed, M.; de Brito, J. Evaluation of high-performance self-compacting concrete using alternative materials and exposed to elevated temperatures by non-destructive testing. J. Build. Eng. 2020, 32, 101720. [Google Scholar] [CrossRef]
  49. Bogas, J.A.; de Brito, J.; Ramos, D. Freeze–thaw resistance of concrete produced with fine recycled concrete aggregates. J. Clean. Prod. 2016, 115, 294–306. [Google Scholar] [CrossRef]
  50. Hao, L.; Liu, Y.; Wang, W.; Zhang, J.; Zhang, Y. Effect of salty freeze-thaw cycles on durability of thermal insulation concrete with recycled aggregates. Constr. Build. Mater. 2018, 189, 478–486. [Google Scholar] [CrossRef]
  51. Abed, M.; Nemes, R.; Tayeh, B.A. Properties of self-compacting high-strength concrete containing multiple use of recycled aggregate. J. King Saud Univ.-Eng. Sci. 2018, 32, 108–114. [Google Scholar] [CrossRef]
  52. Li, X. Recycling and reuse of waste concrete in China. Resour. Conserv. Recycl. 2008, 53, 36–44. [Google Scholar] [CrossRef]
  53. Abed, M.A. Indirect Evaluation of the Compressive Strength of Recycled Aggregate Concrete at Long Ages and after Exposure to Freezing or Elevated Temperatures. Russ. J. Nondestruct. Test. 2021, 57, 195–202. [Google Scholar] [CrossRef]
  54. Abed, M.; Nemes, R. Long-term durability of self-compacting high-performance concrete produced with waste materials. Constr. Build. Mater. 2019, 212, 350–361. [Google Scholar] [CrossRef]
  55. Ebrahimi, K.; Daiezadeh, M.J.; Zakertabrizi, M.; Zahmatkesh, F.; Korayem, A.H. A review of the impact of micro- and nanoparticles on freeze-thaw durability of hardened concrete: Mechanism perspective. Constr. Build. Mater. 2018, 186, 1105–1113. [Google Scholar] [CrossRef]
Figure 1. Particle size distribution of cement and SCMs.
Sustainability 13 10605 g001
Figure 2. X-ray diffraction of cement and SCMs (A: alite (C3S). B: belite (C2S). C: brownmillerite (C4AF). D: gypsum (CSH2). E: gypsum un-hydrated (CS). H: hematite. K: kaolinite. P: plagioclase (lattice). Q: quartz. R: phyllosilicates. S: plagioclase (anorthite). T: tobermorite).
Sustainability 13 10605 g002
Figure 3. Grading curves of sand, NA and RA.
Sustainability 13 10605 g003
Figure 4. Relationships between 28 days’ compressive strength with respect to the compressive strengths which are determined at different ages.
Sustainability 13 10605 g004
Figure 5. Effect of RA or SCMs on the evolution of RV over time for SCHPC over time.
Sustainability 13 10605 g005
Figure 6. Correlation between the compressive strength and RVs of SCHPC.
Sustainability 13 10605 g006
Figure 7. Effect of RA and/or SCMs on the evolution of UPV over time for SCHPC over time.
Sustainability 13 10605 g007
Figure 8. Correlation between the compressive strength and UPVs of SCHPC.
Sustainability 13 10605 g008
Figure 9. Effect of RA and/or SCMs on the residual RVs determined after 50 and 150 freeze–thaw cycles.
Sustainability 13 10605 g009
Figure 10. Correlation between the drop in compressive strength and drop in RVs determined after 50 and 150 freeze–thaw cycles.
Sustainability 13 10605 g010
Figure 11. Effect of RA and/or SCMs on the residual UPV determined after 50 and 150 freeze–thaw cycles.
Sustainability 13 10605 g011
Figure 12. Correlation between the drop in compressive strength and drop in UPVs determined after 50 and 150 freeze–thaw cycles.
Sustainability 13 10605 g012
Table 1. Chemical compositions and physical properties of cement and the SCMs.
Measured PropertyCEM IWFAWPPWCC
Density (g/cm3)3.022.152.331.96
Specific surface area (cm2/g)3326432325012513
Loss on ignition3.01.952.09.25
SiO219.3343.0273.554.28
CaO63.4315.071.3822.81
MgO1.453.140.1551.15
Fe2O33.4214.172.582.16
Al2O34.6715.615.25.09
SO32.63.56-4.90
Chloride content0.040.02-0.02
Free CaO0.710.37--
K2O0.78-3.8-
Na2O0.33-2.08-
TiO2--0.087-
Insoluble part in dilute hydrochloric acid and sodium carbonate0.2649.7289.1333.02
Table 2. Properties of the coarse aggregate.
Physical TestsNA RA
Water absorption (%)1.05.6
Los Angeles wear (%)26.336.1
Density (kg/m3)26402612
Table 3. Concrete mixing proportions and slump flow measurements.
Mix designationContents in kg/m3Slump Flow in cm
CEM I 42.5 NWCCWFAWPPSandCoarse AggregateSuperplasticizerWater
NARA
0/44/16
Series I: 0% RA
RA050000078393901.517569.8
F15RA042507507679200217573
F30RA0350015007519010317573.5
P15RA042500757749280317562.5
P30RA03500015076691803.7517559
C15RA0425750076691901.717565.5
C30RA03501500075089903.2517560
Series II: 25% RA replacement
RA255000007837042301.517568
F15RA254250750767690226217573.5
F30RA2535001500751475221317572
P15RA254250075774697228317561.5
P30RA25350001507666882253.7517559
C15RA2542575007666902251.717565.5
C30RA25350150007506742203.2517558
Series III: 50% RA replacement
RA505000007834704601.517567.5
F15RA504250750767460251217572
F30RA5035001500751451442317572.8
P15RA504250075774464455317560.8
P30RA50350001507664594503.7517557.5
C15RA5042575007664594511.717565.5
C30RA50350150007504514423.2517558
Table 4. Conducted tests and their specimens.
Target TestType of TestMeasurementsSpecimensAges of TestNumber of Specimens for Each Mix
TypeNumber
Compressive strengthNon-destructiveRVsCubes, 150 × 150 × 150 mm328, 90, 270, 740 days12
UPV
DestructiveCompressive strength test
Freeze–thaw resistanceNon-destructiveRelative residual RVsCubes, 150 × 150 × 150 mm9270 days9
Relative residual UPV
DestructiveRelative residual compressive strength
Total21
Table 5. Compressive strength of SCHPC at different ages up to 740 days. All values have been rounded to the nearest 10. (The compressive strength unit is MPa).
Mix28 Days90 Days270 Days740 Days
RA081868888
F15RA073798085
F30RA067778081
C15RA073797978
C30RA052626259
P15RA082939496
P30RA066737980
RA2575869090
F15RA2572818688
F30RA2581848596
C15RA2572818376
C30RA2555596661
P15RA2583909192
P30RA2580909196
RA5079909799
F15RA507786100100
F30RA5086888899
C15RA5077868682
C30RA5054575758
P15RA5067738385
P30RA5065778185
Table 6. Relative residual compressive strength of SCHPC after freeze–thaw cycles exposure. All values have been rounded to the nearest 10. (The relative residual compressive strength unit is %).
Mix0 Cycles50 Cycles150 CyclesMix0 Cycles50 Cycles150 CyclesMix0 Cycles50 Cycles150 Cycles
RA0100106109RA2510010594RA501009590
F15RA01009771F15RA2510010387F15RA501009992
F30RA01008172F30RA251009183F30RA501008975
C15RA01009266C15RA251007867C15RA501007467
C30RA01006236C30RA251005442C30RA501004728
P15RA010010291P15RA251009377P15RA501009380
P30RA01009272P30RA251008670P30RA501008873
Publisher’s Note: MDPI stays neutral with regard to jurisdictional claims in published maps and institutional affiliations.

