Article

Identification of Coupling and Influencing Factors between Urbanization and Ecosystem Services in Guanzhong, China

1
State Key Laboratory of Eco-Hydraulics in Northwest Arid Region of China, Xi’an University of Technology, No. 5 South Jinhua Road, Xi’an 710048, China
2
Key Laboratory of National Forestry Administration on Ecological Hydrology and Disaster Prevention in Arid Regions, Xi’an 710048, China
3
Power China Northwest Engineering Corporation Limited, Xi’an 710065, China
*
Author to whom correspondence should be addressed.
Sustainability 2021, 13(19), 10637; https://0-doi-org.brum.beds.ac.uk/10.3390/su131910637
Submission received: 19 August 2021 / Revised: 19 September 2021 / Accepted: 20 September 2021 / Published: 25 September 2021
(This article belongs to the Special Issue Soil Erosion and Water and Soil Conservation)

Abstract

:
Urbanization trades off the value of ecosystem services for economic value, either directly or indirectly. Optimizing the synergistic effects of both and identifying the coupled influences associated with human activities are essential for sustainable regional development and policy formulation. In this study, we analyzed the spatial differentiation of regional ecosystem service values and urbanization using ArcGIS 10.2, STATA 15.1, the value coefficient method, the urbanization index model, and the coupled coordination model, assessed their coupled coordination status, and further explored the influencing factors, taking the Guanzhong region of China as an example. The results show that the substrate has an important influence on ecosystem service values, with woodlands being the most important value provider and the largest contribution of regulating service values, with a spatial “center-periphery” ring-band growth distribution. There is a clear hierarchy of urbanization, with the higher the administrative level, the higher the level of urbanization. The overall coupling and coordination of ecosystem services and urbanization is in a non-equilibrium state, with high levels in the south and low levels in the north. Further research on the factors influencing the coupling found that the disposable income of urban residents and the population employed in the tertiary industry had the greatest influence.

1. Introduction

Ecosystem services (ES) are the benefits that people derive from ecosystems and can be divided into four categories [1,2,3]: provisioning services (food production, raw material production, etc.), regulating services (climate regulation, gas regulation, etc.), supporting services (biodiversity conservation, soil conservation, etc.), and cultural services (outdoor recreation, aesthetic landscape, etc.). Because ES can characterize ecological elements and functions, they have become important indicators for studying ecological and environmental issues [4,5]. The ecosystem service values (ESV) is the process of monetizing the benefits that humans derive from ecosystems. The monetization of ESV is often used to assess the impact of changes in ES on components of human well-being, is an important way to guide trade-offs in the policymaking process [6], and helps to understand the impact of economic activities on changes in ES and the feedback effects of these changes on economic activities [7].
Urbanization refers to the shift in population and land-use from rural to urban areas [8], and the degree of urbanization is an important indicator of a country or region’s level of economic, social, cultural, and technological development [9,10]. Urban expansion has become an important driver of global environmental change, while also having broad and far-reaching impacts on the structure, function, and spatial evolution of ecosystems [11,12]. Urbanization and human activities have gradually changed the structure of ecosystems (e.g., vegetation cover, land use, etc.) as well as their processes (e.g., species decline), transforming natural ecosystems into coupled human–nature ecosystems [13,14,15,16].
The degree of coupling (C) [13,17] is used to describe the degree of interaction and influence within a system or between system elements. Thus, coupling and a related metric, coupling coordination (D), are used to measure whether the elements within a system are coordinated with each other during development, reflecting the trend from disorder to order in the system [18,19]. Currently, coupling is widely used in the study of climate change and the environment [13]. With the accelerated urbanization process and the increase in human requirements for intact ecological environments, ecosystem services have attracted more and more public attention. Scholars have conducted numerous studies in an attempt to reveal the interactive coupling relationship between urbanization and ecosystem services. As early as the 1980s, Rapport et al. [20] put forth the famous PSR (pressure, state, response) model, and Grossman et al. [21] put forth the hypothesis of the inverted “U” Kuznitz curve of the ecological environment, which laid a theoretical foundation for the discussion of the relationship between urbanization and the ecological environment. Estoque et al. [22] et al. found that urbanization led to a decline of more than 60% in ecosystem services between 1988 and 2009. Buy Antuyev et al. [23] found that urbanization contributes to the improvement of ecosystem function in arid areas by MODIS NDVI data and NPP model. Fang et al. [24] believes that there is a self-organizing and interactive coupling relationship between urbanization and the ecological environment. Ren et al. [25] constructed the evaluation index system and the coupling model of urbanization and the ecological environment system. Song et al. [13] used the coupling model of coordination to research dynamic trends in the development of rapid urbanization and the environment. XAE et al. [26] applied a coordinated coupled model to study the interactive coercive relationship between urbanization and ecosystem services in the metropolitan area. Wl et al. [27] studied the coupled coordination and spatiotemporal heterogeneity between urbanization and ecosystem health in Chongqing city.
Urbanization and ecosystems produce correlations and interactive couplings through their respective coupling elements. Therefore, the degree of coupling and the degree of coupling coordination can reflect the degree of correlation between urbanization and ecosystems. The stronger the correlation, the higher the degree of coupling. This allows us to identify the change of the system through the change of coupling degree and to explore the characteristics of socioeconomic development and ecosystems at a certain stage [28,29,30]. Therefore, the coupling between urbanization and ecosystems as well as the influencing factors are worth studying.
We selected the Guanzhong region as the study area to explore the relationship between urbanization development and ecosystem services and attempt to answer the following questions: (1) What is the spatial differentiation between ecosystem service values and urbanization? What kind of coupling relationship exists between the two? (2) How do the factors involved influence each other? What are the most significant influencing factors? (3) How can we adjust urbanization processes to ensure the maintenance of ecosystem services? This study would assist policy makers in tailoring urban development measures and finding a balance between urban development and the conservation of ecosystem services to ensure their harmonization.

2. Materials and Methods
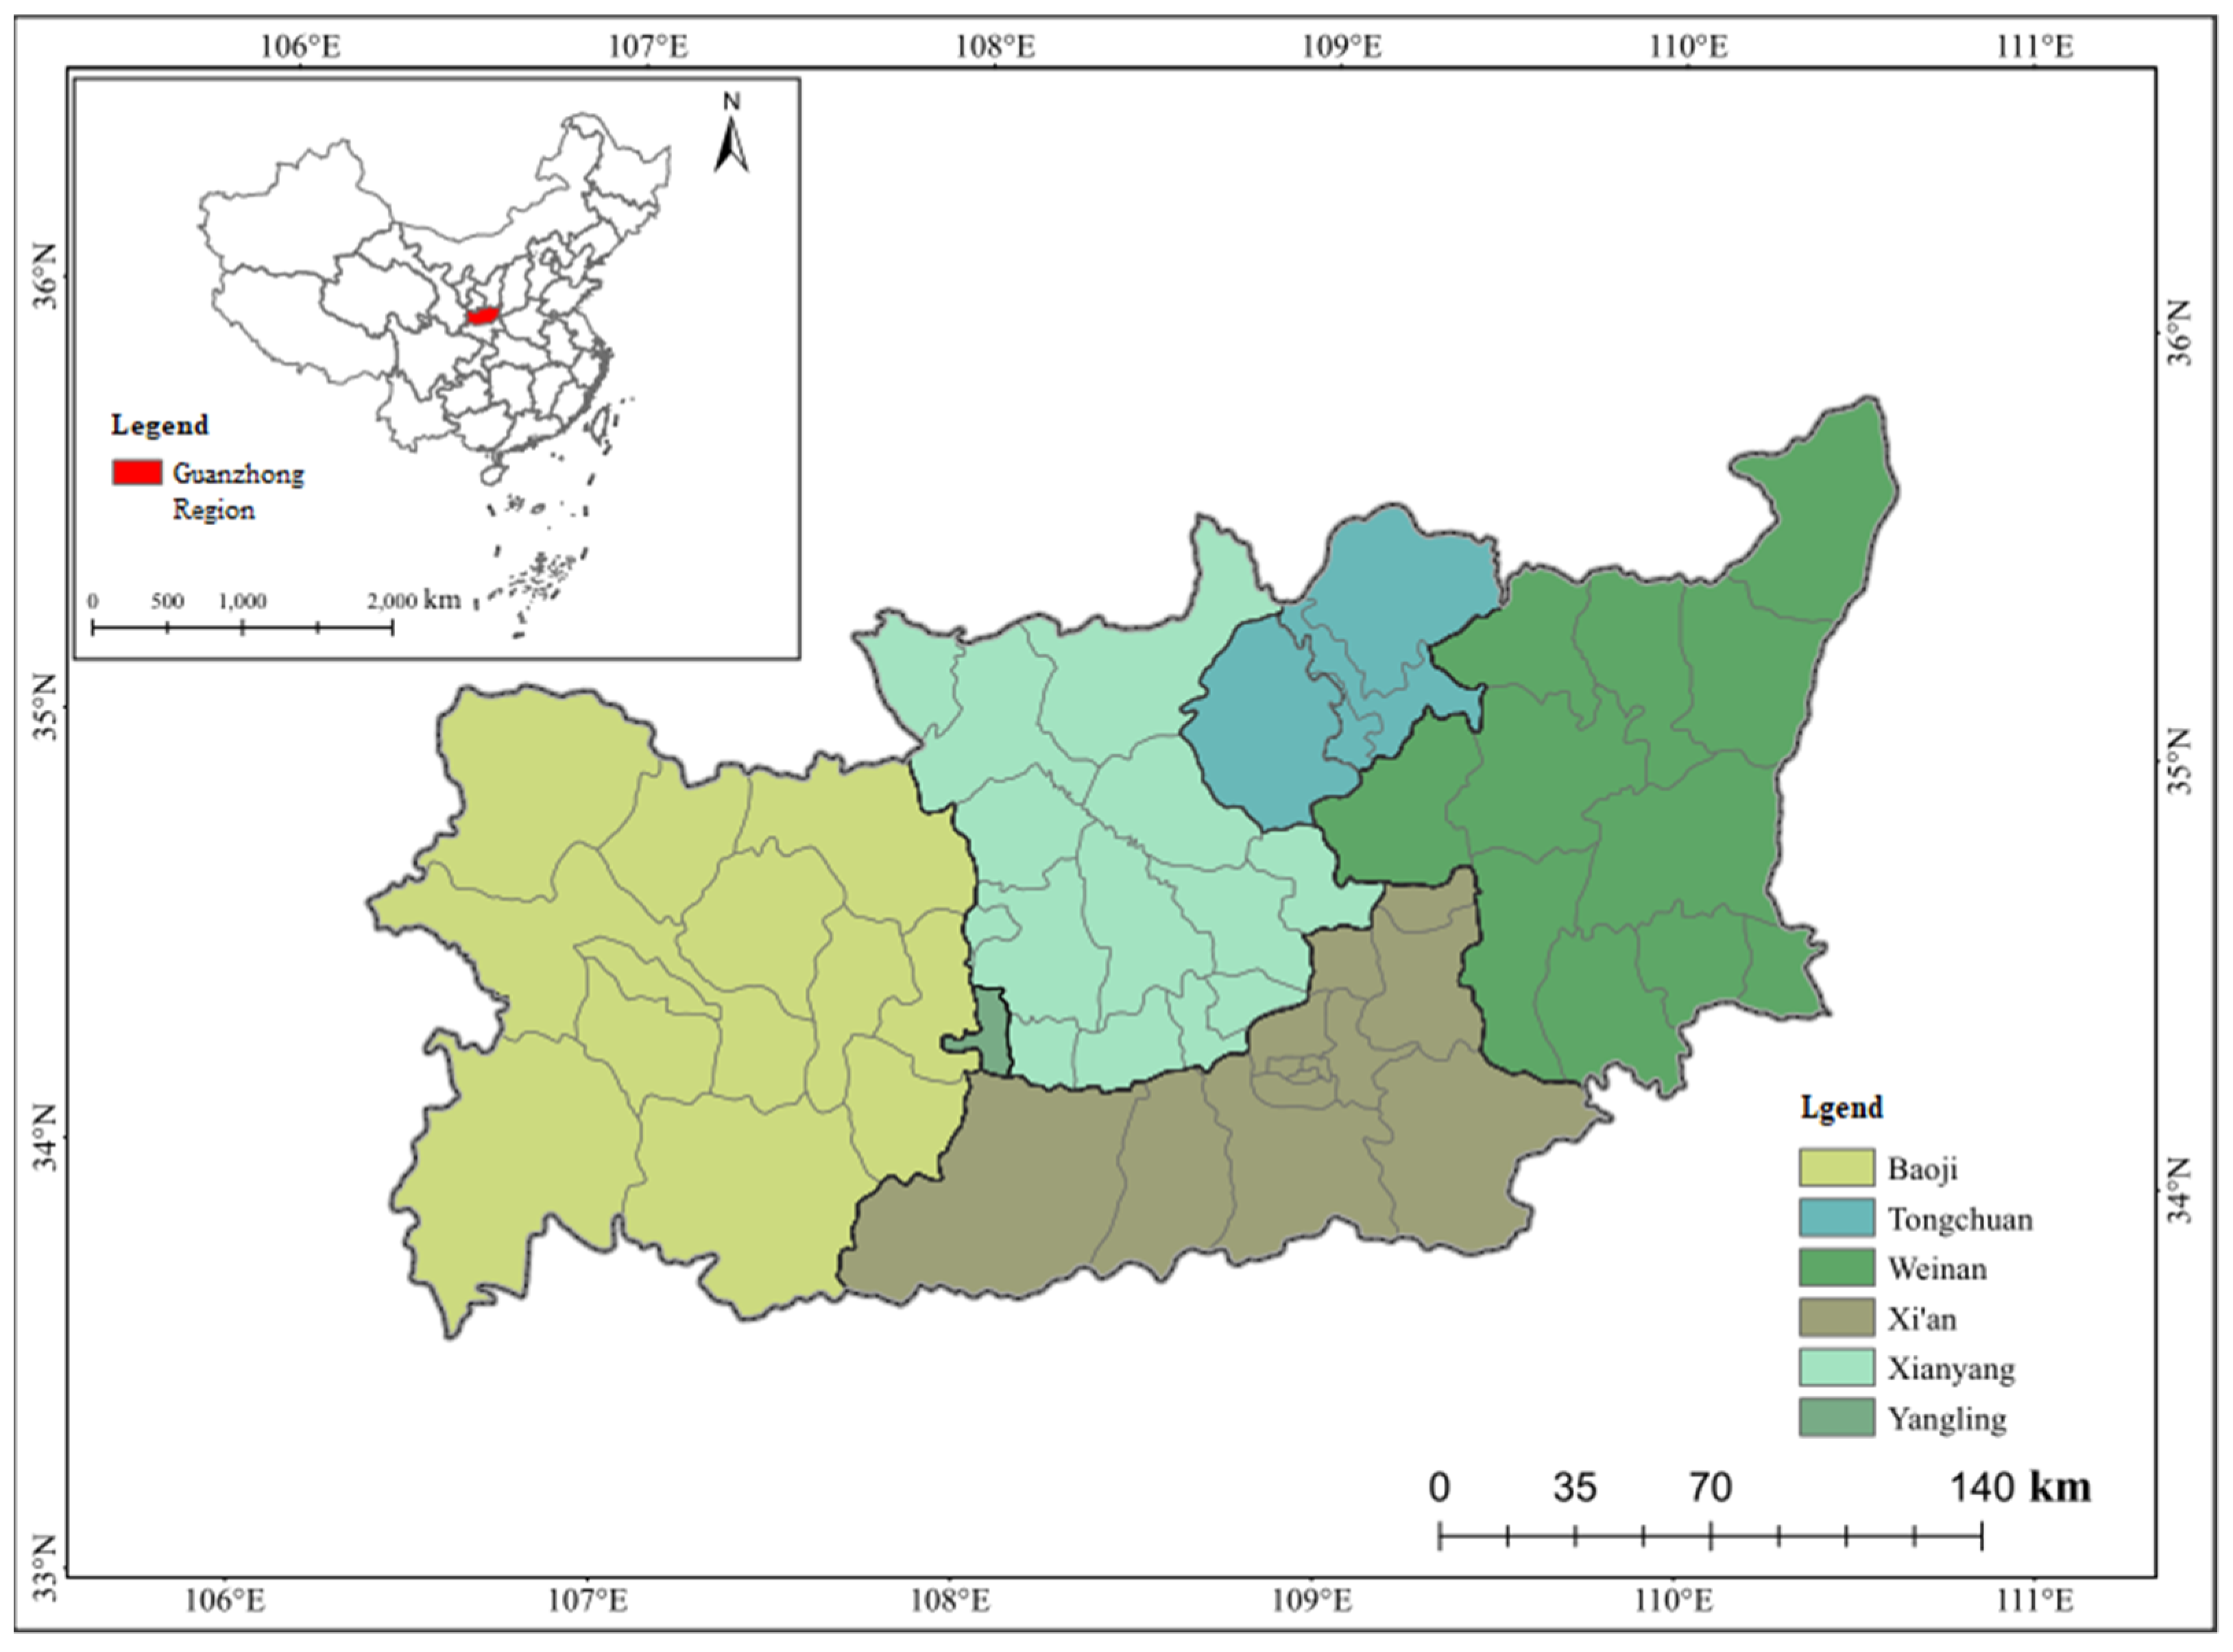
2.1. Study Area

The Guanzhong region belongs to Shaanxi Province, located in the middle part of inland China. Considering the unification of natural data and social statistics, we used the administrative boundary to divide the Guanzhong region into our study area (Figure 1), which mainly includes Xi’an, Xianyang, Baoji, Tongchuan and Weinan. The region is between 33°35′ N and 35°51′ N and between 106°19′ E and 110°36′ E. The Guanzhong region is a basin located between the Loess Plateau and the Qinling Mountain. This terrain is low in the west and high in the east. Furthermore, the Weihe River (a tributary of the Yellow River) runs through the central region (Figure 2). The Guanzhong region is also a warm temperate area with a semi-humid climate, four distinct seasons (i.e., hot and rainy summer, cold and dry winter, and sharp rise and fall in temperature in spring and autumn), and diverse vegetation types and agrotypes. It is at the core of the economic development of northwest China and Shaanxi Province and plays a significant role in the strategic layout of western development. With the rapid development of the economy, it has experienced a significant population influx. The resident population of the Guanzhong region was 19.73 million in 2010 and reached approximately 23.61 million in 2015, representing a five-year population increase of 19.6%. The GDP was CNY 1.8 trillion and accounted for 65.42% of the GDP for Shaanxi Province.
In 2009, the Guanzhong-Tianshui Economic Region was approved by the State Council as an important strategic development region in western China [31]. In February 2018, the National Development and Reform Commission issued the notice on Printing the Development Planning of Guanzhong Plain Urban agglomeration [32], which formally joined the national urban agglomeration development camp. After the policies were established, the Guanzhong Region became an important area of concern for national development due to its special geographical location [33]. Understanding the coupling features of ecosystems and urbanization processes in the Guanzhong region is of high priority for the effective management and sustainable development of social-ecological systems.
LUCC data in 2015 were obtained from the Resource and Environmental Science Data Center of the Chinese Academy of Sciences (http://www.resdc.cn/Default.aspx, accessed on 24 September 2021). The spatial resolution is 30 m. Land use is divided into six categories: cultivated land, forest, grassland, open water, construction land, and unused land.

2.2. Methods

2.2.1. Evaluation of Ecosystem Service Values

Scholars such as Costanza et al. [1,3] have obtained a service value equivalent scale per unit area across a variety of ecosystems in the world. The equivalent factor method, which belongs to the unit-value-based approach, developed by Xie et al. [34,35] is the most widely used in China, especially for the ecosystem service evaluations that result from land use changes. For this method, the economic value of each ecosystem service is estimated as the product of an equivalence coefficient (dimensionless) and the economic value (expressed as yuan/hectare) represented by one standard equivalence factor, which is the value of the product or service provided per unit area.
Xie et al. [33,35] concluded that the economic value of 1 ecological service value equivalent factor is only one seventh of the existing data per unit area of farmland in the absence of human input. In this study, the equivalent value of ecosystem services in the Guanzhong region was derived based on the research results of the equivalent coefficients of Xie et al. [34,35] and Xu et al. [36]. The formula is as follows:
E i = λ × E o i           ( i = 1 , 2 , , 6 )
where λ denotes the equivalent correction coefficient of the ecological service value; Ei represents the revised ecological service value equivalent of land category i; and Eoi refers to the national average value of ecological service equivalent of land category i.
The formula for calculating the ecosystem service value of the equivalent factor is as follows:
V C k = 1 7 × P × 1 n i = 1 n Q i
where VCk is the ecosystem service value equivalent factor (yuan/hm2·a); P is the average grain yield of the whole country (yuan/kg); Qi is the average grain yield of the study area (kg/hm2); n is the main grain type in the Guanzhong region. Based on formulas (1) and (2), the table of ecosystem service values per unit area in the Guanzhong region was obtained (Table 1).
The factor that contributes most to the value of ecological services per unit area is watershed (Table 1), which has a strong regulatory function from the perspective of value per unit area.
Using the method given by Costanza et al. [1,3] to calculate ecosystem service values in the Guanzhong region, the formula is as follows:
E S V i j = K i j S i
where ESVij is the gross value of the j ecosystem services of the land use type, Kij is the unit value of the j ecosystem services of the i land use type, and Si is the total area of the i land type.

2.2.2. Revision of Urbanization Level Index

Since the urbanization rate is between 0 and 1, it is easily influenced by the size of cities and the degree of urban population concentration, resulting in two types of spurious urbanization: concentrated urbanization and dispersed urbanization. If factor analysis is conducted with various indicators, the synthesized numbers often become a tool for ranking or confirming the existence of spatial differences, so it is difficult to accurately describe the degree of differences. Therefore, this study returns to the indicator of urbanization rate and deals with its scale effect to obtain a concise and more explanatory composite urbanization index (NPUP) [37]. Its calculation formula is as follows:
N P U P = N A P U R C P
U R = U P T P 100 %
where NPUP is the comprehensive urbanization index, NAP is the non-agricultural population, UR is the urbanization rate, CP is the urban primacy degree, UP is the urban population, and TP is the total population. There are three methods to determine the urban primacy degree, namely, the urban primacy degree S2, the 4 cities index S4, and the 11 cities index S11:
S 2 = P 1 / P 2 S 4 = P 1 / ( P 2 + P 3 + P 4 ) S 11 = P 1 / ( P 2 + P 3 + + P 11 )
where Pi indicates the population size of the city with rank i, S2 has a theoretical value of 2, and S4 and S11 have theoretical values of 1. If the calculated value is greater than the theoretical value, the concentration degree of the first city is high, otherwise, the concentration degree is low.

2.2.3. The Coupling Coordination Degree Model (CCDM)

Coupling describes the phenomenon by which two or more systems influence each other through interactive mechanisms [13]. In recent years, this concept has been frequently used in ecological and socioeconomic studies. The relationship between urbanization and ESV influences each other (Figure 3), so we calculated the CCD of both at the system level. The mathematic formula which describes the coupling degree model is specified as follows:
C = { g ( E ) · f ( U ) [ α g ( E ) + β ( U ) ] 2 } 3
where C represents the coupling value and characterizes the degree of interaction between systems, 0 ≤ C ≤ 1. g(E) and f(U) are the evaluation functions of the comprehensive development level of ecosystem services and the degree of urbanization, respectively. α and β represent the contribution coefficient of the ecosystem and socioeconomic system, and α + β = 1; each system is equally important for coordinated ecological and socioeconomic development, α = β = 0.5 [38].
The degree of coupling between ecosystem services and urbanization provides a method by which the degree of coordination between the two can be determined. However, in some cases, the coupling degree index does not accurately reflect the overall efficiency and synergy effect of regional ecosystem services and urbanization; thus, it may be misleading to rely solely on the degree of coupling. For this reason, the coupling coordination degree model is used to evaluate the coordination degree of interactive coupling between land ecosystem services and urbanization in different regions [39], and the calculation formula is as follows:
D = C × T
T = α g ( E ) + β f ( U )
where D is the degree of coupling coordination and T is a comprehensive evaluation index for the coordinated development of ecosystem services and urbanization, which reflects the overall synergistic effect or the contribution of the two.
Based on the previous studies [18,38] on the comparative relationship between ecosystem service subsystem g (E) and urbanization subsystem f (U), the types of coupling between ecosystem services and urbanization were classified into 3 major categories, 5 subcategories, and 15 subtypes (Table 2). The classification criteria refer to the type of coupling coordination degree D in physics.

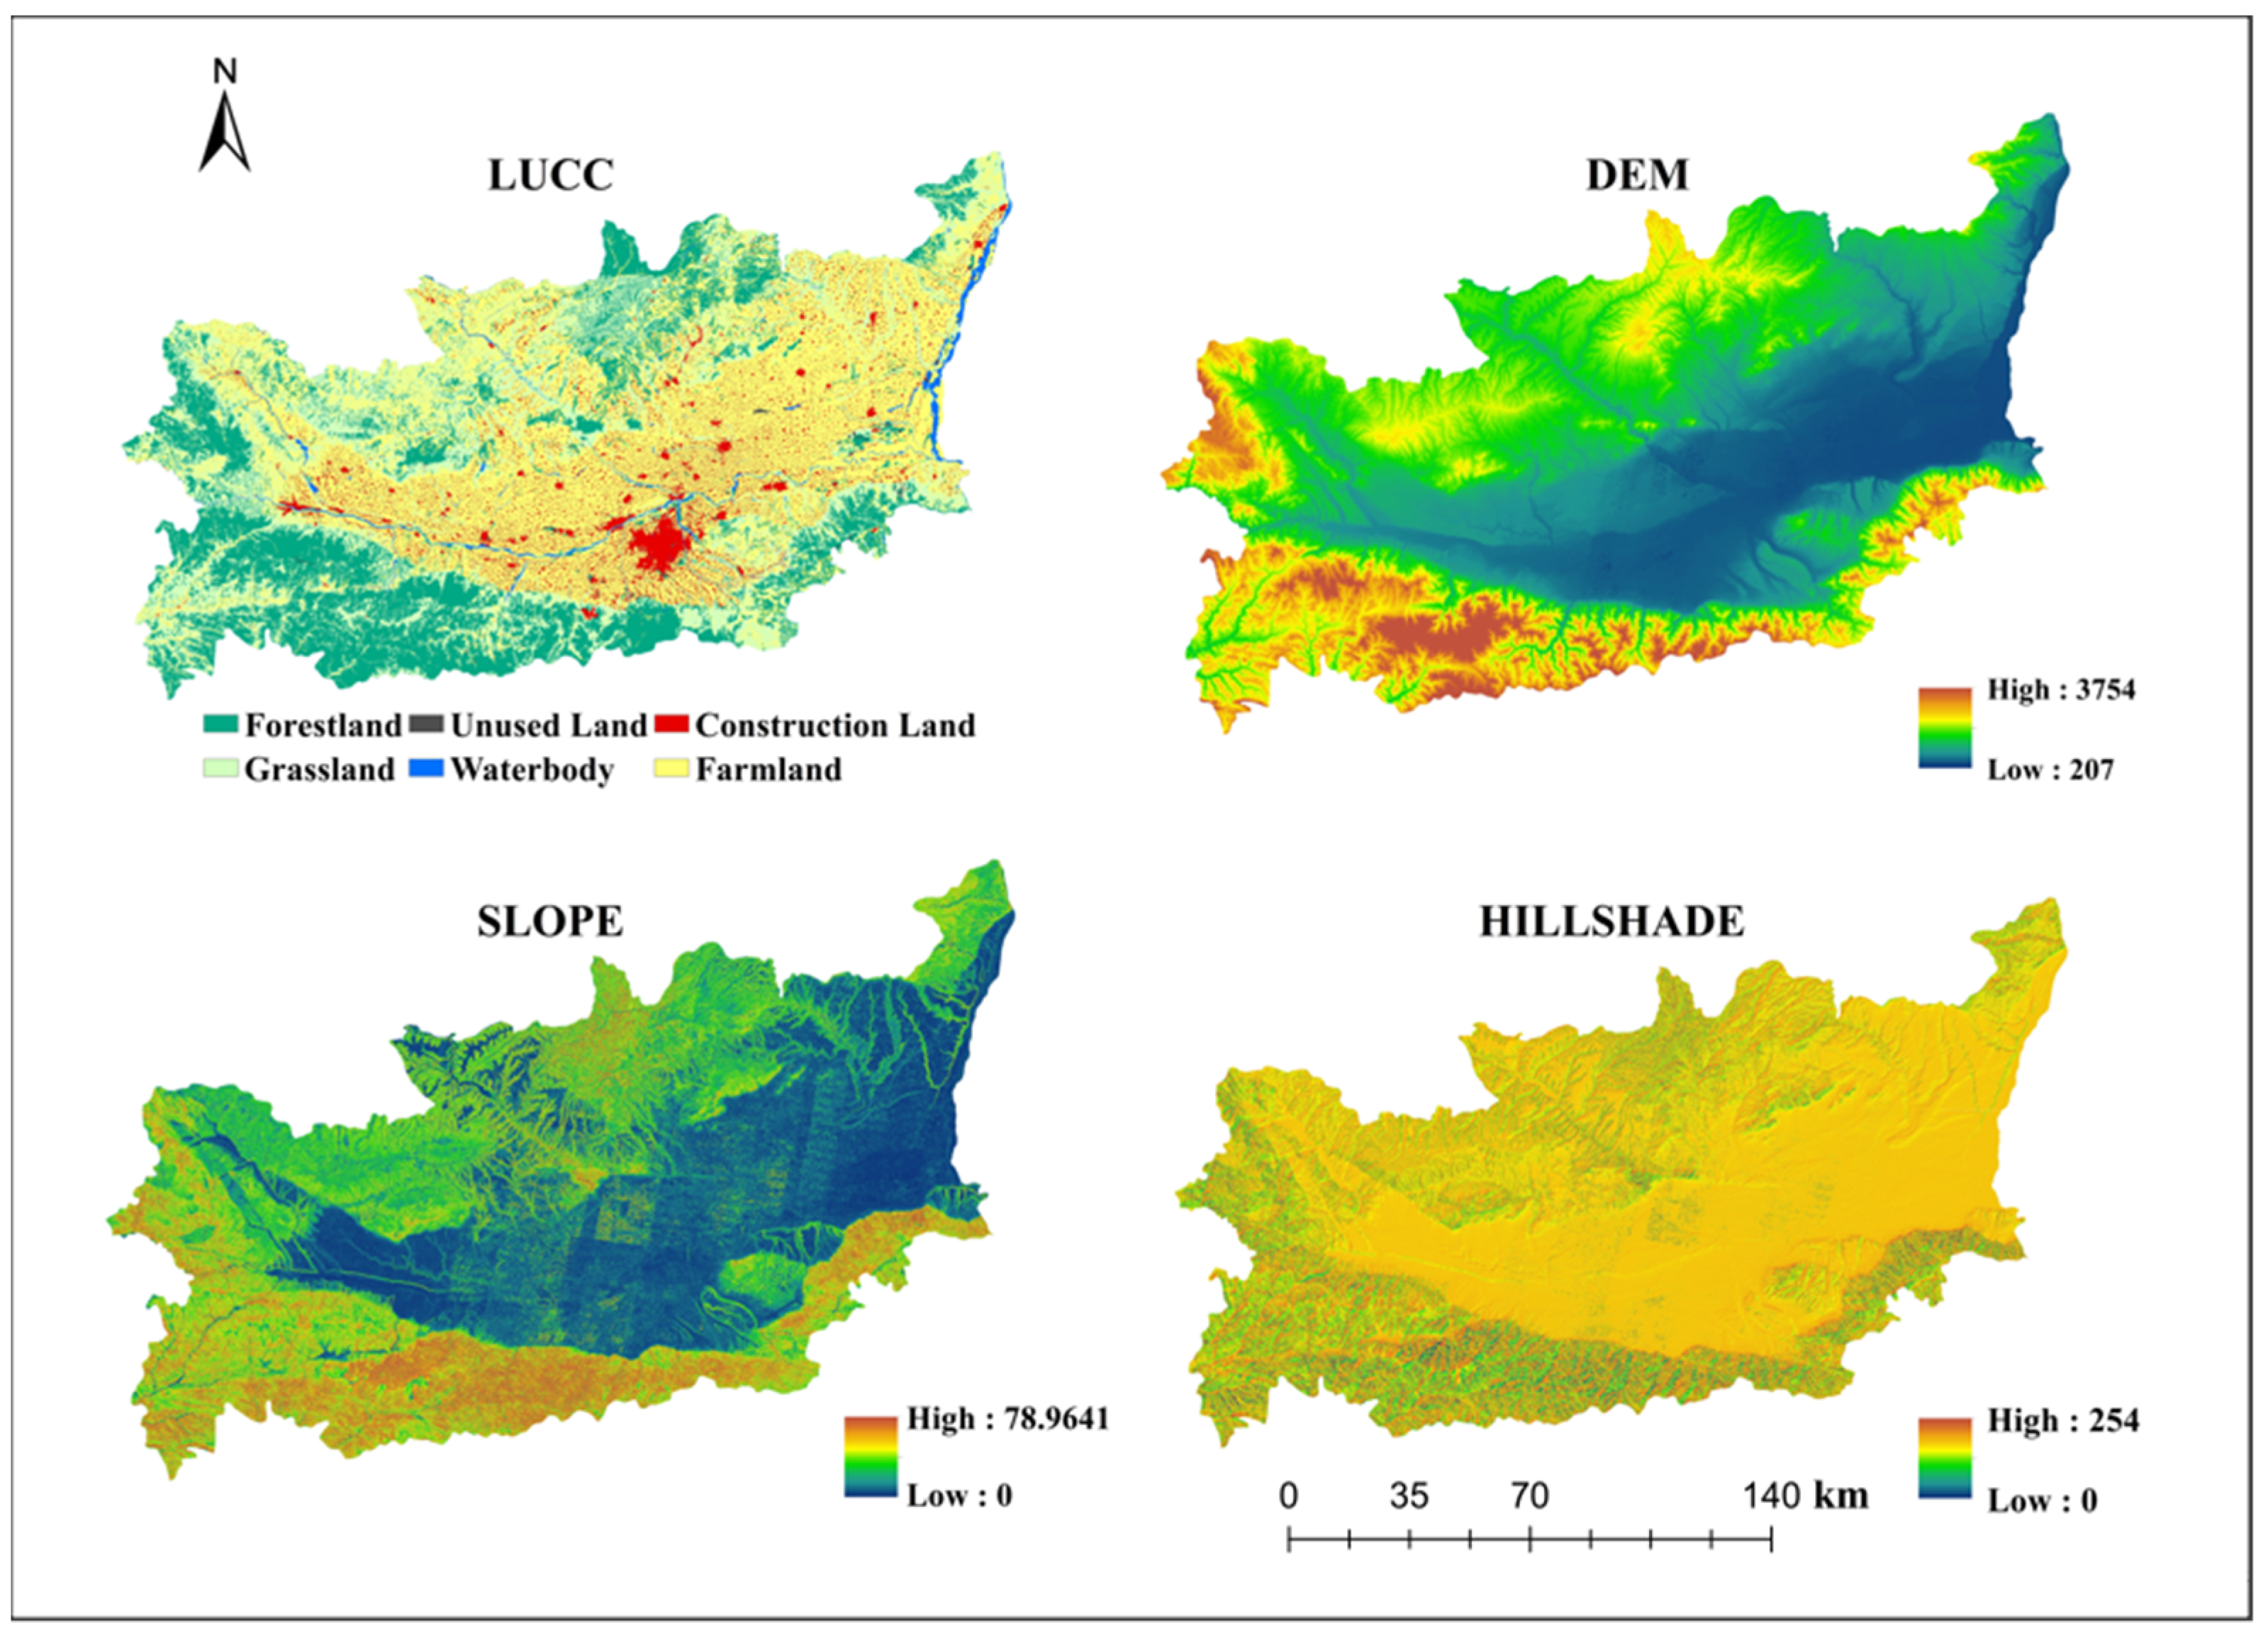
2.3. Data Resources and Processing

The 2015 socioeconomic data for each county were extracted from the County Statistical Yearbook of China, Shaanxi Regional Statistical Yearbook, and Regional statistical bulletins.
The evaluation results of ecosystem services are processed without dimensions using the Max–Min standardization method. Because Xie et al. [34,35] has considered the importance of each service when drawing up the equivalent factor table of land ecosystem service values, the weight of each service is no longer calculated and therefore the weight of each per capita value is equal. The comprehensive urbanization index NPUP is also processed without dimensions using the Max–Min standardization method.

3. Results

3.1. Spatial Distribution Characteristics of Ecosystem Services Value

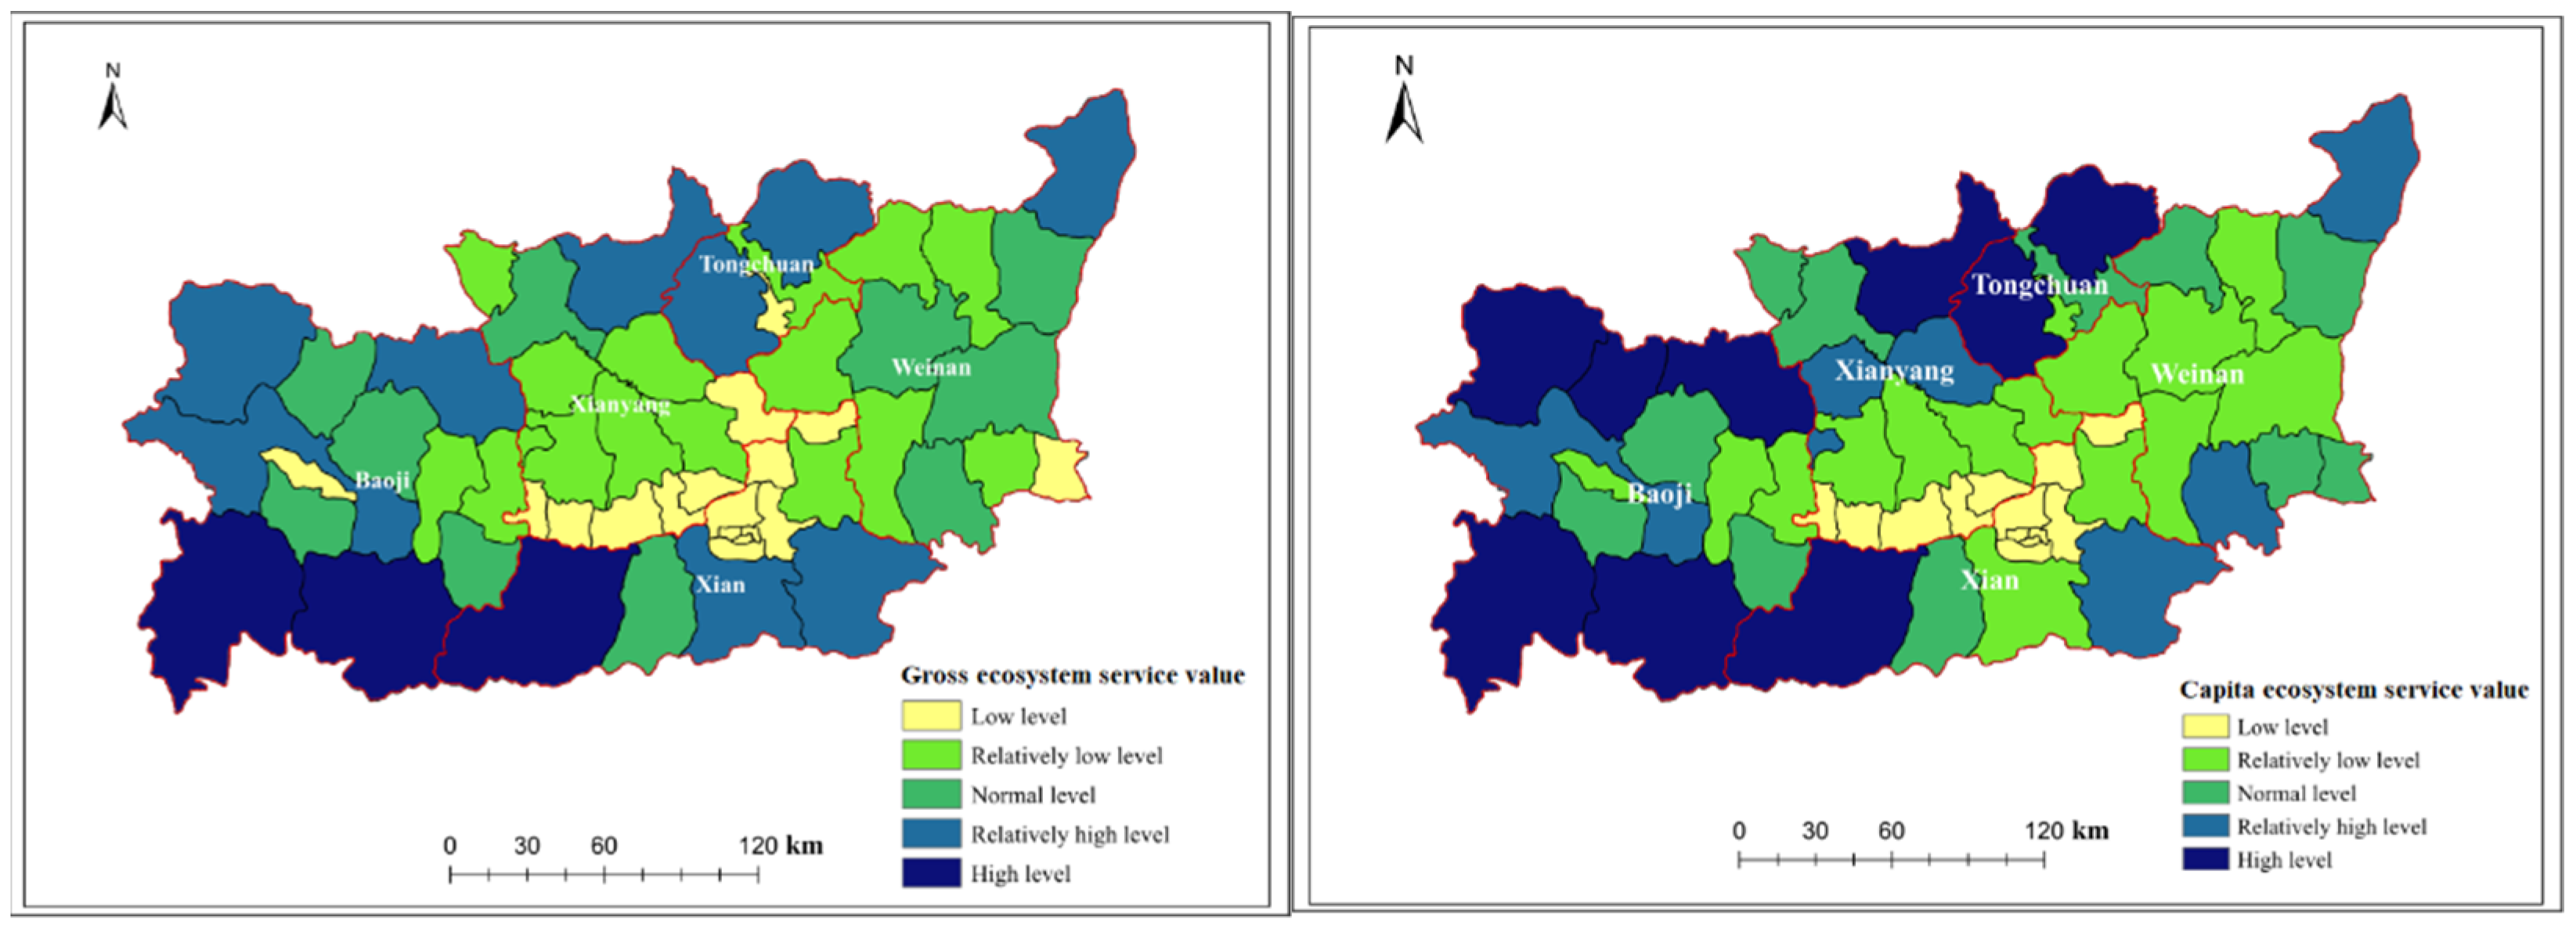
3.1.1. Ecosystem Services Value in Administrative Divisions

The value of ecosystem services in the whole Guanzhong region has clear spatial differentiation characteristics. By administrative division, ESV showed a “center-periphery” distribution in the spatial pattern and an outwardly increasing spatial distribution trend (Figure 4). To further explore the influence of demographic factors on the distribution of ecosystem service values, we calculated the spatial distribution of the per capita ecosystem service values. From the results, it can be seen that the per capita ecosystem service value also shows a spatial differentiation feature centered on Xi’an, increasing from low to high toward the periphery (Figure 4). This is consistent with the distribution of total ecosystem service values. Among the five prefecture-level cities in this study area, the value of the ecosystem services per capita was highest in Baoji and lowest in Xi’an.

3.1.2. Ecosystem Services Value in Different LUCC Types

The total ESV results in Guanzhong (Table 3) were CNY 47,319.5 × 106 in 2015. From the perspective of land use types, forestland displays the highest in total ESV (CNY 23,145.62 × 106), followed by farmland. Unused land recorded the lowest ESV (CNY 5.11 × 10⁶). ESV was unevenly distributed among the six land use categories. Ecosystem service values vary widely among the different land use types, indicating that the underlying surface plays an important role.
Total ESV contains four primary service types: regulating services, provisioning services, supporting services, and cultural services. As shown in Figure 5, the regulating services contributed the most in four primary categories, accounting for 51.33%, and cultural services was the lowest (6.24%).
The four primary service types were divided into secondary divisions, and the calculated results were as follows (Table 3): In all service types, soil retention, hydrologic regulation, climate regulation, and biodiversity were the major ESVs, accounting for 58.08% (bolded in the table), while food production received the lowest value (4.62%).

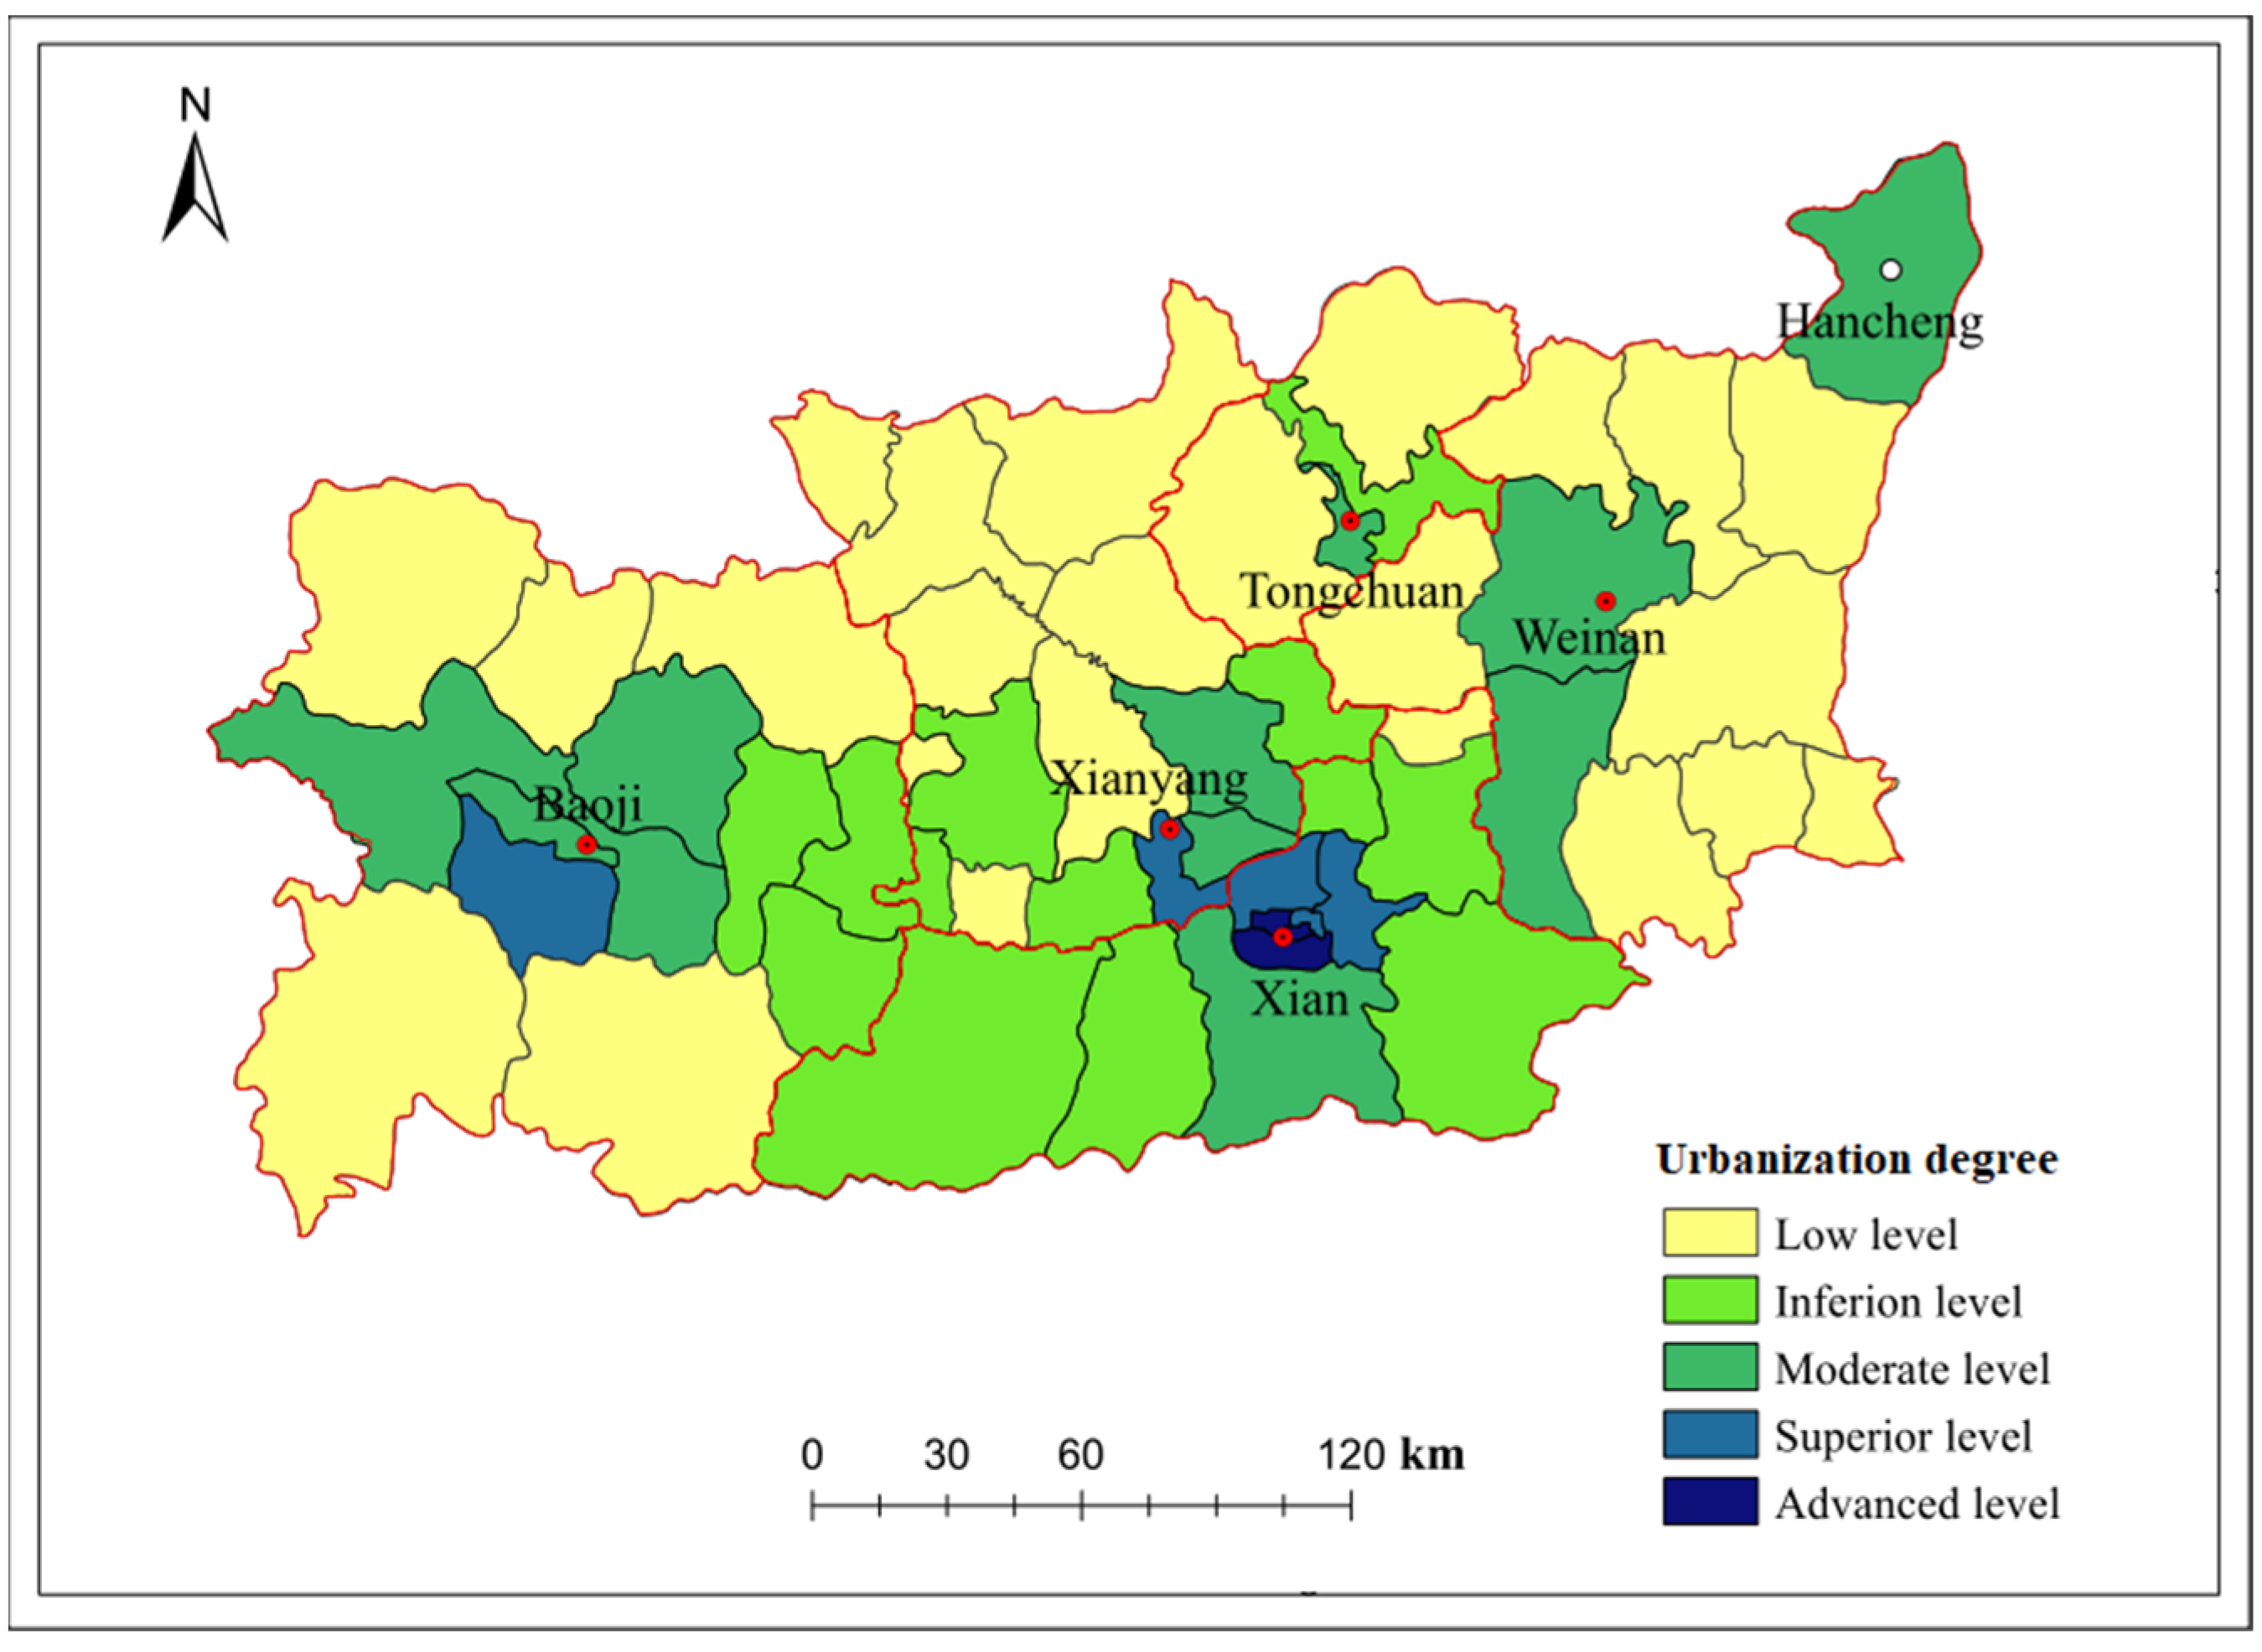
3.2. Spatial Pattern of Urbanization Degree

There is an obvious hierarchy of urbanization levels in the Guanzhong region, with the higher the administrative level, the higher the urbanization level. With Xi’an city as the core and Xianyang city as the subcore, it shows the spatial distribution characteristics decreasing from the center to the outside and from the south to the north (Figure 6). From the spatial distribution structure, Xi’an, as the capital city of the province, has rapid economic development and a larger non-agricultural population, and the degree of urbanization is significantly higher than that of the neighboring cities, which belong to the advanced level of urbanization. The areas with advanced urbanization are closely distributed in Xi’an and the surrounding cities, which are prefecture-level municipal districts. Areas with medium levels of urbanization are mainly concentrated in the areas around Xianyang, as well as Baoji and Weinan cities.
Roughly 68% of the cities in the study area are of the low-level urbanization type, mainly in the northern and eastern parts of the Guanzhong region. Most cities in the north are at low levels of urbanization. Under the influence of the regional “core” and “sub-core” radiation, the closer to the core, the higher the level of urbanization, and vice versa.
It should be noted that the southwest area consists of the Qinling Mountains where the terrain is rugged and the traffic is blocked, which slows down urban development (Figure 6). Although the northeast is the border between the two provinces and the area is remote, Hancheng, as the only planned pilot city in Shaanxi Province, is supported by development policies. In recent years, urbanization has been rapid and has reached a moderate level. Yet, the northern part is close to the Loess Plateau, and the level of urbanization is low.

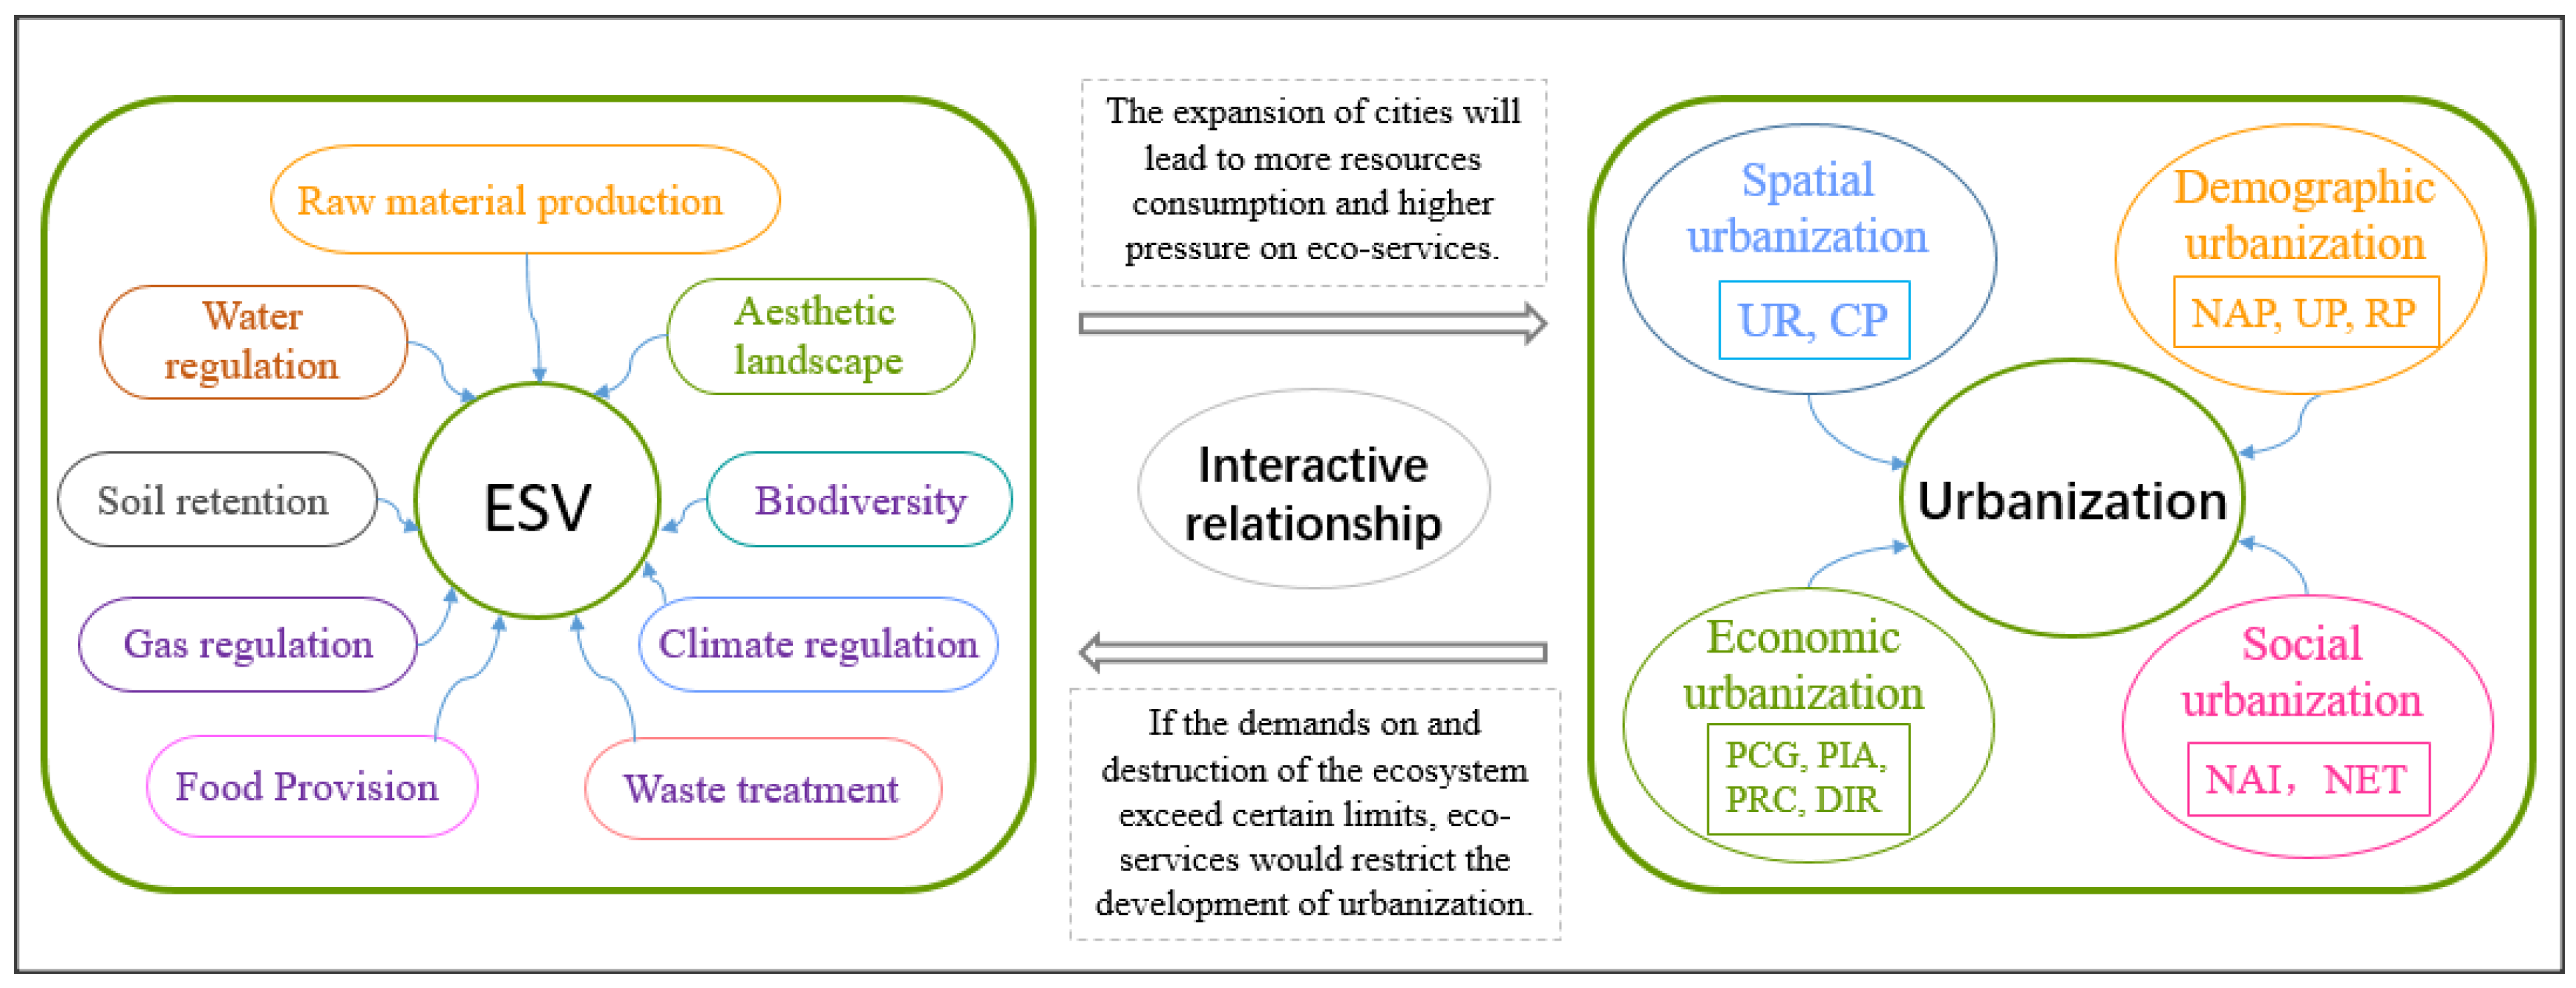
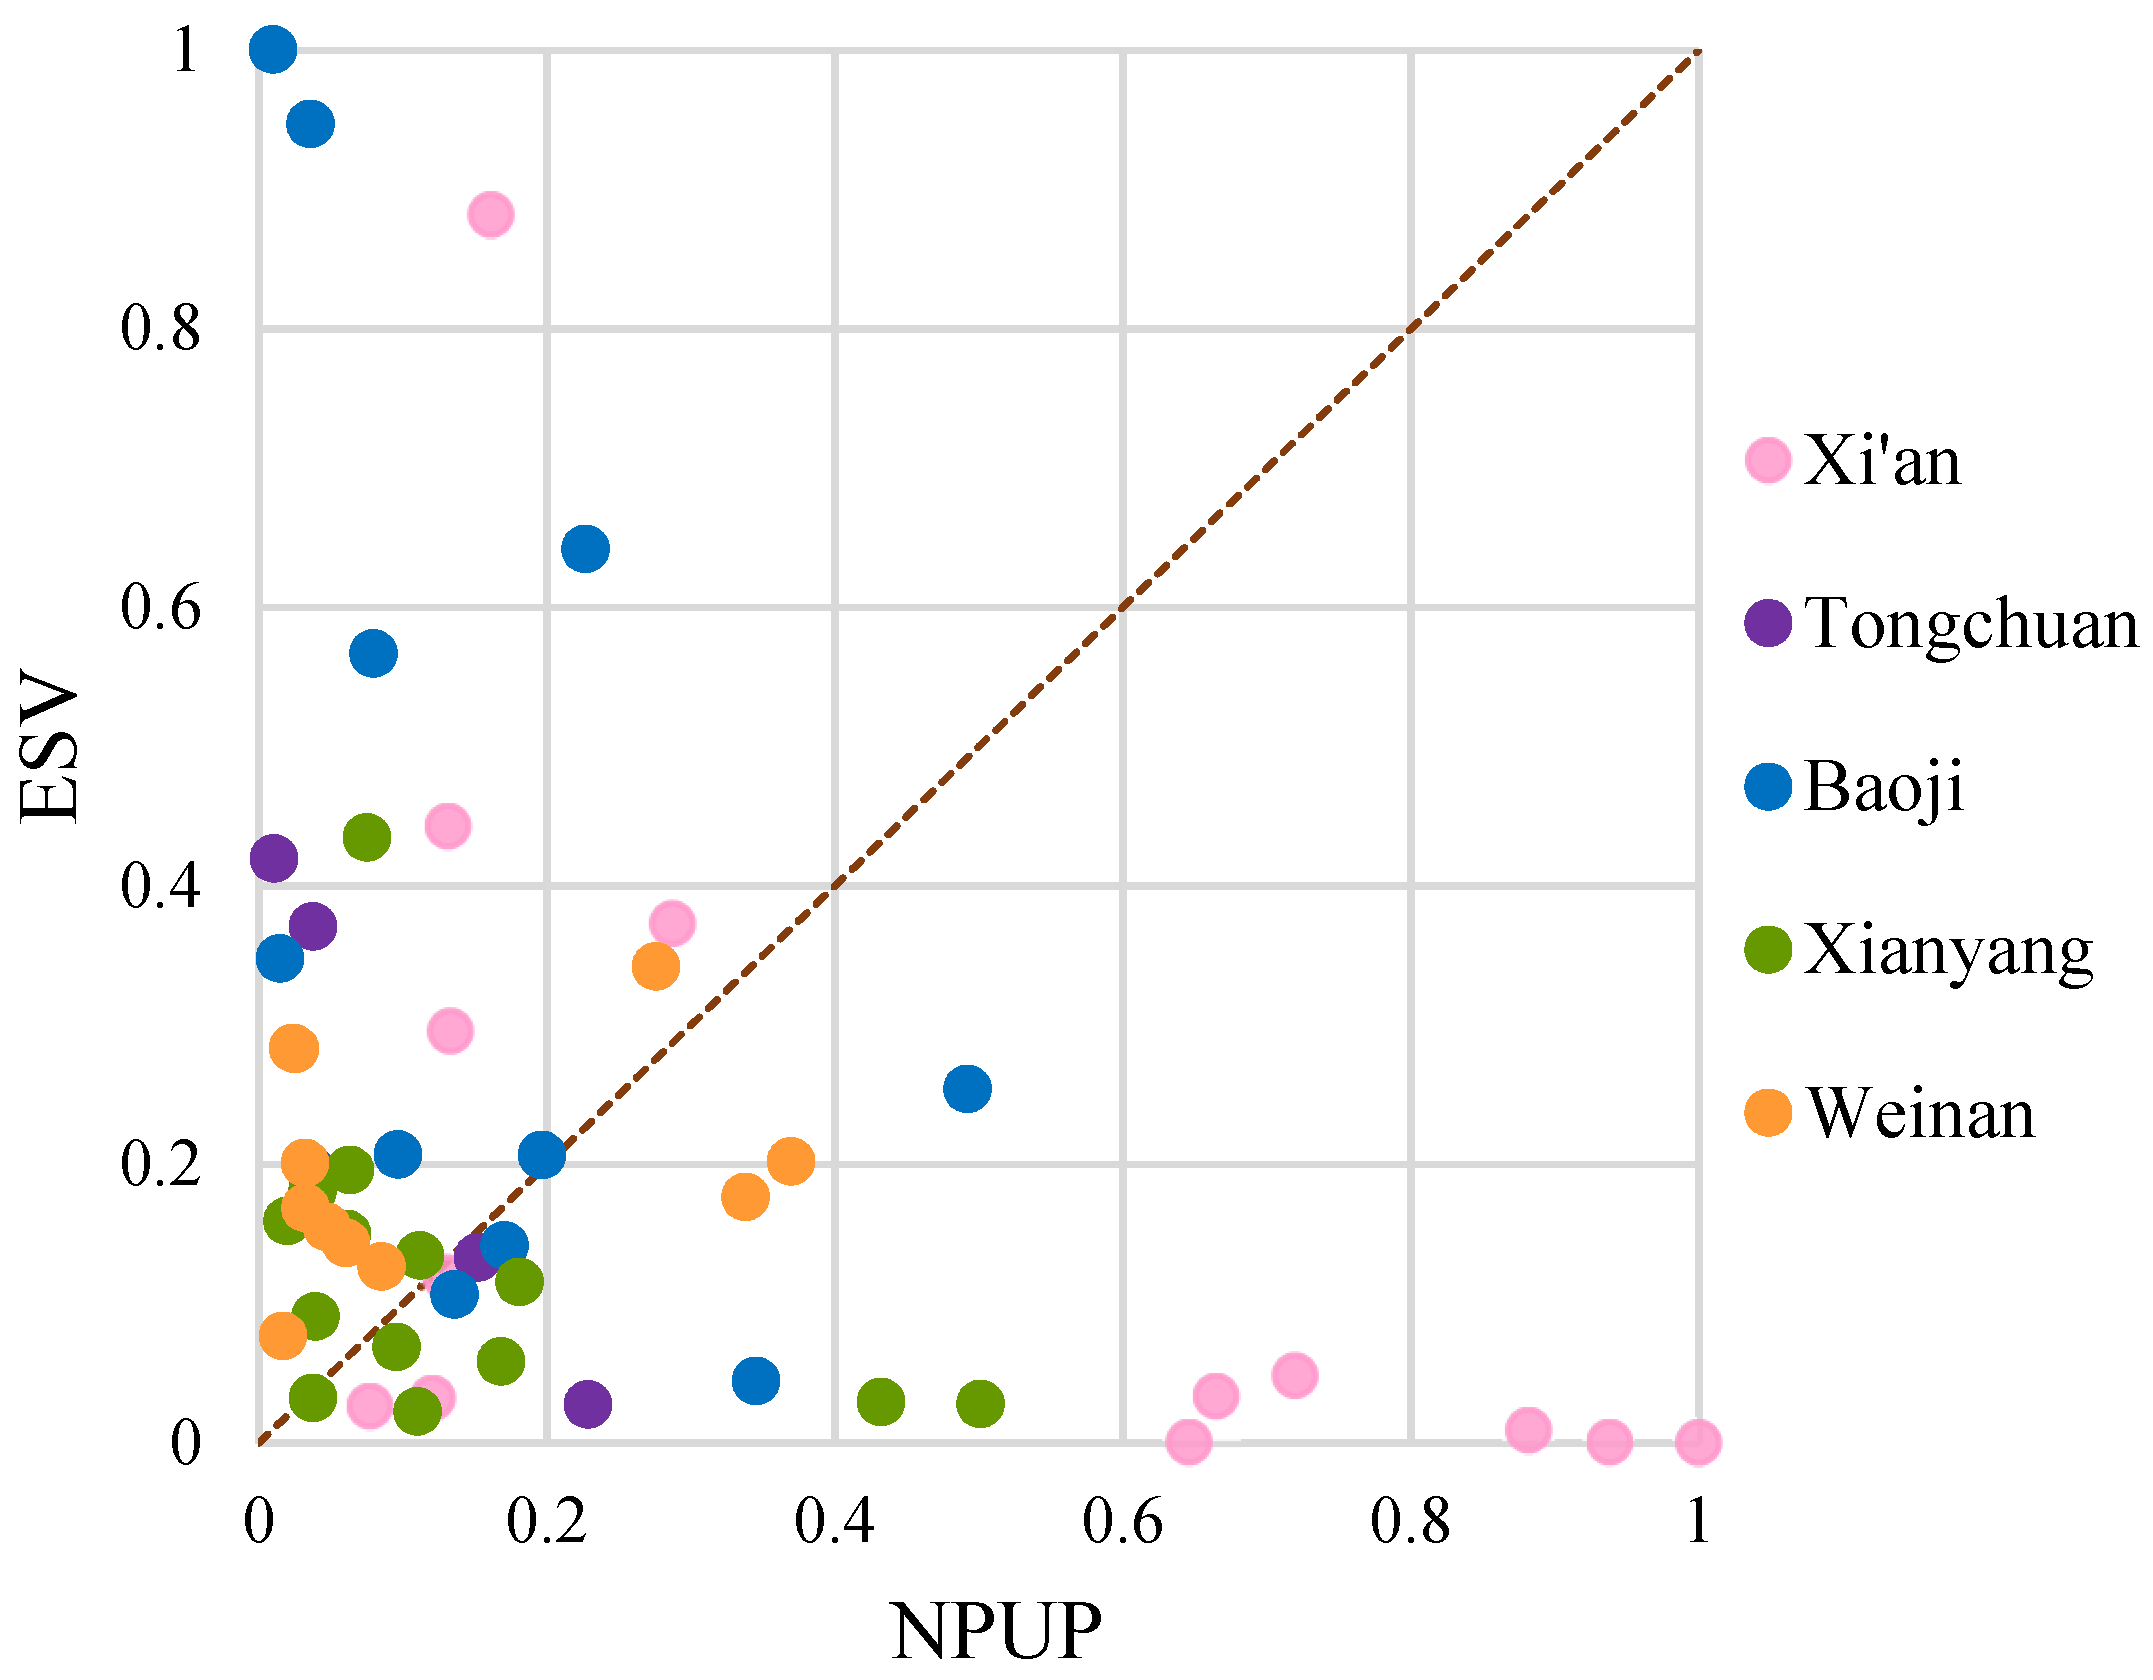
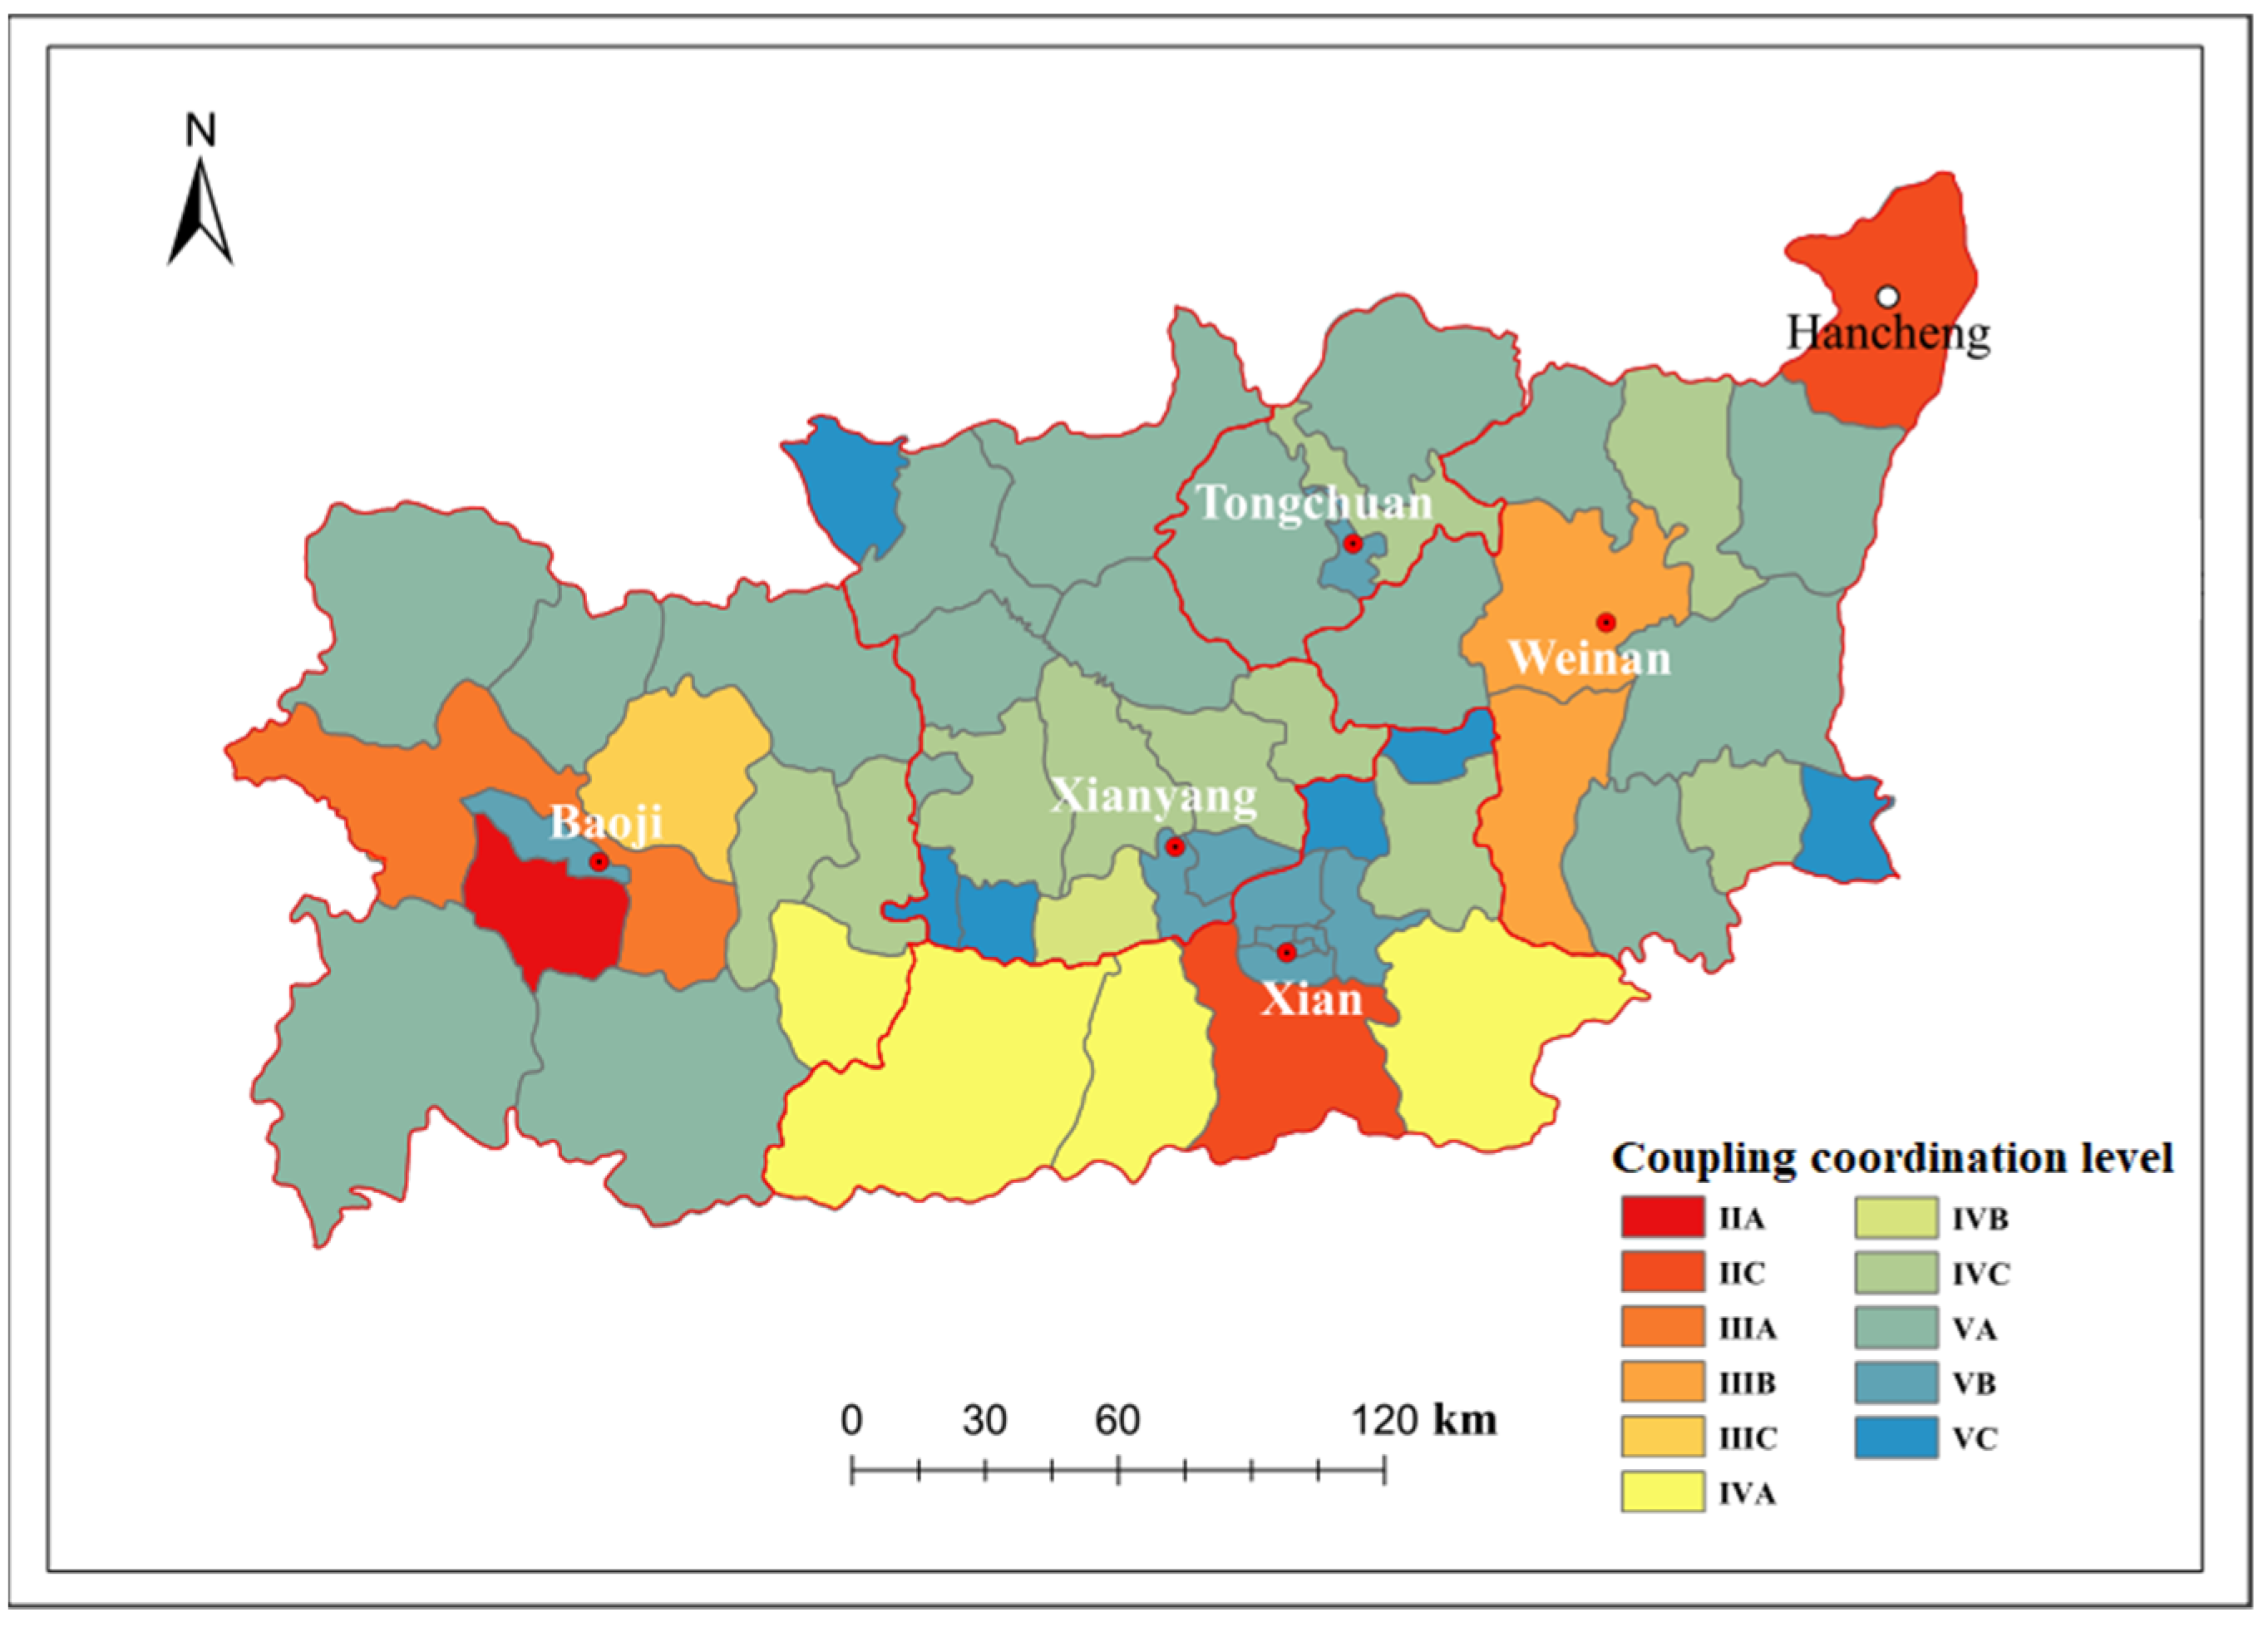
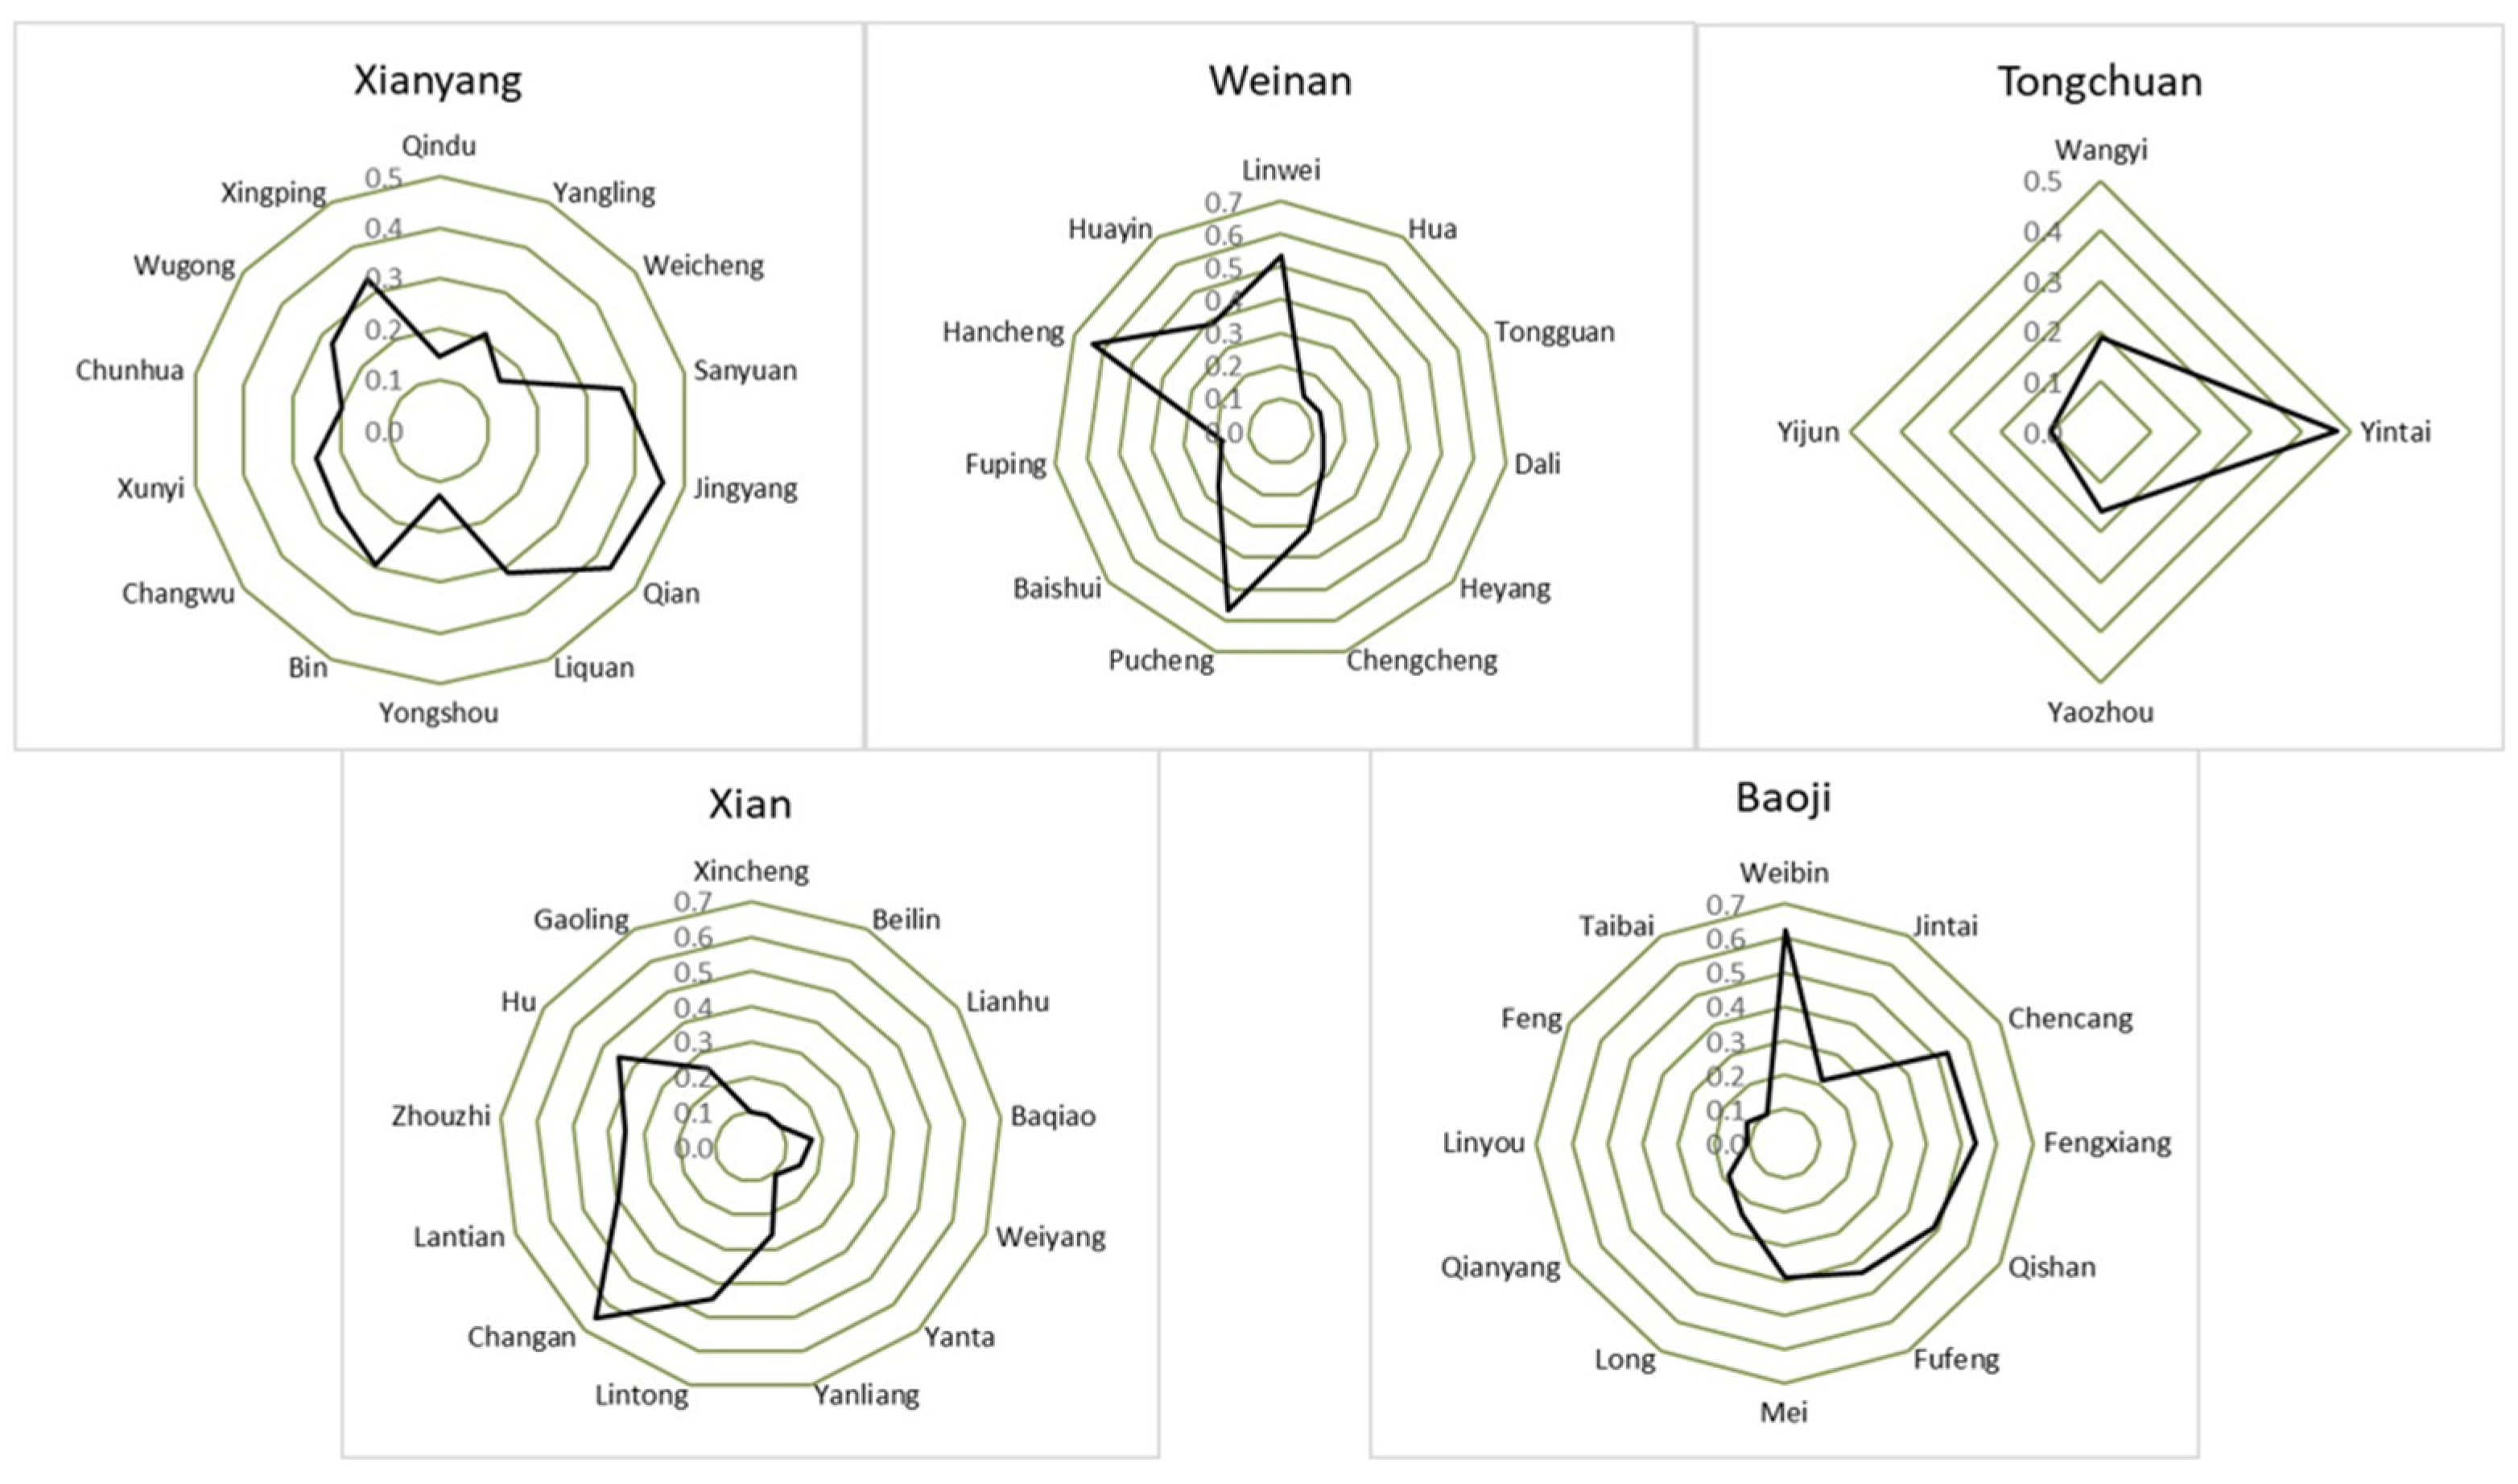
3.3. The interactive Relationship between Urbanization and ESV

The comparison between the NPUP and ESV levels are as follows (Figure 7). The NPUP levels of Xi’an were higher than the ESV levels, and that in Xianyang and Tongchuan were on par with the ESV levels, which have relatively balanced ecological and urbanization processes. NPUP levels in Baoji and Weinan were lower than the ESV levels, lagging behind in terms of urbanization.
The coupling coordination degree of ecosystem service value and urbanization in Guanzhong region (Figure 8) indicate that the overall coupling coordination degree is high in the south and low in the north. The major cities in the south are in a balanced development phase, those in the middle are in a transitional development phase, and those in the north are in an unbalanced development phase.
The degree of coupling coordination at the county (district) scale varies significantly among cities (Figure 9). Specifically, the degree of coupling and coordination varies the most among the districts of Xi’an. Chang’an district, a new urban area, reaches level IIC (moderately balanced development), with coordinated development of the ecological environment and urbanization; several cities in the south adjacent to Chang’an district are close to the Qinling Mountains and carry more natural resources, with coupling coordination reaching level IVA (slightly unbalanced development). However, the old urban areas of Xi’an (such as the Beilin district, Xincheng district, and Lianhu district) are in level VB, with the highest level of urbanization, the highest ecological requirements, and the highest population density but with the lowest per capita ESVs, and the ecological environment lags behind the development and is in an insignificant balance with urbanization development. The coupling coordination degree of the main districts and counties in Baoji City is at a balanced level. Among them, Weibin District has the highest level of urbanization, and with the Weihe River and its tributaries flowing through it, the ecological environment as a whole is better protected, and the degree of coupling coordination is IIA (medium balanced development). The exception to this is the old urban area of Jintai District, which has a stable level of urbanization but lags behind in ecological protection, with a coupling and coordination level of VB (serious imbalance in development). The landscape of the surrounding districts and counties is mostly mountainous and wooded, with good ecological and environmental protection but hindered urban development, and the degree of coupling and coordination does not meet the conditions for achieving balance. The coupling and coordination degree of Xianyang City and Tongchuan City as a whole shows a low level. The coupling coordination degree of five counties and districts in Xianyang City are level IV (slightly unbalanced development), and the non-urban counties are level V (severely unbalanced development), with Jing Yang County having the highest coupling coordination degree and Chunhua County having the lowest. Among the four counties in Tongchuan City, Yintai District is at level IVC (slightly unbalanced development), and the other three counties are at level V (severely unbalanced development). Weinan City has significant differences in the distribution of coupling coordination, with three counties reaching balance. Weinan city and the neighboring Pucheng county in the southwest reach coupling coordination level IIIB (barely balanced development), and Hancheng in the northeast reaches level IIC (moderately balanced development), while the other counties are in an unbalanced state. It should be noted that Hancheng, despite its remote location, is listed as a national pilot area for new urbanization, where economic development and environmental protection go hand in hand, with a coupling coordination level of IIC.

4. Discussion

4.1. The Influencing Factors on Coupling Degree

Urbanization and ecosystem services are two interacting systems [40,41]. Urbanization would affect the ecological environment through demographic growth, economic advancement, energy consumption, and traffic expansion [42]. Alternatively, ecosystems could restrict urban development through population exclusion, capital expulsion, capital competition, and policy intervention [43,44]. Within the Guanzhong region, human activities have become an important driving force affecting the ecological environment and have a significant impact on coupling and harmonious development [45]. Therefore, it is of great urgency to further explore the related factors of human activities to coordinate the relationship between urbanization and the ecological environment.

4.1.1. Selection of Influencing Factors

Based on the existing literature, the situation in the Guanzhong region, and data availability, this study focuses on the coupled influencing factors related to human activities in economic, social, and spatial aspects. In this regard, we selected the following variables: total population, per capita investment in fixed assets, per capita retail sales of consumer goods, proportion of added value of non-agricultural industries, common cultivated land area, number of employees in the tertiary industry, disposable income of the urban population, disposable income of rural residents, per capita GDP, and human capital (Table 4). In view of the availability of county statistical data, combined with the existing literature, we use “the number of secondary school students” as a substitute variable for the level of human capital in the Guanzhong region.

4.1.2. Estimated Results and Analysis

In order to further investigate the factors influencing the coupling degree in Guanzhong counties, we conducted ordinary least squares (OLS) regression between the above explanatory variables and the coupling degree (D value). Because the OLS regression of cross-section data may produce heteroscedasticity, which affects the reliability of the estimation results, we chose “Robust standard error + OLS” to reduce the influence of heteroscedasticity as much as possible.
According to the estimated results of the factors influencing Guanzhong county’s coupling degree in Table 5, the estimated results of Guanzhong county’s coupling degree, among the explanatory variables “disposable income of urban population”, “tertiary industry employees”, “total population”, and “human capital level” significantly affect Guanzhong county’s coupling degree. However, the effects of such factors as “per capita fixed asset investment”, “per capita retail sales of consumer goods”, “proportion of added value of non-agricultural industries”, “area of commonly used cultivated land”, “disposable income of rural residents”, and “per capita GDP” are not significant. Specifically, when the disposable income of the urban population increases by CNY 1000, the D value can increase by 0.0227; when the number of employees in the tertiary industry increases by 10,000, the D value can increase by 0.0303; when the number of middle school students increases by 10,000, the D value can increase by 0.0602; when the total population increases by 10,000, the D value decreases by 0.00541.

4.1.3. Significant Factors and Robustness Test

In order to further explore the factors affecting the coupling degree within the Guanzhong region and test the reliability of the estimated results, it is necessary to test its robustness. According to the previous interval division of D values, we assign 0, 1, 2, and 3 values to the samples that fall in the four intervals, and the values from 0 to 3 indicate the improvement of the coupling degree. In view of the inherent ordering of D, if we directly use the OLS or multivariate probit model to estimate, we cannot reflect this ranking, so we use the ordered probability model (ordered probit model) to estimate the parameters.
From the results of the ordered probit model estimation shown in Table 4, Table 5 and Table 6, we found that “disposable income of urban population”, “number of employees in the tertiary industry”, “per capita investment in fixed assets”, and “disposable income of rural residents” all significantly affect the possibility of coupling degree change in Guanzhong county. Specifically, for every CNY 1000 increase in the disposable income of the urban population, the possibility of increasing the D value is 0.674%; for every 10,000 employees in the tertiary industry, the possibility of increasing the D value is 0.716%; for every CNY 1000 increase in the disposable income of rural residents, the possibility of increasing the D value is 0.961%; and for every CNY 10,000 increase in per capita fixed asset investment, the possibility of decreasing the D value is 0.642%. It is not difficult to find that the coefficients of “total population” and “human capital level” in the ordered probit model are not significant, so there is no sufficient basis to suggest that they significantly affect the coupling degree in the Guanzhong area.
In summary, only the coefficients of “urban population disposable income” and “third industry employment” in both estimation models are significant, which suggests that “urban population disposable income” and “third industry employment” are the significant factors of the coupling degree in the Guanzhong area.
The government should make efforts to increase the income of low- and middle-income people in urban and rural areas, increase the proportion of middle-income people, and improve the consumption expectations of urban and rural residents. Moreover, the industrial structure should be optimized to promote the development of tertiary industry and increase the investment in people’s livelihood and social undertakings. These measures have a positive effect on improving the coupling and coordination mechanism between the value of ecosystem services and urbanization.

4.2. Collaboratively Improving ESV and Urbanization Degree

Urbanization changes landscape patterns and has a profound impact on ecosystems [46], while ecosystems and their carrying capacity constrain the scale of urbanization [47]. This analysis reveals the relationship between urbanization and the value of ecosystem services in the Guanzhong region and their specific manifestations. The two are considered to be two systems coupled in spatial distribution, which differ significantly.
Our results show that forests have the highest ESV, followed by agricultural land and grassland; building land has the lowest ESV, except for unused land. Low-value ecosystem services are mainly distributed in highly urbanized areas, while high-value ecosystem services are concentrated in low-urbanized areas and ecological reserves. This imbalance is the main reason for the lower ESV in the highly urbanized areas of Guanzhong. There is an interaction between the benefits obtained from land use types and urbanization, which is consistent with findings of Zhou et al. [48]. Baoji has the highest value of ecosystem services and is surrounded by several national forest parks that can contribute positively to the ecological conservation of the whole region, but its coupled situation has not reached a balanced and coordinated stage due to urbanization and economic development. Xi’an, as a highly urbanized region, devotes more land to construction, which is obtained by occupying other types of arable land (cropland, forest land, grassland, and water). This has led to a reduction in the value of ecosystem service providers and a corresponding decline in value. Thus, regardless of the level of urbanization, an increase in the proportion of land built per unit negatively affects the total value of ecosystem services. The higher the level of urbanization, the higher the pressure on ESV, which is consistent with findings of Tian et al. [49], and some studies suggest that this also seems to be related to population density [50].
Strict conservation measures should be adopted in future land-use management in the Guanzhong region, with priority given to areas with high ecosystem service values [51]. However, this does not mean that only high-value land use types (e.g., forest land) need to be considered to improve ESV, while ignoring other land types with important ecological functions (e.g., watersheds, construction land, and even wasteland), because ecosystems are a complex and diverse human natural system [52]. In addition, irrational land development during urbanization can further lead to an imbalance in ESV, resulting in a decline in supply, support, and regulating services [48]. Therefore, it is important to recognize that urbanization and ESV development is a coordinated process [53] rather than an imbalance, and attention must be paid to the ecological conservation of land and the health of ecosystems in cities to ensure the synergistic development of ecosystem services and urbanization systems.
In 2015, the Central Politburo put forth the concept of an ‘environment-friendly and resource-saving development model’ [54] in order to balance urban development and ecological conservation. Therefore, in maintaining the function of the ecosystem, additional emphasis should be placed on the quality of the urbanization process [55] rather than the speed. Rough and tumble development is no longer sustainable [56] and intensive land-use helps to maintain the stability of arable land [48]. For cities with expanding urbanization (e.g., Xi’an), the government should exercise greater control over the size of the city, especially for the intensive use of construction land [57], rather than occupying more arable land or the rest of the high ESV output sites. There should also be a focus on urgently protecting forest land, arable land, and water areas to maintain their ecosystem services. Furthermore, for ecosystem services disturbed by general production and construction projects, a long-term mechanism for ecological compensation should be established to (1) effectively compensate for the various risks of excessive urbanization, (2) restrain the damage to ecosystems caused by urban land development in the course of economic development, and (3) provide safeguards for the coordinated development of regional urbanization and ecosystems from the source.

4.3. Research Deficiencies and Prospects

Due to the complexity of ecosystems, their ecosystem services exhibit significant spatial heterogeneity. Research on ESV at this stage is not comprehensive, and many ESV-related issues need to be further explored, such as the importance of the actual form of ecosystem service demand, ecosystem response to human activities, the combined effects of ecosystem services and their internal structure, etc. In particular, the monetization strategy has received considerable and well-founded criticism.
The monetization approach in this study is based on a combination of disciplinary foundations and statistical studies on the origins of this assessment. The theoretical basis of ecosystem services valuation is derived from Kosoy’s theorem [58], and a key feature of its research history is the ability to simplify and monetize the complex relationships between natural capital transformations and social benefits in the transmission of ecosystem services.
To further illustrate the valuation method of ecosystem service value of land in China, we searched the China national knowledge infrastructure, Springer Database, and ScienceDirect Database for articles with the keywords “China”, “ecosystem service value”, and “land”. We searched for articles with keywords “China”, “ecosystem service values”, and “land” in the China Knowledge Base, Springer database and ScienceDirect database, and obtained 2267, 2846, and 3117 records, respectively [59].
We selected 300 journal papers with high relevance and citation frequency to land use and ecosystem service value as samples [59] and statistically analyzed the adoption of various assessment methods in ecosystem service value assessment papers, we can obtain the following results:
(1) There are a variety of methods for valuation of land ecosystem services, and the naming is complicated, but in general, they can be divided into the actual market method, the alternative market method, and the virtual market method. Among them, the equivalent factor method (belonging to the real market method) accounted for 63.6% of the total sample and was more commonly used in the national ecosystem service value study [59]. In contrast, the market price method, shadow engineering method, alternative cost method, material quality conversion method, energy value conversion method, NPP method, model method, etc., have a smaller proportion in the sample, and often multiple methods are used in conjunction with each other to complete the assessment study.
(2) Chinese scholars use the equivalent factor method to study while establishing a framework system for the valuation of various land use types (ecosystem types), which can independently complete the valuation of ecosystem services of all lands in a certain region. Other methods tend to focus on the value assessment of a single land use type such as forest land [60], grassland [61], wetland [62], etc. These methods use a large amount of survey data and relevant parameters to reduce the subjectivity of evaluation results to some extent, but they require a lot of time and labor costs and are more restricted in terms of research locations [63].
(3) Although the equivalent factor method is somewhat subjective, it is more intuitive, easier to use, and especially suitable for regional or even global scales [3], so it has been widely concerned and commonly adopted by scholars at home and abroad, especially in the use of ecosystem service values to study ecosystem and land use evolution [11]. The Guanzhong region belongs to the medium-scale study area, which is in line with the scope of this method, so this method was chosen.
In the context of the “Guanzhong-Tianshui Economic Zone” and “Belt and Road” strategies, regional urbanization has brought unprecedented development opportunities [31], and more uncertainties may arise about the impacts of human activities on ecosystems. Future research should focus on how to better utilize the positive responses of human activities on ecosystems during urbanization.

5. Conclusions

The value coefficient method proposed by Costanza et al. [3] and Xie et al. [34] provides a viable reference value for estimating the value of ecosystem services. This study applied this method and further explored its coupling and coordinated development with urbanization. In the context of rapid urbanization, this paper examined the spatial heterogeneity between urbanization and ecosystem services in the Guanzhong region of China and found that (1) the regulating ecosystem services contributed the most to ESV, accounting for 51.33%, forest land was the most important provider of ESV, generating CNY 23,145.62 × 106, and ESV between districts and counties showed a spatial differentiation of “low center and high periphery”. (2) There is an obvious hierarchy of urbanization levels in the Guanzhong region, with the higher the administrative level, the higher the urbanization level. With Xi’an city as the core and Xianyang city as the subcore, it shows the spatial distribution characteristics decreasing from the center to the outside and from the south to the north. (3) The coupling coordination model analyzed the coupling coordination relationship between urbanization and the ecosystem service value and found that 7 cities in the south were in the balanced development stage, 15 cities in the center were in the transitional development stage, and 32 cities in the north were in the unbalanced development stage. (4) While quantifying the coupling status of the two, this study further concludes that the most significant human activity factors influencing the coupling coordination are urban population disposable income and tertiary employment. The government should implement additional measures to promote the coupled development of ecosystem services and urbanization, improve the quality of citizens, and strengthen supervision and management.

Author Contributions

Conceptualization, Y.C. and Z.L.; methodology, P.L.; software, Y.C.; formal analysis, Y.C.; data curation, Z.Z. and Y.Z.; writing—original draft preparation, Y.C.; writing—review and editing, Y.C; visualization, Y.C; proofreading, Y.C; supervision, Z.L and Y.C; project administration, P.L.; funding acquisition, Z.L. All authors have read and agreed to the published version of the manuscript.

Funding

This research was financed by the Technology Project funded by Clean Energy and Ecological Water Conservancy Engineering Research Center (QNZX-2019-03), the Chinese Academy of Engineering Consulting Project (2020-XZ-14), the National Natural Science Foundations of China (Grant Nos. 51879281), the State Forestry and Grassland Administration’s Independent Research and Development Project “Optimization of Ecological Water Use and Vegetation Pattern of Forests and Grasses in the Yellow River Basin (LC-6-06), and the Science and Technology Project of Department of Transport of Shaanxi Province (Grant NO. 2015-11K).

Institutional Review Board Statement

Not applicable.

Informed Consent Statement

Not applicable.

Data Availability Statement

Not applicable.

Acknowledgments

We would like to thank Alex Moore at Yale University for her assistance with English language and grammatical editing.

Conflicts of Interest

The authors state that they have no known competing financial interests or personal relationships that could affect the work described in this article.

References

  1. Costanza, R.; d’Arge, R.; de Groot, R.; Farber, S.; Grasso, M.; Hannon, B.; Limburg, K.; Naeem, S.; O’Neill, R.V.; Paruelo, J.; et al. The value of the world’s ecosystem services and natural capital. Nature 1997, 387, 253–260. [Google Scholar] [CrossRef]
  2. Liu, J.; Li, J.; Qin, K.; Zhou, Z.; Yang, X.; Li, T. Changes in land-uses and ecosystem services under multi-scenarios simulation. Sci. Total Environ. 2017, 586, 522–526. [Google Scholar] [CrossRef]
  3. Costanza, R.; De Groot, R.; Braat, L.; Kubiszewski, I.; Fioramonti, L.; Sutton, P.; Grasso, M. Twenty years of ecosystem services: How far have we come and how far do we still need to go? Ecosyst. Serv. 2017, 28, 1–16. [Google Scholar] [CrossRef]
  4. Alam, M.; Dupras, J.; Messier, C. A framework towards a composite indicator for urban ecosystem services. Ecol. Indic. 2016, 60, 38–44. [Google Scholar] [CrossRef]
  5. Estoque, R.C.; Murayama, Y. Landscape pattern and ecosystem service value changes: Implications for environmental sustainability planning for the rapidly urbanizing summer capital of the Philippines. Landsc. Urban. Plan. 2013, 116, 60–72. [Google Scholar] [CrossRef]
  6. Winkler, R. Valuation of ecosystem goods and services Part 1: An integrated dynamic approach. Ecol.Econ. 2006, 59, 82–93. [Google Scholar] [CrossRef]
  7. Cordier, M.; Agúndez, J.A.P.; Hecq, W.; Hamaide, B. A guiding framework for ecosystem services monetization in ecological-economic modeling. Ecosyst. Serv. 2013, 8, 86–96. [Google Scholar] [CrossRef] [Green Version]
  8. Limin, J. Urban land density function: A new method to characterize urban expansion. Landsc. Urban. Plan. 2015, 139, 26–39. [Google Scholar] [CrossRef]
  9. Li, B.; Chen, D.; Wu, S.; Zhou, S.; Wang, T.; Chen, H. Spatio-temporal assessment of urbanization impacts on ecosystem services: Case study of Nanjing City, China. Ecol. Indic. 2016, 71, 416–427. [Google Scholar] [CrossRef]
  10. Zhang, Z.; Gao, J.; Fan, X.; Lan, Y.; Zhao, M. Response of ecosystem services to socioeconomic development in the Yangtze River Basin, China. Ecol. Indic. 2017, 72, 481–493. [Google Scholar] [CrossRef]
  11. Wan, L.; Ye, X.; Lee, J.; Lu, X.; Zheng, L.; Wu, K. Effects of urbanization on ecosystem service values in a mineral resource-based city. Habitat Int. 2015, 46, 54–63. [Google Scholar] [CrossRef]
  12. Hou, L.; Wu, F.; Xie, X. The spatial characteristics and relationships between landscape pattern and ecosystem service value along an urban-rural gradient in Xi’an city, China. Ecol. Indic. 2020, 108, 105720.1–105720.10. [Google Scholar] [CrossRef]
  13. Song, Q.; Zhou, N.; Liu, T.; Siehr, S.A.; Qi, Y. Investigation of a “coupling model” of coordination between low-carbon development and urbanization in China. Energy Policy 2018, 121, 346–354. [Google Scholar] [CrossRef] [Green Version]
  14. Huang, G.; London, J. Mapping Cumulative Environmental Effects, Social Vulnerability, and Health in the San Joaquin Valley, California. Am. J. Public Health 2012, 102, 830–832. [Google Scholar] [CrossRef]
  15. Qiu, B.; Li, H.; Zhou, M.; Zhang, L. Vulnerability of ecosystem services provisioning to urbanization: A case of China. Ecol. Indic. 2015, 57, 505–513. [Google Scholar] [CrossRef]
  16. Lyu, R.; Clarke, K.C.; Zhang, J.; Jia, X.; Li, J. The impact of urbanization and climate change on ecosystem services: A case study of the city belt along the Yellow River in Ningxia, China. Comput. Environ. Urban. Syst. 2020, 77, 101351. [Google Scholar] [CrossRef] [Green Version]
  17. Zhou, H. The Modern Chinese Dictionary; Guangming Daily Press: Beijing, China, 2003; pp. 820–821. [Google Scholar]
  18. Xiong, J.X.; Chen, D.L.; Peng, B.F. Spatio-temporal Difference of Coupling Coordinative Degree of Ecological Carrying Capacity in the Dongting Lake Region. Sci. Geogr. Sin. 2014, 34, 1108–1116. (In Chinese) [Google Scholar]
  19. Wang, X.; Dong, Z.; Xu, W.; Luo, Y.; Wang, W. Study on Spatial and Temporal Distribution Characteristics of Coordinated Development Degree among Regional Water Resources, Social Economy, and Ecological Environment Systems. Int. J. Environ. Res. Public Health 2019, 16, 4213. [Google Scholar] [CrossRef] [PubMed] [Green Version]
  20. Rapport, D.J.; Friend, A.M. Towards a Comprehensive Framework for Environmental Statistics: A Stress-Response Approach; Office of the Senior Advisor on Integration: Ottawa, ON, Canada, 1979.
  21. Grossman, G.M.; Krueger, A.B. Environmental Impacts of a North American Free Trade Agreement. CEPR Discuss. Pap. 1992, 8, 223–250. [Google Scholar]
  22. Estoque, A.; Murayama, Y. Examining the potential impact of land use/cover changes on the ecosystem services of Baguio city, the Philippines: A scenario-based analysis. Appl. Geogr. 2012, 35, 316–326. [Google Scholar] [CrossRef]
  23. Buyantuyev, A.; Wu, J. Urbanization alters spatiotemporal patterns of ecosystem primary production: A case study of the Phoenix metropolitan region, USA. J. Arid. Environ. 2009, 73, 512–520. [Google Scholar] [CrossRef]
  24. Fang, C.L.; Huang, J.C.; Bu, W.N. Theoretical Study on Urbanization Process and Ecological Effect with the Restriction of Water Resource in Arid Area of Northwest China. Arid. Land Geogr. 2004, 27, 1–7. [Google Scholar]
  25. Ren, Z.; Qian, X.U.; Yang, R. On coordination development of agricultural ecological-environment and economy in Shaanxi Province based on coupling degree model. J. Arid. Land Resour. Environ. 2011, 25, 14–19. [Google Scholar]
  26. Xiao, R.; Lin, M.; Fei, X.; Li, Y.; Zhang, Z.; Meng, Q. Exploring the interactive coercing relationship between urbanization and ecosystem service value in the Shanghai–Hangzhou Bay Metropolitan Region. J. Clean. Prod. 2019, 253, 119803. [Google Scholar] [CrossRef]
  27. Li, W.; Wang, Y.; Xie, S.; Xian, C.B. Coupling coordination analysis and spatiotemporal heterogeneity between urbanization and ecosystem health in Chongqing municipality, China. Sci. Total Environ. 2021, 791, 148311. [Google Scholar] [CrossRef]
  28. Song, W.; Deng, X.; Yuan, Y.; Li, Z.H.; Song, W.; Wang, Z. Impacts of land-use change on valued ecosystem service in rapidly urbanized North China Plain. Ecol. Model. 2015, 318, 245–253. [Google Scholar] [CrossRef]
  29. Breuste, J.; Qureshi, S.; Li, J. Applied urban ecology for sustainable urban environment. Urban. Ecosyst. 2013, 16, 675–680. [Google Scholar] [CrossRef]
  30. Taylor, L.; Hochuli, D.F. Creating better cities: How biodiversity and ecosystem functioning enhance urban residents’ wellbeing. Urban. Ecosyst. 2015, 18, 747–762. [Google Scholar] [CrossRef]
  31. Qin, K.; Li, J.; Liu, J.; Yan, L.; Huang, H. Setting conservation priorities based on ecosystem services—A case study of the Guanzhong-Tianshui Economic Region. Sci. Total Environ. 2019, 650, 3062–3074. [Google Scholar] [CrossRef]
  32. Notice on the Issuance of the Guanzhong Plain City Cluster Development Plan. Available online: https://www.ndrc.gov.cn/xxgk/zcfb/ghwb/201802/t20180207_962246.html (accessed on 2 February 2018).
  33. Kirchner, M.; Schmidt, J.; Kindermann, G.; Kulmer, V.; Mitter, H.; Prettenthaler, F.; Schauppenlehner, T. Ecosystem services and economic development in Austrian agricultural landscapes—the impact of policy and climate change scenarios on trade-offs and synergies. Ecol. Econ. 2015, 109, 161–174. [Google Scholar] [CrossRef]
  34. Xie, G.D.; Lu, C.X.; Leng, Y.F.; Zheng, D.; Li, S.C. Ecological assets valuation of the Tibetan Plateau. J. Nat. Resour. 2003, 18, 189–196. [Google Scholar]
  35. Xie, G.D.; Zhang, C.X.; Zhen, L.; Zhang, L.M. Dynamic changes in the value of China’s ecosystem services—ScienceDirect. Ecosyst. Serv. 2017, 26, 146–154. [Google Scholar] [CrossRef]
  36. Xu, X.G.; Cui, C.W.; Xu, L.F.; Ma, L.Y. Method study on relative assessment for ecosystem service: A case of green space in Beijing, China. Environ. Earth Sci. 2013, 68, 1913–1924. [Google Scholar] [CrossRef]
  37. Wang, F.L.; Liu, Y.G. Correction of urbanization level indicators based on scale effects. Trop. Geogr. 2011, 31, 403–408. (In Chinese) [Google Scholar]
  38. Yang, Y.; Na, H. The spatial and temporal evolution of coordinated ecological and socioeconomic development in the provinces along the Silk Road Economic Belt in China. Sustain. Cities Soc. 2019, 47, 101466. [Google Scholar] [CrossRef]
  39. Gan, L.; Shi, H.; Hu, Y.; Lev, B.; Lan, H. Coupling coordination degree for urbanization city-industry integration level: Sichuan case. Sustain. Cities Soc. 2020, 58, 102136. [Google Scholar] [CrossRef]
  40. Wang, R.S. Efficient and Harmonious—Principles and Methods of Urban Ecological Regulation; Hunan Education Publishing House: Changsha, China, 1988. [Google Scholar]
  41. Li, T.; Lu, Y.; Fu, B.; Hu, W.; Comber, A.J. Bundling ecosystem services for detecting their interactions driven by large-scale vegetation restoration: Enhanced services while depressed synergies. Ecol. Indic. 2019, 99, 332–342. [Google Scholar] [CrossRef] [Green Version]
  42. Salvati, L.; Zambon, I.; Chelli, F.M.; Serra, P. Do spatial patterns of urbanization and land consumption reflect different socioeconomic contexts in Europe? Sci. Total Environ. 2018, 625, 722–730. [Google Scholar] [CrossRef]
  43. Fang, C.; Zhou, C.; Gu, C.; Chen, L.; Li, S. Theoretical analysis of interactive coupled effects between urbanization and eco-environment in mega-urban agglomerations. Acta Geogr. Sin. 2016, 71, 531–550. [Google Scholar] [CrossRef]
  44. Chaolin, G. Urban. Geography of China; The Commercial Press: Beijing, China, 1999. [Google Scholar]
  45. Vitousek, P.M.; Mooney, H.A.; Lubchenco, J.; Melillo, J.M. Human domination of Earth’s ecosystems. Science 1997, 277, 494–499. [Google Scholar] [CrossRef] [Green Version]
  46. Grimm, N.B.; Faeth, S.H.; Golubiewski, N.E.; Redman, C.L.; Wu, J.; Bai, X.; Briggs, J.M. Global change and the ecology of cities. Science 2008, 319, 756–760. [Google Scholar] [CrossRef] [Green Version]
  47. Dadao, L.U.; Chen, M. Several viewpoints on the background of compiling the “National New Urbanization Planning (2014–2020)”. Acta Geogr.Sin. 2015, 70, 179–185. [Google Scholar] [CrossRef]
  48. Zhou, D.; Tian, Y.; Jiang, G. Spatio-temporal investigation of the interactive relationship between urbanization and ecosystem services: Case study of the Jingjinji urban agglomeration, China. Ecol. Indic. 2018, 95, 152–164. [Google Scholar] [CrossRef]
  49. Tian, Y.; Zhou, D.; Jiang, G. Conflict or Coordination? Multiscale assessment of the spatio-temporal coupling relationship between urbanization and ecosystem services: The case of the Jingjinji Region, China. Ecol. Indic. 2020, 117, 106543. [Google Scholar] [CrossRef]
  50. Wang, J.; Zhou, W.; Pickett, S.T.A.; Yu, W.; Li, W. A multiscale analysis of urbanization effects on ecosystem services supply in an urban megaregion. Sci. Total Environ. 2019, 662, 824–833. [Google Scholar] [CrossRef]
  51. Chuai, X.; Huang, X.; Wu, C.; Li, J.; Lu, Q.; Qi, X.; Zhang, M.; Zuo, T.; Lu, J. Land use and ecosystems services value changes and ecological land management in coastal Jiangsu, China. Habitat Int. 2016, 57, 164–174. [Google Scholar] [CrossRef]
  52. Fu, Q.; Li, B.; Hou, Y.; Bi, X.; Zhang, X. Effects of land use and climate change on ecosystem services in Central Asia’s arid regions: A case study in Altay Prefecture, China. Sci. Total Environ. 2017, 607–608, 633–646. [Google Scholar] [CrossRef]
  53. Cao, Y.; Kong, L.; Zhang, L.; Ouyang, Z. The balance between economic development and ecosystem service value in the process of land urbanization: A case study of China’s land urbanization from 2000 to 2015. Land Use Policy 2021, 108, 105536. [Google Scholar] [CrossRef]
  54. Zhang, P.; Yuan, H.; Xin, T. Sustainable development in China: Trends, patterns, and determinants of the “Five Modernizations” in Chinese cities. J. Clean.Prod. 2019, 214, 685–695. [Google Scholar] [CrossRef]
  55. Bai, Y.; Deng, X.; Jiang, S.; Zhang, Q.; Wang, Z. Exploring the relationship between urbanization and urban eco-efficiency: Evidence from prefecture-level cities in China. J. Clean. Prod. 2018, 195, 487–1496. [Google Scholar] [CrossRef]
  56. Deng, X.; Huang, J.; Rozelle, S.; Zhang, J.; Li, Z. Impact of urbanization on cultivated land changes in China. Land Use Policy 2015, 45, 1–7. [Google Scholar] [CrossRef]
  57. Shi, Z.H.; Cai, C.F.; Ding, S.W.; Wang, T.W.; Chow, T.L. Soil conservation planning at the small watershed level using RUSLE with GIS: A case study in the Three Gorge Area of China. Catena 2004, 55, 33–48. [Google Scholar] [CrossRef]
  58. Kosoy, N.; Corbera, E. Payments for ecosystem services as commodity fetishism. Ecol. Econ. 2010, 69, 1228–1236. [Google Scholar] [CrossRef]
  59. An, G.; Huang, H.; Liu, Z.; Kong, F.B.; Liu, K.; Xu, Y.T. Progress of land use and ecosystem service valuation in China. J. Jinan Univ. (Nat. Sci. Ed.) 2022, 1–11. (In Chinese) [Google Scholar] [CrossRef]
  60. Wu, Q.; Ma, H.Y.; Zhang, H.P.; Liu, Y.R. The value of forest ecosystem services and its compensation calibration—an example of Horsetail pine forest. J. Ecol. 2019, 39, 117–130. (In Chinese) [Google Scholar]
  61. Lou, P.; Fu, B.; Liu, H.; Gao, E.; Fan, D.; Tang, T.; Lin, X. Dynamic estimation of ecosystem service function value of grassland in Xilin Gol league. J. Ecol. 2019, 39, 3837–3849. (In Chinese) [Google Scholar]
  62. Yang, W.; Jin, Y.W.; Sun, L.X.; Sun, T.; Shao, D.D. Trade-off intensity of ecosystem services in the Yellow River Delta wetlands based on production possibility boundary. J. Nat. Resour. 2019, 34, 2516–2528. (In Chinese) [Google Scholar]
  63. Chen, H. Complementing conventional environmental impact assessments of tourism with ecosystem service valuation: A case study of the Wulingyuan Scenic Area, China. Ecosyst. Serv. 2020, 43, 101100. [Google Scholar] [CrossRef]
Figure 1. Map of the administrative divisions of the study area.
Sustainability 13 10637 g001
Figure 2. The environmental layers. (LUCC, fully known as Land Use Cover Changes, is the land-use types of the Guanzhong Region, DEM is the Digital Elevation Model, SLOPE is the slope acquired through DEM by ArcGIS software of the area, and HILLSHADE is the hill shade acquired through DEM by ArcGIS software.).
Sustainability 13 10637 g002
Figure 3. The interactive coupled relationship between ESV and urbanization. Urbanization is a composite process based on the four dimensions of “population, economy, space and society”. In this study, we have selected the following indicators related to human activities according to the four aspects of urbanization. PCG represents per capita GDP. PIA represents per capita investment in fixed assets. PRC represents per capita retail sales of consumer goods. NAI represents non-agricultural industries. DIR represents disposable income of rural residents. NAP represents the non-agricultural population. UR represents the urbanization rate. CP represents the urban primacy degree, and UP represents the urban population. NET represents number of employees in the tertiary industry. RP represents Resident population. CLA represents construction land area.
Sustainability 13 10637 g003
Figure 4. Maps of spatial pattern of gross and per capita ecosystem services value.
Sustainability 13 10637 g004
Figure 5. The percentage of the four primary ESV categories.
Sustainability 13 10637 g005
Figure 6. Map of the spatial distribution of urbanization development degree.
Sustainability 13 10637 g006
Figure 7. Comparison of NPUP and ESV levels.
Sustainability 13 10637 g007
Figure 8. The coupling coordination degree between urbanization and ecosystem services value.
Sustainability 13 10637 g008
Figure 9. The coupling coordination degree on county (district) scale.
Sustainability 13 10637 g009
Table 1. Ecosystem services value per unit area in the Guanzhong region yuan/(hm2·a).
Types of LUCCFarmlandForestlandGrasslandWaterbodyConstruction LandUnused Land
Types of ESV (Million)
Food Supply616.51203.45265.112.33326.7512.33
Raw Material Production240.441837.19221.9424.66215.7824.66
Gas Regulation443.892663.31924.7636.99314.4236.99
Climate Regulation598.012509.18961.7580.15127080.15
Hydrologic Regulation474.712521.51937.0943.1611571.8443.16
Waste Treatment856.951060.39813.79160.299155.13160.29
Soil Retention906.272478.361380.98104.81252.77104.81
Biodiversity628.842780.451152.87246.62114.62246.6
Aesthetic Landscape104.811282.33536.36147.962737.29147.96
Total4870.4117336.187194.64856.9527958.6856.95
Table 2. Comprehensive index of the development stages of coupling between urbanization and ecosystem services.
Primary Division of
Development Stages
Secondary Division of
Development Stages
Tertiary Division of Development Stages
Balanced development
(acceptable interval)
0.7 < D ≤1.0Superiorly balanced
development
g(E) − f(U) > 0.1Superiorly balanced development
with a lagging urbanization (Level IA)
f(U) − g(E) > 0.1Superiorly balanced development
with a lagging environment (Level IB)
0 < |f(U) − g(E)| ≤ 0.1Superiorly balanced development of
urbanization and the environment (Level IC)
Transitional development
(transitional interval)
0.6 < D ≤ 0.7Moderately balanced
development
g(E) − f(U) > 0.1 Moderately balanced development
with a lagging urbanization (Level IIA)
f(U) − g(E) > 0.1 Moderately balanced development
with a lagging environment (Level IIB)
0 < |f(U) − g(E)| ≤ 0.1 Moderately balanced development of
urbanization and the environment (Level IIC)
0.5 < D ≤ 0.6Barely balanced
development
g(E) − f(U) > 0.1Barely balanced development
with a lagging urbanization (Level IIIA)
f(U) − g(E) > 0.1Barely balanced development
with a lagging environment (Level IIIB)
0 < |f(U) − g(E)| ≤ 0.1Barely balanced development of
urbanization and the environment (Level IIIC)
Unbalanced development
(unacceptable interval)
0.3 < D ≤ 0.5Slightly unbalanced
development
g(E) − f(U) > 0.1Slightly unbalanced development
with a lagging urbanization (Level IVA)
f(U) − g(E) > 0.1Slightly unbalanced development
with a lagging environment (Level IVB)
0 < |f(U) − g(E)| ≤ 0.1Slightly unbalanced development of
urbanization and the environment (Level IVC)
0 < D ≤ 0.3Seriously unbalanced
development
g(E) − f(U) > 0.1Seriously unbalanced development
with a lagging urbanization (Level VA)
f(U) − g(E) > 0.1Seriously unbalanced development
with a lagging environment (Level VB)
0 < |f(U) − g(E)| ≤ 0.1Seriously unbalanced development of
urbanization and the environment (Level VC)
Table 3. Land ecosystem services value in the Guanzhong region (×CNY 106).
Regulating ServicesSupporting ServicesProvisioning ServicesCultural ServicesTotal
Gas RegulationClimate RegulationHydrologic RegulationWaste TreatmentSoil RetentionBiodiversityFood ProductionRaw MaterialAesthetic LandscapeTotal
Farmland1101.641484.151178.142126.782249.181560.661530.05596.72260.1112,087.43
Forestland3555.803350.023366.491415.743308.873712.19271.622452.841712.0523,145.62
Grassland1236.201285.641252.681087.851846.051541.12354.38296.69716.999617.60
Waterbody24.4998.93901.42713.1719.69164.7225.4516.81213.232177.92
Construction Land12.3426.7314.3953.4634.9682.254.118.2249.35285.81
Unused Land0.220.480.260.960.631.470.070.150.885.11
Total5930.696245.966713.385397.957459.377062.412185.693371.432952.6247319.50
Table 4. Descriptive statistics of each variable.
VariableNumberMeanMinimumMaximum
Coupling Degree540.380.10.65
Per capita GDP (yuan)5435,967.0916,093136,842
Per capita investment in fixed assets (yuan)5443,663.0913,473154,734
Per capita retail sales of consumer goods (yuan)547669.14479415,182
Proportion of added value of non-agricultural industries (%)540.810.571.06
Disposable income of urban population (yuan)5428,290.1423,90733,600
Disposable income of rural residents (yuan)549697.66762013,615
Number of employees in the tertiary industry5449,977.295113205,341
Resident population (ten thousand)5462.215.13119.29
Human capital5414,497.8194634,076
Common cultivated land area (hm2)5433,144646093,352
Table 5. Estimation results of influencing factors of the Coupling degree (D) in the Guanzhong area.
Explanatory VariablesCoefficientStandard Deviation
Per GDP−1.63 × 10−61.69 × 10−6
Per investment−1.23 × 10−69.92 × 10−7
Per consumption9.19 × 10−69.12 × 10⁻⁶
Non-agricultural−0.1090.137
Urban income2.27 × 10−5 ***4.83 × 10⁻⁶
Rural income2.62 × 10−51.73 × 10⁻⁵
Third employees3.03 × 10−6 ***3.90 × 10⁻⁷
population−0.005 **0.002
Human capital6.02 × 10−6 **2.50 × 10⁻⁶
Arable area−6.71 × 10−71.70 × 10−6
Constant−0.588 ***0.135
Observations54
R20.848
Robust standard errors in parentheses *** p < 0.01, ** p < 0.05.
Table 6. Estimation results of factors affecting the Coupling degree in the Guanzhong area by ordered probit model.
Explanatory VariablesCoefficientStandard Deviation
Per GDP−1.52 × 10−54.14 × 10−5
Per investment−6.42 × 10⁻⁵ **3.26 × 10⁻⁵
Per consumption0.15 × 10−30.24 × 10⁻³
Non-agricultural−6.264.8
Urban income0.674 × 10−3 **0.32 × 10⁻³
Rural income0.96 × 10−3 *0.57 × 10−3
Third employees7.16 × 10−5 **2.83 × 10⁻⁵
population−0.1210.074
Human capital0.15 × 10−39.44 × 10⁻⁵
Arable area−5.00 × 10−54.86 × 10−5
Observations54
R20.629
Standard errors in parentheses ** p < 0.05, * p < 0.1.
Publisher’s Note: MDPI stays neutral with regard to jurisdictional claims in published maps and institutional affiliations.

