
Measuring Learnability through Virtual Reality Laboratory Application: A User Study


1
Department of Software Engineering, National University of Modern Languages, Islamabad 44000, Pakistan
2
Department of Computer Science, National University of Modern Languages, Rawalpindi 46000, Pakistan
3
Faculty of Computing and Informatics, University Malaysia Sabah, Kota Kinabalu 88400, Malaysia
*
Author to whom correspondence should be addressed.
Sustainability 2021, 13(19), 10812; https://0-doi-org.brum.beds.ac.uk/10.3390/su131910812
Submission received: 31 July 2021
/
Revised: 31 August 2021
/
Accepted: 4 September 2021
/
Published: 29 September 2021
(This article belongs to the Special Issue Sustainable Educational Technology and E-learning)
Abstract
:The cutting-edge technology of virtual reality has changed almost every aspect of life in e-commerce, engineering, medicine, and entertainment. This technology has also made its way to the field of education in the form of virtual laboratories. A lack of student engagement and interest towards STEM subjects is reported in the literature. Several studies have been conducted to evaluate virtual reality in education, but these studies are limited in terms of participants and subject coverage. This study aimed to assess the effectiveness of virtual laboratories to develop student’s practical learning skills for secondary school physics. For this purpose, a desktop-based virtual laboratory application was developed based on the guidelines extracted from the literature. A user study was adopted as the main research method, and it was conducted with 184 students of 4 different schools. In each school, students were divided into two groups: experimental (used the virtual laboratory application) and control (used a physical laboratory). The data were collected through an academic quiz conducted at the end of the study. The mean score of the experimental group was 7.16, compared with 5.87 for the control group. The results revealed that the students’ learning using the virtual laboratory application was better compared with the control group. Interestingly, there was no significant difference in the performance of boys and girls in both groups. The usability questionnaire was also completed by 92 students of the experimental group to assess the application interface. The mean score was 73.5 (above average) with an internal consistency of 0.76. The participants found the virtual laboratory application to be user-friendly, easy to use, and supportive in learning.
1. Introduction
The curriculum of Science, Technology, Engineering, and Mathematics (STEM) subjects (e.g., chemistry, physics, mathematics, and biology) of secondary school education makes students creative thinkers and problem solvers and increases their scientific literacy [1]. Many students show less interest in these subjects because they find them boring and too difficult [2]. Due to this reason, students do not actively participate in class and fail to show good performance in these subjects [3].
STEM education needs advancements to be more effective for students in building interest toward their learning. This can be achieved by upgrading teaching methods with technology like virtual reality (VR). Recent advancements of VR include Head-Mounted Devices (HMDs) like the HTC Vive, Oculus Rift, Oculus Quest, Samsung Gear VR, and Google Cardboard, which enable an immersive experience for their users [4,5]. VR replicates the real world in a computer-generated environment, and one can immerse him or herself in this environment through touch, sight, and hearing by wearing headsets, gloves, and headphones [6]. Nowadays, VR applications are found in almost every field, like e-commerce, video games, education, medical, architecture, engineering, and sports [7].
In the field of education, VR is often used in a variety of ways, including virtual museums, virtual teaching, virtual laboratories, and virtual campuses [8,9]. This advancement makes boring subjects more interesting and increases the level of engagement with the subject [10]. VR supports constructive learning in which students develop their own learning, find solutions to the problem, and discuss it with other students [11]. The application ‘Fantastic Contraption’ is an example of constructive learning which helps students understand the concepts of physics. In this application, students build a machine, and if any problem arises, they use their problem-solving skills to fix the issue and solve the problem themselves [12].
Student learning can also be affected if students go through the process of anxiety, distress, disabilities, or other disorders. These students hesitate to collaborate with their classmates [13]. VR gives the opportunity of training or therapy to these students and permits them to learn in a more explorative, engaged, and empowered way [14]. VR applications like ‘VR Language Learning’ and ‘Public Speaking VR’ help students to speak without any hesitation in a classroom and in public [15].
Many educational institutes are now using the technology of VR in order to make studies interesting and innovative and engage students in their learning processes [16]. In the case of traditional teaching methods, students often find the learning process boring because the course content learned in class is different from practical work [17]. The STEM subjects like physics, chemistry, and biology require science laboratories. These laboratories put ideas into practical work, which increases students’ practical skills and leads to a better understanding of science subjects [18].
Traditional science laboratories are built on a physical location, mostly within schools where teachers explain experiments and students do the practical work accordingly. These laboratories are effective in student learning, but they also hold some drawbacks which include the following [19]:
- Students perform a limited number of experiments with a lack of guidance for them;
- Limited in facilities, resources, expensive equipment, infrastructure, and maintenance;
- Lack of teacher’s knowledge and student’s enthusiasm for the experiment;
- Some experiments are dangerous to perform in a physical laboratory [20];
- Unable to meet requirements for distant and handicapped students.
In this context, the new technology of the Virtual Reality Laboratory (VR-Lab) plays its part in overcoming these problems [21]. VR-Lab is an innovative laboratory which helps students and teachers in the teacher–learning process and gives a platform for students to explore and learn by conducting different experiments and to collaborate with other students [22]. It provides an environment for students to learn advanced things which they cannot experience in traditional laboratories [23].
Virtual laboratories help educational institutions to save space in areas where institutions cannot afford the physical infrastructure. Through these laboratories, the appropriate use of equipment and their assembly can easily be performed and effective in time management, and students can repeat any practical task without the waste of any equipment [24]. It helps for assessing the performance of students in crowded groups during practical work, and the maintenance of these laboratories is also inexpensive [25]. Additionally, virtual laboratories are more beneficial when performing high-risk experiments, which are very dangerous to perform and need highly protective measures in physical laboratories [26]. Hence, virtual laboratories are used as an instructional resource, and with the help of contextual elements, students can understand the bonding between the real and virtual worlds.
In this study, we are interested in integrating a cost-effective, desktop-based virtual laboratory in scientific education. This integration overcomes physical laboratory issues such as the inaccessibility of equipment, laboratory infrastructure, funding issues, learning difficulty, or low interest from students toward science experiments [19,21]. The main focus is to use VR technology in secondary schools along with the identification of learning parameters and design guidelines for VR application development. Secondly, the focus is on how VR technology affects students’ learning [27,28].
Virtual laboratories have been found to be effective for students in their learning processes of different concepts. Keeping in mind the benefits of virtual laboratories, the main objectives of this study are as follows:
- Development of a desktop-based virtual laboratory application for physics experiments;
- Evaluation of the developed application in contrast to a physical laboratory in the context of students’ learning.
The contributions of this study are multifold. First, it investigates the key learning parameters for secondary schools and the design guidelines for VR. Second, a virtual laboratory application is developed for physics experiments. Third, the study uses an instrument to measure the usability of the application. Fourth, the study compares the role of a virtual laboratory in contrast with a physical laboratory in secondary school students’ learning.
This paper is structured as follows. Section 2 provides a brief description of the related work for virtual laboratory applications. Section 3 presents the methodology adopted for this research study. The results are discussed in Section 4. Section 5 concludes the study and suggests future work on the developed virtual laboratory application.
2. Related Work
Virtual laboratories provide a platform for students to perform different experiments in STEM subjects virtually, which is useful for an effective learning process. It also supports teachers in demonstrating practical tasks, and students can easily learn the technical skills through this environment [29]. All experiments which are performed in traditional and virtual laboratories increase the constructivism within students. The researchers [30] explained the differences between both laboratories, such as how students of traditional laboratories need care while performing experiments, but this is not the case in a virtual environment. Students can easily interact with different virtual objects and learn by doing different things.
Virtual laboratories help students to meet the required level in their learning process. In [31], the authors measured the students’ achievement levels with the help of a chemistry virtual laboratory. Two environments were used: blended (combination of traditional and virtual) and traditional. The study showed that students in the blended environment performed better compared with the traditional environment because they were more engaged during the learning process.
Students need to increase their social experience, collaboration, and engagement in group discussions along with their studies. For this reason, virtual laboratories are effective for achieving these goals. According to [32], an application developed using an HTC Vive device for physics concepts motivated students to use virtual environments. The application assisted students to move into the immersive environment and interact with objects. The study concluded that experiments performed in this environment were more engaging compared with traditional laboratories.
Another example of a virtual laboratory is a 3D, immersive, computer-based physics application called ‘Water Cycle in Nature’ [2]. The researcher carried out the study with 58 students of a primary school in Ireland, focused on concepts of physics like evaporation and condensation. The results showed that students enjoyed experimenting while performing practical tasks, and it helped them to learn better.
Students’ engagements toward educational material can also be improved through game-based learning using immersive technology. For this purpose, [33] investigated students’ learning in the subject of chemistry through a game-based application developed in VR and augmented reality (AR). The aim of this study was to explore learning effectiveness and game acceptance among students. The results indicated more involvement and acceptance toward technology, but the study was limited to control groups.
3. Materials and Methods
This section explains the methodology adopted in this research. It includes a literature review, application development, a user study, and data analysis.
3.1. Literature Review
In the first phase, a literature review was adopted as a research method [4]. It is a way of collecting and combining previous research [34]. This study thoroughly reviewed the literature for identification of learning parameters and design guidelines for VR from previous studies.
From the literature, different learning parameters were identified and later considered for the application’s design. There are different categories of learning parameters [4,35] which affect student learning in secondary schools. These parameters include affection (subdivided into difficulty level, acceptance of technology, preference, perspective, motivation, effectiveness, attitude, confidence level, and satisfaction), cognition (subdivided into achievement, collaboration, and thinking level), behavior, skills, and correlation. The following design guidelines of VR were also identified from the literature. These guidelines support the development of VR applications:
- The degree of freedom should be minimal [36];
- Create the sense of a 3D environment by using depth cues [40];
- The correct use of user interface (UI) elements [41];
- A user guide that helps to start the 3D environment [42];
- Use a minimum number of controls, which helps the student to remember the controls [43];
- Virtual objects should be made from real-world objects [39];
- Try to use Gestalt principles like similarity, proximity, and hierarchy [44];
- Try to give feedback to the user when they interact with any virtual object [4];
- Use audio to help experience the real world in a virtual environment [45].
3.2. Application Development
In the second phase, there was a need for a VR application for evaluating students’ learning. For this purpose, a virtual laboratory application was developed. This application facilitates educational science laboratories moving from reality to a virtual environment. This conversion includes replacing expensive equipment with graphical virtual objects which are easy to use and move and perform faster. The application needs technical equipment like computers and software which cost less than the traditional laboratory equipment. It provides an interactive and safe environment for students and gives a platform for them to perform experiments individually or in groups.
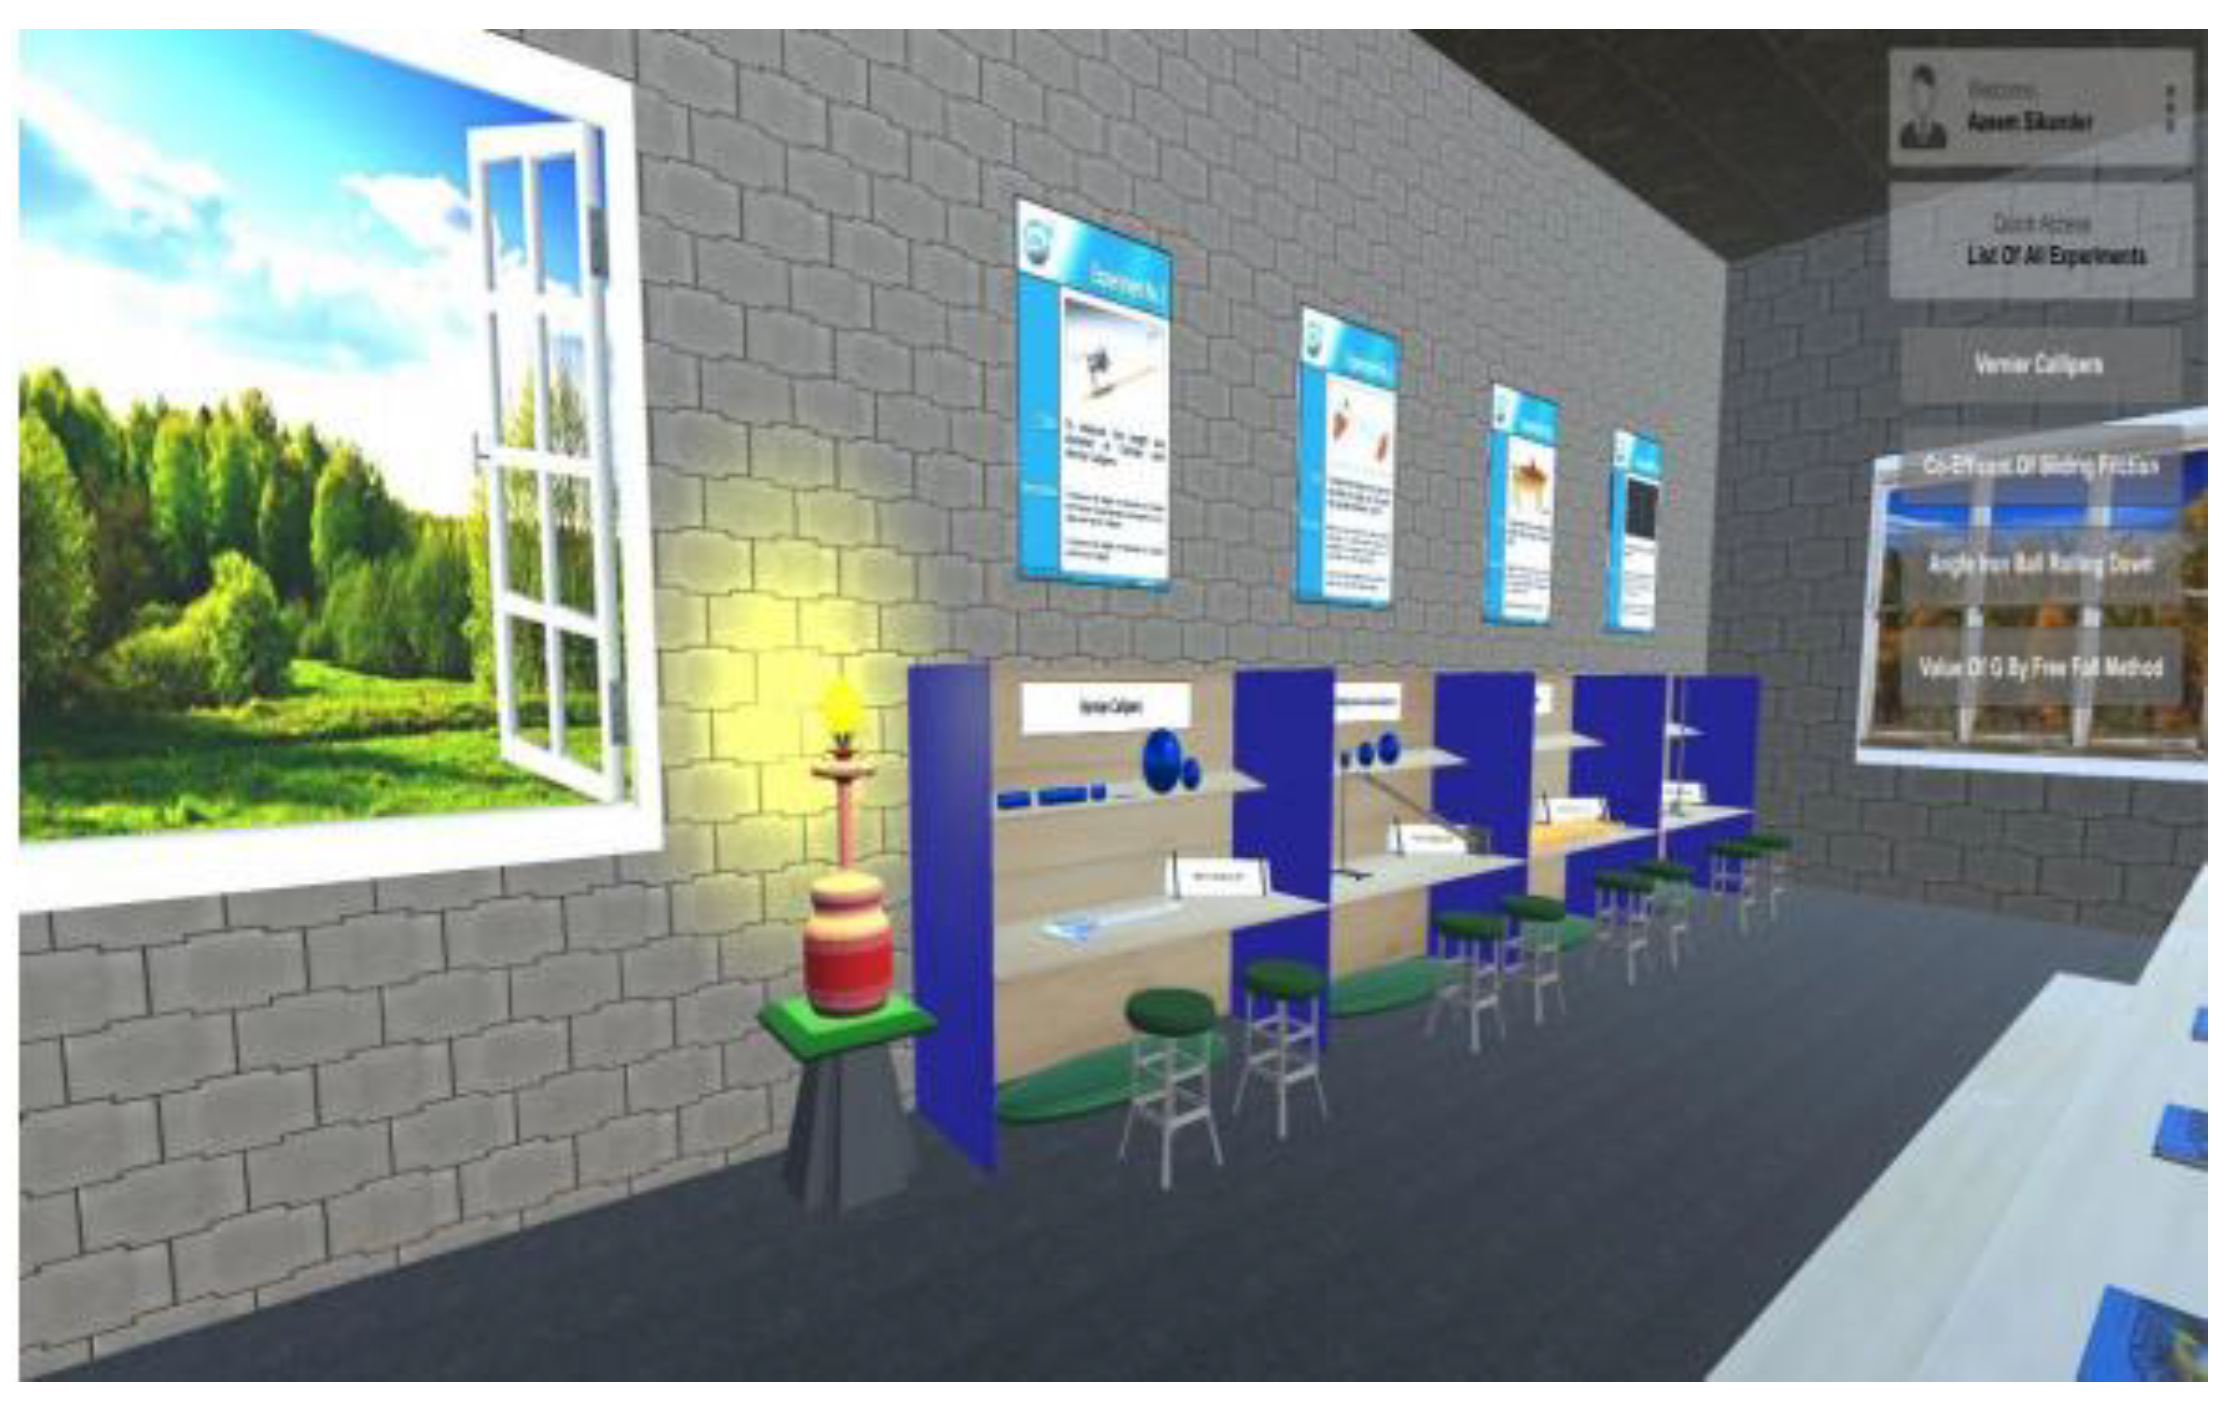
The application having a 3D environment as shown in Figure 1 was meant for physics experiments for secondary school students. It included four experiments: Vernier Calipers (as shown in Figure 2), Coefficient of Sliding Friction, Acceleration of a Rolling Ball on an Angle Iron, and the Value of G by Free Fall Method. The application was designed in Unity 3D and Blender and developed using .NET Framework, C#, PHP, and MySql technologies.
The 3D environment was designed in such a way that students could easily move in the environment and interact with virtual objects. It provided relevant and meaningful experience to the students.
3.3. User Study
In the third phase, the study collected data through a user study [21,46]. This study adopted a quantitative research approach which investigated the phenomena by gathering numerical data and applying computational and mathematical techniques on the data [47,48]. The data were collected through an experimental design comprising two groups: a control group (CG) and an experimental group (EG). The CG used the laboratory without technology, whereas the EG used the technology of a virtual laboratory.
The two groups were given the same physics experiments. They were first taught about the experiments before performing the tasks. The students performed tasks through dragging and dropping objects. Students in both groups were then given the quiz related to experiments performed in virtual and traditional laboratories to assess their attained skill. In this study, the dependent variable was the student’s practical skill learning of physics concepts, and the independent variable was the virtual and traditional laboratory approaches. For the usability evaluation of the application, the students filled out a usability questionnaire at the end of the study.
3.3.1. Study Area
The study was conducted at four different secondary schools located in Rawalpindi, Pakistan. The inclusion criteria for this research were to choose those schools where practical work had not started at that moment and students had no or limited knowledge about the experiments.
3.3.2. Participants and Sampling
Students in ninth grade from four different schools participated in this study. Out of 184 participants, 99 (54%) were boys and 85 (46%) were girls. Participants were randomly assigned to EG and CG in each school. There was an equal number of participants in every group of each school. The age range of the participants was 14–16 years. The details of the participants are shown in Table 1.
At the start of the study, formal permission from the schools’ administrations was requested. Participants in this study were invited on a voluntary basis, and their consent was recorded on paper. Furthermore, confidentiality was also maintained throughout the study.
3.3.3. Data Collection
The data were collected through a quiz and a usability questionnaire. First, the participants of the two groups performed the experiments in virtual and traditional laboratories. Later, a quiz (related to the experiments performed) as a post-test was conducted among them to assess participants’ learning. A System Usability Scale (SUS) questionnaire was used to acquire data about the usability and learning experience of a virtual laboratory. A five-point Likert scale was used to answer the closed-ended questions for the participants. The questionnaire used a mix of positive and negative items [49].
The experiment and quiz questions were validated by two instructors of physics. The coefficient of reliability for a questionnaire, as assessed by the Cronbach’s alpha formula to find internal consistency, was 0.76, which showed that the questionnaire was reliable.
3.4. Data Analysis
The data collected from the quiz and usability questionnaire were analyzed through descriptive and inferential statistical methods. For descriptive analysis, the methods of the mean, standard deviations, and standard error mean were used. For the inferential method, a z-test with a significance level of 5% was applied to evaluate the performance of both the control and experimental groups.
The effect size was also calculated to determine the magnitude of the CG and EG. This was measured through Equation (1):
The usability questionnaire (SUS) used the scores as responses to each item on a five-point rating scale. The scale was labeled as follows: 1 = strongly disagree, 2 = disagree, 3 = neutral, 4 = agree, and 5 = strongly agree. Responses were then calculated through the SUS framework, which used the formula of subtracting one from each odd item score (Equation (2)) and subtracting five from each even item score (Equation (3)). The total scores of the odd and even items were added and multiplied by 2.5 (Equation (4)). The odd-numbered items were positive, whereas the even-numbered items were negative:
4. Results
This section presents the results of the study. The role of the developed virtual laboratory application was considered effective if the EG students’ learning was better than the CG toward the physics experiments. This could be evaluated through the quiz scores. The hypotheses were formulated as given below:
Hypothesis 0 (H0).
There is no significant difference in the students’ learning between the EG and CG.
Hypothesis 1 (H1).
There is a significant difference in the students’ learning between the EG and CG.
Table 2 shows the students’ scores out of 10 for the conducted quiz. The quiz contained 10 multiple choice questions to attempt. The primary purpose of the quiz was to measure the students’ learning gained in this study. The students’ scores were classified as excellent in the case of scores from 8 to 10, fair if the score range was 5–7, and poor in case of scores of 4 or less. In the ‘Excellent’ category, the EG outperformed the students of the CG in each school. In contrast, the number of CG students was high in the ‘Poor’ category. The overall performance of the EG was better compared with the CG.
In the EG, about 48% of the students’ marks were in the ‘Excellent’ category, indicating that the students learned the desired knowledge and practical skills reasonably well, and 39% of the students’ scores were in fair category, whereas 13% were in the ‘Poor’ category. In the CG, the students did not perform as well as the EG students.
In order to test the hypothesis (H1), a two-sample z-test was applied for comparison of the two groups because the sample size was 92 for each group (greater than 30). For normal distribution measurement of the data, skewness symmetry [50] was used (Table 3).
The data would be considered normally distributed if the skewness values were between −0.5 and 0.5. The skewness results showed that the CG was normally distributed with the value of −0.33, whereas the EG had a slightly greater value (−0.77) than ±0.5. The skewness can be seen for each group through the histograms presented in Figure 3 and Figure 4.
The test was applied on the quiz scores of both groups (of all four schools) with a significance level of 5%. As is presented in Table 4, the z-test compared the mean scores of the EG group (M = 7.16) and the CG (M = 5.87) with a z score = 3.80. It was found that the results were statistically significant (i.e., p = 0.000141 (p < 0.05 was considered significant)). This indicates that there was a significant difference in the means of the quiz scores between both groups (EG and CG). Thus, the EG performed better compared with the CG, and the null hypothesis (H0) was rejected in this case.
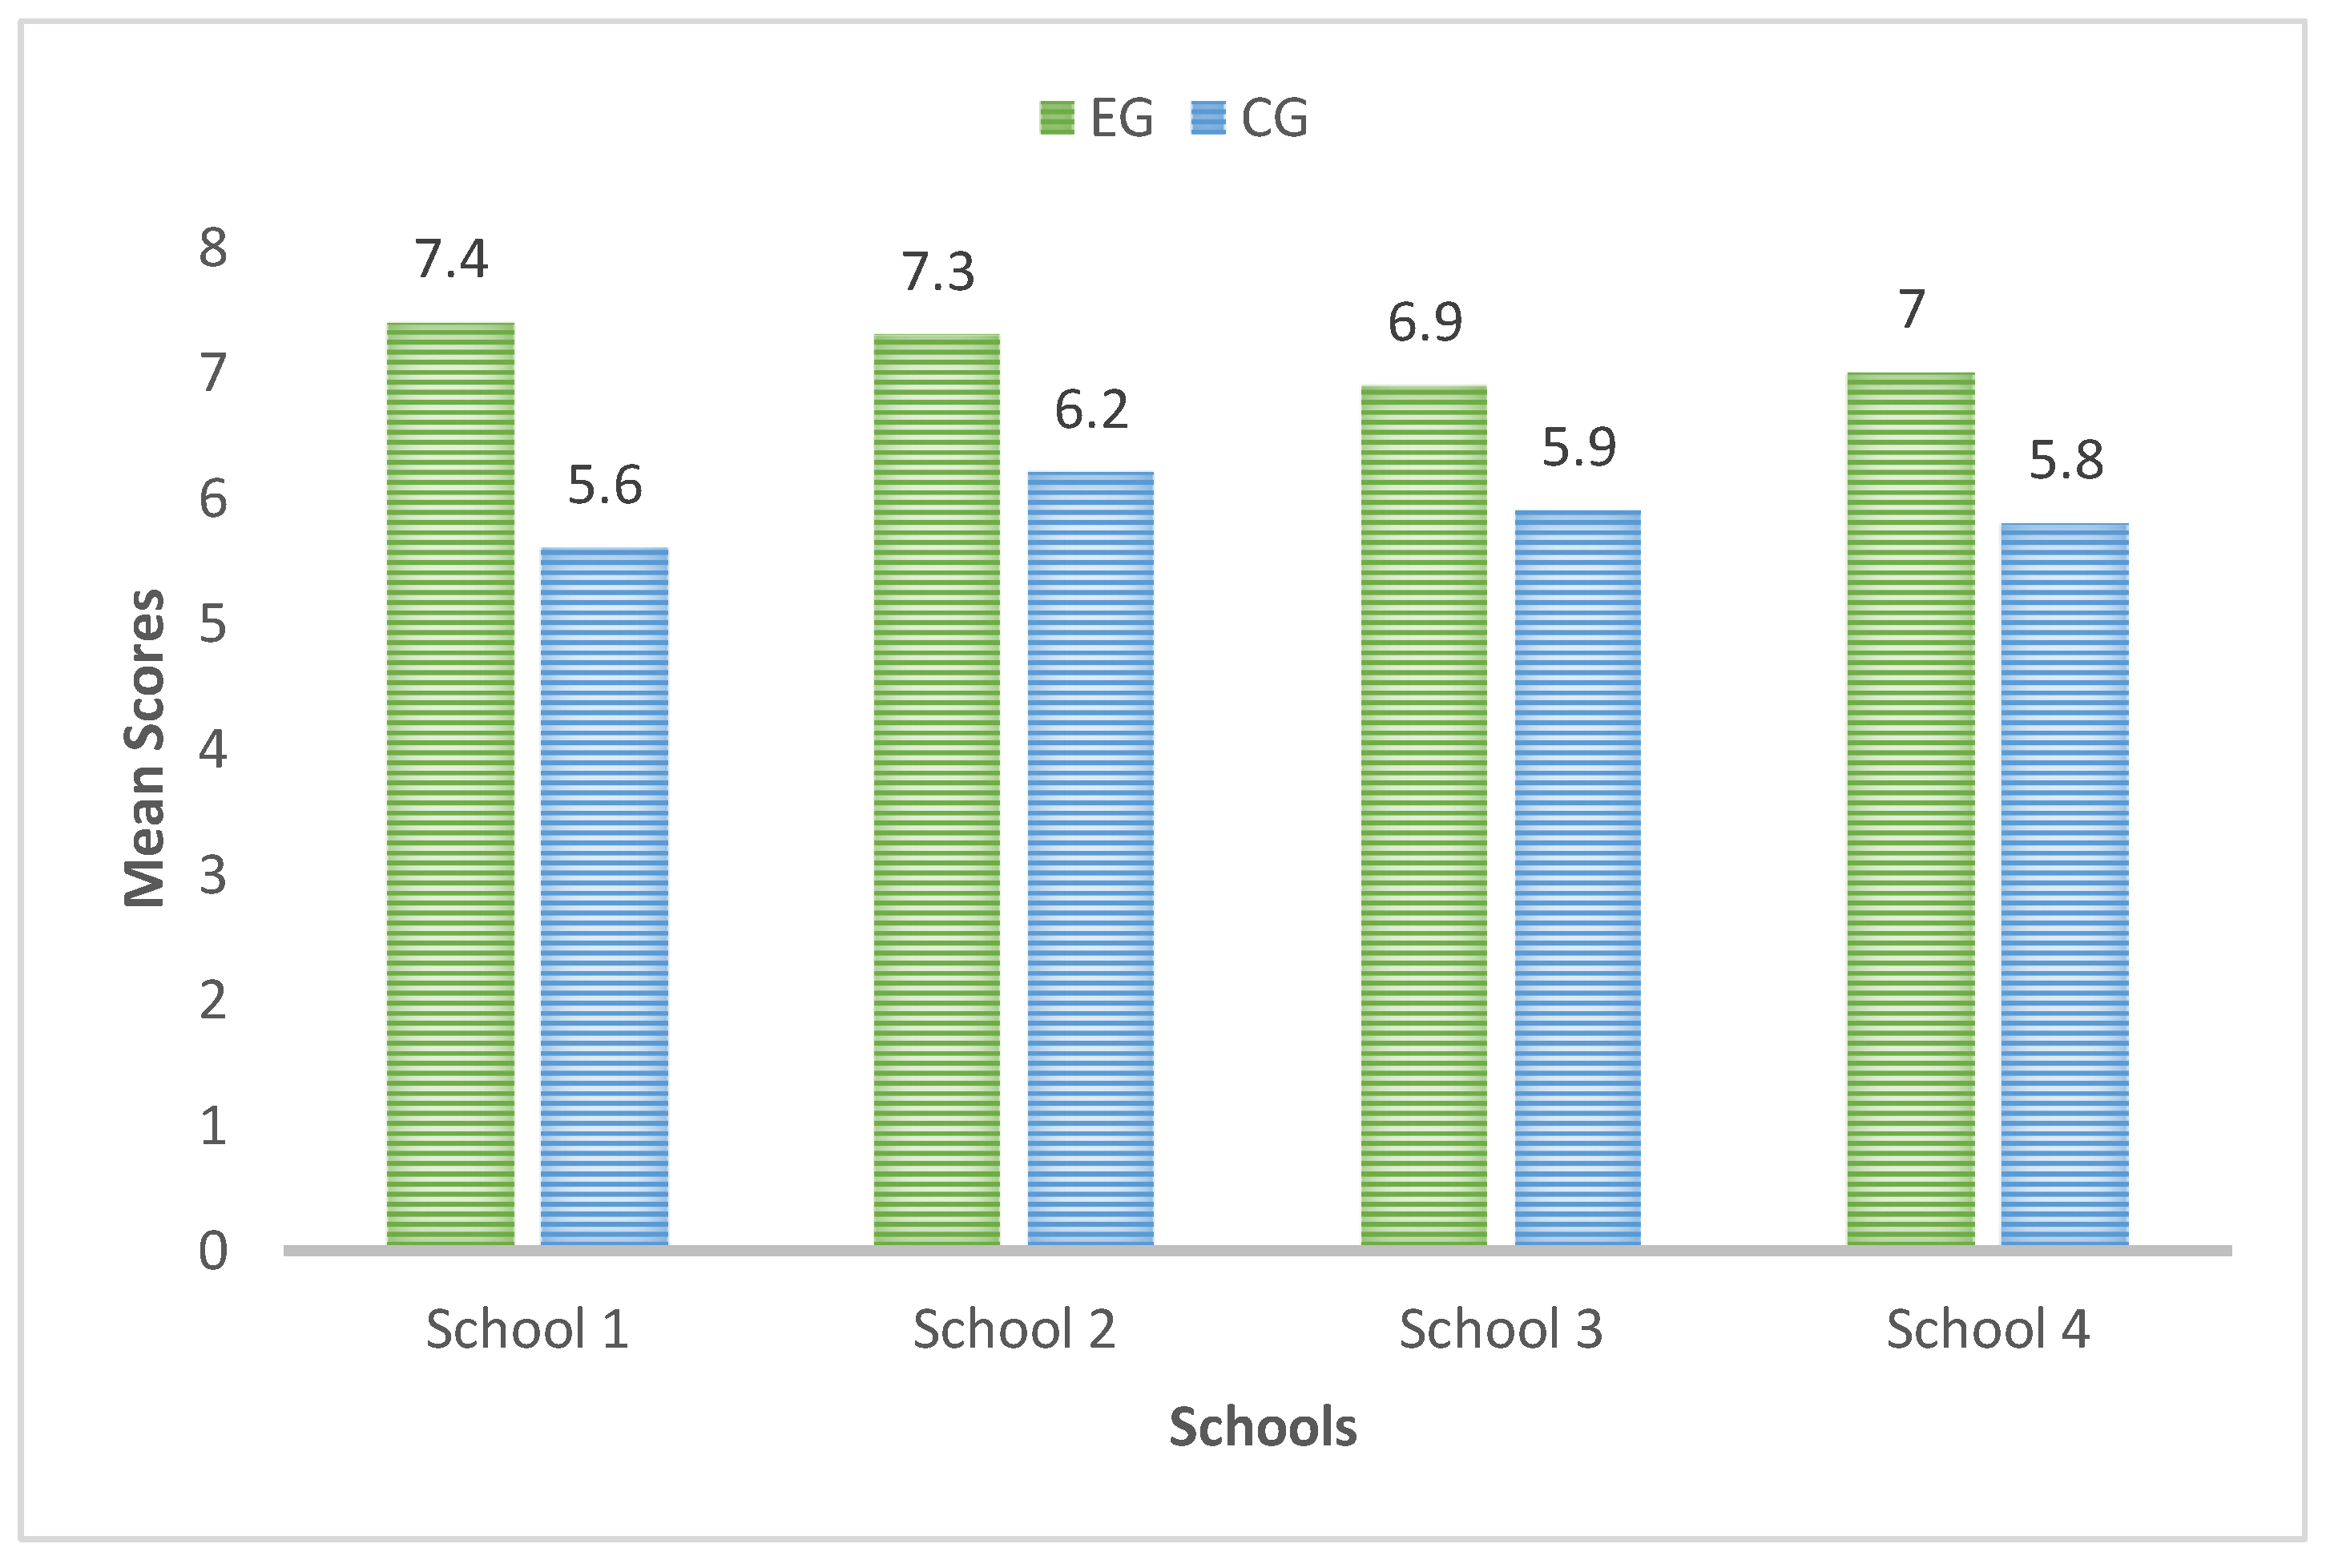
The mean scores were also calculated for both groups as shown in Figure 5. The experimental groups scored significantly better or higher than the CG participants. This means that the students’ performances were improved through the virtual laboratory application. This study also evaluated the performance of the EGs within the schools. It was observed that the EG participants of School 1 performed better than the other three schools with an average mean score of 7.4, which was the highest among the groups.
The effectiveness of the virtual laboratory was also evaluated on the basis of gender through the quiz scores. The user study consisted of 99 boys and 85 girls who were randomly allocated to both groups. The mean scores of the EG participants are shown in Figure 6 with the standard error mean. The mean values were almost the same for the boys and girls in all four schools. The z-test was applied on the quiz scores to find differences among the boys and girls.
The results, presented in Table 5, show that the p value was greater than the alpha value (p > 0.05). This means no significant difference was found between both genders of the EG.
Similarly, the study also evaluated a gender-based comparison for the CG, which is represented in Figure 7. This shows that there was a slight difference in the mean scores of the boys and girls. To find the significant results between the genders of the CG, a z-test was also applied on the data.
The results, presented in Table 6, show that the p value was greater than the alpha value (p > 0.05). This means no significant difference was found between both genders of the CG.
The z-test found significantly different results, as shown in Table 4. For further assurance, this study also calculated its effect size. For interpretation of the effect size results, the general guide by Cohen [51] was used. The guide consists of trivial (<0.1), small (0.1–0.3), moderate (0.3–0.5), and large differences (>0.5). Table 7 shows the effect size, and the value was 0.5, which means there was a moderate difference between the groups. According to Cohen [51], this difference still counts as large enough to be seen by the naked eye.
After analyzing the conceptual understanding of the students in both groups through a quiz, the SUS questionnaire was also circulated among the EG participants. The primary focus was to assess the usability of a developed application and how students felt about the application during the experiments. All participants (92 in total) of the experimental group filled out the questionnaire, which consisted of 10 questions related to usability and learnability.
The SUS score indicated the application usability performance, and each response contained a score ranging from 0 to 100. These scores were not scaled on percentages but rather on percentiles. The average SUS score was 68 with the 50th percentile. The reliability coefficient Cronbach’s alpha was calculated, and the value was 0.76, which indicated good internal consistency of the items, and thus it was acceptable.
According to the SUS results shown in Table 8, the scores were listed as above and below average. The maximum number of scores, with a frequency of F = 31, was recorded in the ‘Excellent’ rating, which means most of the scores were above 80.3 with a mean score M = 87.74 and a standard deviation SD = 4.11. The ‘Good’ rating contained scores between the range of 68–80.3 with a total F = 28. This was the second-highest count for the SUS results, with M = 75.36 and SD = 3.18. This rating was also above average, which counted as acceptable. Interestingly, none of the scores were equal to 68 under the ‘Okay’ rating. A below average score count of F = 26 is listed in the ‘Poor’ rating. The calculated scores were between a range of 51–67, which was also a marginally acceptable range, with M = 62.4 and SD = 5.21. The ‘Awful’ rating consisted of 7 counts, and the scores were below 51. This could be because of a misunderstanding of the SUS questionnaire or participants not paying attention when filling out the questionnaire. Therefore, this rating was not listed in the acceptable category. The SUS rating vs. mean scores with the use of the standard error mean is graphically represented in Figure 8.
There were two factors (i.e., learnability and usability) assessed by the SUS questionnaire. The learnability included two items—item four and item nine—while the remaining eight items belonged to usability. In terms of the results, the average score for learnability was 82%, whereas it was 73.6% for usability. Figure 9 shows the learnability and usability scores compared to the overall SUS score.
5. Discussion
In this study, the main goal was to assess the role of a virtual laboratory in contrast with a physical laboratory for learning physics concepts. The results of this study indicated that students’ learning in the EG was better compared with the CG. The findings of this study support the results of [29], conducted with 58 higher education students for science skills. Moreover, the found statistically significant result (p < 0.05, whereas p = 0.000141) was similar to that of [31], conducted for the learning of chemistry concepts.
Observation during the experiments revealed that the EG students’ interest was relatively greater compared with those in the CG. The same was observed in [10], in which students with a VR application had more interest compared with students using traditional methods. In our study, the students were also excited to try out new technology for learning physics experiments. They were inspired and attracted to the features of a virtual laboratory. They liked the design, colors, and interfaces [4] used for different physics experiments. They were able to easily navigate between different screens and drag and drop the virtual objects. Therefore, the virtual laboratory group really enjoyed performing the experiments. This result is also similar to that of [2], conducted with primary school students for the learning of physics concepts, and the students enjoyed performing the experiments.
It was also observed that some CG students did not pay attention during the physical, traditional mode of teaching. This deficiency was reflected in their quiz scores as shown in Table 2. The average rating of the CG in the ‘Poor’ category was about 25% greater than the average rating in the EG, which was 13% in the same category. In contrast, it was observed that the interest of the EG students in using a virtual laboratory also increased their engagement with the application (average rating of quiz scores in the ‘Excellent’ category was 48%). This observation was similar to that in [9], which also found that emotional stimuli were beneficial for achieving learning motivation and effectiveness in a virtual laboratory.
It was also observed that limited personal computer usage skills might have also contributed to lower quiz scores (mean score was 6.9) at School 3. The students might not have been able to perform the experiments effectively. In contrast, School 1 had a better computer laboratory infrastructure, and the average score of their students was the greatest (mean score was 7.4).
The study also consisted of mixed genders (i.e., both groups (EG and CG) were composed of boys and girls). There was no significant difference between the performances of the boys and girls of the EG (from Table 5, the mean score for boys M = 7.24, and the mean score for the girls M = 7.2; z = 0.12; p = 0.905; p > 0.05). The study also did not find any significant difference between the boys and girls of the CG (from Table 6, p = 0.9). The findings of this study were different compared with those in [52], which reported that male students performed better than female students when using the virtual laboratory.
Regarding the limitations of this study, it was conducted with a large number of students (i.e., 184), but it may be conducted with a greater number of students at multiple schools in different regions for a larger dataset and better generalization of the results. Secondly, as discussed above in this section, the lack of the students’ interest in the CG may be addressed by making teaching sessions relatively more interactive and engaging. Thirdly, this study was conducted with the resources that were available at the schools, which may have affected the students’ performance.
6. Conclusions and Future Work
The new emerging technologies successfully boost students’ learning processes and help STEM education by providing interactive environments for learning. The virtual laboratory is one of the best cutting-edge technologies which provides opportunities for students to learn and perform experiments. It also improves the practical skills of students.
This paper reports a user study conducted with secondary school students to evaluate the effectiveness of a virtual laboratory in learning physics concepts. The study was performed with 184 students who were divided into two groups (i.e., a control group (learned through the traditional laboratory) and an experimental group (learned using the virtual laboratory application)). It was found that the students who used the virtual laboratory application for their learning performed better than the control group. Their interest and learning were reflected through the scores (i.e., the mean score (7.16) of the experimental group was greater than the mean score (5.87) of the control group). The results indicated the positive effect on the students’ learning when using the virtual laboratory. As for the comparison based on the gender in both groups (EG and CG), interestingly, there was no significant difference observed among the performance of the boys and girls. At the end of the study, students in the EG were asked for their feedback about the application through the usability questionnaire. The students appreciated the application, which was reflected through the overall usability score (73%). It was found that the learning and engagement of secondary school students toward their subjects increased by using the user-friendly design of the virtual laboratory application.
It is clear from the results of this study that a virtual laboratory positively affected the students’ learning of physics. Thus, the findings strengthen the existing studies (i.e., a virtual laboratory may play a role in improving students’ learning for multiple science subjects at different levels of school education). Moreover, virtual technology also reduces the laboratory equipment requirements and infrastructure cost through desktop-based applications. This may help developing countries to use the basic existing computer infrastructure for STEM education.
For future work, an online version (web application) of this application may be developed. In this way, it may overcome barriers in the learning process of self-isolated students during the COVID-19 pandemic and may support distance learning education. Furthermore, the scope of this application may be extended to other subjects like chemistry and biology.
Author Contributions
Conceptualization, N.M. and G.R.; methodology, M.K.; software, N.M. and G.R.; validation, M.K. and N.M.; formal analysis, A.A.; investigation, G.R.; writing—original draft preparation, G.R.; writing—review and editing, M.K., N.M. and A.A.; visualization, A.A.; project administration, M.K.; funding acquisition, A.A. All authors have read and agreed to the published version of the manuscript.
Funding
The APC was funded by the Faculty of Computing and Informatics at University Malaysia Sabah in Kota Kinabalu, Malaysia.
Institutional Review Board Statement
The study was conducted according to the NUML Research Ethics Policy and approved by the departmental ethics committee.
Informed Consent Statement
Informed consent was obtained from all subjects involved in the study.
Data Availability Statement
The data presented in this study are available on request from the corresponding author. The data are not publicly available due to subjects’ privacy.
Acknowledgments
We are very thankful to the students, instructors, and staff of the schools who participated in this study and supported us in all possible ways.
Conflicts of Interest
The authors declare no conflict of interest.
References
- Nelson, T.; Lesseig, K.; Slavit, D. Making Sense of STEM Education in a K-12 Context. In Proceedings of the 2016 NARST International Conference, Baltimore, MD, USA, 16 April 2016. [Google Scholar] [CrossRef]
- Bogusevschi, D.; Bratu, M.; Ghergulescu, I.; Muntean, C.H.; Muntean, G.-M. Primary School STEM Education: Using 3D Computer-based Virtual Reality and Experimental Laboratory Simulation in a Physics Case Study. In Proceedings of the Ireland International Conference on Education, IPeTEL workshop, Dublin, Ireland, 22–25 October 2018; p. 5. [Google Scholar]
- Çevik, M.; Özgünay, E. STEM Education through the Perspectives of Secondary Schools Teachers and School Administrators in Turkey. Asian J. Educ. Train. 2018, 4, 91–101. [Google Scholar] [CrossRef]
- Radianti, J.; Majchrzak, T.A.; Fromm, J.; Wohlgenannt, I. A systematic review of immersive virtual reality applications for higher education: Design elements, lessons learned, and research agenda. Comput. Educ. 2019, 147, 103778. [Google Scholar] [CrossRef]
- Keil, J.; Edler, D.; Schmitt, T.; Dickmann, F. Creating Immersive Virtual Environments Based on Open Geospatial Data and Game Engines. KN J. Cartogr. Geogr. Inf. 2021, 71, 53–65. [Google Scholar] [CrossRef]
- Abari, O.; Bharadia, D.; Duffield, A.; Katabi, D. Enabling high-quality untethered virtual reality. In Proceedings of the 14th USENIX Symposium on Networked Systems Design and Implementation (NSDI), Boston, MA, USA, 27–29 March 2017. [Google Scholar]
- Javaid, M.; Haleem, A. Virtual reality applications toward medical field. Clin. Epidemiol. Glob. Health 2019, 8, 600–605. [Google Scholar] [CrossRef] [Green Version]
- Malinchi, C.; Ciupe, A.; Meza, S.; Orza, B. A Mobile Exploration Solution for Virtual Libraries in Higher Education. In Proceedings of the 2017 IEEE 17th International Conference on Advanced Learning Technologies (ICALT), Timisoara, Romania, 3–7 July 2017; pp. 490–492. [Google Scholar] [CrossRef]
- Abadia, R.; Calvert, J.; Tauseef, S.M. Salient features of an effective immersive non-collaborative virtual reality learning environment. In ACM International Conference Proceeding Series; Association for Computing Machinery: New York, NY, USA, 2018; pp. 268–278. [Google Scholar] [CrossRef]
- Au, E.H.; Lee, J.J. Virtual reality in education: A tool for learning in the experience age. Int. J. Innov. Educ. 2017, 4, 215. [Google Scholar] [CrossRef]
- Collins, J.; Regenbrecht, H.; Lanalotz, T. Back to the Future: Constructivist Learning in Virtual Reality. In Proceedings of the 2018 IEEE International Symposium on Mixed and Augmented Reality (ISMAR-Adjunct 2018), Munich, Germany, 16–20 October 2018; pp. 45–46. [Google Scholar]
- Yao, P.; Zhu, T.; Zyda, M. Designing virtual equipment systems for VR. In Communications in Computer and Information Science; Springer: Cham, Switzerland, 2020; Volume 1225, pp. 137–144. [Google Scholar]
- Kählke, F.; Berger, T.; Schulz, A.; Baumeister, H.; Berking, M.; Auerbach, R.P.; Bruffaerts, R.; Cuijpers, P.; Kessler, R.C.; Ebert, D.D. Efficacy of an unguided internet-based self-help intervention for social anxiety disorder in university students: A randomized controlled trial. Int. J. Methods Psychiatr. Res. 2018, 28, e1766. [Google Scholar] [CrossRef] [PubMed] [Green Version]
- Nason, E.E.; Trahan, M.; Smith, S.; Metsis, V.; Selber, K. Virtual treatment for veteran social anxiety disorder: A comparison of 360° video and 3D virtual reality. J. Technol. Hum. Serv. 2019, 38, 288–308. [Google Scholar] [CrossRef]
- Poeschl, S. Virtual Reality Training for Public Speaking—A QUEST-VR Framework Validation. Front. ICT 2017, 4. [Google Scholar] [CrossRef]
- Wang, P.; Wu, P.; Wang, J.; Chi, H.-L.; Wang, X. A Critical Review of the Use of Virtual Reality in Construction Engineering Education and Training. Int. J. Environ. Res. Public Health 2018, 15, 1204. [Google Scholar] [CrossRef] [Green Version]
- Zuo, N.; Josephson, A.; Scheitrum, D. Engaging Students in Global Agriculture: Three Authentic-Learning Classroom Interventions. NACTA J. 2019, 63, 99–107. [Google Scholar]
- Raviv, A.; Cohen, S.; Aflalo, E. How Should Students Learn in the School Science Laboratory? The Benefits of Cooperative Learning. Res. Sci. Educ. 2017, 49, 331–345. [Google Scholar] [CrossRef]
- Takase, M.; Niitani, M.; Imai, T.; Okada, M. Students’ perceptions of teaching factors that demotivate their learning in lectures and laboratory-based skills practice. Int. J. Nurs. Sci. 2019, 6, 414–420. [Google Scholar] [CrossRef] [PubMed]
- Tho, S.W.; Yeung, Y.-Y. Technology-enhanced science learning through remote laboratory: System design and pilot implementation in tertiary education. Australas. J. Educ. Technol. 2016. [Google Scholar] [CrossRef] [Green Version]
- Pirker, J.; Lesjak, I.; Guetl, C. Maroon VR: A Room-Scale Physics Laboratory Experience. In Proceedings of the 2017 IEEE 17th International Conference on Advanced Learning Technologies (ICALT), Timisoara, Romania, 3–7 July 2017; pp. 482–484. [Google Scholar] [CrossRef]
- Paxinou, E.; Zafeiropoulos, V.; Sypsas, A.; Kiourt, C.; Kalles, D. Assessing the Impact of Virtualizing Physical Labs. Explor. Micro, Meso Macro Navig. between Dimens. Digit. Learn. Landsc. 2018, 1, 151–158. [Google Scholar]
- Kapici, H.O.; Akcay, H.; De Jong, T. Using Hands-On and Virtual Laboratories Alone or Together―Which Works Better for Acquiring Knowledge and Skills? J. Sci. Educ. Technol. 2019, 28, 231–250. [Google Scholar] [CrossRef]
- Sriadhi, S.; Restu, R.; Sitompul, H.; Manurung, J. Development of web-virtual laboratory to improve the effectiveness and efficiency of remedial learning. J. Physics: Conf. Ser. 2019, 1402, 077059. [Google Scholar] [CrossRef]
- Dak, R.; Khoje, S.; Pardeshi, P.J. A review on cost-efficient virtual laboratory: A teaching aid. In Proceedings of the International Conference on Computing Methodologies and Communication (ICCMC), Erode, India, 15–16 February 2018; Volume 2018, pp. 663–667. [Google Scholar]
- Alawadhi, S.; AlHabib, N.; Murad, D.; AlDeei, F.; AlHouti, M.; Beyrouthy, T.; Al-Kork, S. Virtual reality application for interactive and informative learning. In Proceedings of the 2017 2nd International Conference on Bio-engineering for Smart Technologies (BioSMART), Paris, France, 29 August–1 September 2017. [Google Scholar]
- Chavez, B.; Bayona, S. Virtual Reality in the Learning Process. In Proceedings of the World Conference on Information Systems and Technologies, Naples, Italy, 27–29 March 2018; pp. 1345–1356. [Google Scholar] [CrossRef]
- Giganti, P.; Falcone, P.M. Socio-technical transitions and innovation niches: The case of the virtual and augmented reality in Europe. AIMS Energy 2021, 9, 755–774. [Google Scholar] [CrossRef]
- Gunawan, A. Harjono, Hermansyah, and L. Herayanti. Guided inquiry model through virtual laboratory to enhance students’ science process skills on heat concept. Cakrawala Pendidik. 2019, 38, 259–268. [Google Scholar] [CrossRef] [Green Version]
- Widodo, A.; Maria, R.A.; Fitriani, A. Constructivist Learning Environment During Virtual and Real Laboratory Activities. Biosaintifika J. Biol. Biol. Educ. 2017, 9, 11–18. [Google Scholar] [CrossRef] [Green Version]
- Bortnik, B.; Stozhko, N.; Pervukhina, I.; Tchernysheva, A.; Belysheva, G. Effect of virtual analytical chemistry laboratory on enhancing student research skills and practices. Res. Learn. Technol. 2017, 25. [Google Scholar] [CrossRef] [Green Version]
- Pirker, J.; Holly, M.S.; Hipp, P.; König, C.; Jeitler, D.; Gütl, C. Improving Physics Education Through Different Immersive and Engaging Laboratory Setups; Springer: Cham, Switzerland, 2018; pp. 443–454. [Google Scholar] [CrossRef]
- Hou, H.-T.; Lin, Y.-C. The Development and Evaluation of an Educational Game Integrated with Augmented Reality and Virtual Laboratory for Chemistry Experiment Learning. In Proceedings of the 2017 6th IIAI International Congress on Advanced Applied Informatics (IIAI-AAI), Hamamatsu, Japan, 9–13 July 2017; pp. 1005–1006. [Google Scholar] [CrossRef]
- Snyder, H. Literature review as a research methodology: An overview and guidelines. J. Bus. Res. 2019, 104, 333–339. [Google Scholar] [CrossRef]
- Xie, H.; Chu, H.-C.; Hwang, G.-J.; Wang, C.-C. Trends and development in technology-enhanced adaptive/personalized learning: A systematic review of journal publications from 2007 to 2017. Comput. Educ. 2019, 140, 103599. [Google Scholar] [CrossRef]
- Ivan, P.P.; LaViola, J.J., Jr.; Kruijff, E.; McMahan, R.P.; Bowman, D. Pub H-BRS|3D User Interfaces: Theory and Practice, 2nd ed.; Addison-Wesley: Boston, MA, USA, 2017. [Google Scholar]
- Kim, M.; Lee, J.W.; Jeon, C.; Kim, J. A Study on Interaction of Gaze Pointer-Based User Interface in Mobile Virtual Reality Environment. Symmetry 2017, 9, 189. [Google Scholar] [CrossRef] [Green Version]
- Kim, H.K.; Park, J.; Choi, Y.; Choe, M. Virtual reality sickness questionnaire (VRSQ): Motion sickness measurement index in a virtual reality environment. Appl. Ergon. 2018, 69, 66–73. [Google Scholar] [CrossRef]
- Jaime, S. UX + VR: 14 Guidelines for Creating Great First Experiences|by Staci Jaime|Medium. UX Collective Magazine. 2017. Available online: https://medium.com/@oneStaci/https-medium-com-ux-vr-18-guidelines-51ef667c2c49%0Ahttps://medium.com/@oneStaci/https-medium-com-ux-vr-18-guidelines-51ef667c2c49#7aa7 (accessed on 5 December 2020).
- Gerig, N.; Mayo, J.; Baur, K.; Wittmann, F.; Riener, R.; Wolf, P. Missing depth cues in virtual reality limit performance and quality of three dimensional reaching movements. PLoS ONE 2018, 13, e0189275. [Google Scholar] [CrossRef] [Green Version]
- Safikhani, S.; Holly, M.; Pirker, J. Work-in-Progress-Conceptual Framework for User Interface in Virtual Reality. In In Proceedings of the 6th International Conference of the Immersive Learning Research Network (ILRN), San Luis Obispo, CA, USA, 21–25 June 2020; pp. 332–335. [Google Scholar]
- Yoshimura, A.; Khokhar, A.; Borst, C.W. Visual Cues to Restore Student Attention based on Eye Gaze Drift, and Application to an Offshore Training System; Association for Computing Machinery: New York, NY, USA, 2019. [Google Scholar] [CrossRef]
- Sutcliffe, A.G.; Poullis, C.; Gregoriades, A.; Katsouri, I.; Tzanavari, A.; Herakleous, K. Reflecting on the Design Process for Virtual Reality Applications. Int. J. Hum.-Comput. Interact. 2018, 35, 168–179. [Google Scholar] [CrossRef]
- Widjojo, E.A.; Chinthammit, W.; Engelke, U. Virtual reality-based human-data interaction. In Proceedings of the 2017 International Symposium on Big Data Visual Analytics (BDVA), Adelaide, Australia, 7–10 November 2017. [Google Scholar]
- Mealy, P. Best Practices and Virtual Reality Design Principles. Available online: https://www.dummies.com/software/best-practices-and-virtual-reality-design-principles/ (accessed on 16 June 2021).
- Kharoub, H.; Lataifeh, M.; Ahmed, N. 3D User Interface Design and Usability for Immersive VR. Appl. Sci. 2019, 9, 4861. [Google Scholar] [CrossRef] [Green Version]
- Rutberg, S.; Bouikidis, C.D. Exploring the Evidence Quantitative and Qualitative Research Focusing on the Fundamentals: A Simplistic Differentiation Between Qualitative and Quantitative Research. Nephrol. Nurs. J. 2018, 45, 2. [Google Scholar]
- Hox, J.J.; Boeije, H.R. Data Collection, Primary vs. Secondary. Encycl. Soc. Meas. 2004, 1, 593–599. [Google Scholar]
- Lewis, J.R. Measuring Perceived Usability: The CSUQ, SUS, and UMUX. Int. J. Hum.-Comput. Interact. 2017, 34, 1148–1156. [Google Scholar] [CrossRef]
- Čisar, P.; Čisar, S.M. Skewness and Kurtosis in Function of Selection of Network Traffic Distribution. Acta Polytech. Hungarica. 2010, 7, 95. [Google Scholar]
- Coe, R. It’s the effect size, stupid: What effect size is and why it is important. In Proceedings of the 2002 Annual Conference of British Educational Research Association, Leeds, UK, 12–14 September 2002. [Google Scholar]
- Gunawan, G.; Dewi, S.M.; Herayanti, L.; Lestari, P.A.S.; Fathoroni, F. Gender Influence on Students Creativity in Physics Learning with Virtual Laboratory. J. Phys. Conf. Ser. 2020, 1471. [Google Scholar] [CrossRef]
Figure 1.
The user interface of the developed virtual laboratory.

Figure 2.
User interface for Experiment 1 (Vernier Calipers).

Figure 3.
Histogram for the normal distribution of the EG.

Figure 4.
Histogram for the normal distribution of the CG.

Figure 5.
Mean scores for both groups across the schools.

Figure 6.
Comparison of mean scores for the EG.

Figure 7.
Comparison of mean scores for the CG.

Figure 8.
Mean SUS score vs. SUS ratings (error bars +/− one standard error of the mean).

Figure 9.
Learnability and usability scores compared to the SUS score.


Table 1.
Participants’ details.
| Schools | No. of Participants | Groups | Gender | Age | ||
|---|---|---|---|---|---|---|
| EG | CG | Girls | Boys | |||
| 1 | 54 | 27 | 27 | 23 | 31 | 14–16 |
| 2 | 46 | 23 | 23 | 21 | 25 | 14–15 |
| 3 | 44 | 22 | 22 | 27 | 17 | 14–16 |
| 4 | 40 | 20 | 20 | 14 | 26 | 15–16 |
Table 2.
Comparison of students’ scores across all schools.
| Classification | Score | School 1 | School 2 | School 3 | School 4 | Age | ||||
|---|---|---|---|---|---|---|---|---|---|---|
| EG | CG | EG | CG | EG | CG | EG | CG | |||
| Excellent | 8–10 | 14 | 6 | 11 | 7 | 10 | 7 | 9 | 7 | 14–16 |
| Fair | 5–7 | 8 | 15 | 10 | 11 | 9 | 9 | 9 | 7 | 13–15 |
| Poor | 0–4 | 5 | 6 | 2 | 5 | 3 | 6 | 2 | 6 | 14–16 |
Table 3.
Data distribution results.
| Experimental Group | Control Group | |
|---|---|---|
| Mean | 7.163043 | 5.869565 |
| Standard Error | 0.223595 | 0.255946 |
| Median | 7 | 6 |
| Mode | 7 | 5 |
| Standard Deviation | 2.144644 | 2.454945 |
| Sample Variance | 4.599498 | 6.026756 |
| Kurtosis | 0.391308 | −0.30517 |
| Skewness | −0.77679 | −0.33345 |
Table 4.
Two-sample z-test results.
| Schools | Experimental Group | Control Group |
|---|---|---|
| Sample Size (N) | 92 | 92 |
| Mean | 7.163043 | 5.869565 |
| Variance | 4.599498 | 6.026756 |
| Z Score | 3.80 | |
| p(Z <= z) Two-Tail | 0.000141 |
Table 5.
Results of a gender-based z-test for the EG.
| Groups | Participants | Mean | Z-Value | p-Value |
|---|---|---|---|---|
| Male | 45 | 7.24 | 0.12 | 0.905 |
| Female | 47 | 7.2 |
Table 6.
Result of gender-based z-test for CG.
| Groups | Participants | Mean | Z-Value | p-Value |
|---|---|---|---|---|
| Boys | 48 | 6.02 | 0.13 | 0.9 |
| Girls | 44 | 5.95 |
Table 7.
Effect size.
| EG | CG | SD | Effect Size |
|---|---|---|---|
| 7.16 | 5.87 | 2.44 | 0.5 |
Table 8.
Descriptive statistics of the SUS questionnaire results.
| SUS Rating | Count (F) | Percentile Range | Mean Score | Standard Deviation |
|---|---|---|---|---|
| Excellent | 31 | 67–100% | 87.74 | 4.11 |
| Good | 28 | 37–63% | 75.36 | 3.18 |
| Okay | 0 | 0 | 0 | 0 |
| Poor | 26 | 9–25% | 62.4 | 5.21 |
| Awful | 7 | 1–4% | 45 | 7.19 |
Publisher’s Note: MDPI stays neutral with regard to jurisdictional claims in published maps and institutional affiliations. |
© 2021 by the authors. Licensee MDPI, Basel, Switzerland. This article is an open access article distributed under the terms and conditions of the Creative Commons Attribution (CC BY) license (https://creativecommons.org/licenses/by/4.0/).
Share and Cite
MDPI and ACS Style
Rasheed, G.; Khan, M.; Malik, N.; Akhunzada, A. Measuring Learnability through Virtual Reality Laboratory Application: A User Study. Sustainability 2021, 13, 10812. https://0-doi-org.brum.beds.ac.uk/10.3390/su131910812
AMA Style
Rasheed G, Khan M, Malik N, Akhunzada A. Measuring Learnability through Virtual Reality Laboratory Application: A User Study. Sustainability. 2021; 13(19):10812. https://0-doi-org.brum.beds.ac.uk/10.3390/su131910812
Chicago/Turabian StyleRasheed, Ghazala, Muzafar Khan, Noman Malik, and Adnan Akhunzada. 2021. "Measuring Learnability through Virtual Reality Laboratory Application: A User Study" Sustainability 13, no. 19: 10812. https://0-doi-org.brum.beds.ac.uk/10.3390/su131910812
Note that from the first issue of 2016, this journal uses article numbers instead of page numbers. See further details here.