Article

Evaluating Benefits of Eco-Agriculture: The Cases of Farms along Taiwan’s East Coast in Yilan and Hualien

1
Department of Applied Economics and Management, College of Humanities and Management, National I-Lan University, I-Lan 260, Taiwan
2
Hualien District Agricultural Research and Extension Station, Council of Agriculture, Executive Yuan, Hualien 973, Taiwan
3
The Center for Green Economy, Chung-Hua Institution for Economic Research, Taipei 106, Taiwan
*
Author to whom correspondence should be addressed.
Sustainability 2021, 13(19), 10889; https://0-doi-org.brum.beds.ac.uk/10.3390/su131910889
Submission received: 29 August 2021 / Revised: 24 September 2021 / Accepted: 27 September 2021 / Published: 30 September 2021
(This article belongs to the Special Issue Economic Profitability and Agriculture Sustainable Development)

Abstract

:
The ecological agriculture (hereinafter referred to as eco-agriculture) concept has grown rapidly in Taiwan in recent years. More and more successful eco-agriculture projects have thus sprouted up in Taiwan, and so a quantitative evaluation model of such projects becomes critically important for improving public understanding of eco-agriculture and for providing a basis for policy analysis. This research thus proposes a quantitative evaluation model for eco-agriculture and analyzes the empirical data collected. We take four farms that practice eco-agriculture in eastern Taiwan for the estimation of direct benefits by surveying farmers about their revenues and costs of crop yields. To evaluate indirect benefits, we employ the Contingent Value Method (CVM) to investigate the willingness-to-pay (WTP) of users and non-users to support eco-agriculture. Results from the direct benefit estimation indicate that eco-agriculture adoption is unlikely to improve the local livelihoods of farming communities. In terms of indirect benefit estimation, eco-agriculture is beneficial to society, but based on our analysis of the direct benefits, these indirect benefits fail to be transformed into profits, showing that eco-agriculture exhibits positive externalities. This constitutes unavoidable challenges for eco-agriculture to be sustainable if these positive externalities cannot be internalized.

1. Introduction

According to McNeely and Scherr [1], the term eco-agriculture refers “to landscapes that achieve the joint objectives of sustainable agricultural production, biodiversity and ecosystem conservation, and rural livelihoods.” Landscape is a mosaic of topography, vegetative covers, land uses, and human settlements, forming an ecosystem that includes natural resources, historical heritage, cultural traditions, production activities, and social values. To simultaneously and synergistically achieve conservation, production, and livelihood objectives, the management of eco-agriculture must be planned at the landscape scale and carried out from a comprehensive point of view with all landscape elements jointly and deliberately considered, without limiting its practices to single farm fields or regions.
Trade-offs are often seen in conventional agriculture to compromise these conservation, production, and livelihood objectives. Eco-agriculture, unlike conventional agriculture, aims to manage these trade-offs and exploit positive synergies among these objectives. It does so by enhancing and enriching a broad range of ecosystem services.
The concept of eco-agriculture has taken root and grown rapidly in Taiwan in recent years. Both public and private sectors as well as research groups have continuously invested resources to publicize the eco-agriculture concept and develop associated promotion programs. For instance, under the guidance of Hualien District Agricultural Research and Extension Station (HDARES), Luoshan Village of Hualien County became home to the first village to adopt eco-agriculture practices in Taiwan in 2002. Farmers of Luoshan Village have voluntarily employed organic farming to grow rice, vegetables, and fruits and further established an “organic village” that incorporates local cultural heritage, ecological conservation, and environmental education to achieve conservation, production, and livelihood objectives. In 2008, Taiwan Ecological Engineering Foundation initiated a fund-raising campaign, aiming to invest in various local ecological restoration projects to assist business revitalization in Bajen Settlement. In 2011, supported by the government agency Forest Bureau, Environmental Ethics Foundation of Taiwan launched a water-terrace restoration program in Gongliao District. This program aimed to improve the habitat’s ecological environment while preserving precious water resources in the targeted area; a new way of living for the related stakeholders in Gongliao was thus developed to achieve conservation, production, and livelihood objectives.
In 2014, a new brand called “Xinnan Tiandong Rice” was created by a group led by Jeran Lin. Lin ceased the use of conventional farming and adopted eco-agriculture practices by terminating the use of pesticides and synthetic fertilizers. Suitable habitats for birds to nest and forage soon emerged in the area where Lin’s land is located after this change of practice. Xinnan Tiandong Rice not only procured and revived ecological and business development in Xinnan Village, but also ensured food safety and secured the livelihoods of local communities. In 2016, HDARES and National Dong Hwa University, together with two other central government agencies (Hualien District Office, Council of Agriculture and Hualien Branch, Soil and Water Conservation Bureau, Council of Agriculture), jointly launched the “Forest-River-Village-Sea Eco-Agriculture Initiative” in Fongbin Township, Hualien County. This initiative established an ongoing multi-stakeholder platform for two local indigenous communities—Amis Dipit tribe and Kavalan Xinshe tribe—to frame cross-sector partnerships and collaborative cross-region governance for the betterment of this initiative’s ecosystem services on the integrated landscape. Local communities were later shown to benefit from the improved provisioning services, regulating services, and cultural services of the ecosystem, through the reconnected and re-enhanced biological diversity of the landscape. These strengthened ecosystem services, at the same time, empower the local communities by enhancing their core competencies, such as knowledge power, action power, and social power, which facilitate their resiliency and ensure the sustainability of their forests, rivers, villages, and the sea.
As more and more successful practices of eco-agriculture sprouted up in Taiwan in recent years, researchers began to discuss various cases of eco-agriculture (Lin et al. [2], Qiu [3], Fang and Shiue [4]) and attempted to elaborate upon the contributions and benefits provided by eco-agriculture. However, most of these studies are mere textual and detailed descriptions of eco-agriculture practices and outcomes, such as the implementation of eco-friendly farming techniques and the exhibits of ecological restoration. Even though positive outcomes of eco-agriculture are universally recognized, a lack of quantitative analysis imposes challenges when attempting to understand the significance or magnitude of eco-agriculture’s benefits.
Based on the definition of eco-agriculture by McNeely and Scherr [1], the function of eco-agriculture is not limited to the provision of food and sustaining the livelihood of farmers, but also biodiversity and ecosystem conservation. In other words, these multifunctional roles have the characteristics of by-products from eco-agricultural production. Whereas these multifunctional values typically possess positive externalities. A positive externality is the positive effect an activity imposes on an unrelated third party [5]. For instance, the biodiversity and environmental protection functions provided by eco-agriculture can benefit an unrelated third party. However, positive externalities can also lead to inefficient markets due to the fact that the individual providing the positive externality provides more value than he or she receives in return. Eventually, supply is ultimately reduced for inadequate remuneration. For instance, people may benefit from the positive externalities of biodiversity and environmental protection brought about by eco-agriculture without providing adequate compensation for the positive externalities provided by the farmers engaged in eco-agriculture. As a result, farmers may reduce the production acreage devoted to eco-agriculture, thereby reducing social welfare. Once market inefficiencies occur, the government should intervene and implement certain policy measures to keep farmers engaged in eco-agriculture.
In Taiwan, the adoption of environmentally friendly farming methods for the production of crops usually results in lower yields compared to conventional farming methods, with unit production costs often higher than conventional farming methods. According to Huang et al. [6], the production quantities of per hectare organic paddy rice in Taiwan were 4739 kg and 3345 kg respectively in the first and second cropping period. The per kilogram production costs were NT$29.2 and 38.6. These kinds of costs were higher than those of conventional rice plantations. While the prices of eco-friendly farming products are usually higher than those of conventional farming products, the ultimate profitability is also likely to be higher than that of conventional farming. However, there is still a lack of empirical research on the profitability of eco-agriculture.
In summary, this study estimates the multifunctional benefits of ecological farming, utilizing a conditional evaluation method to demonstrate that ecological farming can provide positive externalities. On the other hand, the profitability of eco-agriculture is calculated to confirm whether it is adequately remunerated. Based on the results, the adequacy of current government support for eco-agriculture is then discussed.

2. Literature Review

Many studies in the literature have enumerated the various benefits from the application of eco-agriculture. Rasul and Thapa [7] suggested with the reduction of external agro-chemical inputs that eco-agriculture can be economically and ecologically beneficial through increased crop yields and better soil management. Bakhsh et al. [8] found that the adoption of zero tillage technology in the rice wheat system of Punjab, Pakistan substantially increased the production of crops and hence increased farmers’ income. Their livelihoods subsequently greatly improved and poverty was reduced. Hobbs and Gupta [9] showed that conservation technologies in the form of reduced tillage, zero tillage, and bed planting not only enhance input use efficiency and lower farming costs, but also improve the livelihoods of the farmers and offer numerous environmental benefits. Hassan and Bakshi [10] discovered that the rice yield did not decline with a reduction in chemical pesticide usage in Bangladesh. This delivered higher monetary returns to the farmers while reinforcing ecological benefits for the addressed landscape and elevating sustainable social and economic well-being of the local communities.
While the aforementioned studies described a variety of ecological and economic benefits with the application of eco-agriculture, the significance or magnitude of these benefits remains unclear. For cost-effective-oriented institutions like government agencies, quantitative benefit evaluation models are particularly needed for policy-making and policy-evaluation purposes. Therefore, several studies started to use contingent valuation methods to evaluate the benefits of eco-agriculture. For instance, Atinkut et al. [11] estimated that farmers in the Amhara region of Ethiopia were willing to spend 6.84 labor days (equivalent to Ethiopian currency 273.5 Birr) and 8.2 Birr to support sustainable agricultural waste management annually, respectively. At the same time, only a few analyses have been conducted to estimate the willingness-to-pay for eco-agriculture, which are outnumbered by those estimating the willingness-to-pay for eco-agricultural products. For instance, Moser and Raffaelli [12] employed a non-hypothetical choice experiment in Trentino, which is located in the southwestern region of Italy, to investigate consumers’ willingness-to-pay (WTP) for organic apples. They discovered that consumers were willing to pay higher prices for apples produced with organic farming and with lower greenhouse gas emission practices, as compared to those produced with conventional agricultural methods. Combris et al. [13] showed that 207 randomly selected consumers in Portugal and France were willing to pay more for apples and apple juice produced under reduced pesticide usage.
According to Schmit, Rickard, and Taber [14], 169 student participants from Cornell University showed higher WTP for eco-friendly wines given that consumers’ sensory expectations are satisfied on wine quality. Vecchio [15] also analyzed WTP by surveying college students in Naples, Italy and found that young adults were willing to pay 23–57% more for eco-sustainable wines, exhibiting a positive and friendly attitude towards sustainable goods. Uchida et al. [16] investigated the WTP of Co-op Tokyo (a top retailer) employees for seafood that are labelled eco-friendly and noted a statistically significant price premium over non-labelled seafood. Bazoche et al. [17] conducted experimental auctions on apples in four European countries to assess WTP in relation to the reduction of pesticide usage. Their results showed that if consumers were informed about the reduction of pesticide usage, then they were willing to pay significantly higher prices for organic apples, while the prices of apples with Integrated Pest Management remained unaffected and the WTP for apples with conventional agriculture decreased.
Vecchio and Annunziata [18] evaluated consumers’ WTP for chocolate bars with different sustainability labels through experimental auctions participated in by college students from the University of Naples, Italy. Their study revealed that chocolate bars labelled with Fair Trade earned the highest WTP, ones with the Rainforest Alliance labels came in second, and Carbon Footprint was in last place. Zhou, Hu, and Huang [19] investigated household-level tuna steak consumption and examined consumer preferences for eco-labeling through an Internet survey among consumers from Kentucky. Results showed that respondents strongly preferred turtle-safe-labeled tuna steak and expressed a higher WTP for eco-labeled food.
All in all, there has been no shortage of research discussing environmentally-friendly or sustainable agri-food products and estimating the corresponding benefits. Cecchini et al. [20] summarized 41 studies conducted between 2006 and 2017 and concluded that consumers were willing to pay a price premium for products with eco-friendly and organic certification labels. However, other labels—such as animal welfare, “local” production, or social certification—were shown to have minimal effect on consumers’ WTP and preferences.
We summarize from previous studies that the applications and adoptions of eco-agriculture are beneficial in many aspects, including direct benefits (increased agricultural productions and elevated revenues) and indirect benefits (better environmental protection and enhanced biodiversity). However, no studies, to our knowledge, have simultaneously quantified these two types of benefits. Most studies that evaluated the indirect benefits of eco-agriculture overpassed its direct benefits, while studies that discussed both direct and indirect benefits mostly provided only qualitative analysis or textual descriptions.
In order to provide an overview of eco-agriculture benefits, our study presents the estimations of both direct benefits and indirect benefits (Figure 1). As previously mentioned, direct benefits include the increase of agricultural productions and the improvement of local livelihoods. Indirect benefits consist of the enhancement of ecological conservation, the betterment of environmental protection, the preservation of cultural heritage, and the upgrade of landscaping. The so-called ecological conservation benefit refers to the benefit of enriching the ecology of the field and promoting biodiversity. The environmental protection benefit refers to the implementation of ecological agriculture to reduce the pollution of land, rivers, and sea caused by chemical fertilizers and pesticides. The cultural heritage benefit refers to the continuation of traditional agricultural knowledge and farming culture through the guidance and teachings of elders. Upgrade of landscaping benefits refer to the use of environmentally and ecologically friendly agricultural practices, which provide a more aesthetically pleasing view of the fields and create more pleasant atmospheres. All of the indirect benefits are non-market goods in nature.

3. Materials and Methods

We employ two different empirical research methods to estimate direct benefits and indirect benefits in order to offer a comprehensive view of the overall benefits of eco-agriculture.

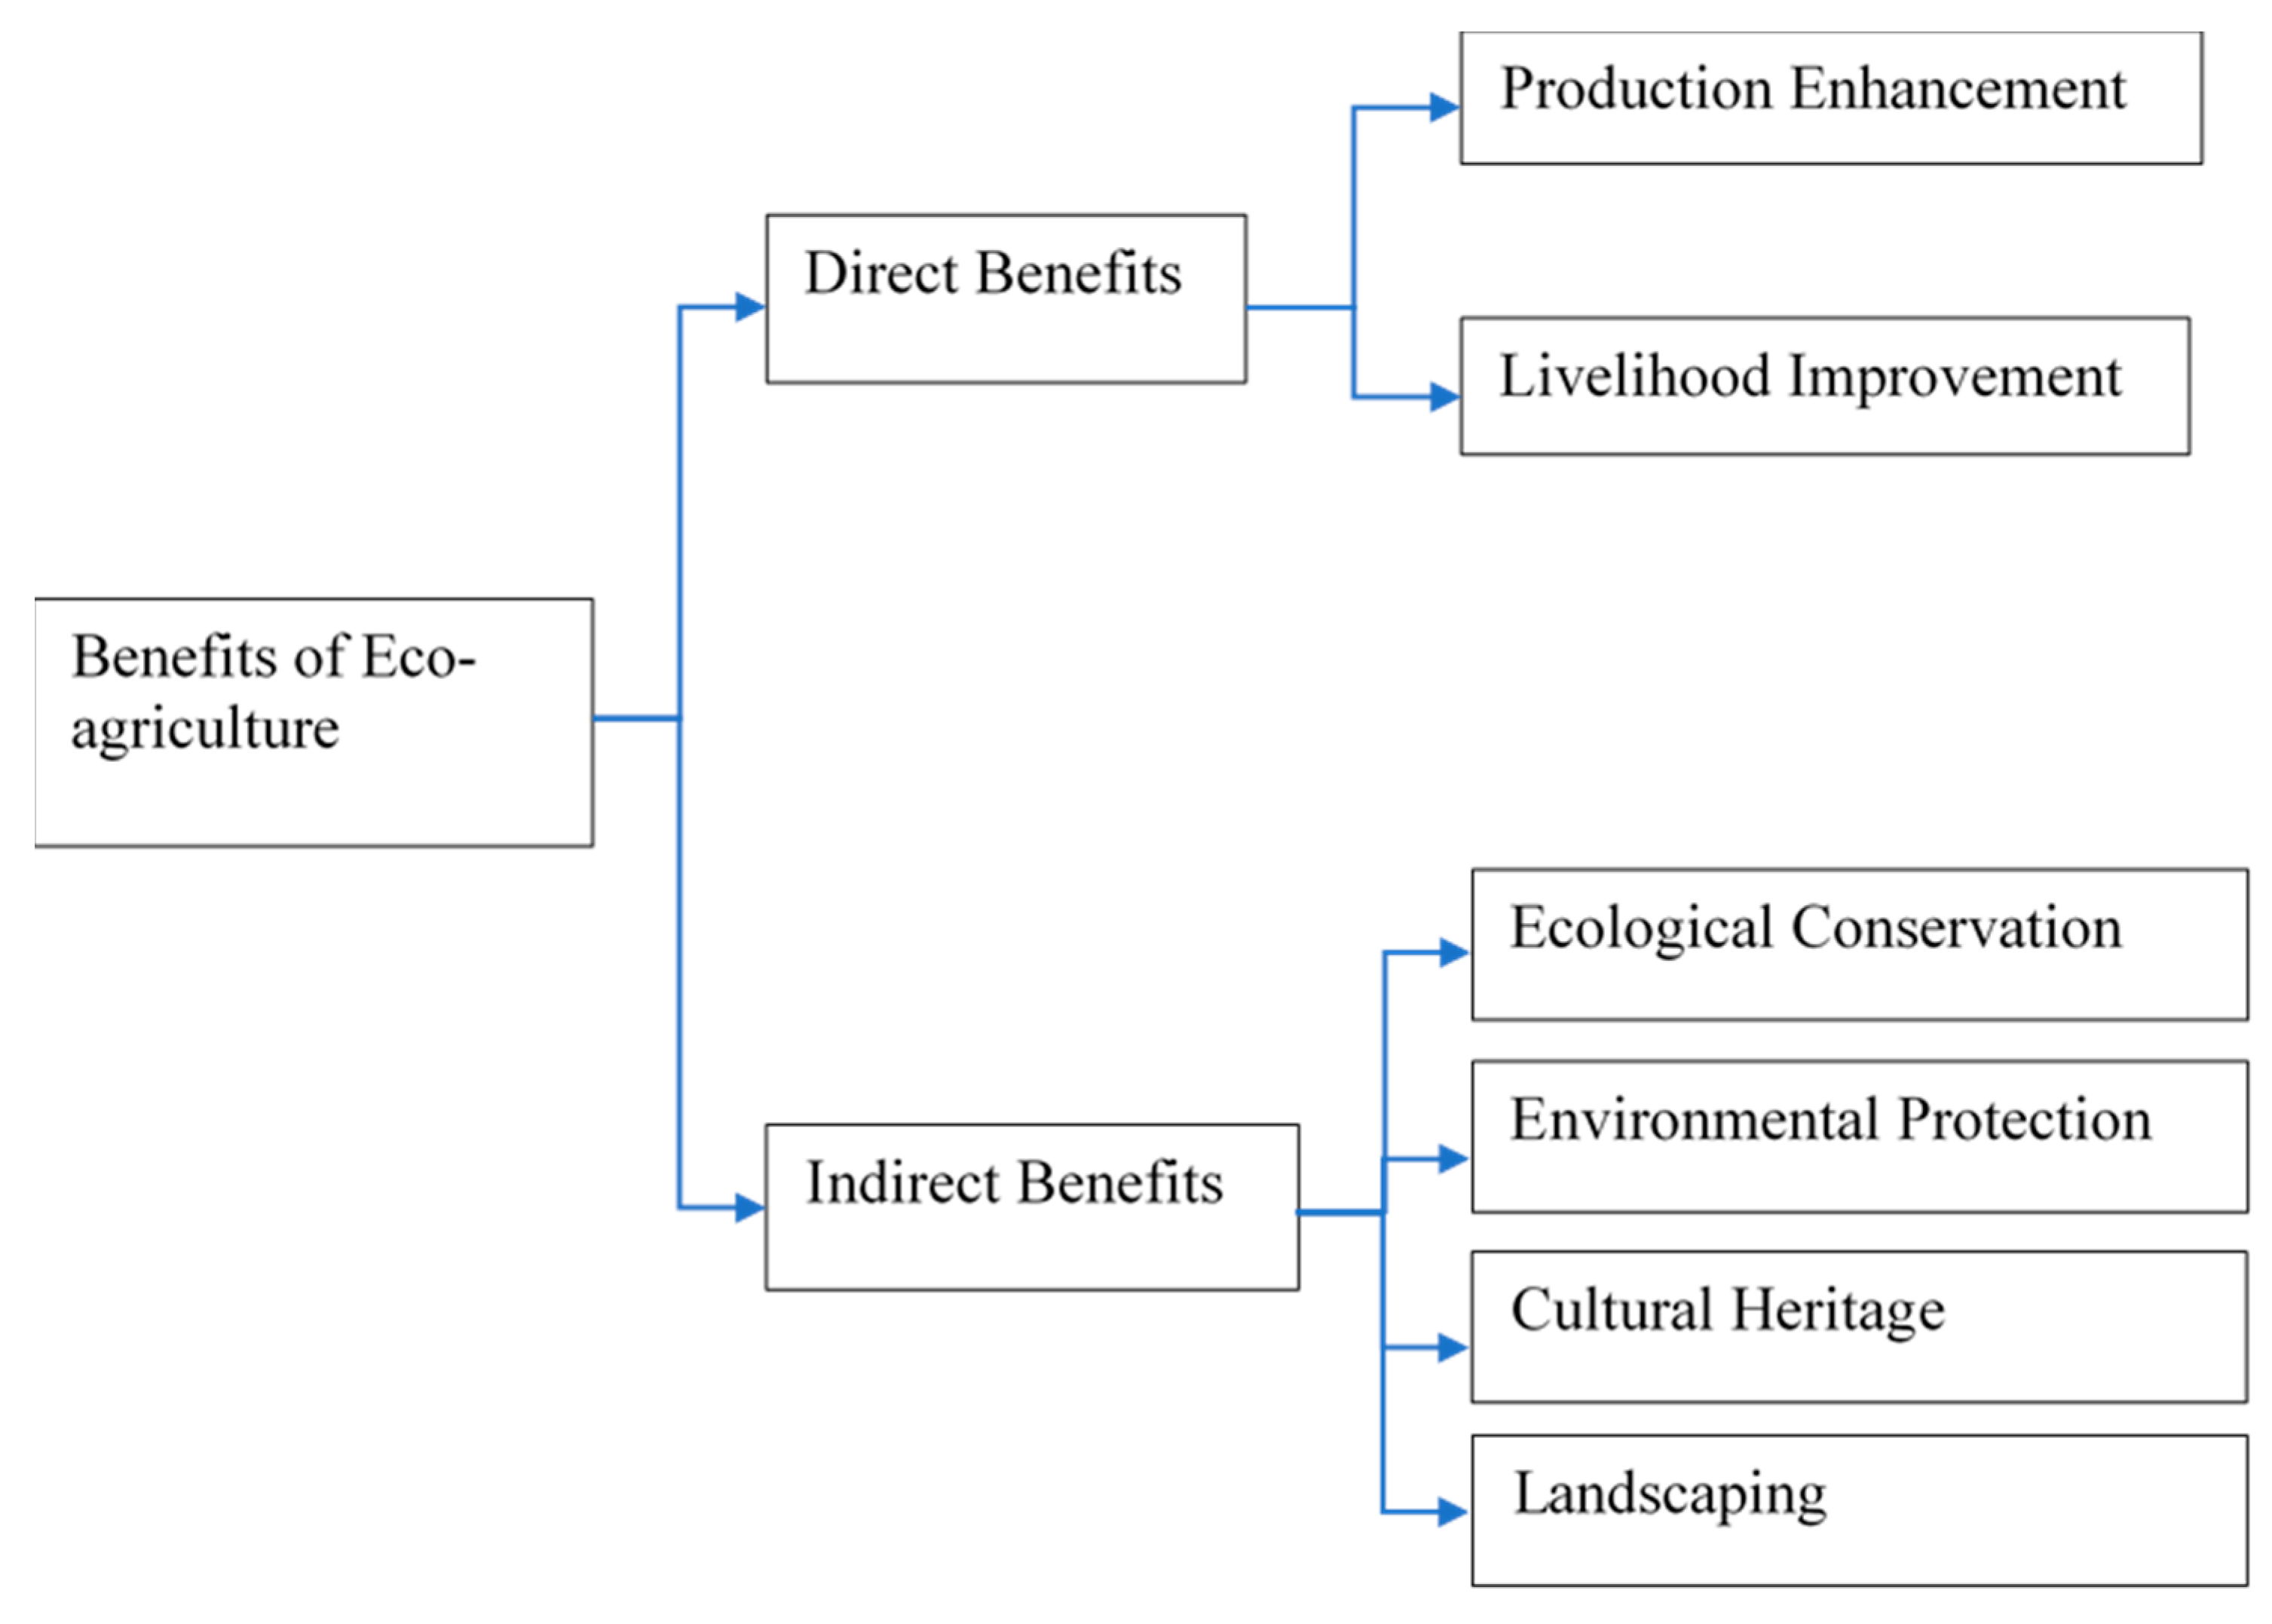
3.1. Direct Benefits: Cost and Benefit Analysis

We study four eco-agriculture cases in eastern Taiwan to estimate the direct benefits of eco-agriculture: Case A is from the Dipit aborigine tribe (Hualien County), Cases B and C are from the Kavalan aborigine tribe (Hualien County), and Case D is from Xinnan Village (Yilan County). All four cases were asked about their crop productions and revenues through questionnaires. Questionnaires included five main sections: (1) basic information of respondents; (2) labor inputs of respondents; (3) amount, value, and cost of farm products; (4) amount, value, and cost of processed farm products; and (5) types, production values, costs of agricultural recreation, if any. The survey year is the year 2018.

3.2. Indirect Benefits: Contingent Valuation Method

We use the Contingent Valuation Method (CVM) to estimate the indirect benefits of eco-agriculture. In terms of method to obtain the WTP of respondents, double-bounded dichotomous choice (DBDC) is one of the elicitation procedures under the CVM context. Dichotomous choice (DC) is very similar to people’s daily purchasing decisions, so this method has a lower protest response compared with other elicitation methods. The National Oceanic and Atmospheric Administration (NOAA) panel [21] has concluded that DC method is preferred in contingent valuation surveys. Since then, DC method has become the most widely used one in CVM research. Aside from that, double-bounded dichotomous choice (DBDC) was extended from single-bounded dichotomous choice (SBDC) and it was proved that DBDC is more efficient than SBDC as more information is elicited about the respondent’s WTP [22,23]. Therefore, the DBDC method was employed to elicit the WTP of respondents in this study.
With the development of quantitative analysis, the transformation technique by Cameron and James [24] or complicated survival analysis is substituted by Maximum Likelihood Estimation proposed by Aberini et al. [25] to estimate parameters by non-linear optimization. The method is described as follows.
Cameron [26] established a CVM model based on expenditure functions by defining the willingness-to-pay function for the change of environmental quality as the difference of expenditure:
W T P ( q 0 , q 1 , u 0 , C ) = e ( q 0 , u 0 , C ) e ( q 1 , u 0 , C )
where q0 and q1 are the environmental quality before and after change; e(.) is the expenditure function; u0 is the utility level before change; and C is the socioeconomic variable vector.
It shows that income heterogeneity exists in the survey data from CVM and that the WTP of respondents differ in their socioeconomic vectors, such as income levels, education levels, and personal environmental quality preferences. To estimate the effect of these variables on WTP, it is assumed that the logarithm of WTP is a function of the above variables:
ln W T P i = f ( X i , β ) + u i
where WTPi is individual i’s real willingness to pay; Xi is a vector of individual characteristics; beta is a vector of parameters; and ui is unmeasured characteristics of the respondent and is assumed to be independently and identically normally distributed with mean 0 and variance sigma square. The respondent i’s WTP, though unknown, lies either below WTPiL, or above WTPiR, or between two values WTPiL and WTPiR. WTPiL and WTPiR are determined by the response to the questions in the double-bounded closed-ended questionnaires.
The likelihood function to be maximized is given by:
ln L = i L ln Φ ( ln W T P i L f ( X i , β ) σ ) + i I ln [ Φ ( ln W T P i R f ( X i , β ) σ ) Φ ( ln W T P i L f ( X i , β ) σ ) ] + i R ln ( 1 Φ ( ln W T P i R f ( X i , β ) σ ) ) = i L ln Φ ( ln W T P i L f ( X i , β ) σ ) + i I ln [ Φ ( ln W T P i R f ( X i , β ) σ ) Φ ( ln W T P i L f ( X i , β ) σ ) ] + i R ln Φ ( ln W T P i R + f ( X i , β ) σ )
Here, phi is the standard normal cumulative density function. L is defined as the set of respondents who were unwilling to pay given amounts of money during the first-stage and second-stage questions, where WTPi < WTPiL; i is defined as the set of respondents who were only willing to pay a given amount of money during one stage of question, where WTPiL ≤ WTPi < WTPiR. R is defined as the set of respondents who were willing to pay given amounts of money during both stages of questions, where WTPi ≥ WTPiR. Maximum-likelihood-estimated beta and sigma are obtained with the use of the MLE technique.

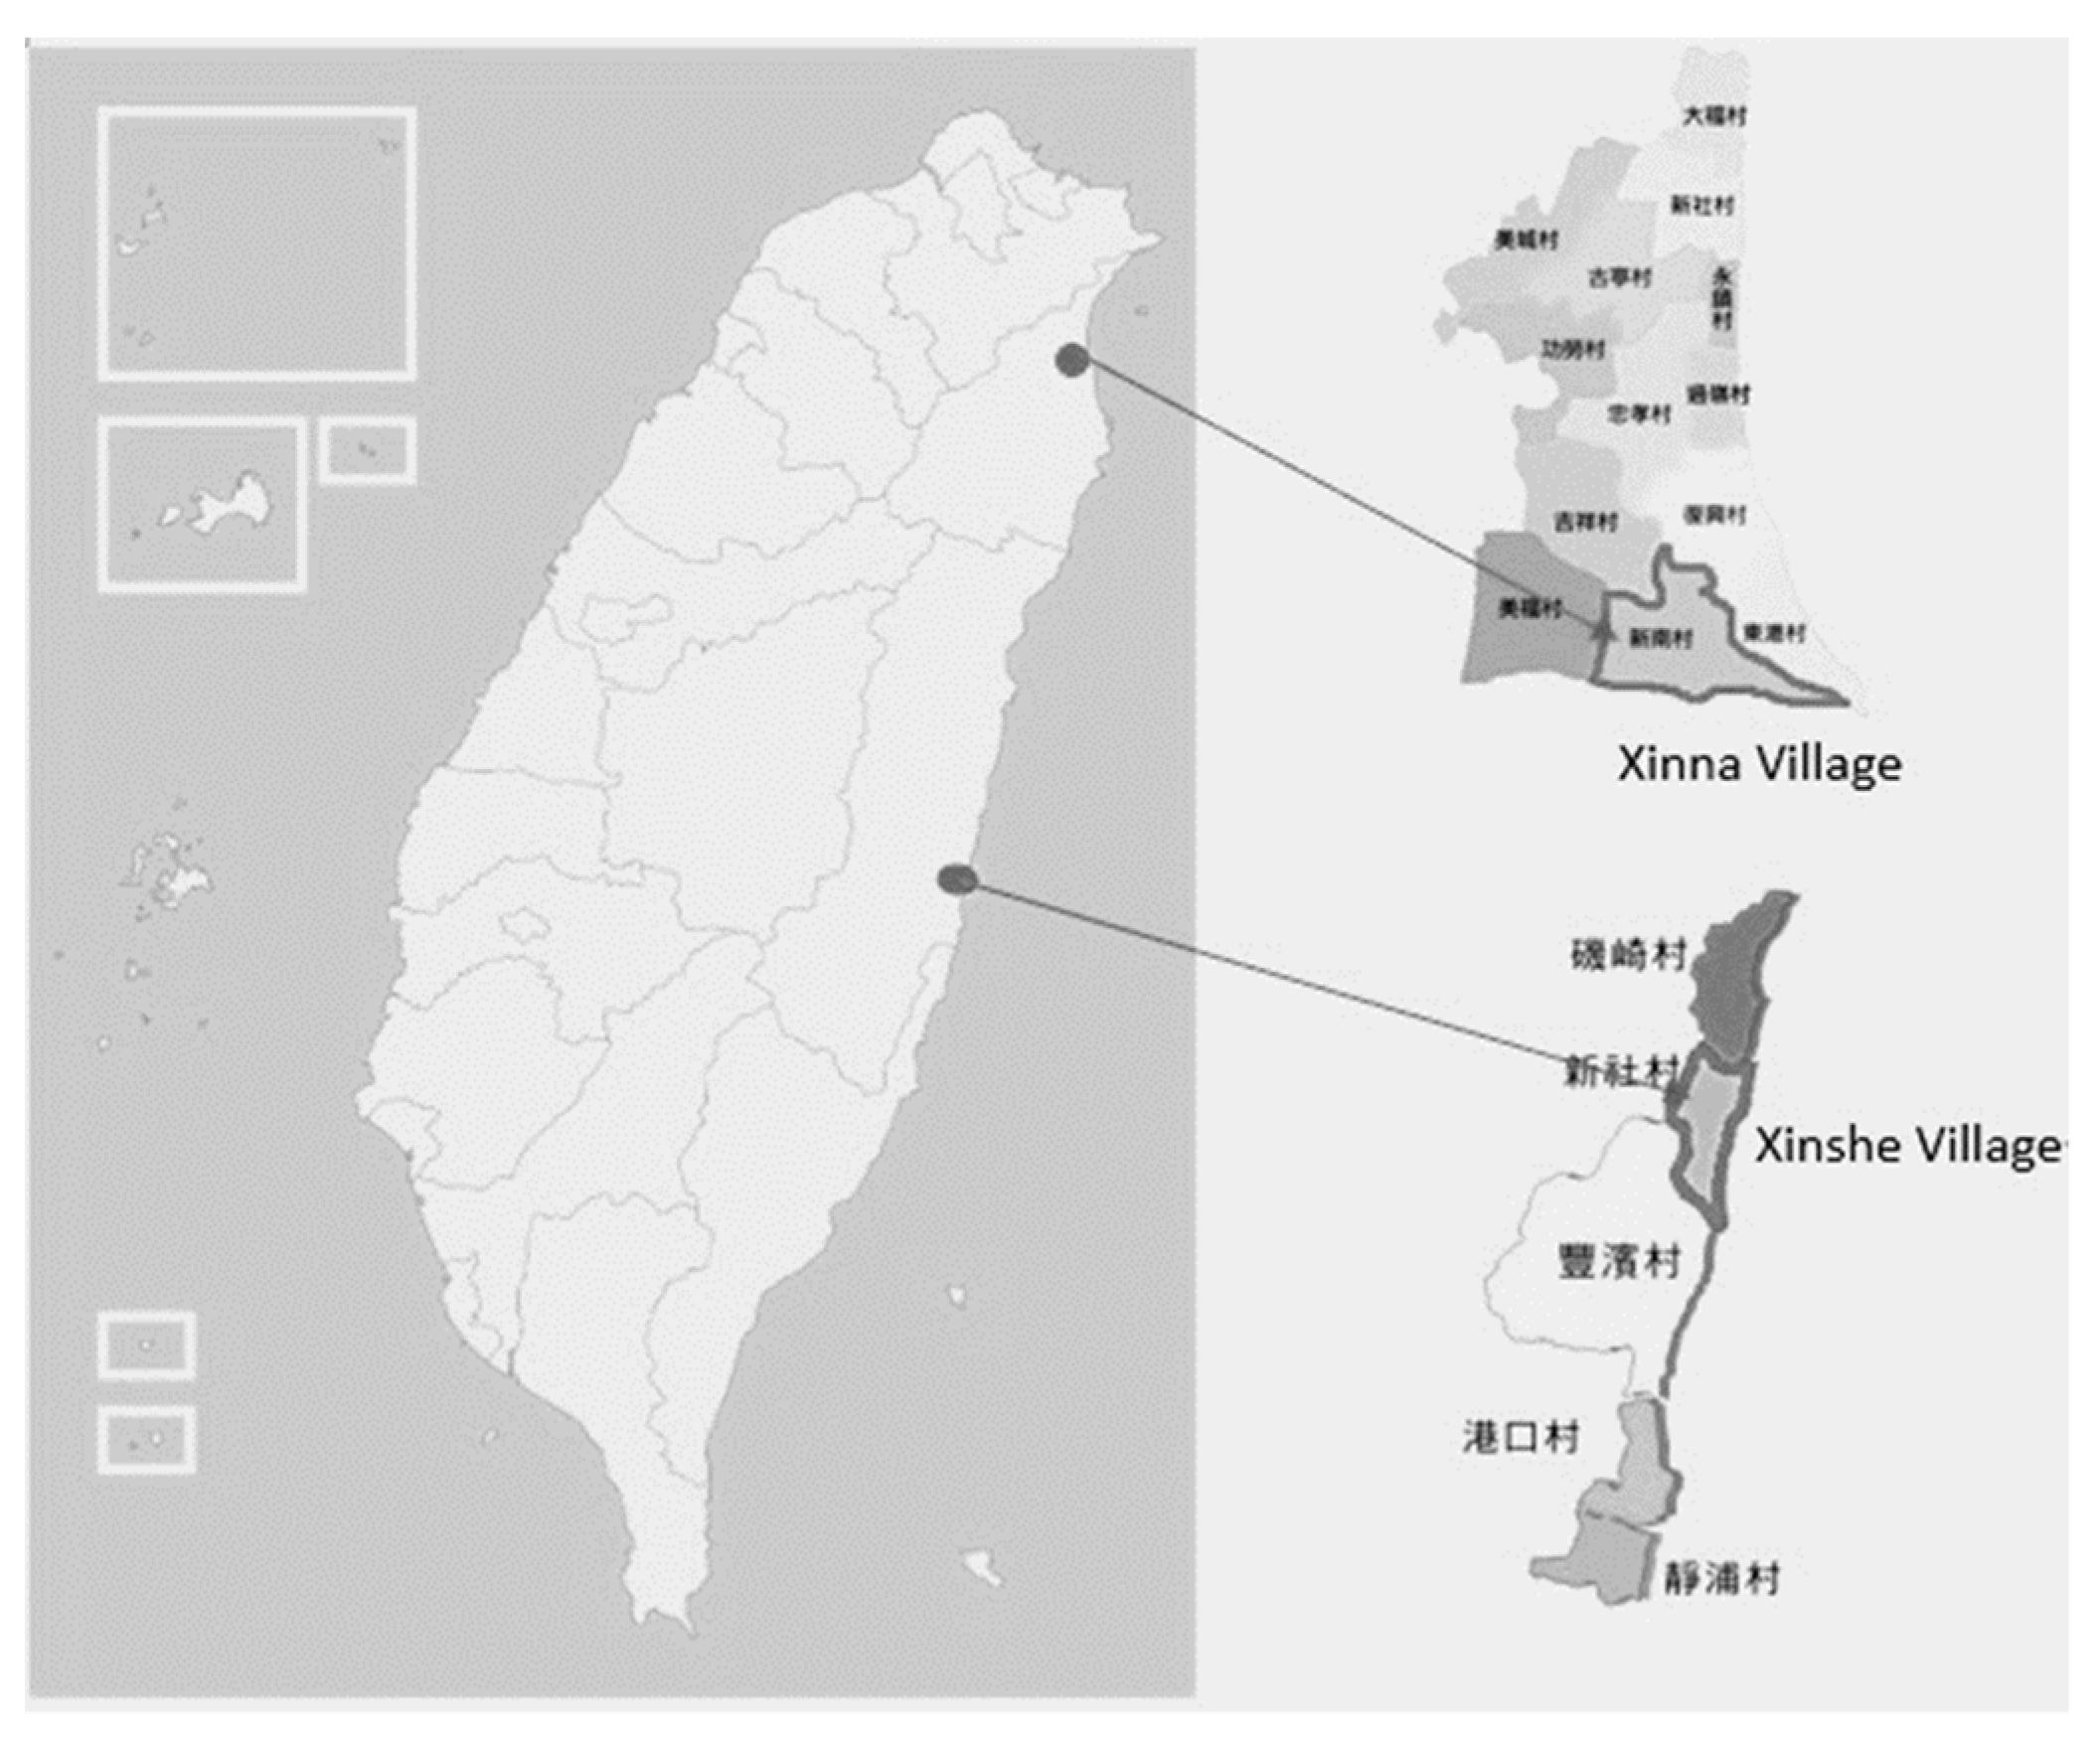
3.3. Case Study Areas

Situated in the eastern part of Taiwan, Yilan and Hualien counties were developed later than the western part of Taiwan, while also being relatively inaccessible and having limited transportation. Companies have rarely set up factories in the eastern part of Taiwan due to the transportation costs. As a result, the environment in eastern Taiwan is less polluted, and therefore is the ideal demonstration location for implementing environmentally friendly agriculture. According to official data released by the Council of Agriculture, in 2019, Hualien’s organically farmed land reached 2374 hectares, accounting for 24.9% of the county’s arable land, ranking it as the county with the largest organically farmed area in Taiwan, significantly surpassing Kaohsiung City, which ranks second with 943 hectares of organically farmed land. In Yilan, despite its proximity to the commercially prosperous Taipei City, the Yilan County Government has made environmental protection its core administrative philosophy for over 30 years, and has time and again prohibited the establishment of factories in Yilan by large, high-polluting corporations. As a result, Yilan has attracted numerous farmers with environmentally friendly values engaging in agricultural activities, while Yilan University was the first university in Taiwan to institute a research center related to the development of organic agriculture. Thus, as eco-agriculture begins to develop in Taiwan, the rural areas of Hualien and Yilan serve as ideal experimentation grounds. For instance, in 2016, the Hualien District Agricultural Research and Extension Station and Dong Hwa University initiated the “Forest-River-Village -Sea” eco-agricultural initiative in Xinshe Village, Fengbin Township, Hualien County, one of the few eco-agricultural sites in Taiwan jointly operated by the government, university, and farmers. In Yilan, Tian Dong Rice is cultivated, which is designed around the concept of waterfowl and aquatic bird conservation. The founder of Xinnan Tiandong Rice was also awarded the 2019 Forestry and Nature Conservation Merit Award. For these considerations, Yilan and Hualien were chosen as the subjects for this study.

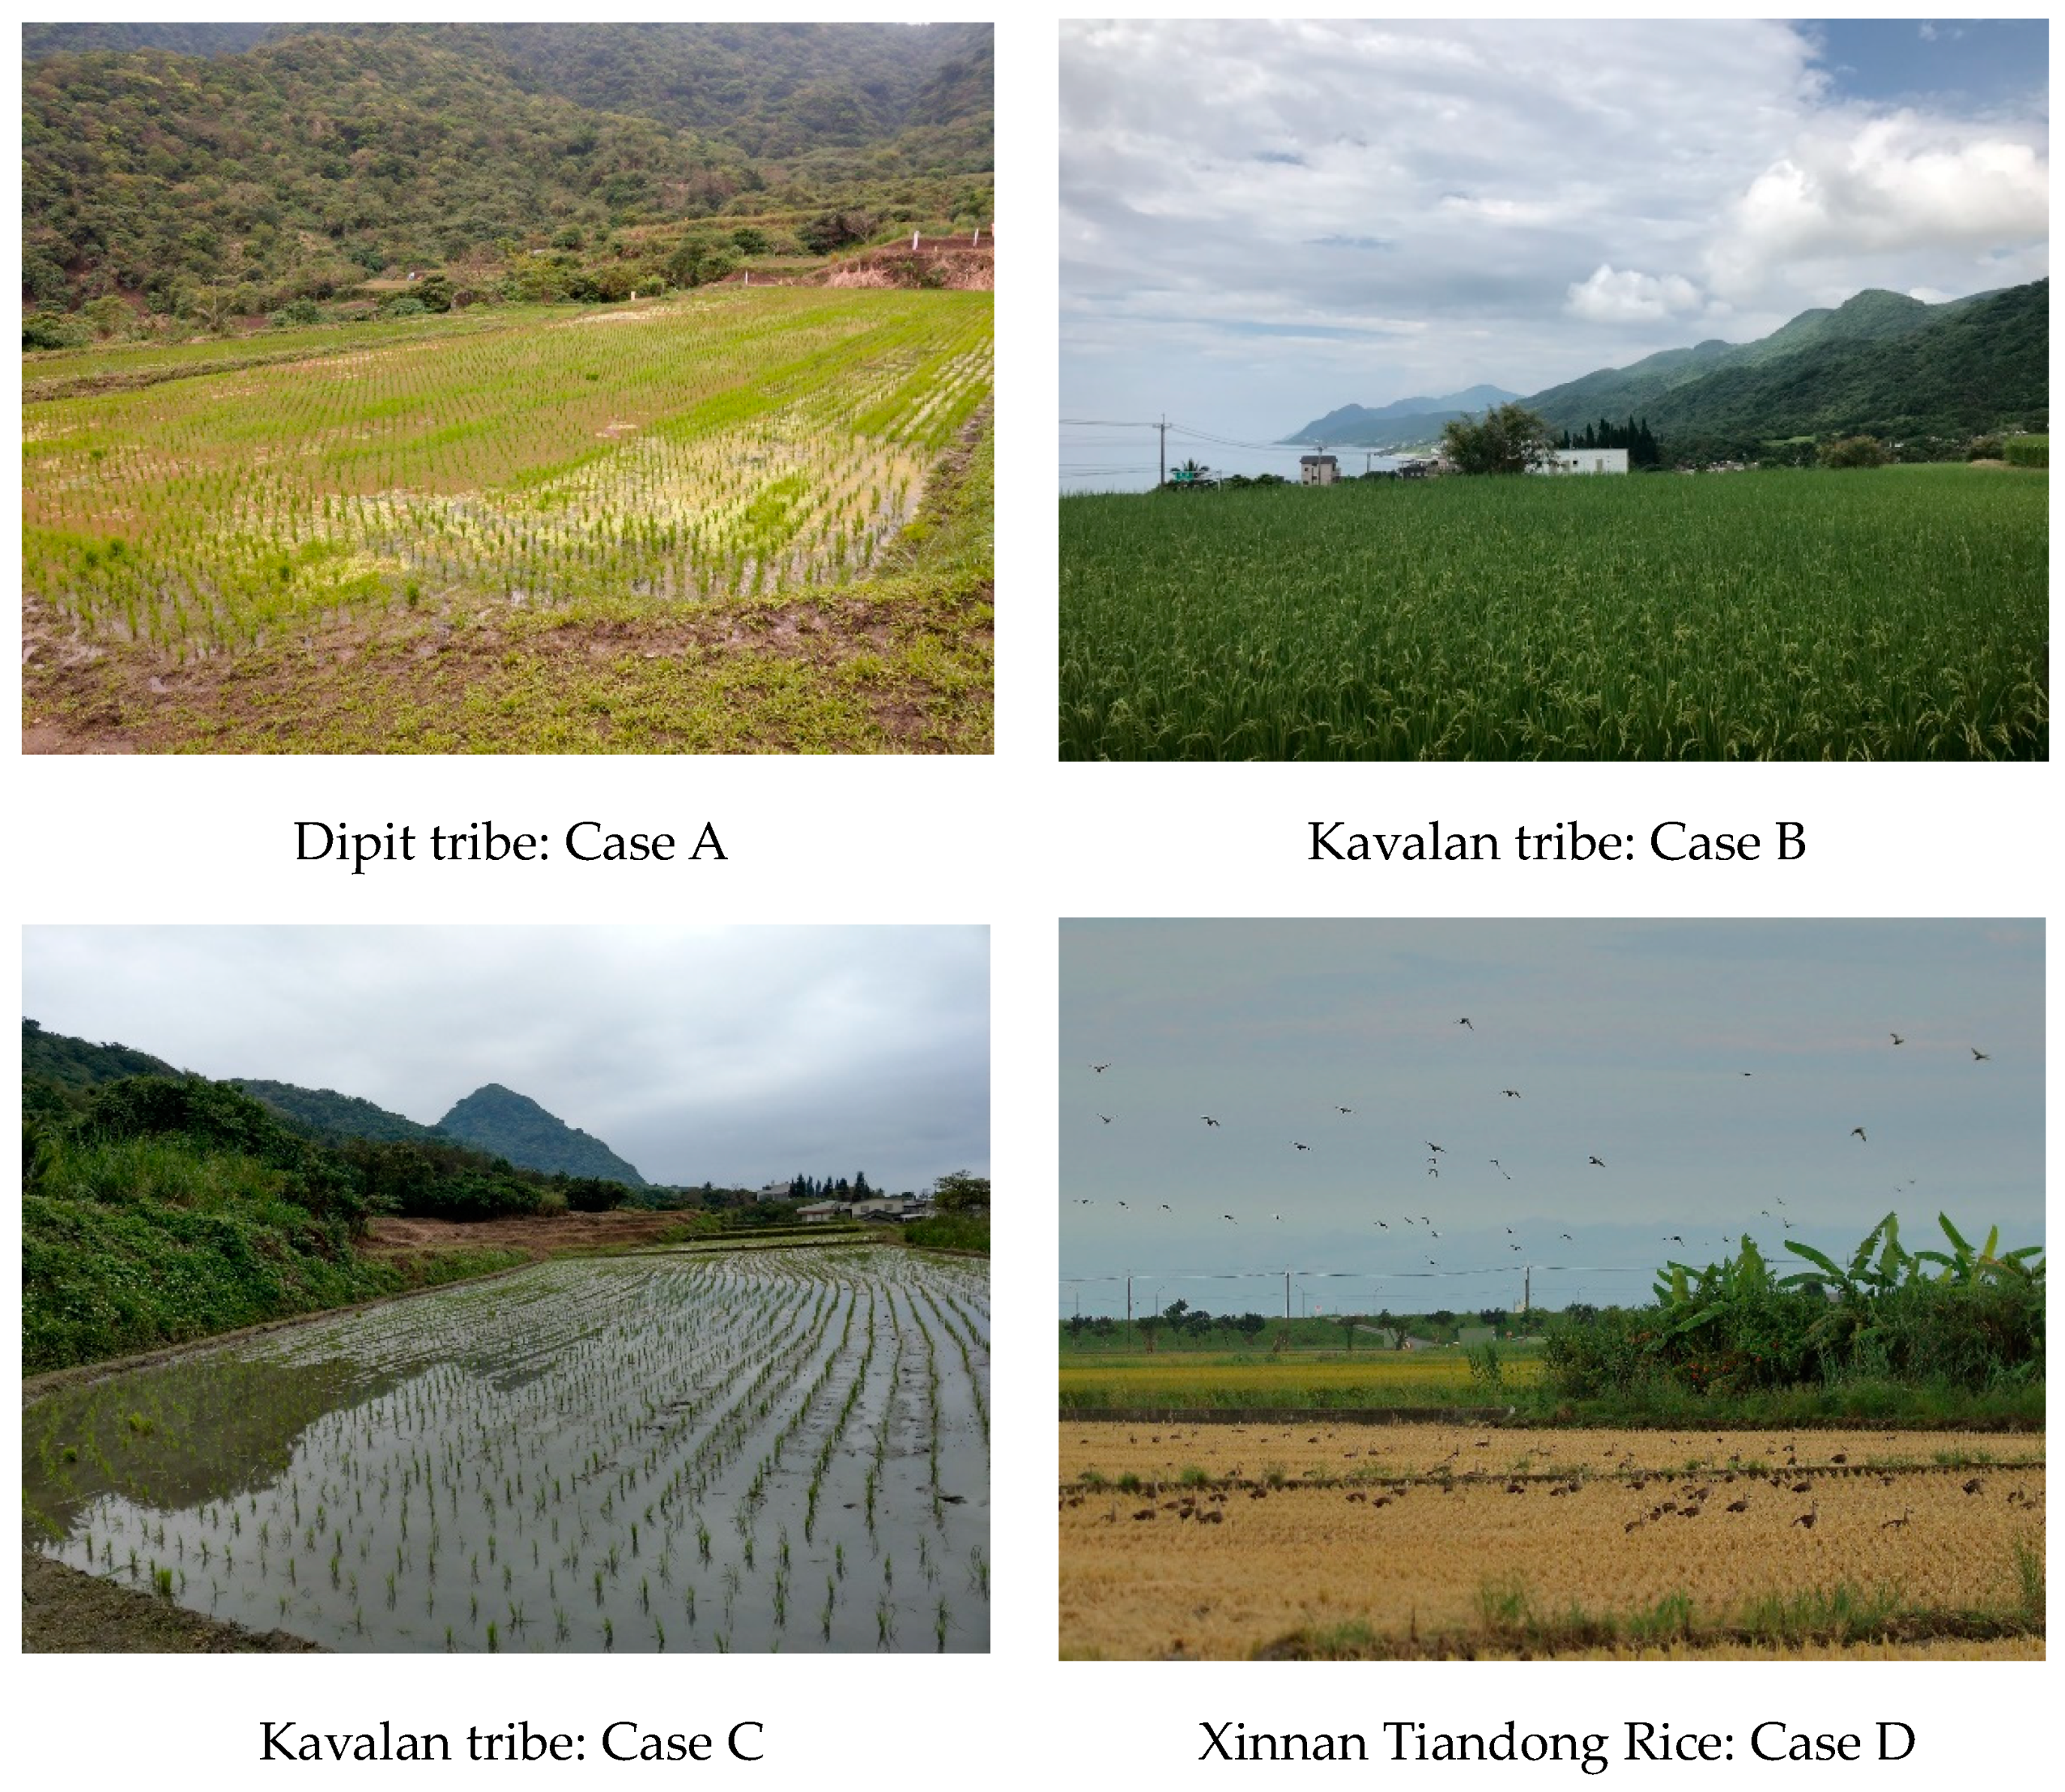
3.3.1. Dipit Tribe: Case A

The Dipit tribe, located in Xinshe Village, Hualien County (Figure 2), is situated on the east side of the Coastal Mountain Range. The tribe currently has only 35 households with an average age of its population at over 70 years old. Case A, married into the village, sought to modify agricultural practices in ways that protected biodiversity and ecosystem services. Her eco-friendly agro-food products were then used to supply the congregate meal programs specifically offered to the elderly in the village. After years of learning-by-doing and with the support and guidance from HDARES, a government agency, rice yields from Case A’s farm have grown steadily to the point where she is able to not only cater meals to the elderly, but also have excess to sell to the market. Moreover, restoration of valuable water terraces of the nearby landscape substantially increased the business value of the ago-products grown therein and brought sentimental values and childhood memories to the elderly of the village. Farm products currently on the market offered by the Dipit tribe include rice, red quinoa, candied roselle, dried aged pickled radish, and dried pickled vegetables, all grown with organic and environmentally friendly farming that features the tribe’s long-held cultural traditions and outstanding ecological environment.

3.3.2. Kavalan Tribe: Case B

The Kavalan tribe is also located in Xinshe Village, where Case B was born and raised. Case B’s families have farmed for a living in Xinshe Village from generation to generation. Case B, with full understanding of the importance of environmental protection, sought to adopt eco-friendly agricultural practices on some of his farm fields that previously used conventional farming. It is shown that with the application of hand weeding, these fields are now free of synthetic herbicides. Determined to conserve the land passed down from their ancestors, the farmers from Kavalan tribe jointly created a brand called “Little Island Friendly Rice” that features its eco-friendly and collaborative way of farming (Figure 3).

3.3.3. Kavalan Tribe: Case C

Case C, who is also a member of the Kavalan tribe, was a counseling psychologist before she became a stay-at-home mom to take care of her young children. She happened to begin to manage the family’s fields after her mother-in-law passed away a few years ago. This was what the rest of her family had long hoped. Through the Hualien County Kavalan Tribe Development Association, Case C initiated a farm called “Eight-Dummies Organic Farm.” Later, with the support and guidance from HDARES, the farm became home to the first experimental habitat to conserve the natural enemies of rice pests in Taiwan.
Crops grown in Eight-Dummies Organic Farm include rice, as well as rotated grains, such as black soybean and buckwheat. Due to differentiation of the root systems through crop rotations, nutrient contents in the soil are expected to be balanced. This improves the permeability of the soil and minimizes the accumulation of hazardous substances, thereby restoring the health of the soil.

3.3.4. Xinnan Tiandong Rice: Case D

Xinnan Village, endowed with a massive area of water rice paddy fields, has been an important habitat to waterfowl in Yilan County (Figure 2). However, due to the excessive use of pesticides and the fragmentation of farm fields caused by rezoning and building farm houses at arbitrary locations, this habitat is at risk of disappearing. Case D, a keen birdwatcher since childhood, understands the significant relationship between healthy land and sustainable bird ecology. Out of his love for Xinnan waterfowl, Case D in 2014 took action and proposed the idea of “organic rice with conserved water paddies” to fellow local farmers. Convinced farmers soon adopted organic and eco-friendly farming to grow rice, which was later acquired at a premium, grinded by Case D, and sold as a new brand “Xinnan Tiandong Rice.” The product line of Xinnan Tiandong Rice includes not only white rice, brown rice, and processed rice products, but also farm recreational tours. Participants of the tours can shop for agro-products and enjoy rural and farming experiences in the neighborhoods of the farm at the same time. For those who cannot make the tours, a website created by Case D’s team is also available for online orders and pre-orders. Case D has developed the most up-to-date business model among these four cases in our study while seamlessly incorporating the valuable spirits of agricultural recreation into his brand: to have fun eating, drinking, touring, shopping, and learning on the farm.

3.4. Sampling and Survey Method of the Estimation of Indirect Benefits of Eco-Agriculture

This study utilizes the contingent value method (CVM) to estimate the indirect benefits of eco-agriculture. Questionnaires are thus required and employed herein to investigate the WPT for eco-agriculture.
In terms of questionnaire design, we have made reference to studies that utilize CVM as a research method to assess the multifunctional value of agriculture for the design of the first draft of the questionnaire, which can be divided into four parts. The first section: Attitudes toward the four indirect benefits of ecological agriculture, which serve as the basis for our subsequent analysis of the four indirect benefits. The second section is concerned with the awareness of ecological agriculture and the purchase experience of ecological agricultural products. We believe that the awareness of ecological agriculture and the purchase experience of ecological agricultural products affect the willingness-to-pay. Similar items can also be found in a number of literatures, for instance, Hung et al. [27], Tseng and Lee [28], and Chen et al. [29]. In the third section, responders’ willingness-to-pay is assessed. The fourth section is concerned with socio-economic variables such as occupation, income, area of residence, etc. After the initial draft was designed, a pre-test survey with a sample of 50 subjects was conducted to address the questions that might be misunderstood or misinterpreted by the participants. The questionnaire was finalized after the revisions were made. Please refer to Appendix A for the contents of the questionnaire.
The survey population of this study is defined as residents of Taipei City, Yilan County, and Hualien County, as consumers of the agro-products produced by these four fields predominantly come from neighboring urban areas. For convenience, the age of respondents is limited to 20 years old and above. Questionnaires are designed in two versions for non-users and users, where users are defined as residents who have shopped from these four farm fields.
We employ the stratified random sampling method in non-user sampling in the form of three strata: Taipei City, Yilan County, and Hualien County. Samples are fragmented based on the proportionality of each stratum to the total number of households of the population and randomly selected in each stratum. The sampling size is determined by:
n = Z α / 2 2 × p ^ × ( 1 p ^ ) E 2
where p ^ is a ratio of a given characteristic in the population. For example, p ^ is assumed to be the ratio of certain educational levels to meet research needs. Past values of p ^ can be used as references and if the current value is unknown. The sampling size n is maximized under the assumption that p ^ is 0.5. This study assumes p ^ equals 0.5, the sampling error (E) is under 0.03, and the confidence level is over 95%. The lower limit of our study’s sampling size is calculated as 1068.
In order to understand whether the WTP for eco-agriculture differs by locations, especially whether an individual’s WTP is higher for organic products from farms in his or her neighborhood/town, we add 30 more samples from Zhuangwei Township and Fongbin Township, respectively, into our sample through in-person interviews. We chose in-person interviews over phone interviews for Zhuangwei and Fongbin Townships due to their small population sizes, as phone interviews have a historically low response rate.
The Dipit and Kavalan tribes, unable to provide the sampling frames for user sampling, were surveyed in purposive sampling by in-person on-site interviews at given stations and mail-in questionnaires. We aimed to collect 60 completed questionnaires. Non-users were mostly phone-interviewed and occasionally interviewed in person, while users were surveyed through both in-person interviews and mail-in questionnaires.

3.5. Descriptive Statistics

Users and non-users were given different versions of questionnaires. The demographic profiles of non-users and users are summarized as follows (Table 1). Out of 1128 non-users (through 1068 phone interviews and 60 in-person interviews), 58.2% of non-user respondents are female, while male non-user respondents are 41.8%. There are more female user respondents than male user respondents as well. The majority (42.8%) of non-user respondents are 60 years old and above, and the average age of non-user respondents is 54.3 years old. The majority (more than 70%) of user respondents are between 30 and 49 years old, and the average age of user respondents is 42.2 years old. Most non-user respondents (38.4%) have a high school diploma as their highest degree of education, followed by a bachelor’s degree (34%). In addition, around half (46.9%) of non-users are unemployed or retired, and judging from the average age of non-users (54.3 years old), most users are likely to be retirees. The majority of user respondents are top to middle management and professionals. In terms of income levels, the majority of non-user respondents (49.7%) earn less than NT$30,000 monthly, followed by 28% in the NT$30,000–NT$50,000 income bracket, while most user respondents (around 60%) earn less than NT$50,000 monthly.

4. Results

4.1. Direct Benefits

4.1.1. Production Enhancement

As shown in Table 2, the average yield of rice from Case A’s field was 2400 kg per hectare (kg/ha) in 2018, equivalent to 43% of that of neighboring fields engaged in conventional farming. Case B’s average yield of rice per hectare (4000 kg/ha) exceeded that of Case A’s, equivalent to 71% of that of neighboring fields engaged in conventional farming. The average yield of rice from Case C’s field was 3360 kg/ha in 2018, equivalent to 60% of that of neighboring fields engaged in conventional farming. The average yield of rice from Case D’s field (5600 kg/ha in 2018) was the highest among these four cases and equivalent to 85% of that of neighboring fields engaged in conventional farming. This result is in line with the average production in other areas in Taiwan, whereby the average crop yield per hectare from organic farming is lower than that with conventional farming.

4.1.2. Livelihood Improvement

In Taiwan, the unit price of an agro-product produced by eco-friendly farming is generally higher than that of conventional farming, as is its unit cost. Profitability is simply not guaranteed with organic farming. For instance, the sales revenue for Case A was NT$142,750; with $667,000 of government subsidy, her total revenue came out at NT$809,750. However, Case A, hoping to help with local employment, spent most of the subsidy hiring local residents for farm work, which resulted in her total cost to hit as high as NT$736,255. Case A wound up with a profit of $73,495 in the end. Similarly, the sales revenue for Case B was NT$480,000; his total revenue came to NT$587,800, after taking into account the government subsidy of NT$$107,800. With a total cost of NT$679,000, Case B suffered a loss of NT$91,200. For Case C, the total revenue (NT$638,900) was the same as the sales revenue, as Case C did not apply for any subsidy from the government. Moreover, Case C had a higher cost than Cases A and B due to the high amortization costs for agricultural machinery. In the end, Case C suffered a loss of NT$323,500 in 2018. Lastly, thanks to the largest farm size and a variety of income sources—including sales of agro-products, sales of processed agro-products, and earnings from recreational ecology tours—Case D earned the highest profit of NT$629,567 among these four cases. To sum up, the sales revenue for Case D was NT$3,053,200; with NT$749,294 of government subsidy, the total revenue for Case D came to NT$3,802,494. Case D also had the highest total cost of NT$3,172,927 among these four cases.
This study shows that the adoption of eco-friendly farming is unlikely to improve the local livelihoods of farming communities. Even with subsidies from the government, two of the four cases in our study earned profits and two suffered losses. If the subsidies were phased out, then all four cases would suffer losses, meaning that it is immensely challenging for eco-agriculture practices in Taiwan to be sustainable without support or assistance from the government.

4.2. Indirect Benefits

4.2.1. Reliability and Validity

An exploratory factor analysis was used for identification of the five underlying dimensions. All the five factors had loadings higher than 0.60, which is much higher than the minimum threshold value of 0.40. Then we used Cronbach’s alpha and composite reliability (CR) to assess the reliability of each dimension. Table 3 reports the Cronbach’s alphas for the dimension, ranging from 0.741 and 0.908, and all of the CR coefficients were above 0.70, which signified high reliability. The average variance extracted (AVE) values for all the constructs were larger than 0.50 and varied from 0.577 to 0.935. Thus, discriminant validity ensured through high reliability and average variance extracted (AVE) were supported.

4.2.2. The Importance of Four Indirect Benefits of Eco-Agriculture

Table 4 shows how four indirect benefits of eco-agriculture were perceived by users and non-users. Here, 96.5% of non-users (1088) considered environmental protection to be very important or fairly important, followed by ecological conservation (91.5%), cultural heritage (76.3%), and landscaping (69.1%). It means more than 60% of non-users view these four indirect benefits as very important or fairly important, as do 80% of users.
To transform the qualitative survey responses (perceived importance) to quantitative expressions for statistical analysis, scores of “importance” are defined as follows: 1, absolutely unimportant; 2, unimportant; 3, slightly important; 4, fairly important; and 5, very important. The relative importance of each benefit is denoted by the ratio of the individual score to the total score for each interviewee. For instance, assuming that a respondent has scores as follows—4 on environmental protection, 3 on ecological conservation, 4 on cultural heritage, and 5 on landscaping (total score 16)—the relative importance for the indirect benefits viewed by this respondent is 0.25, 0.19, 0.25, and 0.31, respectively. Table 5 shows that for non-users, the relative importance of environmental protection is 0.271, followed by ecological conservation at 0.263, cultural heritage at 0.239, and landscaping at 0.227. On the other hand, for users, the order of relative importance of the benefits differs in where the respondents reside. For users, environmental protection is perceived as the most important benefit (0.26), followed by ecological conservation (0.253), cultural heritage (0.251), and landscaping (0.237), while for users located in Hualien County, environmental protection is perceived as the most important benefit (0.26), followed by cultural heritage (0.256), eco-logical conservation (0.248), and landscaping (0.237). Users and non-users shared the same view on the order of relative importance.

4.2.3. Willingness-to-Pay to Support Eco-Agriculture

This study employs the double-bounded dichotomous-choice method to investigate the WTP to support eco-agriculture. Results (Table 6) show that 329 non-users were willing to make annual donations to an “eco-agricultural fund” on a regular basis. Specifically, 79% of non-users were willing to make donations to the fund in the first-stage question. In addition, 70% of the non-users who were willing to make donations in the first stage were willing to donate a higher amount in the second stage. However, when next asked to donate NT$5500 in the second stage, only 19.2% of the respondents said yes. We conclude that the annual donation to an eco-agricultural fund from non-users is estimated to be NT$2000. On the other hand, 65.2% of the non-user respondents who were unwilling to pay in the first stage (21%) were still unwilling, even at a lower amount, to pay to support eco-agriculture in the second stage.
As depicted in Table 7, 76% of the users were willing to make annual donations to an eco-agricultural fund on a regular basis in the first-stage question. Furthermore, 46% of the users, i.e., the “yes, yes” response, were willing to make donations in the first stage and were willing to donate a higher amount in the second stage. On the contrary, there were 30% of respondents, i.e., the “yes, no” response, who were willing to support eco-agriculture in the first stage but we unwilling to pay for a higher price. Sixteen percent of users were unwilling to pay for eco-agriculture in the first stage. When the bid price become lower, they changed their views on support for eco-agriculture. Finally, there were still 8% of respondents who revealed no willingness to pay for eco-agriculture during the elicitation process.

4.2.4. Bid Function Analysis

We estimate the bid function empirically to investigate how the WTP was determined from the data collected through non-users and users surveys. In terms of estimation strategy, the non-users and users data were pooled together to proceed the estimation. The dependent variables are the bidding choices under DBDC method. Furthermore, independent variables include: have heard of Xinnan Tiandong Rice (q7), have heard of Kavalan tribe (q9), have heard of Dipit tribe (q11), have heard of other eco-agricultural products (q13), gender (gender), age (age), education level (edu), top to middle management and professionals (oc1), technician, administration, and service staffs (oc2), farming, forestry, fishery, and related workers (oc3), Elementary laborers (oc4), monthly personal income (lninc), and dummy variable to identify non-user or user (user). Table 8 lists the explanatory variables and their sample statistics.
Table 9 shows the results of maximizing the likelihood function (Equation (2)) to estimate the parameters using data collected from 1188 non-users and users. According to the estimation results of the coefficient, q9, q11, gender, age, edu, oc1, oc3, oc4, and user are statistically significant different from 0. This result means that all these variables have a significant influence on the WTP of the respondent. It is worth mentioning that the dummy variable to identify non-users and users (user) is quite significant statistically. This result indicates that the bidding pattern of non-users is totally different from that of users. Therefore, the WTP derived from the bidding function will also differ between non-users and users.

4.2.5. Willingness-to-Pay

Based on the estimated parameters in Table 10, the estimated WTP for the indirect benefits of eco-agriculture is shown. For non-users, they are on average willing to pay NT$2270.491 to support eco-agriculture. On the other hand, users on average are willing to pay NT$2166.583 to support eco-agriculture.
Finally, the WTP for individual indirect benefits of eco-agriculture is determined by multiplying the estimated overall WTP (Table 11) by the relative importance of the four individual indirect benefits (Table 5). Results appear in Table 10. Non-users are willing to pay the highest price for environmental protection (NT$597.139), followed by ecological conservation (NT$615.303), cultural heritage (NT$542.647), and lastly landscaping (NT$515.401). Similarly, the WTP of users on average for environmental protection is NT$548.145, followed by ecological conservation at NT$563.312, cultural heritage at NT$543.812, and landscaping at NT$513.480.

5. Discussion

Results from direct benefit estimation indicate that the crop yield per hectare with eco-agriculture is not higher, and unfortunately at times lower, compared to that of conventional farming. Our study also shows that the adoption of eco-agriculture is unlikely to improve the local livelihoods of farming communities. Even with government subsidies, two of our four case studies earned profits and two suffered losses. If the subsidies were to be phased out, then all four cases would suffer losses. Due to the higher labor costs and lower yields in eco-agriculture, the unit costs are higher than in other conventional agricultural operations. While these four cases sell their produce at higher prices than conventional agricultural products, they are nevertheless incapable of generating sufficient revenue for them to make a profit. In the instance of Case B and Case D, their prices are similar to those of organic rice, which they can usually market to completion. Although they can sell out their rice, they still suffer losses due to the high cost. The price of Case C is approximately 1.5 to 2 times the price of organic rice, but most consumers would not find this price acceptable, resulting in slow sales and ultimately losses. In comparing profitability for farmers employing conventional or sustainable farming methods/practices, several studies have found results similar to our study. Uematsu and Mishra [30] pointed out that despite the fact that certified organic farmers in the United States may earn higher revenue with the organic crop, they do not earn significantly higher household income than conventional farmers. Luh et al. [31] looked at the above comparison in Taiwan from the perspective of economic performance, with their results showing the margin between the two types of rice—conventional and organic—cannot sufficiently compensate for the output loss from the decreased rice yields using organic farming, thus leading to an unfavorable economic impact on the organic farming households.
This shows that if farmers in eco-agriculture are to profit, they must either raise the price of their products or reduce the unit cost by expanding their production scale. However, it may be difficult for consumers to accept higher prices than those of organic rice. It is even more difficult to expand the production scale. Case B, for example, maintains the use of chemical fertilizers and pesticides on half of his farmland, the reason being that he may not be able to make a living if all of his land is farmed in an eco-agricultural manner. Therefore, unless the government provides sufficient subsidies for eco-agriculture or unless more consumers recognize the value of eco-agriculture and are willing to purchase eco-agricultural products at prices higher than those of organic agricultural products, it remains difficult for Taiwan’s eco-agriculture industry to sustain itself.
The WTP of non-users to support eco-agriculture is NT$2270.491 for its indirect benefits, with the highest proportion of WTP contributing to environmental protection, followed by ecological conservation, cultural heritage, and lastly landscaping. On the other hand, the WTP of users to support eco-agriculture for its in-direct benefits is NT$2166.583. Results show that non-users are willing to pay little more to support eco-agriculture than users. In terms of the WTP for each indirect benefit, users exhibit the highest willingness-to-pay for environmental protection, followed by ecological conservation, cultural heritage, and lastly landscaping; the same as with non-users.
The willingness-to-pay of non-users is higher than that of users. This may be due to a possible factor that users might typically purchase eco-agricultural products, and therefore, given their limited income, they must allocate their income between donations and purchases of eco-agricultural products. As a result, the price they are willing to pay is lower than that of non-users. The willingness-to-pay of non-users is slightly higher than that of users. The non-users’ valuations are mainly motivated by non-use values. On the contrary, the valuations of uses are usually based on experience of usage. Therefore, the WTP difference between user and non-user is possible in a real case [32]. In general, users considered their income constraint somewhat more carefully and were more aware of eco conservation-related issues than non-users [33]. In our case, given the users’ limited income, they must allocate their income between donations and purchases of eco-agricultural products. As a result, the price they are willing to pay is lower than that of non-users.
In terms of the importance of the four indirect benefits, users place the heaviest emphasis on environmental protection, followed by ecological conservation, cultural heritage, and landscaping; the same as with non-users. Previous studies also found similar results. According to Chen [34], more than 90% of the respondents considered agri-environmental service functions related to environmental protection and ecological conservation to be important or very important. However, only about 80% of the respondents considered leisure-related functions to be important or very important. Aizaki et al. [35] used CVM to measure the economic value of the multi-functionality of agriculture and rural areas in Japan. The results demonstrate how the WTP by the survey respondents for each of these functions through policy measures may vary: (1) 649 yen for flood prevention; (2) 505 yen for recharging groundwater; (3) 642 yen for water environment conservation; (4) 445 yen for soil erosion prevention; (5) 579 yen for organic resource utilization; (6) 394 yen for the development of favorable landscapes; (7) 290 yen for recreation and relaxation; and (8) 641 yen for wildlife protection respectively. Lee et al. [36] also used CVM to evaluate the indirect benefits of Taiwan’s ecological industries based on community forestry. The results are similar to the present study: Both the WTP for environmental protection (NT$1026) and ecosystem conservation (NT$1080) are higher than cultural heritage preservation (NT$901). As respondents in the present study and the above literatures tend to share more interest in ecology conservation and environmental protection than in cultural heritage and landscaping, the former two functions and indirect benefits shall be emphasized with policy implications for future public propaganda and communication surrounding eco-agriculture and other measures towards a more sustainable future.

6. Conclusions

According to the estimated results of the indirect benefits, this study demonstrated that positive externalities do exist in eco-agriculture. However, from the results of direct effects, the positive externalities provided by farmers are not fully remunerated, and even after removing government subsidies, all cases are facing losses. Therefore, the government must intervene appropriately. On the one hand, the government should promote the importance of eco-agriculture to environmental protection and ecological conservation, so as to increase the willingness-to-pay of the eco-agricultural products and the quantity of purchases. On the other hand, the government can consider promoting payments for ecosystem services (PES) on a comprehensive scale to provide adequate compensation to farmers engaged in eco-agriculture, so that they are given sufficient incentives to continue engaging in eco-agriculture.
The Taiwan government recently enforced a policy similar to PES. In 2021, Taiwan’s Council of Agriculture began to introduce subsidies for ecological services in critical habitats, with a maximum of NT$30,000 per hectare per year for farmers who meet the conditions of the subsidies (e.g., no use of herbicides, rodent poisons, traps, poisonous baits, bird netting, etc.). However, this level of subsidization may just barely be sufficient for Case D in the case of this study, but may not be sufficient for other cases. Therefore, it is recommended that the government should consider increasing the current subsidy amount in order to support the sustainable development of Taiwan’s ecological agriculture.

Author Contributions

Conceptualization, K.-L.C., W.-H.K. and C.-C.C.; methodology, K.-L.C., W.-H.K. and J.-L.L.; software, J.-L.L.; validation, K.-L.C., W.-H.K. and J.-L.L.; formal analysis, K.-L.C., W.-H.K., C.-C.C. and J.-L.L.; Investigation, K.-L.C., W.-H.K., and J.-L.L.; resources, K.-L.C. and C.-C.C.; data curation, K.-L.C., W.-H.K. and C.-C.C.; writing—original draft preparation, K.-L.C. and W.-H.K.; writing—review and editing, W.-H.K. and J.-L.L.; Visualization, W.-H.K. and J.-L.L.; supervision, K.-L.C.; project administration, C.-C.C.; funding acquisition, C.-C.C. All authors have read and agreed to the published version of the manuscript.

Funding

This research was funded by Hualien District Agricultural Research and Extension Station, Council of Agriculture (Taiwan), grant number 109A002-A.

Data Availability Statement

The data presented in this study are collected from the authors’ 2018 field survey sponsored by a Council of Agriculture research project (109A002-A). The data are not publicly available due to the co-ownership of the sponsor and authors.

Conflicts of Interest

The authors declare no conflict of interest.

Appendix A. Survey Questionnaire

Questionnaire on the public awareness and opinions towards ecological agriculture (NTD$2000 edition)
I. Attitudes toward the four indirect benefits of ecological agriculture
“Ecological agriculture” refers to a process of production based on the elimination of chemical fertilizers and/or pesticides, which provides the following four beneficial functions: (1) Ecological conservation, (2) Environmental protection, (3) cultural heritage, and (4) lastly landscaping
  • Do you consider the benefits of ecological conservation to be important to you?
    Not important at all □Not important □Average □Important □Very important
  • Do you consider the benefits of environmental protection to be important to you?
    Not important at all □Not important □Average □Important □Very important
  • Do you consider the benefits of cultural heritage to be important to you?
    Not important at all □Not important □Average □Important □Very important
  • Do you consider the benefits of lastly landscaping to be important to you?
    Not important at all □Not important □Average □Important □Very important
II. Awareness of ecological agriculture and the purchase experience of ecological agricultural products
5.
Have you ever heard of Xinna Tiandong Rice (a variety of ecological rice)?
I have heard of it     □I have not heard of it
6.
Have you ever bought Xinna Tiandong Rice?
I have have bought it before     □I have not bought it before
7.
Have you ever heard of the Kavalan Tribe?
I have heard of it     □I have not heard of it
8.
Have you ever bought agricultural products from the Kavalan Tribe Tribe?
I have bought them before     □I have not bought them before
9.
Have you ever heard of the Dipit Tribe?
I have heard of it     □I have not heard of it
10.
Have you ever bought agricultural products from the Dipit Tribe?
I have bought them before     □I have not bought them before
11.
Have you ever heard of other ecological agricultural products?
I have heard of it     □I have not heard of it
12.
Have you ever bought other ecological agricultural products?
I have bought them before     □I have not bought them before
III. Willingness-to-pay
13.
If the government were to raise funds to establish an “Ecological Agriculture Fund” to support farmers in engaging in ecological agriculture, would you be willing to make periodic annual donations to this fund?
Yes (continue to Q14)
No (continue to Q15)
14.
Would you be willing to make an annual donation of NTD$2000 to support farmers engaged in ecological agriculture?
  • □Yes → 14_1 if the donation was for NTD$5500 → □Yes (continue to Q16)
  •                               □No (continue to Q16)
  • □No → 14_2 if the donation was for NTD$1200 → □Yes (continue to Q16)
  •                               □No (continue to Q16)
15.
What are your reasons for preferring not to donate? (Multiple Choice)
The government is responsible for the protection of the environment and the preservation of biodiversity, not me.
The gimplementation of ecological agriculture does not benefit me in any way
Economically impermissible (financially unavailable)
Others:
IV. Basic data of respondents
16.
Gender: □Male   □Female
17.
How old are you? ______ yrs
18.
What is your highest level of education?
Elementary school or below □Junior high school □High school (or vocational)
Junior College □University □Masters □Doctorate
19.
Which of the following categories would your occupation better fit into?
Supervisors, managers and other professionals (e.g., directors of private and public institutions), researchers, healthcare professionals, lawyers, teachers, etc.
Technicians, office workers and service workers (e.g., financial workers, receptionists, clerical workers, assistants, travel-related workers, restaurant or other food-related workers, etc.)
Practitioners related to agriculture, forestry, fishery and animal husbandry
Laborers
Military
No occupation (including housewives, students, etc.)
Others (please specify):
20.
Monthly Income: (Including allowance)
Below $20,000 □$80,000 (inclusive)—Below $100,000
$20,000 (inclusive)—Below $30,000 □$100,000 (inclusive)—Below $120,000
$30,000 (inclusive)—Below $40,000 □$120,000 (inclusive)—Below $150,000
$40,000 (inclusive)—Below $50,000 □$150,000 (inclusive)—Below $180,000
$50,000 (inclusive)—Below $60,000 □$180,000 (inclusive)—Below $200,000
$60,000 (inclusive)—Below $80,000 □Above $200,000 (inclusive)
21.
Which county or city do you live in?
22.
Which district/town/city?

References

  1. McNeely, J.A.; Scherr, S. Common Ground, Common Future: How Ecoagriculture Can. Help Feed the World and Save Wild Biodiversity; A Joint Publication with IUCN and Future Harvest; IUCN: Washington, DC, USA, 2001. [Google Scholar]
  2. Lin, J.; Fang, W.T.; Yuan, H.W.; Chen, K.L.; Cheng, J.C.H. Promotions of Taiwan’s eco-agriculture—A case study of Shinnan Tiandong rice. Ilan Univ. J. Bioresour. 2016, 12, 135–164. [Google Scholar]
  3. Qiu, M.Y. Bajen experience and the satoyama vision in taiwan. Nat. Conserv. Q. 2014, 88, 60–71. [Google Scholar]
  4. Fang, Y.J.; Shiue, B.W. The traditional knowledge and new practice intertwined with gongliao rice terrace, where life is connected through ditches and sea view. Nat. Conserv. Q. 2014, 88, 26–39. [Google Scholar]
  5. Varian, H.R. Microeconomic Analysis; W. W. Norton & Company: New York, NY, USA, 1992. [Google Scholar]
  6. Huang, B.W.; Lin, S.I.; Lin, P.H.; Hsieh, Y.T.; Cheng, Y.Y. The production costs and revenues of organic rice. J. Agric. For. 2018, 66, 11–24. [Google Scholar]
  7. Rasul, G.; Thapa, G.B. Sustainability of ecological and conventional agricultural systems in Bangladesh: An assessment based on environmental, economic and social perspectives. Agric. Syst. 2004, 79, 327–351. [Google Scholar] [CrossRef]
  8. Bakhsh, K.; Hassan, I.; Maqbool, A. Impact assessment of zero-tillage technology in rice-wheat system: A case study from Pakistani Punjab. Elec. J. Environ. Agric. Food Chem. 2005, 4, 1132–1137. [Google Scholar]
  9. Hobbs, P.R.; Gupta, R.K. Resource-Conserving technologies for wheat in the rice-wheat system. Improv. Product. Sustain. Rice-Wheat Syst. Issues Impacts 2003, 65, 149–171. [Google Scholar]
  10. Hassan, A.S.M.R.; Bakshi, K. Pest management, productivity and environment: A comparative study of IPM and conventional farmers of Northern districts of Bangladesh. Pak. J. Soc. Sci. 2005, 3, 1007–1014. [Google Scholar]
  11. Atinkut, H.B.; Yan, T.; Arega, Y.; Raza, M.H. Farmers’ willingness-to-pay for eco-friendly agricultural waste management in Ethiopia: A contingent valuation. J. Clean. Prod. 2020, 261, 121211. [Google Scholar] [CrossRef]
  12. Moser, R.; Raffaelli, R. Consumer preferences for sustainable production methods in apple purchasing behaviour: A non-hypothetical choice experiment. Int. J. Consum. Stud. 2012, 36, 141–148. [Google Scholar] [CrossRef]
  13. Combris, P.; Giraud-Héraud, E.; Bazoche, P.; Hannus, C.; Pinto, A.S.; Berjano, M.; Maia, R. Consumers’ willingness to pay for reduced pesticide use in the production of fresh and processed apples. Acta Hortic 2012, 940, 425–432. [Google Scholar] [CrossRef]
  14. Schmit, T.M.; Rickard, B.J.; Taber, J. Consumer valuation of environmentally friendly production practices in wines, considering asymmetric information and sensory effects. J. Agric. Econ. 2013, 64, 483–504. [Google Scholar] [CrossRef] [Green Version]
  15. Vecchio, R. Determinants of willingness-to-pay for sustainable wine: Evidence from experimental auctions. Wine Econ. Policy 2013, 2, 85–92. [Google Scholar] [CrossRef] [Green Version]
  16. Uchida, H.; Roheim, C.A.; Wakamatsu, H.; Anderson, C.M. Do Japanese consumers care about sustainable fisheries? Evidence from an auction of ecolabelled seafood. Aust. J. Agric. Resour. Econ. 2014, 58, 263–280. [Google Scholar] [CrossRef] [Green Version]
  17. Bazoche, P.; Combris, P.; Giraud-Héraud, E.; Seabra Pinto, A.; Bunte, F.; Tsakiridou, E. Willingness to pay for pesticide reduction in the EU: Nothing but organic? Eur. Rev. Agric. Econ. 2014, 41, 87–109. [Google Scholar] [CrossRef]
  18. Vecchio, R.; Annunziata, A. Willingness-to-pay for sustainability-labelled chocolate: An experimental auction approach. J. Clean. Prod. 2015, 86, 335–342. [Google Scholar] [CrossRef]
  19. Zhou, G.; Hu, W.; Huang, W. Are consumers willing to pay more for sustainable products? A study of eco-labeled tuna steak. Sustainability 2016, 8, 494. [Google Scholar] [CrossRef] [Green Version]
  20. Arrow, K.; Solow, R.; Portney, P.R.; Leamer, E.E.; Radner, R.; Schuman, H. Report of the NOAA Panel on Contingent Valuation. 1993. Available online: https://edisciplinas.usp.br/pluginfile.php/4473366/mod_folder/intro/Arow_WTP.pdf (accessed on 13 September 2021).
  21. Hanemann, W.M.; Loomis, J.; Kanninen, B.J. Statistical efficiency of double-bounded dichotomous choice contingent valuation. Am. J. Agric. Econ. 1991, 73, 1255–1263. [Google Scholar] [CrossRef]
  22. Song, N.V.; Huyen, V.N.; Dung, L.T.P.; Thuy, N.T. Using double-bounded dichotomous-choice to estimate households’ willingness to pay for improved water quality in Bac Ninh province of Vietnam. J. Environ. Prot. 2019, 10, 1407–1418. [Google Scholar] [CrossRef] [Green Version]
  23. Cecchini, L.; Torquati, B.; Chiorri, M. Sustainable agri-food products: A review of consumer preference studies through experimental economics. Agric. Econ. 2018, 64, 554–565. [Google Scholar] [CrossRef]
  24. Cameron, T.A.; James, M.D. Efficient estimation methods for “closed-ended” contingent valuation surveys. Rev. Econ. Stat. 1987, 69, 269–276. [Google Scholar] [CrossRef]
  25. Aberini, A.A.; Cropper, M.; Fu, T.T.; Liu, A.K.; Shaw, J.T.; Harrington, D.W. What is the value of reduced morbidity in Taiwan? J. Environ. Econ. Manag. 1997, 34, 107–126. [Google Scholar]
  26. Cameron, T.A. A new paradigm for valuing non-market goods using referendum data: Maximum likelihood estimation by censored logistic regression. J. Environ. Econ. Manag. 1988, 15, 355–379. [Google Scholar] [CrossRef]
  27. Hung, H.C.; Lee, C.J.; Chan, S.L.; Lin, H.C.; Hsiao, T.Y.; Wun, Y.S. Valuation of wetland and landscape for terraced paddy conservation: The case of new taipei city and hualien county. J. Land Res. 2013, 16, 1–22. [Google Scholar]
  28. Tseng, W.C.; Lee, S.A. The food security and landscape values of Taiwan paddy field. J. Agric. Econ. 2005, 78, 39–79. [Google Scholar]
  29. Chen, K.L.; Lin, Y.C.; Shieh, M.S.; Chen, W.C.; Jiang, J.L.; Lee, J.H. Economic valuation of rice paddy. Ilan Univ. J. Bioresour. 2006, 1, 1–14. [Google Scholar]
  30. Uematsu, H.; Mishra, A.K. Organic farmers or conventional farmers: Where’s the money? Ecol. Econ. 2012, 78, 55–62. [Google Scholar] [CrossRef]
  31. Luh, Y.H.; Tsai, M.H.; Jiang, W.J. An application of propensity score matching method on the evaluation of economic outcomes of organic farming. Agric. Econ. 2016, 57, 41–82. [Google Scholar]
  32. Wu, P.I.; Liou, J.L.; Su, M.T. The willingness to pay differences among stakeholders: Compensation benchmark for conservation of a biodiversity sit. Empir. Econ. Lett. 2011, 10, 907–915. [Google Scholar]
  33. Kniivilä, M. Users and non-users of conservation areas: Are there differences in WTP, motives and the validity of responses in CVM surveys? Ecol. Econ. 2006, 59, 530–539. [Google Scholar] [CrossRef]
  34. Chen, M.C. Evaluation of Environmental Services of Agriculture in Taiwan. 2001. Available online: https://www.fftc.org.tw/htmlarea_file/library/20110721173505/eb512.pdf (accessed on 12 September 2021).
  35. Aizaki, H.; Sato, K.; Osari, H. Contingent valuation approach in measuring the multifunctionality of agriculture and rural areas in Japan. Paddy Water Environ. 2006, 4, 217–222. [Google Scholar] [CrossRef]
  36. Lee, C.H.; Wang, C.H.; Chen, Y.H.; Chen, Y.H.; Chen, K.L. The benefit assessment of ecoindustry in Taiwan’s community forestry. J. Appl. Econ. 2013, 93, 43–82. [Google Scholar]
Figure 1. Benefits of eco-agriculture.
Sustainability 13 10889 g001
Figure 2. Xinnan Village, Yilan County and Xinshe Village, Hualien County.
Sustainability 13 10889 g002
Figure 3. Rice fields of four case studies.
Sustainability 13 10889 g003
Table 1. Demographic statistics of respondents.
Non-UsersUsers
(n = 1128)(n = 60)
Respondentsn%2033.4
GenderMale47141.84066.7
Female65758.246.7
Age18–29857.52135.0
30–391049.22541.7
40–4917615.6610.0
50–5928024.846.7
60 and older48342.8610.0
EducationHigh school diploma and below43338.4813.3
Associate17215.22236.7
Bachelor38334.02440.0
Master and above14012.42643.3
OccupationTop to middle management and professionals17415.41626.7
Technicians, administration, and service staffs31127.646.7
Farming, forestry, fishery, and related workers353.111.7
Elementary laborers786.900.0
Others53046.92948.4
Personal
Monthly
Income
Less than NT$30,00056149.72440.0
NT$30,000-$50,00031628.046.7
NT$50,000-$70,0001109.858.4
NT$70,000-$90,000554.91118.4
NT$90,000 and more867.62033.4
Table 2. Direct benefits of eco-agriculture: Four selected cases.
Direct BenefitsIndicatorsFour Cases of Eco-Agriculture Practices
Case ACase BCase CCase D
Production EnhancementArea (Ha)142.46
Rice yield (kg/ha) and equivalence to that of conventional farming (%)2400 kg/ha,
43%
4000 kg/ha,
71%
3360 kg/ha,
60%
5600 kg/ha,
84.5%
Livelihood ImprovementRevenue (NT$)Sales revenue142,750480,000638,9003,053,200
Government subsidy667,000107,8000749,294
Total809,750587,800638,9003,802,494
Cost (NT$)736,255679,000958,3003,172,927
Profit/Loss (NT$)73,495−91,200−323,500629,567
Profit/Loss per unit area (NT$/ha)73,495−22,800−134,792104,928
Table 3. Results of factor analysis and reliability test.
Factor LoadingCronbach’s AlphaComposite
Reliability
Average Variance Extracted (AVE)
Attitudes to the indirect benefits of eco-agriculture 0.7410.8450.577
 Do you think the benefits of the enhancement of ecological conservation are important to you?0.803
 Do you think the benefits of the betterment of environmental protection are important to you?0.790
 Do you think the benefits of the preservation of cultural heritage are important to you?0.758
 Do you think the benefits of the upgrade of landscaping are important to you?0.684
Understanding and buying behavior of Tiandong Rice 0.9430.9660.935
 Have you ever heard of Xinnan Tiandong Rice0.969
 Have you ever bought Xinnan Tiandong Rice0.965
Understanding and buying behavior of agricultural products from Kavalan tribe 0.9440.9490.903
 Have you ever heard of Kavalan tribe0.952
 Have you ever bought agricultural products from Kavalan tribe0.954
Understanding and buying behavior of agricultural products from Dipit tribe 0.9480.9520.908
 Understanding and buying behavior of agricultural products from Dipit tribe0.955
 Understanding and buying behavior of agricultural products from Dipit tribe0.954
Understanding and buying behavior of other eco-agricultural products 0.9090.9490.903
 Have you heard of other eco-agricultural products0.955
 Have you ever bought other eco-agricultural products0.946
Table 4. Importance of indirect benefits of eco-agriculture perceived by users and non-users.
Non-UsersUsers
Indirect BenefitsImportance(n = 1128)(n = 60)
n%n%
Ecological ConservationVery Important72764.53050
Fairly Important30527.02541.7
Slightly Important736.558.3
Unimportant201.800
Absolutely Unimportant30.300
Environmental ProtectionVery Important80471.33456.7
Fairly Important28425.22440.0
Slightly Important332.923.4
Unimportant60.500
Absolutely Unimportant10.100
Cultural HeritageVery Important46741.42541.7
Fairly Important39434.93253.4
Slightly Important22920.335
Unimportant332.900
Absolutely Unimportant50.400
LandscapingVery Important33930.11423.4
Fairly Important44039.03965.0
Slightly Important28825.5711.7
Unimportant544.800
Absolutely Unimportant70.600
Table 5. Scores of importance of indirect benefits of eco-agriculture.
Indirect BenefitsNon-UsersUsers
(n = 1128)(n = 60)
Ecological Conservation0.2630.253
Environmental Protection0.2710.260
Cultural Heritage0.2390.251
Landscaping0.2270.237
Table 6. Non-users’ willingness-to-pay to support eco-agriculture.
First-Stage WTP (NT$)WillingnessPhone and in-Person InterviewsSecond-Stage WTP (NT$)WillingnessPhone and in-Person Interviews
Sample Size%Sample Size%
750Yes6881.91000Yes5381.7
No1518.3
No1518.1150Yes742.9
No857.1
1000Yes7683.51200Yes6686.1
No1013.9
No1516.5750Yes430.8
No1169.2
1200Yes6474.42000Yes5383.3
No1116.7
No2225.61000Yes522.2
No1777.8
2000Yes5275.45500Yes1017.4
No4282.6
No1724.61200Yes840.0
No960.0
Table 7. Users’ willingness-to-pay to support eco-agriculture.
First-Stage WTP (NT$)WillingnessSample Size%Second-Stage WTP (NT$)WillingnessSample Size%
750Yes6121000Yes510
No12
No510150Yes510
No00
1000Yes12241200Yes816
No48
No12750Yes12
No00
1200Yes12242000Yes816
No48
No121000Yes00
No12
2000Yes8165500Yes24
No612
No5101200Yes24
No36
First bound(Yes)3876First + second bound(yes, yes)2346
(yes, no)1530
(no)1224(no, yes)816
(no, no)48
Total-50100--50100
Table 8. Variable definitions and sample statistics (non-users and users).
VariableDefinitionTotal Sample
(Non-Users + Users, n = 1188)
MeanS.D.
q7Have heard of Xinnan Tiandong Rice0.07830.2687
1 = yes; 0 = no
q9Have heard of Kavalan tribe0.50000.5002
1 = yes; 0 = no
q11Have heard of Dipit tribe0.33160.4710
1 = yes; 0 = no
q13Have heard of other eco-agricultural products0.36200.4808
1 = yes; 0 = no
genderGender0.41330.4926
1 = male; 0 = female
ageAge of respondent53.636415.1090
eduEducation level of respondent13.34684.8193
oc1Dummy variable for occupation0.16840.3743
1 = top to middle management and professionals; 0 = other
oc2Dummy variable for occupation0.27530.4468
1 = technicians, administration, and service staffs; 0 = other
oc3Dummy variable for occupation0.03280.1783
1 = farming, forestry, fishery, and related workers; 0 = other
oc4Dummy variable for occupation0.06650.2493
1 = Elementary laborers; 0 = other
lnincMonthly personal income (natural logarithm)10.13160.9039
userDummy variable to identify non-user or user0.05050.2191
1 = user; 0 = non-user
Table 9. Estimation results of bid function.
VariableEstimated CoefficientVariableEstimated Coefficient
q70.1999
(0.1797)
oc10.5254 *
(0.2900)
q90.2132 ***
(0.0838)
oc20.3091
(0.2346)
q110.1916 **
(0.0863)
oc30.4349 *
(0.2529)
q130.1039
(0.0840)
oc4−0.4239 **
(0.2142)
gender0.1899 **
(0.0802)
lninc0.0427
(0.0528)
age−0.0084 ***
(0.0028)
user0.4819 *
(0.2472)
edu0.0408 *
(0.0240)
constant−1.5189 **
(0.6768)
n = 1188
Wald   χ 2 (15) = 172.74 ***
Note: *, **, ***—significant at 1%, 5%, and 10% level respectively; the number in parentheses is standard deviation.
Table 10. Estimates of WTP for overall indirect benefits.
Types of QuestionnairesSample SizeNumber of Respondents Willing to Pay (n)Percentage of Respondents Willing to Pay (%)Mean WTP
(NT$)
95% C.I.
Lower Bound
95% C.I.
Upper Bound
Non-users112832929.17%2270.491$2192.378$2348.603
Users605083.33%2166.583$2074.750$2258.416
Table 11. Estimates of WTP for individual indirect benefit (NT$).
Indirect BenefitsNon-UsersUsers
Total WTP2270.4912166.583
 Ecological Conservation597.139548.145
 Environmental Protection615.303563.312
 Cultural Heritage542.647543.812
 Landscaping515.401513.480
Publisher’s Note: MDPI stays neutral with regard to jurisdictional claims in published maps and institutional affiliations.

