
Volunteers Recruitment, Retention, and Performance during the CSMON-LIFE (Citizen Science MONitoring) Project and 3 Years of Follow-Up

 , , , and
Abstract
:1. Introduction
2. Materials and Methods
3. Results
4. Discussion
5. Conclusions
Author Contributions
Funding
Institutional Review Board Statement
Informed Consent Statement
Data Availability Statement
Acknowledgments
Conflicts of Interest
Appendix A

| R > 30 | <=1950 | 1951–1960 | 1961–1970 | 1971–1980 | 1981–1990 | 1991–2000 |
| 1951–1960 | 0.04396 | |||||
| 1961–1970 | 0.008949 | 0.651 | ||||
| 1971–1980 | <0.0001 | 0.03031 | 0.06356 | |||
| 1981–1990 | 0.0003245 | 0.1181 | 0.2114 | 0.7033 | ||
| 1991–2000 | <0.0001 | 0.09218 | 0.1781 | 0.5769 | 0.9106 | |
| 2001–2008 | <0.0001 | <0.0001 | 0.0003361 | 0.06018 | 0.02914 | 0.01687 |
| R = 21–30 | <=1950 | 1951–1960 | 1961–1970 | 1971–1980 | 1981–1990 | 1991–2000 |
| 1951–1960 | 0.3877 | |||||
| 1961–1970 | 0.2862 | 0.5372 | ||||
| 1971–1980 | 0.4229 | 0.8308 | 0.289 | |||
| 1981–1990 | 0.5593 | 0.3814 | 0.109 | 0.4335 | ||
| 1991–2000 | 0.5758 | 0.2754 | 0.0435 | 0.3025 | 0.9257 | |
| 2001–2008 | NA | 0.003634 | 0.0003425 | 0.006856 | 0.04842 | 0.05838 |
| R = 11–20 | <=1950 | 1951–1960 | 1961–1970 | 1971–1980 | 1981–1990 | 1991–2000 |
| 1951–1960 | 0.6893 | |||||
| 1961–1970 | 0.8967 | 0.5957 | ||||
| 1971–1980 | 0.936 | 0.3392 | 0.6471 | |||
| 1981–1990 | 0.607 | 0.1192 | 0.2402 | 0.413 | ||
| 1991–2000 | 0.01773 | <0.0001 | 0.0002085 | 0.000741 | 0.0162 | |
| 2001–2008 | 0.02104 | <0.0001 | 0.0001148 | 0.0004585 | 0.01564 | 0.8793 |
| R = 6–10 | <=1950 | 1951–1960 | 1961–1970 | 1971–1980 | 1981–1990 | 1991–2000 |
| 1951–1960 | 0.1443 | |||||
| 1961–1970 | 0.05054 | 0.651 | ||||
| 1971–1980 | 0.007425 | 0.2241 | 0.4027 | |||
| 1981–1990 | 0.05442 | 0.6421 | 0.9707 | 0.4505 | ||
| 1991–2000 | 0.001737 | 0.09218 | 0.1781 | 0.5907 | 0.2127 | |
| 2001–2008 | <0.0001 | 0.0003961 | 0.001355 | 0.01413 | 0.001927 | 0.05158 |
| R = 2–5 | <=1950 | 1951–1960 | 1961–1970 | 1971–1980 | 1981–1990 | 1991–2000 |
| 1951–1960 | 0.1088 | |||||
| 1961–1970 | 0.08526 | 0.8298 | ||||
| 1971–1980 | 0.2423 | 0.2322 | 0.09354 | |||
| 1981–1990 | 0.03576 | 0.272 | 0.2918 | 0.006304 | ||
| 1991–2000 | 0.04629 | 0.3842 | 0.4301 | 0.008716 | 0.7116 | |
| 2001–2008 | 0.1038 | 0.9613 | 0.7331 | 0.1364 | 0.1353 | 0.2063 |
| R = 1 | <=1950 | 1951–1960 | 1961–1970 | 1971–1980 | 1981–1990 | 1991–2000 |
| 1951–1960 | 0.718 | |||||
| 1961–1970 | 0.5667 | 0.7403 | ||||
| 1971–1980 | 0.03841 | 0.004431 | 0.003308 | |||
| 1981–1990 | 0.3168 | 0.3018 | 0.4096 | 0.05783 | ||
| 1991–2000 | 0.05453 | 0.008973 | 0.007557 | 0.7668 | 0.1011 | |
| 2001–2008 | <0.0001 | <0.0001 | <0.0001 | 0.01711 | <0.0001 | 0.006881 |
| M 1–36 | <=1950 | 1951–1960 | 1961–1970 | 1971–1980 | 1981–1990 | 1991–2000 |
| 1951–1960 | 0.2235 | |||||
| 1961–1970 | 0.3526 | 0.5113 | ||||
| 1971–1980 | 0.0003827 | <0.0001 | <0.0001 | |||
| 1981–1990 | 0.7661 | 0.0009178 | 0.01023 | <0.0001 | ||
| 1991–2000 | 0.01373 | <0.0001 | <0.0001 | 0.0003028 | <0.0001 | |
| 2001–2008 | <0.0001 | <0.0001 | <0.0001 | <0.0001 | <0.0001 | <0.0001 |
| M 37–72 | <=1950 | 1951–1960 | 1961–1970 | 1971–1980 | 1981–1990 | 1991–2000 |
| 1951–1960 | 0.0107 | |||||
| 1961–1970 | <0.0001 | <0.0001 | ||||
| 1971–1980 | <0.0001 | <0.0001 | 0.1406 | |||
| 1981–1990 | <0.0001 | <0.0001 | 0.008951 | 0.0002353 | ||
| 1991–2000 | <0.0001 | <0.0001 | 0.4631 | 0.01168 | 0.02242 | |
| 2001–2008 | <0.0001 | <0.0001 | 0.001679 | 0.05015 | <0.0001 | <0.0001 |
References
- Haklay, M. Citizen Science and Volunteered Geographic Information: Overview and Typology of Participation. In Crowdsourcing Geographic Knowledge; Sui, D., Elwood, S., Goodchild, M., Eds.; Springer: Dordrecht, The Netherlands, 2013; pp. 105–122. [Google Scholar]
- Franzoni, C.; Sauermann, H. Crowd science: The organization of scientific research in open collaborative projects. Res. Policy 2010, 43, 1–20. [Google Scholar] [CrossRef] [Green Version]
- Eitzel, M.V.; Cappadonna, J.L.; Santos-Lang, C.; Duerr, R.E.; Virapongse, A.; West, S.E.; Kyba, C.C.M.; Bowser, A.; Cooper, C.B.; Sforzi, A.; et al. Citizen Science Terminology Matters: Exploring Key Terms. Citiz. Sci. Theory Pract. 2017, 2, 1. [Google Scholar] [CrossRef] [Green Version]
- Strasser, B.J.; Baudry, J.; Mahr, D.; Sanchez, G.; Tancoigne, E. “Citizen Science”? Rethinking Science and Public Participation. Sci. Technol. Stud. 2019, 32, 52–76. [Google Scholar] [CrossRef]
- Gura, T. Amateur experts. Nature 2013, 496, 259–261. Available online: https://0-www-nature-com.brum.beds.ac.uk/articles/nj7444-259a.pdf (accessed on 26 April 2021). [CrossRef] [PubMed] [Green Version]
- Miller-Rushing, A.; Primack, R.; Bonney, R. The history of public participation in ecological research. Front. Ecol. Environ. 2012, 10, 285–290. [Google Scholar] [CrossRef]
- Silvertown, J. A new dawn for citizen science. Trends Ecol. Evol. 2009, 24, 467–471. [Google Scholar] [CrossRef] [PubMed]
- Bonney, R.; Shirk, J.L.; Phillips, T.B.; Wiggins, A.; Ballard, H.L.; Miller-Rushing, A.J.; Parrish, J.K. Next Steps for Citizen Science. Science 2014, 343, 1436–1437. [Google Scholar] [CrossRef]
- Telenius, A. Biodiversity information goes public: GBIF at your service. Nord. J. Bot. 2011, 29, 378–381. [Google Scholar] [CrossRef]
- Waller, J. Will citizen science take over? 2019. Available online: https://data-blog.gbif.org/post/gbif-citizen-science-data/ (accessed on 26 April 2021).
- Poisson, A.C.; McCullough, I.N.; Cheruvelil, K.S.; Elliott, K.C.; Latimore, J.A.; Soranno, P.A. Quantifying the contribution of citizen science to broad-scale ecological databases. Front. Ecol. Environ. 2020, 18, 19–26. [Google Scholar] [CrossRef]
- Roy, H.E.; Pocock, M.J.O.; Preston, C.D.; Roy, D.B.; Savage, J.; Tweddle, J.C.; Robinson, L.D. Understanding Citizen Science and Environmental Monitoring; Final Report on behalf of UK Environmental Observation Framework. NERC Centre for Ecology & Hydrology and Natural History Museum. 2012. Available online: https://www.ceh.ac.uk/sites/default/files/citizensciencereview.pdf (accessed on 26 April 2021).
- Foster-Smith, J.; Evans, S.M. The value of marine ecological data collected by volunteers. Biol. Conserv. 2003, 113, 199–213. [Google Scholar] [CrossRef]
- Paulos, E. Designing for Doubt: Citizen Science and the Challenge of Change. In Engaging Data: First International Forum on the Application and Management of Personal Electronic Information; MIT: Cambridge, MA, USA, 2009; Available online: https://citeseerx.ist.psu.edu/viewdoc/download?doi=10.1.1.187.5824&rep=rep1&type=pdf (accessed on 26 April 2021).
- Delaney, D.G.; Sperling, C.D.; Adams, C.S.; Leung, B. Marine invasive species: Validation of citizen science and implications for national monitoring networks. Biol. Invasions 2008, 10, 117–128. [Google Scholar] [CrossRef]
- Jordan, R.C.; Brooks, W.R.; Howe, D.V.; Ehrenfeld, J.G. Evaluating the performance of volunteers in mapping invasive plants in public conservation lands. Environ. Manage. 2012, 49, 425–434. [Google Scholar] [CrossRef] [PubMed]
- Lewandowski, E.; Specht, H. Influence of volunteer and project characteristics on data quality of biological surveys. Conserv. Biol. 2015, 29, 713–723. [Google Scholar] [CrossRef] [PubMed]
- Kosmala, M.; Wiggins, A.; Swanson, A.; Simmons, B. Assessing data quality in citizen science. Front. Ecol. Environ. 2016, 14, 551–560. [Google Scholar] [CrossRef] [Green Version]
- De Felici, S.; Mazzei, P.; Sbordoni, V.; Cesaroni, D. Scientists by chance: Reliability of non-structured primary biodiversity data. Insights from Italian Forums of Natural Sciences. Biogeogr. J. Integr. Biogeogr. 2021, 36. [Google Scholar] [CrossRef]
- Fraisl, D.; Campbell, J.; See, L.; Wehn, U.; Wardlaw, J.; Gold, M.; Moorthy, I.; Arias, R.; Piera, J.; Oliver, J.L.; et al. Mapping citizen science contributions to the UN sustainable development goals. Sustain. Sci. 2020, 15, 1735–1751. [Google Scholar] [CrossRef]
- Mugdal, S.; Turbe, A.; Sanz, F.; Barba, J.; Pelacho, M.; Serrano-Sanz, F.; Robinson, L.; Gold, M. Citizen Science for Environmental Policy: Development of an EU-Wide Inventory and Analysis of Selected Practices; Final Report for the European Commission; DG Environment under the Contract 070203/2017/768879/ETU/ENV.A.3, Bio Innovation Service, in Collaboration with Fundacion Ibercivis and The Natural History Museum, November 2018. Available online: https://op.europa.eu/en/publication-detail/-/publication/842b73e3-fc30-11e8-a96d-01aa75ed71a1/language-en (accessed on 20 August 2021).
- Ballerini, L.; Bergh, S.I. Using citizen science data to monitor the Sustainable Development Goals: A bottom-up analysis. Sustain. Sci. 2021. [Google Scholar] [CrossRef]
- Asingizwe, D.; Poortvliet, P.M.; Koenraadt, C.J.M.; van Vliet, A.J.H.; Ingabire, C.M.; Mutesa, L.; Leeuwis, C. Why (not) participate in citizen science? Motivational factors and barriers to participate in a citizen science program for malaria control in Rwanda. PLoS ONE 2020, 15, e0237396. [Google Scholar] [CrossRef]
- Larson, L.R.; Cooper, C.B.; Futch, S.; Singh, D.; Shipley, N.J.; Dale, K.; LeBaron, G.S.; Takekawa, J.Y. The diverse motivations of citizen scientists: Does conservation emphasis grow as volunteer participation progresses? Biol. Conserv. 2020, 242, 108428. [Google Scholar] [CrossRef]
- Kragh, G. The motivation of volunteers in Citizen Science; They walk among us: The rise of citizen science. Environ. Sci. 2016, 25, 32–35. Available online: https://www.the-ies.org/sites/default/files/journals/es_citizen_science_aug_16.pdf (accessed on 26 April 2021).
- Brouwer, S.; Hessels, L.K. Increasing research impact with citizen science: The influence of recruiting strategies on sample diversity. Public Underst. Sci. 2019, 28, 606–621. [Google Scholar] [CrossRef]
- Galloway, A.W.; Tudor, M.T.; Haegen, W.M.V. The Reliability of Citizen Science: A Case Study of Oregon White Oak Stand Surveys. Wildlife Soc. B. 2006, 34, 1425–1429. [Google Scholar] [CrossRef]
- Seymour, V.; Haklay, M. Exploring Engagement Characteristics and Behaviours of Environmental Volunteers. Citiz. Sci. Theory Pract. 2017, 2, 5. [Google Scholar] [CrossRef]
- Crimmins, T.M.; Weltzin, J.F.; Rosemartin, A.H.; Surina, E.M.; Marsh, L.; Denny, E.G. Focused campaign increases activity among participants in Nature’s Notebook, a citizen science project. Nat. Sci. Educ. 2014, 43, 64–72. [Google Scholar] [CrossRef]
- Sauermann, H.; Franzoni, C. Crowd science user contribution patterns and their implications. Proc. Natl. Acad. Sci. USA 2015, 112, 679–684. [Google Scholar] [CrossRef] [PubMed] [Green Version]
- Andow, D.A.; Borgida, E.; Hurley, T.M.; Williams, A.L. Recruitment and Retention of Volunteers in a Citizen Science Network to Detect Invasive Species on Private Lands. Environ. Manag. 2016, 58, 606–618. [Google Scholar] [CrossRef] [PubMed]
- Crall, A.; Kosmala, M.; Cheng, R.; Brier, J.; Cavalier, D.; Henderson, S.; Richardson, A. Volunteer recruitment and retention in online citizen science projects using marketing strategies: Lessons from Season Spotter. J. Sci. Commun. 2017, 16, A01. [Google Scholar] [CrossRef] [Green Version]
- Ang, A.; Jabbar, S.; D’Rozario, V.; Lakshminarayanan, J. Citizen Science Program for Critically Endangered Primates: A Case Study from Singapore. Primate Conserv. 2021, 35. Available online: http://www.primate-sg.org/storage/pdf/PC35_Ang_et_al_Citizen_science.pdf (accessed on 26 April 2021).
- Arienzo, M.M.; Collins, M.; Jennings, K.S. Enhancing Engagement of Citizen Scientists to Monitor Precipitation Phase. Front. Earth Sci. 2021, 9, 617594. [Google Scholar] [CrossRef]
- Martellos, S.; Attorre, F.; De Felici, S.; Cesaroni, D.; Sbordoni, V.; Blasi, C.; Nimis, P.L. Plant sciences and the Italian National Biodiversity Network. Plant Biosyst. 2011, 145, 758–761. [Google Scholar] [CrossRef]
- Carpaneto, G.M.; Campanaro, A.; Hardersen, S.; Audisio, P.; Bologna, M.A.; Roversi, P.F.; Sabbatini Peverieri, G.; Mason, F. The LIFE Project “Monitoring of insects with public participation” (MIPP): Aims, methods and conclusions. Nat. Conserv. 2017, 20, 1–35. [Google Scholar] [CrossRef]
- Parrish, J.K.; Jones, T.; Burgess, H.K.; He, Y.; Fortson, L.; Cavalier, D. Hoping for optimality or designing for inclusion: Persistence, learning, and the social network of citizen science. Proc. Natl. Acad. Sci. USA 2019, 116, 1894–1901. [Google Scholar] [CrossRef] [PubMed] [Green Version]
- Jacobson, S.K.; Carlton, J.S.; Monroe, M.C. Motivation and Satisfaction of Volunteers at a Florida Natural Resource Agency. J. Park Recreat. Admin. 2012, 30, 51–67. Available online: https://citeseerx.ist.psu.edu/viewdoc/download?doi=10.1.1.1040.9631&rep=rep1&type=pdf (accessed on 26 April 2021).
- West, S.; Pateman, R. Recruiting and Retaining Participants in Citizen Science: What Can Be Learned from the Volunteering Literature? Citiz. Sci. Theory Pract. 2016, 1, 15. [Google Scholar] [CrossRef] [Green Version]


| M 1–36 Period | M 37–72 Period | Overall Period | |
|---|---|---|---|
| Duration months | 36 | 36 | 72 |
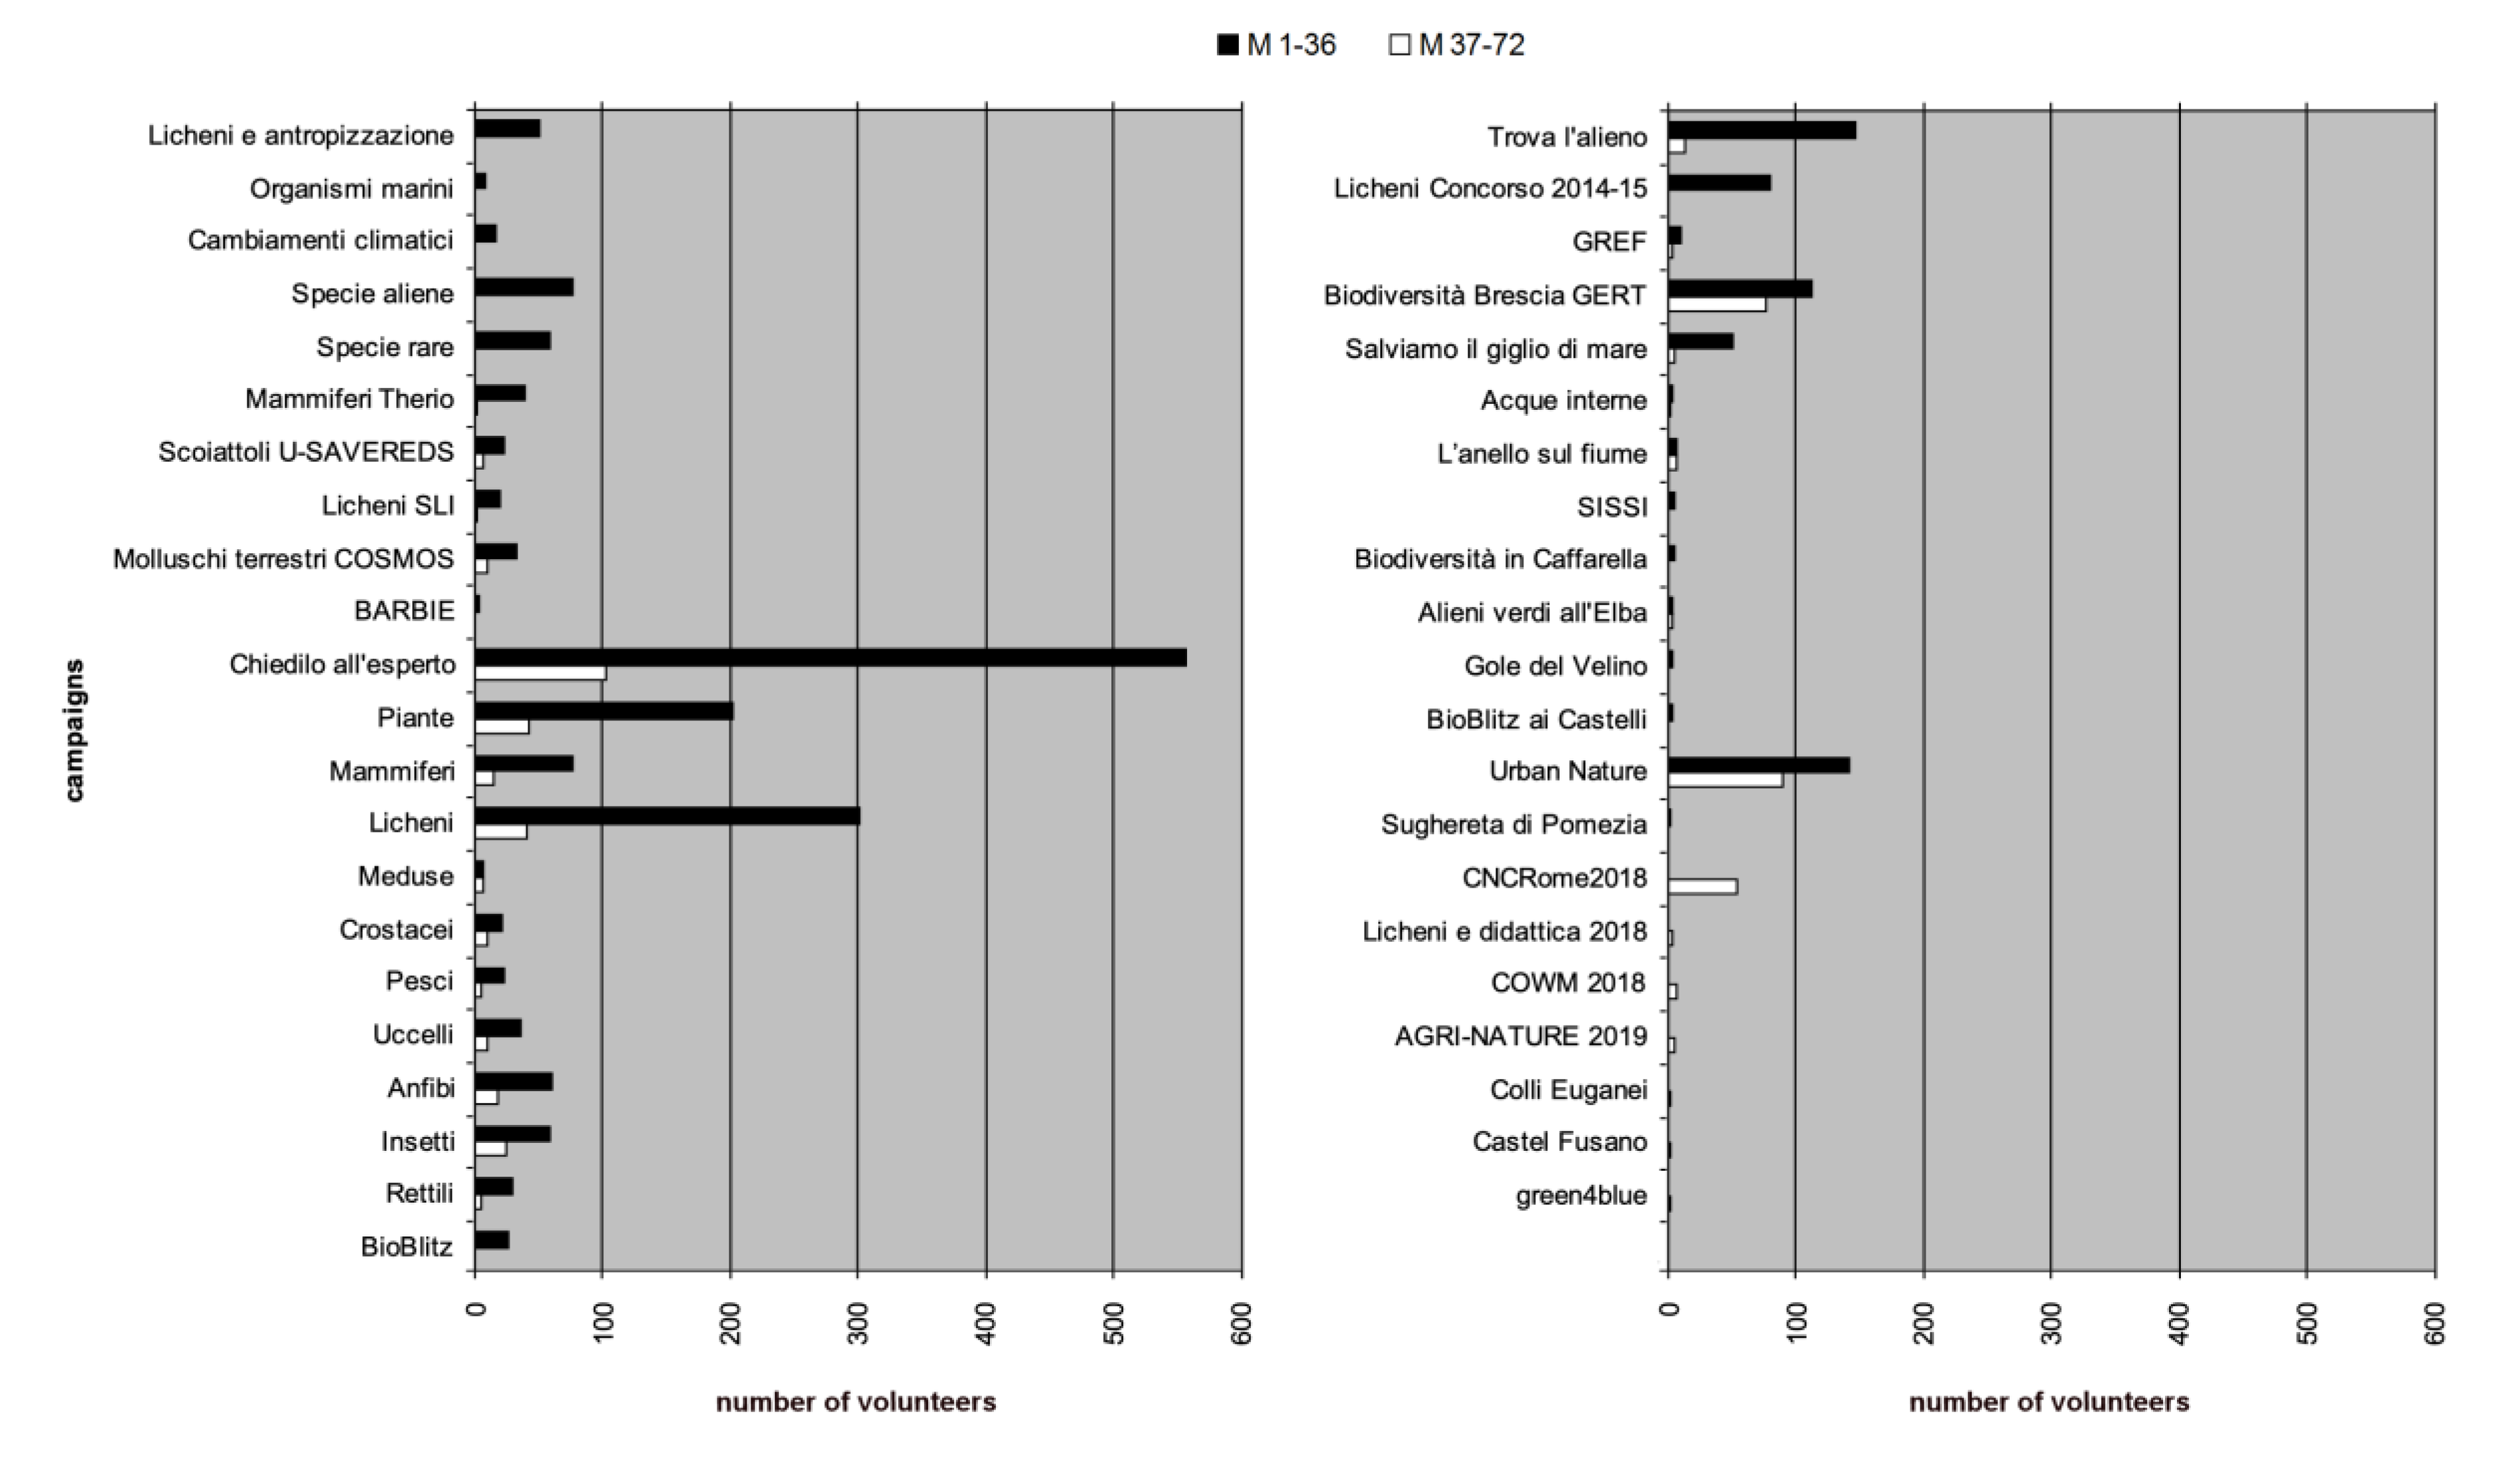
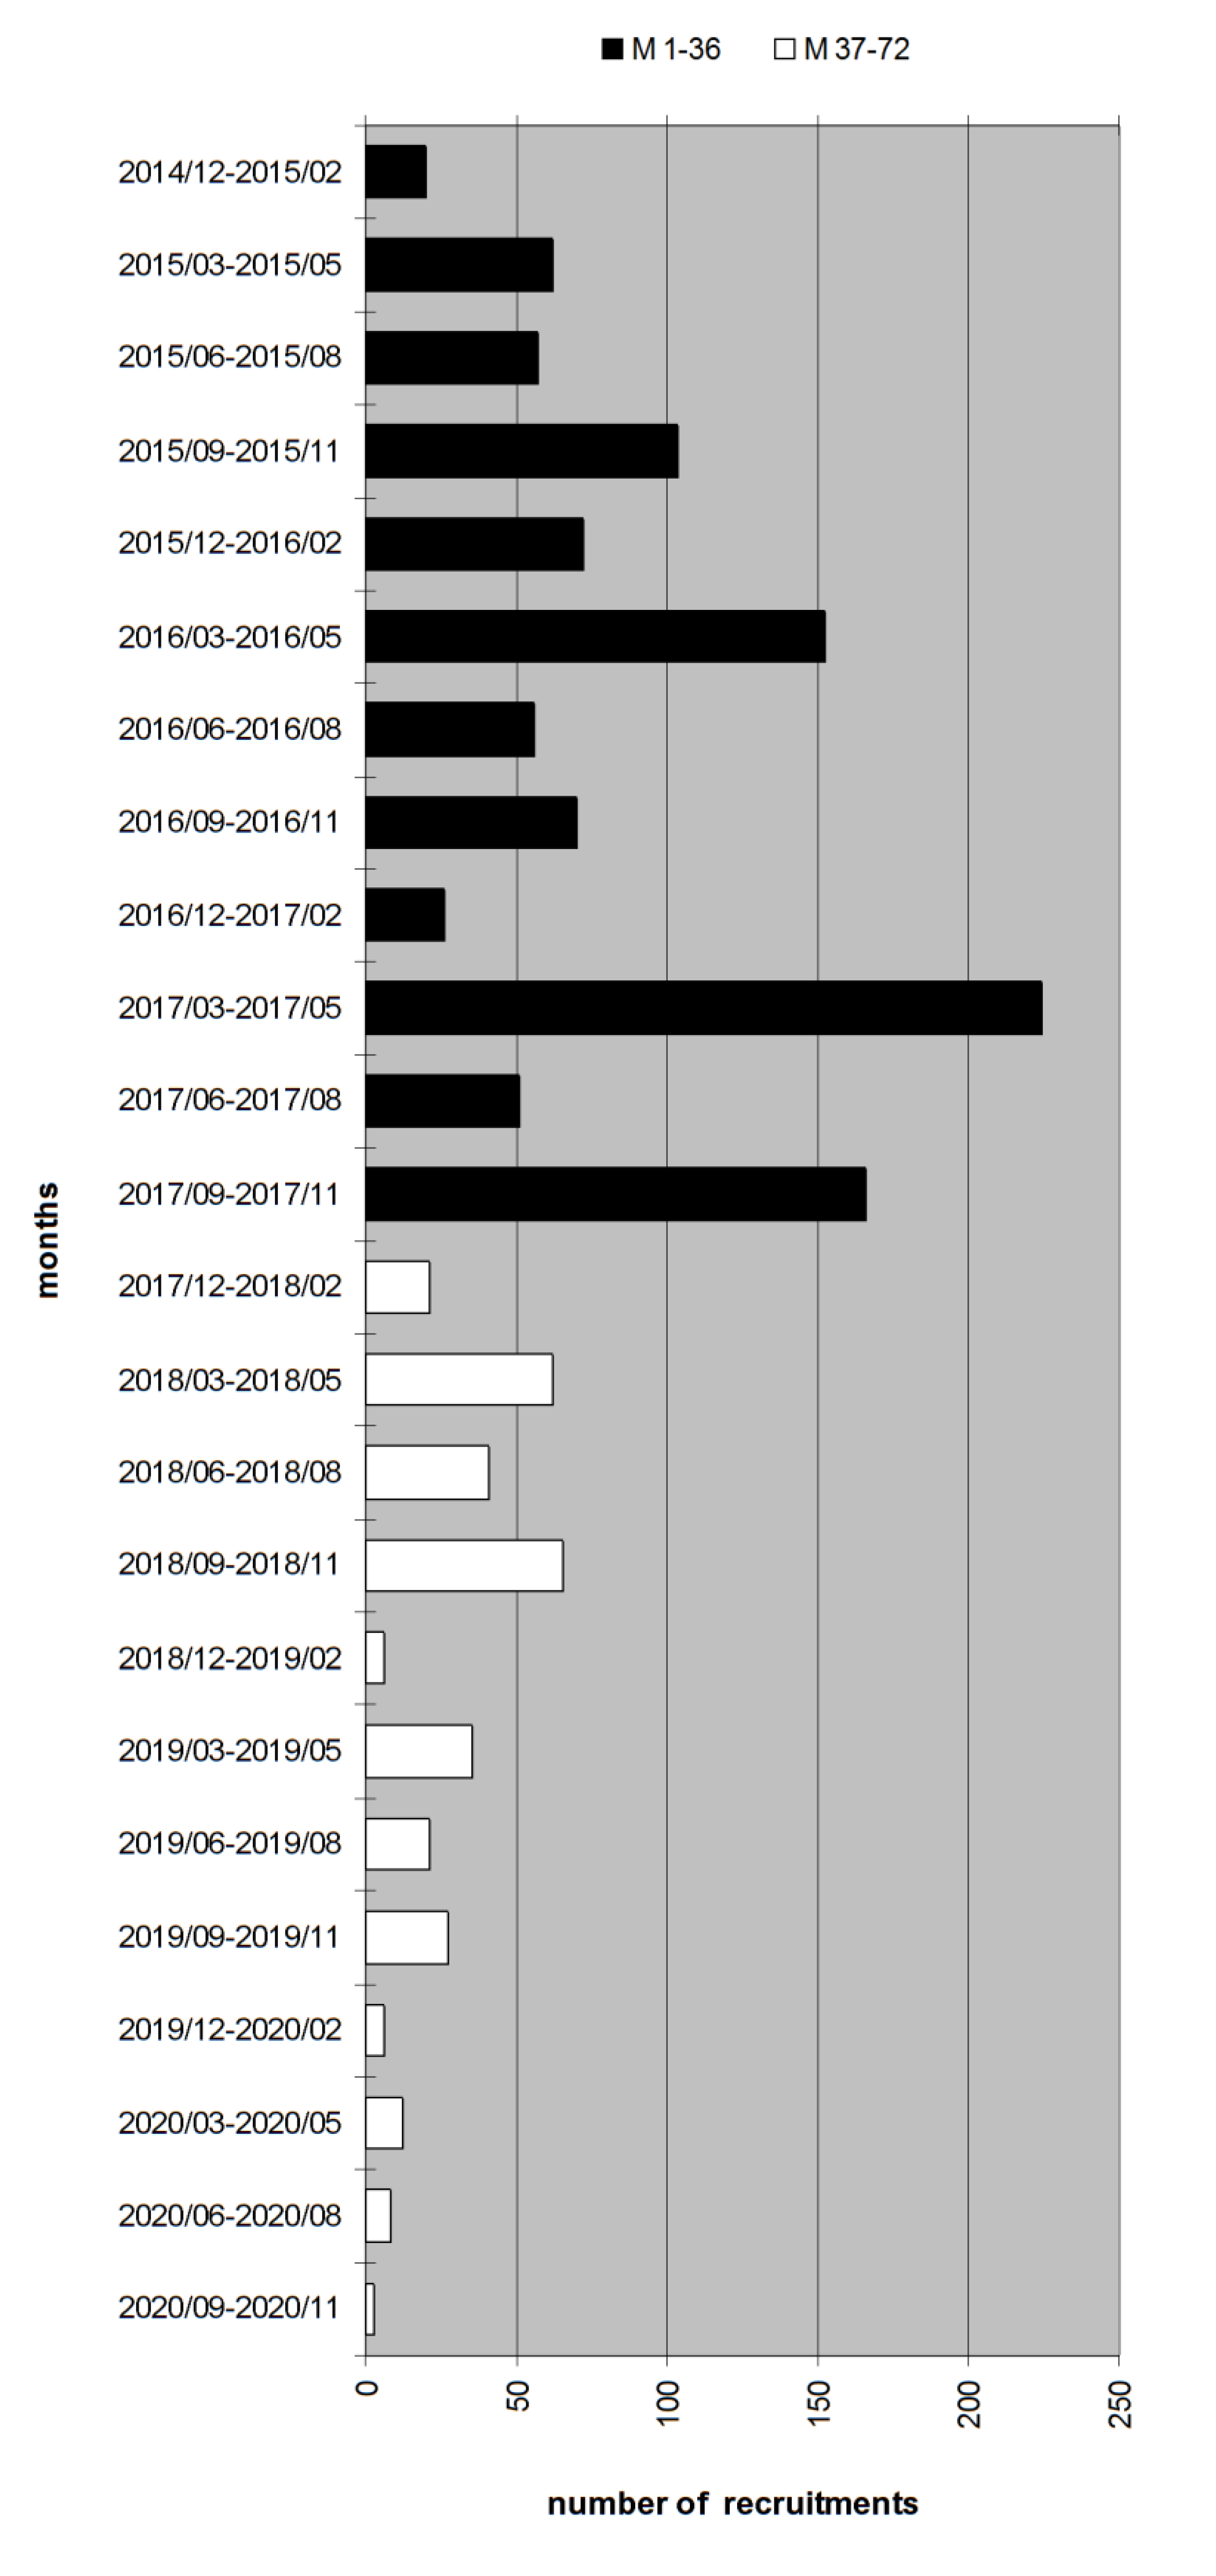
| Volunteers | 1485 | 445 (78 retained, 367 new) | 1852 |
| Active campaigns | 36 | 30 (23 continuing, 7 new) | 43 |
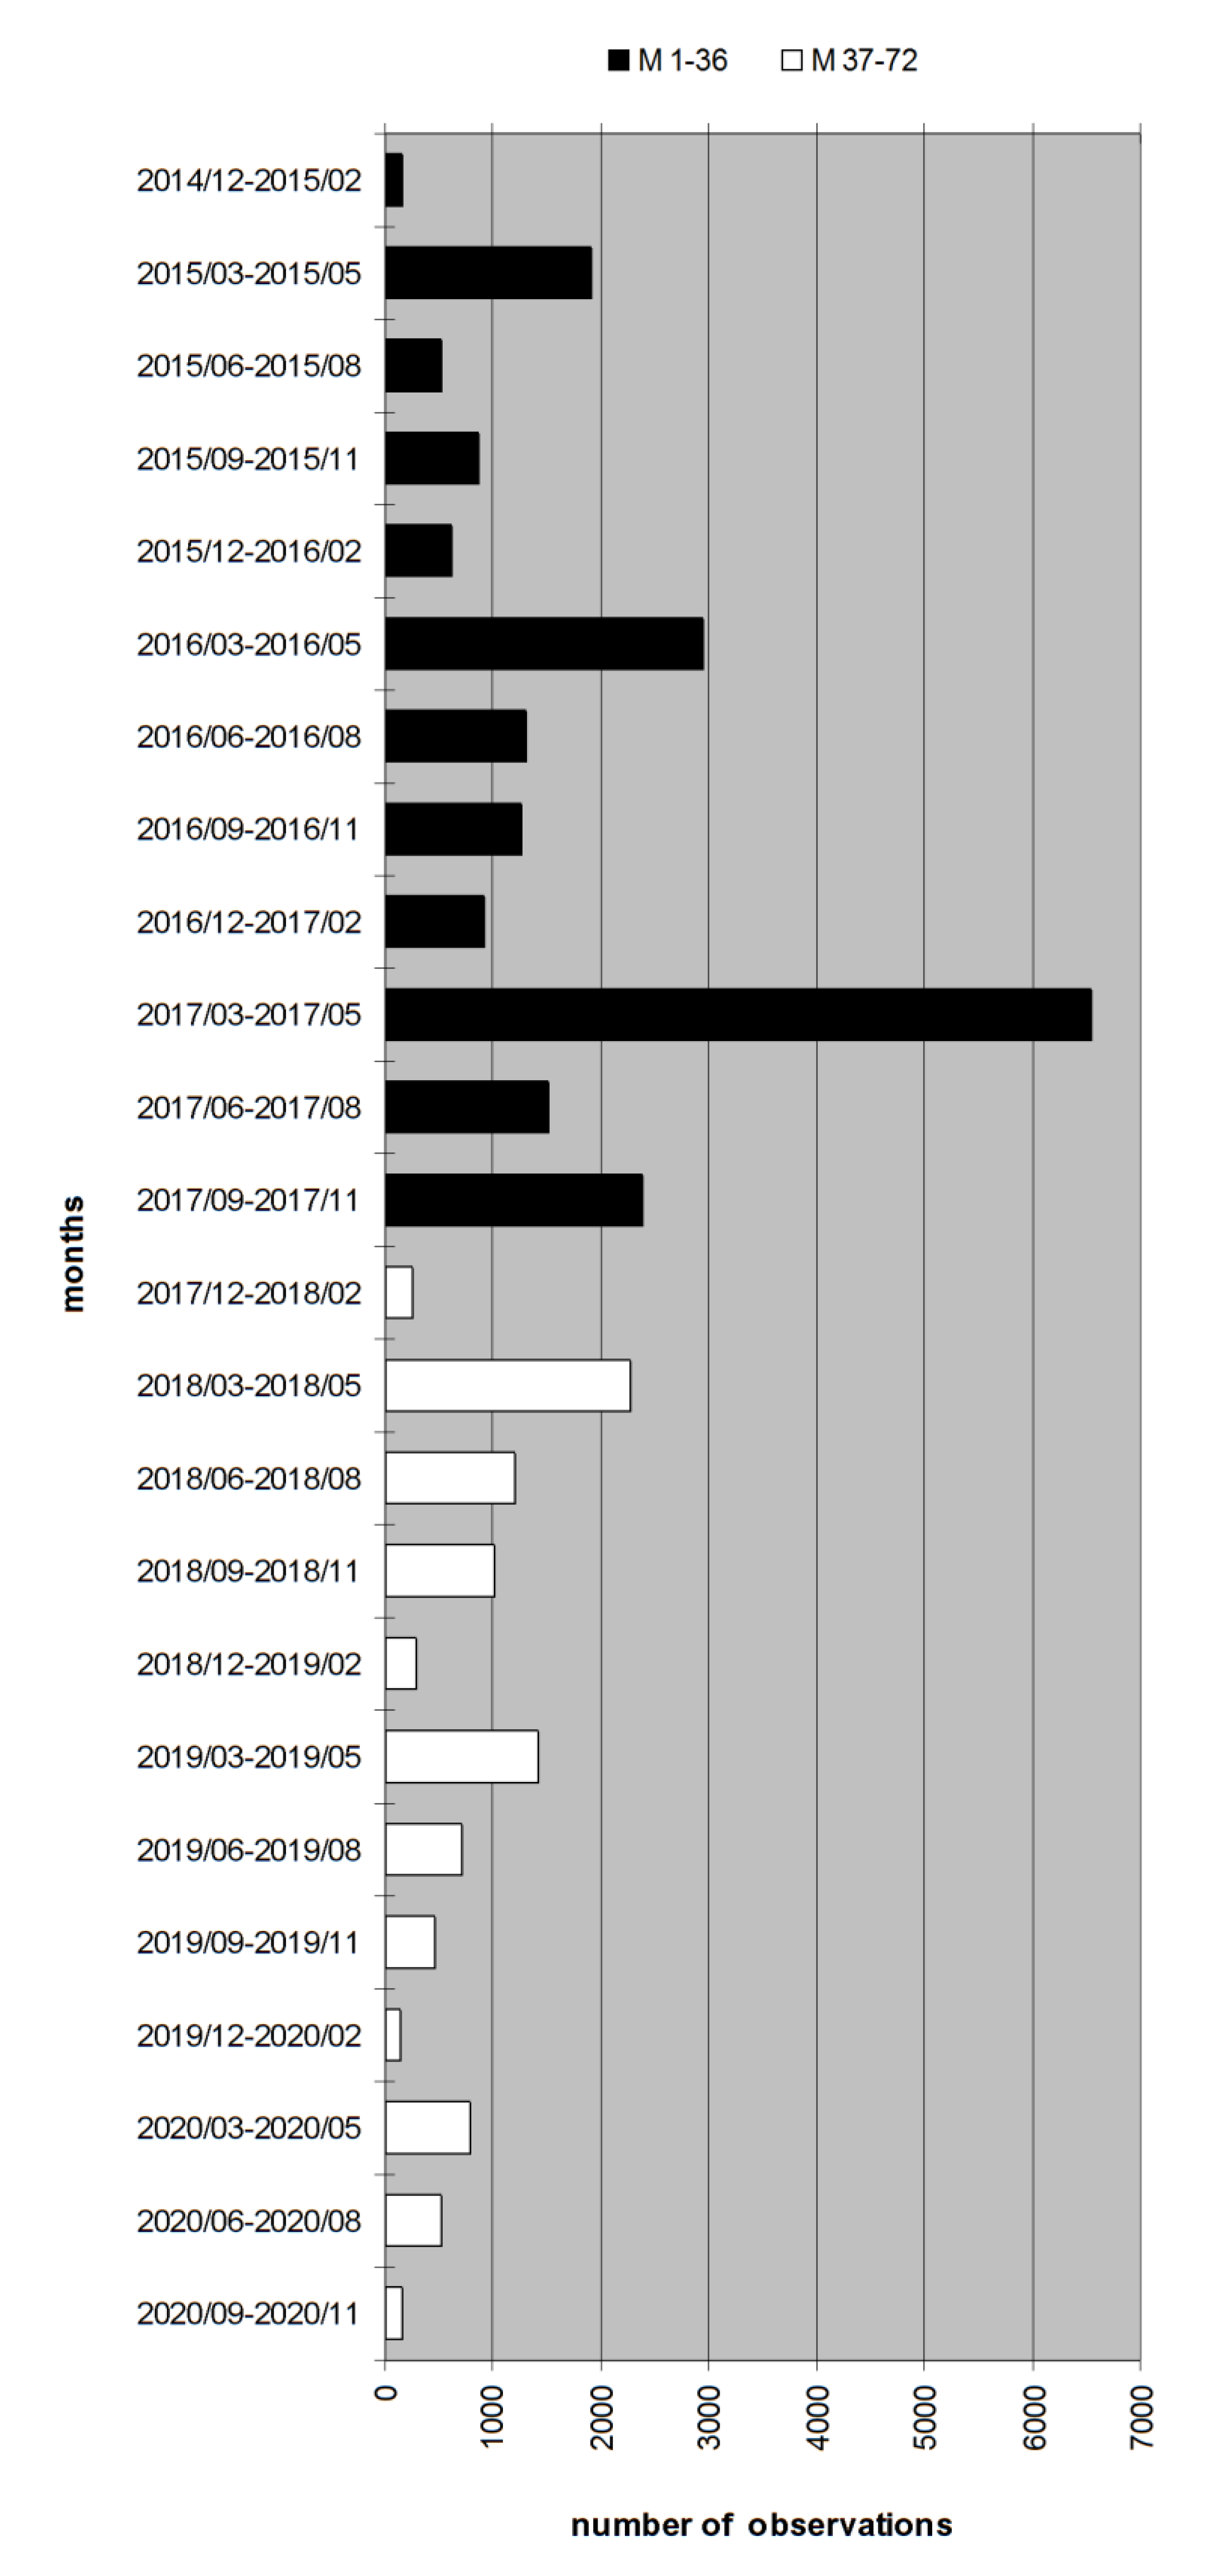
| Total observations | 20,888 | 9174 | 30,062 |
| Correct observations | 15,836 (76%) | 7691 (84%) | 23,527 (78%) |
| Wrong observations | 4431 (21%) | 654 (7%) | 5085 (17%) |
| Uncertain observations | 621 (3%) | 829 (9%) | 1450 (5%) |
| Campaign | Number of Observations in Periods | Increase of Observations in M 37–72 (%) | |||
|---|---|---|---|---|---|
| ID | Name | M 1–36 | M 37–72 | Overall | |
| 1 | Licheni e antropizzazione (Lichens and anthropization) | 427 | 427 | ||
| 6 | Organismi marini (Marine organisms) | 24 | 24 | ||
| 13 | Cambiamenti climatici (Climate changes) | 28 | 28 | ||
| 14 | Specie aliene (Alien species) | 884 | 884 | ||
| 15 | Specie rare (Rare species) | 149 | 149 | ||
| 16 | Mammiferi Therio (Mammals Therio) | 101 | 2 | 103 | 2 |
| 17 | Scoiattoli U-SAVEREDS (Squirrels U-SAVEREDS) | 61 | 7 | 68 | 11 |
| 18 | Licheni SLI (Lichens SLI) | 34 | 1 | 35 | 3 |
| 21 | Molluschi terrestri COSMOS (Terrestrial molluscs) | 82 | 17 | 99 | 21 |
| 23 | BARBIE | 3 | 3 | ||
| 25 | Chiedilo all’esperto (Ask the expert) | 3836 | 738 | 4574 | 19 |
| 26 | Piante (Plants) | 1088 | 165 | 1253 | 15 |
| 27 | Mammiferi (Mammals) | 143 | 17 | 160 | 12 |
| 29 | Licheni (Lichens) | 6462 | 307 | 6769 | 5 |
| 30 | Meduse (Jellyfish) | 11 | 7 | 18 | 64 |
| 31 | Crostacei (Crustaceans) | 23 | 13 | 36 | 57 |
| 32 | Pesci (Fish) | 45 | 5 | 50 | 11 |
| 33 | Uccelli (Birds) | 75 | 17 | 92 | 23 |
| 34 | Anfibi (Amphibians) | 119 | 22 | 141 | 18 |
| 35 | Insetti (Insects) | 123 | 33 | 156 | 27 |
| 36 | Rettili (Reptiles) | 48 | 8 | 56 | 17 |
| 38 | BioBlitz | 468 | 468 | ||
| 39 | Trova l’alieno (Find the alien) | 1132 | 21 | 1153 | 2 |
| 40 | Licheni Concorso 2014-15 (Lichens Contest 2014-15) | 535 | 535 | ||
| 42 | GREF | 395 | 32 | 427 | 8 |
| 43 | Biodiversità Brescia GERT (Biodiversity in Brescia) | 2750 | 5572 | 8322 | 203 |
| 44 | Salviamo il giglio di mare (Let’s save the sea daffodil) | 130 | 6 | 136 | 5 |
| 45 | Acque interne (Inland waters) | 7 | 1 | 8 | 14 |
| 46 | L’anello sul fiume (The ring on the river) | 120 | 10 | 130 | 8 |
| 50 | SISSI | 12 | 12 | ||
| 52 | Biodiversità in Caffarella (Biodiversity in Caffarella) | 86 | 86 | ||
| 53 | Alieni verdi all’Elba (Green aliens on Elba) | 5 | 5 | 10 | 100 |
| 54 | Gole del Velino (Gorges of Velino) | 54 | 54 | ||
| 56 | BioBlitz ai Castelli (BioBlitz at the Castelli) | 7 | 7 | ||
| 58 | Urban Nature | 1419 | 608 | 2027 | 43 |
| 60 | Sughereta di Pomezia | 2 | 2 | ||
| 61 | CNCRome2018 | 1471 | 1471 | ||
| 62 | Licheni e didattica 2018 (Lichens and teaching 2018) | 15 | 15 | ||
| 63 | COWM 2018 | 48 | 48 | ||
| 64 | AGRI-NATURE 2019 | 13 | 13 | ||
| 65 | Colli Euganei | 7 | 7 | ||
| 66 | Castel Fusano | 4 | 4 | ||
| 68 | green4blue | 2 | 2 | ||
| Campaign | Months of Activity | Range of Activity | |||||
|---|---|---|---|---|---|---|---|
| ID | Name | M 1–36 | M 37–72 | Overall | Months | Started | Ended |
| 1 | Licheni e antropizzazione | 13 | 0 | 13 | 17 | M1 | M20 |
| 6 | Organismi marini | 4 | 0 | 4 | 6 | M1 | M20 |
| 13 | Cambiamenti climatici | 5 | 0 | 5 | 7 | M1 | M20 |
| 14 | Specie aliene | 13 | 0 | 13 | 17 | M1 | M20 |
| 15 | Specie rare | 9 | 0 | 9 | 20 | M1 | M20 |
| 16 | Mammiferi Therio | 21 | 2 | 23 | 54 | M2 | ongoing |
| 17 | Scoiattoli U-SAVEREDS | 20 | 5 | 25 | 65 | M3 | ongoing |
| 18 | Licheni SLI | 7 | 1 | 8 | 36 | M4 | ongoing |
| 21 | Molluschi terrestri COSMOS | 25 | 11 | 36 | 61 | M6 | ongoing |
| 23 | BARBIE | 2 | 0 | 2 | 2 | M9 | ongoing |
| 25 | Chiedilo all’esperto | 28 | 29 | 57 | 63 | M10 | ongoing |
| 26 | Piante | 26 | 23 | 49 | 61 | M11 | ongoing |
| 27 | Mammiferi | 26 | 12 | 38 | 61 | M11 | ongoing |
| 29 | Licheni | 24 | 26 | 50 | 61 | M11 | ongoing |
| 30 | Meduse | 7 | 6 | 13 | 32 | M11 | ongoing |
| 31 | Crostacei | 15 | 9 | 24 | 63 | M11 | ongoing |
| 32 | Pesci | 13 | 5 | 18 | 63 | M11 | ongoing |
| 33 | Uccelli | 20 | 9 | 29 | 59 | M11 | ongoing |
| 34 | Anfibi | 25 | 10 | 35 | 56 | M11 | ongoing |
| 35 | Insetti | 23 | 14 | 37 | 61 | M11 | ongoing |
| 36 | Rettili | 14 | 5 | 19 | 47 | M11 | ongoing |
| 38 | BioBlitz | 2 | 0 | 2 | 24 | M11 | ongoing |
| 39 | Trova l’alieno | 25 | 10 | 35 | 56 | M11 | ongoing |
| 40 | Licheni Concorso 2014-15 | 9 | 0 | 9 | 11 | M11 | M21 |
| 42 | GREF | 16 | 7 | 23 | 47 | M14 | ongoing |
| 43 | Biodiversità Brescia GERT | 20 | 36 | 56 | 56 | M16 | ongoing |
| 44 | Salviamo il giglio di mare | 11 | 5 | 16 | 49 | M19 | ongoing |
| 45 | Acque interne | 3 | 1 | 4 | 26 | M20 | ongoing |
| 46 | L’anello sul fiume | 3 | 5 | 8 | 32 | M26 | ongoing |
| 50 | SISSI | 7 | 0 | 7 | 9 | M28 | ongoing |
| 52 | Biodiversità in Caffarella | 4 | 0 | 4 | 6 | M29 | ongoing |
| 53 | Alieni verdi all’Elba | 3 | 2 | 5 | 16 | M30 | ongoing |
| 54 | Gole del Velino | 3 | 0 | 3 | 3 | M30 | ongoing |
| 56 | BioBlitz ai Castelli | 2 | 0 | 2 | 2 | M30 | ongoing |
| 58 | Urban Nature | 2 | 16 | 18 | 38 | M30 | ongoing |
| 60 | Sughereta di Pomezia | 1 | 0 | 1 | 1 | M30 | M35 |
| 61 | CNCRome2018 | 0 | 9 | 9 | 14 | M40 | ongoing |
| 62 | Licheni e didattica 2018 | 0 | 4 | 4 | 7 | M46 | M56 |
| 63 | COWM 2018 | 0 | 1 | 1 | 1 | M48 | M49 |
| 64 | AGRI-NATURE 2019 | 0 | 3 | 3 | 3 | M54 | ongoing |
| 65 | Colli Euganei | 0 | 4 | 4 | 8 | M60 | ongoing |
| 66 | Castel Fusano | 0 | 2 | 2 | 2 | M60 | ongoing |
| 68 | green4blue | 0 | 1 | 1 | 1 | M71 | ongoing |
| Retention Groups | <=1950 | 1951–1960 | 1961–1970 | 1971–1980 | 1981–1990 | 1991–2000 | 2001–2008 | Total | p |
|---|---|---|---|---|---|---|---|---|---|
| 1 | 16 57.14% | 70 560.87% | 128 562.75% | 201 575.28% | 111 566.87% | 201 574.17% | 268 583.23% | 995 572.47% | <0.001 |
| 2–5 | 1 53.57% | 17 514.78% | 32 515.69% | 28 510.49% | 33 519.88% | 50 518.45% | 47 514.60% | 208 515.15% | 0.047 |
| 6–10 | 4 514.29% | 7 56.09% | 10 54.90% | 9 53.37% | 8 54.82% | 7 52.58% | 2 50.62% | 47 53.42% | <0.001 |
| 11–20 | 2 57.14% | 11 59.57% | 16 57.84% | 18 56.74% | 8 54.82% | 3 51.11% | 4 51.24% | 62 54.52% | <0.001 |
| 21–30 | 0 50% | 3 52.61% | 8 53.92% | 6 52.25% | 2 51.20% | 3 51.11% | 0 50% | 22 51.60% | 0.023 |
| >30 | 5 517.86% | 7 56.09% | 10 54.90% | 5 51.87% | 4 52.41% | 7 52.58% | 1 50.31% | 39 52.84% | <0.001 |
| Total | 28 52.04% | 115 58.38% | 204 514.86% | 267 519.45% | 166 512.09% | 271 519.74% | 322 523.45% | 1373 5100% |
| Age Classes | % of Correct Observations | Increase of Observations in M 37–72 (%) | Volunteers Retained from M 1–36 (%) | Increase of Volunteers in M 37–72 (%) | ||
|---|---|---|---|---|---|---|
| M 1–36 | M 37–72 | Overall | ||||
| <=1950 | 86.63 | 97.99 | 96.74 | 724.42 | 31.25 | 62.50 |
| 1951–1960 | 89.58 | 98.96 | 94.82 | 121.07 | 6.59 | 24.44 |
| 1961–1970 | 88.97 | 85.09 | 88.04 | 36.66 | 11.18 | 31.58 |
| 1971–1980 | 74.56 | 82.30 | 76.56 | 34.34 | 4.57 | 35.53 |
| 1981–1990 | 85.77 | 91.15 | 86.95 | 27.63 | 10.00 | 26.15 |
| 1991–2000 | 78.77 | 86.30 | 81.22 | 46.89 | 4.05 | 18.47 |
| 2001–2008 | 63.56 | 77.75 | 65.69 | 17.69 | 2.51 | 33.05 |
| p | <0.001 | <0.001 | ||||
| Retention Groups | % of Correct Observations |
|---|---|
| 1 | 70.53 |
| 2–5 | 74.97 |
| 6–10 | 87.95 |
| 11–20 | 90.14 |
| 21–30 | 92.20 |
| >30 | 96.70 |
| Genus | Observations | ||||||
|---|---|---|---|---|---|---|---|
| Correct | Wrong | Uncertain | Total | ||||
| n | % | n | % | n | % | n | |
| Xanthoria | 3443 | 86% | 554 | 14% | 2 | 0% | 3999 |
| Flavoparmelia | 1519 | 45% | 1864 | 55% | 3 | 0% | 3386 |
| Ailanthus | 1428 | 93% | 115 | 7% | 0 | 0% | 1543 |
| Robinia | 862 | 91% | 86 | 9% | 0 | 0% | 948 |
| Hedera | 371 | 91% | 37 | 9% | 0 | 0% | 408 |
| Evernia | 174 | 47% | 193 | 52% | 3 | 1% | 370 |
| Opuntia | 340 | 94% | 21 | 6% | 0 | 0% | 361 |
| Phytolacca | 234 | 98% | 6 | 3% | 0 | 0% | 240 |
| Trachemys | 211 | 92% | 15 | 7% | 4 | 2% | 230 |
| Parmotrema | 16 | 7% | 199 | 91% | 4 | 2% | 219 |
| Podarcis | 166 | 92% | 14 | 8% | 1 | 1% | 181 |
| Psittacula | 133 | 80% | 31 | 19% | 3 | 2% | 167 |
| Ruscus | 161 | 98% | 4 | 2% | 0 | 0% | 165 |
| Crataegus | 94 | 60% | 63 | 40% | 0 | 0% | 157 |
| Diploicia | 22 | 14% | 135 | 86% | 0 | 0% | 157 |
| Quercus | 143 | 92% | 13 | 8% | 0 | 0% | 156 |
| Myopsitta | 139 | 90% | 10 | 6% | 6 | 4% | 155 |
| Pancratium | 155 | 100% | 0 | 0% | 0 | 0% | 155 |
| Vanessa | 103 | 71% | 40 | 28% | 2 | 1% | 145 |
| Apis | 84 | 58% | 59 | 41% | 1 | 1% | 144 |
| Carpobrotus | 109 | 89% | 12 | 10% | 1 | 1% | 122 |
| Acer | 117 | 98% | 2 | 2% | 0 | 0% | 119 |
| Pinus | 83 | 74% | 29 | 26% | 0 | 0% | 112 |
| Anas | 102 | 99% | 1 | 1% | 0 | 0% | 103 |
| Sciurus | 94 | 91% | 8 | 8% | 1 | 1% | 103 |
Publisher’s Note: MDPI stays neutral with regard to jurisdictional claims in published maps and institutional affiliations. |
© 2021 by the authors. Licensee MDPI, Basel, Switzerland. This article is an open access article distributed under the terms and conditions of the Creative Commons Attribution (CC BY) license (https://creativecommons.org/licenses/by/4.0/).
Share and Cite
Martellos, S.; Pittao, E.; Cesaroni, D.; Mereu, A.; Petruzzella, D.; Pinzari, M.; Sbordoni, V.; Tallone, G.; Attorre, F. Volunteers Recruitment, Retention, and Performance during the CSMON-LIFE (Citizen Science MONitoring) Project and 3 Years of Follow-Up. Sustainability 2021, 13, 11110. https://0-doi-org.brum.beds.ac.uk/10.3390/su131911110
Martellos S, Pittao E, Cesaroni D, Mereu A, Petruzzella D, Pinzari M, Sbordoni V, Tallone G, Attorre F. Volunteers Recruitment, Retention, and Performance during the CSMON-LIFE (Citizen Science MONitoring) Project and 3 Years of Follow-Up. Sustainability. 2021; 13(19):11110. https://0-doi-org.brum.beds.ac.uk/10.3390/su131911110
Chicago/Turabian StyleMartellos, Stefano, Elena Pittao, Donatella Cesaroni, Alessio Mereu, Damiano Petruzzella, Manuela Pinzari, Valerio Sbordoni, Giuliano Tallone, and Fabio Attorre. 2021. "Volunteers Recruitment, Retention, and Performance during the CSMON-LIFE (Citizen Science MONitoring) Project and 3 Years of Follow-Up" Sustainability 13, no. 19: 11110. https://0-doi-org.brum.beds.ac.uk/10.3390/su131911110