Article

Comparison of Stress Fields near Longitudinal Construction Joints of Tied and Doweled Sections in Portland Cement Concrete Pavements

1
Department of Civil and Environmental Engineering, Chung-Ang University, Seoul 06974, Korea
2
Civil Engineering Program, Ingram School of Engineering, Texas State University, San Marcos, TX 78666, USA
3
Department of Civil, Environmental, and Construction Engineering, Texas Tech University, Lubbock, TX 79409, USA
*
Author to whom correspondence should be addressed.
Sustainability 2021, 13(20), 11217; https://0-doi-org.brum.beds.ac.uk/10.3390/su132011217
Submission received: 31 August 2021 / Revised: 28 September 2021 / Accepted: 7 October 2021 / Published: 12 October 2021
(This article belongs to the Special Issue Pavement Design, Analysis and Material Characterization)

Abstract

:
In Portland cement concrete (PCC) pavements, tie bars are commonly used at longitudinal construction joints (LCJs) to prevent the lanes from separating. Meanwhile, the increase in multiple lanes due to greater traffic volumes has raised concerns about potential longitudinal cracking; this has led to the use of dowel bars instead of tie bars at LCJs. However, there is a paucity of studies focused on the comparison between the behaviors of concrete pavement based on the restrained conditions provided by tie and dowel bars at LCJs. In this study, we investigated the effects of the placement of tie and dowel bars at LCJs on the potential for longitudinal cracking in response to the increase in concrete stress that may occur when the lanes are tied together in PCC pavements. Field testing verified that the variation in concrete strain was more restrained in the case of a tie bar than a dowel bar, whereas it resulted in higher stress in the concrete element in the tie bar section. However, the use of dowel bars caused more movement in the transverse direction at LCJs as compared with tie bars. Thus, our results indicate that using dowel bars reduces the potential for longitudinal cracking; however, it may increase the potential for lane separation.

1. Introduction

Tie bars have been used at longitudinal construction joints (LCJs) in Portland cement concrete (PCC) pavements to keep lanes from separating and, to a lesser extent, to provide enhanced load transfer efficiency between lanes or between an outside/inside lane and a tied shoulder [1]. In contrast, dowel bars have traditionally been used nearly exclusively at transverse contraction joints in jointed plain concrete pavements (JPCPs) to transfer load from one slab to the next [2].
Because the actions of tie and dowels bars are remarkably different, their design methods are also vastly different. Currently, tie bars are designed based on subgrade drag theory (SGDT), which was developed several decades ago, whereas the design of dowels is primarily based on the work by Timoshenko, expanded later by Friberg and Bradbury [2]. One of the key differences between the two design methods is that the tie bar design addresses stresses due to temperature variations, while the dowel bar design is based on limiting bearing stresses in concrete near dowels due to the application of wheel loading.
As traffic volumes have increased over time, numerous lanes have been built and are usually tied together with tie bars to prevent lane separations. According to SGDT, the wider the pavement, the greater the stresses in tie bars and concrete [2]. Subsequently, the increased number of slabs tied together has raised concerns regarding the potential increase in concrete stresses that may result in longitudinal cracks, which is still an issue [3,4]. There are no cost-effective and efficient repair methods to address longitudinal cracks. Field evaluations of a number of longitudinal cracks indicate that they are primarily caused by insufficient saw-cut depth or late saw-cut at longitudinal warping joints (LWJs) [5]. Excessive built-in curling also appears to play a role in longitudinal crack development [6]. These cracks are often observed in continuously reinforced concrete pavement (CRCP), where only a few lanes are tied together. This indicates that the cracks were not necessarily due to tying too many lanes together. Furthermore, there are CRCP sections wherein more than seven lanes are tied together; however, they had no issues of longitudinal cracking. This indicates that as long as longitudinal joints are functioning, thus reducing transverse concrete stresses, longitudinal cracking will not occur. In other words, SGDT might not be applicable for tie bar and transverse steel design [7,8,9]. Nevertheless, the aforementioned concerns about tie bars have led some state highway agencies to use dowel bars in LCJs instead of tie bars to reduce the potential for longitudinal cracking.
A survey revealed that California, Texas, and Arizona are using dowel bars in LCJs. Although California has specifications for use of dowel bars in LCJs [10], Texas and Arizona do not, and the decision to use the same seems to lie with the design engineer. In addition, the Houston District of the Texas Department of Transportation (TxDOT) has used dowels in LCJs in several projects. However, the sole purpose of the use of dowels in LCJs was to reduce the amount of transverse steel. In addition, a recent study investigated the effect of the concrete cover on the performance of doweled longitudinal joints in concrete pavements [11], and in another study, dowel bars were applied to the longitudinal joints in an adjacent box beam bridge to reduce longitudinal cracks [12]. Therefore, although there have been multiple cases where dowel bars are being used in LCJs, studies to determine the effectiveness of the use of dowel bars are scant. Hence, in terms of the efficiency of longitudinal crack control in LCJs, few studies have focused on the comparison between stress development in concrete, based on the restrained conditions provided by tie bars and dowel bars.
Consequently, this study aimed to investigate the effect of the placement of tie and dowel bars at LCJs on the potential longitudinal cracking in response to the increase in concrete stress that may occur when multiple lanes are tied together in PCC pavements. To this end, a field instrumentation was conducted in the two test sections in new CRCP, in which tie and dowel bars were used to tie existing/new lanes at LCJs. The distribution of the variation in concrete strain under a given environmental loading was measured along the distance from the LCJ and was compared for the two sections. The movement of a slab at the LCJ in the transverse direction was also measured. In addition, the stress of the measured concrete element was calculated through a mechanical analysis.

2. Field Testing

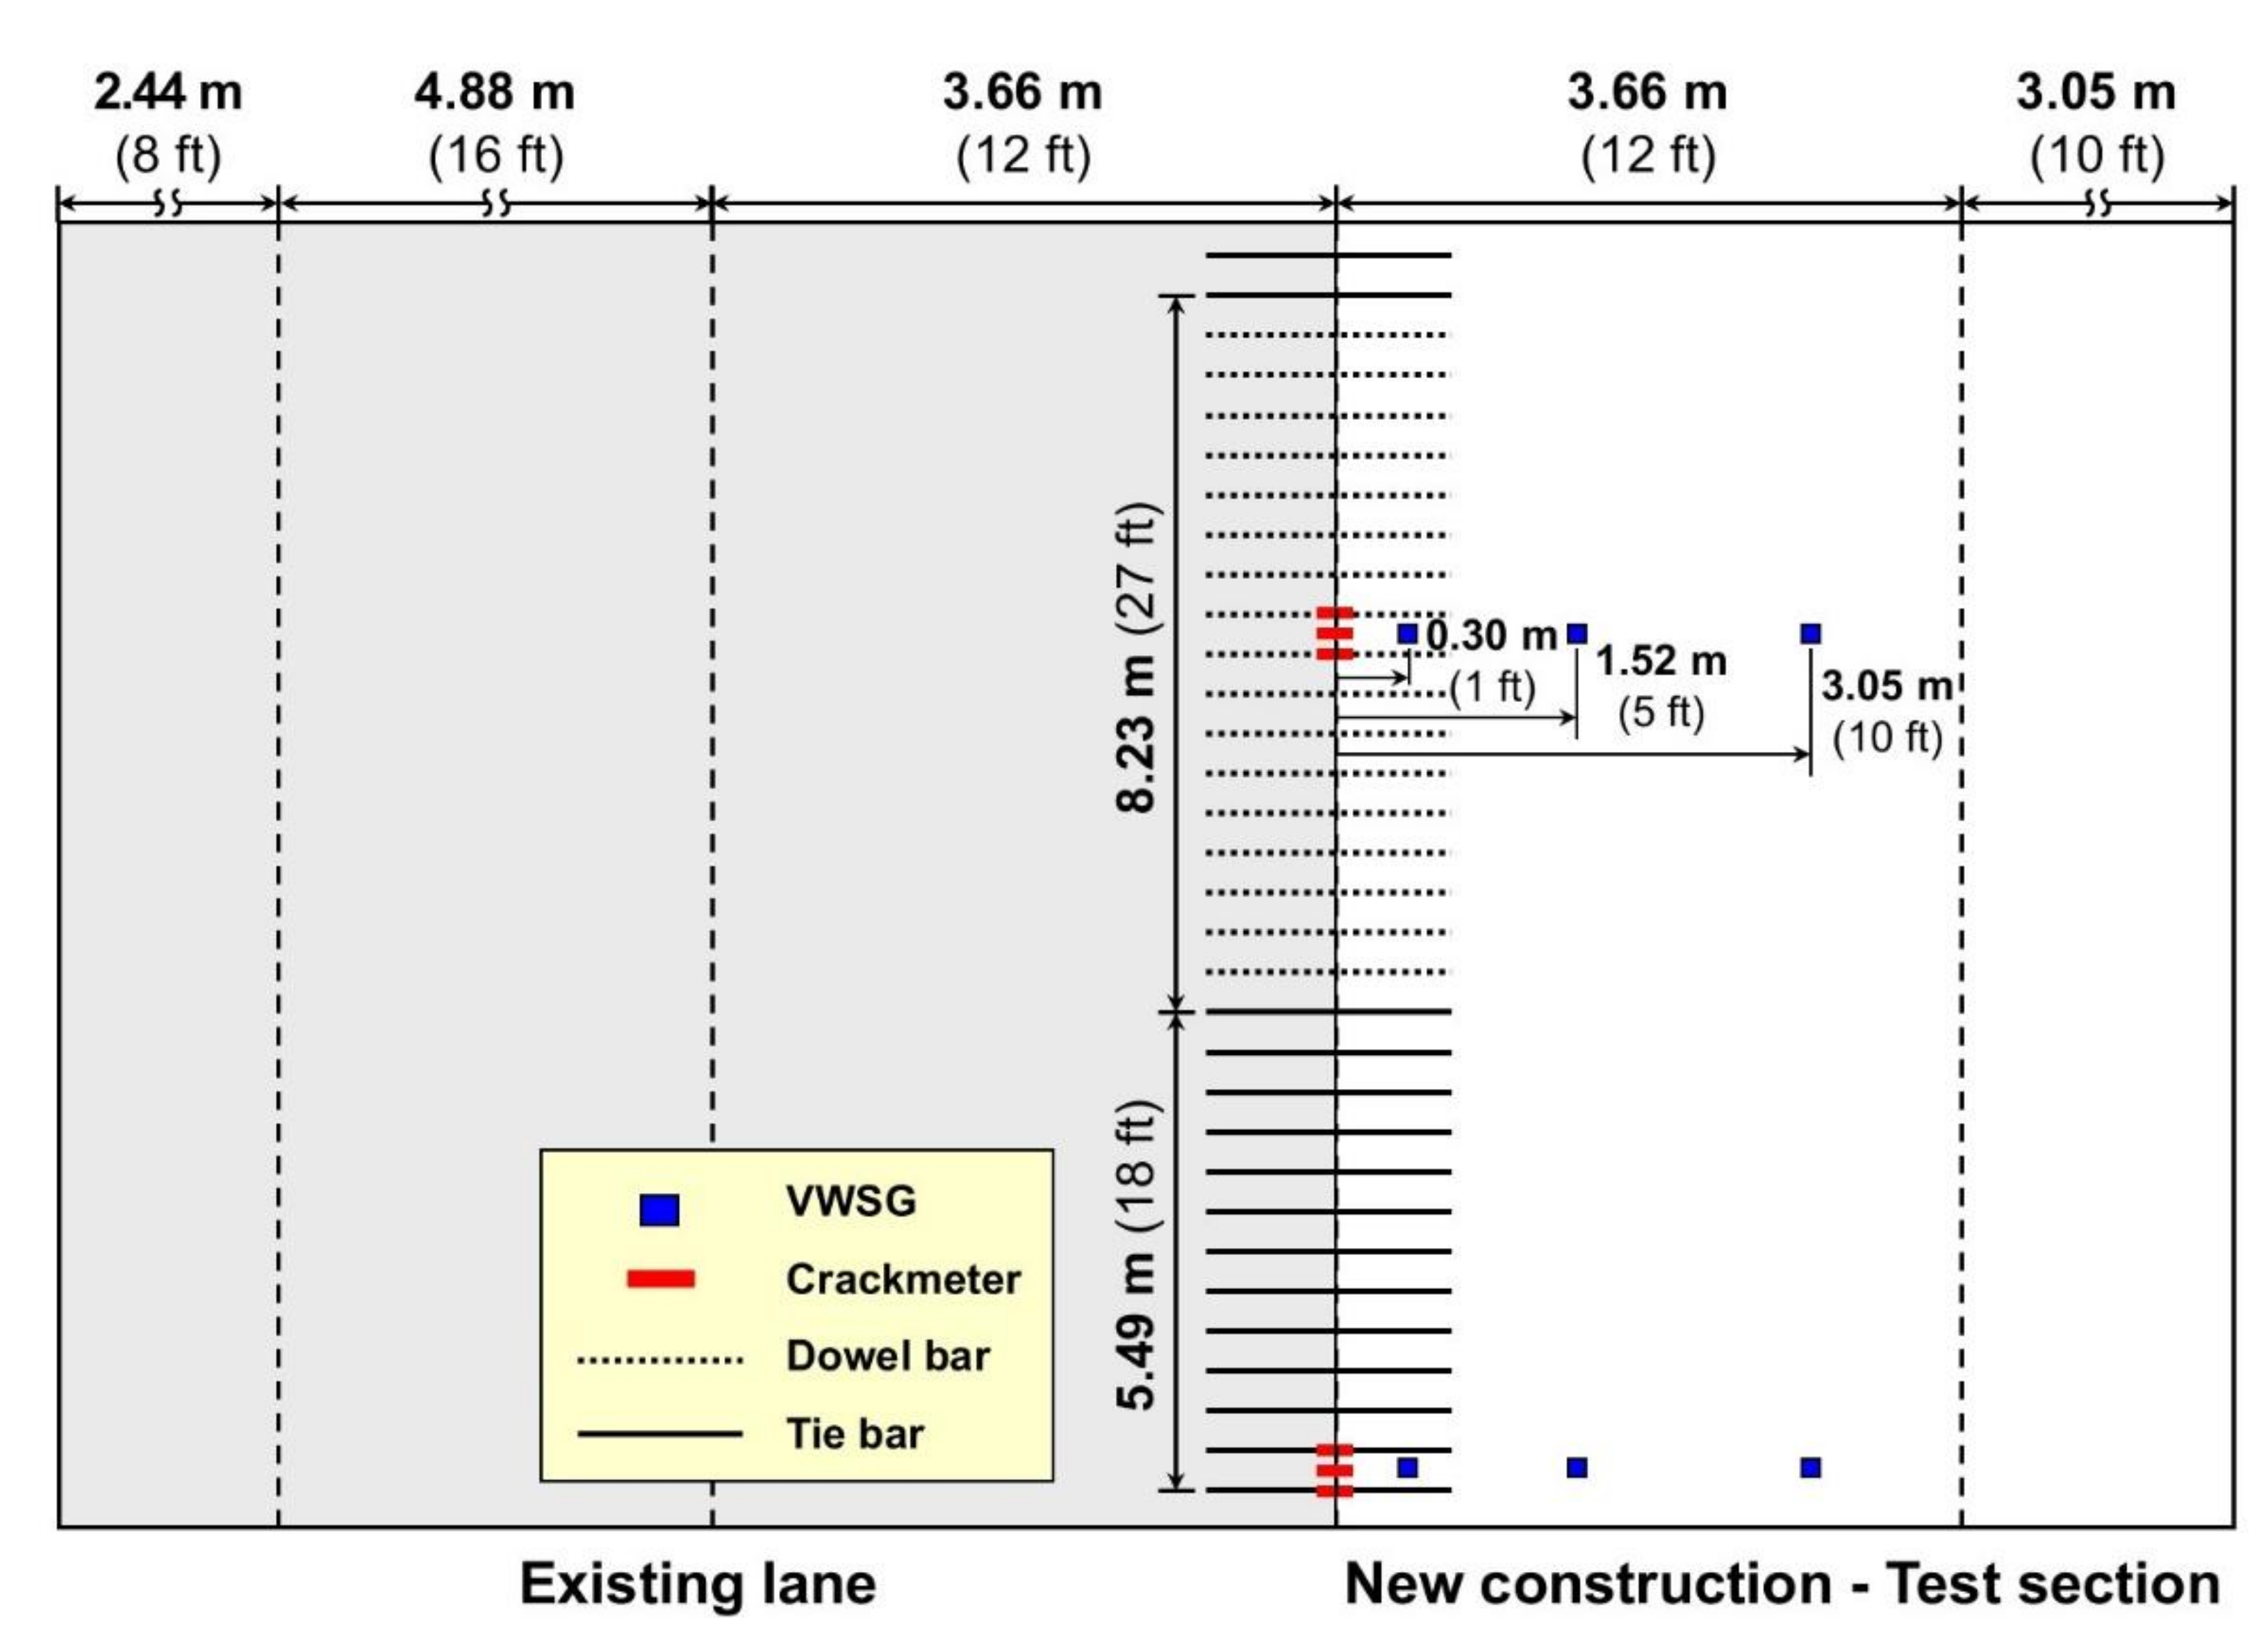
2.1. Description of Test Section

The new CRCP section instrumented for this experiment is located on Interstate Highway 35 (IH-35) south bound in Belton, Texas. The test slab consists of new 355.6 mm (14 in.) thick CRCP and over a 101.6 mm (4 in.) thick asphalt stabilized base. Two layers of longitudinal bar are placed at the depths of 111.1 mm (4⅜ in.) and 212.7 mm (8⅜ in.) with 241.3 mm (9½ in.) spacing. The new slab that was constructed is 6.71 m (22 ft) wide and is tied with the existing lane through two layers of tie and dowel bars. The existing lane consisted of three lanes, with widths of 2.44 m (8 ft), 4.88 m (16 ft), and 3.66 m (12 ft), respectively. The two layers of tie and dowel bars are placed at depths of 130.2 mm (5⅛ in.) and 231.8 mm (9⅛ in.), respectively, along with transverse reinforcement. Each layer of bar is spaced at 0.46 m (1.5 ft). The diameter of rebars placed in the longitudinal and transverse direction is 19 mm (#6 bar). In accordance with the recommendation of TxDOT, which recognizes the importance of support conditions in pavement design, the stabilized bases with appropriate thickness that provide more than 81.4 MPa/m of the modulus of the subgrade reaction (k-value) for the support were used in the test section [13]. Therefore, it is considered that the load-bearing capacity is sufficient to minimize the execution errors [14], and we assumed that the difference in stress development in concrete is due to the difference in restraint between tie and dowel bars. Table 1 shows the concrete mixtures used in the CRCP.

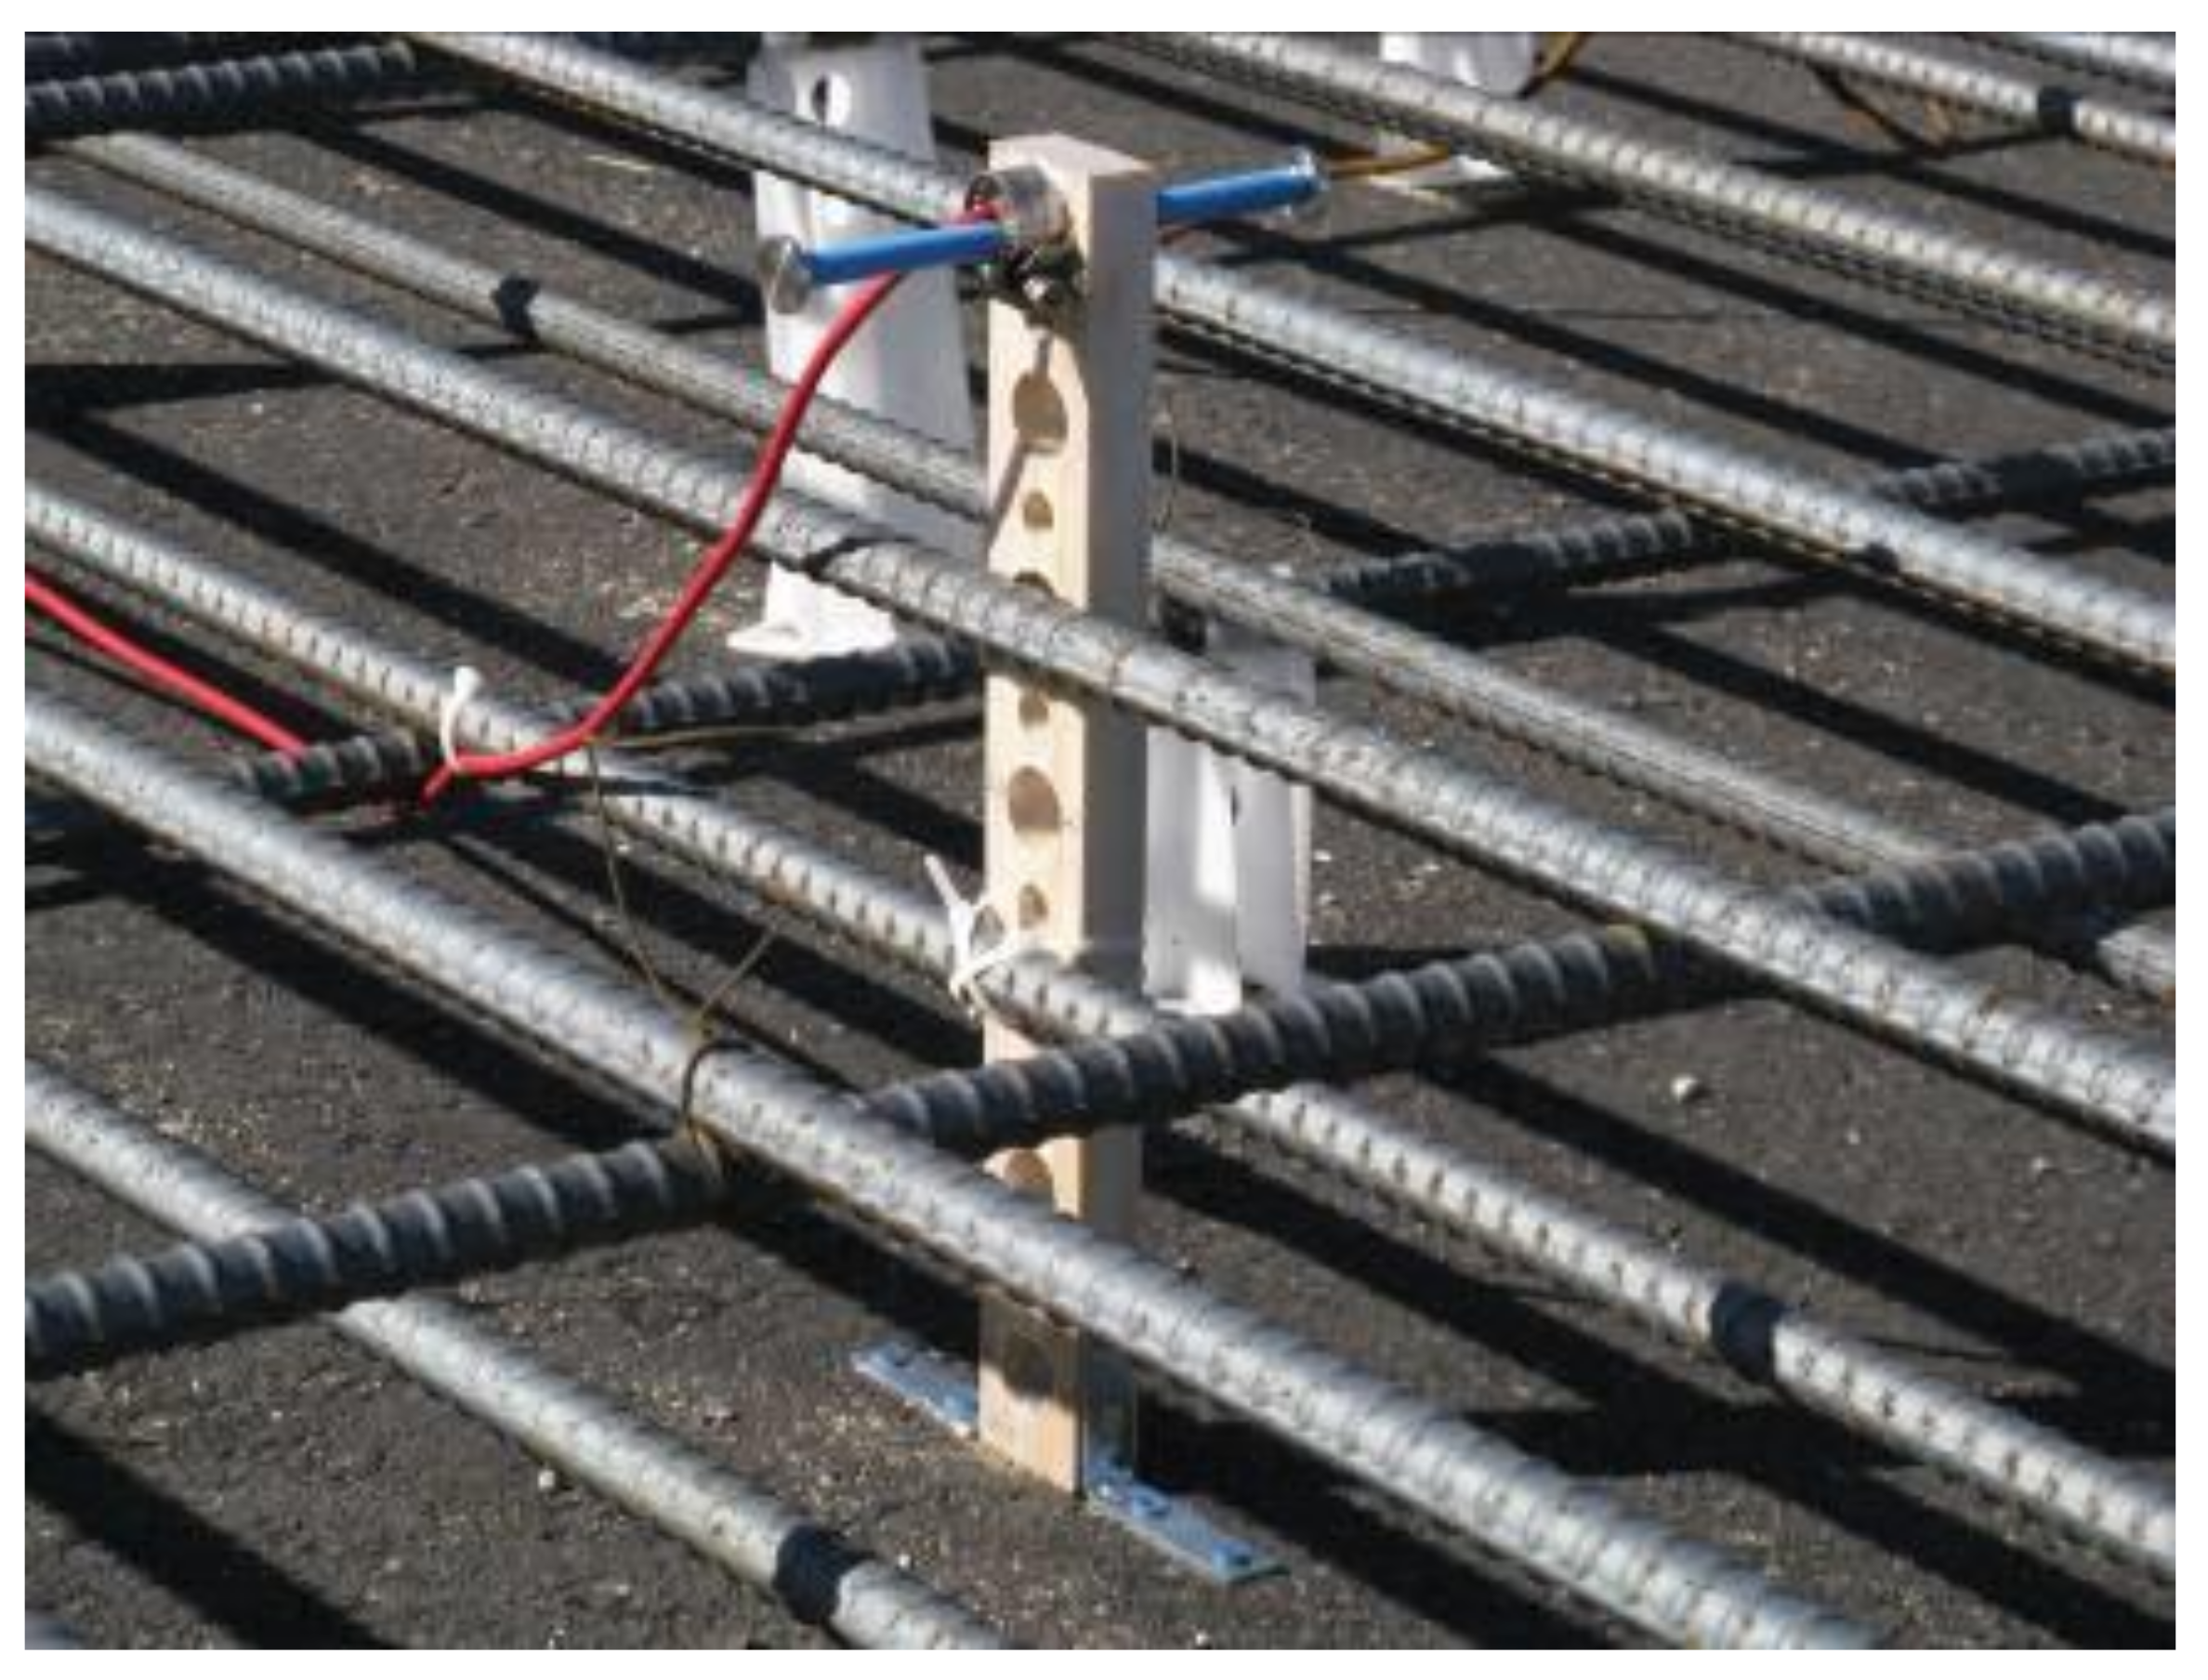
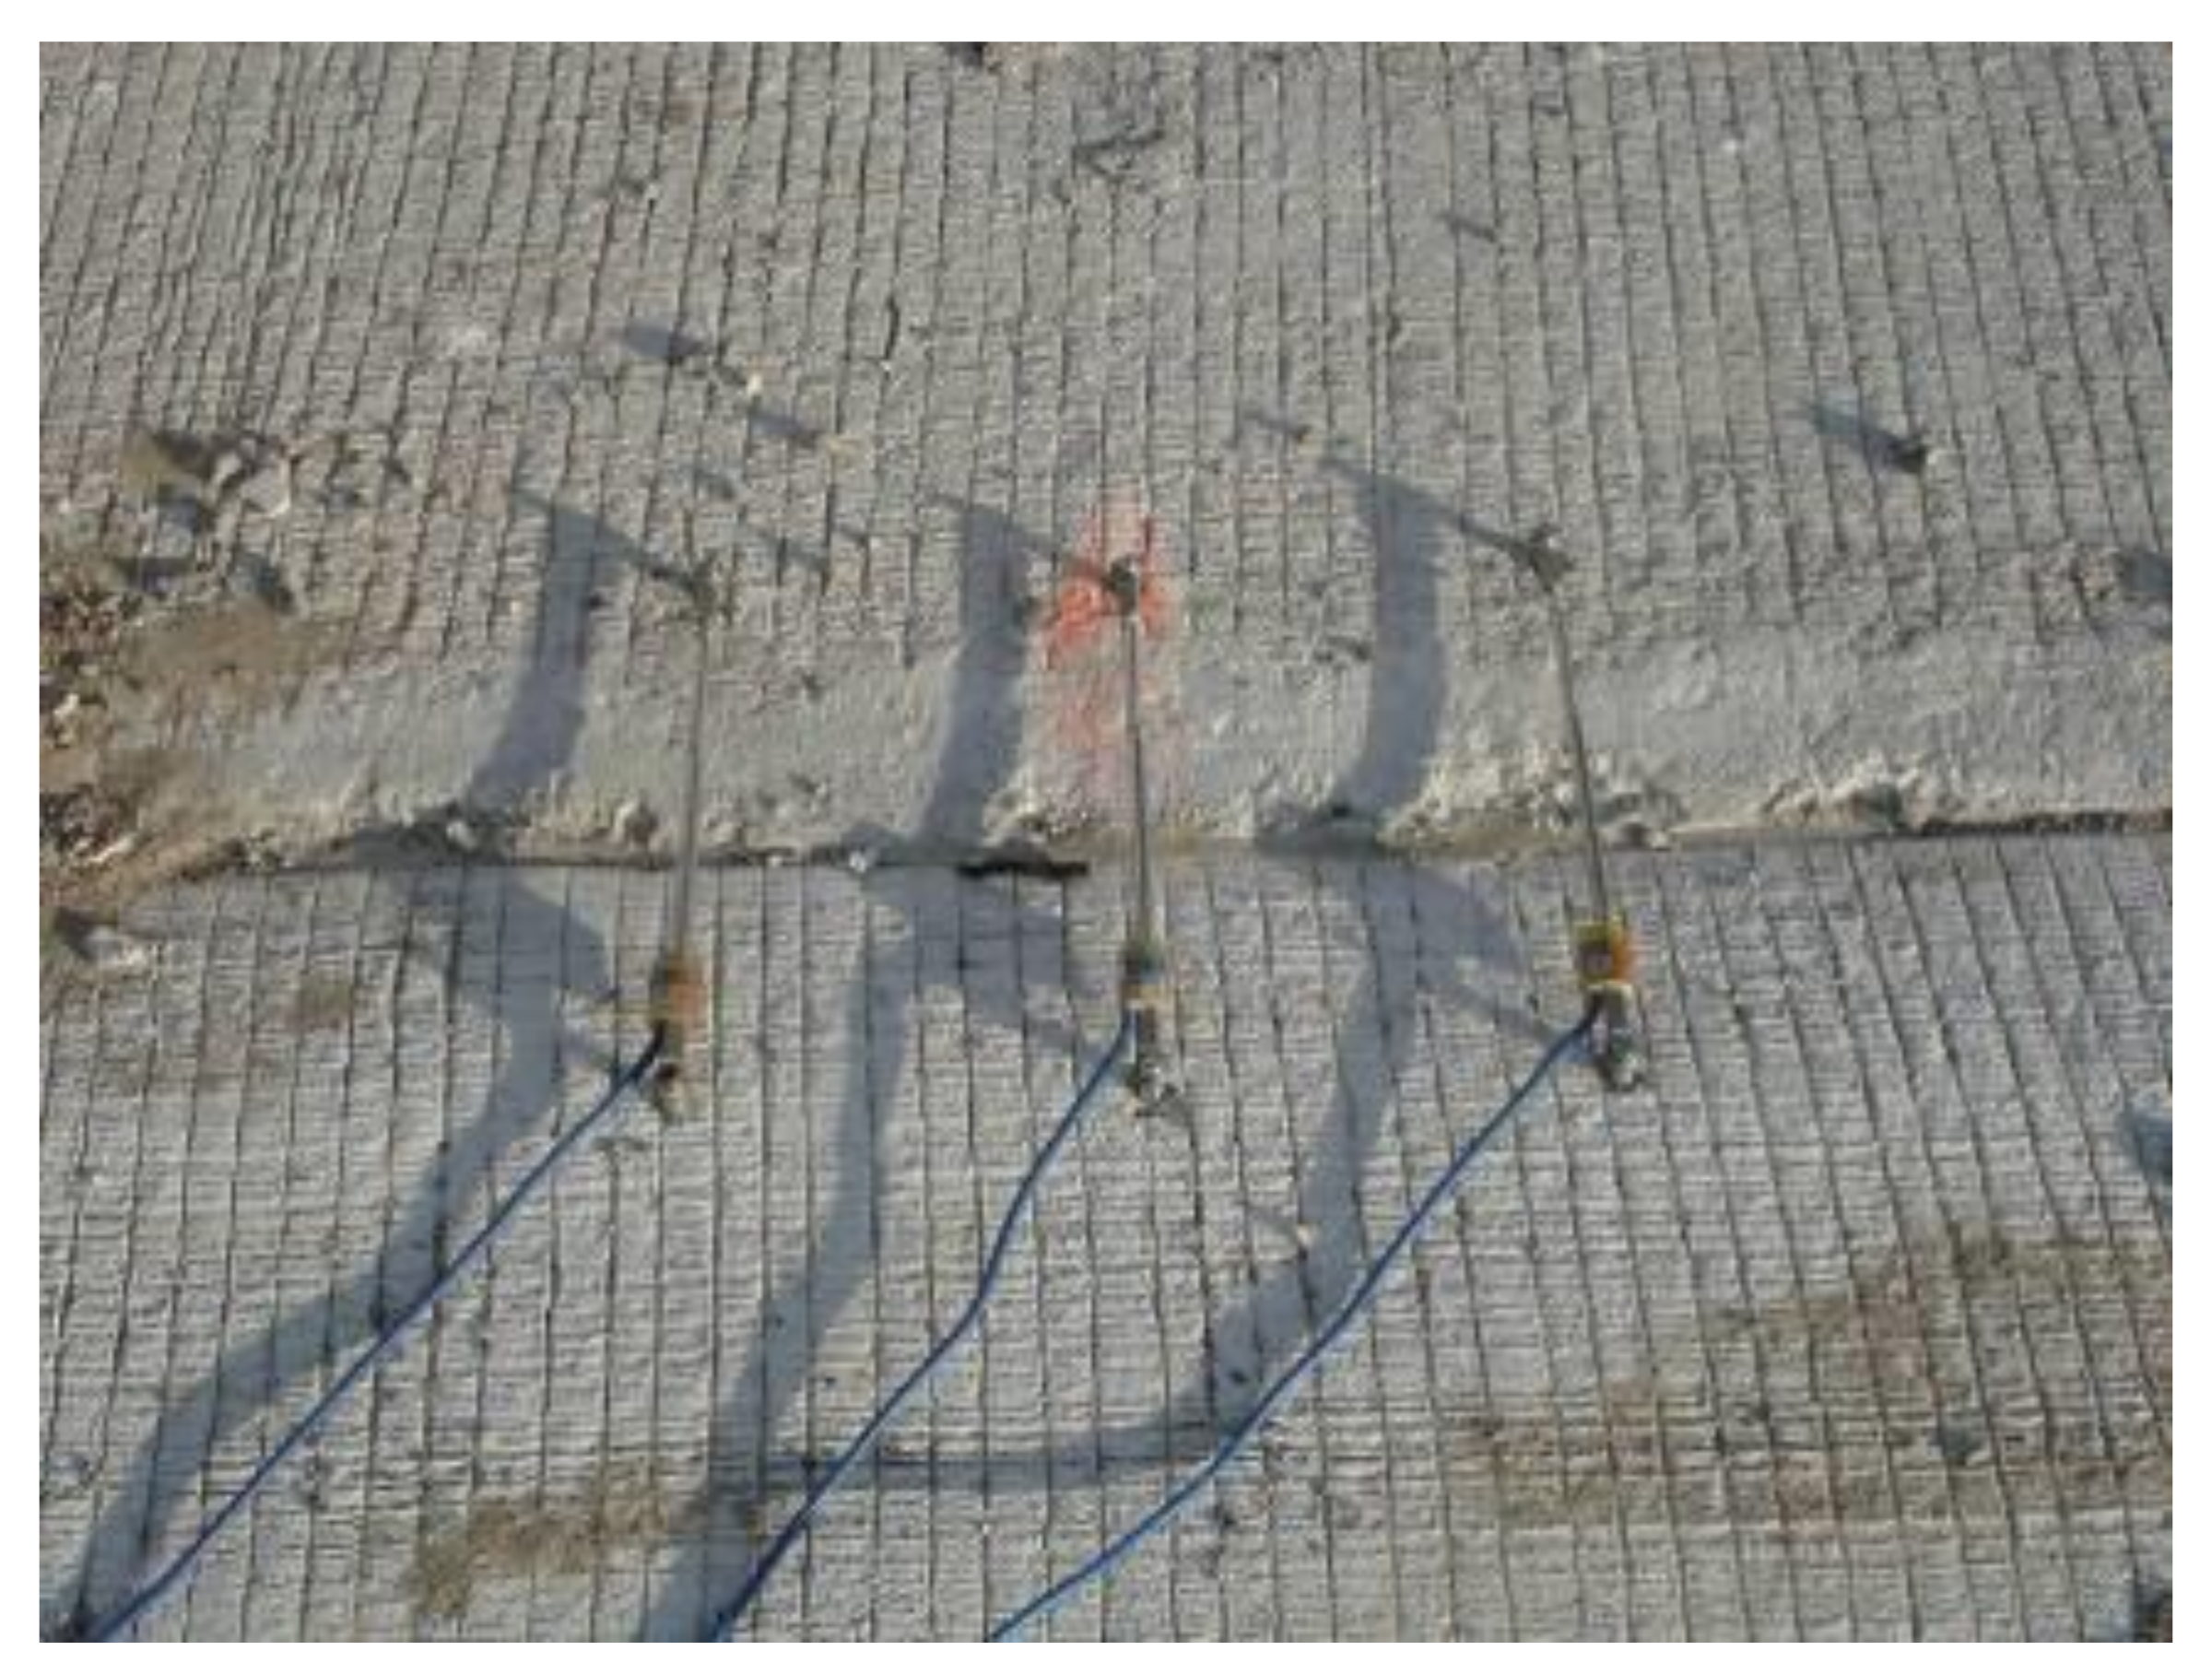
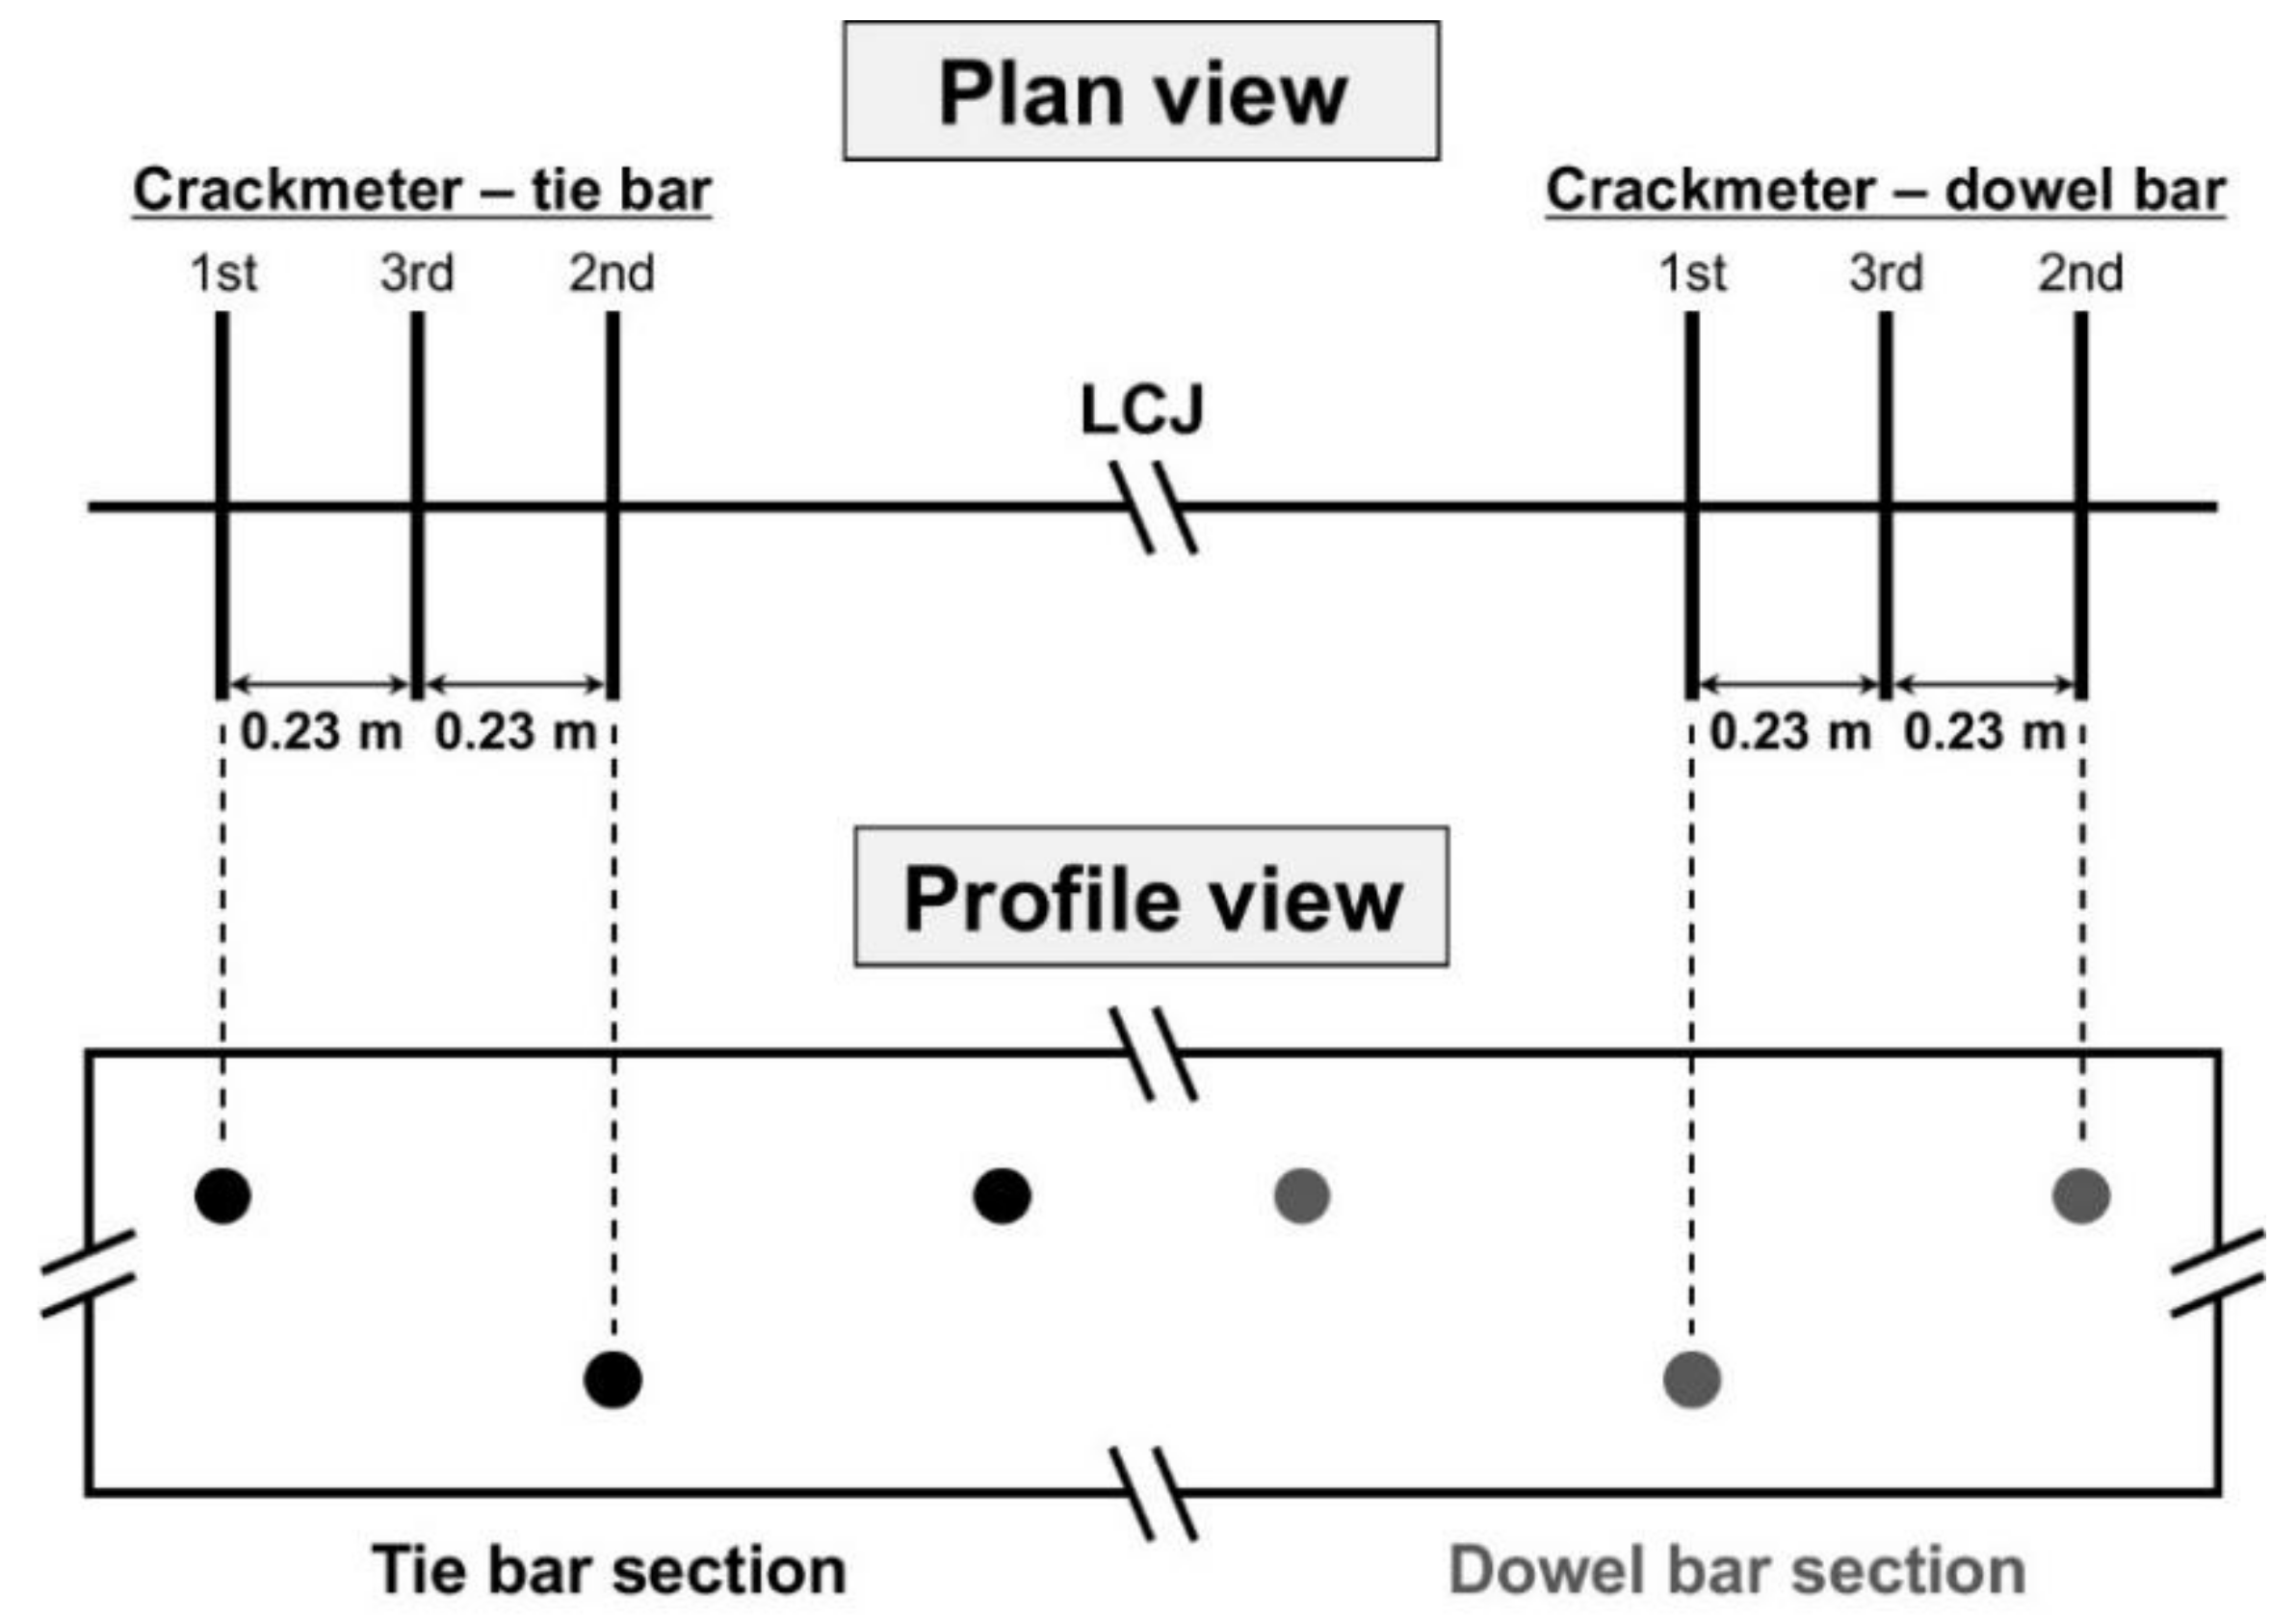
2.2. Field Instrumentation

The field instrumentation was conducted in two different test sections. The tie bars were arranged in one test section as originally designed, while the dowel bars were arranged in place of tie bars in the other section. Considering environmental loading, two sections were expected to represent the different behavior of new CRCP because the existing and new lanes of CRCP were connected at LCJs through different bars.
Figure 1 shows the overview of field instrumentation. As shown in Figure 1, each test section has two types of gages installed: one is a vibrating wire strain gage (VWSG), and the other is a crackmeter. In order to estimate the risk of longitudinal cracking in CRCP, three VWSGs were installed in the transverse direction at a depth of 25.4 mm (1 in.) from the surface of CRCP, as shown in Figure 1 and Figure 2. Figure 1 also shows the detailed location of VWSGs installed in each test section. These VWSGs were placed at different distances of 0.30 m (1 ft), 1.52 m (5 ft), and 3.05 m (10 ft), respectively, from the LCJ. The strain measured using VWSG was used to estimate the strain and stress in the transverse direction and consequently assess the risk of longitudinal cracking in CRCP [15]. Although the longitudinal joint on the right side within the new section (see Figure 1) may have affected the reading of VWSGs, it was assumed that the effect on the VWSGs was the same at equal distances. Therefore, we considered that the variation in concrete strain measured from VWSGs depending on the distance from the LCJ between the existing and new lanes was caused by the difference in degree of restraint between the tie and dowel bars.
Crackmeters can measure the displacement of CRCP at the surface [16]. These were installed across the LCJ on the 82nd day from concrete placement. Figure 3 shows crackmeters installed in each test section. Because each test section has two layers of tie or dowel bar, three crackmeters were placed across the LCJ: the first one is located on the vertical extension of the top layer of the bar, the second on that of the bottom, and the third between the top and bottom, at intervals of 0.23 m (0.75 ft), as shown in Figure 4. The different variations of displacement were expected to be measured using each of the crackmeters because the measured concrete element would be restrained differently, depending on the distance from the bars.

3. Measured Results

Figure 5 shows the typical variation of measured temperature and strain using VWSG in two test sections. The installed VWSGs were located at different distances from the LCJ, as shown in Figure 1. On the x-axis, the whole number denotes midnight of the day following the concrete placement. For example, 81 indicates midnight on Day 81 following the concrete placement.
Figure 5a shows the variation in strain due to temperature variation at 0.30 m (1 ft). Although the concrete strain was measured through concrete placement, only a portion of the data is shown because it represents the overall trend of variation in the entire monitoring period. As expected, the variation in concrete strain was close to the overall variation in temperature. Given the same variation in temperature, the variation in strain in the dowel bar section was greater than that in the tie bar section. This indicates that the movement of the measured concrete elements was more strongly restrained by the tie bar than the dowel bar, which agrees with the current practice. However, the difference in restraints is not as significant as was expected. The data measured during the period from the afternoon of the 82nd day to the morning of the 83rd day was used in the mechanical analysis, which has been explained further in this study, in order to estimate the transverse stress and the risk of longitudinal cracking in CRCP. Figure 5b,c show the variation in strain due to temperature variation at 1.52 m (5 ft) and 3.05 (10 ft) away from the LCJ, respectively. Similar to the strain at 0.30 m (1 ft), the tie bar restrained more movement of the concrete element, and thus lesser variation in strain was recorded in the tie bar section than the dowel bar section.
Figure 6 shows the comparison between strain variations at different distances from the LCJ in the dowel and tie bar test sections, respectively. This indicates that the concrete element is restrained more when it is located away from the LCJ.
Figure 7 shows the transverse displacement across the LCJ, measured by crackmeters in the dowel and tie bar test sections, respectively. As mentioned earlier, three crackmeters were installed at the surface at different distances from the dowel and tie bars in each test section. In both sections, the least movement occurred when the tie or dowel bars were closer to the pavement surface and increased with an increase in distance, as shown in Figure 7. This implies that more restraint is caused by the top layer of the dowel or tie bars and less by the bottom layer of the bars. It also indicates that the tie bar provides CRCP with more restraint in the transverse direction than the dowel bar because the variation in movement is higher in the dowel bar section than in the tie bar section, as shown in Figure 7.

4. Mechanical Analysis of Test Results

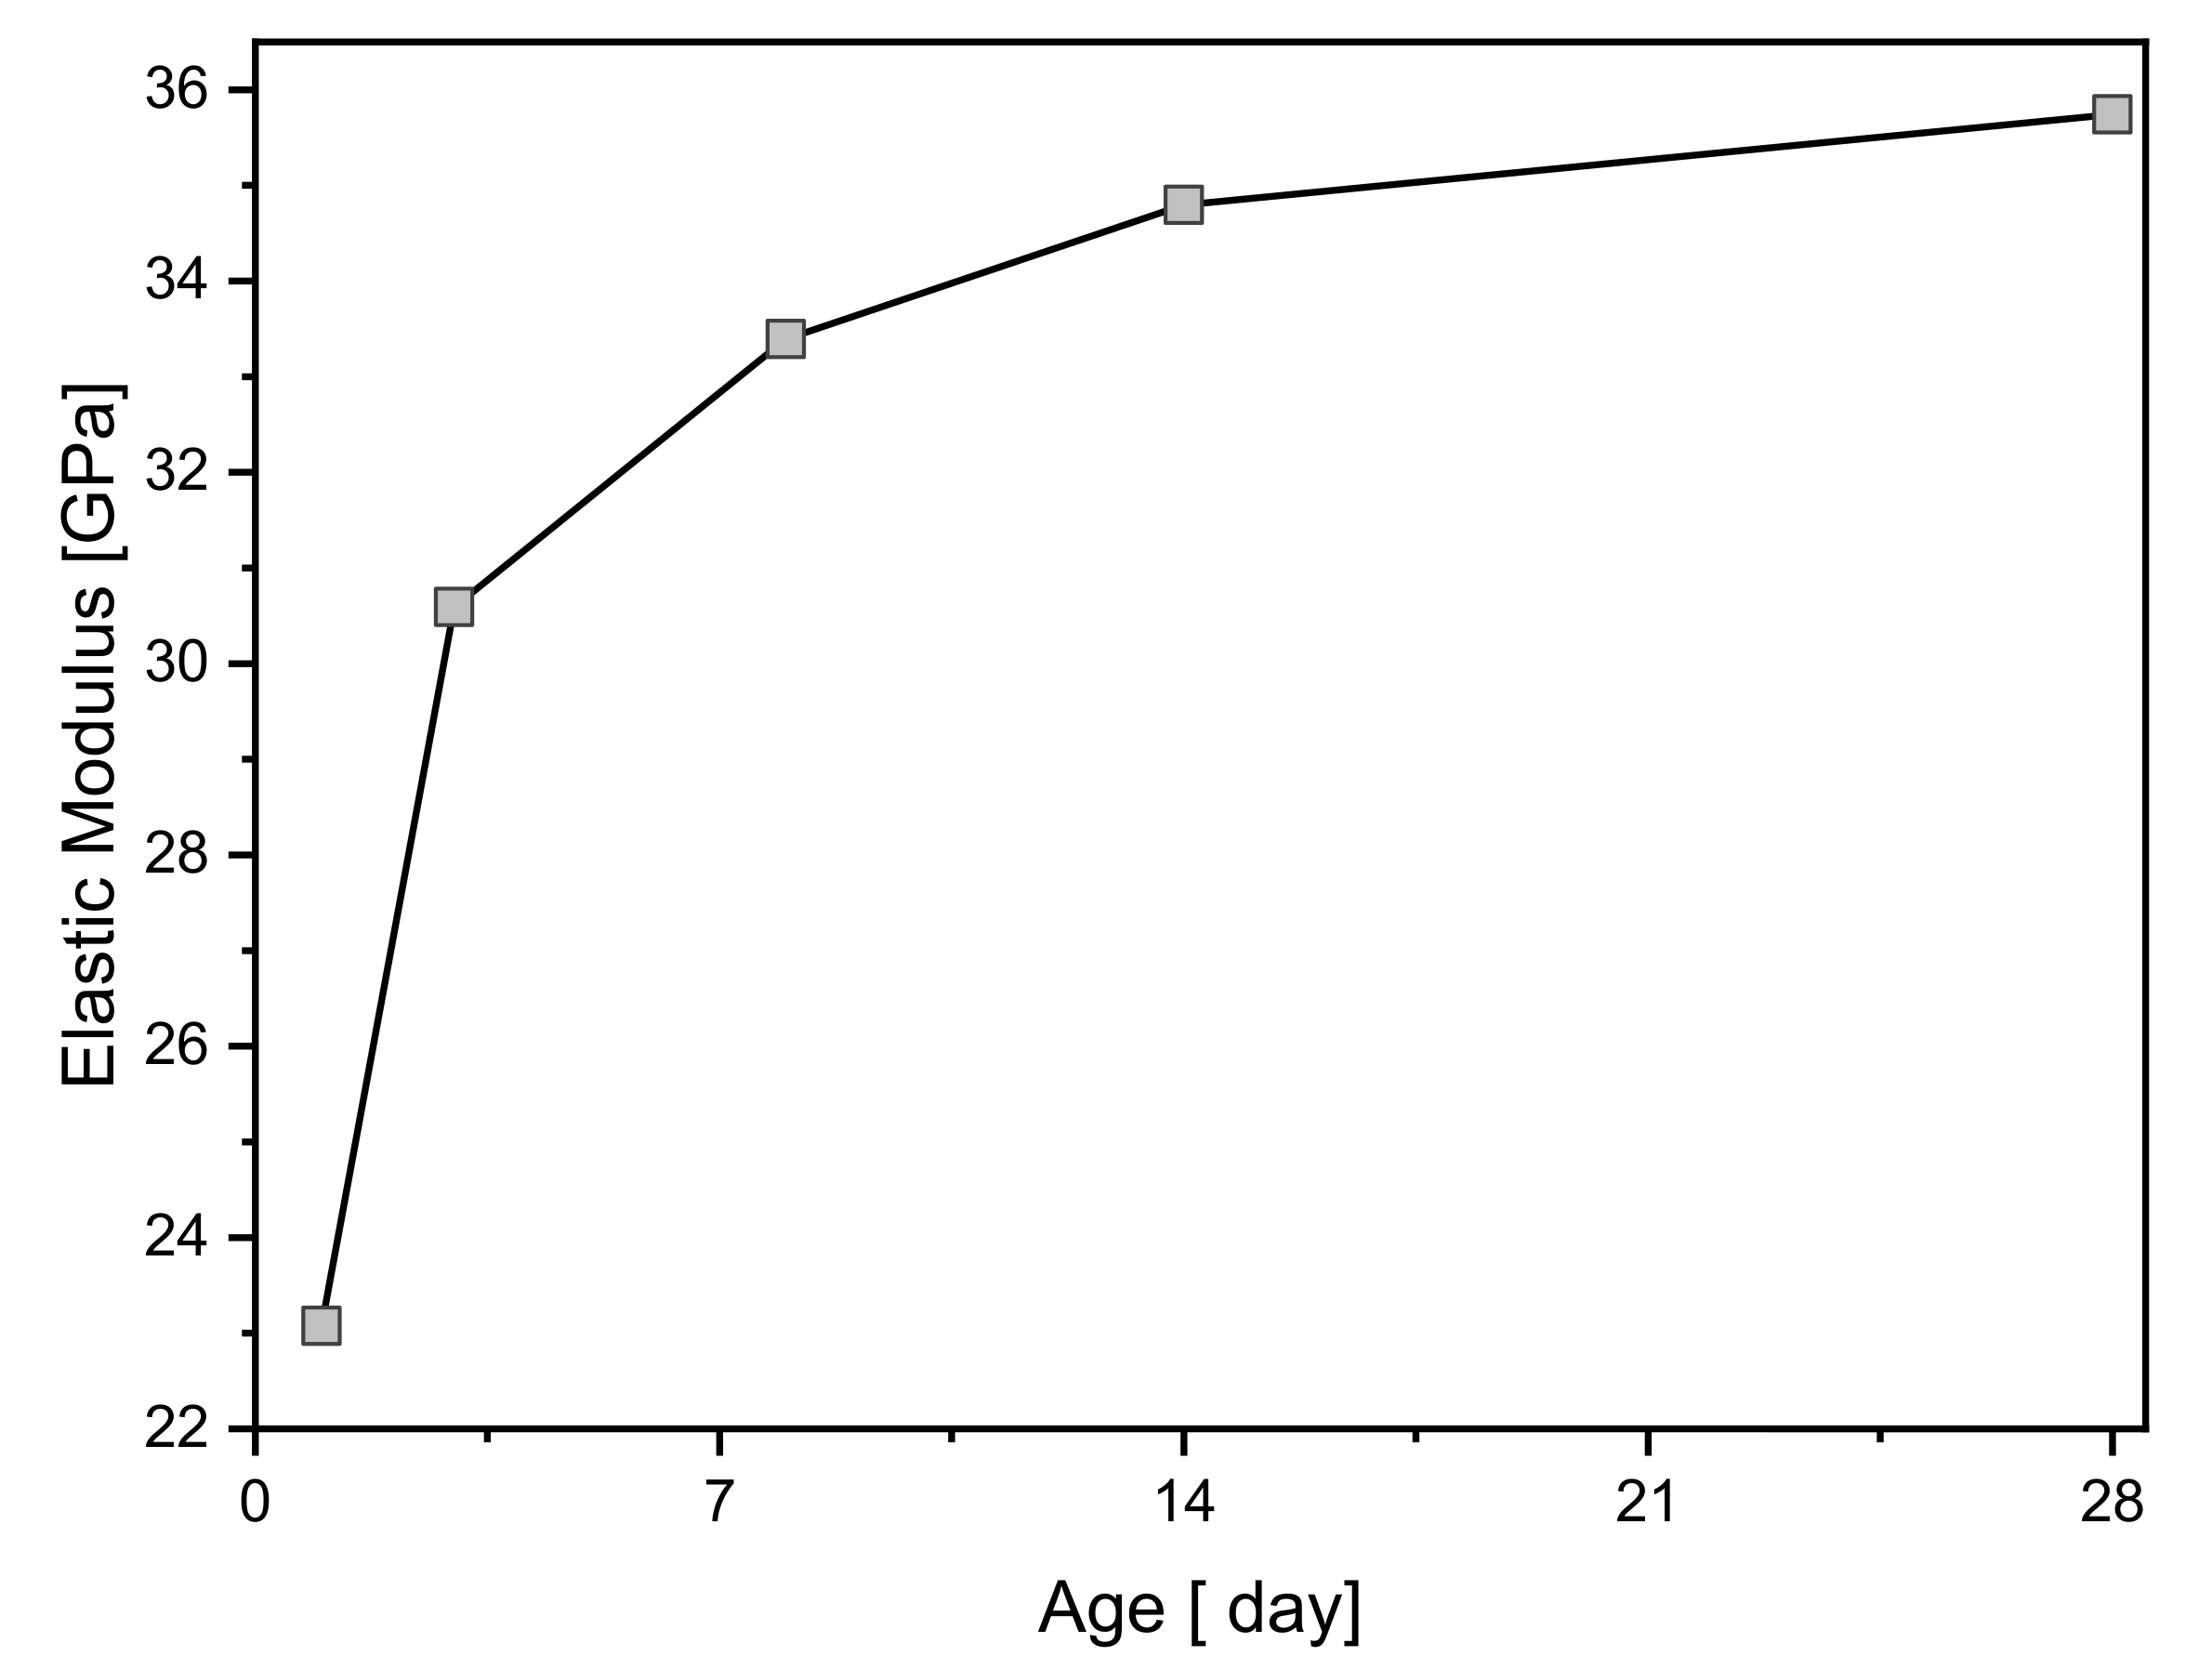
4.1. Constitutive Relation of Stress–Strain in Concrete

In this section, the method to calculate stress history from measured strain history in concrete is described. For the concrete element uniaxially loaded within the service stress range, total strain ε i of the concrete at time i consists of stress-dependent strain ε i σ and stress-independent strain ε i 0 [17]. Stress-dependent strain, which is produced by stresses in the concrete, is the sum of the instantaneous strain ε i E , which is elastic if the stress is small, and creep strain ε i c . In contrast, stress-independent strain, which is not related to stresses, is the sum of thermal strain ε i T and shrinkage ε i s h . Therefore, the total strain increment Δ ε i during time step Δ t i = t i t i 1 can be expressed as follows:
Δ ε i = Δ ε i E + Δ ε i c + Δ ε i T + Δ ε i s h   = Δ ε i σ + Δ ε i 0                                          
where Δ ε i σ = ε i E + ε i c ; Δ ε i 0 = ε i T + ε i s h . The variation in stress arising from a prescribed strain history can be obtained through the principle of superposition as follows [17]:
σ t = 0 t R t , t d ε t d ε 0 t = 0 t R t , t   d ε σ t                      
where σ t = stress history, and R t , t = relaxation function, which represents the stress at time t caused by an increment of stress-dependent strain d ε σ t , which was imposed at time t .
The multi-axial generalization of the stress–strain relation can be obtained by the assumption that the material is isotropic. Based on the hypothesis of linearity, Equation (2) is generalized as follows:
σ = 0 t R t , t B d ε ε 0
B = 1 ν 1 + ν 1 2 ν 1 ν / 1 ν ν / 1 ν 0 0 0 1 0 0 0 1 0 0 0 ν * 0 0 ν * 0 ν *
v * = 1 2 v 2 1 v
where, σ = σ 11   σ 22   σ 33   σ 12   σ 23   σ 31 T , ε = ε 11   ε 22   ε 33   ε 12   ε 23   ε 31 T , ε 0 = ε 0   ε 0   ε 0   0   0   0 T , and v = Poisson ratio.

4.2. Degree of Restraint

The mechanical analysis was conducted with measured data during the period when the crackmeter was being placed in the field, i.e., the afternoon of the 82nd day to the morning of the 83rd day, as shown in Figure 5. For the relatively short period given, the contribution of creep and shrinkage to the development of stress in the measured concrete element in test sections can be negligible [17], and therefore Equation (1) can be reduced as follows:
Δ ε i = Δ ε i E + Δ ε i T
As shown in Figure 6, the variation of strain in concrete elements is different, even though all measured elements are subject to similar temperature variation. This indicates that the deformation of the slab is less restrained near the LCJ and more near the center of the slab. The variation in concrete strain in the following two concrete elements, because of temperature changes for the period specified earlier, was measured using VWSG in the field: one element without restraint, through a nonstress cylinder (refer to Section 4.4) and the other with restraint, which was located at 0.30 mm (1 ft) from the LCJ in the tie bar section. The coefficient of the linear regression equation is related to the degree of restraint on concrete volume changes. For the given temperature variation, the degree of restraint can be defined as follows [15]:
R i = 1 Δ ε i Δ ε i f = 1 s i Δ T i s i f Δ T i
where R i = degree of restraint [-]; Δ ε i f = variation of strain of unrestrained concrete; Δ ε i = variation of strain of restrained concrete; s i f = slope of unrestrained concrete [10−6 mm/mm/°C]; and s i   = slope of restrained concrete [10−6 mm/mm/°C].
If there is no restraint on concrete volume changes, the slope of the line should be close to the slope of the unrestrained concrete that is equal to the coefficient of thermal expansion (CTE) [18]. Therefore, Equation (7) can be expressed in terms of CTE:
R i = 1 s i α c
where α c = CTE [10−6 in./in./°C]. For example, the degree of restraint in the concrete element at 0.30 m (1 ft) from the LCJ in the tie bar section was calculated to be 9.2%, which implies that only 9.2% of the free movement in the concrete element was restrained. Therefore, a higher degree of restraint yields a higher stress development in the measured concrete element.
For the given temperature variation Δ T i , stress-dependent strain in Equation (6), which is directly related to stress development, can be expressed in terms of degree of restraint as follows:
Δ ε i E = Δ ε i Δ ε i T = R i α c Δ T i

4.3. Stress State in CRCP

In order to accurately estimate the stress development of the concrete element due to temperature changes, three VWSGs were required to be installed in three directions, i.e., longitudinal, transverse, and vertical directions. Considering the length and width of CRCP, however, CRCP is very thin, and the top surface is in a stress-free condition in the vertical direction. Therefore, the vertical stress component in Equation (3) may be assumed to be negligible unless the measured concrete element is located near the rebar, across the crack, or the LCJ [19]. Plane stress conditions may exist in the measured concrete element in the test sections. Under the assumption given prior, and as demonstrated in Section 4.2, Equation (3) may be written as follows:
Δ σ i t r = E c 1 ν 2 Δ ε i E , t r + ν Δ ε i E , l o
where Δ σ i t r = stress variation in transverse direction; Δ ε i E , t r = elastic strain variation in transverse direction; and Δ ε i E , l o = variation of elastic strain in longitudinal direction.
Because CRCP is equipped with a great length, the movement of CRCP in the longitudinal direction can be assumed to be completely restrained, unless the element is located near the transverse crack. Equation (10) with Δ ε i E , given by Equation (3), may be rewritten as
Δ σ i t r = E c 1 ν 2 R i t r + ν R i l o α c Δ T i     = E c 1 ν 2 R i t r + ν α c Δ T i
where R i t r = degree of restraint in transverse direction; R i l o = degree of restraint in longitudinal direction; and E c = elastic modulus of concrete. Equation (11) implies that the stress development in the transverse direction due to temperature changes can be calculated from the measured degree of restraint using VWSG and the known CTE.

4.4. Estimated Stress of Measured Concrete Element in Test Section

Figure 8 shows a nonstress cylinder (NC) installed in the test section. This cylinder was used to measure the concrete strain that does not contain stress-dependent strain, i.e., thermal strain and drying shrinkage [20]. The NC was designed such that it isolates concrete inside the NC from the surrounding concrete, and thus prevents the transfer of stress from the surrounding concrete to the concrete in the NC. The concrete inside the solid NC was completely isolated from the surrounding concrete, and thus the VWSG in the NC was able to measure the thermal strain of concrete under stress-free conditions. Therefore, the free thermal strain due to temperature changes, i.e., CTE, could be measured using the VWSG in the solid NC.
Figure 9 shows the variation in measured strain along with the temperature changes with and without NC in the field. As shown in Figure 9, the difference in concrete strain was markedly different depending upon the presence or absence of NC, which proves the effectiveness of NC for the prevention of the transfer of stress. In addition, a good correlation was obtained between variations of strain and temperature. As described in Section 4.2, the CTE of the concrete, which corresponds to the slope of the linear regression line of the unrestrained concrete in the graph, was 7.59 × 10⁻⁶ mm/mm/°C. Figure 10 shows the measured elastic modulus of the concrete. The modulus of concrete at the 28th day was 35.74 GPa. Furthermore, these values were used to calculate the stress variation given by Equation (11).
Figure 11 shows the temperature profile and gradient of the test section. Figure 11a illustrates the temperature distribution along the depth of the tie bar test section during the specified period, as shown in Figure 5. As expected, a higher variation in temperature occurred at the top surface of the test section. The given temperature profile and gradient, which is used in the mechanical analysis, is shown in Figure 11b. The second order polynomial was used in the regression of the temperature gradient [21].
Figure 12 shows the variation in the strain in the concrete elements at different distances from the LCJ in the dowel and tie bar test sections. To obtain the relationship between the concrete strain with the given temperature variation, the data of the cooling stage (see Figure 5 and Figure 6) were analyzed, and the trend lines and the slopes are shown in Figure 12. Because it shows the relatively short period time of behaviors about 82 days after concrete placement, the effect of drying shrinkage on the opening of the LCJ is not considered to be the main cause. The linear coefficient of regression decreased as the element moved away from the LCJ. This means that the non-temperature factors restraining the movement of concrete increased with increasing distance from the LCJ. In addition, the movement of the LCJ was opposite to the changing trend of the temperature. At the same distance from the LCJ, the dowel bar section obtained higher coefficients than the tie bar section, which implies that the concrete element was less restrained. From the measured results displayed in Figure 12, the degree of restraint of each element can be calculated using Equation (8).
For the given temperature gradient, the stress development in the concrete element in the transverse direction can be calculated with the known CTE, degree of restraint, and elastic modulus (refer to Equation (11)). Figure 13 shows the calculated stress of concrete elements at different distances from the LCJ. It indicates that higher stress develops as the distance between the element and the LCJ increases. The tie bar restrains the movement of the slab at the LCJ and thus leads to higher stress development. The mechanical analysis results are consistent with the field measurements, as shown in Figure 5 and Figure 6. Although field measurements for a specific period of time were used for mechanical analysis, similar results can be obtained even with measured data from other periods because the strain behavior of concrete in the tied and doweled sections according to temperature and distance from the LCJ represents consistent trends, as shown in Figure 5 and Figure 6. Therefore, it is considered that the mechanical analysis results are reliable and have representativeness. However, this result may vary depending on the field conditions, and thus further studies in this area are required.

5. Conclusions and Discussion

This study investigated the effects of the placement of tie and dowel bars in LCJs on the stress development in concrete in a PCC pavement. More specifically, the behavior of tied and doweled concrete pavements under environmental loading was evaluated to estimate the potential for longitudinal cracking. To this end, the field testing was performed on two sections in the new CRCP connected to the existing lanes via tie and dowel bars at the LCJs. Concrete strain gages were installed at different distances from the LCJ, while concrete displacement gages were installed across the LCJ, in the transverse direction. These gages were installed in each test section—tied section and doweled section—to investigate the difference in the behavior of tied CRCP and doweled CRCP. The following conclusions were obtained based on the field experiments:
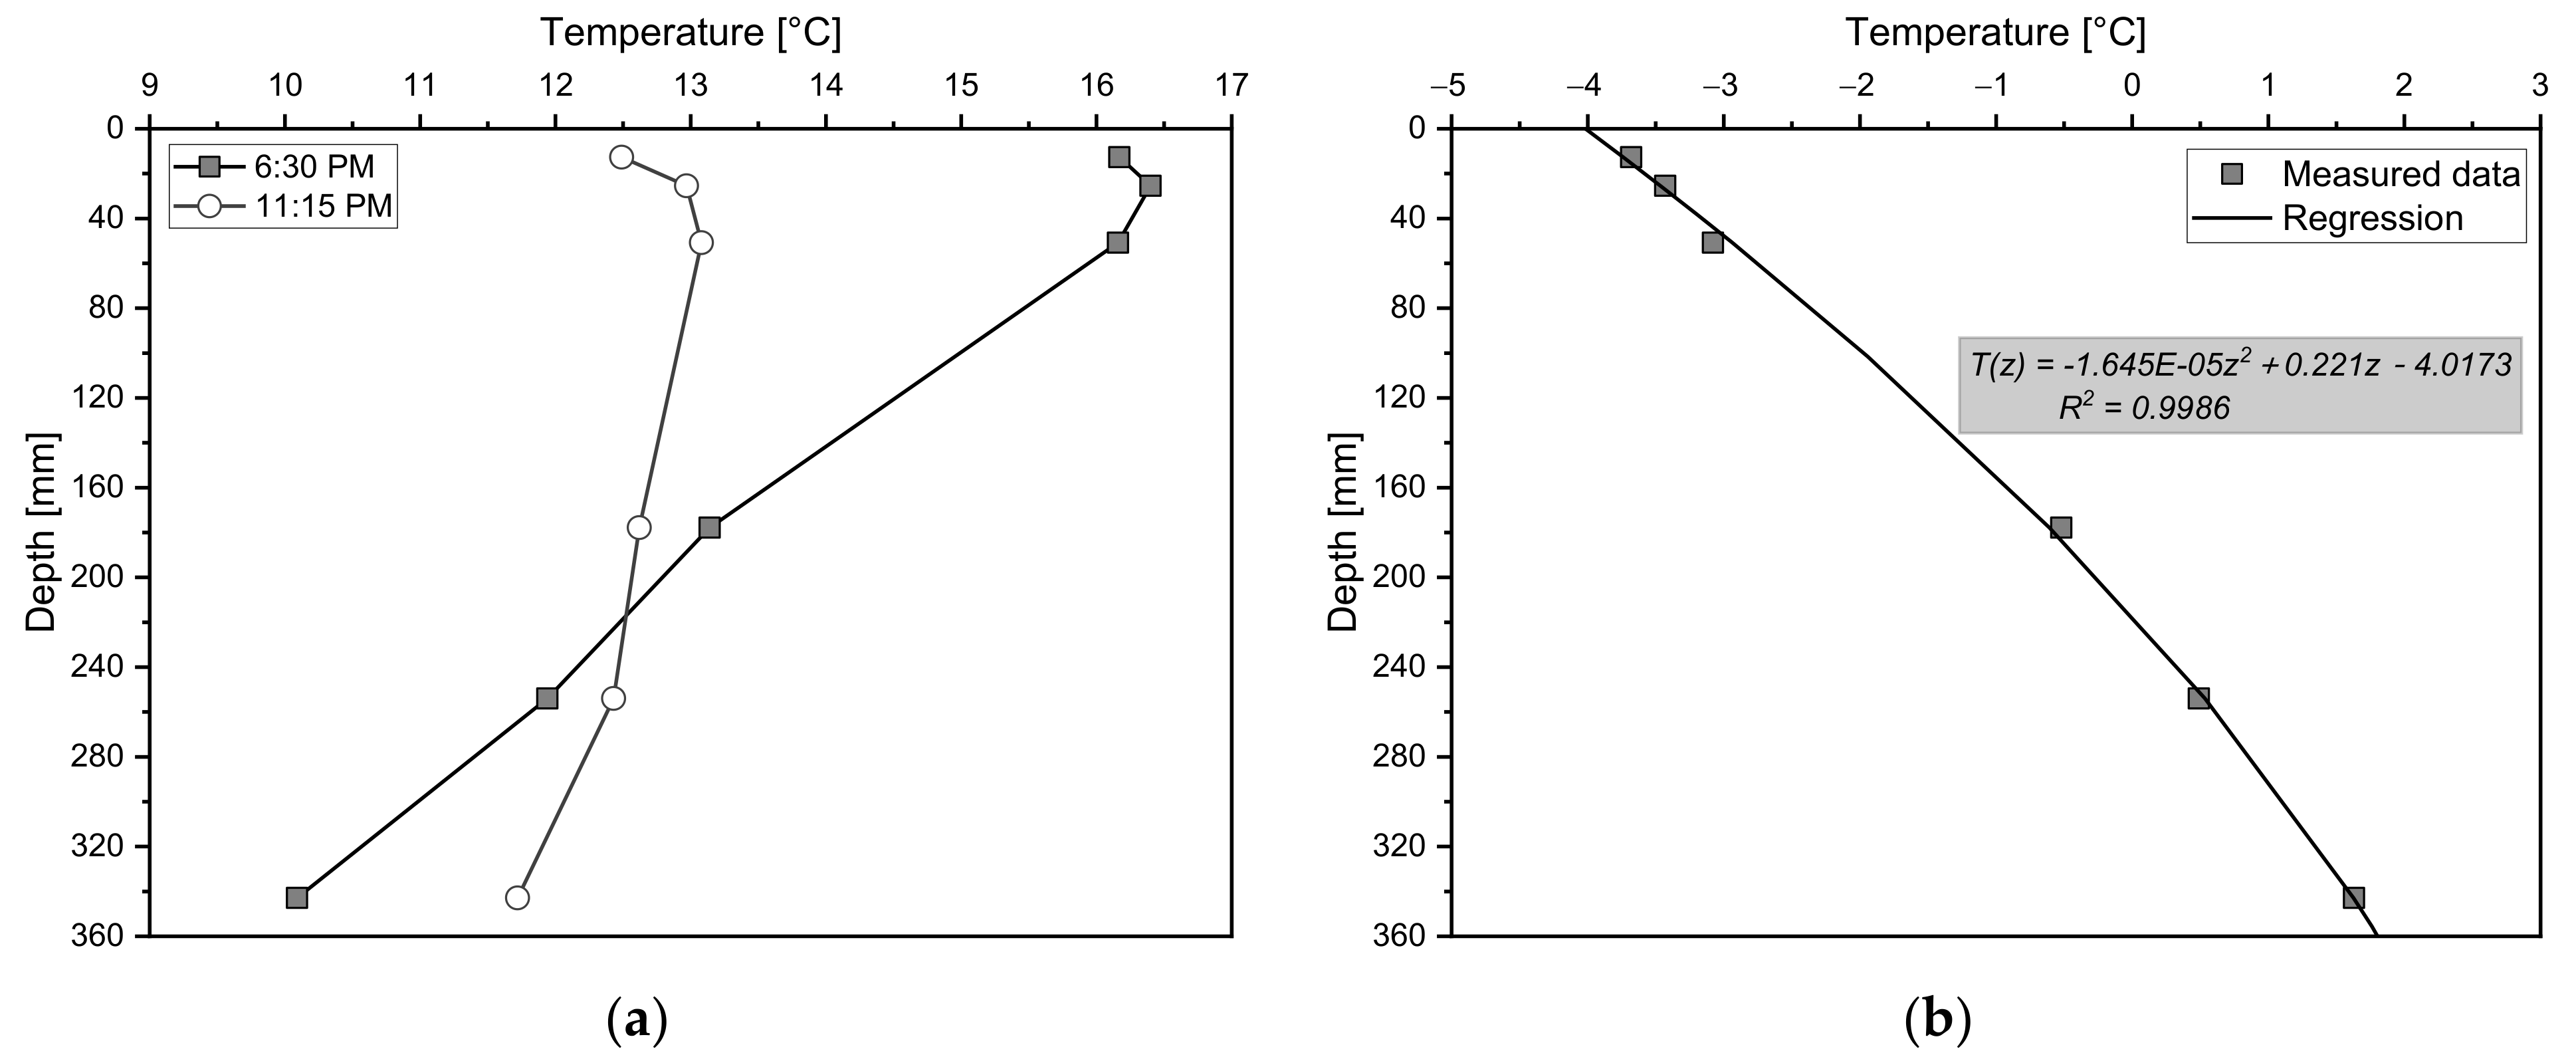
  • Concrete temperatures evaluated at various depths from the concrete placement displayed substantial variation through the slab depth. This variation may be the cause for the curling in the concrete slab and does not support the SGDT’s assumption that there is no temperature change along the depth of the slab. The temperature gradient along the depth of the slab demonstrated a character of nonlinear distribution.
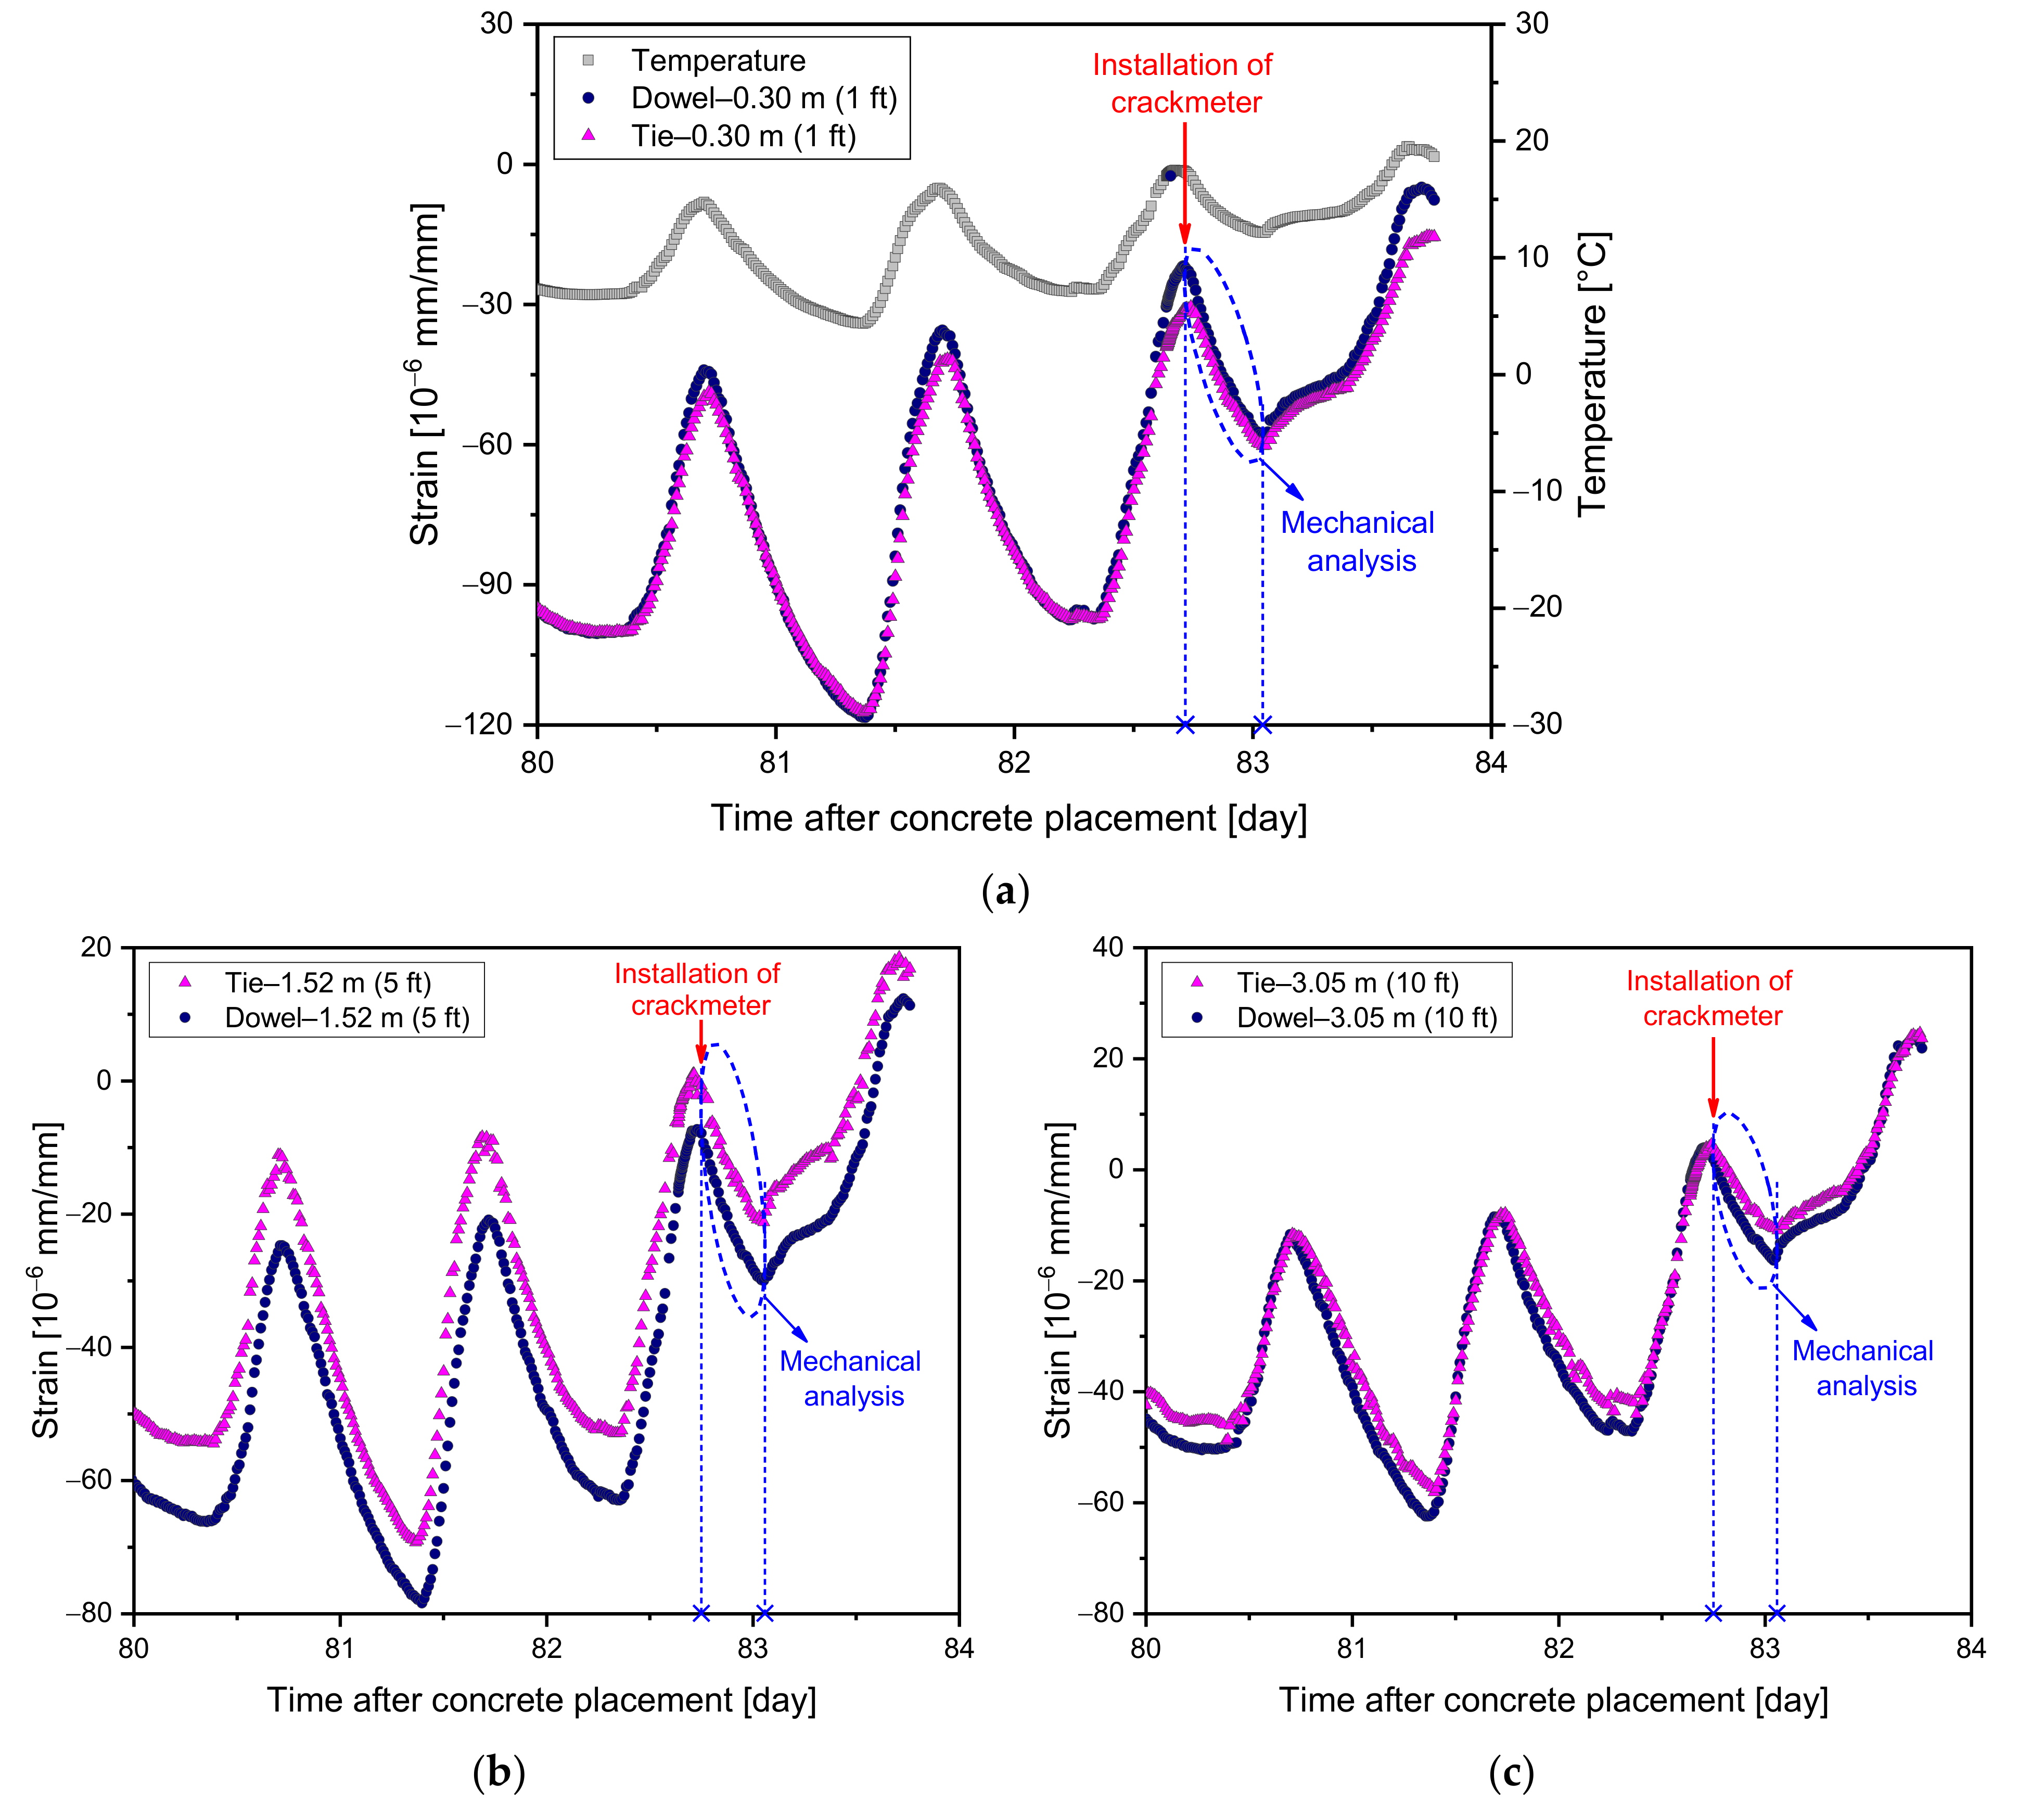
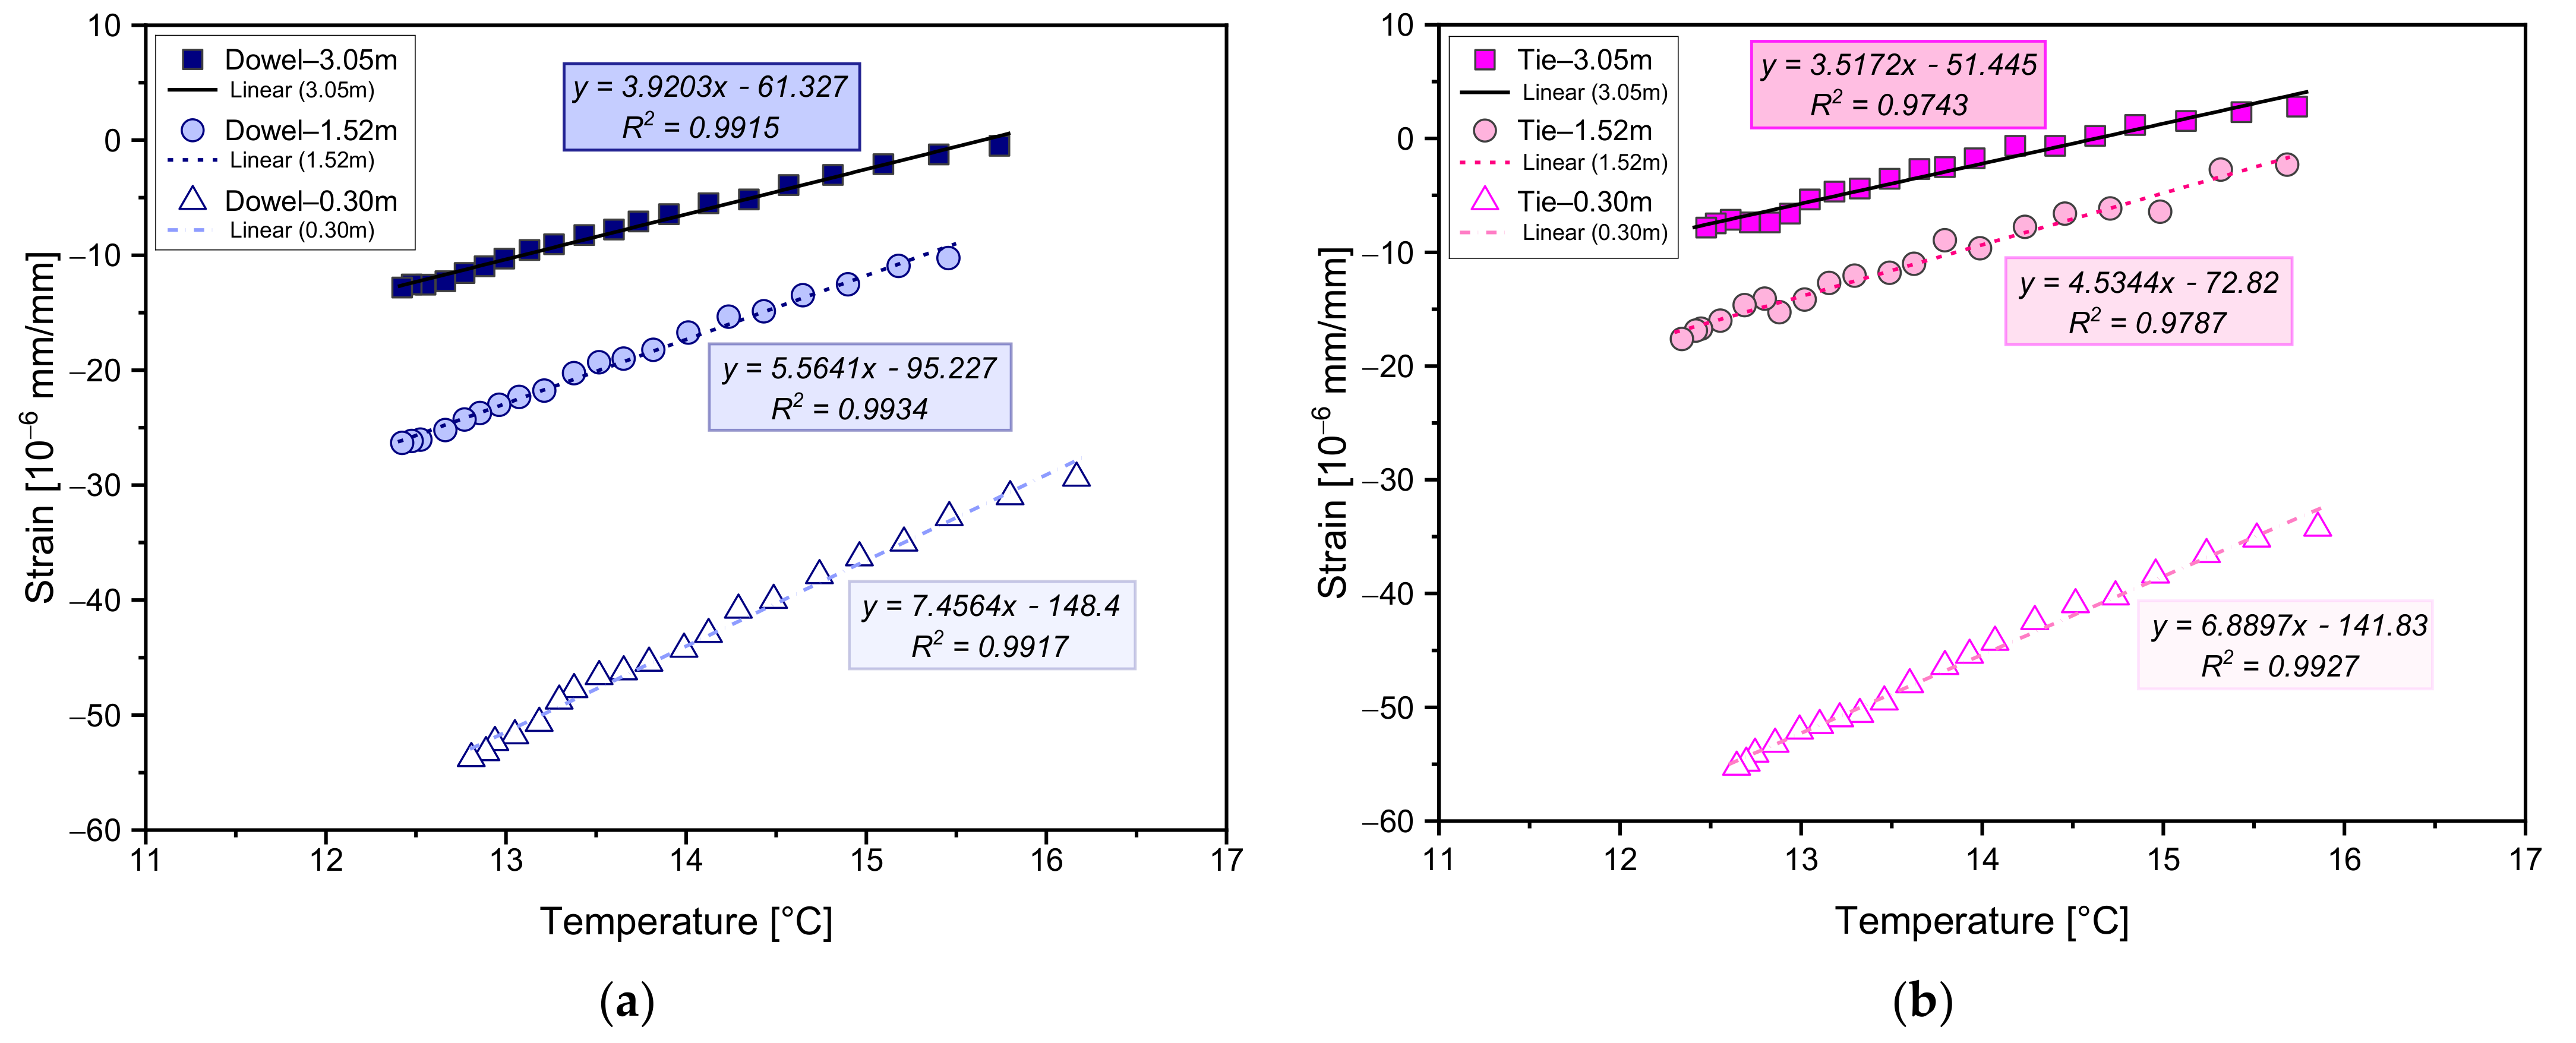
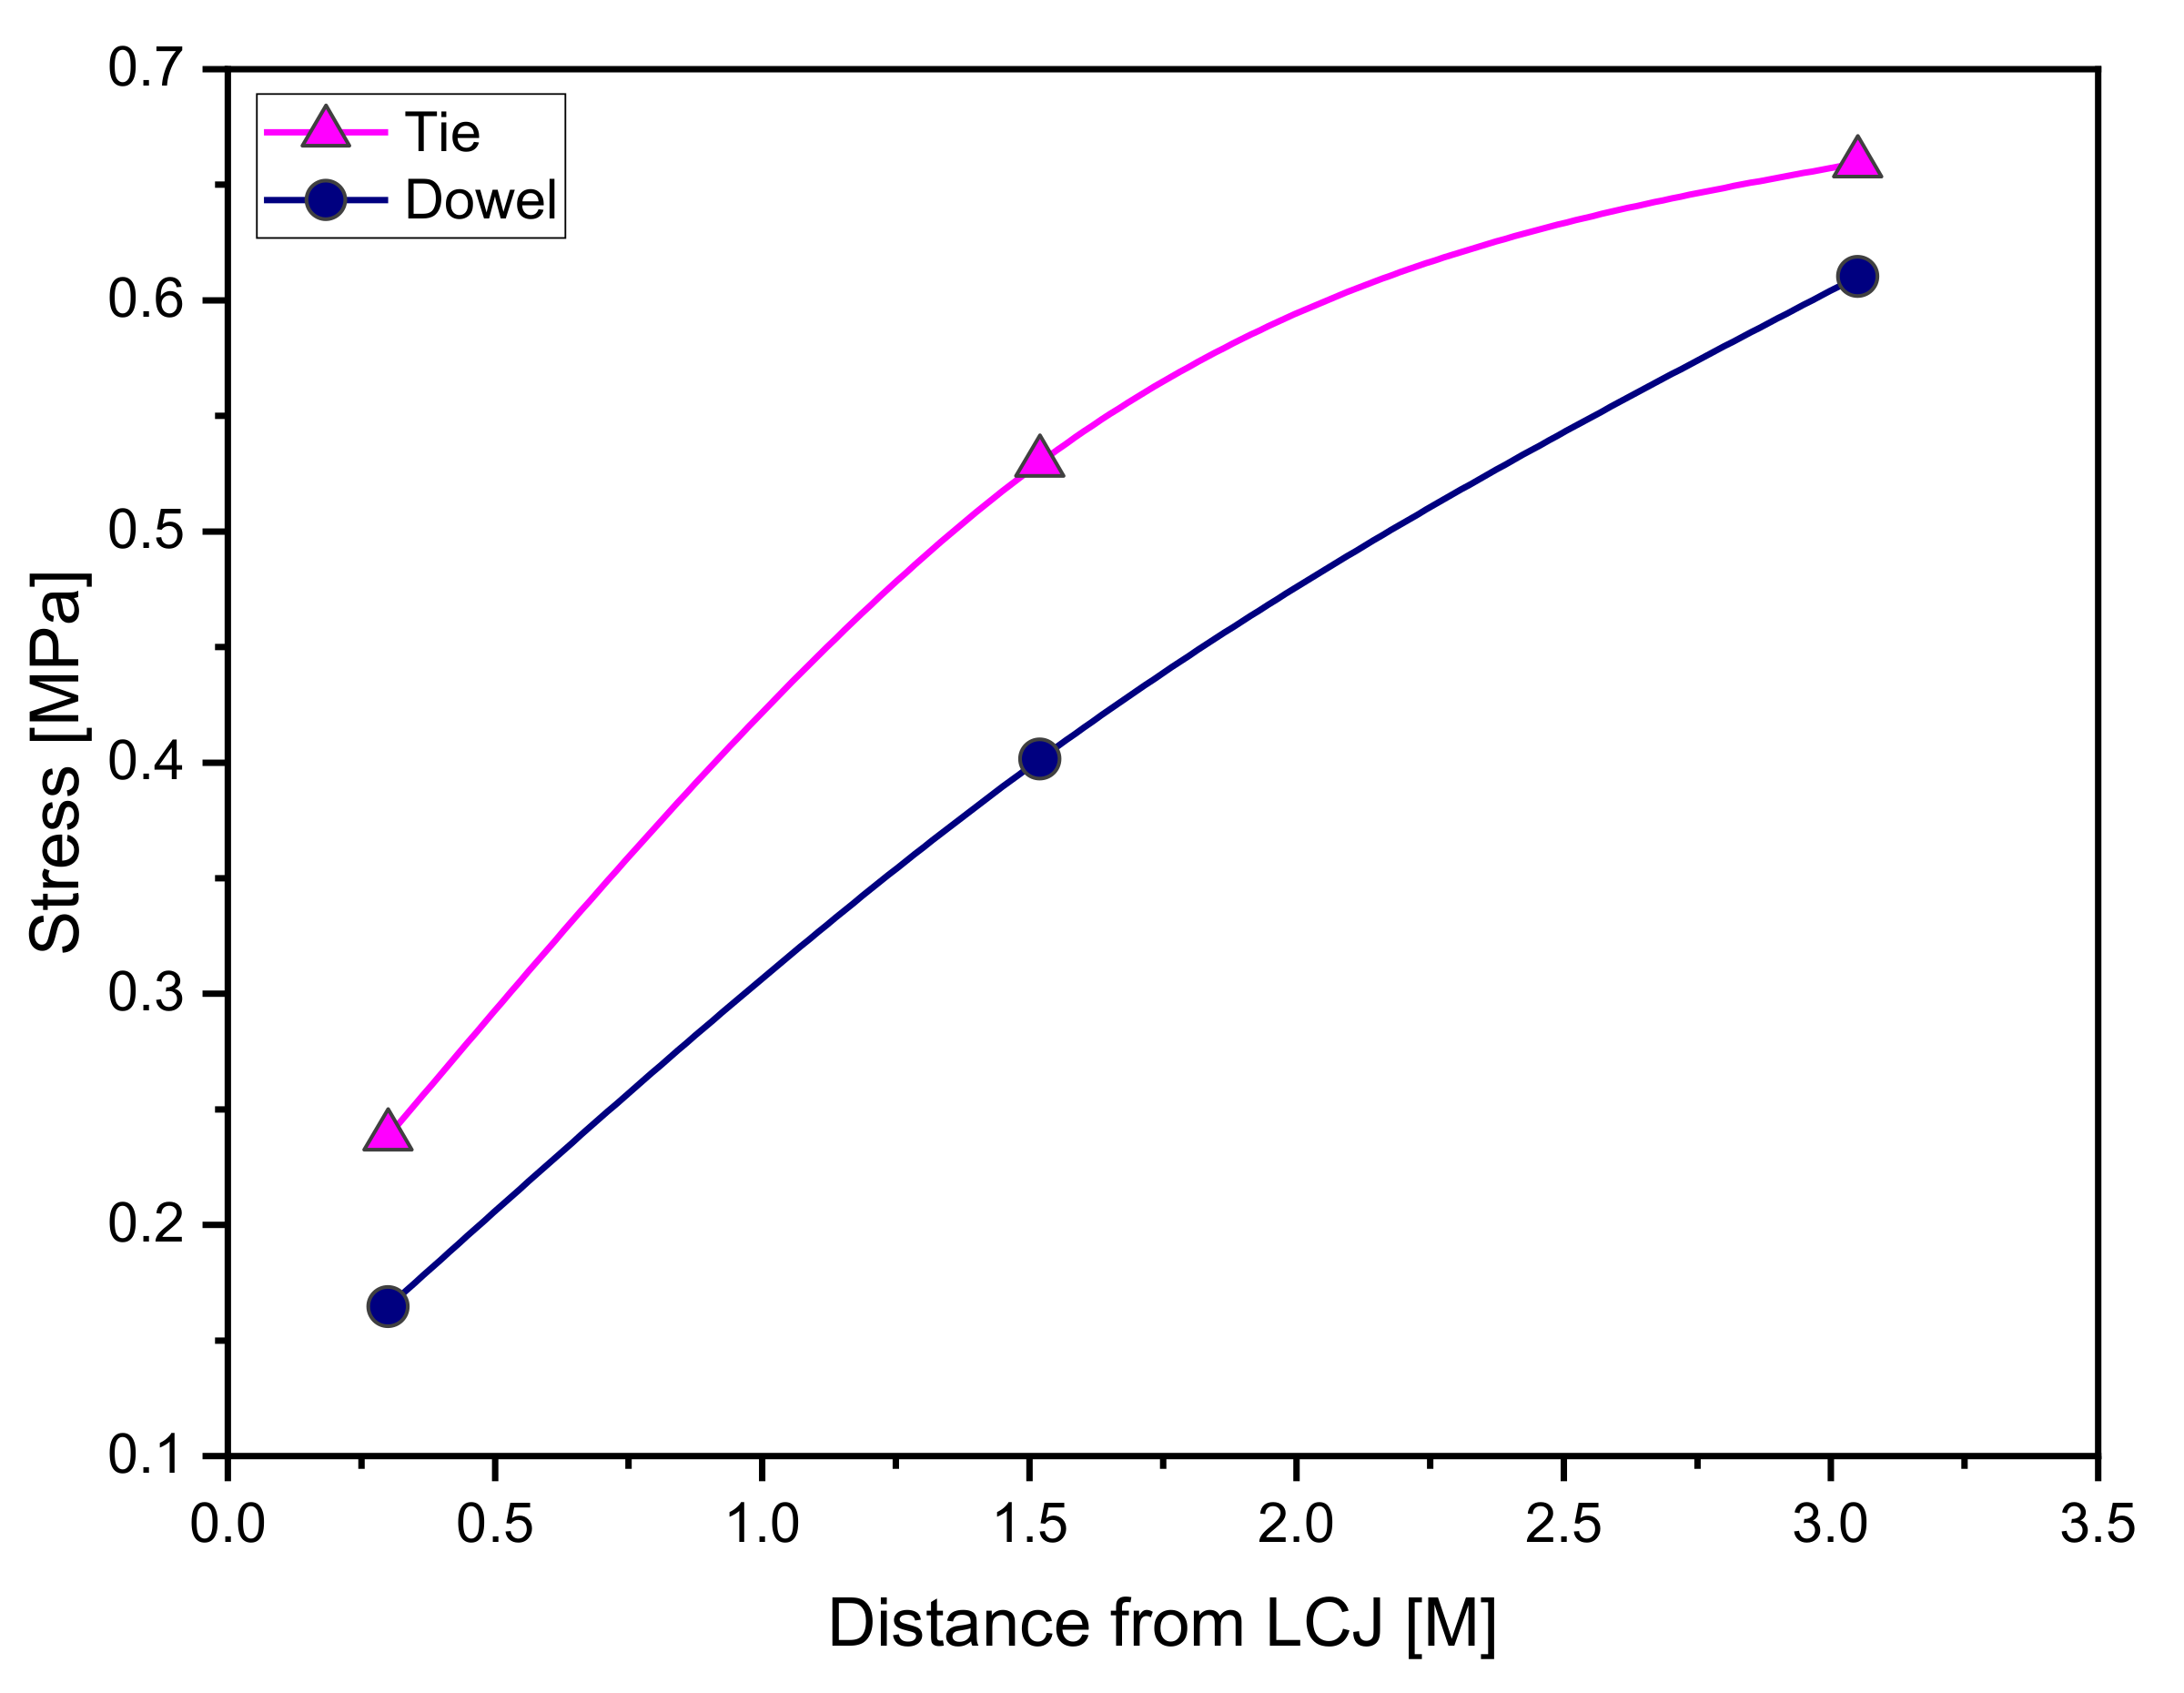
  • Given temperature variation, the variation in concrete strain in the transverse direction was more restrained by the tie bar. This caused higher stress development in the concrete element, which was located at the same distance from the LCJ, in the tie bar section than the dowel bar section. As the measured concrete element moved further away from the LCJ, the developed stress of the concrete element increased.
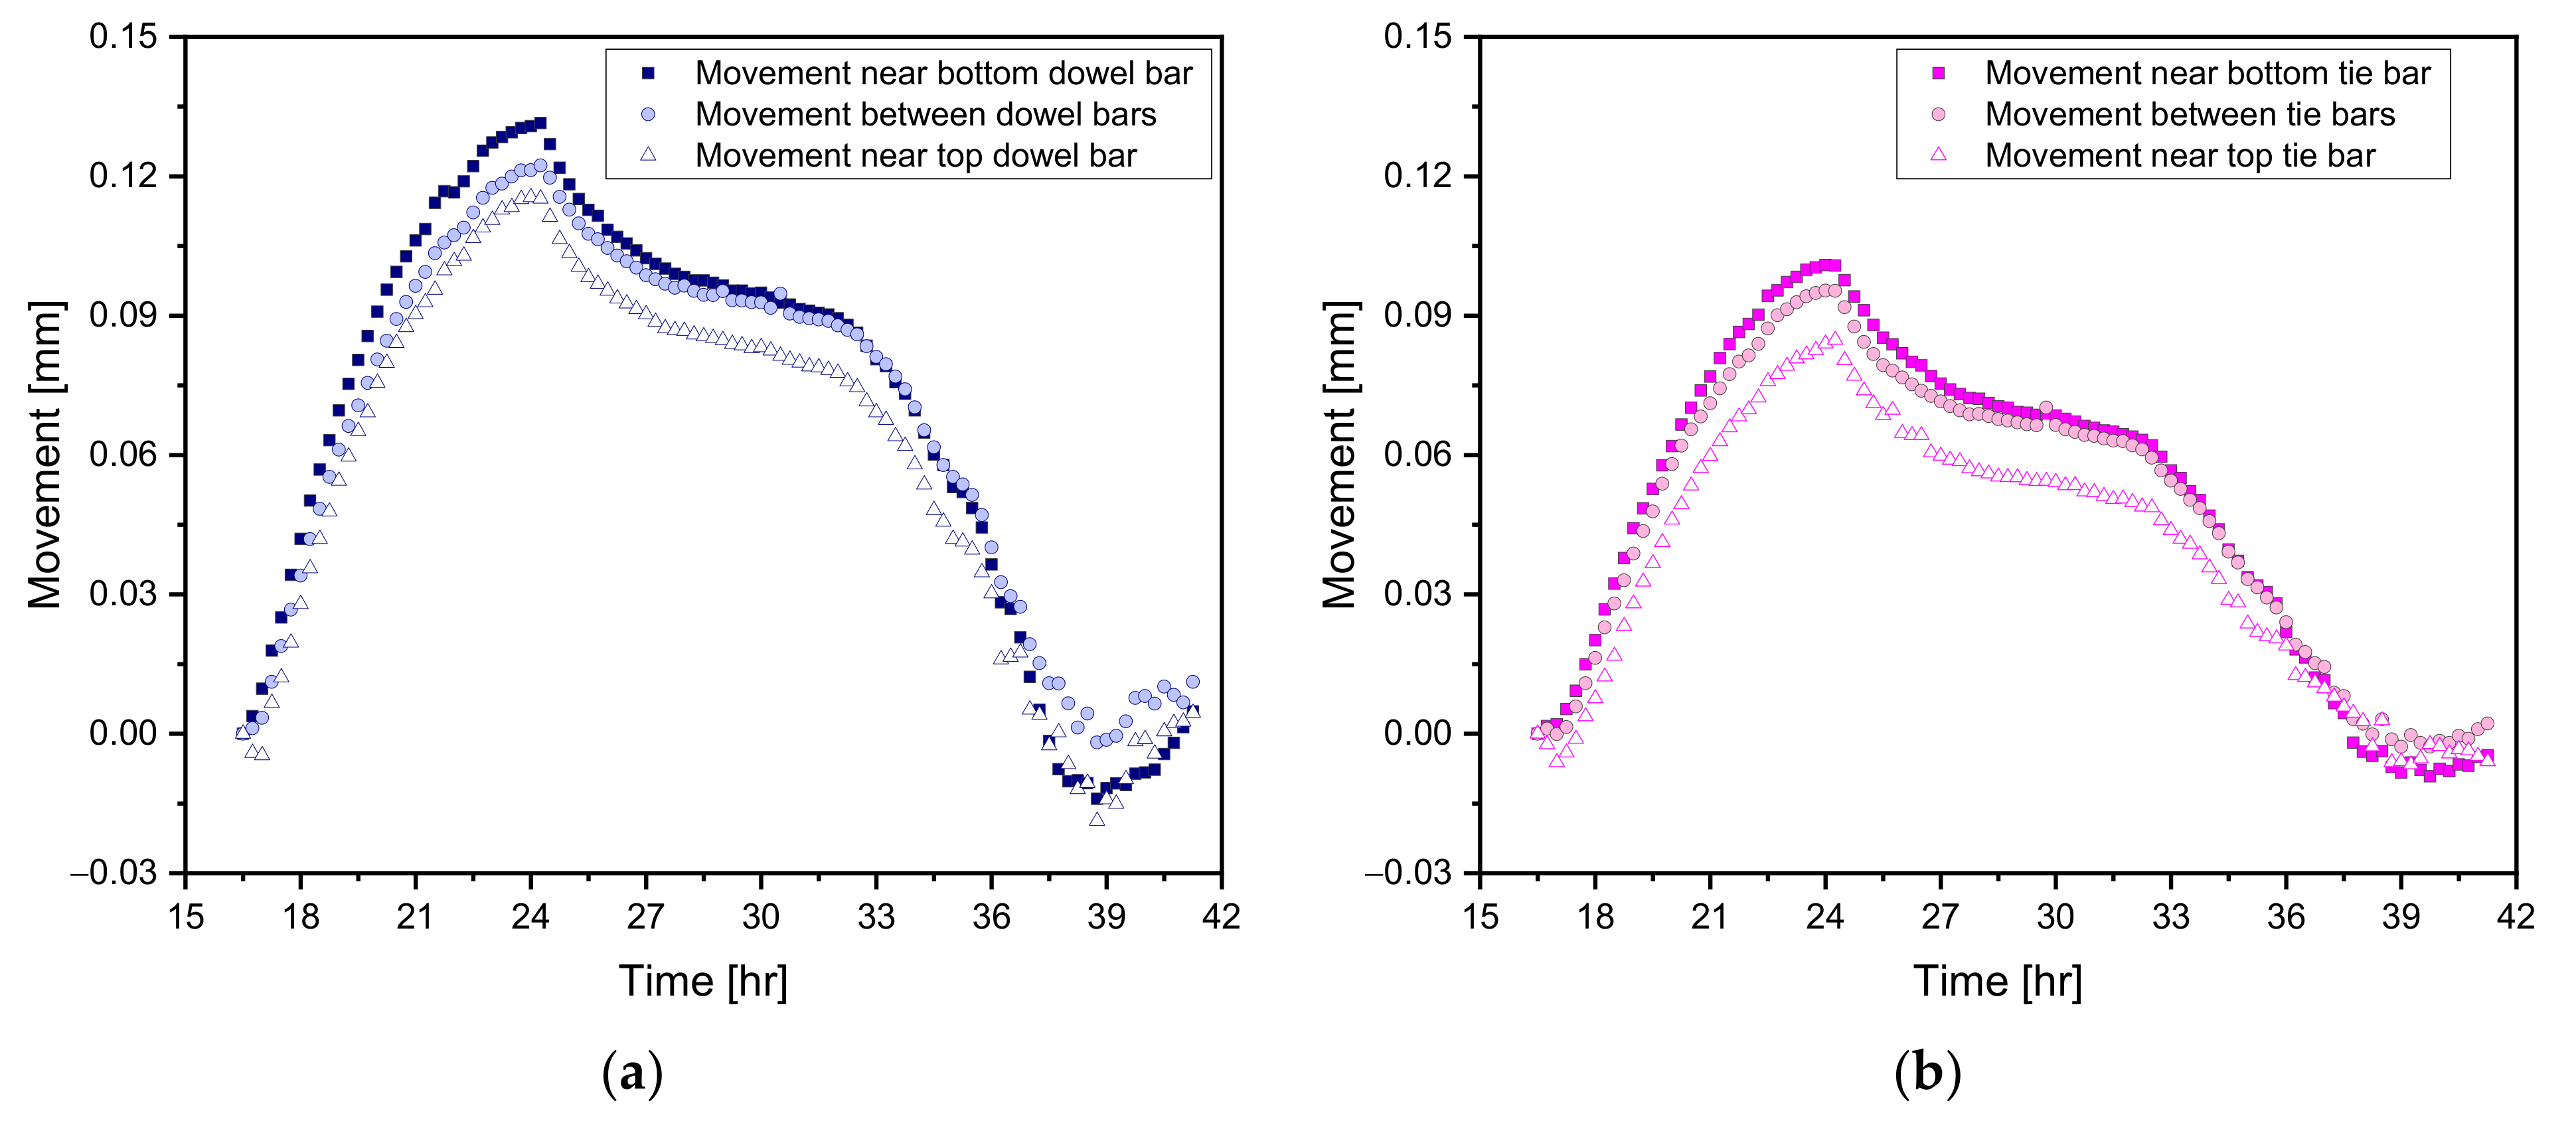
  • The concrete element was more restrained when it was closer to the dowel or tie bars in the vertical direction. The transverse movement of the slab at the LCJ was more restrained by the top layer of the dowel or tie bars and less by the bottom layer. The tie bar also provided more restraint of movement in the transverse direction than the dowel bar.
The findings of the study demonstrated that the concrete stress decreases as dowel bars are placed at the LCJs, which implies that opting for dowel bars may reduce the potential for longitudinal cracking. However, simultaneously, the use of dowel bars causes movement in the transverse direction at LCJs that becomes considerably larger than while using tie bars; this may result in increased potential for lane separation. Therefore, it is difficult to conclude that the use of dowel bars in LCJs is effective in reducing the risk of potential longitudinal cracking, as compared with tie bars. In addition, if the conditions are appropriate (concrete with large CTE and modulus of elasticity, ambient temperature variations that cause large non-linear concrete temperature variations through the slab depth, and large built-in curling), transverse concrete stress could become large enough to increase the potential for longitudinal cracking. This potential may depend on the width (number of lanes tied together) and thickness of the concrete pavement. Furthermore, because the tie bar and dowel bar are typically deformed and smooth steel bars, respectively, different levels of restraint may be provided due to differences in surface properties. Moreover, the opening of the LCJ may vary depending on the thickness of the tie and dowel bars. Therefore, further studies in these areas are required.
Consequently, based on the findings from this study, dowel LCJs are recommended to be designed considering both the advantage of reducing stress in concrete and the disadvantage of increased potential for lane separation. It is expected that the calculated stress from measured data through mechanical analysis can provide useful information for the development and verification of the numerical model to adequately predict the potential for longitudinal cracking of PCC pavements while using dowel or tie bars.

Author Contributions

Conceptualization, J.H.Y., M.W. and S.C.; methodology, G.H., J.H.Y. and S.C.; validation, G.H. and J.K.; investigation, G.H., J.K. and S.C.; resources, M.W. and S.C.; data curation, G.H. and J.K.; writing—original draft preparation, G.H. and S.C.; writing—review and editing, G.H. and S.C.; visualization, G.H. and J.H.Y.; supervision, M.W. and S.C.; project administration, S.C.; funding acquisition, S.C. All authors have read and agreed to the published version of the manuscript.

Funding

This research was conducted with the support of the “National R&D Project for Smart Construction Technology (No.21SMIP-A158708-02)” funded by the Korea Agency for Infrastructure Technology Advancement under the Ministry of Land, Infrastructure and Transport, and managed by the Korea Expressway Corporation. This work was also supported by the National Research Foundation of Korea (NRF) grant funded by the Korea government (MSIT) (NRF-2021R1F1A1062654).

Institutional Review Board Statement

Not applicable.

Informed Consent Statement

Not applicable.

Data Availability Statement

Not applicable.

Conflicts of Interest

The authors declare no conflict of interest.

References

  1. Zhang, L.; Ma, B.; Li, Y. 3-D Finite Element Analysis for Evaluating Tie Bars Connection between New and Existing Portland Concrete Pavement. In Proceedings of the 15th COTA International Conference of Transportation Professionals, Beijing, China, 24–27 July 2015; pp. 798–809. [Google Scholar] [CrossRef]
  2. Huang, Y.H. Pavement Analysis and Design, 2nd ed.; Pearson: Upper Saddle River, NJ, USA, 2004; pp. 1–711. [Google Scholar]
  3. Yang, S.; Zhang, Y.; Kaya, O.; Ceylan, H.; Kim, S. Investigation of Longitudinal Cracking in Widened Concrete Pavements. Balt. J. Road Bridg. Eng. 2020, 15, 211–231. [Google Scholar] [CrossRef]
  4. Xiao, D.X.; Wu, Z. Longitudinal cracking of jointed plain concrete pavements in Louisiana: Field investigation and numerical simulation. Int. J. Pavement Res. Technol. 2018, 11, 417–426. [Google Scholar] [CrossRef]
  5. Chen, D.H.; Won, M. Field Investigations of Cracking on Concrete Pavements. J. Perform. Constr. Facil. 2007, 21, 450–458. [Google Scholar] [CrossRef]
  6. Yeon, J.H.; Choi, S.; Ha, S.; Won, M.C. Effects of Creep and Built-In Curling on Stress Development of Portland Cement Concrete Pavement under Environmental Loadings. J. Transp. Eng. 2013, 139, 147–155. [Google Scholar] [CrossRef]
  7. Chen, D.H.; Choi, P.; Chen, K.Y.; Won, M. Slot stitching for longitudinal joint separation repairs. Constr. Build. Mater. 2016, 115, 153–162. [Google Scholar] [CrossRef]
  8. Choi, S.; Won, M.C. Design of Tie Bars in Portland Cement Concrete Pavement considering Nonlinear Temperature Variations. Transp. Res. Rec. J. Transp. Res. Board 2009, 2095, 24–33. [Google Scholar] [CrossRef]
  9. Ha, S.; Choi, S.; Won, M.C. Behavior of Tied Multiple-Lane Portland Cement Concrete Pavement: Effects of Environmental Loading and Dowel Bar use. Transp. Res. Rec. 2010, 2154, 57–77. [Google Scholar] [CrossRef]
  10. California Department of Transportation. Guide for Design and Construction of New Jointed Plain Concrete Pavements (JPCPs). Available online: http://www.dot.ca.gov/hq/esc/Translab/OPD/JPCP-Design-Construction-Guide.pdf. (accessed on 9 June 2021).
  11. Bianchini, A.; González, C.R.; Barker, W.R. Recommendations for the Minimum Thickness of Concrete Pavements Supporting F-15 and C-17 Aircrafts. J. Transp. Eng. 2015, 141, 6014002. [Google Scholar] [CrossRef]
  12. Semendary, A.A.; Steinberg, E.P.; Walsh, K.K. Implementing Ultra High Performance Concrete (UHPC) with Dowel Bars in Longitudinal Joints (Shear Key) in an Adjacent Box Beam Bridge. In Proceedings of the First International Interactive Symposium on UHPC, Des Moines, IA, USA, 18–20 July 2016; Iowa State University: Ames, IA, USA, 2016; Volume 1. [Google Scholar]
  13. Zhou, W.; Choi, P.; Ryu, S.W.; Won, M.C. Evaluation of Pavement Support for Pavement Design. J. Transp. Eng. 2015, 141, 04015019. [Google Scholar] [CrossRef]
  14. Cho, B.H.; Won, M.; Nam, B.H. Layer Composition of Continuously Reinforced Concrete Pavement Optimized Using a Re-gression Analysis Method. Infrastructures 2021, 6, 56. [Google Scholar] [CrossRef]
  15. Nam, J.H.; Kim, D.H.; Choi, S.; Won, M.C. Variation of Crack Width Over Time in Continuously Reinforced Concrete Pave-ment. Transp. Res. Rec. 2007, 2037, 3–11. [Google Scholar] [CrossRef]
  16. Choi, S.; Ha, S.; Won, M.C.; Information, R. Mechanism of Transverse Crack Development in Continuously Reinforced Concrete Pavement at Early Ages. Transp. Res. Rec. J. Transp. Res. Board 2015, 2524, 42–58. [Google Scholar] [CrossRef]
  17. Bazant, Z.P.; L’Hermite, R. Mathematical Modeling of Creep and Shrinkage of Concrete; John Wiley & Sons: New York, NY, USA, 1988; pp. 99–215. [Google Scholar]
  18. Kim, D.H.; Won, M.C. Pilot Implementation of Optimized Aggregate Gradation for Concrete Paving, Center for Transportation Research, The University of Texas at Austin, Report No. FHWA/TX-09/5-9026-01-1, September, 2008. Available online: http://www.utexas.edu/research/ctr/pdf_reports/5_9026_01_1.pdf. (accessed on 10 June 2021).
  19. Choi, S.; Ha, S.; Won, M.C. Horizontal cracking of continuously reinforced concrete pavement under environmental loadings. Constr. Build. Mater. 2011, 25, 4250–4262. [Google Scholar] [CrossRef]
  20. Choi, S.; Won, M.C. Thermal Strain and Drying Shrinkage of Concrete Structures in the Field. Mater. J. 2010, 107, 498–507. [Google Scholar]
  21. Mohamed, A.R.; Hansen, W. Effect of Nonlinear Temperature Gradient on Curling Stress in Concrete Pavements. Transp. Res. Rec. J. Transp. Res. Board 1997, 1568, 65–71. [Google Scholar] [CrossRef]
Figure 1. Overview of field instrumentation.
Sustainability 13 11217 g001
Figure 2. VWSG installed in the field.
Sustainability 13 11217 g002
Figure 3. Crackmeters installed in each test section.
Sustainability 13 11217 g003
Figure 4. Detailed locations of crackmeters installed in test sections.
Sustainability 13 11217 g004
Figure 5. Typically measured temperature and strain at (a) 0.30 m, (b) 1.52 m, and (c) 3.05 m from the LCJ in two test sections.
Sustainability 13 11217 g005
Figure 6. Measured strain at different distances from the LCJ in (a) dowel bar and (b) tie bar test sections.
Sustainability 13 11217 g006
Figure 7. Measured transverse displacement across the LCJ at different locations from (a) dowel bar and (b) tie bar.
Sustainability 13 11217 g007
Figure 8. Nonstress cylinder installed in the field.
Sustainability 13 11217 g008
Figure 9. Rate of concrete strain due to temperature changes.
Sustainability 13 11217 g009
Figure 10. Development of elastic modulus of concrete.
Sustainability 13 11217 g010
Figure 11. (a) Measured temperature profile and (b) temperature gradient of test section.
Sustainability 13 11217 g011
Figure 12. Variation in strain due to temperature changes in the (a) dowel bar and (b) tie bar test section.
Sustainability 13 11217 g012
Figure 13. Calculated stress of concrete elements at different distances from the LCJ.
Sustainability 13 11217 g013
Table 1. Configurations of concrete mixtures used in test section.
Cement
(Type I/II)
[kg/m3]
Fly Ash
(Class F)
[kg/m3]
Water
[kg/m3]
w/bCoarse
Aggregate
[kg/m3]
Fine
Aggregate
[kg/m3]
Air Entraining Agent
[mL/m3]
Water Reducing Admixture
[mL/m3]
Air
Content
[%]
Slump
[mm]
200661200.4512117431556204.533
Publisher’s Note: MDPI stays neutral with regard to jurisdictional claims in published maps and institutional affiliations.

