
Fibre-Reinforced Concrete Is Sustainable and Cost-Effective for Water-Retaining Structures


1
Mott Macdonald, Newcastle upon Tyne NE1 4SN, UK
2
School of Civil Engineering, University of Leeds, Leeds LS2 9JT, UK
*
Author to whom correspondence should be addressed.
Sustainability 2021, 13(20), 11479; https://0-doi-org.brum.beds.ac.uk/10.3390/su132011479
Submission received: 13 August 2021
/
Revised: 4 October 2021
/
Accepted: 13 October 2021
/
Published: 18 October 2021
(This article belongs to the Collection Advanced Materials, Systems and Policies for Achieving Sustainability Goals in Construction)
Abstract
:Although fibre-reinforced-concrete (FRC) is increasingly used, it has been occasionally applied to water-retaining structures (WRSs), and no comprehensive design guidelines are currently available for the design of WRSs with FRC. A design methodology for such applications based on available recommendations and research has been applied to three reference scenarios representing a wide range of WRSs: a flood defence wall, a weir wall, and a swimming pool wall. For each of these scenarios, alternative designs using different FRC mix designs have been compared through the statistical analysis of several relevant parameters. This study confirms that the use of FRC significantly reduces reinforcement requirements when compared to conventional reinforced concrete solutions. Clear trends have been identified between the structural performance of the resulting WRS designs, the FRC mix characteristics and the fibre type and dimensions. This study has considered not only structural performance but also the total cost and environmental footprint per unit length of WRSs, and these considerations further the case for adoption of FRC in such applications. Overall, fibre dosages below 0.75% and 2% in volume for steel and synthetic fibres, respectively, can lead to WRS designs with lower cost and carbon footprint than their reinforced concrete counterparts.
1. Introduction
The field of fibre-reinforced concrete (FRC) has experienced significant advances since the 1990s, when the first comprehensive report on FRC by the ACI committee 544 appeared [1]. Since then, the measurement of FRC most relevant mechanical properties and, in particular, the characterisation of its flexural performance, have been standardised, leading to standards EN 14651 [2] and ASTM C1609 [3], which have been widely accepted as the basis for the specification of FRC mixes. Despite these advances, the use of FRC in applications where it is intended to make a major contribution to structural performance is still relatively limited when compared to its wider use in applications such as pavements, flooring and tunnel lining segments. This has been attributed to factors like the lack of comprehensive design guidelines until very recently and the risk-averse nature of the construction industry [4], although significant steps are being made in that direction, including notable efforts such as the ACI 544 guide to design with FRC [5] or the report on FRC tunnel segments [6]. One type of application where the use of FRC can be particularly advantageous in the short and medium terms is that of water-retaining structures (WRS), for two main reasons: (i) FRC mixes are well known to effectively reduce cracking [7,8,9], which is key to the serviceability requirements that determine the design of WRSs, and (ii) climate change means increased risk of flooding in many areas [10,11] leading to an increased requirement for WRSs, which justifies the timeliness of this study. This paper is articulated around the hypothesis that the use of FRC will lead to increased efficiency in WRS design.
1.1. Cracking in Concrete
Due to the horizontal loading WRSs are subjected to, flexure is the primary consideration for WRSs. Cracks that occur in concrete members subjected to bending can be due to flexural cracking and shrinkage cracking. Flexural cracking is influenced by different factors, including the section depth, reinforcement ratio, and cover [12], but has little impact on the design of WRSs from the point of view of load-bearing capacity and ultimate limit state (ULS) checks. However, it significantly affects the serviceability checks, which is why the durability requirements as outlined in EN1992-1-1 [13] require flexural cracking to be limited based on the exposure class.
Shrinkage cracks, on the other hand, appear as a result of the time-dependent deformations of concrete, most importantly those resulting from thermal expansion and contraction under restraint. The key reasons for shrinkage cracking are the changing elastic modulus of concrete throughout the setting and hardening stages; the release of heat due to cement hydration; and the fact that all concrete members are subject to some degree of either external or internal restraint [14]. Early age tensile creep partially counterbalances shrinkage deformations, and several studies have found that the autogenous healing and the self-sealing effect (SSE) of concrete reduce crack width and in turn permeability over time [15]. However, in practical terms, these processes have a limited impact and do not necessarily prevent shrinkage cracks from appearing.
The careful design of the concrete mix is an effective measure to control shrinkage cracking by means of limiting plastic shrinkage. This includes measures such as: incorporating chemical admixtures and, in particular, shrinkage reducing agents [16], adjusting the effective water to cement ratio (W/C) [17], or partially replacing Portland cement with supplementary cementitious materials [14].
1.2. Water-Retaining Structures (WRSs)
To control cracking, that is, to maintain crack widths below an acceptable limit, members do not typically require significantly more reinforcement than that required to resist bending forces. However, crack control is of particular interest to the design of WRSs, as Poiseuille’s Law establishes that permeability of the member is dictated by crack width [18].
Current design guidance for WRSs is given in EN1992-1-1 [13] and EN1992-3 [19]. EN1992-1-1 details design flexural resistance and cracking. EN1992-3, on the other hand, provides WRS specific guidance such as the definition of tightness class. Complementing the design guidance in the Eurocode, the CIRIA C766 guide [14] outlines the design process for checking shrinkage cracking. EN1992-1-1 gives a methodology of limited scope for flexural cracking control methods with only a few ways of reducing cracking to satisfy the requirements. The CIRIA C766 guide [14] builds upon this methodology to include further crack controlling measures such as the reduction of cement content through the use of supplementary cementitious materials (SCMs), the use of flexible formwork and minimising the thermal expansion of aggregates.
The guide “Concrete Basements” [20] recommends designing to minimise shrinkage cracking through avoiding end restraint. Restraint is a key consideration for WRSs to determine the restraint factor, which accounts for the level of restraint experienced by a concrete member. Work by Mcleod [21] highlights the high economic cost of meeting these crack width requirements in addition to finding that the crack model used in EN1992-1-1 [13] is conservative when compared to other models.
As the current design practices for WRSs largely revolve around additional steel reinforcement in order to effectively control cracking, WRSs often have a higher cost and embodied carbon per unit volume of concrete when compared to other applications. These two aspects are particularly pertinent as, throughout the world, flood defences are being constructed at an increasing rate: for example, in the UK, increased flood risk is estimated to require an investment of £920 million per year [10]. Therefore, if WRSs can be designed with less steel reinforcement, there is significant scope for a more efficient use of resources and extending the use of FRC in WRSs can be a significant step in that direction.
1.3. Fibre-Reinforced Concrete (FRC)
FRC has several advantages when compared to conventional concrete, most notably in relation to residual flexural strength in its cracked state, enhanced toughness in flexure and tension, stress redistribution and crack control [9]. Because of these characteristics, when reinforced concrete elements are made with FRC it is possible to reduce the amount of conventional reinforcement and sometimes even completely eliminate it [22,23,24,25,26]. Typical examples of applications of FRC include floor slabs cast in situ and precast earth retaining units. Its prevalence in the construction industry is continuously growing but still remains modest with respect to its potential [27].
The most prevalent fibre types currently utilised in industry are steel (crimped or hooked end) and macrosynthetic fibres. Hooked end steel fibres are often utilised due to their improved anchorage within the concrete, and have been shown to lead to 38% higher shear strengths in beam members [28]. The tensile strength of steel fibres has also been found to be instrumental in flexural performance of SFRC [29]. Macrosynthetic fibres made of materials such as polypropylene or polyolefin are, in some applications, preferred over steel fibres due to a more moderate impact on workability [30]. Therefore, current knowledge leads to steel fibres being favoured over macro-synthetic fibres where flexural and shear performance are critical, whilst macro-synthetic fibres are generally utilised in less demanding applications where workability is a concern.
There is no shortage of studies concluding that the use of FRC can effectively reduce both shrinkage and flexural cracking with respect to conventional concrete [7,9,31,32]. The reduction of shrinkage and flexural cracking makes them more watertight, which makes FRC well suited for WRSs. Also, there has been an increasing number of applications where FRC has been used in more demanding, less typical cases. Projects such as the lagoon at Universal studios, Osaka, and the Oslo swimming pool complex [33] demonstrate that macro-synthetic FRC can be effectively deployed in WRSs to control cracking.
1.4. Significance of This Study
The design guidance currently available to designers in relation to FRC structural elements includes the provisions concerned with FRC in the Model Code 210 [34] and the more recent guide to design with FRC prepared by ACI Committee 544 [5]. Both present methodologies for the determination of flexural and shear capacity of the concrete member are based on design values for the residual flexural strength parameters as per the characterisation test prescribed by EN14651 [2]. Although the Model Code also proposes a method of calculating the width of flexural cracks, the design guidance currently available is heavily focused on ultimate limit state design and as a result does not cover all of the checks relevant to WRSs, in particular shrinkage cracking and deflection.
The study reported in this paper is concerned with the applicability of FRC to WRSs, proposing a consistent framework for the design of this type of structures with FRC, thereby addressing the aforementioned gap in current knowledge which seems to have been preventing the uptake of FRC in WRSs. By demonstrating that FRC solutions to WRSs can reduce cost and embodied carbon, in addition to showcasing the structural design process, it is hoped that the paper highlights the economic and environmental benefits of FRC in WRSs.
2. Methodology
2.1. Overview of the Methodology
The central idea of this study was to generate alternative structural design solutions for three reference WRS scenarios, considering a wide range of different FRC mixes by varying the fibre material, the dosage of fibres, the water-to-binder-ratio, cement content and the aggregate content. Since this led to hundreds of different combinations, it was necessary to formulate the design framework in a way that allowed semi-automated calculations. This was used to carry out the structural design of the different variations of each WRS scenario in parallel, allowing the comparison and design optimisation. Since there are no unified, comprehensive design provisions for the serviceability design of FRC members, some semi-empirical equations proposed in literature were combined with the available design recommendation [5,34] to produce an adequate methodology for the design of WRS utilising FRC.
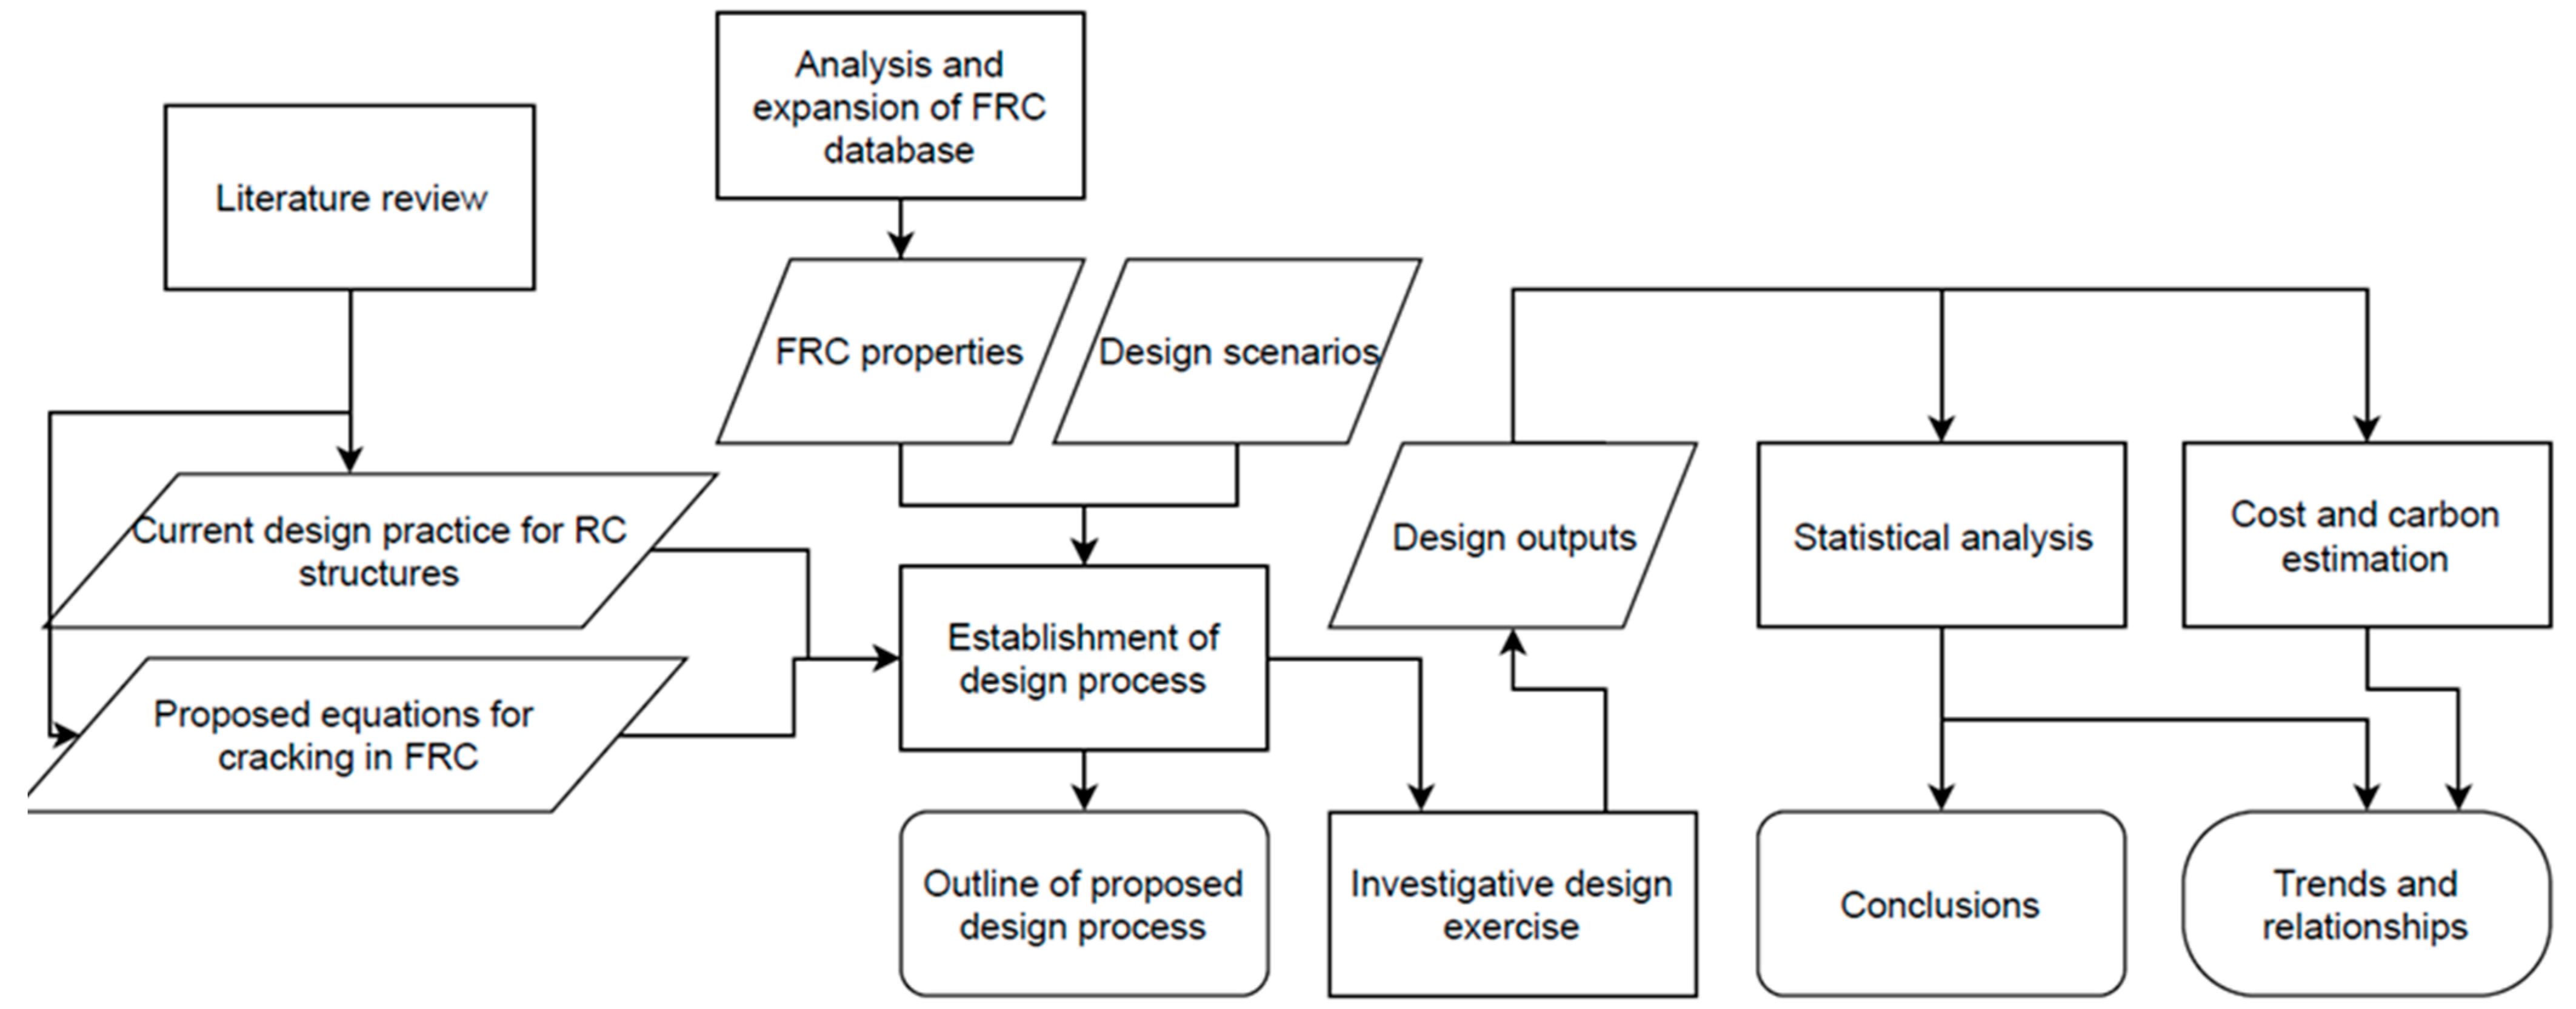
This methodology was applied to a range of mixes representing varying concrete strengths, fibre types, and other parameters to produce thousands of alternative solutions to the scenarios considered. The results were then statistically analysed to relate fibre type and dosage to the embodied carbon and cost per unit volume of concrete in each of the WRS scenarios considered. These relationships allowed the determination of the range of fibre dosages within which the use of a certain type of fibre can lead to a design which is more effective than a standard reinforced concrete design in terms of cost and environmental footprint. Figure 1 outlines the workflow of the project.
2.2. FRC Mixes and Types of Fibre Considered
In order to ensure a wide range of validity for the results of this study, numerous different FRC mixes were considered. The mix designs were generated as combinations of the different variables in Table 1. In all cases, the total aggregate content was assumed at 1600 kg/m3, and the total paste content (cement, SCMs, and water) at 800 kg/m3, the cement type being CEM II/B-S or CEM III. All possible combinations of the different values in Table 1 led to a total of 7128 FRC mixes.
Hooked-end steel (S), straight polypropylene (PP), and straight polyolefin (PO) fibres were considered, assuming an elastic modulus of 200 GPa, 12 GPa, and 10 GPa, respectively. These three fibres were selected as they represent the majority of fibres currently utilised in industry, although the authors appreciate that several other fibre types can be used in different amounts. The fibre content, expressed as fibre volume fraction (Vf, in percentage) was varied between 0% and 1.5%, a range that is representative of most FRC mixes [35]. Three different sizes were considered for each type of fibre. Steel fibre dimensions were based on commercially available hooked-end fibre sizes, with lengths between 30 and 60 mm, and aspect ratios between 40 and 55. A constant aspect ratio of 67 was assumed for PP and PO fibres, with lengths between 48 and 60 mm, based on commercially available straight fibres.
In the design of structural elements with FRC, the flexural capacity of the material is specified through fR1 and fR3, which are the residual flexural strength values corresponding to a crack opening of 0.5 mm and 1.5 mm respectively in accordance with the standard EN14651 [2]. In this study, no experimental characterization tests were carried out as the high number of FRC mixes resulting from the different combinations of values in Table 1 made it unfeasible. Instead, for each of these combinations fR1 and fR3 values were estimated by means of regression equations which were derived from the analysis of the database of FRC mixes and residual flexural strength results compiled as part of the ongoing project ‘Optimization of FRC mixes using data mining’ [36]. The same procedure was followed to estimate compressive strength values.
Representative values for the interfacial shear strength between fibre and concrete, which was necessary to account for the effect of fibres on shrinkage, was assumed to be 3.5 MPa for steel fibres and 0.1 for PP and PO fibres, based on the pull-out test results reported by Abbas and Khan [37].
2.3. Reference Water-Retaining Structures: Design Scenarios
Three real WRS projects were used as reference design scenarios, representative of a range of WRS applications with varying levels of stringency. All scenarios were designed as a repeating unit of 1 m, their section being as shown in Figure 2, as loading and geometry were constant throughout the length of each structure. The most critical cross-sections from the point of view of flexural design are also identified in Figure 2. The structural design calculations and checks were all focused on these cross-sections. A summary of the most relevant design parameters for each scenario is presented in Table 2.
Scenario A is a water-retaining wall to contain a swimming pool. This vertical cantilevered wall is not backfilled as is often the case with swimming pools, meaning it experiences a higher bending moment. The second scenario (B) is a reinforced concrete weir wall dividing an existing wash water recovery tank. This wall is designed as a class 1 WRS vertical cantilevered section which is connected to a footing via post-installed reinforcement bars. The third scenario (C) is a flood defence wall in a saline environment. This wall is fixed to the footing in a similar manner to scenario B and needs to resist heavier brackish water in addition to being subject to a harsher environment. All scenarios have a structural class of S4 and a maximum crack width wmax of 0.3 mm [19].
As the three scenarios considered are all similar structures, that is, water-retaining vertical cantilevered walls cast in sequential bays, the following parameters were kept constant as per Eurocode 2 (EN1992-1-1) [13]:
- The coefficient k1, which takes into account the bond properties of reinforcement when calculating crack widths, was taken as 0.8, which corresponds to high-bond bars being used as reinforcement (Section 7.3.4 of Eurocode 2);
- The coefficient k2, which takes into account the distribution of strain when calculating crack widths, was taken as 0.5, as the cross-sections designed were subject to bending (Section 7.3.4 of Eurocode 2);
- The coefficient kt, dependent on the duration of the load, was taken as 0.4, which corresponds to long-term loading (Section 7.3.4 of Eurocode 2);
- The factor K, to take into account different structural systems when it comes to deflection control, was 0.4 as all members were cantilevered (Table 7.4N of Eurocode 2);
- The relative humidity was taken as 85%, typical for most of England.
2.4. Structural Design
2.4.1. Design in Reinforced Concrete (RC) without Fibres
The design of RC solutions was carried out to EN1992-1-1 [13] and EN1992-3 [19] assuming a simplified stress block and following supplementary guidance from CCIP-060 [38] and CIRIA C766 [14], in particular regarding shrinkage cracking checks.
All final designs for RC were verified against flexural capacity, shear capacity, deflection, flexural cracking and shrinkage cracking checks. Transverse reinforcement was assumed to be positioned outside of the longitudinal reinforcement, and when the shear strength of the concrete alone would have been sufficient to resist shear forces, a nominal transverse reinforcement of 12 mm bars at maximum spacing was considered. The design moments were calculated assuming a re-distribution ratio (δ) of 1.
2.4.2. Design in Fibre-Reinforced Concrete (FRC)
To design FRC members in flexure, the ACI 544 Guide to Design with FRC [5] and the Model Code 2010 [34] were followed. The design properties of FRC for the ultimate limit state in flexure were determined assuming the rigid plastic model proposed by the Model Code 2010 [34], which accounts for the characteristic residual tensile strength of FRC. In order to determine whether fibres could fully replace conventional reinforcement, the corresponding checks in line with Section 5.6.3 of the Model Code 2010 [34] were carried out. In those cases where longitudinal reinforcement was necessary in addition to fibres, the required reinforcement was calculated based on the difference between the design bending moment and the contribution of fibres to flexural capacity. Shear checks were carried out to the Model Code 2010 [34].
In terms of serviceability limit states, deflections were checked. As the reference WRSs were cantilevered elements, horizontal displacements at the top of these structures were assimilated to deflections. For the verification of maximum instantaneous deflection values in FRC members, the work by Amin et al. [39] was followed. These deflection values were checked against the maximum allowable deflection as per the Model Code 2010 [34].
The flexural cracking check for FRC members was carried out in a similar manner to RC members. The maximum permissible crack width, wlimit, was determined to guidance from EN1992-1-1 [13] and EN1992-3 [19]. In order to take into account the effect of fibres, the actual crack width for FRC, wk,F, was determined by Section 7.7.4 of the Model Code 2010 [34], and checked against wlimit. In those cases where wlimit was exceeded, the necessary additional reinforcement was introduced.
There is limited guidance for the consideration of shrinkage cracking when it comes to the design of FRC elements. The methodology followed in this study was based on the existing RC shrinkage cracking methodology as per CIRIA C766 [14], with some modifications. To account for the reduced autogenous shrinkage of FRC, a substitute term for ultimate autogenous shrinkage was used based on previous work [40]. Also, to account for the additional strain-resisting capacity of FRC versus conventional concrete, the tensile strain capacity term was modified to include the additional capacity afforded by the residual flexural strength of FRC.
2.5. Material Amounts, Costs, and Embodied Carbon Values
In order to quantify the cost and embodied carbon of each structural solution produced for each scenario, the mass of all materials per unit length of WRS were calculated. In these calculations, concrete (excluding reinforcement) was assumed to have a density of 2400 kg/m3; the density of steel was assumed at 7850 kg/m3 for both conventional reinforcement and fibres; and the density of PP and PO fibres was considered as 946 and 970 kg/m3, respectively. To determine the total embodied carbon per unit length, the mass of each material was multiplied by its specific embodied carbon using the values reported by Hammond and Jones [41], taking into account the specific contribution of different FRC mix constituents. To determine the total cost per unit length, the unit costs as per the CESMM 4 Carbon and Price Book 2013 [42] were considered.
3. Results and Discussion
3.1. Mix Proportions and Mechanical Properties
The structural design of the three scenarios A, B, and C shown in Figure 2 was carried out considering the RC and FRC mix designs resulting from all combinations of the values summarised in Table 1, and following the methodology outlined in 2.4. Those combinations that did not satisfy the flexural crack width checks due to very low strength were discarded as they did not correspond to feasible, realistic specifications. These represented 4.2%, 15.9% and 0% of the cases for scenarios A, B and C, respectively.
The distribution of fR1 and fR3 values estimated for all these cases was inspected, as these are the residual flexural strength parameters relevant to the specification of, and design with FRC. The violin plots showing their frequency distributions, segmented by fibre type, are presented in Figure 3. The white boxes in these plots represent the interquartile range for each set of values, which contains the central 50% of values around the average; and the black squares represent the 5th and 95th percentiles.
As Figure 3 shows, all possible combinations of the mix design parameters in Table 1 led to a sufficiently wide range of fR1 and fR3 values being considered for the structural design of the three WRS scenarios, which was key to ensure the representativeness of the results from this study. Although the plots in Figure 3 are segmented by fibre type, it is important to note that several other mix design parameters were varied simultaneously (see Table 1), which explains the high scatter. Across all mixes, fR3 values were generally lower and more scattered than fR1 values, and the frequency distributions were significantly skewed, i.e., high values were less common than low or average values.
Regardless of the fibre type, longer fibres were generally associated with higher fR1 and fR3 values. As said above, the FRC mix designs generated for this study were generally characterised by a strain-softening behaviour [43], and fR3 was only estimated as higher than fR1 in cases where fibres with a length of 60 mm were considered at a high volume fraction. This strain-hardening behaviour of FRC mixes with longer fibres was indicative that they can be more efficient when it is the ULS design which dictates the reinforcement requirements, because higher fR3 values implies higher moment capacities, thus reducing the need for conventional reinforcement. In fact, ULS design was often the critical check for many of the cases analysed across the three scenarios, and as a consequence longer fibres were found to be better suited to such design situations.
3.2. Effect of Fibres on Load-Bearing Capacity and Cracking of the Critical Sections
In order to understand the influence of FRC mix design on the load-bearing capacity of the critical sections identified for WRS design scenarios A, B, and C, the contribution of fibres to the moment capacity of the section (Mn-FRC) and the shear capacity of the section (VRd,F) were analysed. As the trends observed for each of the three scenarios were all very similar, the results presented in this section correspond to only one of them (scenario A) for comparative purposes.
The bars in Figure 4 show the average moment capacity contributed by the fibres (values on the left axis), whilst the lines represent their contribution to the shear capacity of the section (values on the right axis). For the three fibre types considered in this study, longer fibres were associated with a higher contribution to the bending moment capacity, whilst shorter fibres resulted in a higher contribution to shear strength. This difference was particularly marked in relation to steel fibres.
The positive effect on moment capacity of using longer fibres was attributed to the fact that the moment capacity of an FRC section depends on fR3, and FRC mixes with longer fibres were generally associated with higher residual flexural strength and, in particular, higher fR3 values, as discussed in the previous section. This was consistent with the current understanding of how FRC members perform in flexure. A longer fibre length means that their crack bridging action is more prominent [44]. When crack bridging does happen, a longer fibre length means that the fibre can withstand a greater force before experiencing a pull-out failure. Also, the capacity of a fibre to resist a pull-out failure is a function of not only the shear strength of the fibre-matrix interface [37] but also the surface area that this shear strength can act over. Therefore, longer fibres with increased surface area can resist higher tensile forces before failure by pull-out. Another aspect to take into account is that the fibres bridging the cracks can fail by rupture or elongation rather than being pulled out of the concrete matrix. Given the big difference between steel and PP/PO in terms of elastic modulus, this would explain why the effect of fibre length on moment and shear capacity is more marked for steel fibres than PP or PO fibres in Figure 4.
The negative correlation between the length of fibres and their contribution to shear capacity was attributed to this being affected by the number of fibres that a shear failure plane can intercept, which in turn depends on the number of fibres per unit volume of concrete. Since the number of fibres per unit volume is, for any given fibre dosage or volume fraction, inversely proportional to the fibre length, it follows that the number of fibres intercepted by a shear failure plane is higher for shorter fibres. In consequence, as Figure 4 shows, FRC mixes with shorter fibres are generally better suited to structural applications in which shear is the determining check. On the other hand, whenever the flexural capacity is the determining factor, longer fibres seem to be more appropriate.
In addition to the contribution of fibres to the moment and shear capacities of the most critical cross-section in scenarios A, B and C, their impact on crack width values was also checked through the corresponding design calculations. With the introduction of fibres, flexural cracking was drastically reduced from the average crack width of 0.18 mm which was obtained for the RC solutions. Fibres of any material, as long as they were considered in dosages of at least Vf = 0.3% and their length was not less than 50 mm, led to virtually negligible crack widths, with the corresponding reductions in reinforcement requirements. However, in the three WRS scenarios considered in this study, the flexural cracking benefits of fibres were largely unrealised because of their relatively high crack tolerance as class 1 structures [19]. In class 2 structures, where no through cracks are tolerated [19], these reductions in reinforcement requirements could be much more significant.
Finally, shrinkage cracking checks were also carried out for all the alternative FRC mix designs generated for the three scenarios. Shrinkage cracking was substantially reduced by the introduction of fibres, as they reduce the restrained strains and increase the tensile strain capacity. In fact, none of all the FRC mixes were predicted to experience any shrinkage cracking at early-age or the long-term conditions. These results were consistent with literature concerned with the effect of fibres on shrinkage cracking [45]. Furthermore, little difference was observed between the different dosages considered, leading to a similar conclusion to that made by [46], that high dosages are not required to control shrinkage cracking.
For RC designs, the critical check which dictated the reinforcement amount was almost always the flexural crack width. By using FRC, which often completely eliminated flexural cracking, the conventional reinforcement requirements were significantly reduced. However, almost every design required some form of conventional reinforcement due to the minimum requirements stipulated by the flexural and shrinkage cracking checks. This meant that practically all FRC design cases, no matter the fibre content, had to incorporate the same reinforcement requirements, once again reinforcing the idea that higher fibre dosages do not necessarily provide additional benefits.
3.3. Mix Proportions and Cost of Materials
Cost is often the driving force of change in the construction industry and therefore it is vital to the successful implementation of new materials that they make financial sense. This study intended to find out whether the use of FRC could be more advantageous than conventional reinforced concrete in terms of cost whilst providing equivalent structural performance. A clear relationship between fibre dosage and the total cost of materials (in British pounds, GBP) per metre length of WRS can be seen for the different fibre materials and scenarios considered in Figure 5. This includes the cost of FRC constituents as well as the necessary conventional reinforcement. The total cost of materials corresponding to the RC solution for each scenario is represented by a dashed line. It can be seen that, in all three scenarios, it is possible to have solutions in FRC that are most effective than the RC solution in terms of the total cost of materials.
For any scenario and fibre material, the lowest cost was associated to the lowest fibre dosage considered in the study, i.e., Vf = 0.15%. The increase in cost associated with higher fibre dosages across all three scenarios was entirely due to the higher dosage of fibres, as the minimum reinforcement and concrete parameters did not change with that parameter. The relative contribution of fibres to the total cost of materials obviously varied with Vf. On average, fibres represented 8% of the cost when dosed at Vf = 0.15%, whilst they represented almost half of the cost when dosed at Vf = 1.5%.
For fibre dosages above Vf = 0.15%, the cost of materials followed a linear trend with respect to the fibre volume fraction, Vf. The intersection of each of the lines with the dashed line representing the cost of the RC solution produced a theoretical value of Vf at which the cost of FRC and RC solutions, for each fibre material and scenario, coincide. This value represents the boundary between fibre dosages for which FRC is cost-competitive with RC and those for which it is not.
There was a clear difference between steel and synthetic fibres: as the plots in Figure 5 show, steel FRC solutions were in general more costly than the solutions with synthetic FRC (with PP or PO fibres). However, their relative trends were consistent throughout the three scenarios, with a boundary volume fraction of approximately 2% for synthetic FRC mixes to be cost-competitive. Since this study did not consider cases with Vf higher than 1.5%, this is referred to as the theoretical boundary value for synthetic fibres. With steel fibres, the boundary Vf values were significantly lower, this being in the region of 0.65% for scenarios 1 and 3, and slightly higher (0.87%) for scenario 2. These results demonstrate that, for application in WRSs, fibre dosages below such theoretical boundary values can make FRC cost-competitive with RC solutions.
The cost differences between steel and synthetic fibres at any given volume fraction arise from their different densities. As steel fibres are of equivalent cost and density to steel reinforcing bars, cost parity with RC solutions is reached when their total amount is equal in volume to an equivalent provision of conventional steel reinforcement. On the other hand, a substantially higher volume of synthetic fibres can be introduced until such cost parity is reached, due to their density being much lower than that of steel. Although there is certainly a difference between steel and synthetic fibres with regard to crack control, with steel fibres having a greater effect on flexural cracking [30], the majority of applications in WRSs would be more cost-effective using synthetic FRC rather than steel FRC.
Another important aspect to highlight in relation to the plots shown in Figure 5 is that they confirm that low to moderate fibre dosages can provide as effective a solution as higher fibre dosages at a lower cost. Not only can FRC mixes compete with the equivalent RC solutions in terms of the total cost of materials for applications to WRSs, but their cost can be kept to relatively low levels as long as fibres are not dosed above Vf = 0.5%.
A statistical analysis was performed to refine the theoretical boundary Vf values to take the variability of the results and the limitations of the study into account. Taking the theoretical boundary Vf for each scenario and fibre material as reference, slightly lower Vf values were defined to compare all the cases with Vf below that value to the corresponding RC solutions. In order to confirm the validity of the hypothesis that such subsets of FRC solutions were more cost-effective than the RC equivalent, a one-tailed t-test was used adopting a 95% confidence level [47]. Also, it was necessary to bear in mind that the solutions analysed in this study took Vf values between 0% and 1.5% and, therefore, there was no evidence to support the validity of any theoretical boundary Vf values above 1.5%. As a result of these considerations, a competitive range of Vf values for each scenario and fibre material was defined. These competitive ranges are shown in Table 3, together with the unit cost (total cost of materials per metre length of WRS) at the theoretical boundary Vf value for each scenario, which coincides with the average cost of RC solutions in each case.
While the fibre material and fibre volume fraction were found to have the most significant impact on cost, the cost implications of alternative fibre lengths were significantly minor within the ranges considered in this study. PO and PP fibre designs reduced in cost on average by 1.3% by increasing fibre length from 48 mm to 60 mm based upon dosages below the boundary dosage. With steel fibres, an average 3.6% decrease in cost was obtained when increasing the fibre length from 30 mm to 60 mm. As discussed in the previous section, longer fibres are generally more effective for FRC applications in WRSs, which are often dictated by flexural cracking and moment capacity, and cost was not found to be an additional issue relevant to the selection of fibre length.
The focus of this paper is on the fibres, but of course the relative proportions of some other FRC mix constituents were also found to significantly affect the cost of solutions for WRSs. The most relevant factor was the cement-to-SCMs ratio which, at lower values, represents a higher cement replacement percentage. As the unit cost of SCMs is lower than that of Portland cement, lower cement-to-SCMs ratios were associated with more competitive FRC solutions. The water-to-cement and water-to-binder ratios, on the other hand, had little to no effect on the total costs. This was attributed to the fact that any substantial savings derived from reducing the cement and/or binder content generally led to reductions in mechanical performance which translated into higher reinforcement requirements, the cost of which offsets any mix proportioning savings.
3.4. Mix Proportions and Embodied Carbon
Figure 6 summarises the relationships observed between fibre dosage and embodied carbon for each scenario and fibre material, showing the average trends based on all cases considered in this study.
As with cost, the embodied carbon of steel FRC solutions increased with the fibre volume fraction with a steeper gradient than that of the synthetic FRC solutions, due to the embodied carbon of steel being substantially higher than that of synthetic fibres. In all cases, average embodied carbon values followed a linear relationship with respect to Vf. The same methodology that has been explained in relation to costs was followed in the analysis of the implications of fibres on embodied carbon. The average embodied carbon for RC solutions were found to be 373.7, 240.42, and 347.01 kg eCO2/m of WRS for scenarios A, B, and C, respectively. To determine the dosage above which the embodied carbon of FRC solutions exceeded that of the RC baseline, a regression analysis was performed to obtain the linear equation relating embodied carbon to fibre dosage for each scenario and fibre material, which was then solved with an eCO2 value equal to that of the RC baseline to determine the theoretical boundary Vf value under which FRC solutions are environmentally competitive with their RC counterparts. Slightly lower Vf values were then established to compare the subset of cases with Vf below that value to the corresponding RC solutions. As with cost, a t-test at 95% confidence was used to confirm the hypothesis that such FRC solutions had significantly lower embodied carbon than the RC solutions. As a result, a competitive range of Vf values for each scenario and fibre material was obtained, which are shown in Table 4 together with the average embodied carbon values per unit length of WRS at the theoretical boundary Vf value for the three scenarios considered.
Both Figure 6 and Table 4 show that FRC solutions can outperform WRS designs in RC in terms of embodied carbon. Synthetic fibres were found to generate a much wider range of cases with significantly lower embodied carbon than RC to the point that their theoretical boundary Vf values exceeded the maximum dosages commonly found in real applications of PP and PO fibres and certainly the limit considered in this study. Based on the evidence generated in this study, the introduction of PP or PO fibres in any dosage up to 1.5% would improve the embodied carbon of any of the three WRS scenarios considered.
This was not the case with steel fibres. On average, the steel FRC solutions corresponding to the maximum fibre dosage (Vf = 1.5%) led to WRS designs which were associated with a 37.5% higher carbon footprint than the RC equivalent. However, it must be noted that a volume fraction of 1.5% is very high for steel fibres: recent studies have confirmed that steel fibres are used in dosages lower than 1.0% in most cases [35,48]. For two out of the three WRS design scenarios considered in this study, steel fibres in volume fractions of up to 0.6% would lead to FRC solutions with a lower embodied carbon than the RC alternatives. Given that steel fibre volume fractions in the region of 0.5% or lower are common in practice [48], it can be said that the use of steel FRC mixes would still be a feasible option to reduce the embodied carbon of those two scenarios. The more restrictive conditions of scenario B would further reduce the maximum steel fibre volume fraction compatible with achieving the goal of an embodied carbon value below the RC reference. Considering the three scenarios together, the competitive range of Vf values for steel fibres would be up to 0.4%, which still allows for steel FRC solutions to be competitive in terms of embodied carbon, but certainly less so than synthetic FRC alternative designs.
Regarding the synthetic FRC solutions, it is interesting to compare the boundary values in Table 4 to those in Table 3. The theoretical boundary Vf values obtained for the synthetic fibres considered in this study (PP and PO) were significantly higher in relation to embodied carbon than the boundary values in terms of costs, indicating that the impact of synthetic fibres on embodied carbon is lower than their impact on cost. Therefore, if the conditions for cost parity are satisfied by a synthetic FRC design, then it can be said that it also satisfies the conditions for eCO2 parity. Contrastingly, in all but scenario A, the boundary dosages for steel fibres were lower than for cost, which indicated that for steel fibres the critical consideration is embodied carbon, whilst for synthetic fibres the opposite is true.
Breaking down eCO2 to the constituent components of FRC yields an interesting comparison when compared to cost. Overall, fibres make up a much smaller portion of an FRC structure’s carbon footprint when compared to cost. This aligns with the fact that the carbon footprint of concrete is not directly represented in its cost [49]. On average, fibres when dosed at Vf = 1.5% make up 29.5% of the total carbon of a mix. What this means for FRC, is that the proportion of eCO2 attributed to fibres is lower, suggesting that designs dictated by eCO2 are less sensitive to increases in fibre dosage. However, this is averaged over all fibre types considered, which is why this conclusion aligns with conclusions drawn from the boundary dosages for synthetic fibres, but not for steel fibres.
4. Conclusions
- The results of the study reported in this paper show that appropriately designed FRC mixes can provide significant reductions in the cost and embodied carbon of WRSs. The economic and environmental merits of utilising FRC for the design of WRSs have been clearly demonstrated, and fibre dosage ranges that make FRC solutions competitive have been derived.
- A methodological framework for the structural design of FRC-based WRSs has been followed, integrating the available code provisions and recommendations for the design of crack-sensitive concrete structures with the current knowledge of FRC mix design and the latest recommendations for the design of structural elements with FRC.
- In applications where reinforcement requirements are dictated by moment capacity, as is the case with WRSs, longer fibres are generally preferable. On the other hand, whenever shear capacity is the determining factor, shorter fibres can yield more efficient solutions.
- For optimal economic and environmental WRS solutions, fibre dosages should be kept as low as possible, as the benefits of higher fibre dosages in design properties do not directly translate into capacity increases of the same magnitude.
- Overall, WRS designs in synthetic FRC are less expensive and carbon-intensive than steel FRC solutions. Synthetic fibres do not completely eliminate the minimum conventional reinforcement requirements but generally lead to preferable solutions in terms of cost and embodied carbon which are competitive with steel FRC and RC equivalents.
- Synthetic FRC solutions for WRSs which are cost competitive and have a lower carbon footprint than their equivalent RC solutions can be designed with volume fractions of PP or PO fibres of up to 1.5%. For steel FRC solutions to be competitive, the fibre volume fraction needs to be no higher than 0.4%.
Author Contributions
Conceptualization, C.R. and E.G.-T.; methodology, C.R. and E.G.-T.; formal analysis, C.R.; investigation, C.R. and E.G.-T.; data curation, C.R. and E.G.-T.; writing—original draft preparation, C.R.; writing—review and editing, E.G.-T.; visualization, C.R. and E.G.-T.; supervision, E.G.-T. All authors have read and agreed to the published version of the manuscript.
Funding
This research was funded by the ACI Foundation—American Concrete Institute (ACI) through a grant awarded to the project “Optimization of Fiber-Reinforced Concrete using Data Mining” by the Concrete Research Council.
Institutional Review Board Statement
Not applicable.
Informed Consent Statement
Not applicable.
Data Availability Statement
Data and details on the structural design methodology are available upon request. Please email [email protected].
Acknowledgments
The authors would like to thank Andrew Fairgrieve and Mark Simpson of Mott Macdonald for their help in providing the case studies used for this study. The authors also thank the ACI and the ACI Foundation for the funding received, which made possible the first part of this study.
Conflicts of Interest
The authors declare no conflict of interest.
References
- ACI Committee 544. ACI 544.1R-96: Report on Fiber Reinforced Concrete; American Concrete Institute: Farmington Hills, MI, USA, 1996. [Google Scholar]
- CEN. Test Method for Metallic Fibre Concrete-Measuring the Flexural Tensile Strength (Limit of Proportionality (LOP), Residual); BSI: London, UK, 2005. [Google Scholar]
- ASTM. ASTM C1609/C1609M-19a Standard Test Method for Flexural Performance of Fiber-Reinforced Concrete (Using Beam with Third-Point Loading); ASTM International: West Conshohocken, PA, USA, 2019. [Google Scholar]
- Roumboutsosa, A.; Panteliasb, A. Addressing infrastructure investor risk aversion: Can project delivery resilience ratings help? Util. Policy 2021, 71, 101225. [Google Scholar] [CrossRef]
- ACI Committee 544. ACI 544.4R-18: Guide to Design with Fiber-Reinforced Concrete; American Concrete Institute: Farmington Hills, MI, USA, 2018. [Google Scholar]
- ACI Committee 544. ACI PRC-544.7-16. Report on Design and Construction of Fiber-Reinforced Precast Concrete Tunnel Segments; American Concrete Institute: Farmington Hills, MI, USA, 2016. [Google Scholar]
- Pesic, N.; Ziavanovic, S.; Garcia, R.; Papastergiou, P. Mechanical Properties of Concrete Reinforced with Recycled HDPE Plastic Fibres. Constr. Build. Mater. 2016, 115, 362–370. [Google Scholar] [CrossRef] [Green Version]
- Mesbah, H.A.; Buyle-Bodin, F. Efficiency of polypropylene and metallic fibres on control of shrinkage and cracking of recycled aggregate mortars. Constr. Build. Mater. 1999, 13, 439–447. [Google Scholar] [CrossRef]
- Banthia, N.; Gupta, R. Influence of Polypropylene Fibre Geometry on Plastic Shrinkage Cracking in Concrete. Cem. Concr. Res. 2006, 36, 1263–1267. [Google Scholar] [CrossRef]
- Environment Agency. Long Term Investment Scenarios (LTIS) 2019. 2019. Available online: https://www.gov.uk/government/publications/flood-and-coastal-risk-management-in-england-long-term-investment/long-term-investment-scenarios-ltis-2019 (accessed on 20 April 2020).
- IPCC. Climate Change 2013: The Physical Science Basis; Cambridge University Press: Cambridge, UK, 2013. [Google Scholar]
- Rasmussen, A.B.; Fisker, J.; Hagsten, L.G. Cracking in flexural reinforced concrete members. Procedia Eng. 2017, 172, 922–929. [Google Scholar] [CrossRef]
- CEN. Eurocode 2: Design of Concrete Structures—Part 1-1: General Rules and Rules for Buildings; BSI: London, UK, 2004. [Google Scholar]
- Bamforth, P.B. CIRIA C766: Control of Cracking Caused by Restrained Deformation in Concrete; CIRIA: London, UK, 2019. [Google Scholar]
- Hearn, N. Self-sealing, autogenous healing and continued hydration: What’s the Difference? Mater. Struct. 1998, 31, 563–567. [Google Scholar] [CrossRef]
- Gong, J.; Wei, Z.; Zhang, W. Influence of shrinkage-reducing agent and polypropylene fiber on shrinkage of ceramsite concrete. Constr. Build. Mater. 2018, 159, 155–163. [Google Scholar] [CrossRef]
- Hwang, S.; Khayat, K.H. Effect of mix design on restrained shrinkage of self-consolidating concrete. Mater. Struct. 2010, 43, 367–380. [Google Scholar] [CrossRef]
- Edvardsen, C. Water Permeability and Autogenous Healing of Cracks in Concrete. Innov. Concr. Struct. Des. Constr. 1999, 473–487. [Google Scholar]
- CEN. EN 1992-3: Eurocode 2—Design of Concrete Structures—Part 3: Liquid Retaining and Containment Structures; BSI: London, UK, 2006. [Google Scholar]
- The Concrete Centre. Guidance on the Design and Construction of In-Situ Concrete Basement Structures; MPA The Concrete Centre: Surrey, UK, 2012. [Google Scholar]
- Mcleod, C.H. Investigation into Cracking in Reinforced Concrete Water-Retaining Structures. MScEng, Stellenbosch University, Stellenbosch, South Africa, March 2013. [Google Scholar]
- Facconi, L.; Minelli, F. Verification of structural elements made of FRC only: A critical discussion and proposal of a novel analytical method. Eng. Struct. 2017, 131, 530–541. [Google Scholar] [CrossRef]
- Chiaia, B.; Fantilli, A.P.; Vallini, P. Evaluation of minimum reinforcement ratio in FRC members and application to tunnel linings. Mater. Struct. 2007, 40, 593–604. [Google Scholar] [CrossRef]
- Sorelli, L.G.; Meda, A.; Plizzari, G.A. Steel fiber concrete slabs on ground: A structural matter. ACI Mater. J. 2006, 103, 551. [Google Scholar]
- Michels, J.; Waldmann, D.; Maas, S.; Zurbes, A. Steel fibers as only reinforcement for flat slab construction—Experimental investigation and design. Constr. Build. Mater. 2012, 26, 145–155. [Google Scholar] [CrossRef]
- Pujadas, P.; Blanco, A.; Cavalaro, S.; Aguado, A. Plastic fibres as the only reinforcement for flat suspended slabs: Experimental investigation and numberical simulation. Constr. Build. Mater. 2014, 57, 92–104. [Google Scholar] [CrossRef]
- Prisco, M.; Plizzari, G.; Vandewalle, L. Fibre reinforced concrete: New design perspectives. Mater. Struct. 2009, 42, 1261–1281. [Google Scholar] [CrossRef]
- Jaina, K.; Singh, B. Deformed steel fibres as minimum shear reinforcement—An investigation. Structures 2016, 7, 126–137. [Google Scholar] [CrossRef]
- Choi, W.-C.; Jung, K.-Y.; Jang, S.-J.; Yun, H.-D. The Influence of Steel Fiber Tensile Strengths and Aspect Ratios on the Fracture Properties of High-Strength Concrete. Materials 2019, 12, 2105. [Google Scholar] [CrossRef] [Green Version]
- Guerini, V.; Conforti, A.; Plizzari, G.; Kawashima, S. Influence of Steel and Macro-Synthetic Fibers on Concrete Properties. Fibers 2018, 6, 47. [Google Scholar] [CrossRef] [Green Version]
- Qian, C.X.; Stroeven, P. Development of hybrid polypropylene-steel fibre-reinforced concrete. Cem. Concr. Res. 2000, 30, 63–69. [Google Scholar] [CrossRef]
- Sanjuán, M.A.; Moragues, A. Polypropylene-fibre-reinforced mortar mixes: Optimization to control plastic shrinkage. Compos. Sci. Technol. 1997, 57, 655–660. [Google Scholar] [CrossRef]
- The Concrete Society. Guidance on the Use of Macro-Synthetic-Fibre-Reinforced Concrete; The Concrete Society: Surrey, UK, 2007. [Google Scholar]
- FIB. Model Code 2010; International Federation for Structural Concrete (Fib): Lausanne, Switzerland, 2013. [Google Scholar]
- Garcia-Taengua, E. Using Decades of Data to Rethink Proportioning and Optimisation of FRC Mixes: The OptiFRC Project. 2021. Fibre Reinf. Concr. Improv. Innov. 2020, 30, 827–838. [Google Scholar] [CrossRef]
- Garcia-Taengua, E.; Marti-Vargas, J.; Serna, P. Residual flexural strength of SFRC: A multivariate perspective. In Fibre Reinforced Concrete: Improvements and Innovations II; Springer: Cham, Switzerland, 2021; pp. 232–243. [Google Scholar] [CrossRef]
- Abbas, Y.M.; Khan, M.I. Fiber–Matrix Interactions in Fiber-Reinforced Concrete: A Review. Arab. J. Sci. Eng. 2016, 41, 1183–1198. [Google Scholar] [CrossRef]
- Bond, A.J.; Brooker, O.; Harris, A.J.; Harrison, T.; Moss, R.M.; Narayanan, R.S.; Webster, R. How to Design Concrete Structures Using Eurocode 2; MPA The Concrete Centre: Surrey, UK, 2018. [Google Scholar]
- Amin, A.; Foster, S.J.; Kaufmann, W. Instantaneous deflection calculation for steel fibre reinforced concrete one way members. Eng. Struct. 2017, 131, 438–445. [Google Scholar] [CrossRef] [Green Version]
- Mangat, P.S.; Azari, M.M. A theory for the free shrinkage of steel fibre reinforced cement matrices. J. Mater. Sci. 1984, 19, 2183–2194. [Google Scholar] [CrossRef]
- Hammond, G.; Jones, C. Inventory of Carbon and Energy; University of Bath: Bath, UK, 2008. [Google Scholar]
- Mott MacDonald. CESMM4 Carbon & Price Book 2013; ICE Publishing: London, UK, 2013. [Google Scholar] [CrossRef]
- Naaman, A.E. Deflection-Softening and Deflection-Hardening FRC Composites: Characterisation and Modeling. ACI Spec. Publ. 2007, 248, 53–66. [Google Scholar]
- Stang, H.; Krenchel, H. Micromechanics of crack bridging in fibre-reinforced concrete. Mater. Struct. 1993, 26, 486–494. [Google Scholar] [CrossRef]
- Mazzoli, A.; Monosi, S.; Plescia, E.S. Evaluation of the early-age-shrinkage of Fiber Reinforced Concrete (FRC) using image analysis methods. Constr. Build. Mater. 2015, 101, 596–601. [Google Scholar] [CrossRef]
- Panzera, T.H.; Christoforo, A.L.; Ribeiro Borges, P.H. Advanced Fibre-Reinforced Polymer (FRP) Composites for Structural Applications; Woodhead Publishing: Cambridge, UK, 2013. [Google Scholar]
- Walpole, R.E.; Myers, R.H.; Myers, S.L.; Ye, K. Probability & Statistics for Engineers & Scientists, 9th ed.; global edition; Pearson: London, UK, 2016. [Google Scholar]
- Garcia-Taengua, E.; Bakhshi, M.; Ferrara, L. Meta-Analysis of Steel Fiber-Reinforced Concrete Mixtures Leads to Practical Mix Design Methodology. Materials 2021, 14, 3900. [Google Scholar] [CrossRef] [PubMed]
- Black, L.; Purnell, P. Is carbon dioxide pricing a driver in concrete mix design? Mag. Concr. Res. 2015, 68, 561–567. [Google Scholar] [CrossRef] [Green Version]
Figure 1.
Diagrammatic overview of the study.

Figure 2.
Drawings of the water-retaining structure (WRS) scenarios considered: (a) Scenario A; (b) Scenario B; (c) Scenario C. The most critical cross-sections in flexure, taken as reference for comparing the resulting structural designs, are indicated as sections A-A, B-B, and C-C, respectively. Drawings are approximately to scale.

Figure 3.
Violin plots showing the distribution of fR1 and fR3 values estimated for all FRC mixes considered in this study.
Figure 3.
Violin plots showing the distribution of fR1 and fR3 values estimated for all FRC mixes considered in this study.

Figure 4.
Contribution of fibres to moment capacity and shear capacity of the most critical section in flexure (scenario A) for different fibre types and fibre lengths (in mm).
Figure 4.
Contribution of fibres to moment capacity and shear capacity of the most critical section in flexure (scenario A) for different fibre types and fibre lengths (in mm).

Figure 5.
Plots of average cost per unit length against fibre volume fraction, for each WRS design scenario.
Figure 5.
Plots of average cost per unit length against fibre volume fraction, for each WRS design scenario.

Figure 6.
Plots of average embodied carbon per unit length against fibre volume fraction, for each WRS design scenario.
Figure 6.
Plots of average embodied carbon per unit length against fibre volume fraction, for each WRS design scenario.


Table 1.
Fibre-reinforced concrete (FRC) mixes generated for consideration in this study.
| Variable | Values Considered |
|---|---|
| Fibre volume fraction, Vf (%) | 0–0.15–0.3–0.45–0.6–0.75–0.9–1.05–1.2–1.35–1.5 |
| Fibre material | Steel–Polypropylene (PP)–Polyolefin (PO) |
| Cement-to-SCMs ratio | 0.33–1–3 |
| Water-to-binder ratio | 0.2–0.33–0.5–0.8 |
| Coarse-to-fine aggregate ratio | 0.5–1–1.5 |
Table 2.
Main defining parameters of the WRS design scenarios.
| Parameter | Scenario A | Scenario B | Scenario C |
|---|---|---|---|
| Maximum allowable crack width for through cracks, wk1 (mm) | 0.18 | 0.178 | 0.20 |
| Exposure classes | XD2 | XC2, XD2, XA2 | XC4, XS3, XF4 |
| Design ultimate bending moment, MEd (kNm) | 51.5 | 30.0 | 49.3 |
| Design service bending moment, MSLS (kNm) | 38.2 | 22.2 | 40.9 |
| Design shear force, VEd (kN) | 50.1 | 37.9 | 42.0 |
| Early age temperature drop, T1 (°C) | 9 | 9 | 19 |
Table 3.
Representative values in relation to the total cost of materials per unit length.
| Scenario | Fibre Type | Theoretical Boundary Vf | Unit Cost at Boundary Vf | Competitive Range for Vf |
|---|---|---|---|---|
| A | Steel | 0.66% | 168.16 GBP/m | up to 0.6% |
| PP | 2.07% | up to 1.5% | ||
| PO | 2.01% | up to 1.5% | ||
| B | Steel | 0.87% | 107.98 GBP/m | up to 0.6% |
| PP | 2.12% | up to 1.5% | ||
| PO | 2.06% | up to 1.5% | ||
| C | Steel | 0.63% | 158.60 GBP/m | up to 0.6% |
| PP | 1.96% | up to 1.5% | ||
| PO | 1.91% | up to 1.5% |
Table 4.
Summary of hypothesis testing for embodied carbon per unit length.
| Scenario | Fibre Type | Theoretical Boundary Vf | Average eCO2 at Boundary Vf | Competitive Range for Vf |
|---|---|---|---|---|
| A | Steel | 0.68% | 373.7 kgCO2/m | up to 0.6% |
| PP | 4.05% | up to 1.5% | ||
| PO | 4.17% | up to 1.5% | ||
| B | Steel | 0.75% | 240.4 kgCO2/m | up to 0.6% |
| PP | 4.43% | up to 1.5% | ||
| PO | 4.57% | up to 1.5% | ||
| C | Steel | 0.57% | 347.1 kgCO2/m | up to 0.4% |
| PP | 3.39% | up to 1.5% | ||
| PO | 3.49% | up to 1.5% |
Publisher’s Note: MDPI stays neutral with regard to jurisdictional claims in published maps and institutional affiliations. |
© 2021 by the authors. Licensee MDPI, Basel, Switzerland. This article is an open access article distributed under the terms and conditions of the Creative Commons Attribution (CC BY) license (https://creativecommons.org/licenses/by/4.0/).
Share and Cite
MDPI and ACS Style
Ryan, C.; Garcia-Taengua, E. Fibre-Reinforced Concrete Is Sustainable and Cost-Effective for Water-Retaining Structures. Sustainability 2021, 13, 11479. https://0-doi-org.brum.beds.ac.uk/10.3390/su132011479
AMA Style
Ryan C, Garcia-Taengua E. Fibre-Reinforced Concrete Is Sustainable and Cost-Effective for Water-Retaining Structures. Sustainability. 2021; 13(20):11479. https://0-doi-org.brum.beds.ac.uk/10.3390/su132011479
Chicago/Turabian StyleRyan, Ciarán, and Emilio Garcia-Taengua. 2021. "Fibre-Reinforced Concrete Is Sustainable and Cost-Effective for Water-Retaining Structures" Sustainability 13, no. 20: 11479. https://0-doi-org.brum.beds.ac.uk/10.3390/su132011479
Note that from the first issue of 2016, this journal uses article numbers instead of page numbers. See further details here.