
The Framework for Measuring Port Resilience in Korean Port Case


Port Operation Department, Korea Maritime Institute, Busan 49111, Korea
*
Author to whom correspondence should be addressed.
Sustainability 2021, 13(21), 11883; https://0-doi-org.brum.beds.ac.uk/10.3390/su132111883
Submission received: 23 August 2021
/
Revised: 23 October 2021
/
Accepted: 25 October 2021
/
Published: 27 October 2021
(This article belongs to the Special Issue Risk Analysis of Infrastructure and Environmental Systems)
Abstract
:Port resilience has become a crucial topic to achieve port sustainability. To assist ports to successfully develop policies to improve resilience, this study aims to develop a framework for measuring port resilience. This paper conceptualizes the framework to assess port resilience based on relevant literature by conducting exploratory and confirmatory factor analysis using 199 samples collected from port stakeholders in South Korea. As a result, it is validated that the framework is a multi-hierarchical structure based on nine factors, i.e., robustness, redundancy, visibility, flexibility, collaboration, agility, information sharing, response, and recovery. Our findings would serve as a theoretical footstep for further studies on the relations between port resilience and sustainability and also contribute to implement policies to strengthen port resilience.
1. Introduction
Resilience has played a key role in achieving business sustainability in the rapidly changing environment with a number of threats against business. Recently, threats to port operations have been on the rise. In the past, disasters such as typhoons, earthquakes, and tsunamis or human factors such as ship collisions and strikes were major threats, but now cyber-terrorism and infectious diseases are emerging as new threats. A case in point is the global pandemic of COVID-19. In June 2020, 16 Russian sailors working at Gamcheon Port in Busan were tested positive for COVID-19, leading to the self-isolation of 200 workers who were working at the port, hence the complete suspension of port operations [1]. This shows that infectious diseases such as COVID-19, which were not considered a threat to port operations, can be an actual threat to the port sector as they spread worldwide. In other words, factors that threaten port functionality are becoming increasingly diverse over time. This highlights the necessity to develop ports’ resilience, the ability to quickly adapt to impacts that may cause disruption of functions and restore them as soon as practicable.
Resilience is the ability to cope with the outcomes of unavoidable events to return to the original operational state or proceed to a better state [2]. Studies on resilience were initiated by Holling [3] in 1973, after which the concept was embraced by many disciplines including ecology, psychology, pedagogy, architecture, business management, and economics [4]. In particular, research started in the supply chain field in 2004, and the collapse of the supply chain triggered by the 2011 Tohoku earthquake and tsunami further accelerated studies on resilience [1]. One of the major areas of resilience studies is infrastructure, such as airports, ports, public transportation, waterworks, and power plants, as their failure can have significant impact on society.
Ports constitute a core part of the world’s logistical infrastructure, and the interruption of major port functions can seriously affect the global economy [5]. In this sense, port resilience is of overarching importance for both the national and global economy. Nonetheless, studies on port resilience were not related to the operations and policies of the port industry. To develop policies to improve port resilience, we require building and validating a framework to assess the resilience of ports. In particular, developing a framework requires defining the elements of port resilience and analyzing factors to validate the model.
This study aimed to develop a framework to assess resilience for commercial port and validate its applicability. Factors considered in resilience assessments vary by area, and merely applying them to port resilience assessments will have limitations in reflecting the characteristics of ports. Thus, we conducted a literature review and factor analysis to identify factors to assess resilience in consideration of the characteristics of ports, based on which we developed an assessment framework. Since resilience is a requirement of sustainability [6], the framework this paper suggested could have an important role in improving port sustainability.
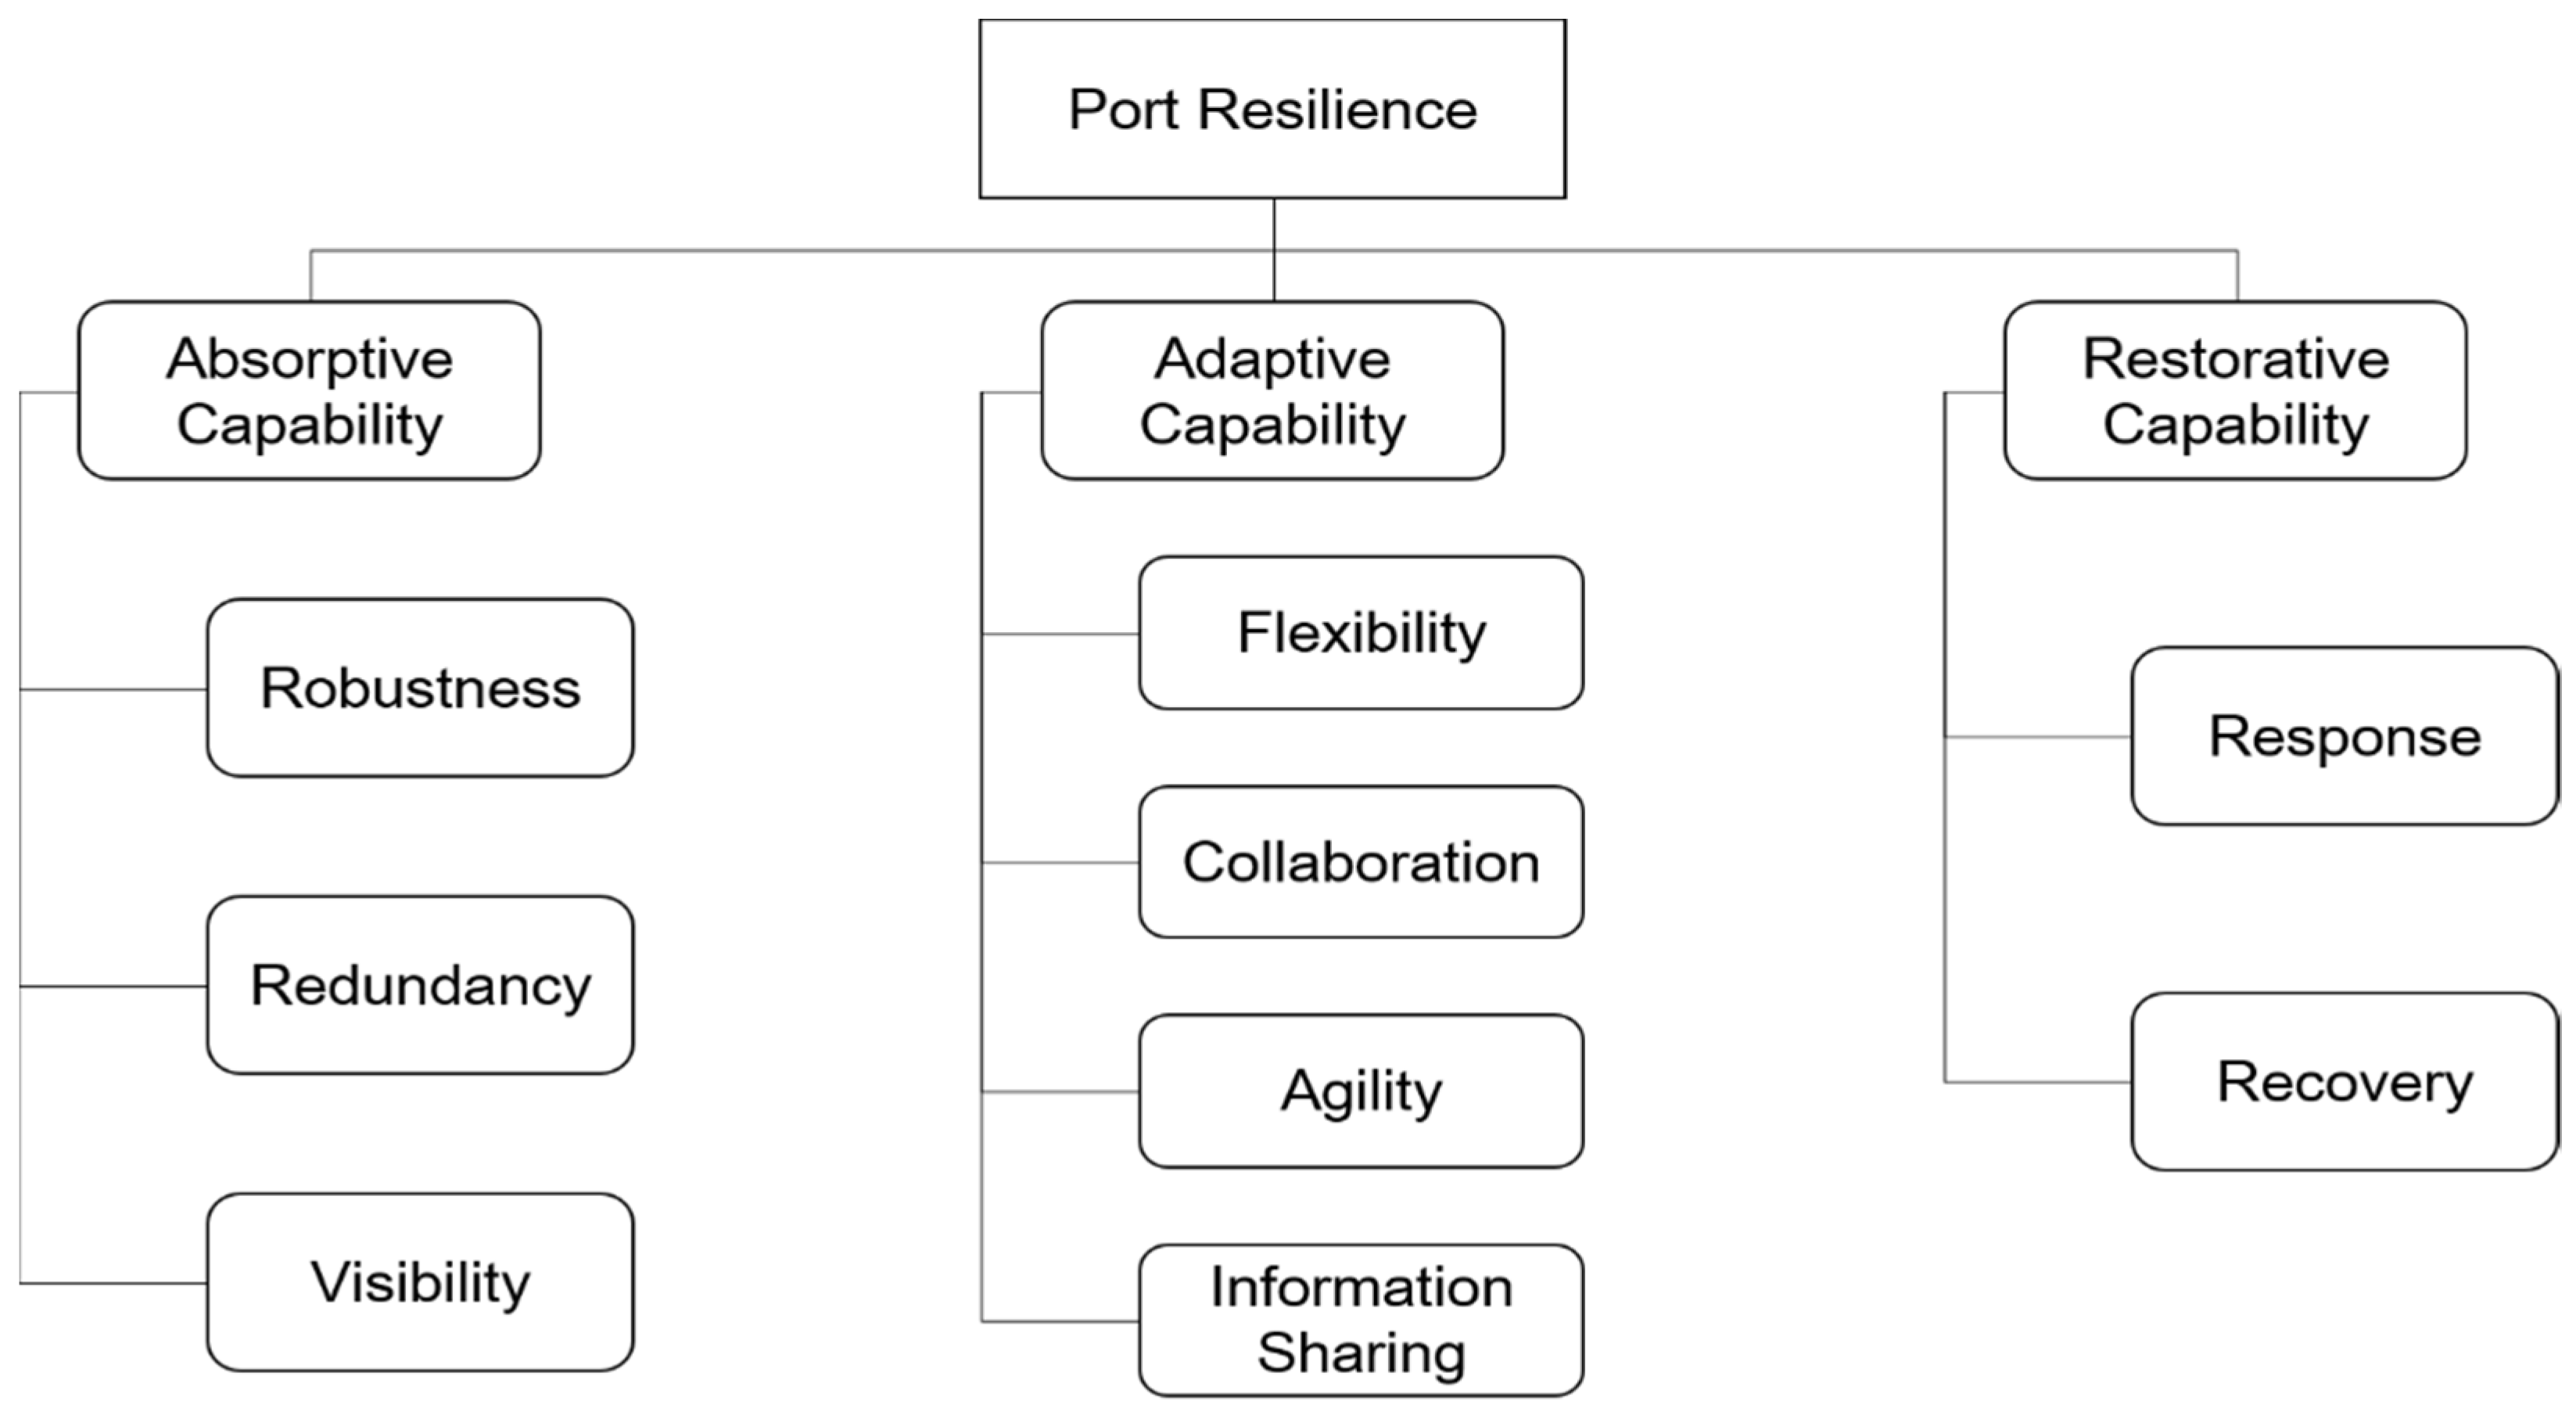
The resilience assessment framework presented in this paper is based on the theory of the “resilience triangle”, with absorptive capability, adaptive capability, and restorative capability [7] being the components of resilience. Through a literature review, we selected three factors—robustness, redundancy, and visibility—as the factors to measure the absorptive capability, four factors—flexibility, collaboration, agility, and information sharing—as the factors to measure adaptive capability, and two factors—response and recovery—as the factors to measure the restorative capability. Additionally, a survey of port stakeholders in South Korea was conducted to collect data, based on which explorative and confirmatory factor analysis was carried out to validate the framework. The measurements showed that ports in South Korea had relatively weaker restorative capability than absorptive and adaptive capabilities, calling for developing relevant measures. The significance of this paper lies in the fact that it has validated the resilience assessment framework and demonstrated that this framework is applicable to actual policy development.
The introduction is followed by Section 2, which focuses on the literature review, and Section 3, which describes the study model and data collection. Section 4 shows the results of the exploratory and confirmatory factor analysis, and Section 5 presents the analysis results’ policy implications. The conclusions, the limitations of this study, and future research directions are presented in Section 5.
2. Literature Review
First, we examined the definitions of resilience in preceding studies. Then, we looked into the studies on port resilience and identified their contributions. Lastly, to structure the port resilience assessment framework, we conducted extensive searches for resilience assessment studies in supply chains and infrastructural systems that are closely associated with ports.
2.1. Definitions of Resilience
The resilience concept was known to be first applied to socio-ecology research by Holling [3]. In his paper, he defined resilience as “the ability to absorb change and disturbance and still maintain the same relationships between populations or state variables”. His study triggered the introduction of the resilience concept to various disciplines including ecology, psychology, sociology, pedagogy, architecture, business management, and economics, each of which has defined resilience in its own terms.
Rice and Caniato [8] defined resilience as “the ability to respond to an unexpected disturbance and then restore operations to normal”. Martin and Helen [9] defined it as “the ability of a system to return to its original state or move to a new, more desirable state after being disturbed”, and for Gaonkar and Viswanadham [10], it relates to “the ability to maintain, resume, and restore operations after a disruption”. Ponomarov and Holcomb [11] defined resilience as “the adaptive capability of the supply chain to prepare for unexpected events, respond to disruptions, and recover from them by maintaining continuity of operations at the desired level of connectedness and control over structure and function”. Pettit et al. [12] defined it as “the capacity to survive, adapt, and grow in the face of turbulent change”, and Ponis and Koronis [13] described resilience as “the ability to proactively plan and design the supply chain network for anticipating unexpected disruptive events, respond adaptively to disruptions while maintaining control over structure and function and transcending to a post-event robust state of operations, if possible, more favorable than the one prior to the event, thus gaining competitive advantage”.
Ivanov and Sokolov [14] defined resilience as “the ability to maintain, execute and recover (adapt) the planned execution along with achievement of the planned (or adapted, but yet still acceptable) performance”, with an emphasis on sticking to the planned execution. Kim et al. [15] defined it as “a network-level attribute to withstand disruptions that may be triggered at the node or arc level”. This may be a heterogenous definition compared to other definitions but still shares the same emphasis on ‘the ability to withstand disruption”. Kamalahmadi and Parast [16] described resilience as “the adaptive capability of a supply chain to reduce the probability of facing sudden disturbances, resist the spread of disturbances by maintaining control over structures and functions, and recover and respond by immediate and effective reactive plans to transcend the disturbance and restore the supply chain to a robust state of operations”. Shin and Park [2] defined it as “the ability of a firm to cope with the consequences of unavoidable events in order to return to its original operations or move to a new, more desirable state after being disturbed”.
The definitions of resilience vary by author; they share some common keywords. Though not identical, most of the definitions have similar keywords, including disruption or disturbance, maintain, or recovery. In this sense, resilience refers to the ability to prepare for unexpected functional disruption and maintain or recover normal functions in the event of disruption. Additionally, an emphasis is put on the ability to keep the functions sustainable without being interrupted.
Based on these definitions, we define port resilience as the ability to absorb unexpected impact to prevent functions from being interrupted, adapt to changes, and quickly recover the original functions. Here, the keywords are “absorb”, “adapt”, and “recover”. An impact on port functions leading to disruption in supply may put a halt on the whole supply chain, and the resulting paralysis of logistic functions may have bigger ripple effects on the national economy, hence the emphasis on the ability to absorb the impact and sustain functionality. It also embraces “the ability to quickly adapt to impact and recover the original functions”, an element found in almost all definitions of resilience. In this study, we developed the port resilience assessment framework based on this definition.
2.2. Literatures on Port Resilience
Research on the port resilience can be classified into three categories: (i) risk management, (ii) frameworks to improve resilience, and (iii) quantitative resilience measurements.
Resilience is a concept closely related to risk management, but with some differences. According to Starr et al. [17], risk management rely on point solution, while resilience is a continuous process of finding new risks and building a capacity to respond. There are many studies in port risk management. As a representative study, Lam and Su [18] looked into functional disruption cases in Asian ports, categorized them depending on their probability and severity, and presented countermeasures. Gou and Lam [19] analyzed port terminal operation processes to suggest a framework for disaster risk analysis and carried out a simulation of the impact of risks on port operations at Laem Chabang Port in Thailand to estimate potential loss these risks may cause. While there are many papers focusing on risk management, few of them have covered the resilience concept.
Studies also have been conducted with the focus on the establishment of frameworks to improve resilience. Nair et al. [20] presented a framework applicable to the system component level to measure port network resilience and suggested plans to ease risks and improve resilience in the Port of Świnoujście in Poland. Rice and Trepte [21] conducted a survey of port stakeholders to collect opinions and data on port function disruptions and measures for resilience improvement. Based on these findings, they suggested building information systems for communications and improving labor flexibility being the pivotal factors. Lam and Bai [22] embraced the quality function deployment concept to develop measures to improve the resilience of the maritime supply chain. Using the concept of the house of quality representing the relations between risk factors and resilience factors, they presented contingency plans, monitoring systems, and supply chain relations management as the most important factors. Justice et al. [23] proposed resilience as a breakthrough to cope with the challenging situations container terminals in the U.S. were facing. They also mentioned future development orientations. Shaw et al. [24] developed measures to improve the resilience of ports in the U.K. and highlighted the importance of involving all stakeholders including operators, shipping companies, and logistic companies and building information sharing systems. While these papers presented frameworks to improve port resilience, they treated resilience as an abstract concept and did not delve into concrete measures to quantify it.
Lastly, efforts have been made to measure resilience. Shang et al. [25] studied the planning problems of berths and cranes in terms of port resilience, especially robustness. Iris and Lam [26] also studied a similar problem. In addition, they mathematically measured the effectiveness of recovery plans for cost minimization in various scenarios. Iris et al. [27] investigated the loading problem for container terminals in terms of the flexibility. They suggested the flexibility comes from an agreement between the operator and the shipping company and proposed a heuristic for flexible schedule planning. Venturini et al. [28] emphasized collaboration between port terminals and shipping liners for a sustainable supply chain. They presented a terminal operations and sailing times optimization model based on collaboration between the operator and shipping company. Tongzon and Nguyen [29] studied the relationship between logistics integration, technical efficiency, and allocation efficiency using the survey data of global shipping lines. They argued that logistics integration had a significant effect on the efficiencies. Aforementioned studies focused on one aspect of resilience and did not cover the overall resilience framework. Omer et al. [30] investigated how to measure the resilience of marine transportation, including ports. They developed a formula to measure resilience in three terms—tonnage, time, and cost—and used system dynamics to actually measure them. Pant et al. [31] defined resilience as a function of vulnerability and restoration, and to explain uncertainties, they developed a probabilistic measurement formula and applied it to the Tulsa Port Of Catoosa in Oklahoma, the USA. Chen et al. [32] investigated how to measure the network resilience of ports and inland transportation. They presented an integer programming model and applied it to the Port of Gothenburg to obtain measurements, analyze them, and present the result. Cho and Park [33] suggested a conceptual model to measure port resilience from the perspectives of robustness and agility and conducted actual measurements using a system dynamics simulation, demonstrating the potential applicability of system dynamics. Touzinsky et al. [34] delved into the resilience of the U.S. maritime transportation system. They collected data on the impact of the hurricane on three ports in the U.S. Southeast and measured their resilience as change in performance affected by the storms in terms of cumulative vessel residence time and net port entries. Aforementioned studies have a significant contribution in that they defined resilience and conducted quantitative measurements, but they did not deal with the factors or structure that fundamentally constitute the port resilience.
2.3. Literatures on Supply Chain and Infrastructural System Resilience
Continued efforts have been made to study the components of supply chain resilience and supply chain capabilities related to resilience. In one notable example, Pettit et al. [12] examined factors that cause supply chain vulnerabilities and resilience-related supply chain factors. They presented seven vulnerability factors—turbulence, deliberate threats, external pressure, limited resource, sensitivity, connectivity, and supplier/customer disruption—and 14 resilience factors: flexibility in sourcing, flexibility in order fulfillment, capacity, efficiency, visibility, adaptability, anticipation, recovery, dispersion, collaboration, organization, market position, security, and financial strength. Based on Pettit et al. [12], Pettit et al. [35] developed a resilience management tool titled “Supply Chain Resilience Assessment and Management”. Jüttner and Maklan [36] delved into the relations between supply chain resilience, supply chain management, and vulnerability and presented flexibility, velocity, visibility, and collaboration as the components of resilience. Hohenstein et al. [37] analyzed 67 papers on supply chain resilience published between 2003 and 2013 to identify 36 resilience factors and present six key factors: flexibility, visibility, capacity, collaboration, redundancy, and agility. Chowdhury and Quaddus [4] studied the relation between operational vulnerability, supply chain performance, and supply chain resilience and presented three elements of resilience: proactive capability, reactive capability, and supply chain design. Subfactors of the proactive capability include flexibility, redundancy, integration, efficiency, market strength, financial soundness, and readiness; subfactors of the reactive capability include response and recovery; and the subfactors of the supply chain design include density, complexity, and criticality, which together form a 12-factor model. Shashi et al. [38] reviewed papers on supply chain resilience published between 2003 and 2018 to organize a framework to measure resilience. In this framework, they defined supply chain resilience in three aspects—anticipation, resistance, and recovery and response—and identified metrics for each aspect. Anticipation metrics include robustness, redundancy, and design; resistance metrics include collaboration and agility; and recovery and response metrics include responsiveness. These suggest that studies on the components of supply chain resilience largely share the same core elements and have developed from listing factors in mono-hierarchical models to multi-hierarchical models.
Infrastructural systems often focus on quantitative measurements of resilience; hence, there are not many studies that present factors to structure assessment frameworks. Bruneau et al. [39] presented a conceptual framework in their study on resilience to earthquakes, with robustness, redundancy, resourcefulness, and rapidity being the four aspects of resilience. Adjetey-Bahun et al. [40] presented a measurement system that combined these four aspects with quantitative measurement. In a study on resilience in the field of engineering, Shirali et al. [41] presented six resilience indicators—top management commitment, just culture, learning culture, awareness and opacity, preparedness, and flexibility—and carried out a survey to measure scores for these indicators. Vugrin et al. [7], Francis and Bekera [42], and Yu et al. [43] defined resilience as the sum of the absorptive capability, adaptive capability, and restorative capability. Vugrin et al. [7] presented robustness and redundancy as absorptive capability metrics, contingency measures and substitutability as adaptive capability metrics, and the quantity of resources for restoration and swift procurement as restorative capability metrics. Nan and Sansavini [44] presented a model that combined the resilience triangle with quantitative measurements. Overall, recently, the resilience triangle model has been commonly used in the field of infrastructural systems, which are often combined with quantitative measurements. However, the three aspects of the resilience triangle encompass very wide conceptual domains. In this sense, improving the model would require segmenting the metrics and defining relevant capabilities.
2.4. Contribution to the Literature
The aforementioned studies on port resilience make a significant contribution, but they primarily delved into the abstract concept of resilience and frameworks to improve resilience. Some of them covered quantitative measurements, but even so, they merely developed mathematical models for measurements and applied to selected ports. Measuring port resilience and using the findings for policy development requires studies to solidify theoretical foundations by confirming the components of resilience, but few have studied this topic. Table 1 summarizes the main constructs of literatures on the port, supply chain, and infrastructure resilience. While the literature on port resilience tends to focus on one or two constructs, research on the supply chain resilience tends to present a variety of constructs. In addition, research on infrastructure systems resilience tends to focus on the resilience triangle as a major research topic.
Compared with previous studies, Shaw et al. [24] studied port resilience planning in the UK port, but they focused on the identification of port risk factors and communication between stakeholders to respond to them and had not theoretically studied the resilience. Shashi et al. [38] suggested the systematic framework for supply chain resilience, but this study did not conduct an empirical analysis to verify the validity of the framework. In this study, we referred to these studies on port resilience and literature in relevant areas such as supply chains and infrastructural systems to define port resilience, identify the components of resilience, establish a framework for measurements, and validate the model using factor analysis. The resulting framework has distinction in that it can be used to develop policy support measures to strengthen port resilience.
3. Materials and Methods
3.1. Overview of Research Dedign
In this section, we present the resilience measurement framework based on the literature review. Works by Shashi et al. [38] and Vugrin et al. [7] are studies that suggested concrete frameworks for resilience measurements in supply chains and infrastructural systems, respectively, and these two models have similarities. Anticipation, resistance, and recovery and response in the study by Shashi et al. [38], respectively, correspond to the absorptive capability, adaptive capability, and restorative capability in the resilience triangle, and their respective sub-elements also share similar concepts. Both studies present robustness and redundancy as sub-elements of anticipation and absorptive capability, and contingency measures and substitutability as sub-elements of adaptive capability are similar to the supply chain reengineering and agility concepts. Lastly, recovery and response are coterminous with restorative capability. Thus, we considered these two models similar and consolidated them to build the port resilience measurement framework.
In this study, we see a port as an infrastructural system, and we build the framework based on the resilience triangle proposed by Vugrin et al. [7] and Francis and Bekera [42]. We also categorized various resilience factors identified by studies in ports, supply chains, and infrastructural systems into the metrics of absorptive capability, adaptive capability, and restorative capability and validated the framework. To build the framework, we first selected nine factors that are frequently cited and recognized as important factors among various resilience factors (see Table 1). They are robustness, redundancy, visibility, flexibility, collaboration, agility, information sharing, response, and recovery, which we have redefined based on preceding literature to make them fit port resilience studies. Table 2 shows the definitions of these factors.
Of the nine factors, robustness, redundancy, and visibility are classified as the absorptive capability metrics. Flexibility, collaboration, agility, and information sharing are the adaptive capability metrics, and response and recovery are the restorative capability metrics. For the absorptive capability, robustness and redundancy are metrics of absorptive capability presented by Vugrin et al. [7]. We considered visibility a factor that helps better identify the effects of unexpected impact on the functionality of port operation processes and absorb them, hence an absorptive capability metric. For the adaptive capability, collaboration and agility are metrics of adaptive capability presented by Shashi et al. [38], and we categorized flexibility as an adaptive capability metric as per the definition. Information sharing empowers members to adapt themselves to crises by promoting transparent internal information sharing and serving as an essential element of adaptation to change through external collaboration, hence an adaptive capability metric. Lastly, response and recovery are metrics of restorative capability presented by Shashi et al. [38] and Chowdhury and Quaddus [4]. Figure 1 shows the resilience measurement framework.
3.2. Data Collection
We conducted a survey from September to October 2020 for data collection. We put together survey questions (measurement variables) used to measure the nine factors through a literature review in supply chains and infrastructural systems and discussed with experts in ports and supply chains to select variables that best fit this study, which were translated into the Korean language. Three or four measurement variables were selected per construct, a total of 28. After the translation, we modified part of the questions to make them better serve the purpose of the survey, i.e., measuring port resilience. To ensure that the questions convey the same meanings and contexts after translation and modification, we had a bilingual speaker of Korean and English verify the questions to secure the content validity of the survey. Table 3 shows the selected measurement variables.
The survey was conducted in cooperation with a survey specialist with experience in port surveys. First, we developed a list of more than 2000 people who are involved in port operators, shipping companies, and port authorities and surveyed them through email and telephone. The questionnaire consisted of the basic information section that asked the respondents about their affiliation, experience, and ports involved and the 28 resilience-related questions in the five-point Likert scale (1 = Strongly disagree, 5 = Strongly agree). As shown in Table 4, 199 respondents answered the survey questions.
3.3. Data Analysis
To validate the framework to assess port resilience, we conducted exploratory and confirmatory factor analysis. Factor analysis is the most widely used method for developing measurement tools or verifying the validity of the factor in framework [57,58,59]. Exploratory factor analysis is used in various disciplines including psychology and business management to identify common factors and to assess the validity of the measures [60]. While exploratory factor analysis relies on data to develop theoretical structures, confirmatory factor analysis examines measurement variables–potential variables relations to confirm the fitness of a model, hence more theoretical validation [61]. In this study, we already developed the port resilience measurement framework based on the theories of preceding studies, and confirmatory factor analysis would be a better fit, but exploratory factor analysis preceded as we structured the questionnaire based on different papers and translated the questions into the Korean language. Based on the survey results for the nine constructs, we conducted exploratory factor analysis to verify the fitness of this survey in measuring each factor and adjusted the model based on the analysis findings, followed by confirmatory factor analysis to finally validate the port resilience measurement framework. For analysis, we used the R 4.0.0 psych and lavaan package.
4. Results and Discussion
4.1. Exploratory Factor Analysis
Before conducting the factor analysis, we carried out the Kaiser–Meyer–Olkin (KMO) test and the Bartlett’s test for sphericity to determine the fitness of the data. Kaiser [62] mentioned that a KMO value of 0.7 or higher is good, and, in our test, the KMO value was 0.9, indicating good correlations between the variables. The sphericity test showed a probability value of less than 0.01, demonstrating the fitness of the variables for the use in the factor analysis.
Table 5 shows the results of the exploratory factor analysis for the 28 factors. Maximum likelihood estimation was used for the analysis, with varimax rotation applied. The number of the factors was nine, as determined in the literature review.
According to Hair et al. [63], the thresholds for sufficient factor loading are greater than 0.4 with 200 sample size. Overall, the results were as expected, but the loadings of two variables (rob1 and fle3) are lower than 4.0 with low communality of 0.28 and 0.23, respectively. Communality refers to the proportion of each variable’s variance that can be explained by the factors, and a communality score of less than 0.4 is not acceptable [64]. Thus, we decided to remove these two questions and redo the exploratory factor analysis. Table 6 shows the results.
All loadings satisfied the threshold (loading > 0.4), and for all factors, communality scores were 0.4 or higher. As an indicator for the fitness of the model, the RMSEA (root mean square error of approximation) value was 0.04, which was lower than the threshold for good fit. Based on these results, we excluded the two variables and confirmed the 26 variables and nine factors for confirmatory factor analysis. The two questions removed were: “port performance would not deviate significantly from targets” (robustness) and “the port’s collaboration partners can flexibly adjust supply capacity to mitigate disruptions” (flexibility). For port robustness, maintaining functionality is more important than achieving performance, and achieving port performance targets is greatly influenced by external factors such as economic conditions, hence the difficulties in measuring robustness with that question. The flexibility question was thought to be unfit given that the capabilities of partners have relatively insignificant influence on ports, unlike supply chains, where key partners play pivotal roles.
4.2. Confirmatory Factor Analysis
Before conducting confirmatory factor analysis to validate the structure of the port resilience assessment framework, we conducted discriminant validity analysis for the factors. Discriminant validity tests whether different factors are actually unrelated. In general, discriminant validity is tested by comparing the average variance extracted (AVE) with the squared correlation between constructs, where discriminant validity exists when the AVE is greater than the square value of the squared correlation [65]. Table 7 shows the comparison between the square values of the correlation and the AVE. In the table, leading diagonals represent the AVE, and off diagonal entries are squared correlation. As shown in the table, all correlations satisfied the condition.
We conducted higher-order confirmatory factor analysis with the model illustrated in Figure 1. During the analysis, a Heywood case occurred, i.e., negative estimated variance of ‘restorative capability’. The negative estimated variance might result from model misspecification. However, Van Driel [66] suggested that if the estimated confidence interval of the negative variance includes zero, the negative variance is due to sampling fluctuation, not model misspecification. The estimated confidence interval of the negative variance in our model is [−0.078, 0.045]. Hence, we applied another solution to resolve the Heywood case instead of model modification. One of the commonly used methods is to fix the negative variance to zero or near zero (e.g., 0.005) [67]. After applying the method, the model shows good fit indexes. Evidence of good fit could be determined by the following standards: normed χ2 between 2 and 5 [68], CFI and TLI greater than 0.9 [69], and RMSEA less than 0.08 [70]. Table 8 shows the model fit indexes.
Then, we assessed the reliability and convergent validity using the factor loading, composite reliabilities (CR) and AVE. The assessment result (Table 9) confirmed that all loadings were statistically significant, ranging from 0.611 to 0.994 (>0.6), and indicating strong convergent validity of the measurement variables relating to specific latent variables; the CR ranged from 0.750 to 0.954, demonstrating a feasible level (>0.7) [71], and AVE ranged from 0.542 to 0.875 (>0.5) [72].
Given these results, the port resilience measurement framework developed in this study satisfied both convergent validity and discriminant validity; hence, structural validity was confirmed. It also showed a good fit, indicating that this model fits the purpose of measuring port resilience. Figure 2 shows the result of confirmatory factor analysis.
4.3. Discussion
We used the data collected from the port stakeholder survey for exploratory and confirmatory factor analysis to validate the port resilience measurement framework using the 26 questions covering the nine factors, i.e., robustness, redundancy, visibility, flexibility, collaboration, agility, information sharing, response, and recovery. This result can provide many implications for port resilience management. We discuss the present situation and future resilience management directions of South Korean ports using measurement scores.
First, we compared the scores for the absorptive capability, adaptive capability, and restorative capability that form the infrastructural resilience triangle. The three factors of the adaptive capability all scored similarly, while the collaboration and information-sharing variables of the absorptive capability scored relatively higher, and the agility variable scored the lowest. This implies that the ports are actively collaborating with key partners but relatively lack the ability to swiftly respond to unexpected changes in environment. The recovery variable of the restorative capability scored the lowest of all variables at 2.92. This is indicative that South Korean ports lack the ability to swiftly return to normal operations when impacted and that they need to strengthen the restorative capability to improve their resilience.
Next, the score of measurement variables was examined. On average, most of the questions scored more than 3 points, suggesting that ports in South Korea have above-average resilience capabilities. To be specific, the highest score was achieved from col1 (the port jointly works with its key partners for mutual managerial goals) for the collaboration factor, which is the strongest capability of South Korean ports among the many factors to measure port resilience. The second highest score was achieved from res3 (the port has a contingency for mitigating crisis) for the response factor. This is indicative that South Korean ports have strong resilience capabilities in terms of collaboration with many companies to achieve their key management targets and contingency organizations. On the other hand, the lowest scores were observed from rec2 (the port can recover from crises at less costs) and rec1 (The port has the ability to absorb significant losses) for the recovery factor, indicating the necessity to strengthen recuperative capabilities in response to emergency situations. See Table 10 bellow.
Last, utilizing the framework suggested in this study for the strengthening of port resilience requires linking the factors in the framework with real-world activities in ports. This study recommends that port decision-makers link the port performance index of existing studies with the resilience framework of this study. For example, Ha et al. [73] suggested 36 port performance indicators. Not all indicators can be linked to resilience frameworks, but four productivity indicators (berth occupancy, crane efficiency, yard utilization, and labor utilization) can be linked to robustness, and information/communication integration practices (integrated EDI for communication, integrated IT to share data and collaborate with channel members) can be linked to collaboration and information sharing. In this way, if port decision makers can manage in connection with existing performance indicators and the resilience framework, it will help improve the port resilience. In addition, it can be a way to define actual capacity-building activities for each construct and establish an activity plan. Table 11 shows examples of capacity-building activities for these nine factors based on the survey questions and the opinion of port management experts. To improve the resilience of South Korean ports, measuring the effectiveness of contingency plans and modifying them based on feedback, developing plans to finance restoration, and carrying out crisis response training on a regular basis are required, among others.
As discussed earlier, Korean ports lack recovery-related capabilities. In order to strengthen recovery capability, a contingency plan for maintenance and restoration of port facilities is required, and a plan for costs must be included. Zhang et al. [74] suggested the framework of sustainable maintenance strategies for port facilities. They used a mathematical model to select the optimal maintenance based on cost, and the model shows that sustainability-related costs are an important factor in port maintenance costs. Similarly, port decision-makers will be able to measure the effectiveness of various contingency plans in terms of recovery cost by using the simulation models to enhance recovery capacity.
5. Conclusions
In this study, we examined literature in supply chains and infrastructural systems to identify factors and variables to measure resilience and built a port resilience measurement framework. Additionally, we surveyed port stakeholders to validate the framework. The most important theoretical contribution of this study is that we demonstrated through a literature review that port resilience has a multi-hierarchical structure based on nine factors. These findings would serve as a theoretical footstep for further studies on the relations between port resilience and sustainability. This study also contributes to policies in that it established a concrete measurement framework for the abstract concept of port resilience and connected it to concrete activities to strengthen resilience. Applying the resilience measurement framework to ports in South Korea revealed that, among the components of resilience, they have adaptive capability and absorptive capability to some extent but relatively lack restorative capability. In other words, they are somewhat prepared for impact but there are inadequacies in their restorative capabilities or response when impacted. Indeed, institutions related to resilience in South Korea primarily focus on prevention and preparedness but lack restoration plans and manuals and have insufficient performance indicators. In this context, it is needed to put an emphasis on strengthening ports’ restorative capability, for example, contingency organizations, financing restoration costs, and measuring the effectiveness of contingency plans and developing relevant legislation and institutions.
Some limitations and future avenues should be mentioned. This study used a survey to collect the data. However, some constructs such as robustness and recovery can measure mathematically. Although there are currently no relevant data available in Korea, it is necessary to build data from a long-term perspective and conduct quantitative research using the data. It will also be necessary to conduct research on countries with relevant data. Theory-wise, this model could be employed to validate the causal relation between resilience and ports’ operation and sustainability performances in an effort to understand what resilience means to port performances. In terms of policy, efforts should be made to define real-world port activities related to the nine factors of resilience and develop relevant key performance indicators. In this study, we briefly mentioned port capacity building activities for each factor of resilience. Developing more concrete action plans based on expert opinions and performance indicators for actual assessments would help develop concrete port resilience assessment systems, hence ensuring sustainability of port operations.
Author Contributions
Conceptualization, S.K. and C.K.; methodology, S.K.; software, S.K.; validation, S.K., S.C. and C.K.; formal analysis, S.K.; investigation, S.K. and C.K.; resources, S.K., S.C. and C.K.; data curation, S.K. and S.C.; writing—original draft preparation, S.K. and C.K.; writing—review and editing, S.K., S.C. and C.K.; visualization, S.K.; supervision, C.K.; project administration, C.K.; funding acquisition, S.K. All authors have read and agreed to the published version of the manuscript.
Funding
This research was supported by the “A Study on the Measurement Model for the Port Resilience (2020)” and “A Project to Establishment Ocean and Fisheries Grand Strategy for Future Risks (2021)” funded by Korea Maritime Institute.
Institutional Review Board Statement
Not applicable.
Informed Consent Statement
Not applicable.
Data Availability Statement
The quantitative and qualitative data used to support the findings of this study are included within the article.
Conflicts of Interest
The authors declare no conflict of interest.
References
- Kim, S.-K.; Kim, C.-H. Analysis of the Impact of COVID-19 on Port Operation. J. Navig. Port Res. 2021, 45, 155–164. [Google Scholar] [CrossRef]
- Shin, N.; Park, S. Evidence-Based Resilience Management for Supply Chain Sustainability: An Interpretive Structural Modelling Approach. Sustainability 2019, 11, 484. [Google Scholar] [CrossRef] [Green Version]
- Holling, C.S. Resilience and Stability of Ecological Systems. Annu. Rev. Ecol. Syst. 1973, 4, 1–23. [Google Scholar] [CrossRef] [Green Version]
- Chowdhury, M.H.; Quaddus, M. Supply chain resilience: Conceptualization and scale development using dynamic capability theory. Int. J. Prod. Econ. 2017, 188, 185–204. [Google Scholar] [CrossRef]
- Kang, D.; Kim, S. Conceptual Model Development of Sustainability Practices: The Case of Port Operations for Collaboration and Governance. Sustainability 2017, 9, 2333. [Google Scholar] [CrossRef] [Green Version]
- Asprone, D.; Manfredi, G. Linking disaster resilience and urban sustainability: A glocal approach for future cities. Disasters 2014, 39, s96–s111. [Google Scholar] [CrossRef] [Green Version]
- Vugrin, E.D.; Warren, D.E.; Ehlen, M.A.; Camphouse, R.C. A Framework for Assessing the Resilience of Infrastructure and Economic Systems. In Sustainable and Resilient Critical Infrastructure Systems; Springer: Berlin/Heidelberg, Germany, 2010; pp. 77–116. [Google Scholar] [CrossRef]
- Rice, J.B.; Caniato, F. Building a secure and resilient supply network. SUPPLY Chain Manag. Rev. 2003, 7, 53–61. [Google Scholar]
- Christopher, M.; Peck, H. Building the Resilient Supply Chain. Int. J. Logist. Manag. 2004, 15, 1–14. [Google Scholar] [CrossRef] [Green Version]
- Gaonkar, R.S.; Viswanadham, N. Analytical Framework for the Management of Risk in Supply Chains. IEEE Trans. Autom. Sci. Eng. 2007, 4, 265–273. [Google Scholar] [CrossRef]
- Ponomarov, S.Y.; Holcomb, M.C. Understanding the concept of supply chain resilience. Int. J. Logist. Manag. 2009, 20, 124–143. [Google Scholar] [CrossRef]
- Pettit, T.J.; Fiksel, J.; Croxton, K.L. Ensuring supply chain resilience: Development of a conceptual framework. J. Bus. Logist. 2010, 31, 1–21. [Google Scholar] [CrossRef]
- Ponis, S.; Koronis, E. Supply Chain Resilience: Definition Of Concept And Its Formative Elements. J. Appl. Bus. Res. 2012, 28, 921–930. [Google Scholar] [CrossRef]
- Ivanov, D.; Sokolov, B. Control and system-theoretic identification of the supply chain dynamics domain for planning, analysis and adaptation of performance under uncertainty. Eur. J. Oper. Res. 2013, 224, 313–323. [Google Scholar] [CrossRef]
- Kim, Y.; Chen, Y.-S.; Linderman, K. Supply network disruption and resilience: A network structural perspective. J. Oper. Manag. 2014, 33–34, 43–59. [Google Scholar] [CrossRef] [Green Version]
- Kamalahmadi, M.; Parast, M.M. A review of the literature on the principles of enterprise and supply chain resilience: Major findings and directions for future research. Int. J. Prod. Econ. 2016, 171, 116–133. [Google Scholar] [CrossRef]
- Starr, R.; Newfrock, J.; Delurey, M. Enterprise resilience: Managing risk in the networked economy. Strateg. Bus. 2003, 30, 70–79. [Google Scholar]
- Lam, J.S.L.; Su, S. Disruption risks and mitigation strategies: An analysis of Asian ports. Marit. Policy Manag. 2015, 42, 415–435. [Google Scholar] [CrossRef]
- Gou, X.; Lam, J.S.L. Risk analysis of marine cargoes and major port disruptions. Marit. Econ. Logist. 2018, 21, 497–523. [Google Scholar] [CrossRef]
- Nair, R.; Avetisyan, H.; Miller-Hooks, E. Resilience Framework for Ports and Other Intermodal Components. Transp. Res. Rec. J. Transp. Res. Board 2010, 2166, 54–65. [Google Scholar] [CrossRef]
- Rice, J.; Trepte, K. The MIT CTL Port Resilience Survey Report; MIT Cent. Transp. Logist.: Cambridge, MA, USA, 2012; Available online: https://ctl.mit.edu/sites/default/files/Port%20resilience%20survey%20report%20v27%20sans%20SEM.pdf (accessed on 14 September 2021).
- Lam, J.S.L.; Bai, X. A quality function deployment approach to improve maritime supply chain resilience. Transp. Res. Part E: Logist. Transp. Rev. 2016, 92, 16–27. [Google Scholar] [CrossRef]
- Justice, V.; Bhaskar, P.; Pateman, H.; Cain, P.; Cahoon, S. US container port resilience in a complex and dynamic world. Marit. Policy Manag. 2016, 43, 179–191. [Google Scholar] [CrossRef]
- Shaw, D.R.; Grainger, A.; Achuthan, K. Multi-level port resilience planning in the UK: How can information sharing be made easier? Technol. Forecast. Soc. Chang. 2017, 121, 126–138. [Google Scholar] [CrossRef]
- Shang, X.T.; Cao, J.X.; Ren, J. A robust optimization approach to the integrated berth allocation and quay crane assignment problem. Transp. Res. Part E Logist. Transp. Rev. 2016, 94, 44–65. [Google Scholar] [CrossRef]
- Iris, Ç.; Lam, J.S.L. Recoverable robustness in weekly berth and quay crane planning. Transp. Res. Part B Methodol. 2019, 122, 365–389. [Google Scholar] [CrossRef]
- Iris, C.; Christensen, J.; Pacino, D.; Røpke, S. Flexible ship loading problem with transfer vehicle assignment and scheduling. Transp. Res. Part B Methodol. 2018, 111, 113–134. [Google Scholar] [CrossRef] [Green Version]
- Venturini, G.; Iris, C.; Kontovas, C.A.; Larsen, A. The multi-port berth allocation problem with speed optimization and emission considerations. Transp. Res. Part D Transp. Environ. 2017, 54, 142–159. [Google Scholar] [CrossRef] [Green Version]
- Tongzon, J.L.; Nguyen, H.-O. Effects of port-shipping logistics integration on technical and allocative efficiency. Asian J. Shipp. Logist. 2021, 37, 109–116. [Google Scholar] [CrossRef]
- Omer, M.; Mostashari, A.; Nilchiani, R.; Mansouri, M. A framework for assessing resiliency of maritime transportation systems. Marit. Policy Manag. 2012, 39, 685–703. [Google Scholar] [CrossRef]
- Pant, R.; Barker, K.; Ramirez-Marquez, J.E.; Rocco, C.M. Stochastic measures of resilience and their application to container terminals. Comput. Ind. Eng. 2014, 70, 183–194. [Google Scholar] [CrossRef]
- Chen, H.; Cullinane, K.; Liu, N. Developing a model for measuring the resilience of a port-hinterland container transportation network. Transp. Res. Part E Logist. Transp. Rev. 2017, 97, 282–301. [Google Scholar] [CrossRef]
- Cho, H.; Park, H. Constructing resilience model of port infrastructure based on system dynamics. Int. J. Saf. Secur. Eng. 2017, 7, 352–360. [Google Scholar] [CrossRef] [Green Version]
- Touzinsky, K.F.; Scully, B.M.; Mitchell, K.N.; Kress, M. Using Empirical Data to Quantify Port Resilience: Hurricane Matthew and the Southeastern Seaboard. J. Waterw. Port Coastal Ocean Eng. 2018, 144, 05018003. [Google Scholar] [CrossRef]
- Pettit, T.J.; Croxton, K.L.; Fiksel, J. Ensuring Supply Chain Resilience: Development and Implementation of an Assessment Tool. J. Bus. Logist. 2013, 34, 46–76. [Google Scholar] [CrossRef]
- Jüttner, U.; Maklan, S. Supply chain resilience in the global financial crisis: An empirical study. Supply Chain Manag. Int. J. 2011, 16, 246–259. [Google Scholar] [CrossRef]
- Hohenstein, N.-O.; Feisel, E.; Hartmann, E.; Giunipero, L. Research on the phenomenon of supply chain resilience: A systematic review and paths for further investigation. Int. J. Phys. Distrib. Logist. Manag. 2015, 45, 90–117. [Google Scholar] [CrossRef]
- Centobelli, P.; Cerchione, R.; Ertz, M. Managing supply chain resilience to pursue business and environmental strategies. Bus. Strat. Environ. 2019, 29, 1215–1246. [Google Scholar] [CrossRef]
- Bruneau, M.; Chang, S.E.; Eguchi, R.T.; Lee, G.C.; O’Rourke, T.D.; Reinhorn, A.M.; Shinozuka, M.; Tierney, K.; Wallace, W.A.; von Winterfeldt, D. A Framework to Quantitatively Assess and Enhance the Seismic Resilience of Communities. Earthq. Spectra 2003, 19, 733–752. [Google Scholar] [CrossRef] [Green Version]
- Adjetey-Bahun, K.; Birregah, B.; Châtelet, E.; Planchet, J.L.; Laurens-Fonseca, E. A simulation-based approach to quantifying resilience indicators in a mass transportation system. In ISCRAM 2014 Conference Proceedings Book of Papers–11th International Conference on Information Systems for Crisis Response and Management; The Pennsylvania State University: State College, PA, USA, 2014; pp. 75–79. [Google Scholar]
- Shirali, G.; Mohammadfam, I.; Ebrahimipour, V. A new method for quantitative assessment of resilience engineering by PCA and NT approach: A case study in a process industry. Reliab. Eng. Syst. Saf. 2013, 119, 88–94. [Google Scholar] [CrossRef]
- Francis, R.; Bekera, B. A metric and frameworks for resilience analysis of engineered and infrastructure systems. Reliab. Eng. Syst. Saf. 2014, 121, 90–103. [Google Scholar] [CrossRef]
- Yu, S.; Kim, S.-W.; Oh, C.-W.; An, H.; Kim, J.-M. Quantitative assessment of disaster resilience: An empirical study on the importance of post-disaster recovery costs. Reliab. Eng. Syst. Saf. 2015, 137, 6–17. [Google Scholar] [CrossRef]
- Nan, C.; Sansavini, G. A quantitative method for assessing resilience of interdependent infrastructures. Reliab. Eng. Syst. Saf. 2017, 157, 35–53. [Google Scholar] [CrossRef]
- Erol, O.; Sauser, B.J.; Mansouri, M. A framework for investigation into extended enterprise resilience. Enterp. Inf. Syst. 2010, 4, 111–136. [Google Scholar] [CrossRef]
- Scholten, K.; Schilder, S. The role of collaboration in supply chain resilience. Supply Chain Manag. Int. J. 2015, 20, 471–484. [Google Scholar] [CrossRef]
- Purvis, L.; Spall, S.; Naim, M.; Spiegler, V. Developing a resilient supply chain strategy during ‘boom’ and ‘bust’. Prod. Plan. Control. 2016, 27, 579–590. [Google Scholar] [CrossRef]
- Jain, V.; Benyoucef, L.; Deshmukh, S. A new approach for evaluating agility in supply chains using Fuzzy Association Rules Mining. Eng. Appl. Artif. Intell. 2008, 21, 367–385. [Google Scholar] [CrossRef]
- Wu, I.-L.; Chuang, C.-H.; Hsu, C.-H. Information sharing and collaborative behaviors in enabling supply chain performance: A social exchange perspective. Int. J. Prod. Econ. 2014, 148, 122–132. [Google Scholar] [CrossRef]
- Norrman, A.; Jansson, U. Ericsson’s proactive supply chain risk management approach after a serious sub-supplier accident. Int. J. Phys. Distrib. Logist. Manag. 2004, 34, 434–456. [Google Scholar] [CrossRef]
- Brandon-Jones, E.; Squire, B.; Autry, C.W.; Petersen, K. A Contingent Resource-Based Perspective of Supply Chain Resilience and Robustness. J. Supply Chain Manag. 2014, 50, 55–73. [Google Scholar] [CrossRef] [Green Version]
- Wieland, A.; Wallenburg, C.M. Dealing with supply chain risks. Int. J. Phys. Distrib. Logist. Manag. 2012, 42, 887–905. [Google Scholar] [CrossRef] [Green Version]
- Zsidisin, G.A.; Wagner, S.M. Do perceptions become reality? the moderating role of supply chain resiliency on disruption occurrence. J. Bus. Logist. 2010, 31, 1–20. [Google Scholar] [CrossRef]
- Mandal, S.; Sarathy, R.; Korasiga, V.R.; Bhattacharya, S.; Dastidar, S.G. Achieving supply chain resilience. Int. J. Disaster Resil. Built Environ. 2016, 7, 544–562. [Google Scholar] [CrossRef]
- Altay, N.; Gunasekaran, A.; Dubey, R.; Childe, S.J. Agility and resilience as antecedents of supply chain performance under moderating effects of organizational culture within the humanitarian setting: A dynamic capability view. Prod. Plan. Control. 2018, 29, 1158–1174. [Google Scholar] [CrossRef]
- Liu, C.-L.; Shang, K.-C.; Lirn, T.-C.; Lai, K.-H.; Lun, Y.H. Supply chain resilience, firm performance, and management policies in the liner shipping industry. Transp. Res. Part A Policy Pr. 2018, 110, 202–219. [Google Scholar] [CrossRef]
- Kim, J. Development and Validation of the Career Adaptability Scale for Undergraduates in Korea. Sustainability 2021, 13, 11004. [Google Scholar] [CrossRef]
- Abdulahi, E.W.; Fan, L. Exploring and Validating Container Operational Risk Scale in Container Shipping: The Case of Ethiopian Shipping and Logistics Service Enterprise. Sustainability 2021, 13, 9248. [Google Scholar] [CrossRef]
- Fermani, A.; Sergi, M.; Carrieri, A.; Crespi, I.; Picconi, L.; Saggino, A. Sustainable Tourism and Facilities Preferences: The Sustainable Tourist Stay Scale (STSS) Validation. Sustainability 2020, 12, 9767. [Google Scholar] [CrossRef]
- Maskey, R.; Fei, J.; Nguyen, H.-O. Use of exploratory factor analysis in maritime research. Asian J. Shipp. Logist. 2018, 34, 91–111. [Google Scholar] [CrossRef]
- Hurley, A.E.; Scandura, T.A.; Schriesheim, C.A.; Brannick, M.T.; Seers, A.; Vandenberg, R.J.; Williams, L.J. Exploratory and Confirmatory Factor Analysis: Guidelines, Issues, and Alternatives. J. Organ. Behav. 1997, 18, 667–683. [Google Scholar] [CrossRef]
- Kaiser, H.F. An index of factorial simplicity. Psychometrika 1974, 39, 31–36. [Google Scholar] [CrossRef]
- Hair, J.F.; Anderson, R.E.; Tatham, R.L.; Black, W.C. Factor analysis. Multivariate data analysis. NJ Prentice-Hall 1998, 3, 98–99. [Google Scholar]
- Osborne, J.W.; Costello, A.B.; Kellow, J.T. Exploratory factor analysis (EFA) is rightly described as both an art and a science, whereresearchers follow a series of analytic steps involving judgments more reminiscent of qualitative inquiry, an interesting irony given the mathematical sophisticati. Best Pract. Quant. Methods 2008, 86. [Google Scholar] [CrossRef]
- Lu, C.-S.; Shang, K.-C.; Lin, C.-C. Examining sustainability performance at ports: Port managers’ perspectives on developing sustainable supply chains. Marit. Policy Manag. 2016, 43, 909–927. [Google Scholar] [CrossRef]
- Van Driel, O.P. On various causes of improper solutions in maximum likelihood factor analysis. Psychometrika 1978, 43, 225–243. [Google Scholar] [CrossRef]
- Chen, F.; Bollen, K.A.; Paxton, P.; Curran, P.J.; Kirby, J.B. Improper Solutions in Structural Equation Models: Causes, Consequences, and Strategies. Sociol. Methods Res. 2001, 29, 468–508. [Google Scholar] [CrossRef]
- Hair, J.F.; Anderson, R.E.; Tatham, R.L.; Black, W.C. Análisis Multivariante; Prentice Hall Madrid: Madrid, Spain, 1999; Volume 491. [Google Scholar]
- Kline, R.B. Principles and Practice of Structural Equation Modeling; Guilford Publications: New York, NY, USA, 2015; ISBN 1462523358. [Google Scholar]
- Hu, L.; Bentler, P.M. Cutoff criteria for fit indexes in covariance structure analysis: Conventional criteria versus new alternatives. Struct. Equ. Model. A Multidiscip. J. 1999, 6, 1–55. [Google Scholar] [CrossRef]
- Brusset, X. Does supply chain visibility enhance agility? Int. J. Prod. Econ. 2016, 171, 46–59. [Google Scholar] [CrossRef]
- Bagozzi, R.P.; Yi, Y. On the evaluation of structural equation models. J. Acad. Mark. Sci. 1988, 16, 74–94. [Google Scholar] [CrossRef]
- Ha, M.-H.; Yang, Z.; Lam, J.S.L. Port performance in container transport logistics: A multi-stakeholder perspective. Transp. Policy 2018, 73, 25–40. [Google Scholar] [CrossRef]
- Zhang, Y.; Kim, C.-W.; Tee, K.F.; Lam, J.S.L. Optimal sustainable life cycle maintenance strategies for port infrastructures. J. Clean. Prod. 2017, 142, 1693–1709. [Google Scholar] [CrossRef]
Figure 1.
Port resilience measurement framework.

Figure 2.
Result of confirmatory factor analysis.


Table 1.
Summary of the literature.
| Reference | Main Construct | |
|---|---|---|
| Port resilience | [25] | robustness |
| [26] | robustness, response, recovery | |
| [27] | flexibility | |
| [28] | collaboration, information sharing | |
| [29] | collaboration | |
| [24] | information sharing | |
| [33] | Robustness, agility | |
| Supply chain resilience | [12,35] | flexibility, efficiency, visibility, recovery, collaboration |
| [36] | vulnerability, flexibility, velocity, visibility, collaboration | |
| [37] | flexibility, visibility, capacity, collaboration, redundancy, agility | |
| [4] | flexibility, redundancy, integration, efficiency, market strength, financial soundness, readiness, response, recovery | |
| [38] | anticipation (robustness, redundancy, design), resistance (collaboration, agility), recovery, response | |
| [45] | redundancy, recovery, vulnerability, agility, flexibility, opacity, collaboration, visibility | |
| [46] | Flexibility, velocity, collaboration | |
| Infrastructure resilience | [39,40] | robustness, redundancy, resourcefulness, rapidity |
| [41] | commitment, culture, awareness, opacity, preparedness, flexibility | |
| [7] | absorptive capability (robustness, redundancy), adaptive capability (contingency, substitutability), restorative capability (resources, procurement) | |
Table 2.
Definitions of the nine resilience factors.
| Factor | Definition | Source |
|---|---|---|
| Robustness | The ability to resist change without adapting its initial stable configuration | [47] |
| Redundancy | Ability to respond to sudden changes through multiple suppliers and slack resources | [37] |
| Visibility | The extent to which actors have access which they consider as being key or useful to their operations | [36] |
| Flexibility | The ability of a system to adapt to the changing requirements of its environment with minimum time and effort | [45] |
| Collaboration | The level of joint decision making at a tactical, operational or strategic level between two or more partners | [46] |
| Agility | The ability to rapidly respond to changes in market and customer demands | [48] |
| Information Sharing | The degrees of communication, trust, and interdependence for their willingness to work together in a joint manner | [49] |
| Response | The required reaction to an incident or emergency to assess the level of containment and to control activity | [50] |
| Recovery | Ability to return to normal operational state rapidly | [12] |
Table 3.
Measurement variables.
| Construct | Measurement Variables | Source |
|---|---|---|
| Robustness (ROB) | (rob1) Port performance would not deviate significantly from targets. | [51] |
| (rob2) The port would be able to carry out its regular functions in any situation. | ||
| (rob3) The port retains the same stable situation as it had before changes occur. | [52] | |
| (rob4) Without adaptations being necessary, the port performs well over a wide variety of possible scenarios | ||
| Redundancy (RED) | (red1) The port maintains reserve capacity for physical supports such as equipment and workforce. | [4] |
| (red2) The port has backup energy and utility sources for contingency. | ||
| (red3) The port has reserve capacity to handle unexpected fluctuations in demands. | [53] | |
| Visibility (VIS) | (vis1) The port has an information system that accurately track all operations. | [35] |
| (vis2) The port manages real-time data on equipment, workforce, etc. | ||
| (vis3) The port has an effective business intelligence program for data analysis. | ||
| Flexibility (FLE) | (fle1) The port can adjust its delivery schedules to mitigate disruptions. | [54] |
| (fle2) The port can adjust work capacity in response to disruptions. | ||
| (fle3) The port’s collaboration partners can flexibly adjust supply capacity to mitigate disruptions. | ||
| Collaboration (COL) | (col1) The port jointly works with its key partners for mutual managerial goals. | [54] |
| (col2) The port develops strategic objectives jointly with partners. | ||
| (col3) The port jointly works with its key partners for mutual benefits. | ||
| Agility (AGI) | (agi1) The port is capable of responding to unexpected requests by partners. | [55] |
| (agi2) The port operation model is capable of quickly responding to rapid changes in environment. | ||
| (agi3) The port’s employees have capabilities to perform multiple works and quickly switch between them. | [56] | |
| Information Sharing (IMS) | (ims1) The port exchanges relevant information with partners. | [51] |
| (ims2) The port exchanges timely information with partners. | ||
| (ims3) The port exchanges accurate information with partners. | ||
| Response (RES) | (res1) The port can quickly respond to disruptions. | [4] |
| (res2) The port can undertake adequate respond to crises. | ||
| (res3) The port has a contingency for mitigating crisis. | ||
| Recovery (REC) | (rec1) The port has the ability to absorb significant losses. | [4] |
| (rec2) The port can recover from crises at less costs. | ||
| (rec3) The port can reduce impact of loss by its ability to handle crisis. |
Table 4.
Sample demographics.
| Characteristic | Number of Respondents | Percentage of Respondents | |
|---|---|---|---|
| Type | Shipping company | 94 | 47.2% |
| Operator | 85 | 42.7% | |
| Port authority | 20 | 10.1% | |
| Work experience | 1–5 years | 34 | 17.1% |
| 6–10 years | 38 | 19.1% | |
| 11–15 years | 36 | 18.1% | |
| 16–20 years | 33 | 16.6% | |
| Over 20 years | 58 | 29.1% | |
Table 5.
Results of the primary exploratory factor analysis.
| Variable | ROB | RED | VIS | FLE | COL | AGI | IMS | RES | REC | Communality |
|---|---|---|---|---|---|---|---|---|---|---|
| rob1 | 0.27 | 0.03 | 0.26 | 0.08 | 0.25 | 0.04 | 0.24 | 0.09 | 0.04 | 0.28 |
| rob2 | 0.57 | 0.06 | 0.11 | 0.17 | 0.17 | 0.13 | 0.08 | 0.04 | 0.07 | 0.43 |
| rob3 | 0.93 | 0.22 | 0.11 | 0.02 | 0.04 | 0.06 | 0.06 | 0.16 | 0.19 | 1 |
| rob4 | 0.52 | 0.28 | 0.24 | 0.03 | 0.03 | 0.14 | 0.13 | 0.19 | 0.25 | 0.55 |
| red1 | 0.19 | 0.51 | 0.21 | 0.09 | 0.02 | 0.13 | 0.23 | 0.16 | 0.12 | 0.45 |
| red2 | 0.24 | 0.74 | 0.23 | 0.15 | 0.06 | 0.12 | 0.21 | 0.12 | 0.2 | 0.8 |
| red3 | 0.11 | 0.45 | 0.22 | 0.19 | 0.17 | 0.32 | 0.16 | 0.17 | 0.11 | 0.49 |
| vis1 | 0.13 | 0.26 | 0.62 | 0.09 | 0.14 | 0.12 | 0.17 | 0.14 | 0.12 | 0.58 |
| vis2 | 0.11 | 0.07 | 0.9 | 0.12 | 0.09 | 0.15 | 0.23 | 0.05 | 0.04 | 0.93 |
| vis3 | 0.16 | 0.21 | 0.58 | 0.05 | 0.11 | 0.08 | 0.11 | 0.08 | 0.22 | 0.5 |
| fle1 | 0.13 | 0.18 | 0.13 | 0.66 | 0.2 | 0.16 | 0.12 | 0.13 | 0.04 | 0.6 |
| fle2 | 0.1 | 0.08 | 0.11 | 0.93 | 0.16 | 0.15 | 0.15 | 0.17 | 0.09 | 1 |
| fle3 | 0.07 | 0.19 | 0.06 | 0.03 | 0.15 | 0.09 | 0.37 | 0.14 | −0.03 | 0.23 |
| col1 | 0.07 | 0.05 | 0.14 | 0.15 | 0.54 | 0.27 | 0.36 | 0.15 | −0.02 | 0.57 |
| col2 | 0.13 | 0.08 | 0.13 | 0.13 | 0.79 | 0.17 | 0.26 | 0.18 | 0.1 | 0.83 |
| col3 | 0.09 | 0.06 | 0.12 | 0.21 | 0.71 | 0.13 | 0.32 | 0.08 | 0.14 | 0.72 |
| agi1 | 0.12 | 0.2 | 0.18 | 0.24 | 0.26 | 0.78 | 0.18 | 0.16 | 0.08 | 0.87 |
| agi2 | 0.25 | 0.14 | 0.16 | 0.16 | 0.17 | 0.56 | 0.21 | 0.19 | 0.23 | 0.61 |
| agi3 | 0.14 | 0.17 | 0.13 | 0.08 | 0.2 | 0.4 | 0.41 | 0.2 | 0.15 | 0.51 |
| ims1 | 0.09 | 0.07 | 0.13 | 0.11 | 0.19 | 0.12 | 0.86 | 0.06 | 0.11 | 0.85 |
| ims2 | 0.01 | 0.1 | 0.21 | 0.11 | 0.2 | 0.08 | 0.82 | 0.12 | 0.13 | 0.82 |
| ims3 | 0.13 | 0.18 | 0.2 | 0.1 | 0.24 | 0.12 | 0.79 | 0.23 | 0.07 | 0.85 |
| res1 | 0.16 | 0.12 | 0.15 | 0.22 | 0.14 | 0.26 | 0.32 | 0.63 | 0.17 | 0.73 |
| res2 | 0.17 | 0.22 | 0.15 | 0.21 | 0.18 | 0.25 | 0.32 | 0.66 | 0.22 | 0.83 |
| res3 | 0.18 | 0.24 | 0.09 | 0.16 | 0.34 | 0.06 | 0.35 | 0.52 | 0 | 0.63 |
| rec1 | 0.26 | 0.37 | 0.2 | 0.1 | 0.13 | 0.13 | 0.03 | 0.36 | 0.52 | 0.69 |
| rec2 | 0.18 | 0.12 | 0.2 | 0.06 | 0.02 | 0.15 | 0.16 | 0.03 | 0.92 | 1 |
| rec3 | 0.22 | 0.16 | 0.05 | 0.09 | 0.24 | 0.06 | 0.06 | 0.32 | 0.42 | 0.42 |
Table 6.
Results of the secondary exploratory factor analysis.
| Variable | ROB | RED | VIS | FLE | COL | AGI | IMS | RES | REC | Communality |
|---|---|---|---|---|---|---|---|---|---|---|
| rob2 | 0.57 | 0.06 | 0.12 | 0.17 | 0.16 | 0.13 | 0.07 | 0.04 | 0.07 | 0.43 |
| rob3 | 0.93 | 0.21 | 0.11 | 0.02 | 0.05 | 0.06 | 0.05 | 0.17 | 0.19 | 1 |
| rob4 | 0.52 | 0.28 | 0.23 | 0.04 | 0.03 | 0.15 | 0.12 | 0.2 | 0.25 | 0.54 |
| red1 | 0.19 | 0.51 | 0.21 | 0.09 | 0.02 | 0.14 | 0.2 | 0.17 | 0.12 | 0.45 |
| red2 | 0.25 | 0.74 | 0.24 | 0.14 | 0.08 | 0.12 | 0.18 | 0.13 | 0.2 | 0.8 |
| red3 | 0.11 | 0.46 | 0.23 | 0.19 | 0.18 | 0.32 | 0.13 | 0.17 | 0.11 | 0.5 |
| vis1 | 0.13 | 0.24 | 0.66 | 0.1 | 0.15 | 0.11 | 0.15 | 0.15 | 0.11 | 0.61 |
| vis2 | 0.11 | 0.08 | 0.85 | 0.12 | 0.09 | 0.15 | 0.24 | 0.05 | 0.04 | 0.85 |
| vis3 | 0.16 | 0.2 | 0.61 | 0.06 | 0.11 | 0.08 | 0.11 | 0.08 | 0.22 | 0.53 |
| fle1 | 0.12 | 0.17 | 0.14 | 0.66 | 0.21 | 0.16 | 0.11 | 0.14 | 0.04 | 0.6 |
| fle2 | 0.09 | 0.09 | 0.1 | 0.93 | 0.17 | 0.15 | 0.15 | 0.17 | 0.09 | 1 |
| col1 | 0.07 | 0.06 | 0.14 | 0.15 | 0.55 | 0.27 | 0.34 | 0.16 | −0.02 | 0.56 |
| col2 | 0.13 | 0.07 | 0.14 | 0.13 | 0.82 | 0.16 | 0.22 | 0.19 | 0.1 | 0.85 |
| col3 | 0.09 | 0.06 | 0.12 | 0.21 | 0.71 | 0.13 | 0.3 | 0.09 | 0.13 | 0.71 |
| agi1 | 0.12 | 0.2 | 0.19 | 0.24 | 0.27 | 0.77 | 0.15 | 0.16 | 0.08 | 0.86 |
| agi2 | 0.25 | 0.14 | 0.16 | 0.16 | 0.18 | 0.57 | 0.19 | 0.19 | 0.23 | 0.62 |
| agi3 | 0.14 | 0.17 | 0.13 | 0.08 | 0.21 | 0.41 | 0.39 | 0.22 | 0.14 | 0.5 |
| ims1 | 0.09 | 0.1 | 0.13 | 0.11 | 0.21 | 0.14 | 0.84 | 0.09 | 0.09 | 0.84 |
| ims2 | 0.01 | 0.12 | 0.22 | 0.11 | 0.22 | 0.09 | 0.81 | 0.15 | 0.11 | 0.82 |
| ims3 | 0.12 | 0.2 | 0.19 | 0.1 | 0.27 | 0.13 | 0.77 | 0.26 | 0.05 | 0.86 |
| res1 | 0.16 | 0.12 | 0.16 | 0.22 | 0.15 | 0.26 | 0.29 | 0.65 | 0.17 | 0.73 |
| res2 | 0.17 | 0.22 | 0.15 | 0.21 | 0.19 | 0.26 | 0.28 | 0.67 | 0.21 | 0.83 |
| res3 | 0.17 | 0.24 | 0.09 | 0.16 | 0.36 | 0.06 | 0.31 | 0.53 | −0.01 | 0.63 |
| rec1 | 0.26 | 0.36 | 0.21 | 0.1 | 0.14 | 0.13 | 0.01 | 0.36 | 0.52 | 0.69 |
| rec2 | 0.19 | 0.12 | 0.21 | 0.06 | 0.02 | 0.15 | 0.18 | 0.03 | 0.92 | 1 |
| rec3 | 0.22 | 0.16 | 0.05 | 0.09 | 0.24 | 0.06 | 0.05 | 0.32 | 0.42 | 0.42 |
Table 7.
The discriminant measures.
| Variables | ROB | RED | VIS | FLE | COL | AGI | IMS | RES | REC |
|---|---|---|---|---|---|---|---|---|---|
| ROB | 0.584 | ||||||||
| RED | 0.430 | 0.542 | |||||||
| VIS | 0.208 | 0.428 | 0.627 | ||||||
| FLE | 0.104 | 0.252 | 0.166 | 0.754 | |||||
| COL | 0.118 | 0.206 | 0.211 | 0.285 | 0.682 | ||||
| AGI | 0.265 | 0.473 | 0.319 | 0.346 | 0.453 | 0.558 | |||
| IMS | 0.113 | 0.312 | 0.284 | 0.179 | 0.437 | 0.368 | 0.819 | ||
| RES | 0.295 | 0.460 | 0.266 | 0.352 | 0.393 | 0.547 | 0.450 | 0.691 | |
| REC | 0.442 | 0.526 | 0.288 | 0.170 | 0.187 | 0.378 | 0.154 | 0.472 | 0.560 |
Table 8.
Fit indexes.
| Index | Χ2 | df | p-Value | CFI | TLI | RMSEA |
|---|---|---|---|---|---|---|
| Value | 564.556 | 288 | 0.000 | 0.916 | 0.905 | 0.069 |
Table 9.
Confirmatory factor analysis results.
| Latent Variables | Measurement Variables | Loadings | CR | AVE |
|---|---|---|---|---|
| Robustness | rob2 | 0.627 | 0.805 | 0.584 |
| rob3 | 0.887 | |||
| rob4 | 0.756 | |||
| Redundancy | red1 | 0.683 | 0.778 | 0.542 |
| red2 | 0.830 | |||
| red3 | 0.685 | |||
| Visibility | vis1 | 0.813 | 0.834 | 0.627 |
| vis2 | 0.829 | |||
| vis3 | 0.729 | |||
| Flexibility | fle1 | 0.833 | 0.859 | 0.754 |
| fle2 | 0.902 | |||
| Collaboration | col1 | 0.737 | 0.865 | 0.682 |
| col2 | 0.885 | |||
| col3 | 0.849 | |||
| Agility | agi1 | 0.837 | 0.860 | 0.558 |
| agi2 | 0.787 | |||
| agi3 | 0.704 | |||
| Information Sharing | ims1 | 0.893 | 0.750 | 0.819 |
| ims2 | 0.893 | |||
| ims3 | 0.928 | |||
| Response | res1 | 0.841 | 0.869 | 0.691 |
| res2 | 0.928 | |||
| res3 | 0.711 | |||
| Recovery | rec1 | 0.867 | 0.789 | 0.560 |
| rec2 | 0.744 | |||
| rec3 | 0.611 | |||
| Absorptive Capability | Robustness | 0.710 | 0.827 | 0.618 |
| Redundancy | 0.916 | |||
| Visibility | 0.714 | |||
| Adaptive Capability | Flexibility | 0.659 | 0.849 | 0.587 |
| Collaboration | 0.763 | |||
| Agility | 0.888 | |||
| Information Sharing | 0.737 | |||
| Restorative Capability | Response | 0.892 | 0.826 | 0.705 |
| Recovery | 0.784 | |||
| Port Resilience | Absorptive Capability | 0.895 | 0.954 | 0.875 |
| Adaptive capability | 0.914 | |||
| Restorative Capability | 0.994 |
Table 10.
Measurement scores.
| Constructs | Mean of Measurement Variables | Mean of Latent Variables | ||
|---|---|---|---|---|
| Robustness | rob2 | 3.42 | 3.27 | 3.26 |
| rob3 | 3.2 | |||
| rob4 | 3.2 | |||
| Redundancy | red1 | 3.48 | 3.27 | |
| red2 | 3.2 | |||
| red3 | 3.12 | |||
| Visibility | vis1 | 3.26 | 3.25 | |
| vis2 | 3.42 | |||
| vis3 | 3.06 | |||
| Flexibility | fle1 | 3.36 | 3.36 | 3.30 |
| fle2 | 3.35 | |||
| Collaboration | col1 | 3.59 | 3.42 | |
| col2 | 3.25 | |||
| col3 | 3.41 | |||
| Agility | agi1 | 3.07 | 3.11 | |
| agi2 | 3.1 | |||
| agi3 | 3.16 | |||
| Information Sharing | ims1 | 3.48 | 3.47 | |
| ims2 | 3.48 | |||
| ims3 | 3.45 | |||
| Response | res1 | 3.26 | 3.36 | 3.14 |
| res2 | 3.32 | |||
| res3 | 3.51 | |||
| Recovery | rec1 | 2.85 | 2.92 | |
| rec2 | 2.7 | |||
| rec3 | 3.2 | |||
Table 11.
Factor-specific activities to improve port resilience.
| Constructs | Activities to Improve Resilience |
|---|---|
| Robustness | Situational (natural disasters, terrorism, strike, etc.) operation manuals. Identifying vulnerabilities and developing regular inspection plans. |
| Redundancy | Securing and managing reserve unloading and transportation equipment. Emergency workforce mobilization plans. |
| Visibility | Advancing and visualizing port operation information systems. Introducing advanced technologies such as digital twins. |
| Flexibility | Developing contingency operation plans using big data, AI, etc. |
| Collaboration | Organizing a port operation council centering on stakeholders. Sharing the port’s strategic targets. |
| Agility | Identifying customer needs on a regular basis. Training staff on how to cope with crises. |
| Information Sharing | Risk information sharing through the port operation council. Information sharing to develop joint response systems. |
| Response | Developing crisis-specific contingency organizations and reporting structures and appoint persons in charge. Carrying out crisis response training to improve the capabilities of the contingency organization. |
| Recovery | Developing plans to finance port function restoration in emergency situations. Measuring the effectiveness of the contingency plans through simulation. |
Publisher’s Note: MDPI stays neutral with regard to jurisdictional claims in published maps and institutional affiliations. |
© 2021 by the authors. Licensee MDPI, Basel, Switzerland. This article is an open access article distributed under the terms and conditions of the Creative Commons Attribution (CC BY) license (https://creativecommons.org/licenses/by/4.0/).
Share and Cite
MDPI and ACS Style
Kim, S.; Choi, S.; Kim, C. The Framework for Measuring Port Resilience in Korean Port Case. Sustainability 2021, 13, 11883. https://0-doi-org.brum.beds.ac.uk/10.3390/su132111883
AMA Style
Kim S, Choi S, Kim C. The Framework for Measuring Port Resilience in Korean Port Case. Sustainability. 2021; 13(21):11883. https://0-doi-org.brum.beds.ac.uk/10.3390/su132111883
Chicago/Turabian StyleKim, Sungki, Sanggyun Choi, and Chanho Kim. 2021. "The Framework for Measuring Port Resilience in Korean Port Case" Sustainability 13, no. 21: 11883. https://0-doi-org.brum.beds.ac.uk/10.3390/su132111883
Note that from the first issue of 2016, this journal uses article numbers instead of page numbers. See further details here.