
A Machine Learning-Based Communication-Free PV Controller for Voltage Regulation
by
 , and
, and
Shabib Shahid
1,*, 
Saifullah Shafiq
2,
Bilal Khan
1,
Ali T. Al-Awami
1,3 and
Muhammad Omair Butt
2 1
Electrical Engineering Department, King Fahd University of Petroleum & Minerals, Dhahran 31261, Saudi Arabia
2
Electrical Engineering Department, Prince Mohammad Bin Fahd University, Khobar 31952, Saudi Arabia
3
Interdisciplinary Research Center for Smart Mobility and Logistics, King Fahd University of Petroleum & Minerals, P.O. Box 5067, Dhahran 31261, Saudi Arabia
*
Author to whom correspondence should be addressed.
Sustainability 2021, 13(21), 12208; https://0-doi-org.brum.beds.ac.uk/10.3390/su132112208
Submission received: 20 August 2021
/
Revised: 29 September 2021
/
Accepted: 30 September 2021
/
Published: 5 November 2021
(This article belongs to the Special Issue Sustainable Energy Systems: Emerging Technologies and Practices in Renewable Energy Storage)
Abstract
:Due to the recent advancements in the manufacturing process of solar photovoltaics (PVs) and electronic converters, solar PVs has emerged as a viable investment option for energy trading. However, distribution system with large-scale integration of rooftop PVs, would be subjected to voltage upper limit violations, unless properly controlled. Most of the traditional solutions introduced to address this problem do not ensure fairness amongst the on-line energy sources. In addition, other schemes assume the presence of communication linkages between these energy sources. This paper proposes a control scheme to mitigate the over-voltages in the distribution system without any communication between the distributed energy sources. The proposed approach is based on artificial neural networks that can utilize two locally obtainable inputs, namely, the nodal voltage and node voltage sensitivity and control the PV power. The controller is trained using extensive data generated for various loading conditions to include daily load variations. The control scheme was implemented and tested on a 12.47 kV feeder with 85 households connected on the 220 V distribution system. The results demonstrate the fair control of all the rooftop solar PVs mounted on various houses to ensure the system voltage are maintained within the allowed limits as defined by the ANSI C84.1-2016 standard. Furthermore, to verify the robustness of the proposed PV controller, it is tested during cloudy weather condition and the impact of integration of electric vehicles on the proposed controller is also analyzed. The results prove the efficacy of the proposed controller.
1. Introduction
Most of the governments around globe have set ambitious targets for reducing carbon emissions. In order to achieve these targets, a significant amount of small and medium scale renewable energy resources need to be integrated into the power grids. Hence, the traditional power systems are observing an ongoing transition that focus on environmental concerns such as smart grid initiatives, etc. Considering the renewables as an integral part of the power grids, the concept of unidirectional flow of power is not applicable anymore. Furthermore, the solar power being available in abundance and easy to harvest energy from, is allowing prominent integration of photovoltaic (PV) generators in power systems and enabling bi-directional power flow [1].
Among various renewable energy resources, the PV panels and wind turbines (WT) are considered as most suitable options for distributed power generation. Both the PVs and WTs tend to provide an economic and environment-friendly solution, besides being readily available [2]. However, the performance of these resources is inconsistent and is highly dependent on climatic factors such as location, time of the day, weather, etc. Thus, it is highly likely that the power generated through these renewable resources will not follow power variations in load. Consequently, introducing an uncertainty in the power quality and reliability of overall power system [3,4,5,6]. A net negative demand may result in the power system, due to inclusion of large number of renewables which can lead to voltage, thermal and other technical problems [7]. Hence, a controlling mechanism is required for all the system elements along with respective participants, to ensure effective integration of renewables in the power distribution systems [8].
Different machine-learning based controllers have been developed in the recent years, which are different in scope and objectives [9,10,11,12]. Artificial neural networks (ANN) are used by researchers to demonstrate faster and more accurate maximum power point tracking for solar PVs [9]. In [10], a multi-layer feed-forward ANN is used to improve the power quality in a power system with wide-spread EV chargers. Neural network-based vector controller is designed in [11,12] for the integration of residential solar PV with a utility grid. This intelligent control mechanism has several advantages over conventional controllers. These controllers are capable of mapping non-linear relationships and provide accurate solutions for multivariable problems. Hence, ANN is used to construct the controller used in this research work.
Active control strategies can be classified into model-based [13,14] or model-free [15] from the perspective of network operation modelling. In addition, control schemes can be defined as stochastic [16] and robust [17] when the relating uncertainties from renewable generation and communication networks are taken into account. An important system aspect is observability when classifying the control strategies. In this regard, approaches can be grouped into centralized, decentralized and fully autonomous [18].
A centralized control scheme requires an extensive observation platform to remotely monitor the distribution system parameters [19], lacking by current weaker or older distribution systems. Additionally, to process this huge amount of data, higher processing computing resources are needed in the central control unit. This centrally processed data is used to calculate power of the PV units. Therefore, this strategy turns out to be suboptimal for distribution systems which lack established communication links [20]. While the decentralized control procedures rely on reduced communication linkages, they also apply less computational resources as reduced data is transacted [20]. In spite of that, the need for communication networks, make these strategies less desirable.
Contrary to the presented strategies, autonomous schemes rely on locally available information. In addition, these local controllers avoid nearby communication dependence and are fast and less expensive to deploy. Thus, these techniques are most suitable solutions pre-widespread communication dependence. Autonomous techniques also have better thermal management since the amount of power curtailment reduce system components congestions [21]. However, there is a highly non-linear relationship between PV’s output and the system voltages.
In centralized and decentralized strategies, the system voltages are maintained by regulating PV’s active and reactive power outputs. However, in the literature, few autonomous control schemes are discussed. For voltage regulation reference [21] employs a voltage sensitivity concept to control PVs active and reactive power outputs. Although the concept of voltage sensitivity-based regulation is promising but the sensitivity calculation method is not robust enough to adapt to the system changes. Since configuration changes occur frequently in a typical distribution system. Moreover, the PVs fail to contribute equally for voltage regulation since the farthest PVs participate unfairly. Embedded inverter features, such as volt/var and volt/watt curves, can also be put in service to regulate the voltages in the absence of communication infrastructure [22]. In [23], optimal volt-var curves are found offline for rooftop PV inverters which are connected in the system taking count of load and PV’s active power scenarios. However, this approach has a major shortcoming as it cannot integrate system changes. Additionally, the present optimal volt/var curves may become worst due to resulting changes in the system configuration.
Generally, the rooftop PVs are installed to maximize the monetary profits and therefore, most of the PVs are installed with controllers that drive them towards unity power factor [24]. However, smart inverters are required to operate within a range of selected power factors to support voltage regulation, as per the IEEE 1547 Standard for distributed energy resources (DERs) interconnection [25]. Thus, all PVs should contribute equally when system support is needed, especially during over-voltage events. In this context, similar contribution from the PVs available at disparage locations in the distribution system is called ‘fairness’. An autonomous PV controller is designed that ensures fairness among the PVs, but it is limited to a small-scale distribution system [26].
In this article, a machine learning-based autonomous PV controller framework is presented. The training data are generated for changing loading conditions to include daily, monthly and yearly load variations. Nodal voltage and its sensitivity to changes in the load are input signals to the controller and the determined output is the applicable demand. The proposed controller thresholds the active power output of the PVs to maintain the voltages within the allowable range as given by ANSI C84.1-2016 standard [27]. A noteworthy feature of the proposed controller is ensuring fairness among PVs installed at various locations in the secondary distribution system. A PV-rich test distribution system is employed to evaluate efficacy of the proposed controller. Moreover, response of the controller is further tested under cloudy weather and it fairly controls all the PVs irrespective of their locations. To further test the robustness of the PV controller, many EVs are connected in the network. Results show that the implemented controller regulates the system voltages effectively. Moreover, all the PVs fairly contribute when the system requires support. The following are specific contributions of this article:
- (1)
- A communication-free PV controller is proposed that determines the power cap for each PV based on the local measurements, such as nodal voltage and nodal sensitivity.
- (2)
- The proposed controller effectively regulates the system voltages as defined by ANSI C84.1-2016 standard without the need for any communication infrastructure.
- (3)
- The most attractive feature of the proposed controller is to fairly control the PV power outputs irrespective of their nodal placements in distribution system.
2. Proposed Methodology
2.1. PV Voltage Control
The proposed controller adjusts the power injection of the solar PVs to keep the system voltage within an acceptable range. These PV power plants are connected at various locations in the distribution system, some are closer to and others farther away from the distribution transformer. Each of these solar PVs must be restricted to generate power not more than the upper generation limit termed as power generation cap (PGcap).
In order to circumvent the communication requirements between the distributed solar power producers, it is important to estimate the PGcap using local measurements only. Although voltage at the point of connection (POC) is an important basis for estimating PGcap, but it is not sufficient. Because voltages of the different nodes may behave differently to the power injections. Some of the nodes may violate the upper voltage limits, especially when PV generates more than the connected demand. In this case, downstream or farther nodes in the system will have higher voltages as compared to the nodes at the upstream. In fact, the downstream nodes which are farther from the feeding point are more sensitive to load/generation changes as compared to the upstream nodes. Therefore, the nodal sensitivity can be used along with the nodal voltages, to regulate the power generated by PVs. Moreover, the local voltage sensitivity can also be estimated remotely [18,20]. In addition, the method for its computation is described by Algorithm 1.
Algorithm 1 uses the local nodal voltage (), electric load () and the power generated by the solar PV (). These inputs are used to compute the local voltage sensitivity () for each instant. However, in some instances when the change in at a particular node is less than the threshold β, the sensitivity value is not updated because these events may result in the incorrect sensitivity calculations. In fact, the change in load/generation at a particular node would have more impact on the voltage of that node as compared to the other nodes. So, if the sensitivity is calculated for the node during the instances when the change in load/generation is low at that specific node, the change in the voltage at that node may have the more influence of the significant changes in load/generation at the nearby nodes. Hence, these instances may result in wrong sensitivity calculations and are ignored. A tuning parameter β is used to filter out these values. Note that β may vary from one distribution network to another.
| Algorithm 1 Proposed voltage sensitivity calculation |
| Input: Output: Variables: 1: 2: 3: if then 4: 5: else 6: 7: End if |
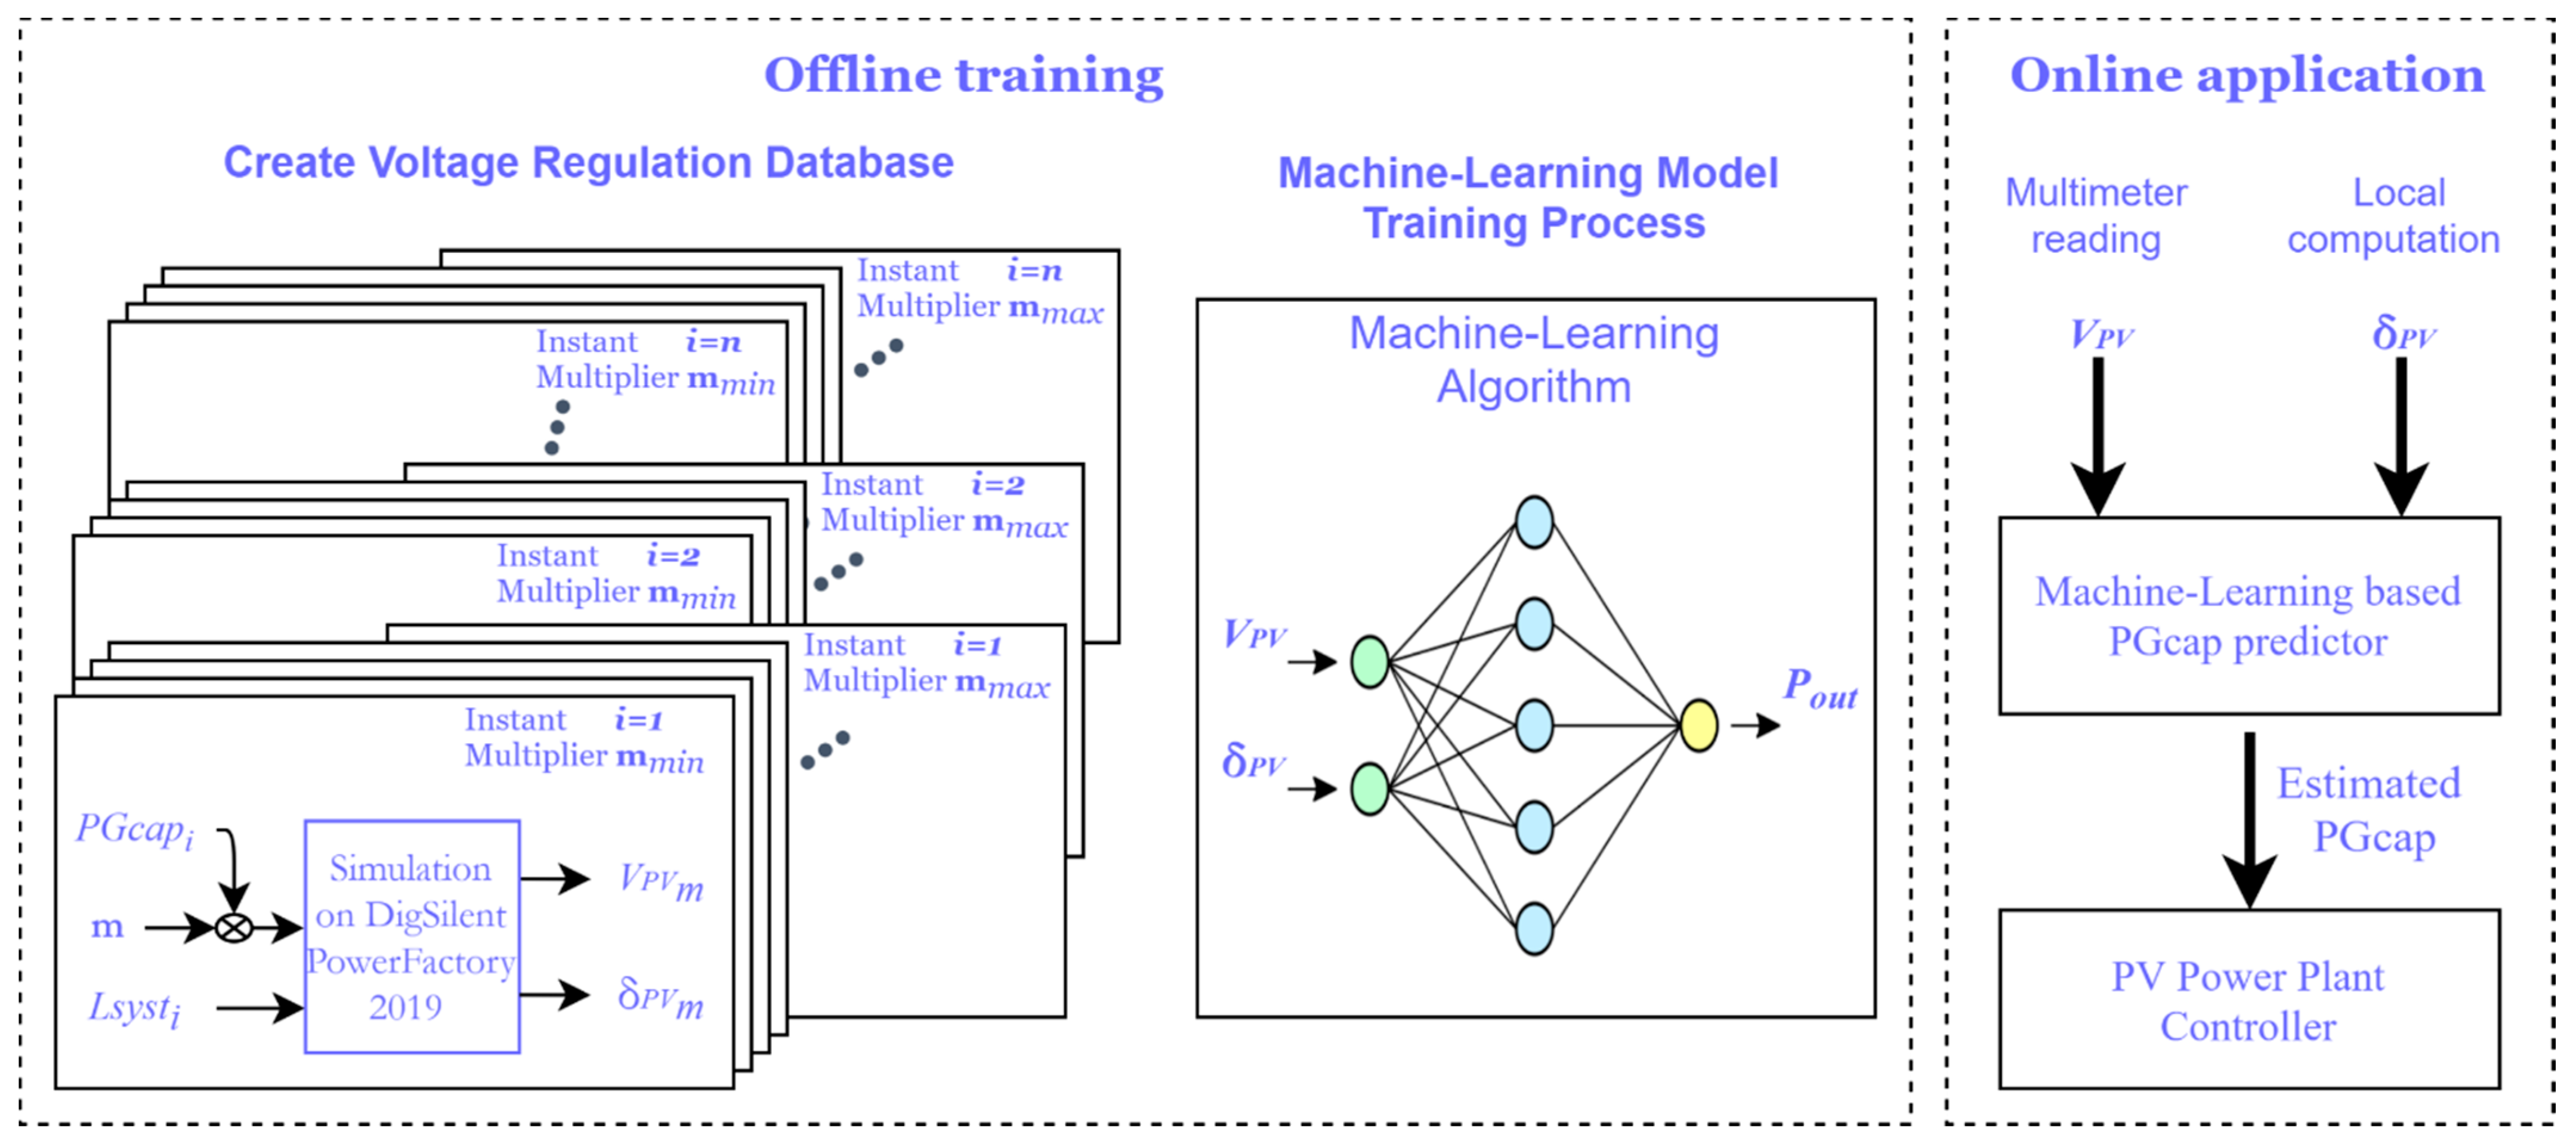
The value of the voltage sensitivity coefficient at any node and the respective voltage at the POC, gives a good description of the nodes position in the distribution system. Therefore, a machine learning-based approach is designed to use these inputs to determine the PGcap fairly for all the solar power plant. Once the objective and input to the machine learning-based strategy is identified, the strategy is further grouped in offline training and an online application module as given in Figure 1.
2.2. Create Voltage Regulation Database
For any machine learning algorithm to achieve good performance in online application, the training set needs to cover operation conditions in the field. In this application, this means realistic ranges of system loads (Lsyst) and solar power generations needs to be simulated.
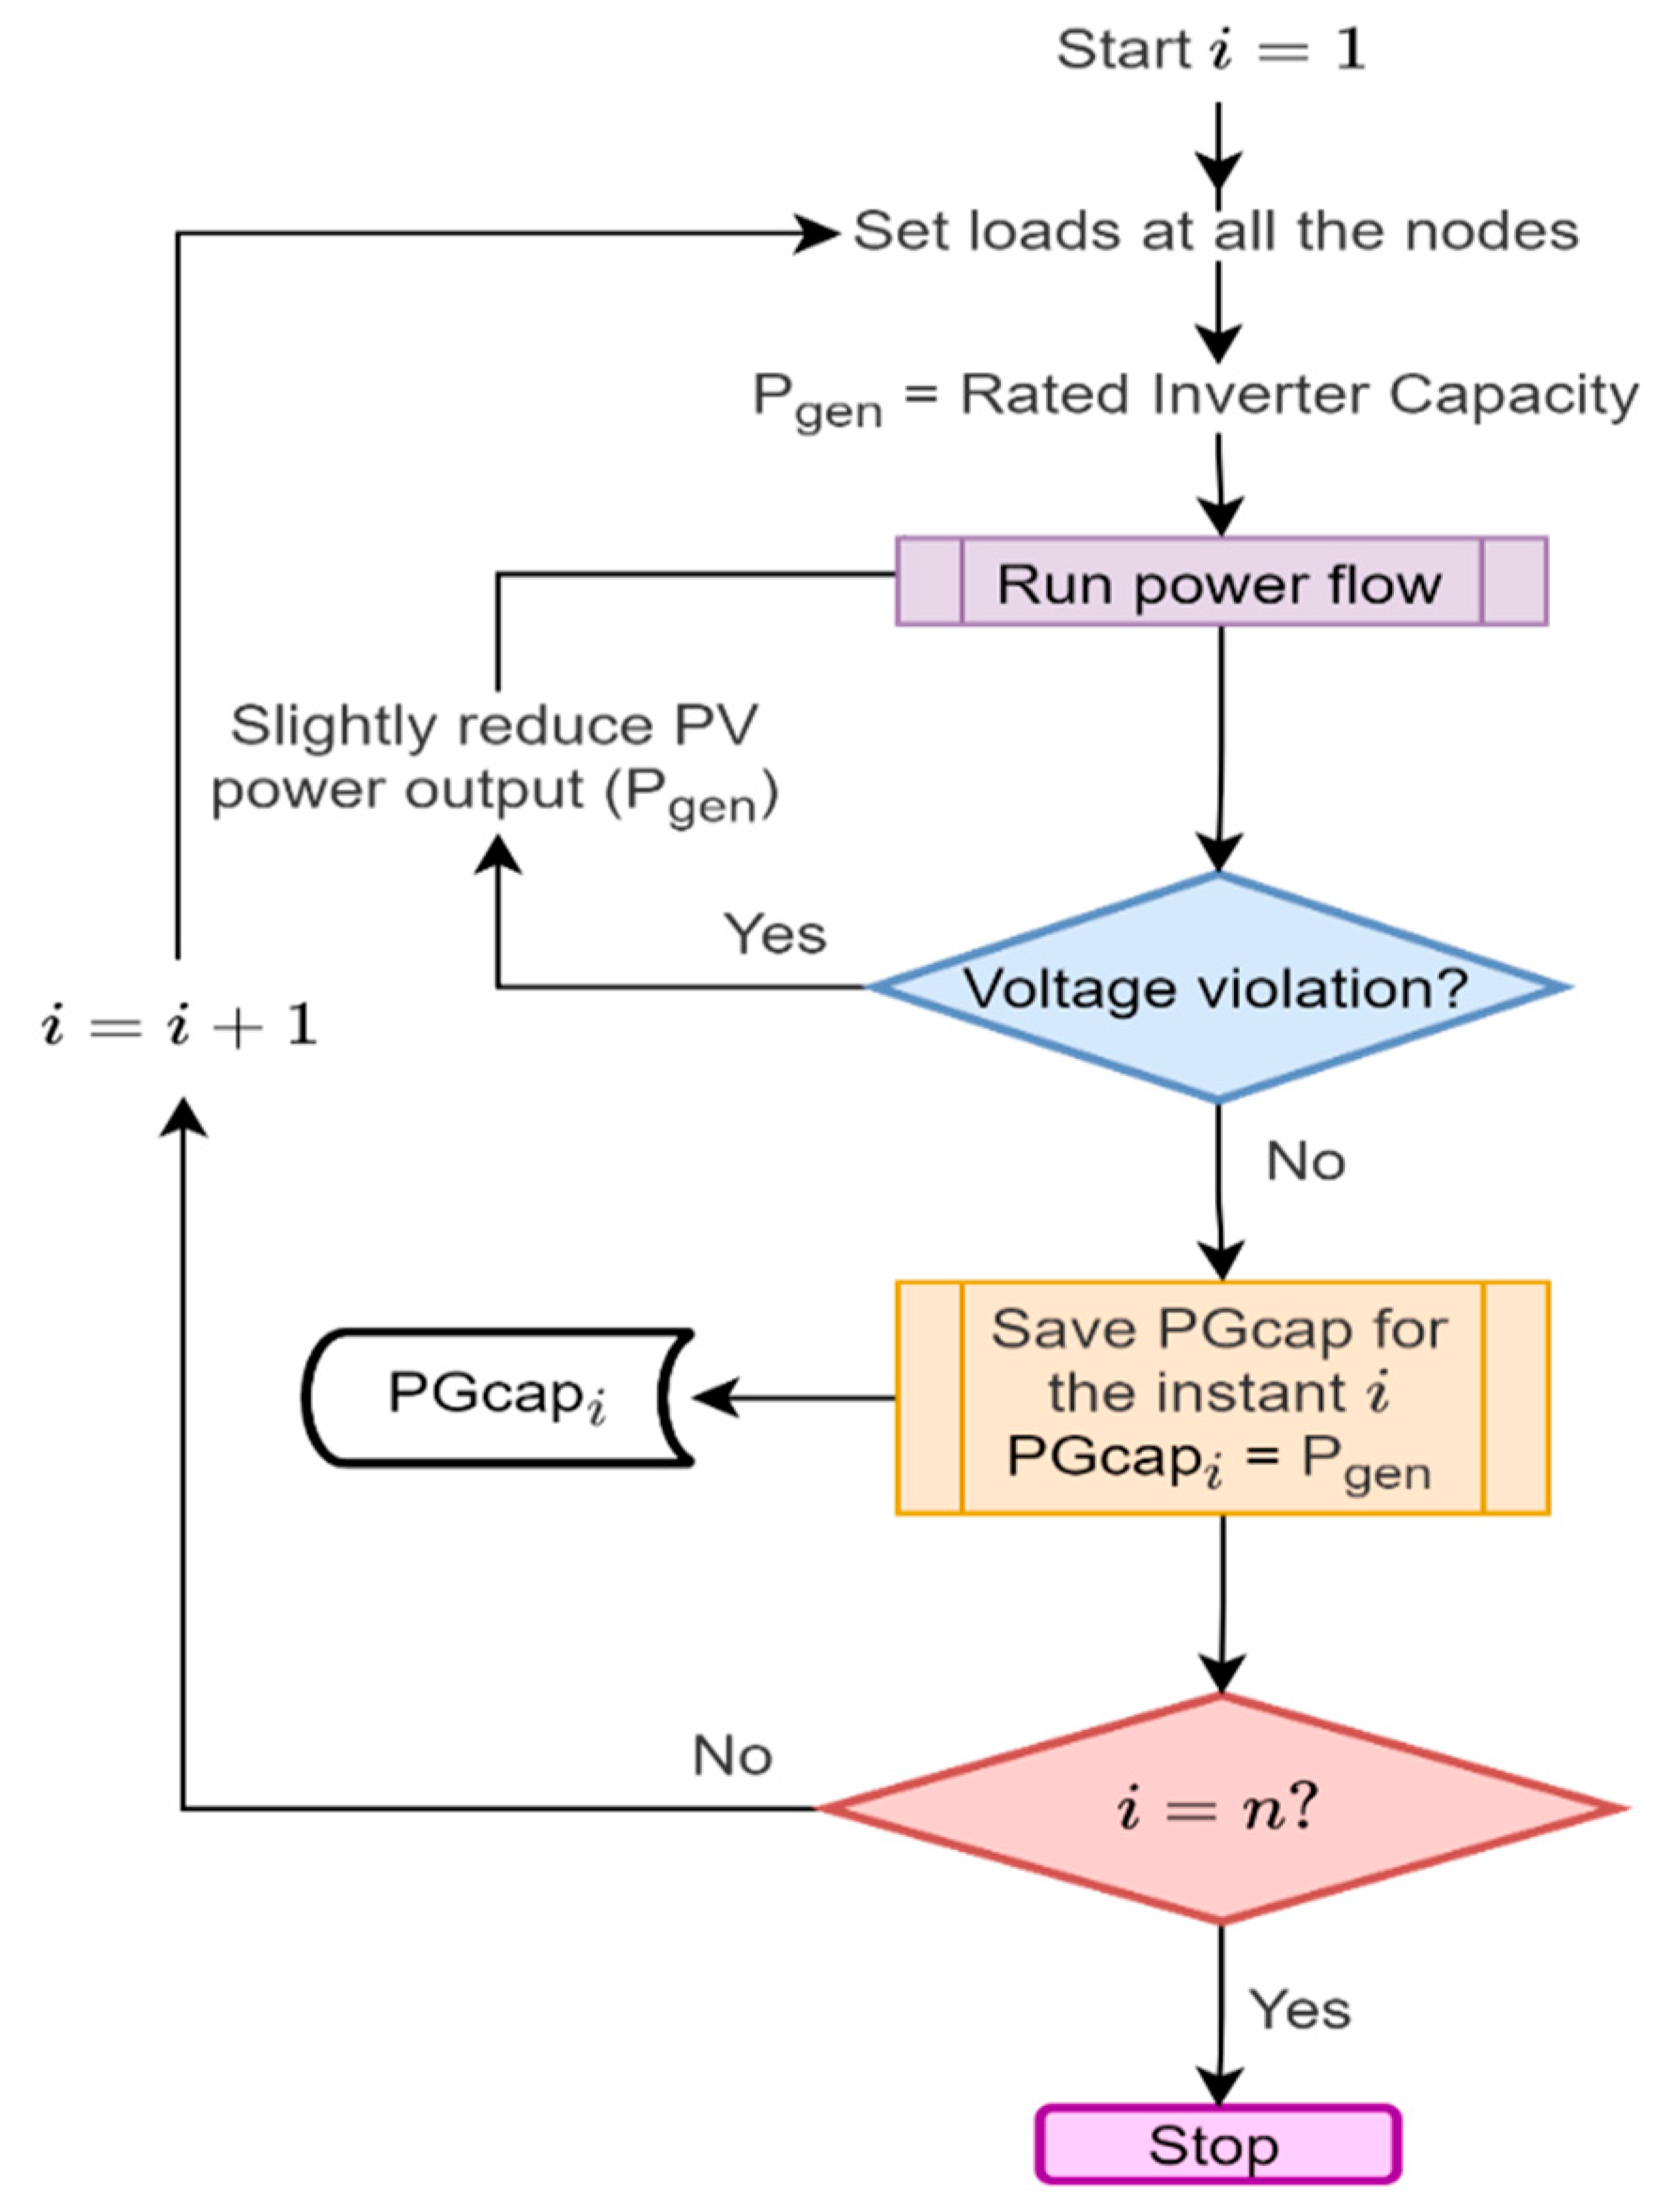
To generate a required data set, load is set at all the system nodes and then the PGcap is found by an iterative process as shown in Figure 2. At the start, all the PVs are selected to generate at their maximum rated capacity. Then, the power flow analysis is performed using a simulator and subsequently power outputs of PVs are reduced to the level that all the system over-voltages are eliminated. This procedure is repeated for various conditions of electrical load in the system to simulate load variations ranging from hours to seasons. Based on the power flow results of each loading condition, the PGcap that needs to be applied at each node is determined so that the acceptable voltage profiles are obtained.
Furthermore, the additional training data points are required to train the controller’s response to high voltage and low voltage scenarios. The high voltages may appear in the system when the power generated by the PVs is greater than the PGcap at any particular instant. Likewise, low voltages may occur when the PV power output is less than the PGcap. These events are very common for the distribution systems with variable renewable energy sources and load excursions. To imitate these events, power generated by the PVs is varied and the power-flow is simulated for all the high/low voltage scenarios. These sub-optimal power generations are represented by , where is a multiplier and it is varied between and , as shown in Figure 1. Training data points for low-voltage and high-voltage scenarios are obtained when is less than and greater than , respectively. The response of the controller in these sub-optimal power generation conditions is explained in Section 2.3.
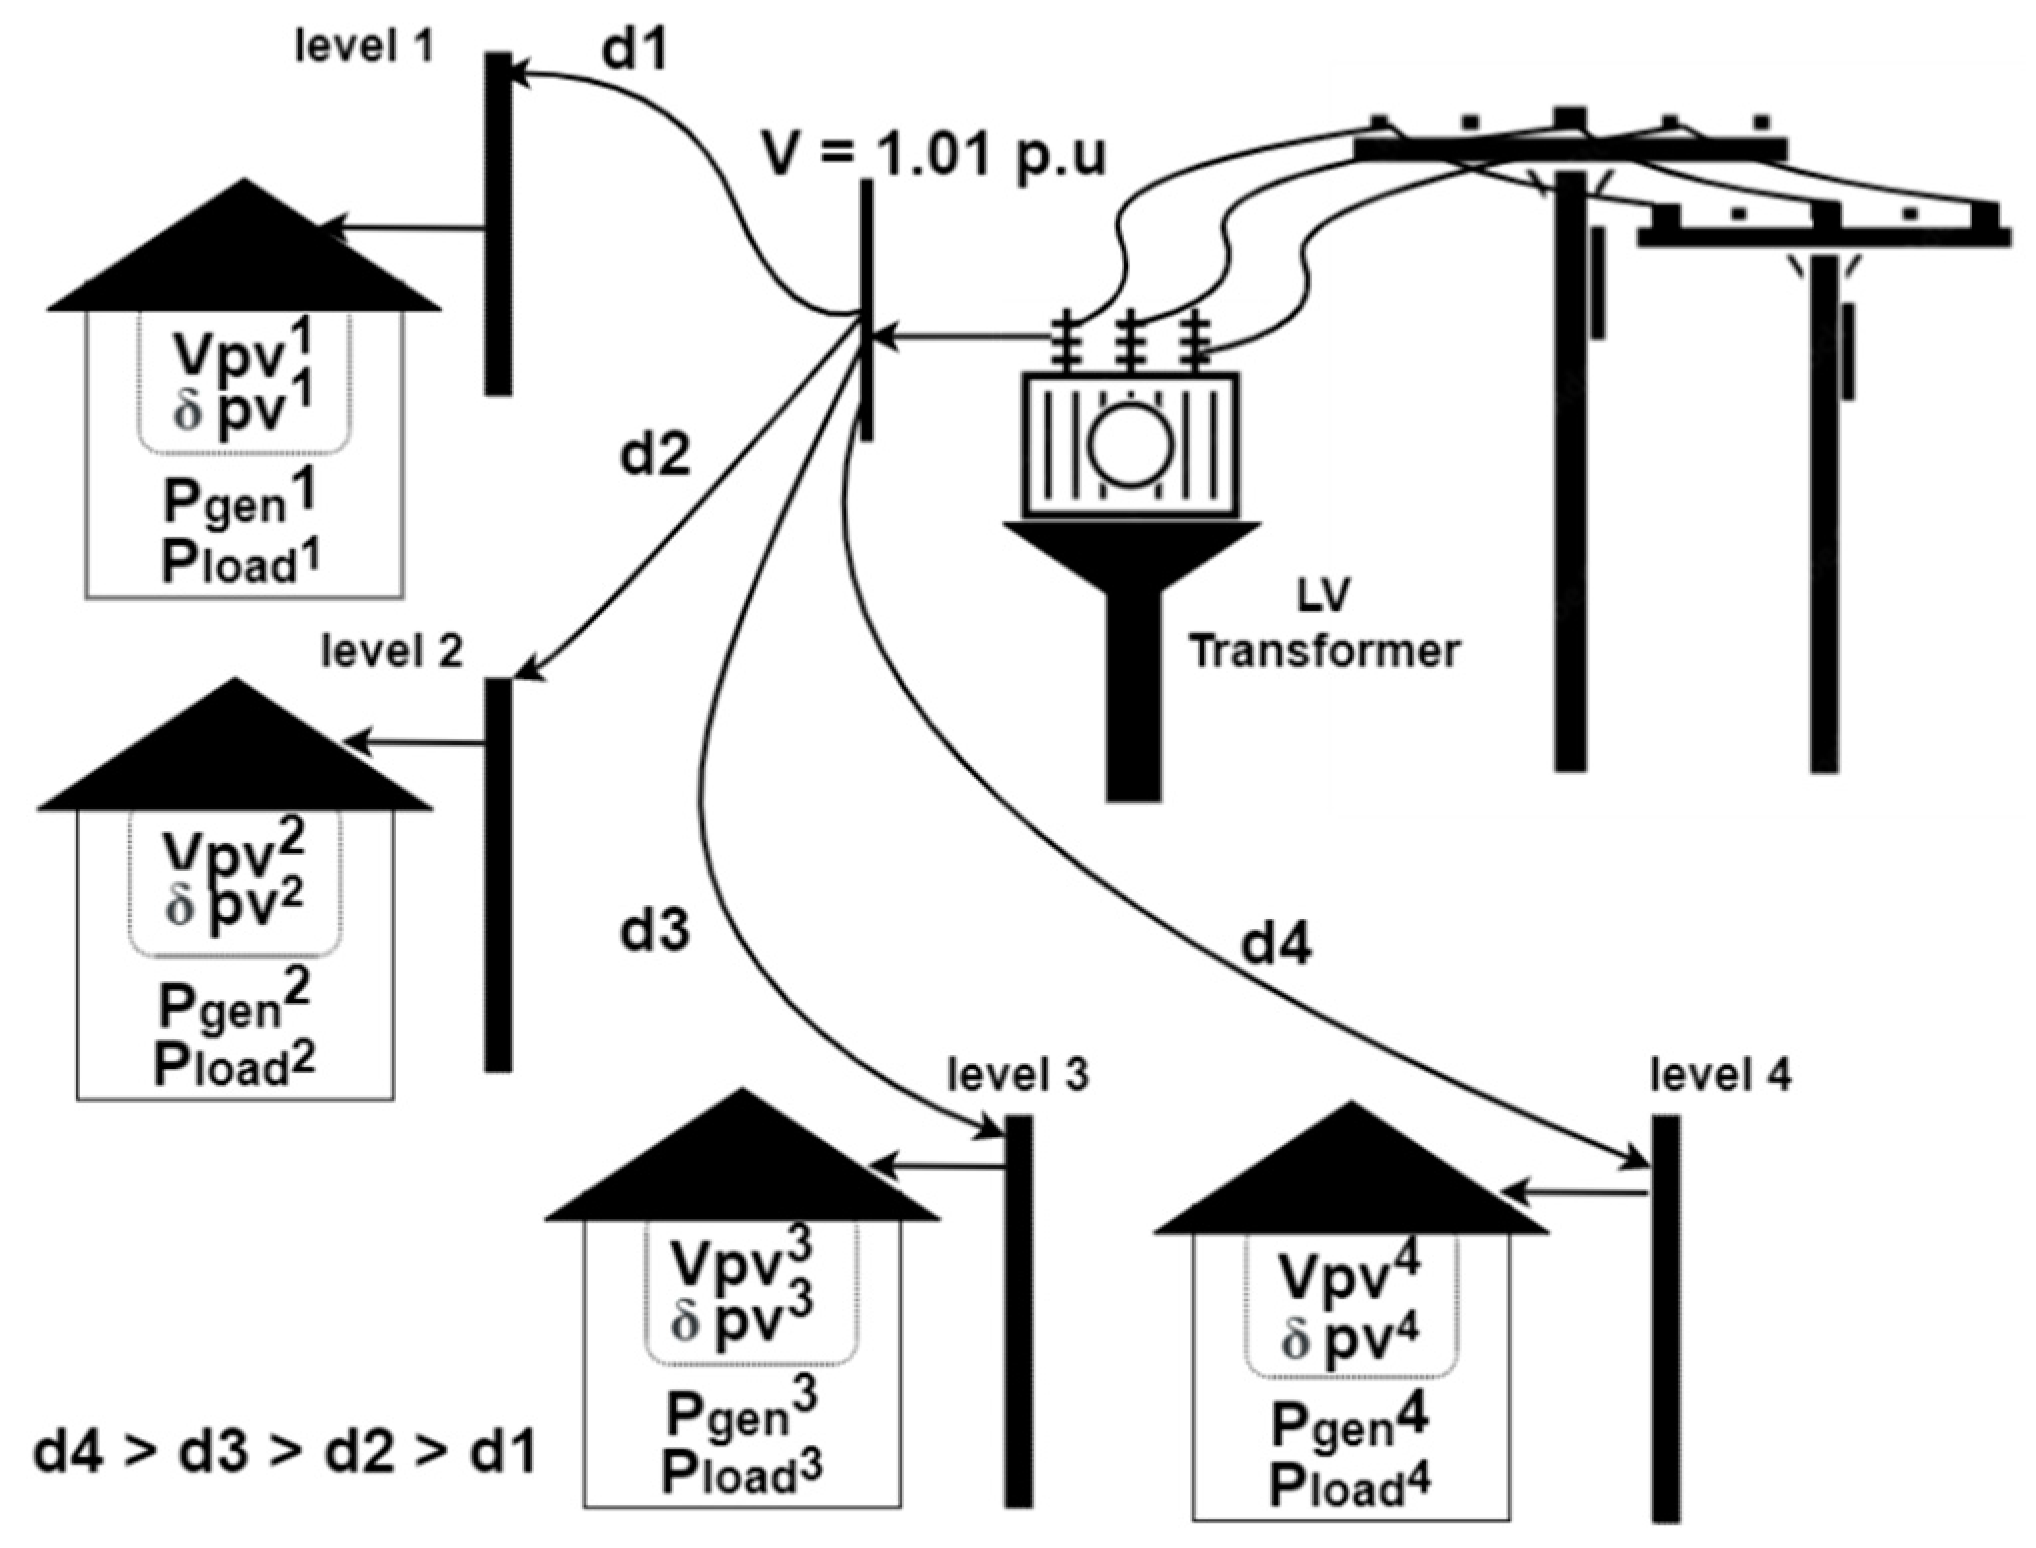
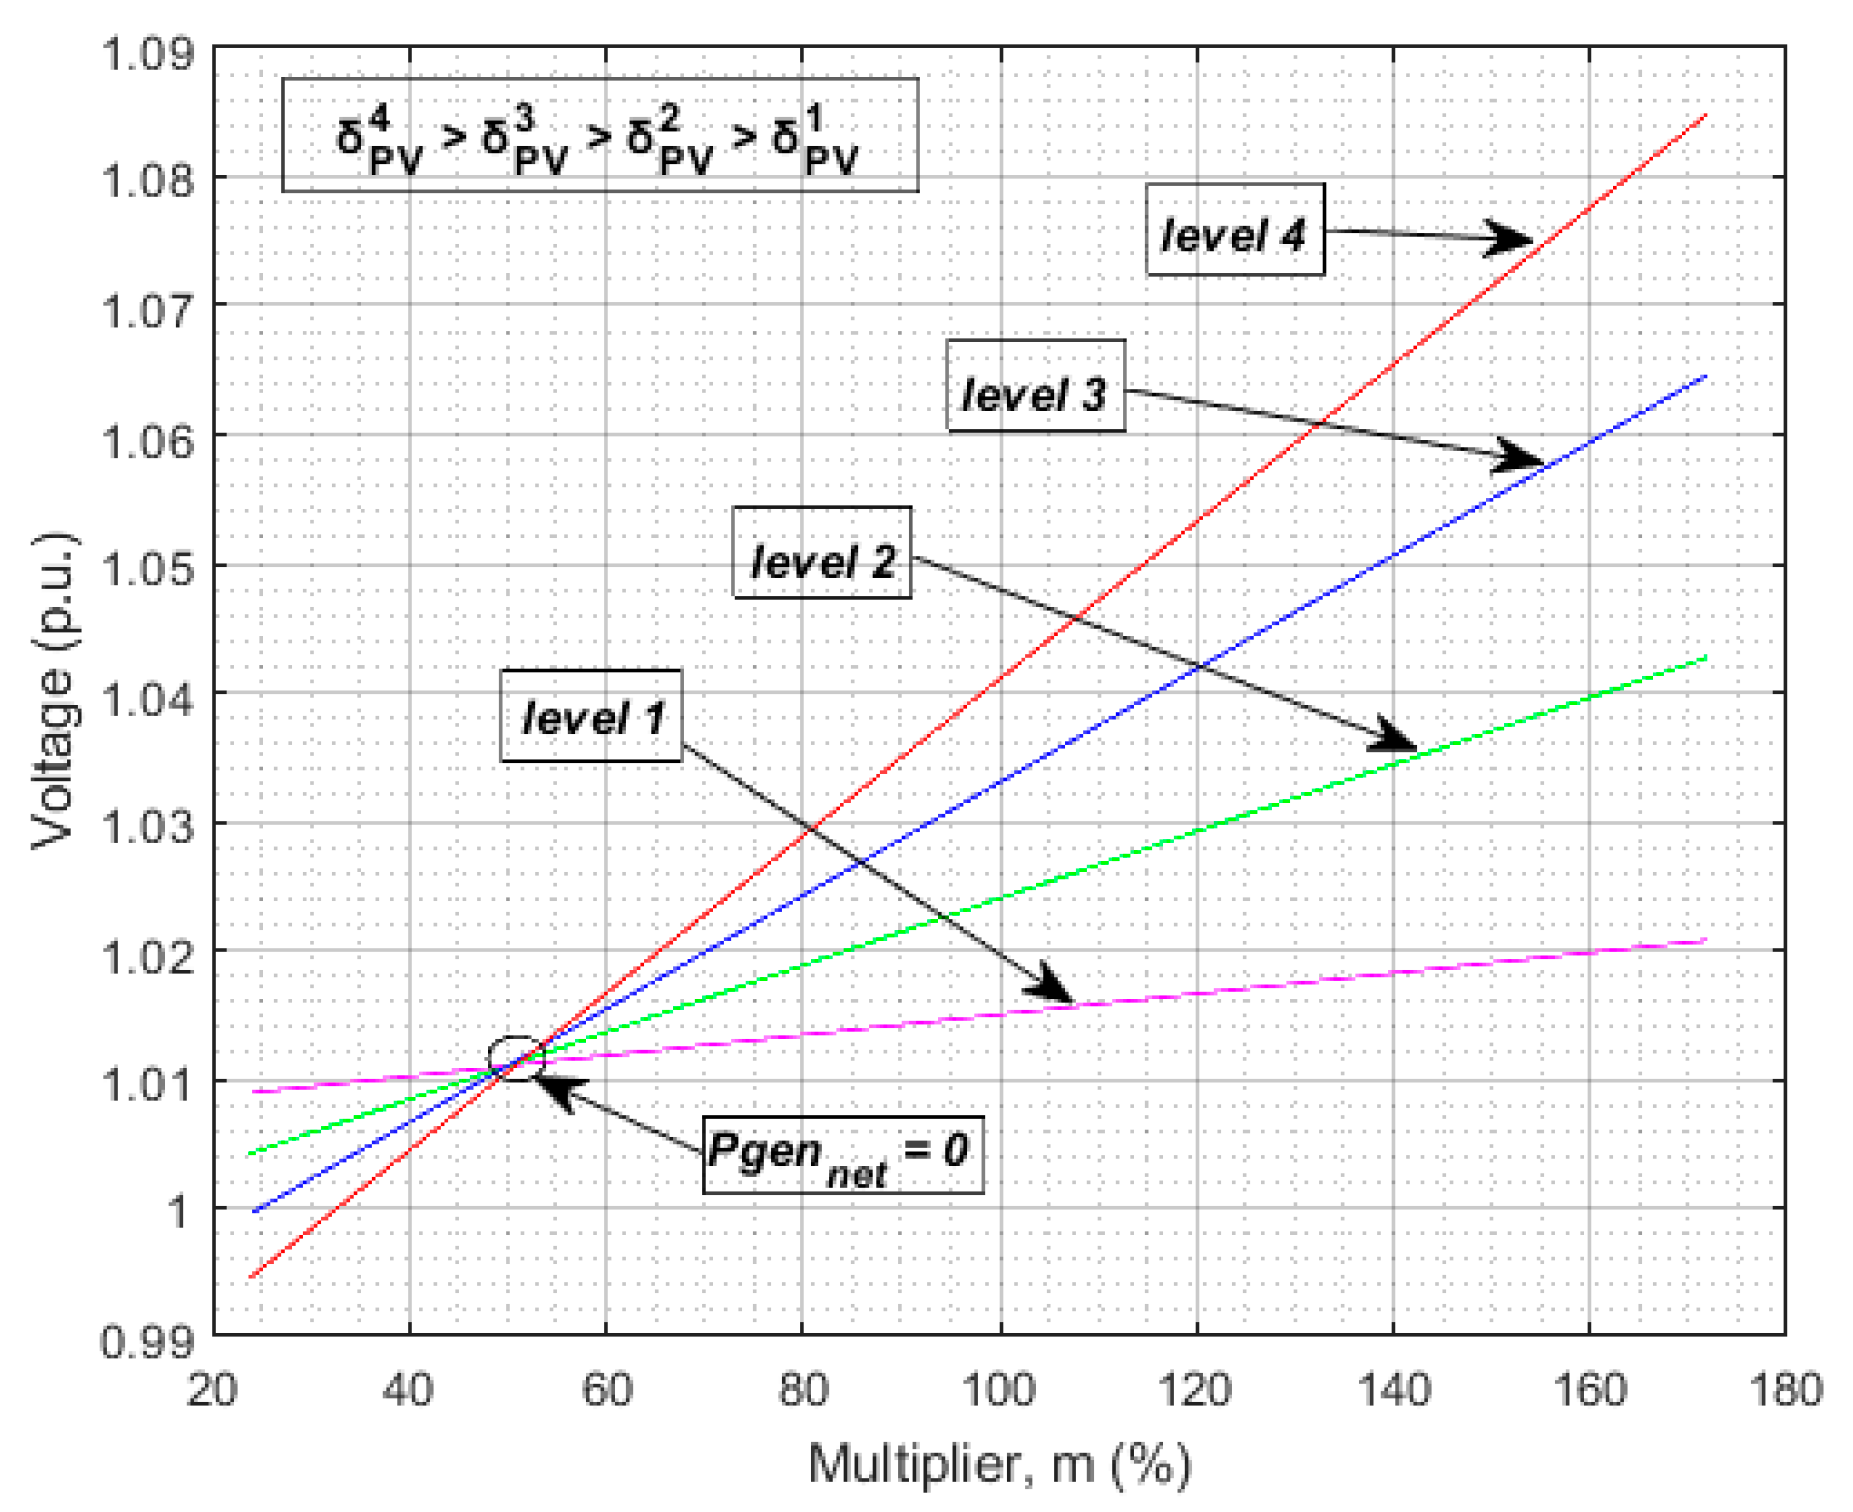
Voltages of the nodes in the distribution system change differently with the changes in power generations. For instance, consider the LV distribution system shown in Figure 3. Houses available at different levels are connected to the nearby LV transformer. Note that the transformer bus is regulated at the voltage of 1.01 p.u., as mentioned in Figure 3. In addition, note that the house at level 1 is less sensitive to the changes in load/generation as compared to the house at level 4. The voltages and sensitivities of these houses for different power generations , are shown in Figure 4. Note that the Figure 4 is plotted at a specific loading condition. It can be seen that the slope of the curve for level 4 house is steeper than the curve of the level 1 house. That means, the house at level 4 is more sensitive when compared to the level 1 house. Another important fact is that when the generation () becomes equal to the load (), the net power generation () becomes zero and the voltages of the nodes become the same as the voltage at the transformer bus ( p.u.). For a specific loading condition of this example system, becomes zero when as shown in Figure 4. It is important to note that this event can happen at different loading conditions for smaller/bigger distribution systems. It can also be observed from the Figure 4 that for the positive (i.e., to the right of the marked circle) the nodes with higher sensitivities have higher voltages than the other less sensitive nodes.
2.3. Training Controller Response
A neural network is a non-linear statistical model that endeavors to recognize underlying relationships in a set of data. It can represent the complex behaviors of natural or engineered processes. They can adapt to changing input; so, the network generates the best possible result without needing to redesign the output criteria. Hence, a fully connected multi-layer perceptron (MLP) neural network is used to design the control formula for the PV power output. This network is trained with the generated voltage regulation database to calculate the parameters associated with MLP neural network. The concept of transfer learning is employed for optimal training of the controller.
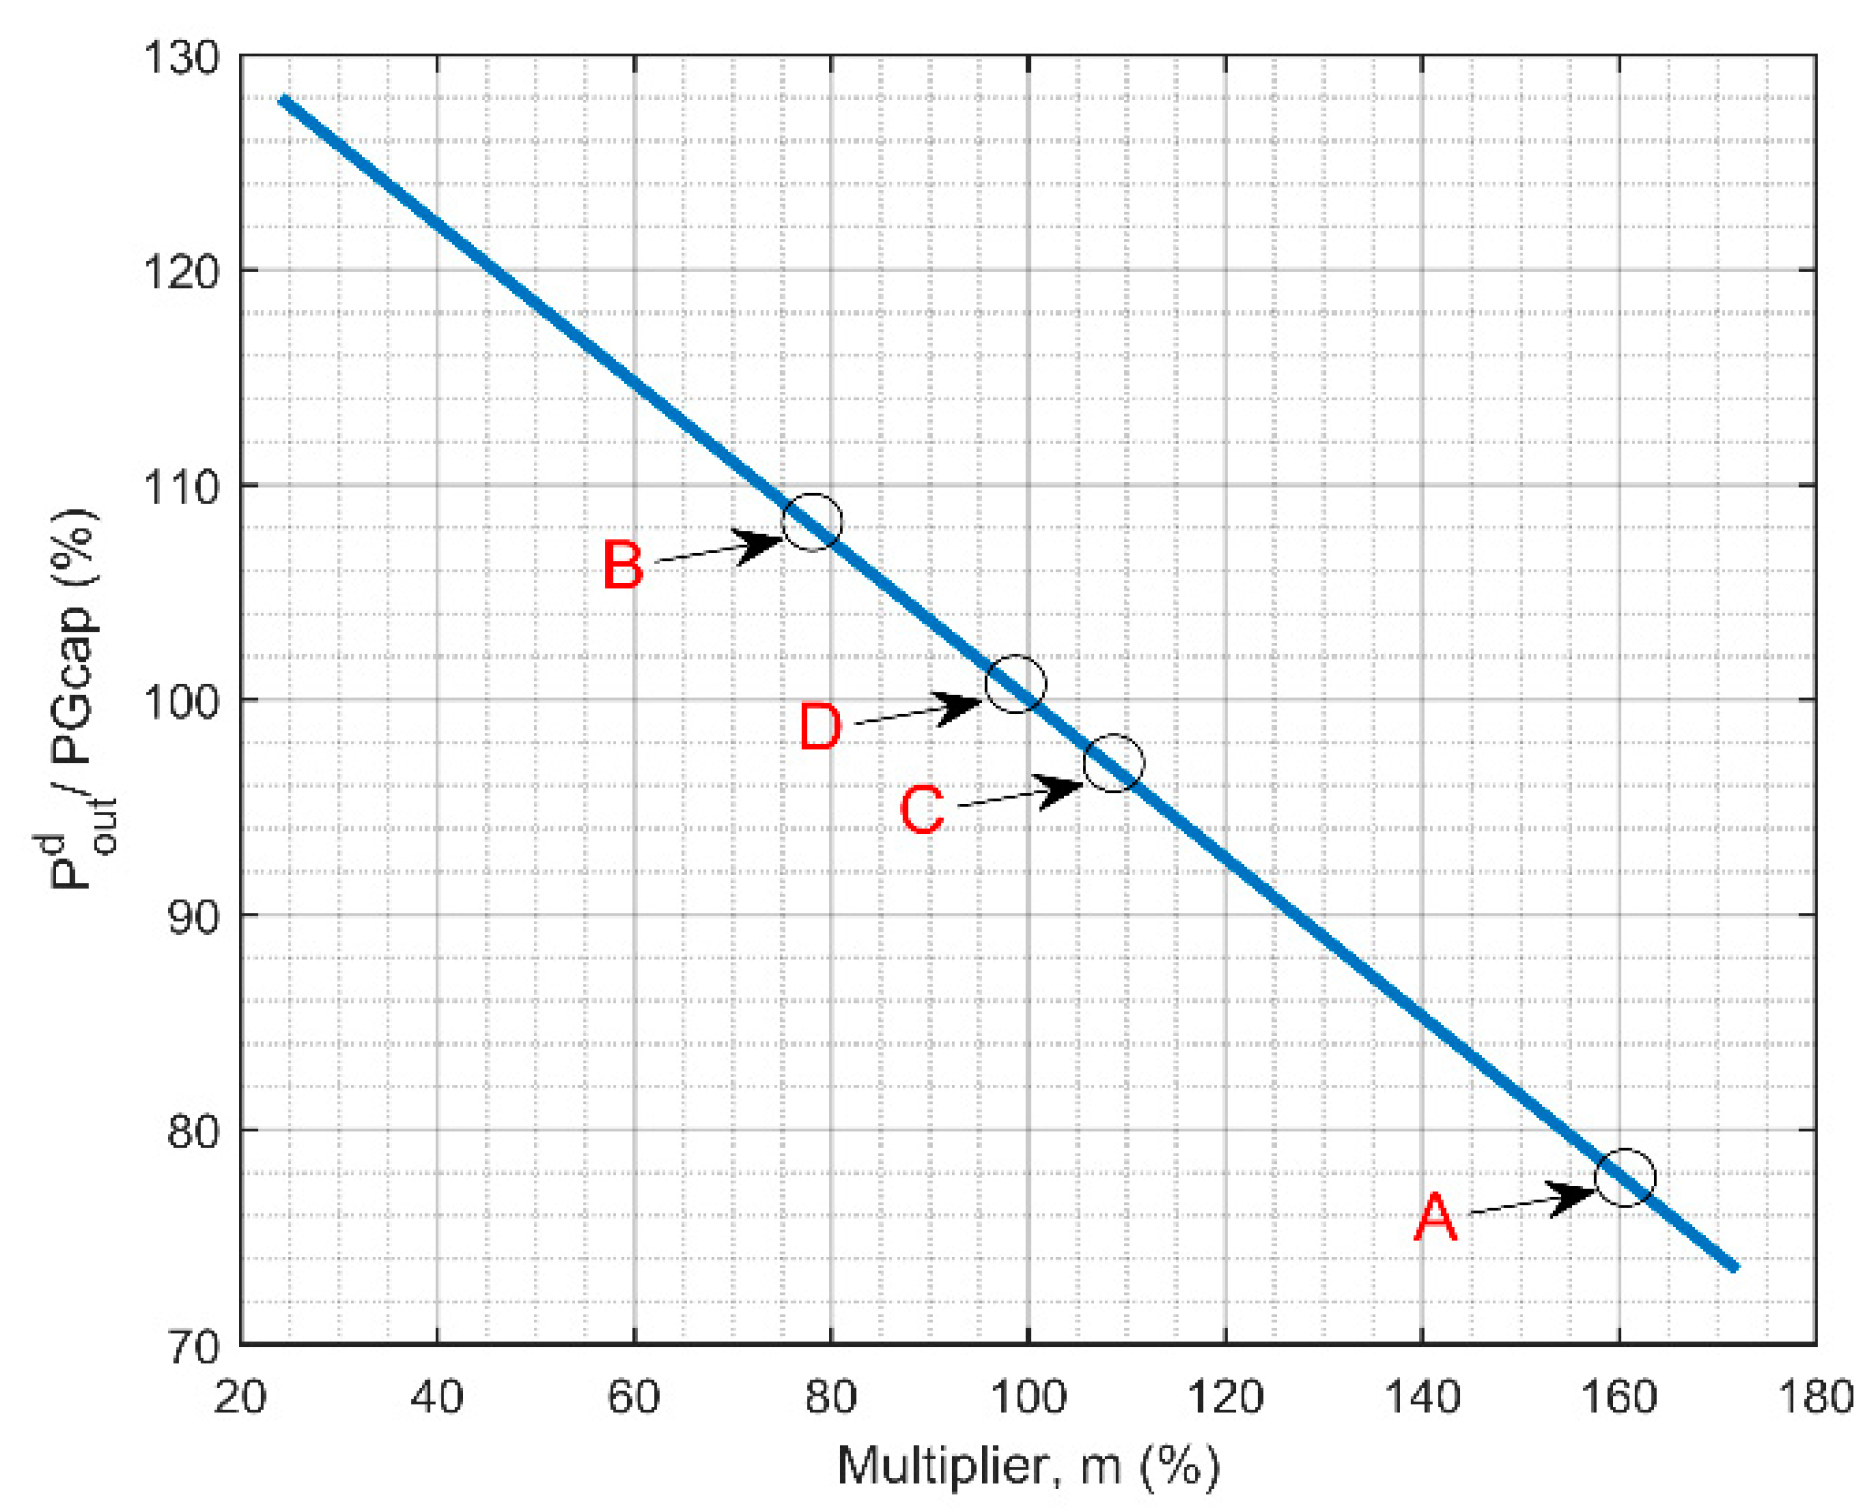
In this ML approach, the inputs are the nodal voltages (V) and their corresponding sensitivities (δ) and the output is the desired PV power generation (). Both the inputs V and δ, were obtained during the voltage regulation database generation. By design, the database included the input points which represent the over/under power generation () instances. Now, to secure the stability of the system in these extreme scenarios, the desired outputs of the controller () must improve the voltages in steps. For instance, if the voltages are high then the controller is expected to reduce the power generation. Similarly, for lower voltages the power generation needs to be increased. The relationship between and is calculated using (1).
where
is the desired power output, is the power generation cap, m is the multiplier and is the gradient of the controller response. Note that when the multiplier is 1, the becomes equal to . However, when the multiplier is not equal to 1, then is adjusted accordingly to improve the system voltages.
As mentioned earlier, the output of PVs may vary since they are highly variable. Moreover, the output of neural network-based controller may vary a bit from the desired power output depending on the input data. Hence, the data points must be generated in such a way that the desired controller response is achieved. Note that is the parameter that defines the behaviour of the controller response. It is important to understand that if the value of is close to 0, then the controller output would not change significantly during the extreme voltage conditions. In other words, the controller response would be highly conservative. On the other hand, if the value of is close to 1, then the controller output would quickly respond to the changes in the load/generation but may oscillate between the extreme voltage conditions. Therefore, the best controller response would be achieved when the value of is between 0 and 1. In this work, the best controller response is achieved when the is set to 0.37. However, it may vary depending on the controller requirements.
Let us demonstrate the controller behaviour as described in (1). Figure 5 shows the relationship between and (as defined in Equation (1)), with . For example, if the multiplier is 160% (i.e., point A in Figure 5), then the voltage reaches to 1.078 p.u. at the downstream bus (i.e., level 4 house) as shown in Figure 4. Since the voltage violation is severe, the controller would reduce the power output to 78%. Correspondingly, the controller will move to the point B (see Figure 5) and the voltage would become 1.028 p.u. (see Figure 4). At the subsequent instants, the controller will move to 108% (i.e., point C in Figure 5). Eventually, the controller response will reach to PGcap (point D) and regulate the system voltages within the allowed limits. It is important to note that the controller will mostly operate in the normal range, that means, the data points generated for the low/high voltages will be only followed during these extreme events.
2.4. Neural Network Structure
In this control strategy only two inputs are used, namely, voltage and the nodal sensitivity. Therefore, a small ANN structure is sufficient to be used for effective PV power control. Figure 1 shows the general overview of the proposed control structure. The purpose of the controller is to predict the PV power output depending on the inputs.
Note that the activation function of the output layer is linear, as provided in (2). However, the sigmoid activation function, given in (3), is used in the input layer. The associated weights and biases are represented by and , respectively. Moreover, N represents the total number of neurons in the hidden layer.
The network is obtained through training by using the Levenberg-Marquardt algorithm. The training of neural network means adjusting the weights of layers and biases to get the target values. During the training process, weights and biases are adjusted and the target values are tracked continuously until the squared error between the actual and the desired outputs is minimized. The performance function of ANN is the mean squared error (MSE), as described in (4).
Neural networks have the ability to adapt to the distribution function and this makes them more likely to find the non-linear relationships between the input measurements and the output. Nevertheless, this ability to adapt may result in the neural network that largely overfits the training data, producing the effect called ‘overfitting’ [28]. To avoid this, a split of the data must be carried out between the training model and the test model (e.g., 80%–20%), with the aim of obtaining low MSE on the test data. In this work, 80% of the data is used to train the controller while the controller is tested on the rest of the 20% data.
3. Test System
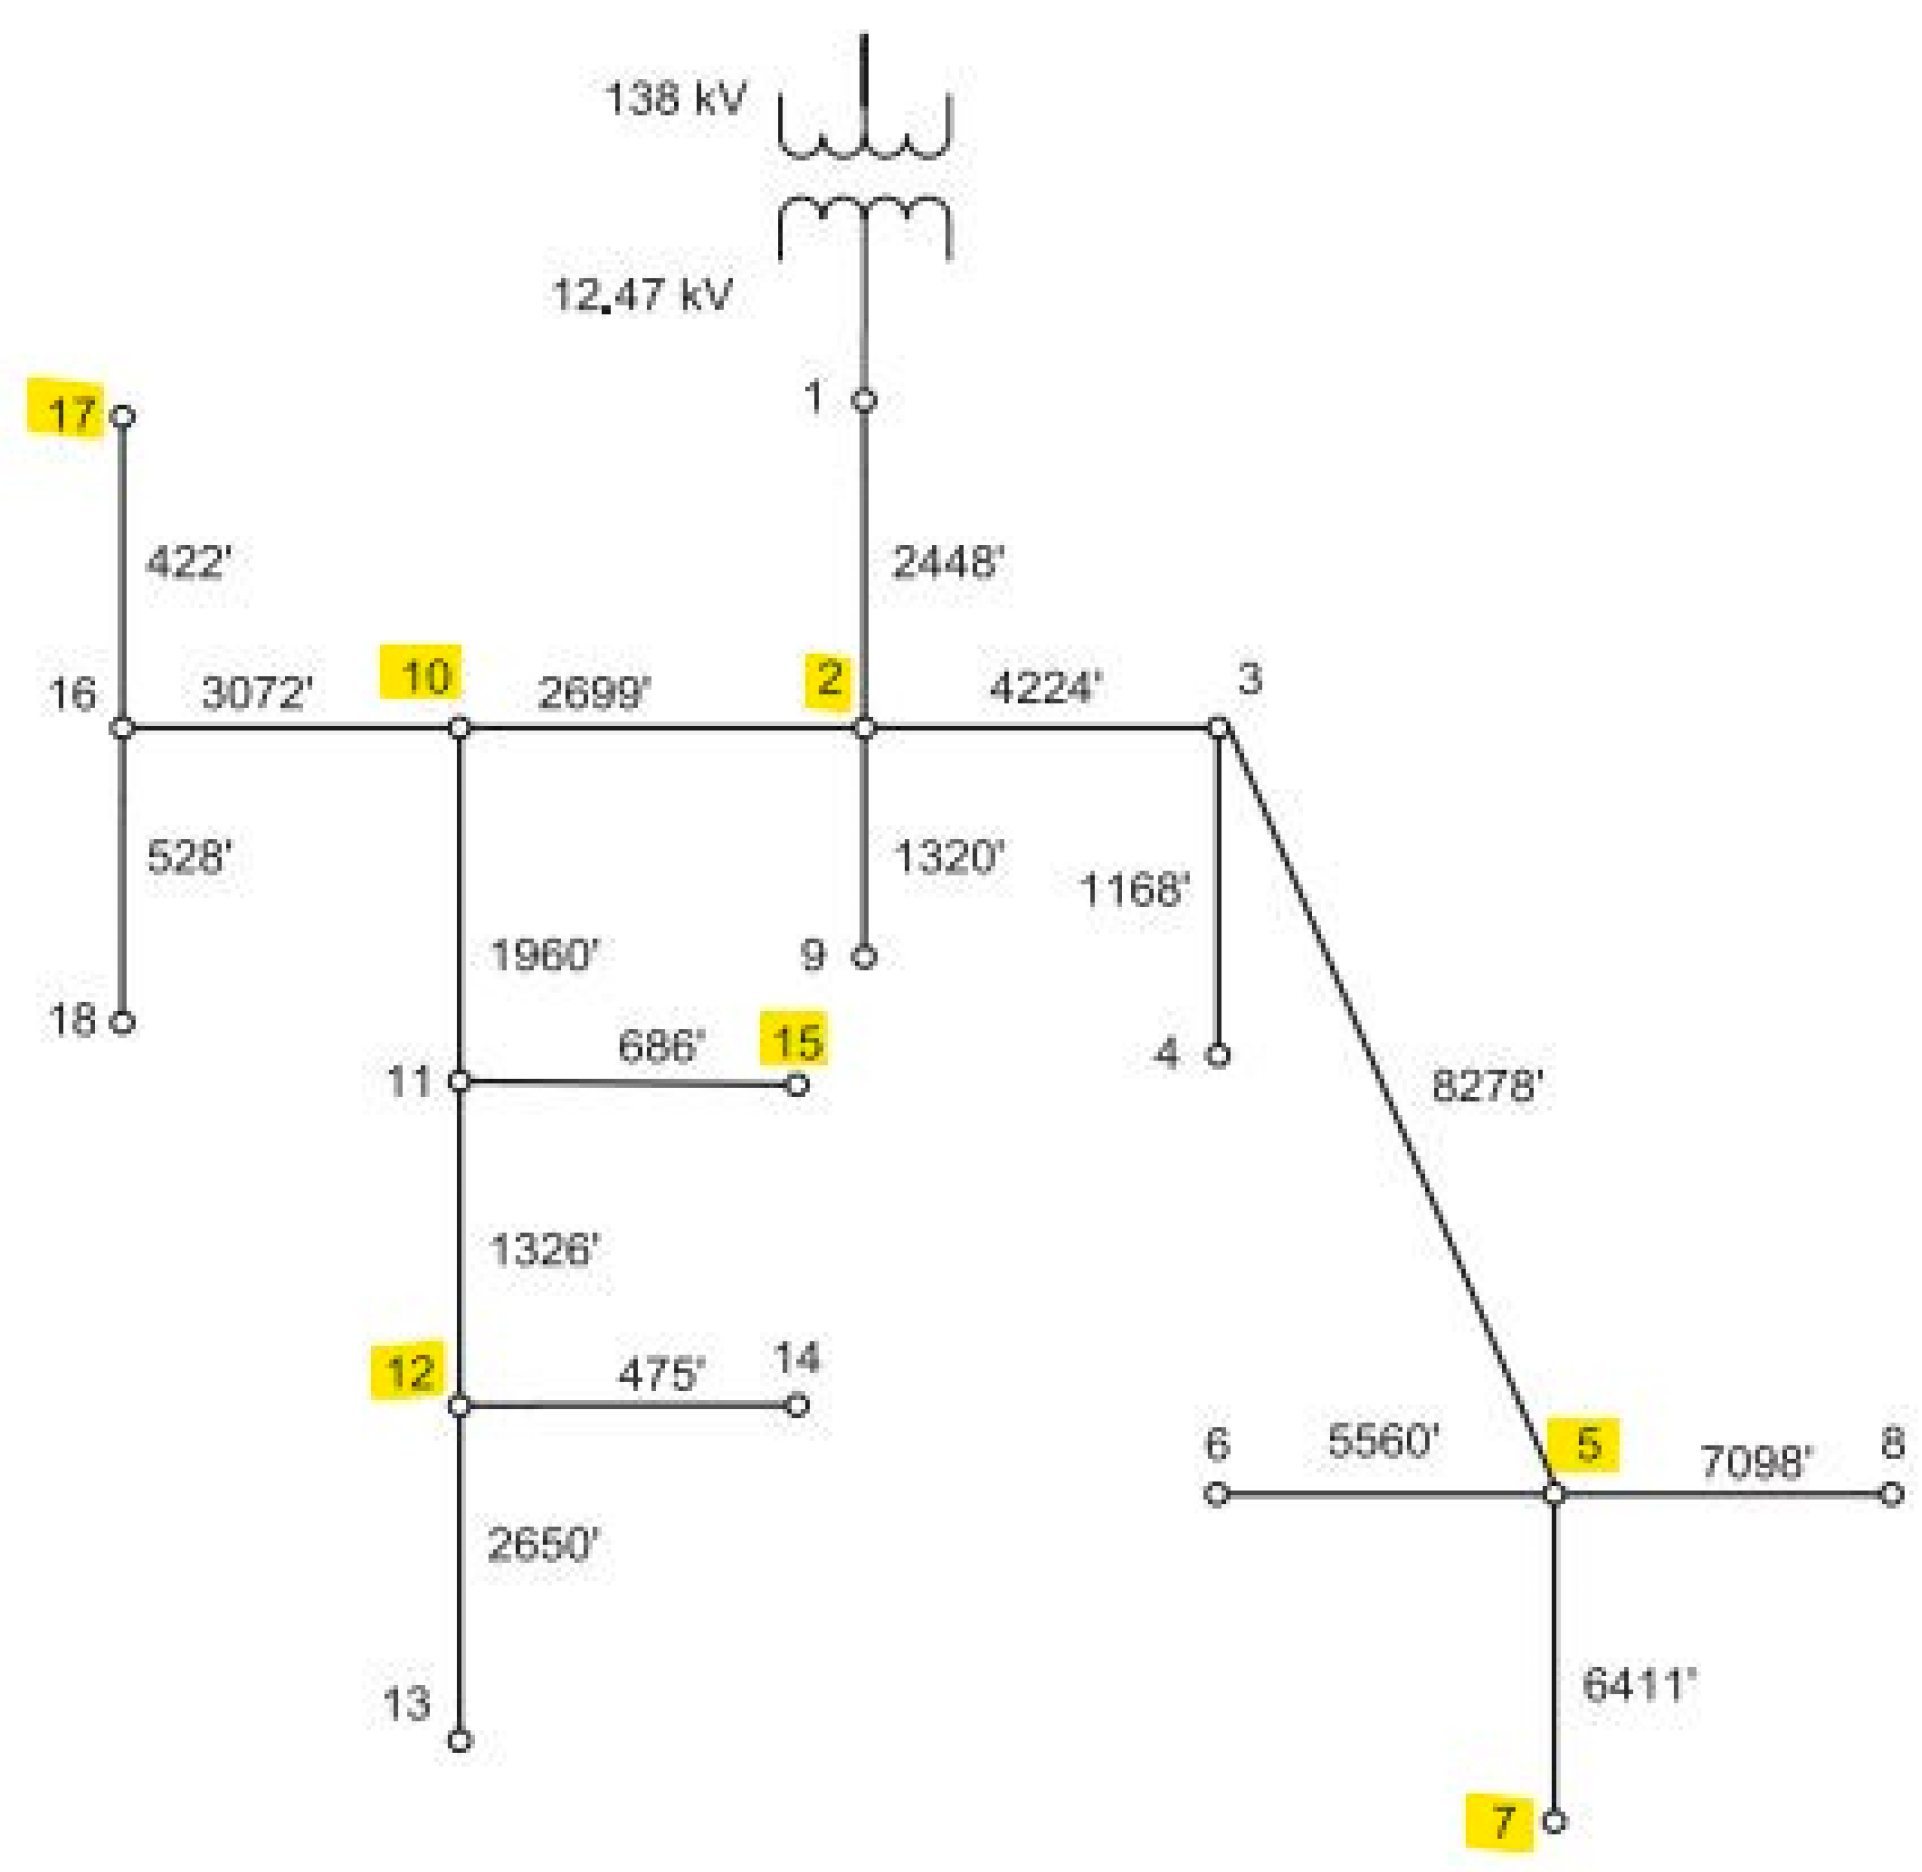
The distribution network used to test the effectiveness of the proposed PV controller is shown in Figure 6 [20,29]. This is a balanced three-phase medium voltage (MV) system with 17 primary nodes. Where each node is connected to a low voltage (LV) radial distribution system. The accumulated load and rated PV capacity at each of these LV systems is kW and kW, respectively. The system parameters of the primary and secondary nodes are provided in Table 1.
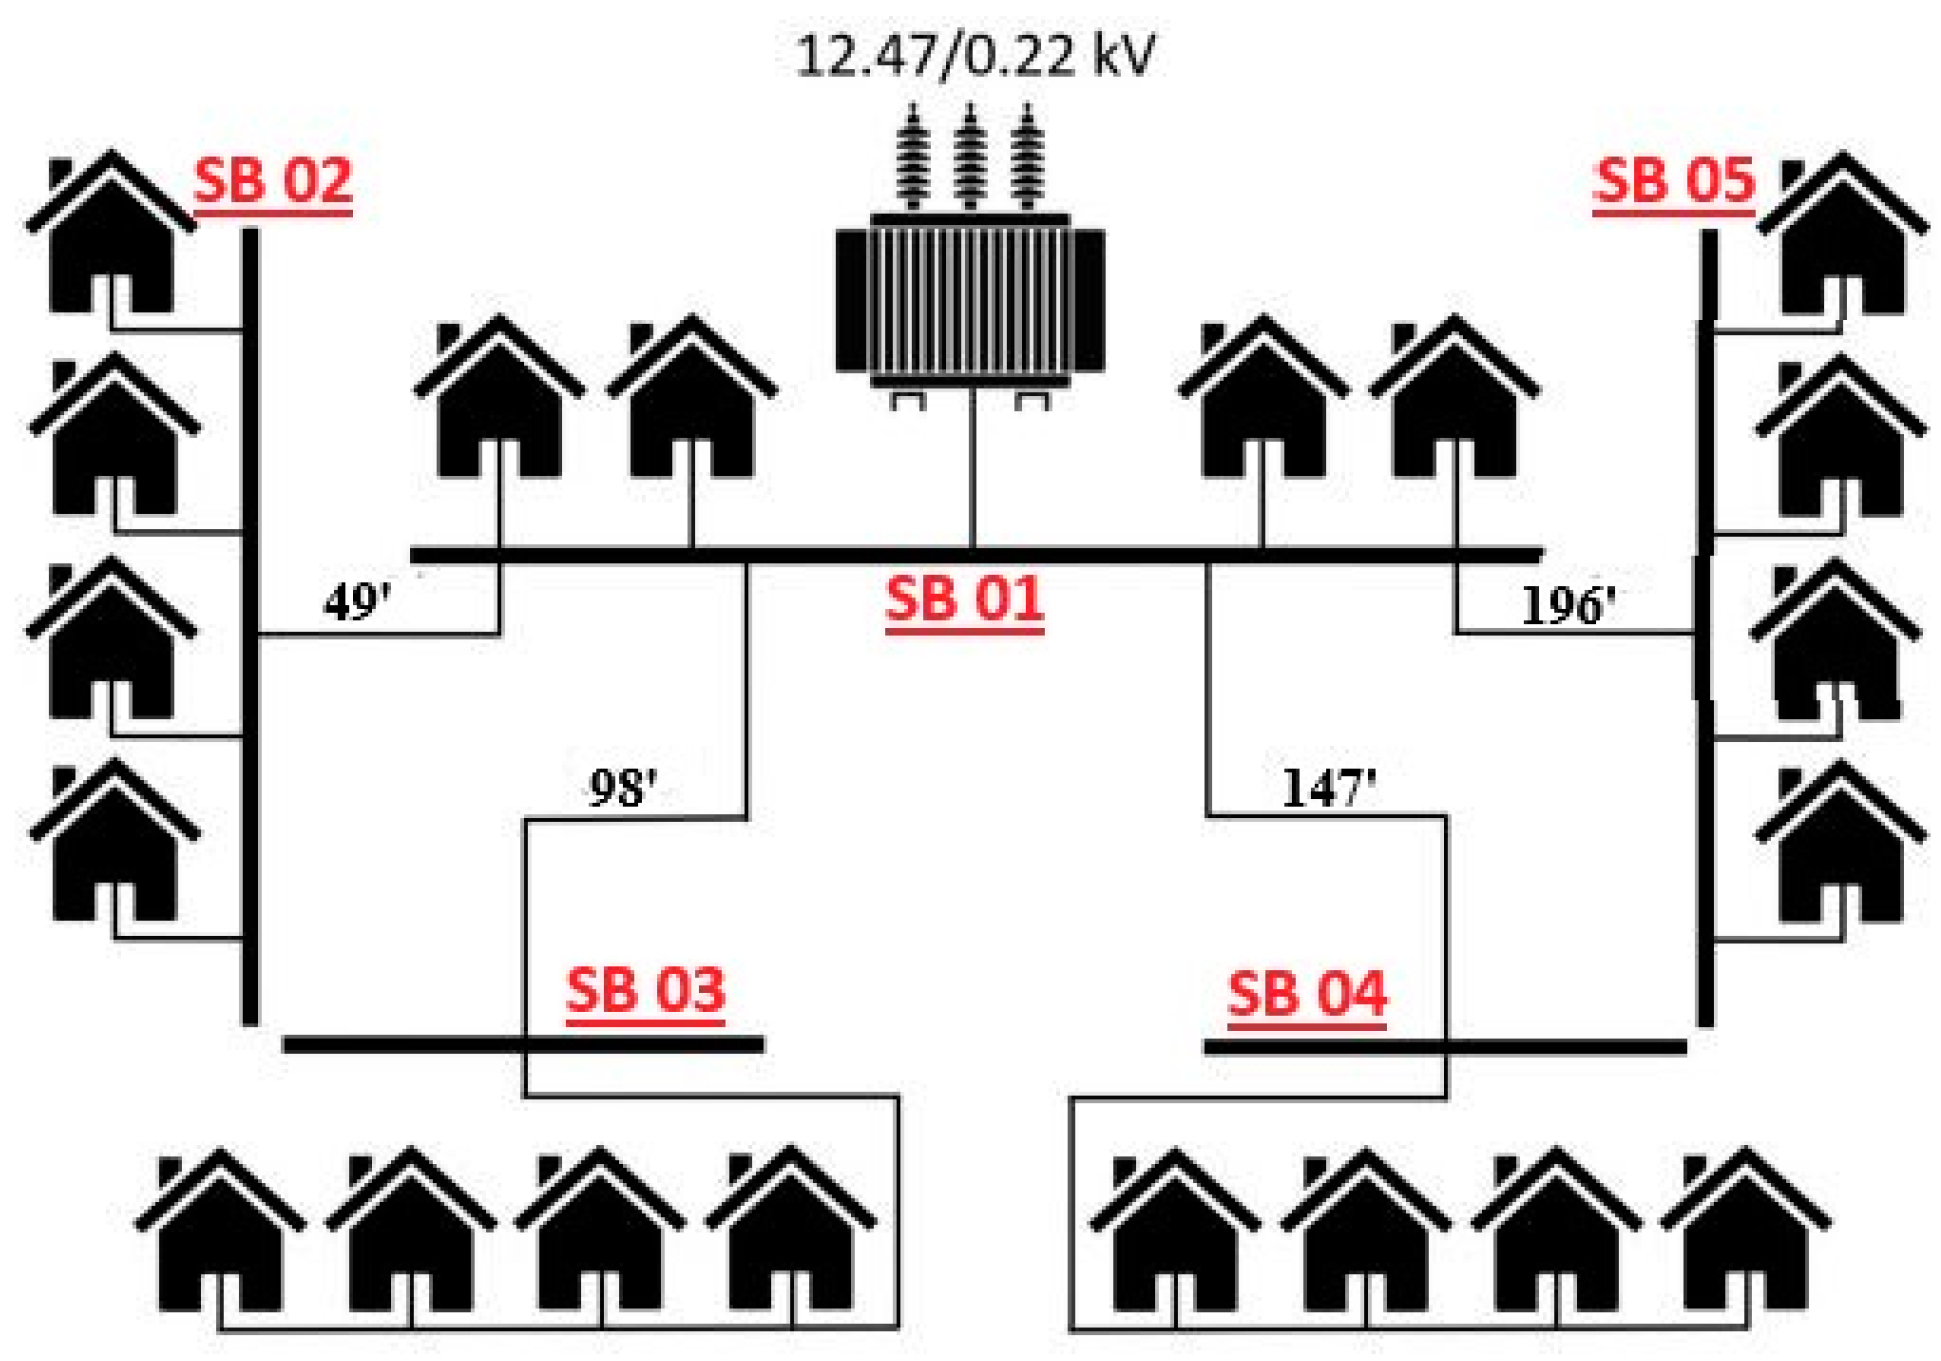
Primary nodes have a three-phase 12.47/0.22 kV secondary distribution transformer. Each transformer feeds 20 houses at each phase through five laterals, as shown in Figure 7. The PVs are installed on four buses in the secondary systems, which are labelled as SB 02, SB 03, SB 04 and SB 05 (see Figure 7). Note that the secondary systems connected to the highlighted primary nodes in Figure 6 have solar PVs installed.
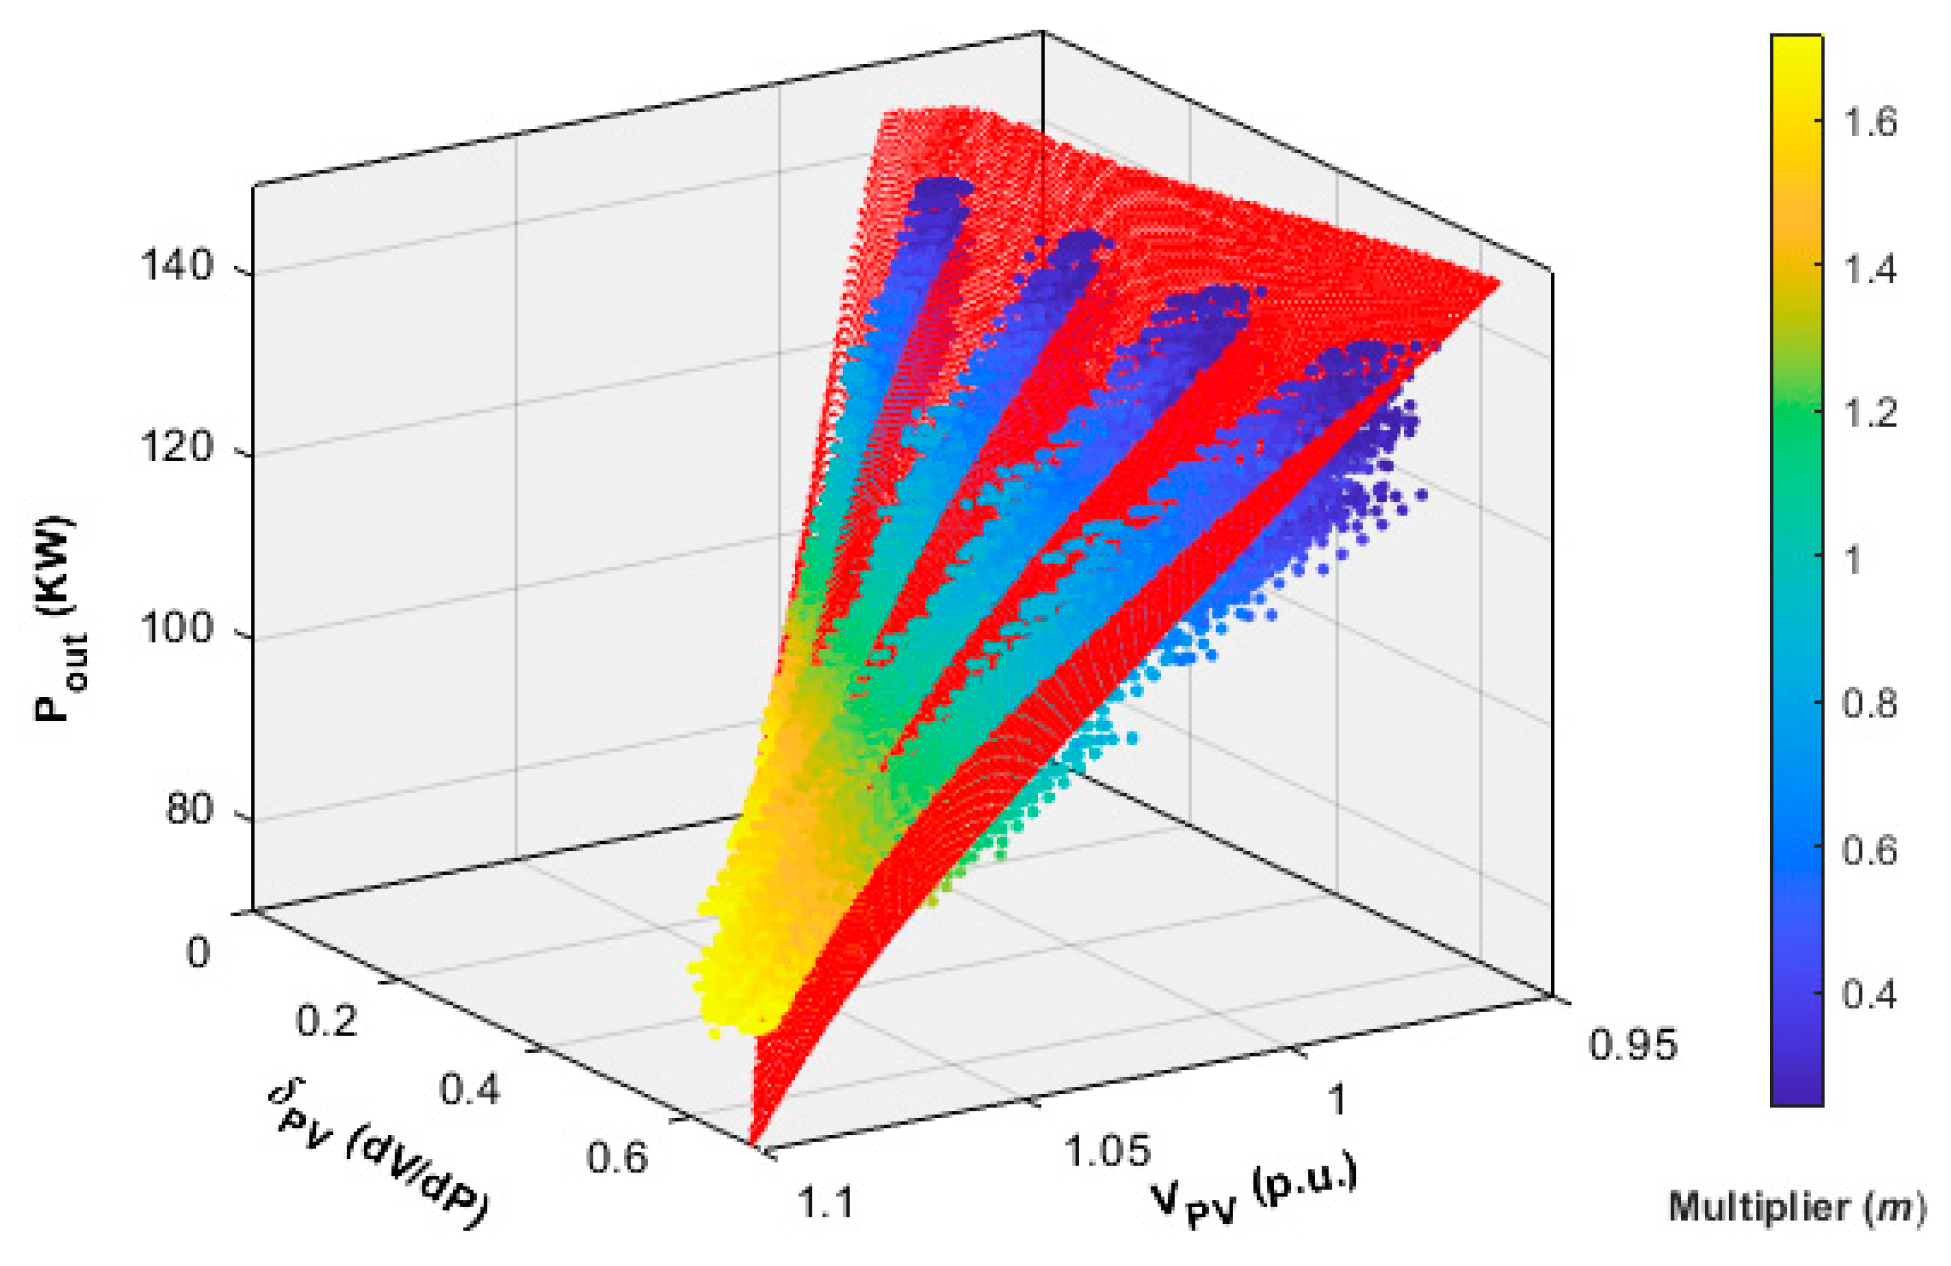
The communication-free PV controller is installed with each rooftop PV. The voltage regulation database (explained in Section 2.2) is used to train the controller to their respective output values determined by Equation (1) as mentioned in Section 2.3. Since there are only two inputs and one output, a small ANN with 5 hidden neurons is chosen. This network is trained using “nntool” in MATLAB. The network is obtained through training by using the Levenberg–Marquardt algorithm. In this control strategy, the controller is trained in such a way that it can be installed at any location in the distribution system. The relationship between inputs and the output is shown in Figure 8. It can be observed that there are four different groups of data points. These groups correspond to the different levels of houses in the secondary distribution system. The red plane shown in Figure 8 shows the response of the neural network controller.
4. Results and Discussion
The purpose of the proposed controller is to modulate the power injected by the rooftop solar PVs connected in the distribution system. These controllers are expected to regulate the system voltages within an acceptable range, defined by the ANSI C84.1-2016 standard. Additionally, fairness among the distributed PVs is also an important requisite for customer satisfaction. The machine learning-based PV controller presented in this article is designed to work in the absence of any communication linkages between the controllers. The trained network only uses the local voltage measurements and the sensitivity estimations as inputs (see Algorithm 1).
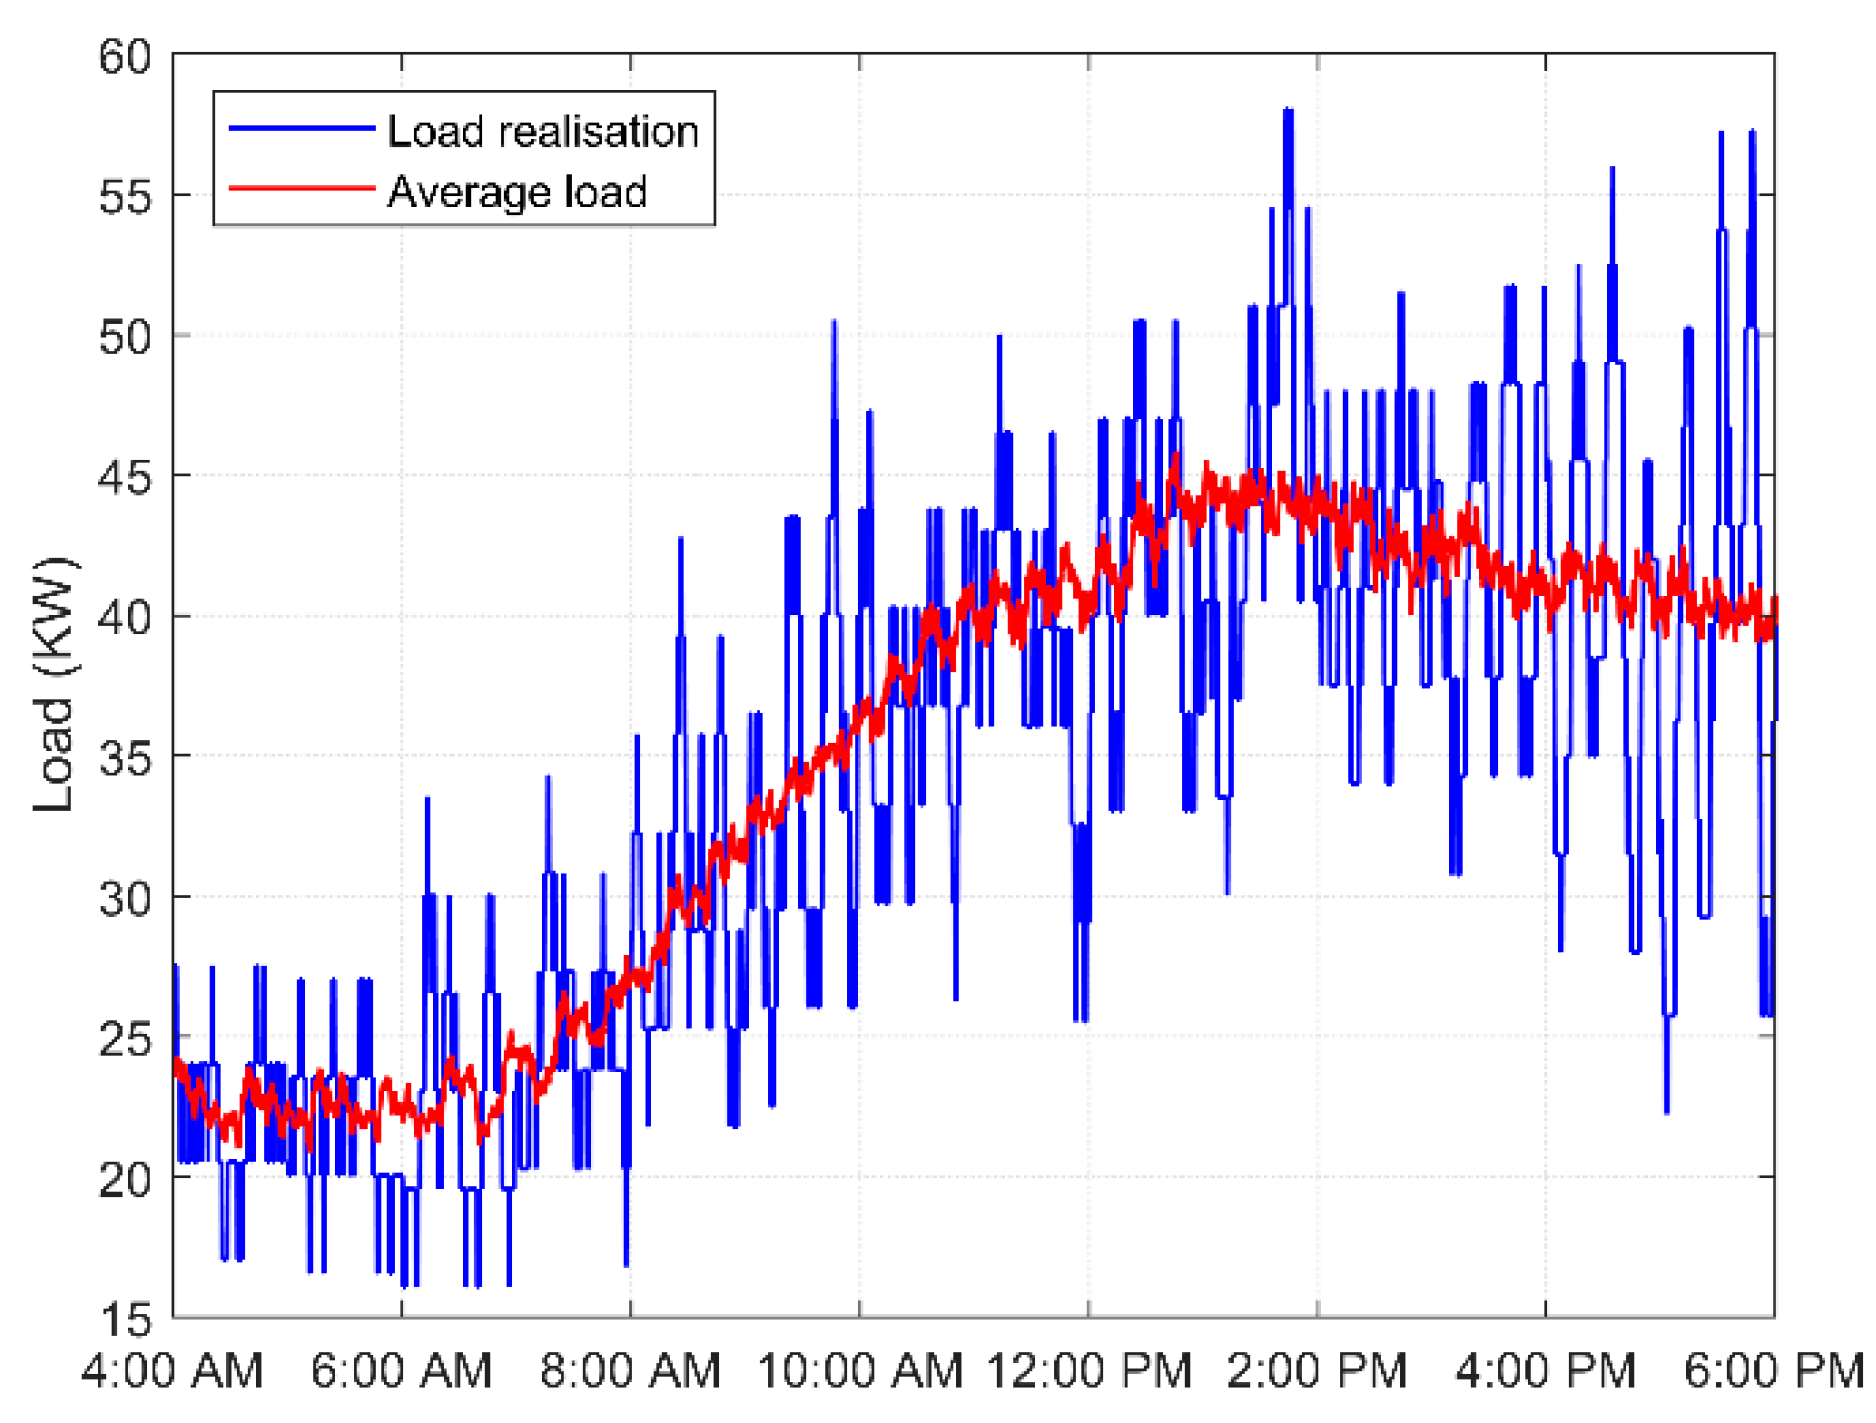
The test distribution system under consideration has loads on all the secondary buses. A typical load profile and the average load profile of these loads are depicted in Figure 9 for illustrative purposes. It can be noticed that the load is highly variable, this is due to the on/off actions of various household appliances. These high load variations in each LV node of the system will make the voltage regulation problem more challenging and, hence, test the controller’s effectiveness in the abnormal or extreme conditions.
The voltage regulation performances of different communication-free PV controllers are compared and they are arranged in increasing order of their benefits. These control schemes include, opportunistic maximum power point tracking controller, droop-based and voltage-based on-off controllers and lastly the proposed PV controller. Note that, considering space limitations, results are presented for some specific nodes. To present node-specific results, two extreme nodes, i.e., Node-10 (upstream) and Node-7 (downstream), are selected since they can provide sufficient performance details.
4.1. Conventional System (i.e., without PVs)
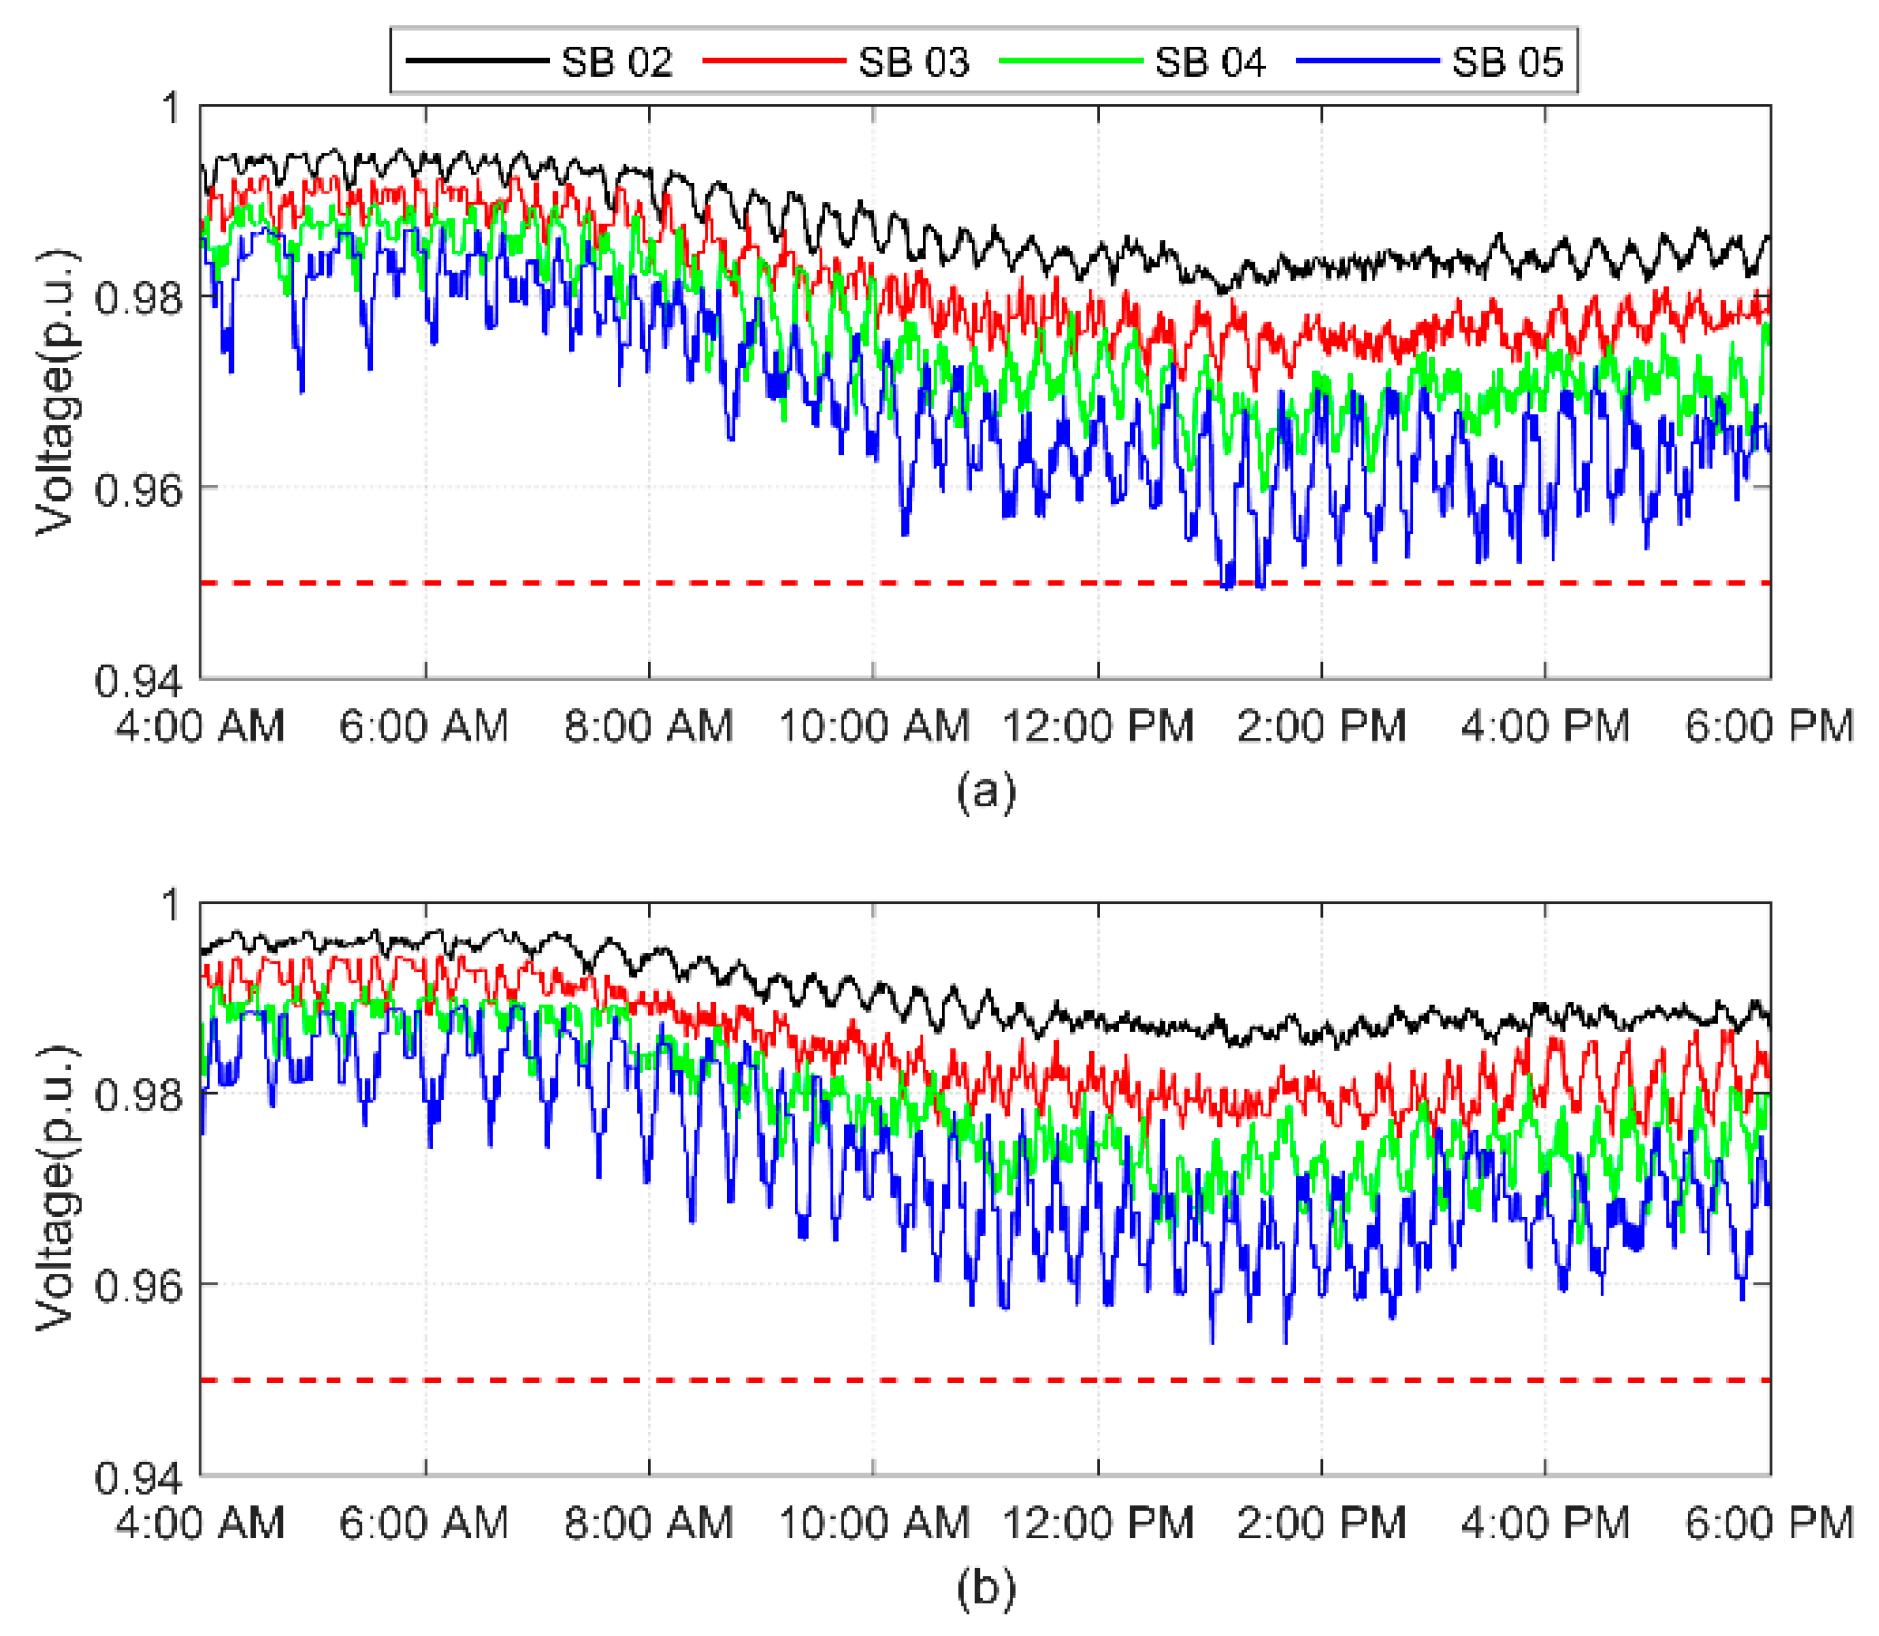
In order to showcase the impact of increasing the solar power penetration in the present electric power infrastructure, for comparison the test system without PVs is shown. For this case, bus voltages of the secondary system connected to Node-7 and Node-10 are shown in Figure 10.
It is clearly visible that there is not much of a difference between the voltage profiles of the upstream and downstream MV nodes. The voltages of the downstream LV system (Figure 10a) are only slightly lower than that of the upstream LV system (Figure 10b). However, there is a significant voltage difference between the upstream and downstream LV busses. Voltage of the upstream bus (i.e., SB 02) is close to 1 p.u. while the voltage at the most downstream bus (i.e., SB 05) is much lower yet within the allowable voltage range as defined by the ANSI C84.1-2016 standard. A bus connected closer to the MV/LV transformer (i.e., strong/upstream bus) is less sensitive to change in load than that connected farther from the transformer (i.e., weak/downstream node). That is why, SB 05 has the highest voltage variations. This elucidates the importance of voltage regulation for the power sources connected to the LV busses.
4.2. Base Case (i.e., PVs without Any Controller)
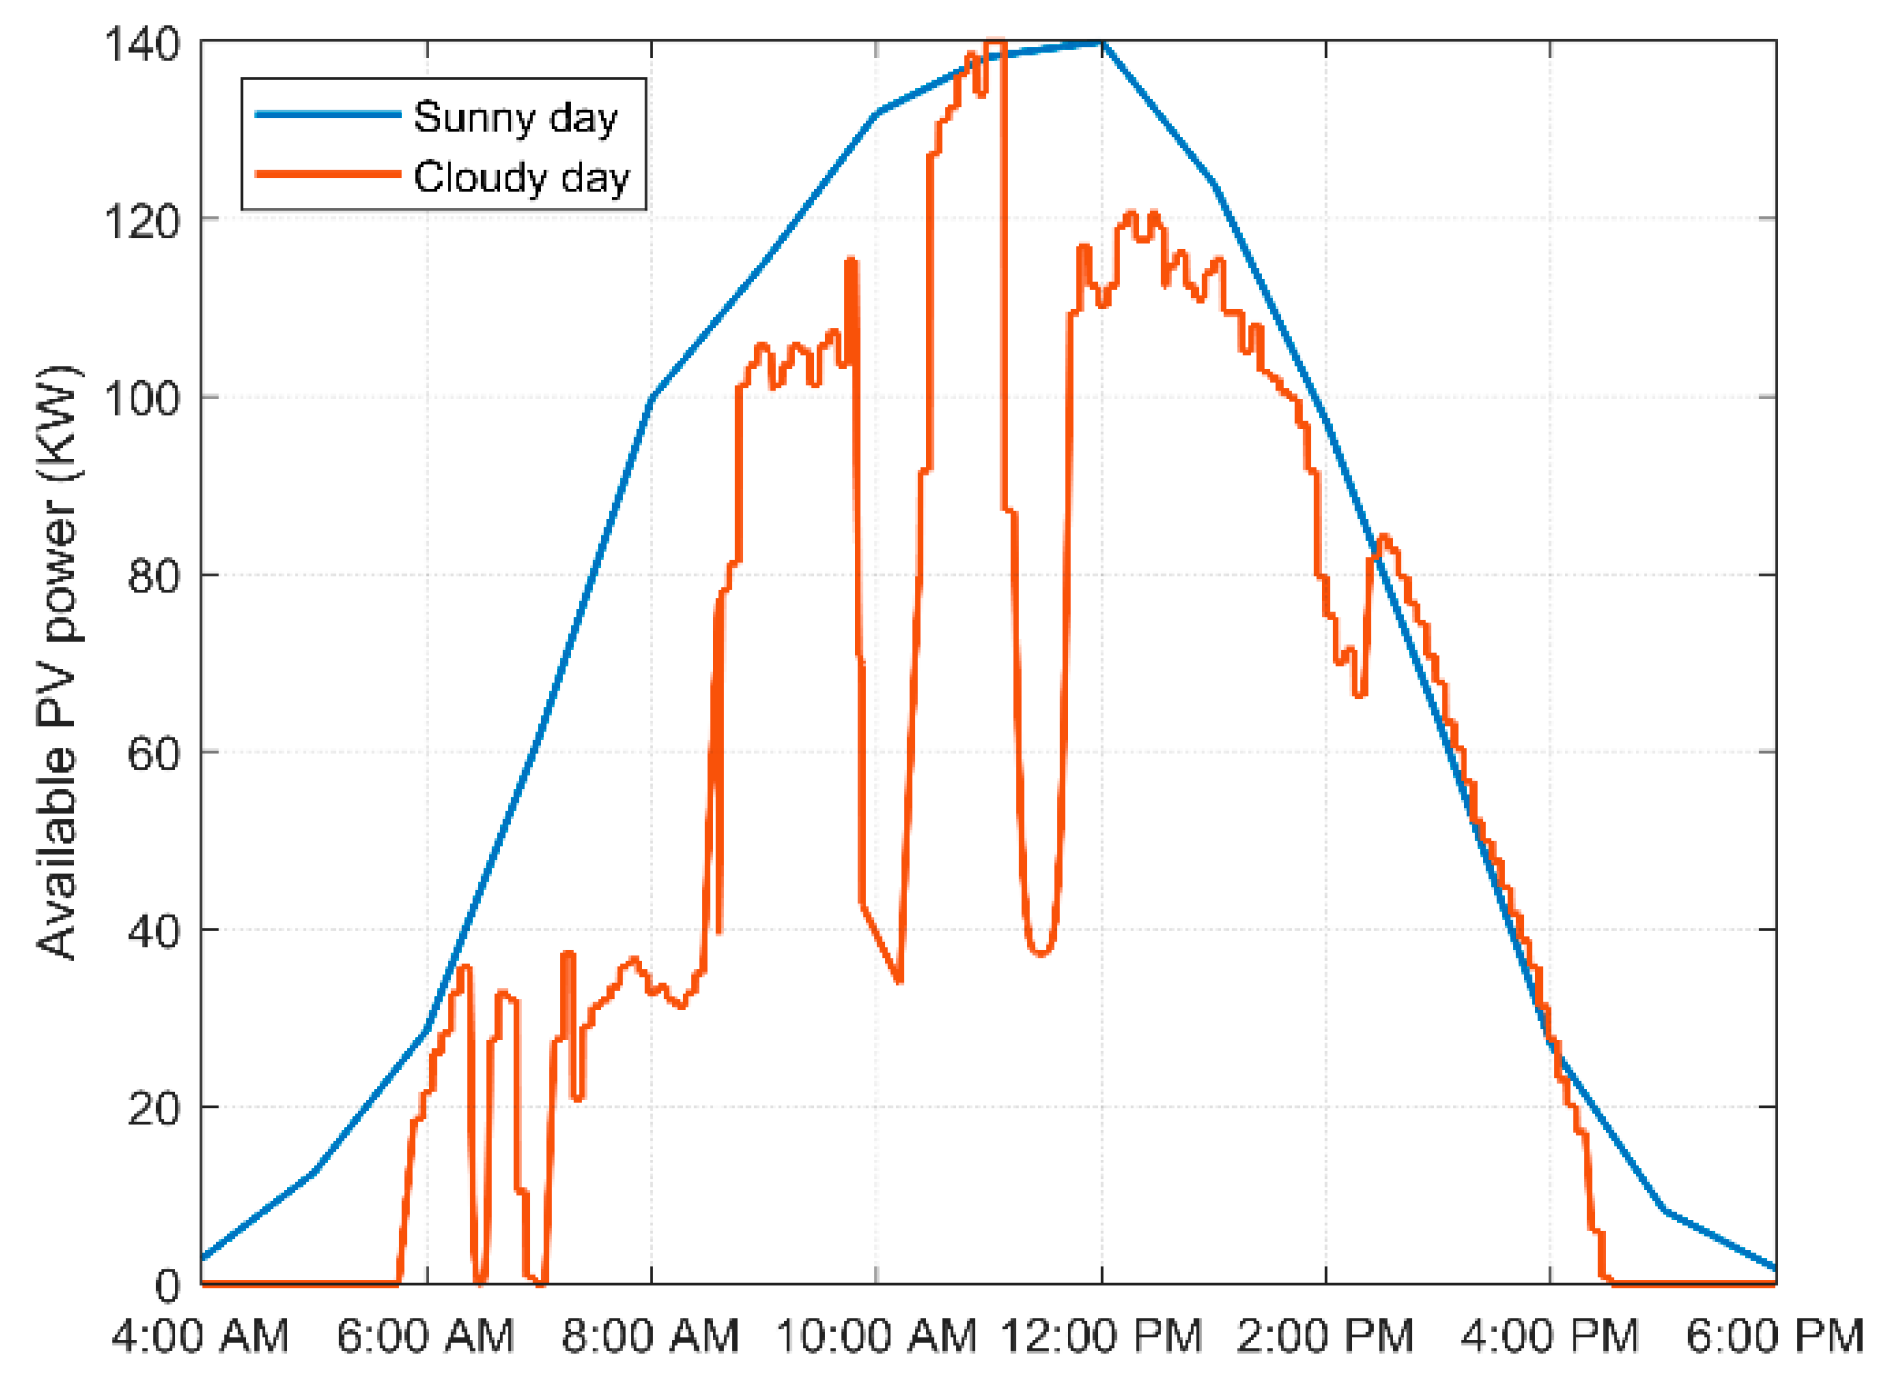
This case represents moderate levels of solar power integration with the system loads shown in the previous sub-section. The solar power is injected into the power system without any control. PV power profiles for a particular sunny day in the summer season is considered which is shown in Figure 11. In a sunny day during the peak sunlight hours, there is more energy being produced by the PVs than consumed by the loads. Hence, in this section the impact of this high penetration of widespread PVs in the distribution system is studied.
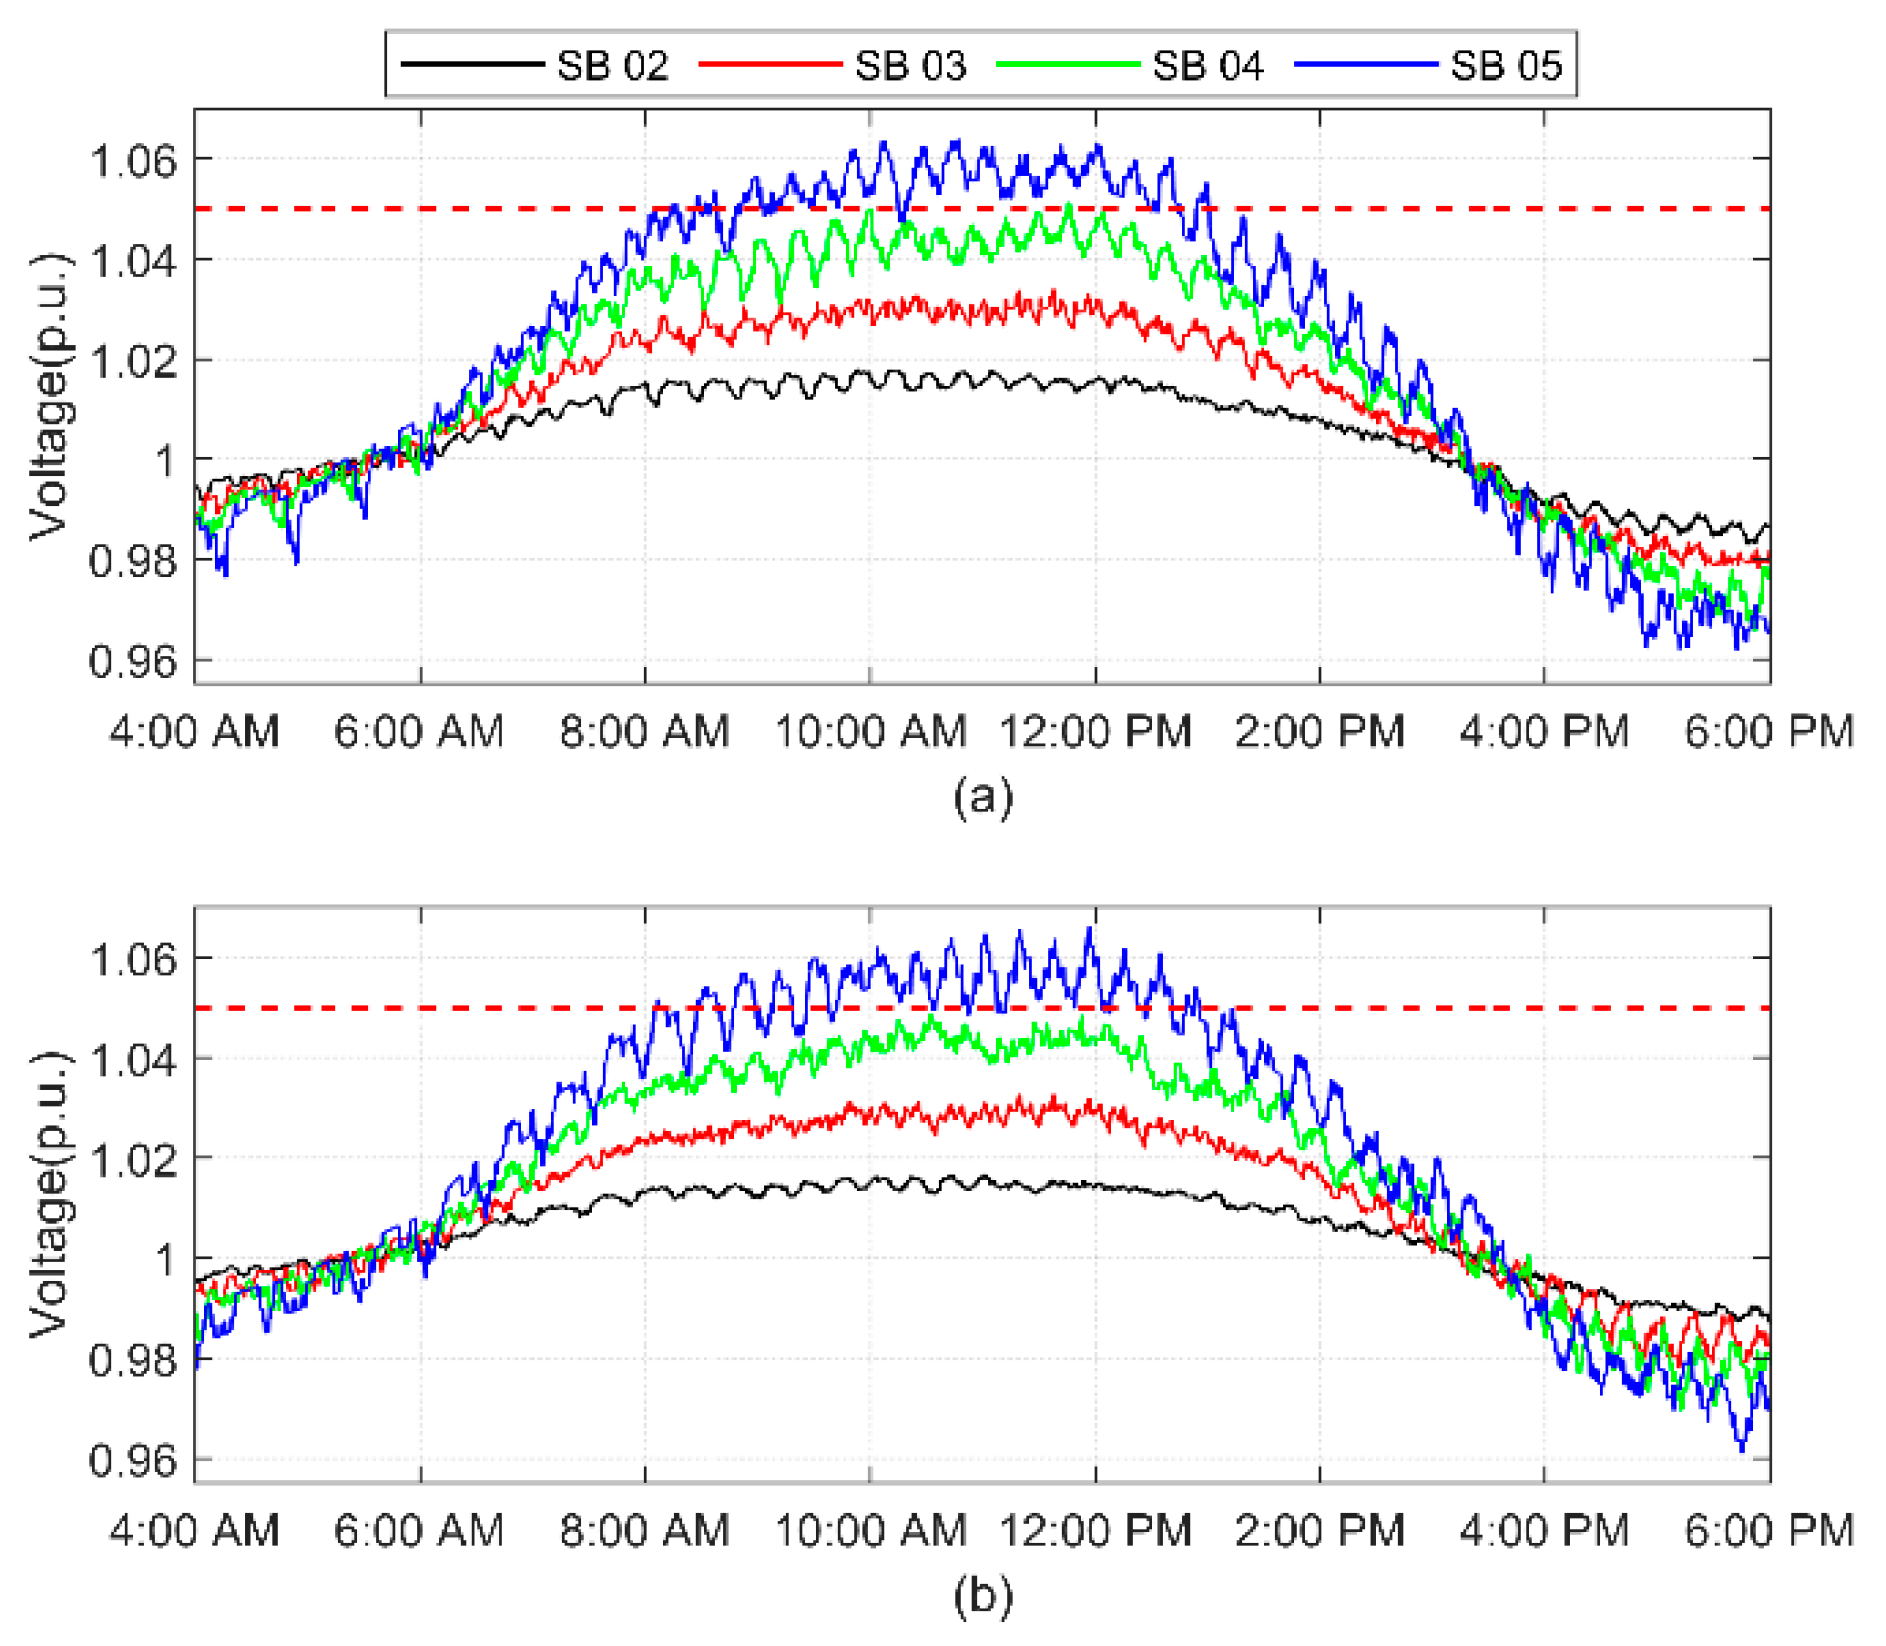
The base case voltage profiles are shown in Figure 12 with uncontrolled PV integration. The buses that are farther away from the transformer (i.e., SB 04 and SB 05) have voltage upper limit violations; however, buses that are closer to the transformer (i.e., SB 02 and SB 03) have the voltages within the allowable limits. It is noteworthy to observe that the voltage at the downstream bus is much higher as compared to the upstream bus. However, it was much lower as compared to the upstream bus when no PVs were installed (see Figure 10 and Figure 12). It is due to the fact that the downstream buses are often more sensitive to changes in the load and/or power generation when compared to the upstream buses.
4.3. On-Off Controller
In this case, an on/off switch controller is tested. A reference voltage, p.u. is selected. Based on the POC bus voltage, the controller decides to ramp down the power generation if the voltage is higher than and ramp up the power generation if the voltage is lower than . Ramp limits are selected to be 1 kW/10 s to avoid abrupt variations.
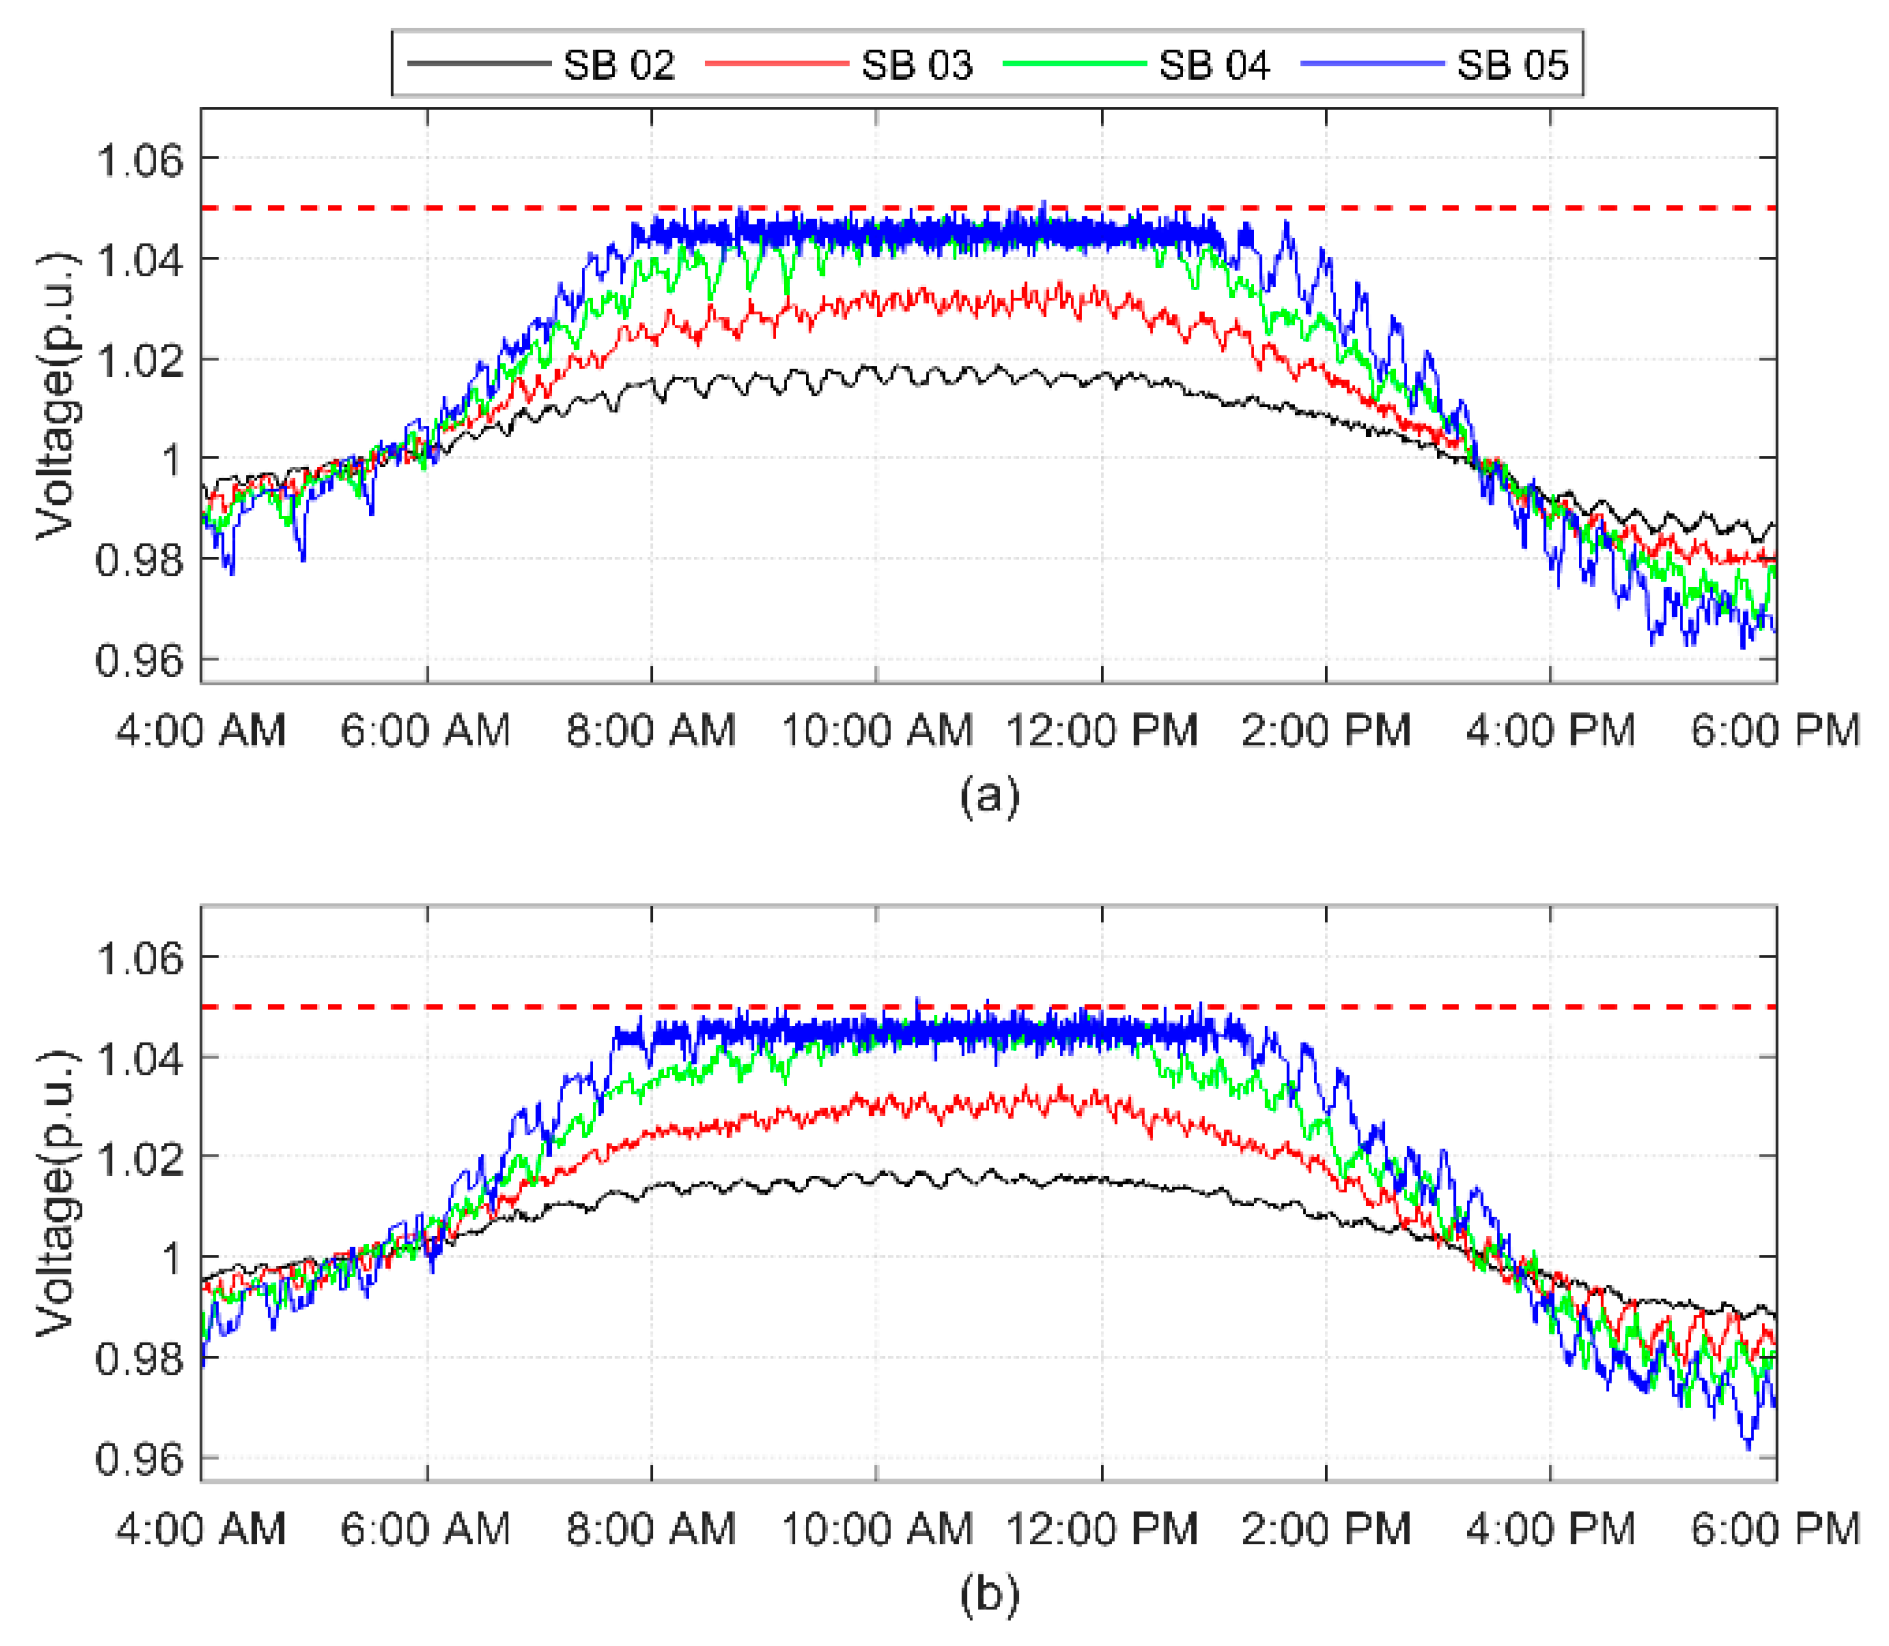
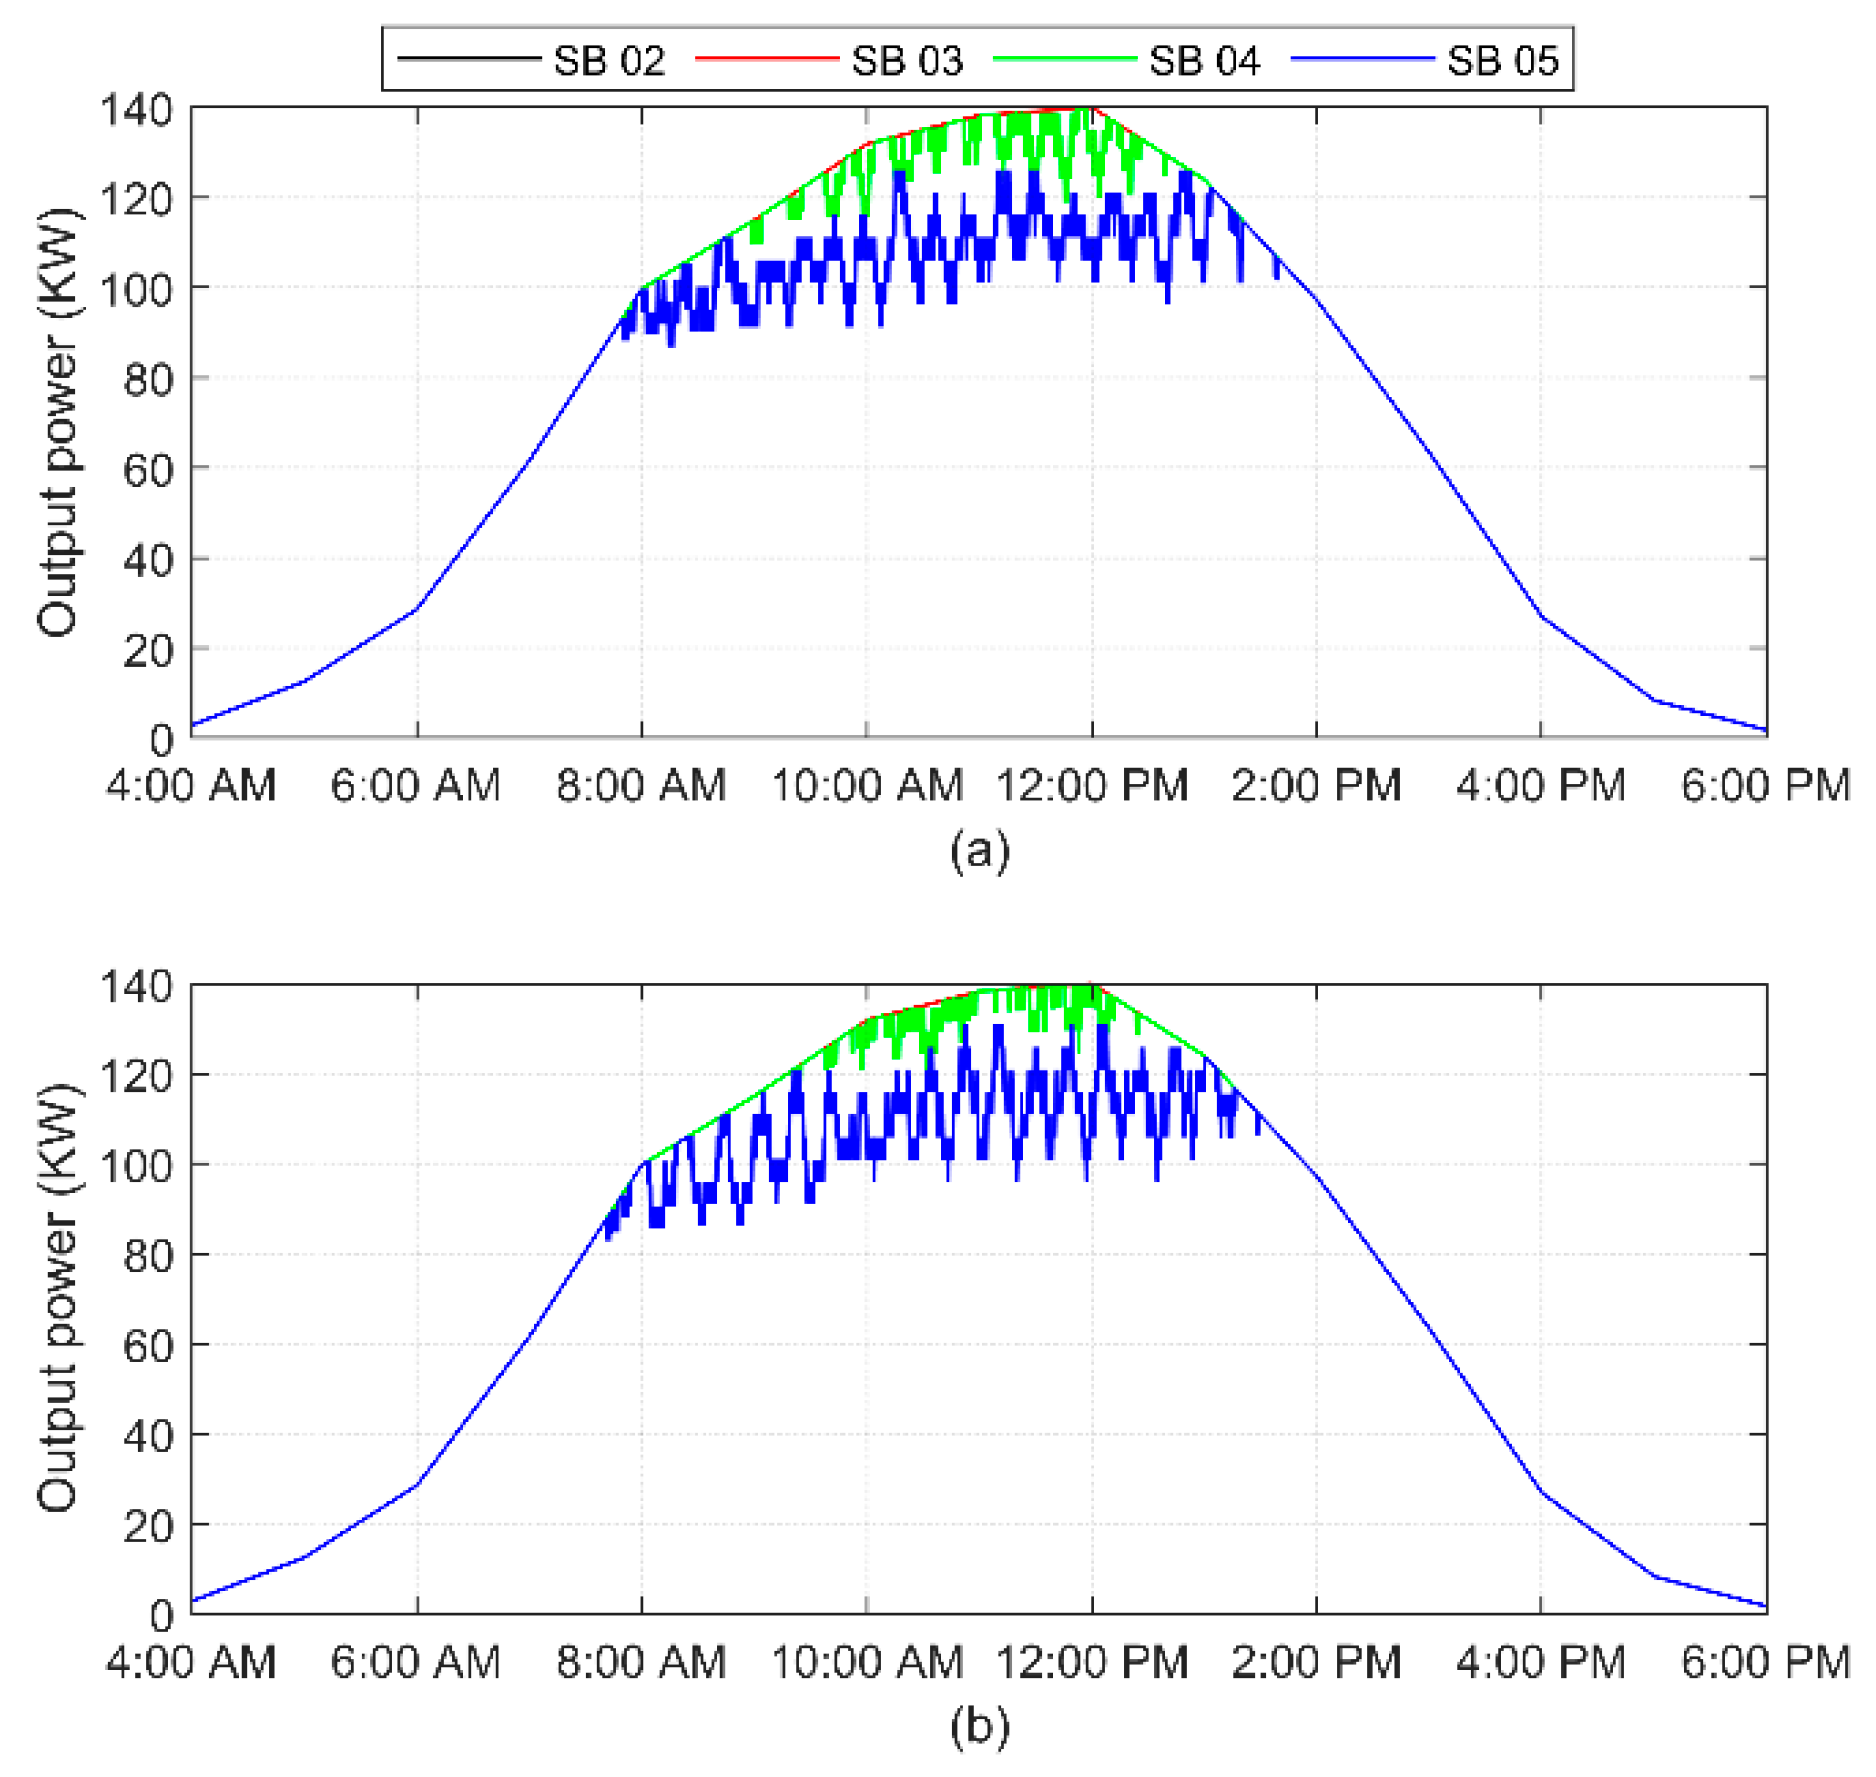
In Figure 13 and Figure 14, the voltage profiles and power generation profiles of the secondary buses are shown. It is evident that the power is only curtailed for downstream buses (i.e., SB 04 and SB 05), whereas the upstream buses are allowed to generate all the available power. Moreover, due to the frequent switching the SB 05 bus has fluctuating voltage problem, which may lead to other power system problems [30].
4.4. Droop-Based Controller
In this section, a prevalent control scheme based on droop characteristics is shown for comparison. This scheme relies on the static droop P-V characteristics curve of each node in the distribution system. This relationship between the voltage and the output power is defined by the piecewise linear function as provided in (5). In [31], settings are done based on the location and the system loads. However, due to system reconfigurations this scheme would require communication, which is absent in present-time distribution systems.
A simpler form of the droop-based controller is tested with same droop constants, . A critical system voltage, , is set to be 1.05, which is the maximum allowable voltage defined by the ANSI C84.1-2016 standard. Considering a safety margin, the controller is activated at 1.02 p.u. The droop constant,, is set at 21.
where:
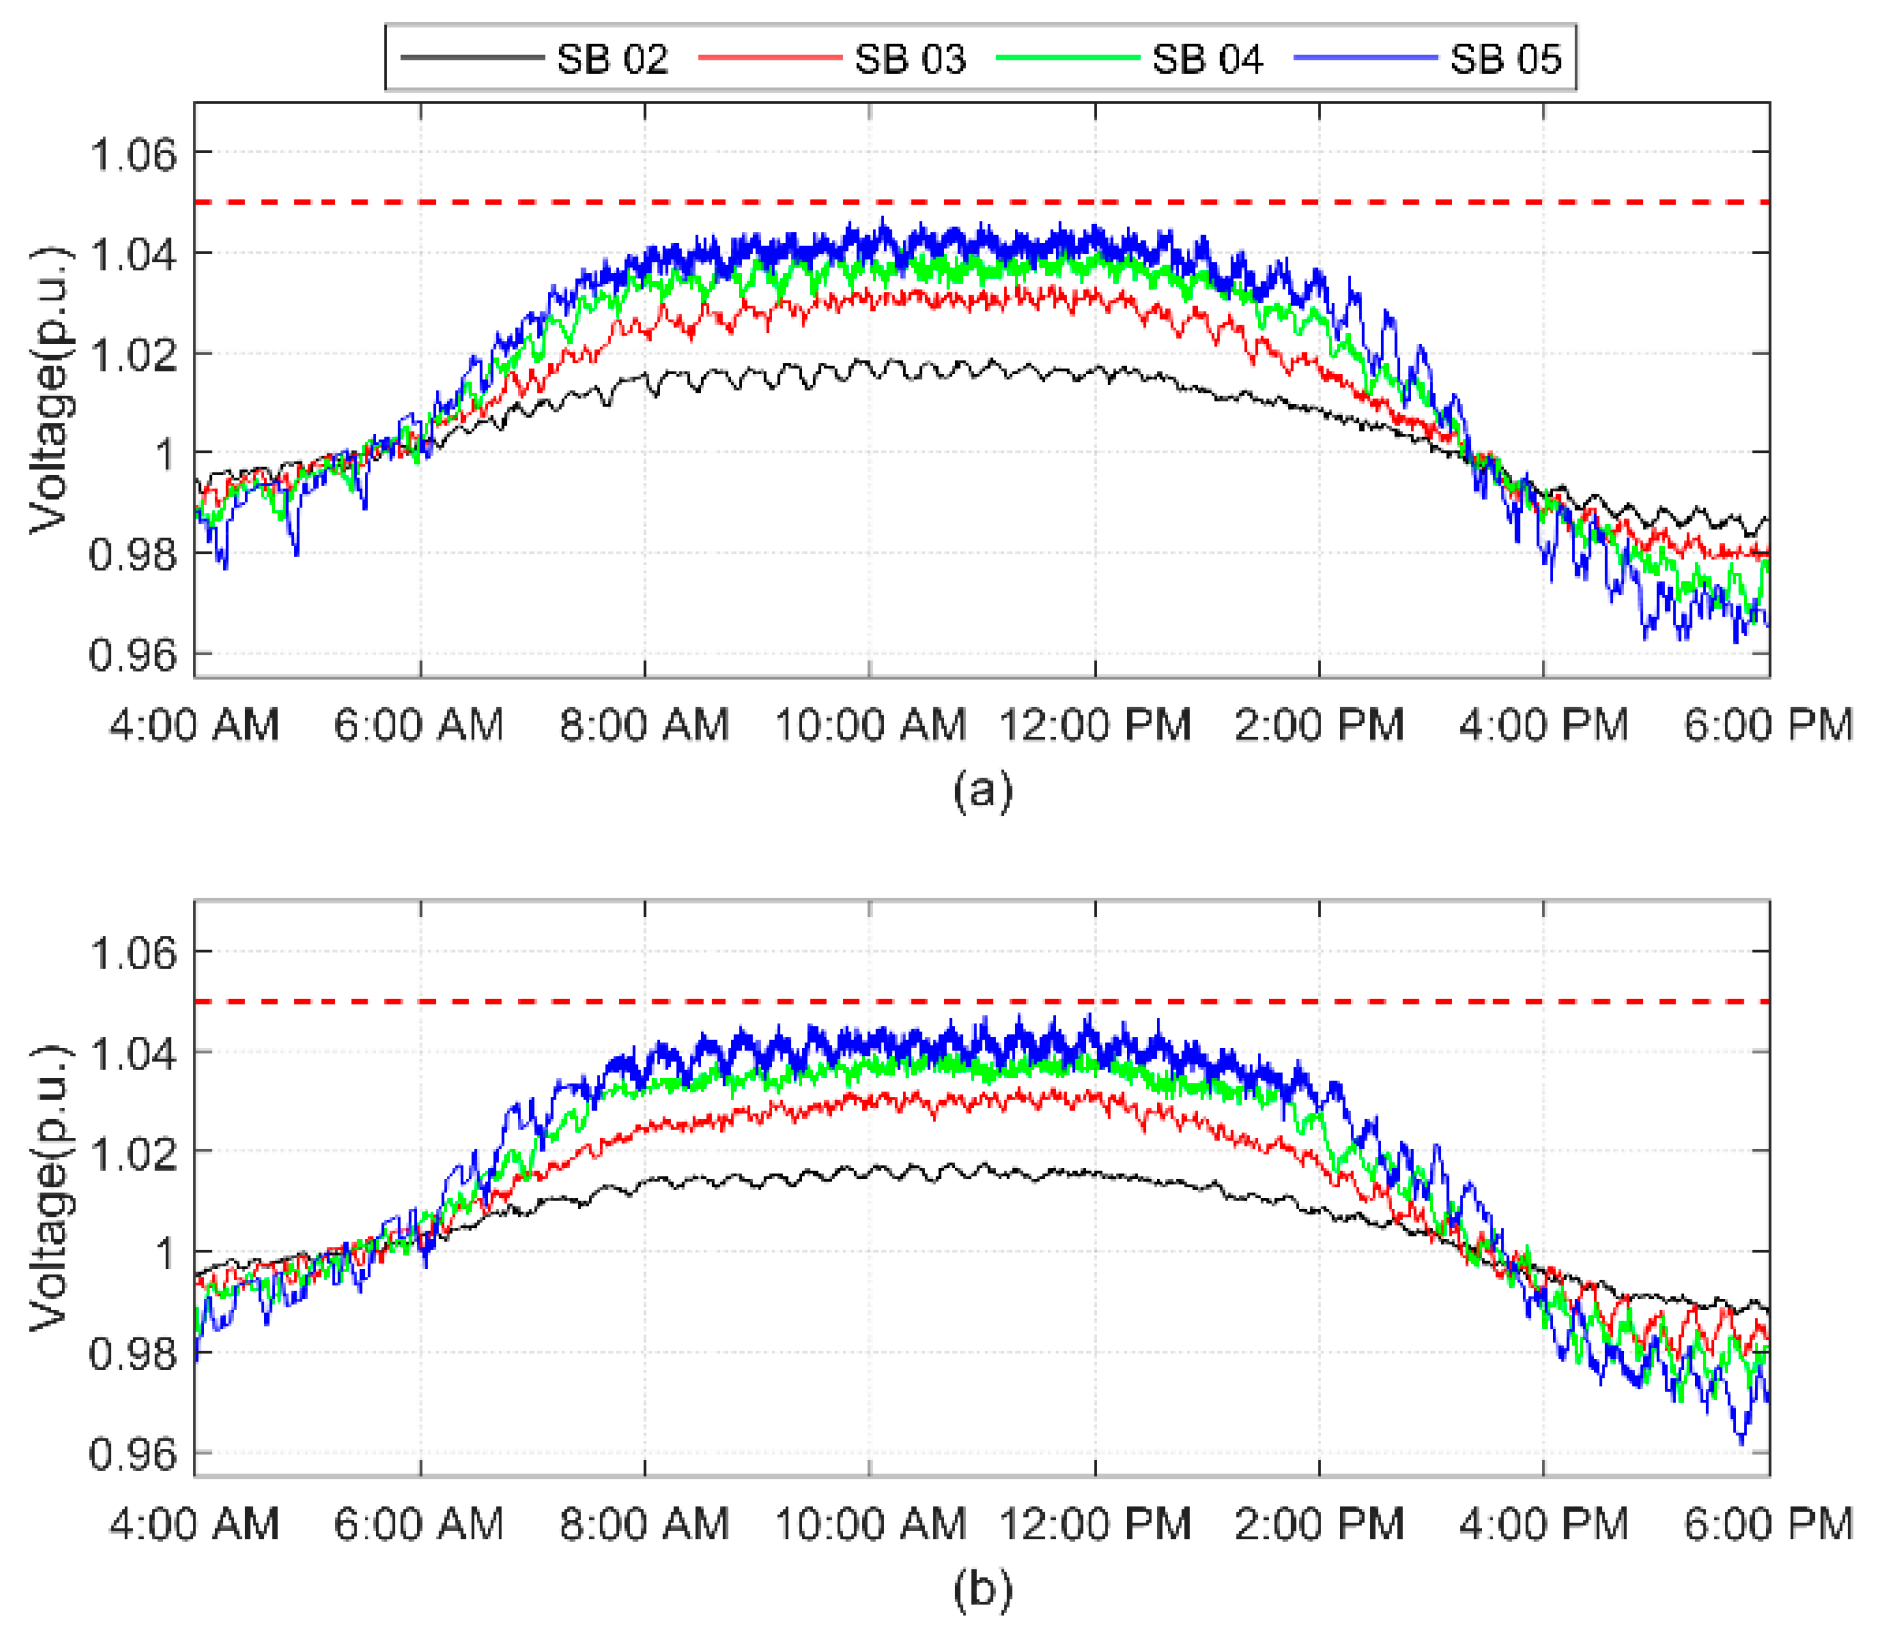
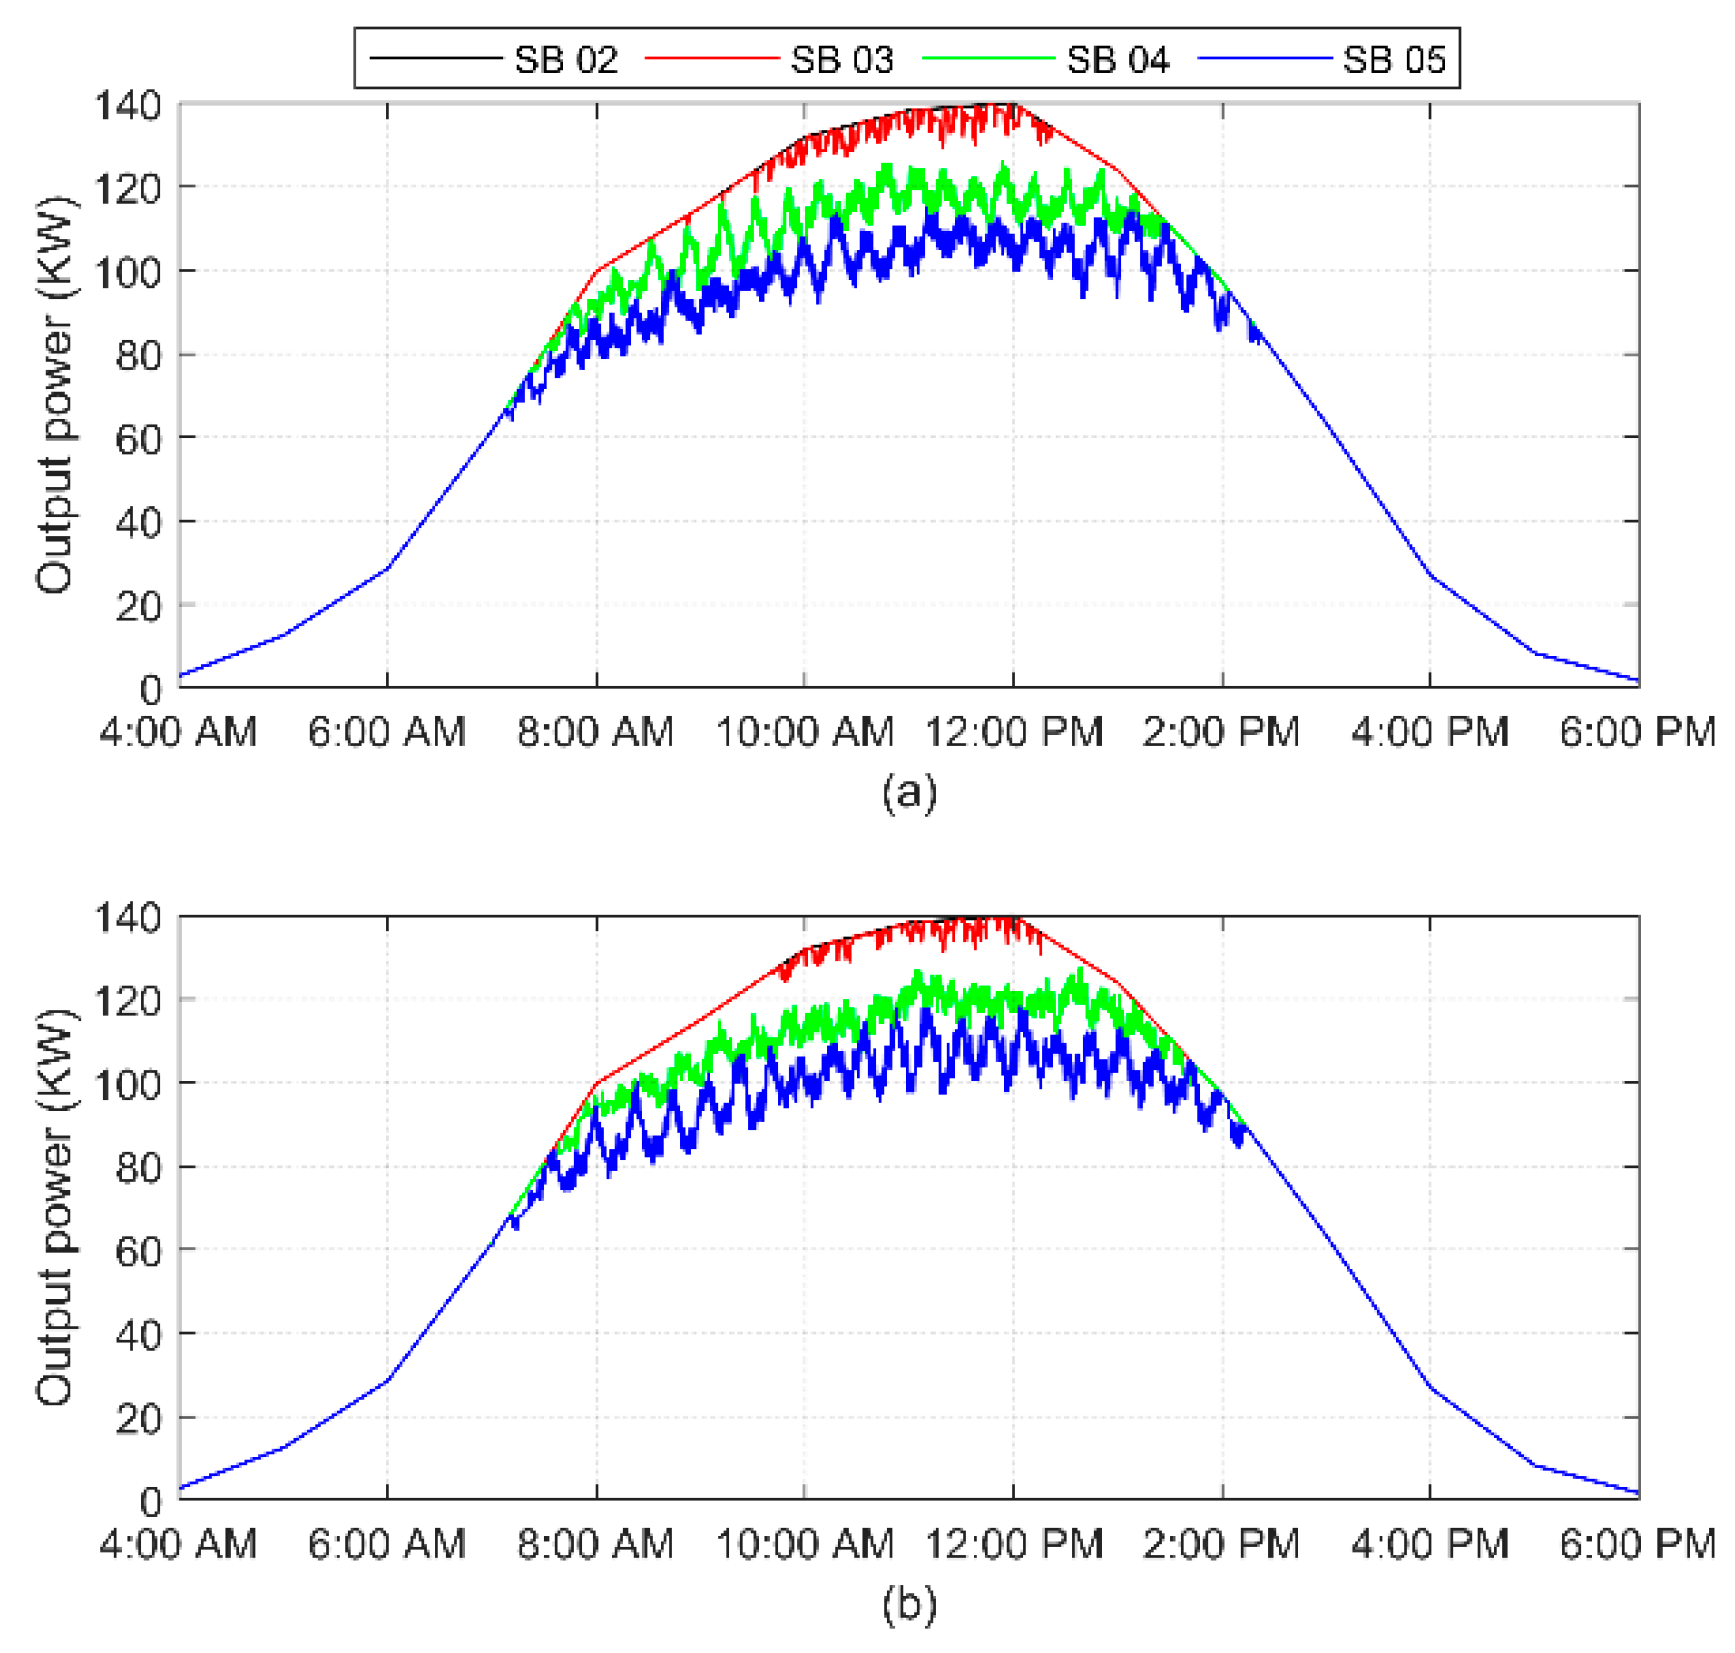
The system voltages are shown in Figure 15. It can be seen that all the voltages are within the allowed limits. However, the buses located downstream inject less power than the buses closer to the transformer as illustrated in Figure 16. The buses closer to the transformer can export full PV power available while the downstream buses are undesirably restricted due to their higher voltages. Thus, the PV generated revenues for these customers are lower as compared to other customers.
The uncontrolled integration of PVs results in voltage-rise problems, as it is shown in Section 4.2. While other communication-free controllers (Section 4.3 and Section 4.4) are not able to act fairly among all the PVs connected in the system. Additionally, these controllers are not able to provide a stable voltage profile at the PVs point of connection. It is because they only use voltage readings to control the power injected and there are no integral or derivative control modules.
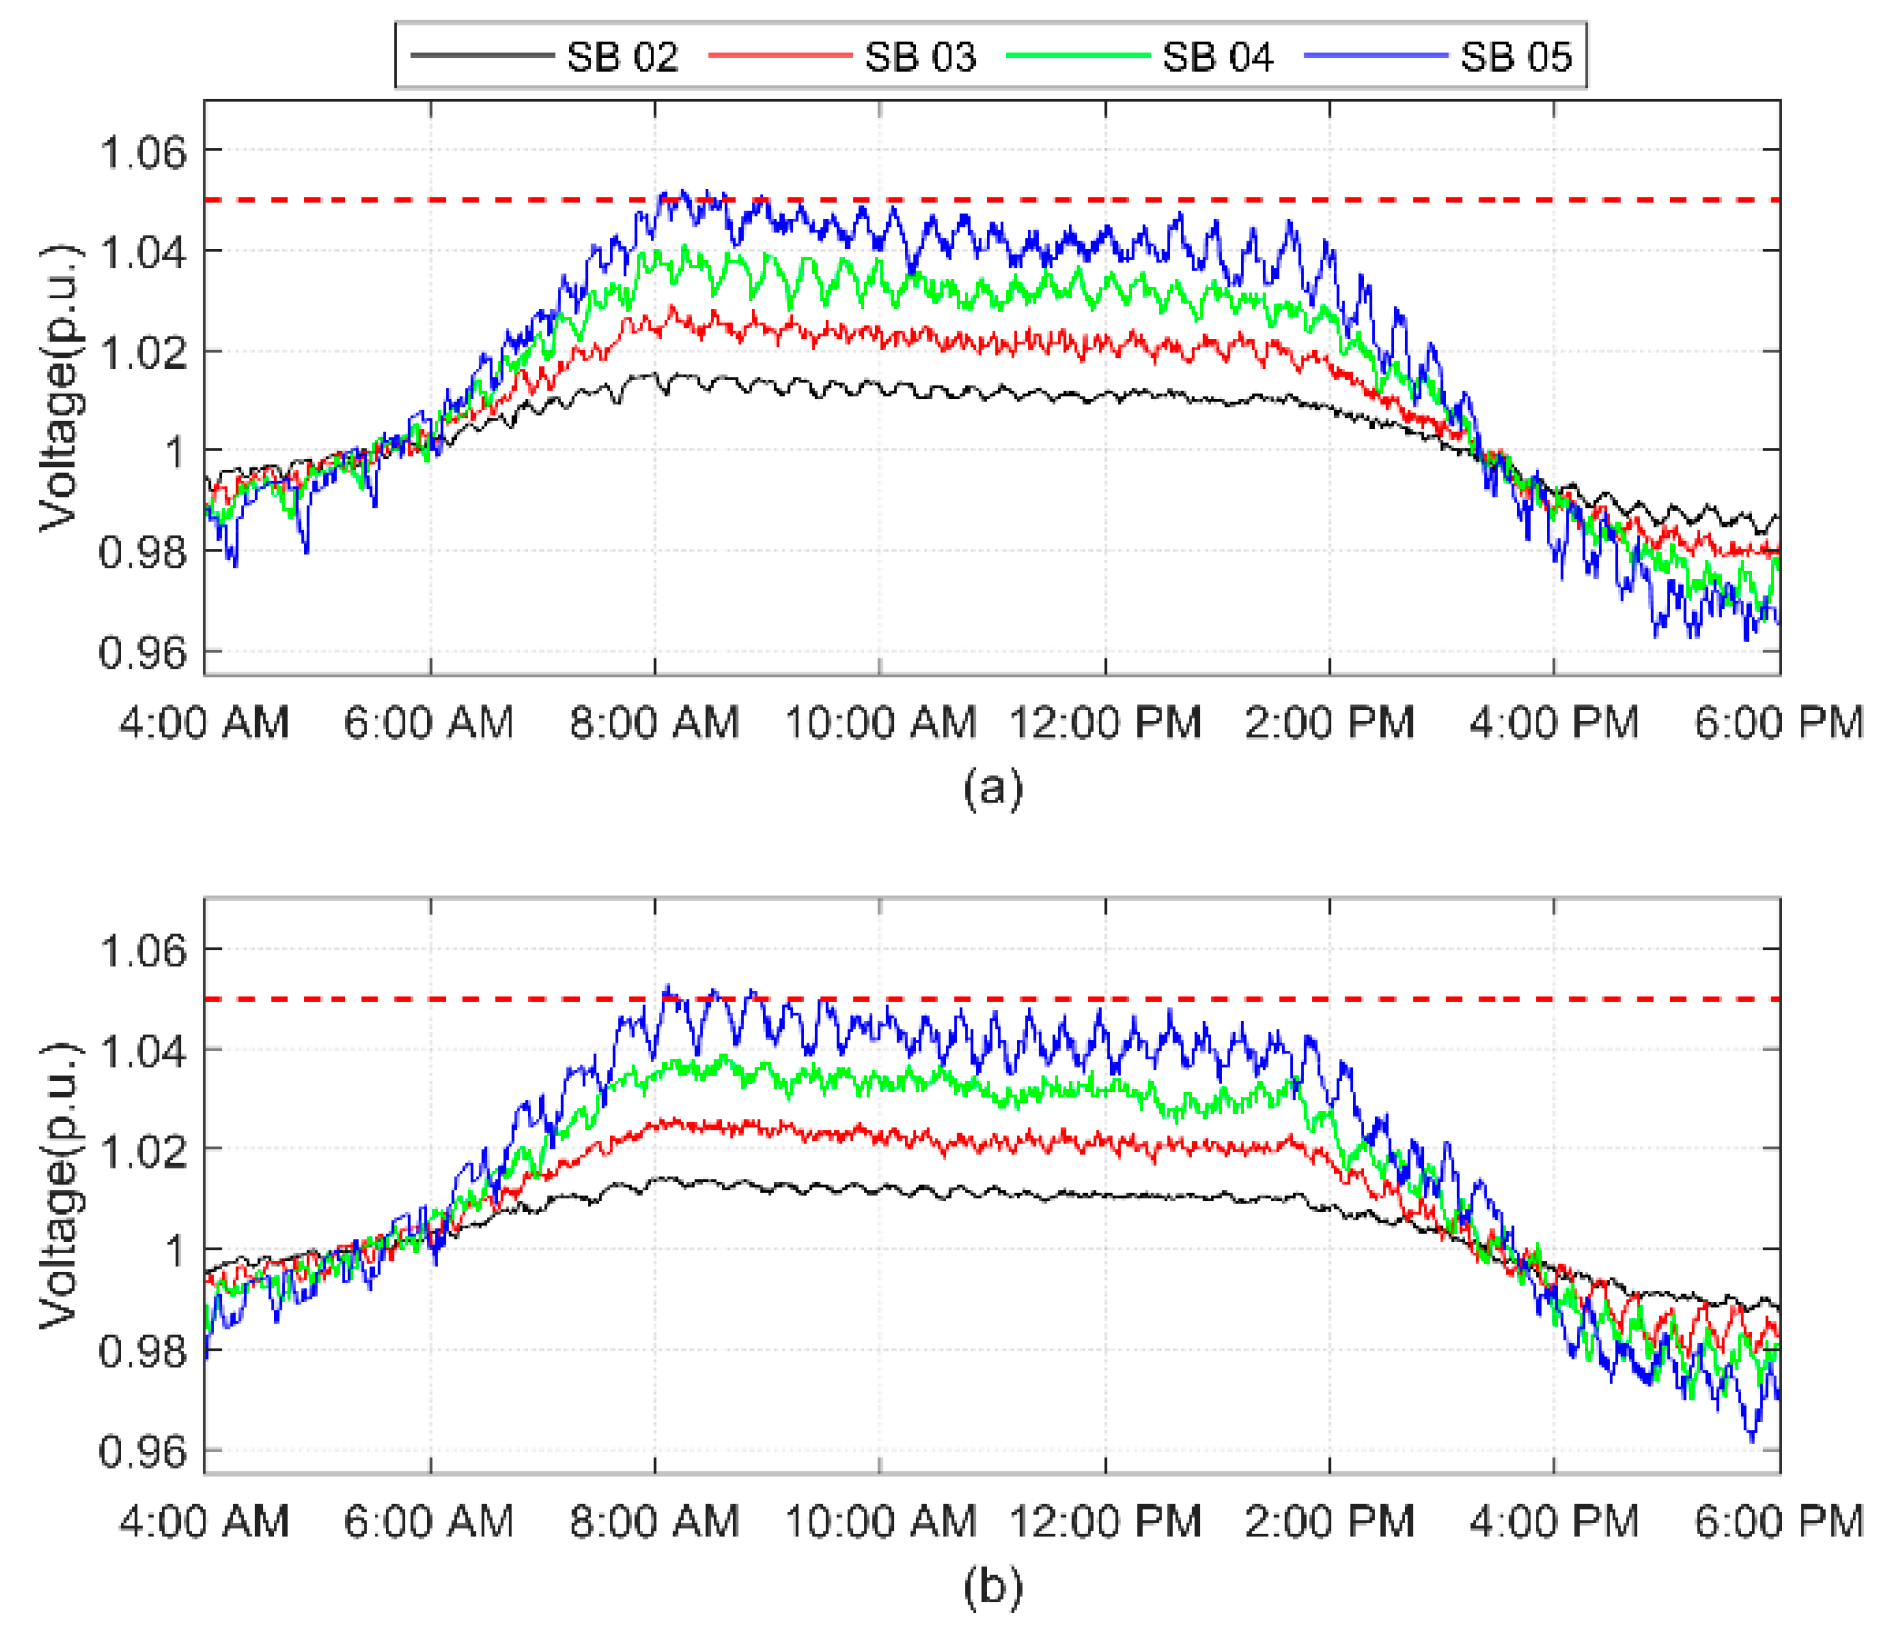
In order to mitigate the voltage-rise problem, a machine learning-based autonomous PV controller is presented. The controller utilizes both, the nodal voltage and its sensitivity to throttle the power output of the solar PV. Each solar PV in the distribution system is controlled independently by these controllers. The resulting voltage profiles are provided in Figure 17 when the proposed controllers are implemented. It can be clearly seen that the controller is able to effectively regulate the system voltages with good system voltage stability. Throughout the day, the voltages are maintained within the permissible range, except between 8:00 A.M. and 9:00 A.M., where some negligible over-voltages are recorded. This is because of the time required by the controller to respond to the significant variations in load/generation (as shown in Figure 5 and explained in Section 2.3).
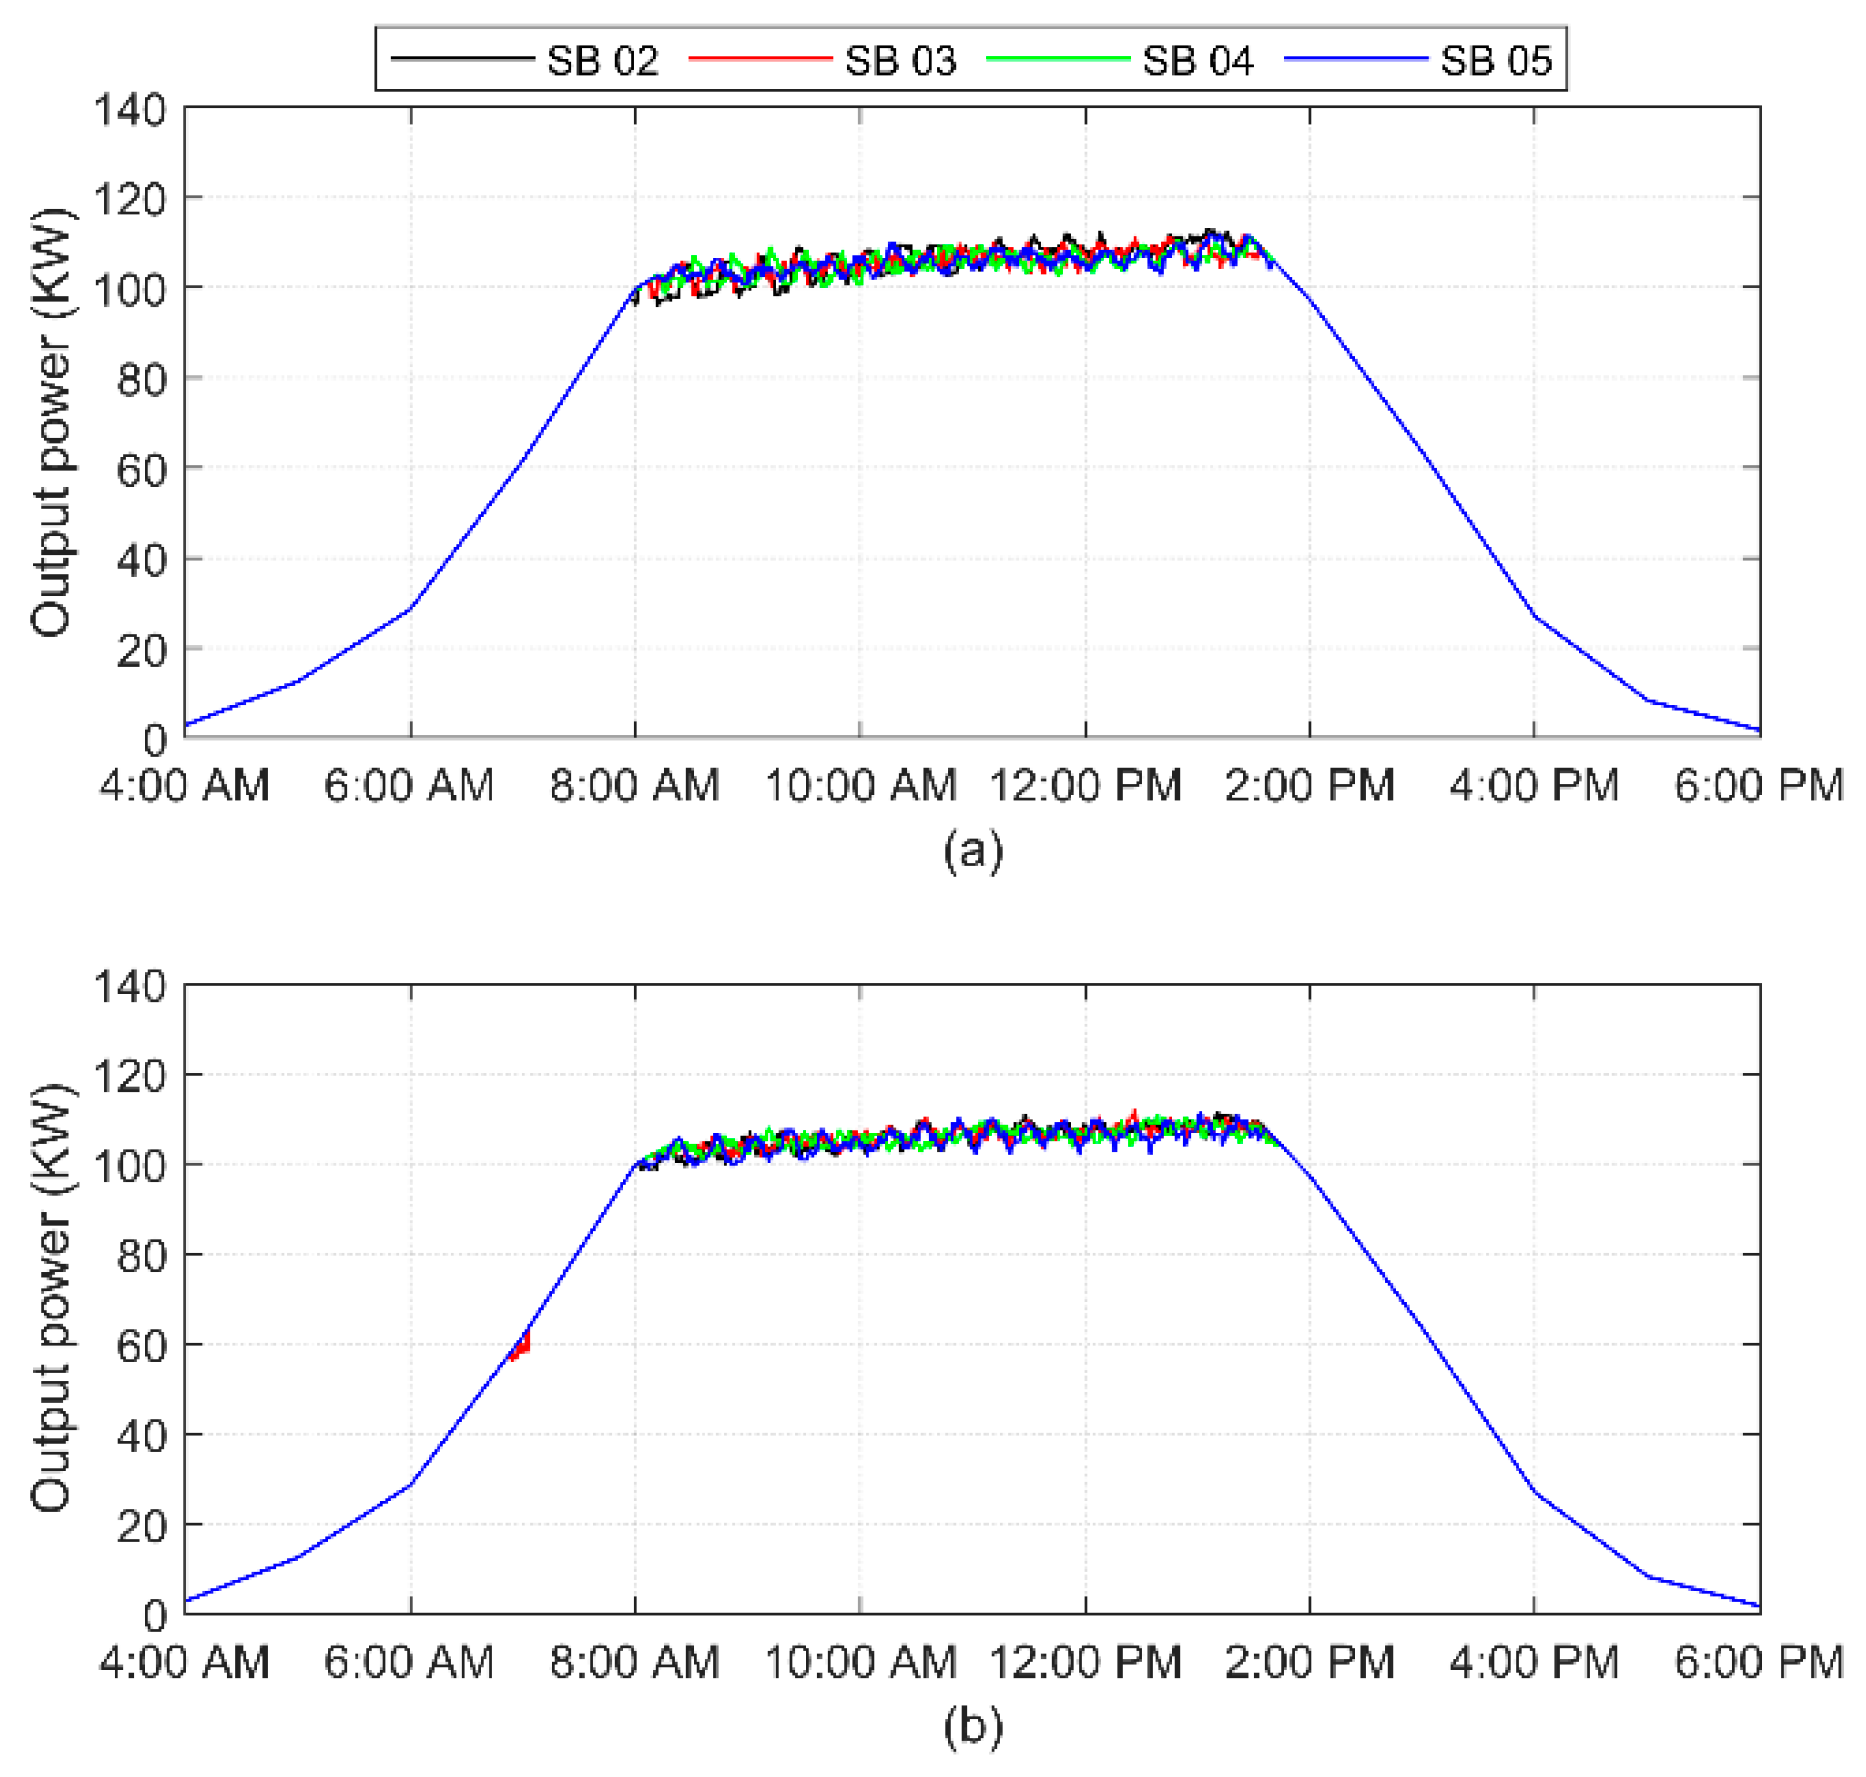
The most interesting feature of the proposed controller is fair power curtailment, despite the fact that there is no communication among the PVs connected at various locations in the distribution network. The power generated in the presence of the proposed controller is shown in Figure 18. The proposed controller curtails similar amount of power from all the PVs when the system support is required. The daily energy produced by the proposed and the droop-based controllers are provided in Table 2. It can be observed that the secondary downstream bus (i.e., SB 05) produces around 240 kWh less energy than the upstream secondary bus (i.e., SB 02) when the droop-based controllers are utilized. However, for the proposed controller similar amount of energy is being produced at all the secondary buses in the system. These results indicate the efficacy of the proposed controller.
5. Control Strategy Performance
In this section, performance of the proposed voltage and sensitivity-based control strategy is further examined. Table 3 summarizes the fairness for all control modes and effectiveness of these methods to avoid voltage limit violations. Total energy produced by each primary node in a day are also included. As anticipated, the uncontrolled integration of solar power results in the maximum energy production; however, the voltage violations are extreme and persist for longer duration (i.e., for about 286 min). On the other hand, the voltages are appreciably improved for on-off and droop-based controllers, but the fairness issue was gravely compromised. It is evident that the downstream buses (SB 04 and SB 05) experience most of the energy curtailment; therefore, these control techniques are not suitable for fair power integration. However, the proposed controller fairly curtails the energy from each PV system. Moreover, it drastically improves the system voltages as compared to the uncontrolled case. Note that the proposed controller curtails a little higher amount of the generated power in comparison to the other controllers. However, this slightly higher curtailment allows all the distributed PVs to participate fairly in the voltage improvement process.
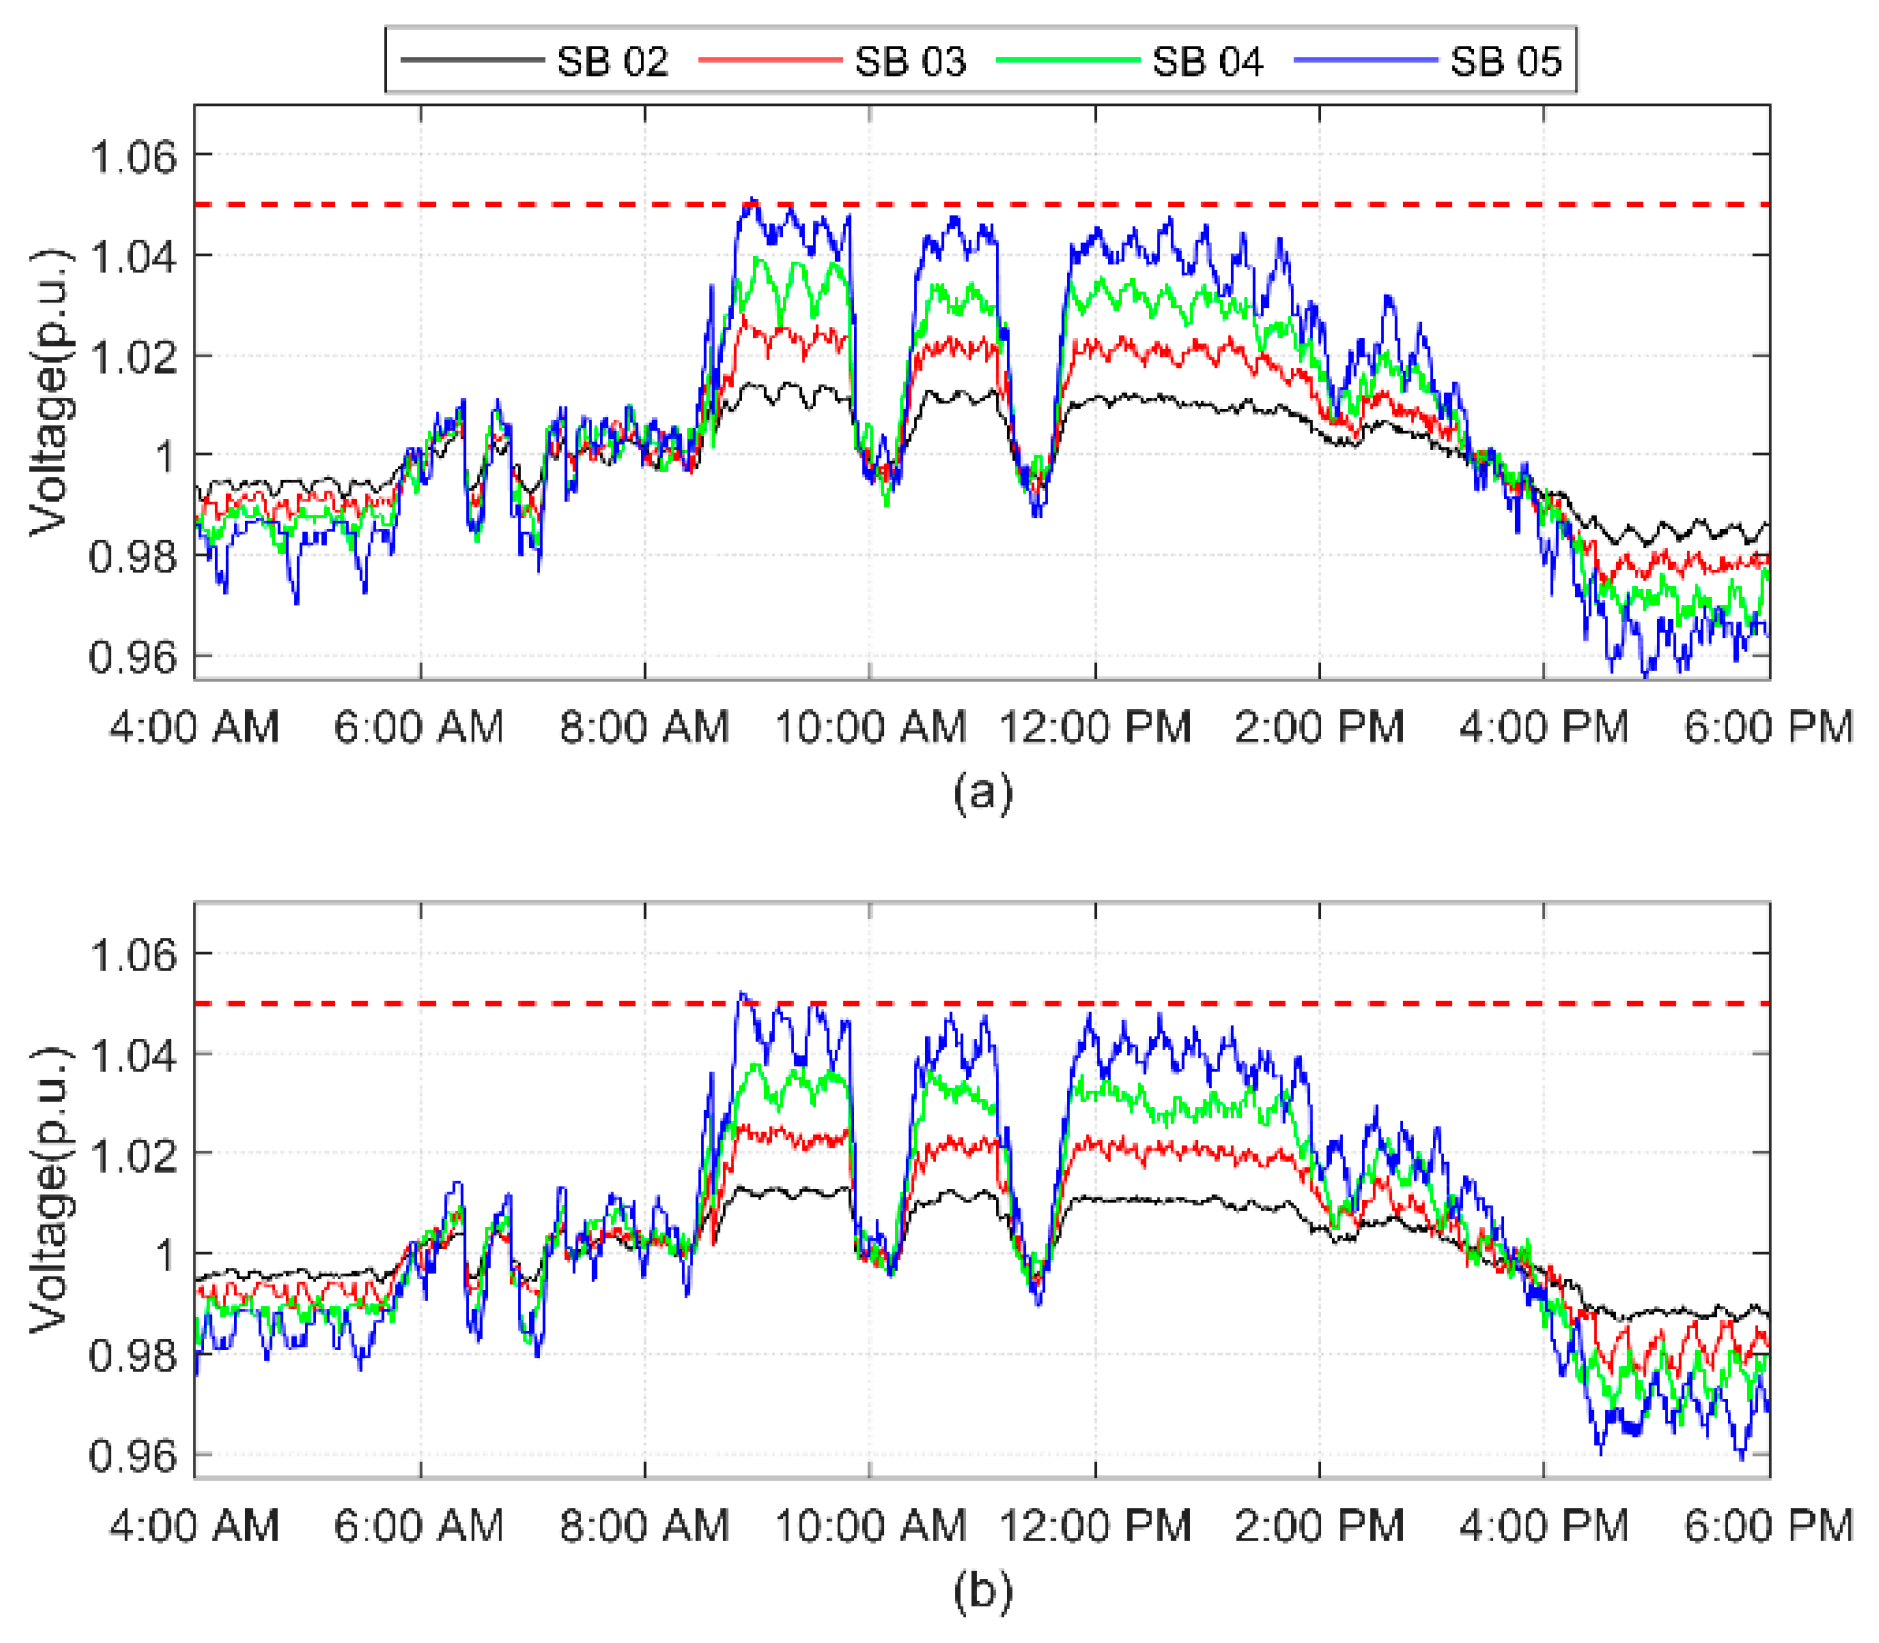
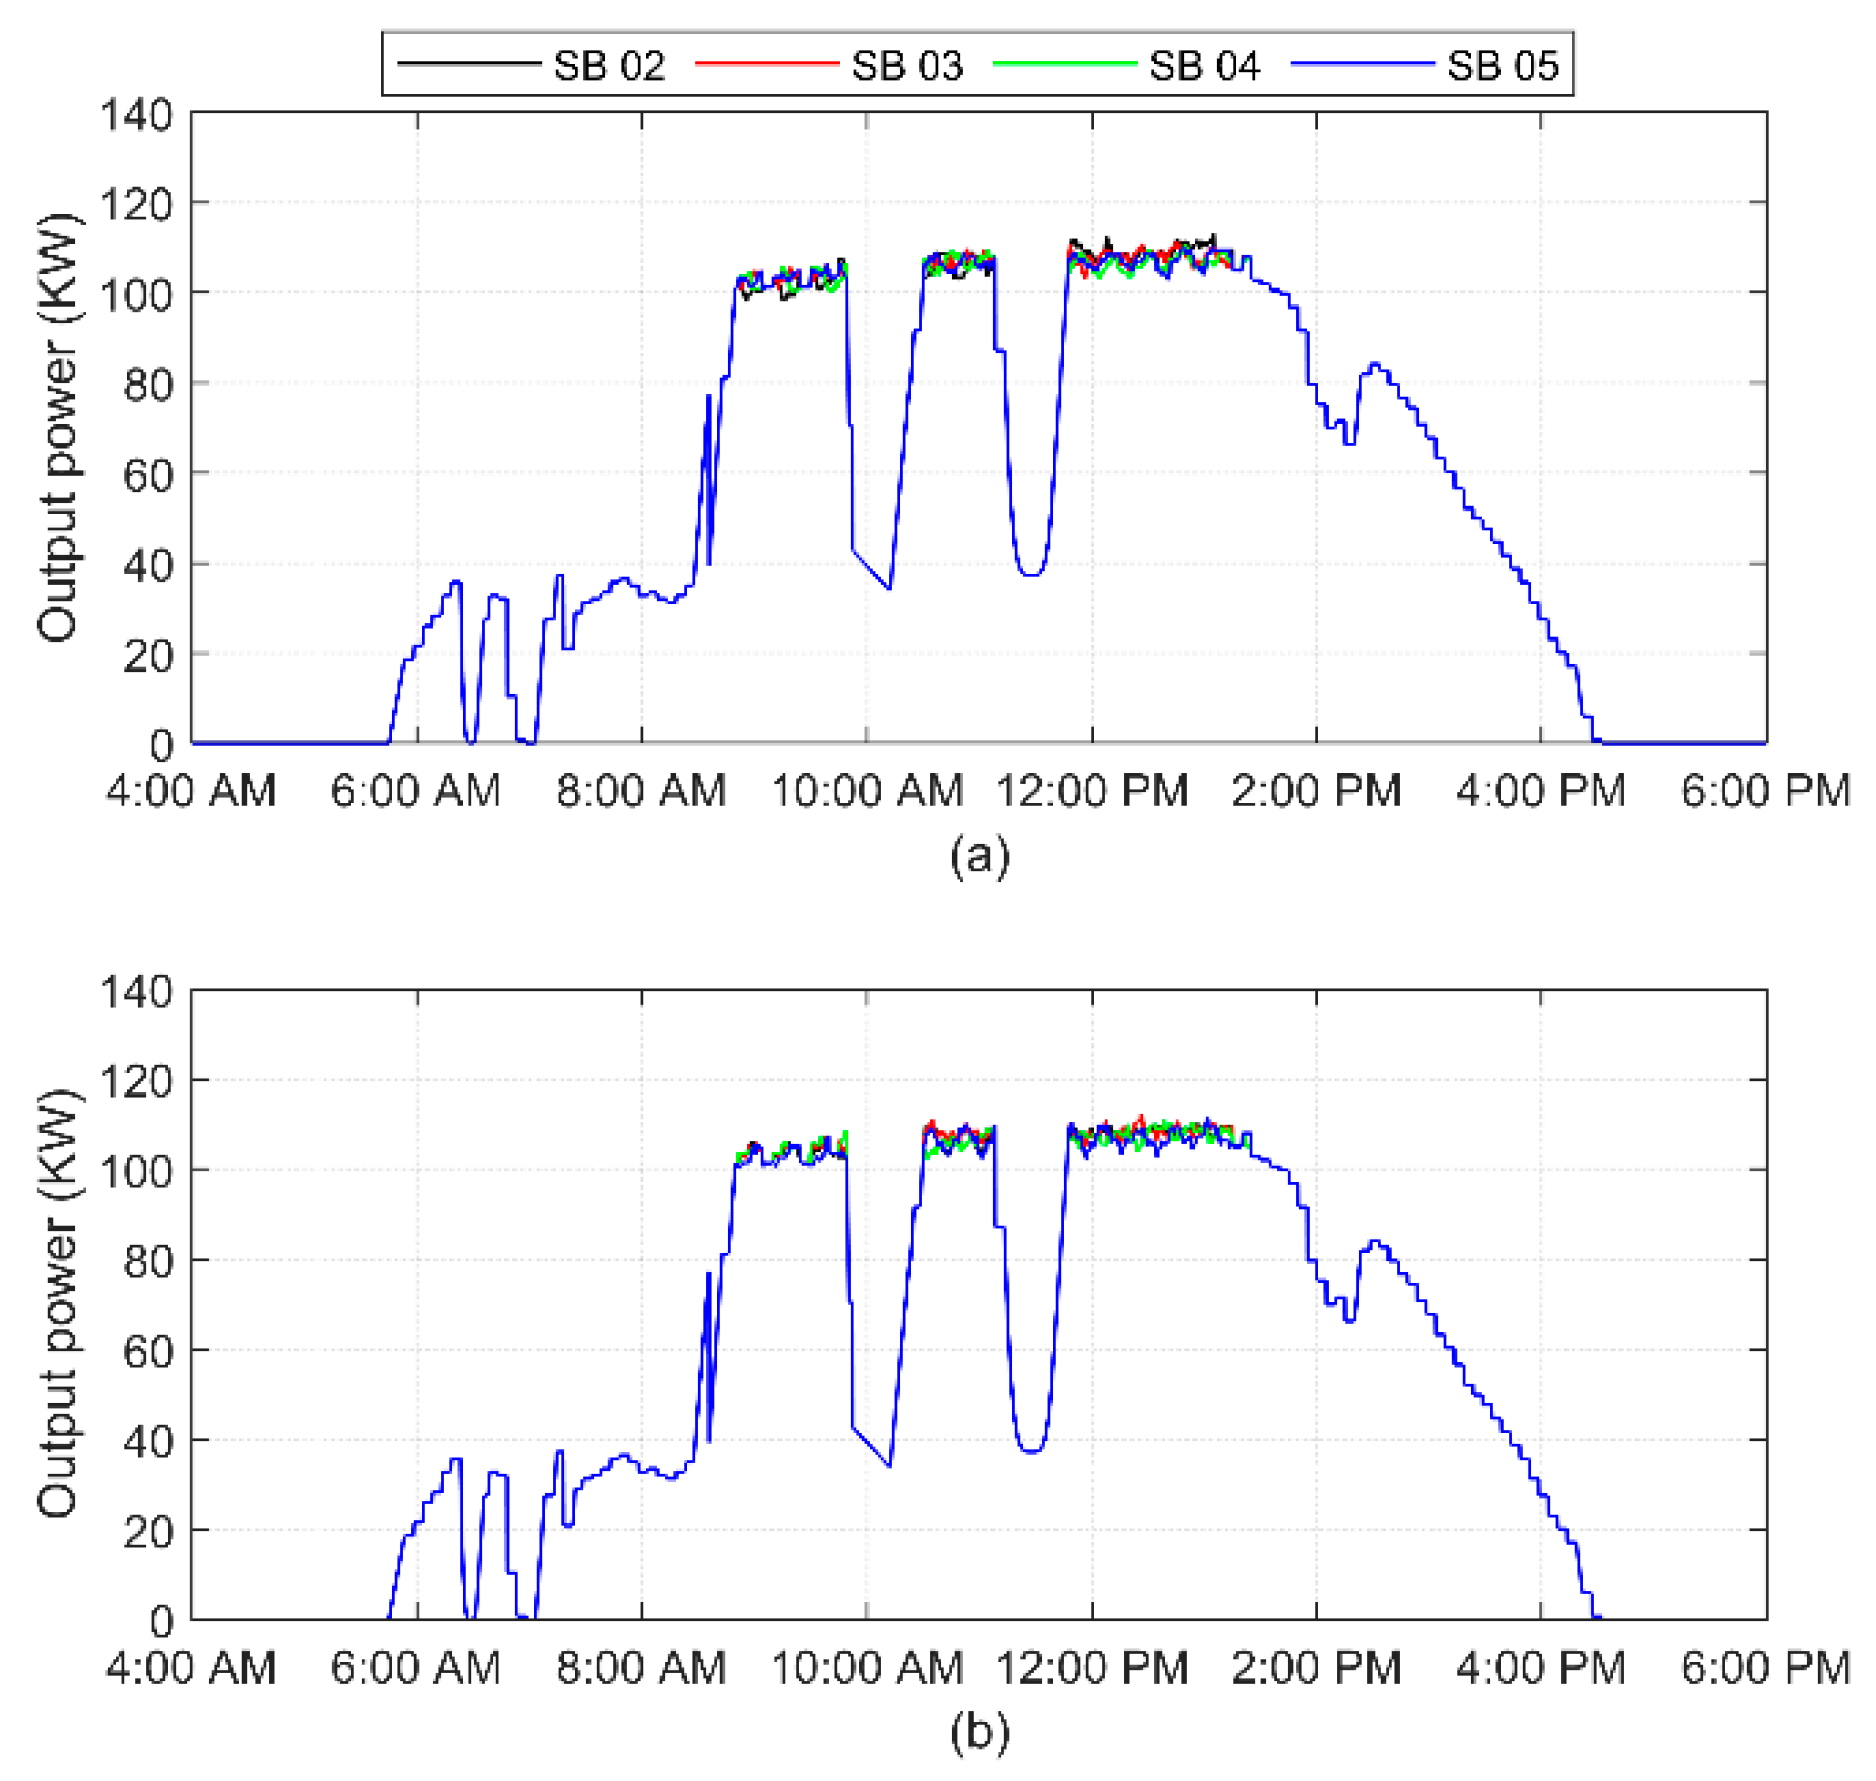
In addition, the performance of the proposed control strategy is assessed with solar resource variability. This can happen for many reasons, including the cloud covering the solar PVs. The PV’s output generation is highly varied on a cloudy day compared to a sunny day, as shown in Figure 11. The voltage and power generation profiles of the secondary buses are shown in Figure 19 and Figure 20, respectively, when the proposed controller is tested during cloudy day. The results illustrate that the controller response to fluctuating available solar power is quick. Despite that the change in output power is not restricted (no ramp limit), power is always fairly curtailed to minimize the over voltage violations.
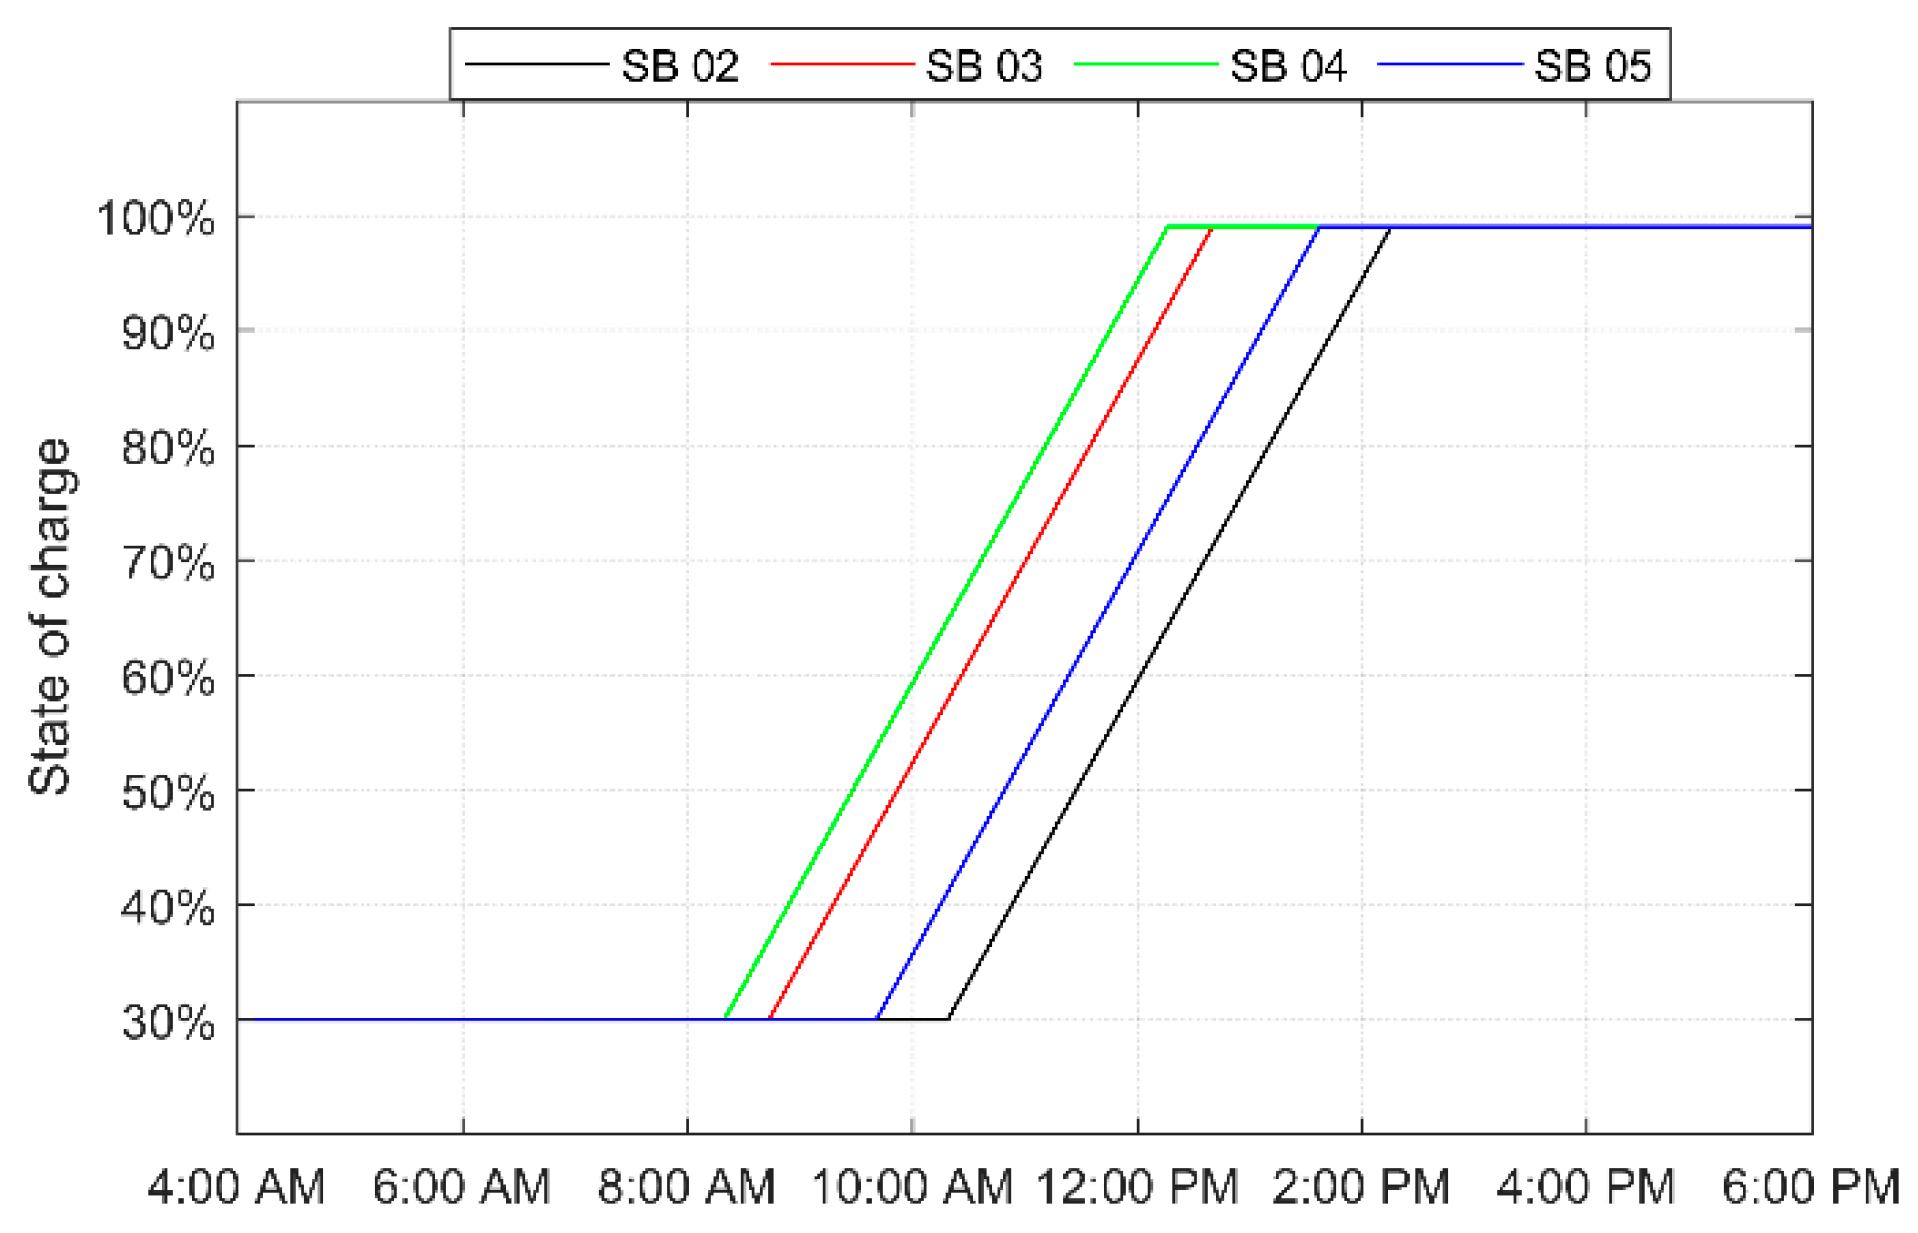
To further assess the robustness of the proposed autonomous PV controller, it is assumed that one of every two houses has an electric vehicle (EV). Nissan Leafs having 40 kWh battery pack model [32] are used to test the proposed controller when they are connected to the secondary buses. The EVs are assumed to charge at the rate of 7 kW when plugged in. That means, each EV takes 4 h to charge the battery from 30% to 100%. EVs are expected to plug-in between 6:30 a.m. and 10:30 a.m. since the impact of EVs charging on the PV control needs to be studied. The state of charge (SOC) for the EVs connected in primary Node-10 are shown in Figure 21.
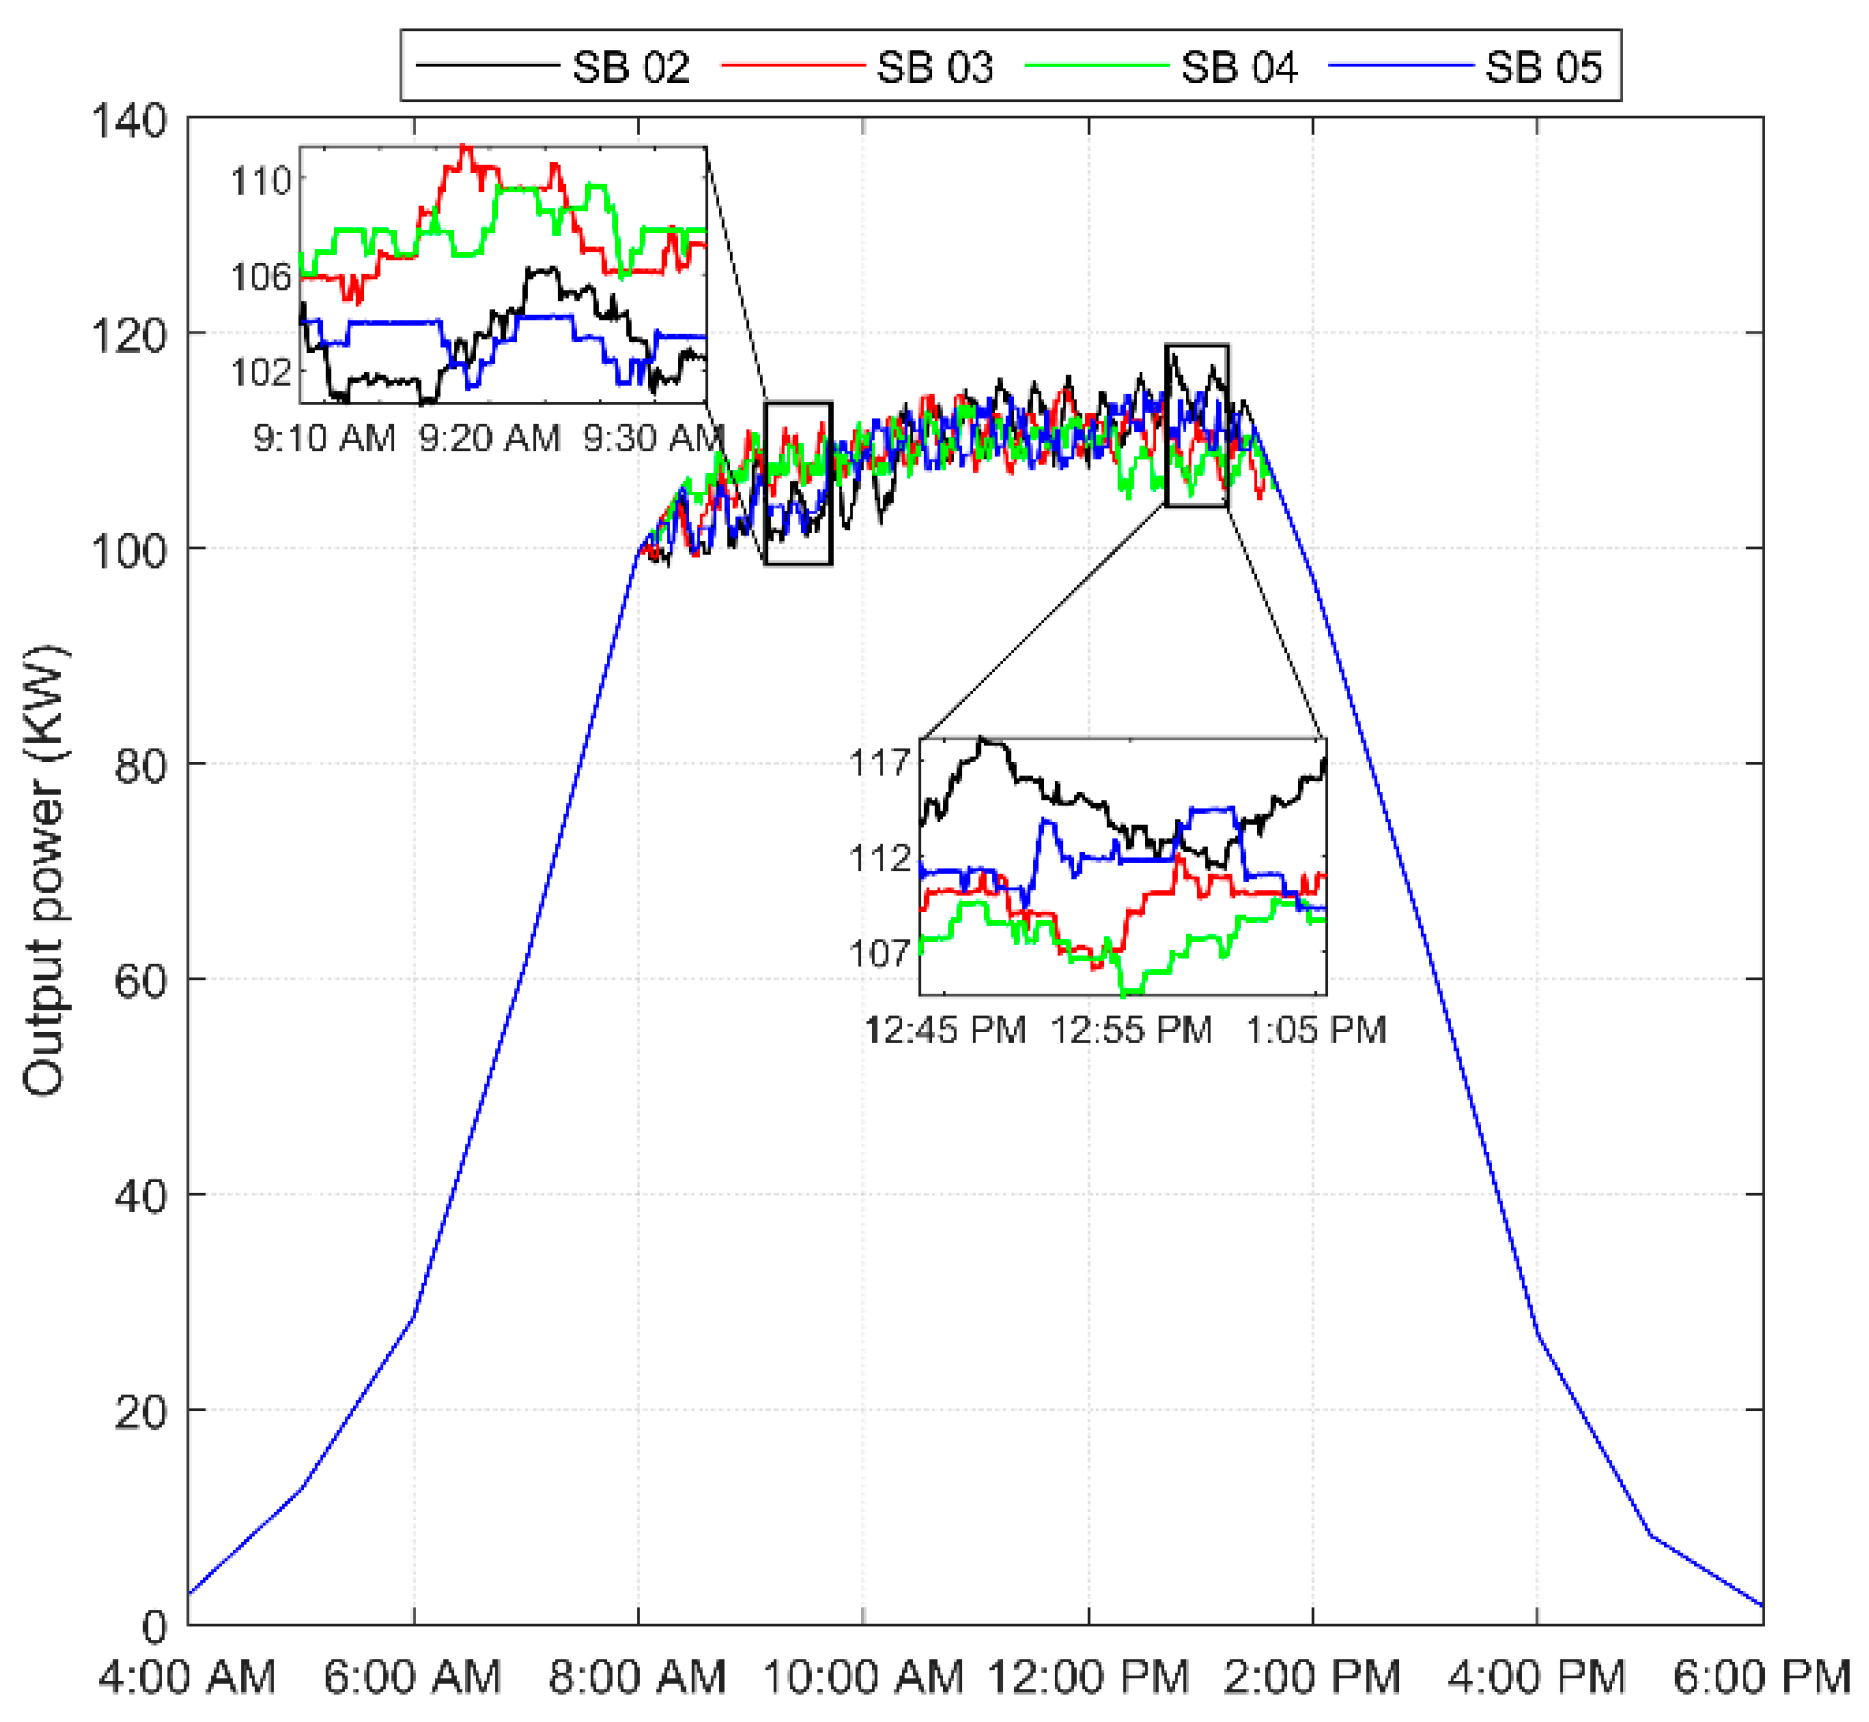
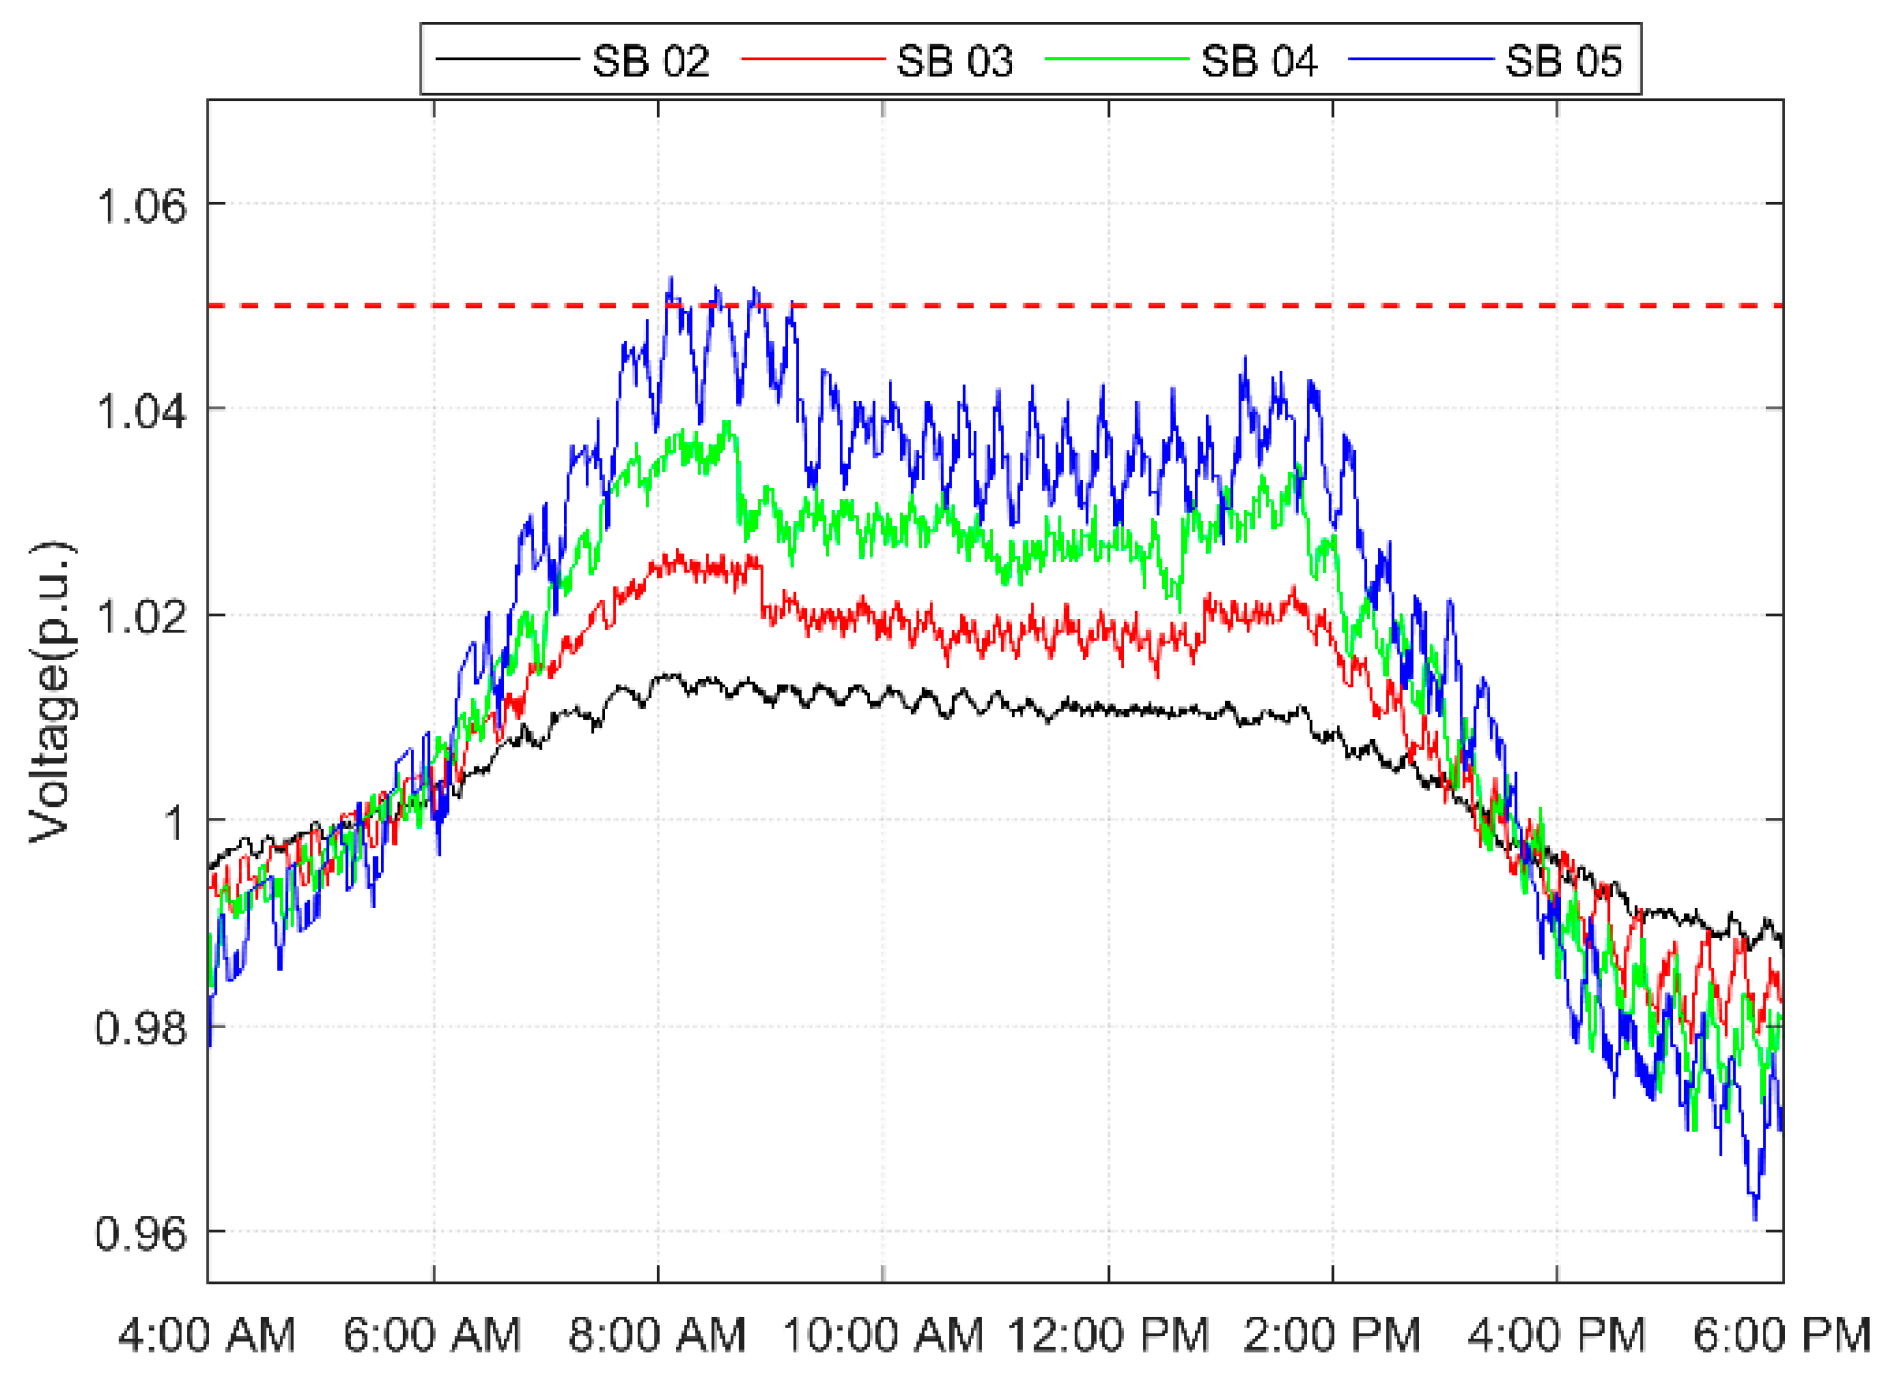
When two EVs get connected to a bus at any given time, the load at that bus increases by 14 kW. Consequently, the voltage at that bus changes which affects the PV power generation. Figure 22 shows the PV power output when the proposed controller is being used during these events. Note that the EVs only connected at SB 03 and SB 04 are charging during the period from 9:00 a.m. until 9:30 a.m. During this time period, the power generated at these buses is only 3 to 5 kW more than the power generated at other buses. Similarly, from 12:30 p.m. until 1:25 p.m. the EVs only connected to SB 01 and SB 05 are charging, while the others are already fully charged. During this time, the PV power output for the buses with connected EVs is only a little more than the other buses. The voltage profiles of the EVs charging points are shown in Figure 23. Note that the voltages of the buses decrease when the EVs start charging, this happens because of the instantaneous increase in the load.
Table 4 shows the overall PV energy produced in a day at the secondary buses of Node-7 and Node-10 when the EVs are being charged. It can be seen that the daily energy production has been increased when there is extra load connected in the system (see Table 3 and Table 4). In fact, the system voltages drop when more load is connected which allows the PVs to generate relatively more power. These results indicate that the proposed controller successfully balances the trade-off between high penetration of renewable energy and fair power curtailment, so that the voltages remain within the allowable range as defined by ANSI C84.1-2016 standard.
6. Conclusions
This paper proposes a local voltage regulation control scheme for distributed solar PVs connected in the secondary network of the distribution system. The proposed technique is aimed at fairly controlling the power injections of all the PVs without the need of any communication infrastructure. The proposed machine-learning based controller uses two local measurements as inputs, namely, the nodal voltage and its sensitivity, to determine the PV power output. The performance of the proposed controller is validated in a PV-rich MV/LV test distribution system. Even though the controllers in the system work independently, they fairly controlled the power injections of all the PVs to keep the network voltages in an acceptable range. The distinctiveness of the proposed technique is highlighted by comparing a few other communication-free controllers as presented in the previously published literature. In addition, the robustness of the controller is verified by considering a cloudy day. In addition, the electric vehicles (EVs) are integrated into the secondary distribution system to further confirm the efficacy of the proposed controller in the future distribution systems.
The contributions of the proposed approach are evident since the machine learning-based controller is relatively inexpensive yet easy to deploy solution, which only requires the local voltage measurements at the point of connection. Additionally, this method is computationally fast because of the minimal hardware requirement and there are no communication delays. The fast computational time ensures the suitability of the approach for solving real-time voltage problems.
Author Contributions
Conceptualization, S.S. (Shabib Shahid), S.S. (Saifullah Shafiq) and A.T.A.-A.; methodology, S.S. (Shabib Shahid), S.S. (Saifullah Shafiq) and B.K.; software, A.T.A.-A.; validation, S.S. (Saifullah Shafiq), B.K. and A.T.A.-A.; formal analysis, S.S. (Shabib Shahid) and S.S. (Saifullah Shafiq); investigation, A.T.A.-A.; resources, A.T.A.-A.; data curation, S.S. (Shabib Shahid) and B.K.; writing—original draft preparation, S.S. (Shabib Shahid), S.S. (Saifullah Shafiq), B.K. and M.O.B.; writing—review and editing, S.S. (Shabib Shahid) and S.S. (Saifullah Shafiq); visualization, S.S. (Shabib Shahid), B.K. and M.O.B.; supervision, A.T.A.-A.; project administration, S.S. (Saifullah Shafiq) and M.O.B.; funding acquisition, S.S. (Saifullah Shafiq) and M.O.B. All authors have read and agreed to the published version of the manuscript.
Funding
This research received no external funding.
Institutional Review Board Statement
Not applicable.
Informed Consent Statement
Not applicable.
Acknowledgments
The authors would like to acknowledge the support provided by World Futures Studies Federation (WFSF), Prince Mohammad Bin Fahd University (PMU), Prince Mohammad Bin Fahd Center for Futuristic Studies (PMFCFS), Khobar, Saudi Arabia.
Conflicts of Interest
The authors declare no conflict of interest.
References
- Farag, H.E.; Abdelaziz, M.; El-Saadany, E.F. Voltage and Reactive Power Impacts on Successful Operation of Islanded Microgrids. IEEE Trans. Power Syst. 2012, 28, 1716–1727. [Google Scholar] [CrossRef]
- Khalid, M.; Akram, U.; Shafiq, S. Optimal Planning of Multiple Distributed Generating Units and Storage in Active Distribution Networks. IEEE Access 2018, 6, 55234–55244. [Google Scholar] [CrossRef]
- Khatamianfar, A.; Khalid, M.; Savkin, A.V.; Agelidis, V.G. Improving Wind Farm Dispatch in the Australian Electricity Market with Battery Energy Storage Using Model Predictive Control. IEEE Trans. Sustain. Energy 2013, 4, 745–755. [Google Scholar] [CrossRef]
- Shafiq, S.; Al-Awami, A.T. Reliability and economic assessment of renewable micro-grid with V2G electric vehicles coordination. In Proceedings of the 2015 IEEE Jordan Conference on Applied Electrical Engineering and Computing Technologies (AEECT), Amman, Jordan, 3–5 November 2015; pp. 1–6. [Google Scholar] [CrossRef]
- Khalid, M.; Ahmadi, A.; Savkin, A.V.; Agelidis, V.G. Minimizing the energy cost for microgrids integrated with renewable energy resources and conventional generation using controlled battery energy storage. Renew. Energy 2016, 97, 646–655. [Google Scholar] [CrossRef]
- Akram, U.; Khalid, M. A Coordinated Frequency Regulation Framework Based on Hybrid Battery-Ultracapacitor Energy Storage Technologies. IEEE Access 2018, 6, 7310–7320. [Google Scholar] [CrossRef]
- Walling, R.A.; Saint, R.; Dugan, R.C.; Burke, J.; Kojovic, L.A. Summary of Distributed Resources Impact on Power Delivery Systems. IEEE Trans. Power Deliv. 2008, 23, 1636–1644. [Google Scholar] [CrossRef]
- Ochoa, L.F.; Dent, C.J.; Harrison, G.P. Distribution network capacity assessment: Variable DG and active networks. IEEE Trans. Power Syst. 2010, 25, 87–95. [Google Scholar] [CrossRef] [Green Version]
- Gowid, S.; Massoud, A. A robust experimental-based artificial neural network approach for photovoltaic maximum power point identification considering electrical, thermal and meteorological impact. Alex. Eng. J. 2020, 59, 3699–3707. [Google Scholar] [CrossRef]
- Shafiq, S.; Khan, B.; Raussi, P.; Al-Awami, A.T. A novel communication-free charge controller for electric vehicles using machine learning. IET Smart Grid 2021, 4, 334–345. [Google Scholar] [CrossRef]
- Sun, Y.; Li, S.; Lin, B.; Fu, X.; Ramezani, M.; Jaithwa, I. Artificial Neural Network for Control and Grid Integration of Residential Solar Photovoltaic Systems. IEEE Trans. Sustain. Energy 2017, 8, 1484–1495. [Google Scholar] [CrossRef]
- Arora, A.; Singh, A. Design and implementation of Legendre-based neural network controller in grid-connected PV systems. IET Renew. Power Gener. 2019, 13, 2783–2792. [Google Scholar] [CrossRef]
- Alnaser, S.; Ochoa, L. Advanced Network Management Systems: A Risk-Based AC OPF Approach. IEEE Trans. Power Syst. 2015, 30, 409–418. [Google Scholar] [CrossRef] [Green Version]
- Sansawatt, T.; Ochoa, L.; Harrison, G. Smart Decentralized Control of DG for Voltage and Thermal Constraint Management. IEEE Trans. Power Syst. 2012, 27, 1637–1645. [Google Scholar] [CrossRef]
- Olivier, F.; Aristidou, P.; Ernst, D.; Van Cutsem, T. Active management of low-voltage networks for mitigating over voltages due to photovoltaic units. IEEE Trans. Smart Grid 2016, 7, 926–936. [Google Scholar] [CrossRef] [Green Version]
- Donkers, M.C.F.; Heemels, W.P.M.H.; Bernardini, D.; Bemporad, A.; Shneer, V. Stability analysis of stochastic networked control systems. Automatica 2012, 48, 917–925. [Google Scholar] [CrossRef]
- Yue, D.; Han, Q.; Lam, J. Network-based robust HŒ control of systems with uncertainty. Automatica 2005, 41, 999–1007. [Google Scholar] [CrossRef]
- Shafiq, S.; Al-Awami, A.T. A Novel Communication-Free Charge Controller for Electric Vehicles. In Proceedings of the 2018 IEEE Industry Applications Society Annual Meeting (IAS), Portland, OR, USA, 23–27 September 2018; pp. 1–6. [Google Scholar]
- Vovos, P.N.; Kiprakis, A.; Wallace, A.R.; Harrison, G. Centralized and Distributed Voltage Control: Impact on Distributed Generation Penetration. IEEE Trans. Power Syst. 2007, 22, 476–483. [Google Scholar] [CrossRef] [Green Version]
- Shafiq, S.; Al-Awami, A.T. An Autonomous Charge Controller for Electric Vehicles Using Online Sensitivity Estimation. IEEE Trans. Ind. Appl. 2020, 56, 22–33. [Google Scholar] [CrossRef]
- Zhang, Z.; Ochoa, L.F.; Valverde, G. A Novel Voltage Sensitivity Approach for the Decentralized Control of DG Plants. IEEE Trans. Power Syst. 2018, 33, 1566–1576. [Google Scholar] [CrossRef] [Green Version]
- Seal, B. Common Functions for Smart Inverters, 4th ed.; Tech. Rep. 3002008217; EPRI: Palo Alto, CA, USA, December 2016. [Google Scholar]
- O’Connell, A.; Keane, A. Volt–var curves for photovoltaic inverters in distribution systems. IET Gener. Transm. Distrib. 2017, 11, 730–739. [Google Scholar] [CrossRef]
- Antoniadou-Plytaria, K.E.; Kouveliotis-Lysikatos, I.N.; Georgilakis, P.S.; Hatziargyriou, N.D. Distributed and Decentralized Voltage Control of Smart Distribution Networks: Models, Methods, and Future Research. IEEE Trans. Smart Grid 2017, 8, 2999–3008. [Google Scholar] [CrossRef]
- IEEE Standard for Interconnecting Distributed Resources with Electric Power Systems—Amendment 1; IEEE Standard 1547a; IEEE: Piscataway, NJ, USA, May 2014.
- Shafiq, S.; Khan, B.; Al-Awami, A.T. An Autonomous DG Controller Using Artificial Intelligence Approach for Voltage Control. In Proceedings of the 2020 2nd International Conference on Smart Power & Internet Energy Systems (SPIES), Bangkok, Thailand, 15–18 September 2020; pp. 446–451. [Google Scholar]
- American National Standard for Electrical Power Systems and Equipment—Voltage Ratings (60 Hertz); ANSI Std. C84.1-2020; National Electrical Manufacturers Association: Arlington, VA, USA, 2020.
- Jin, L.; Kuang, X.; Huang, H.; Qin, Z.; Wang, Y. Study on the Overfitting of the Artificial Neural Network Forecasting Model. J. Meteorol. Res. 2005, 19, 216–225. [Google Scholar]
- Al-Awami, A.T.; Sortomme, E.; Akhtar, G.M.A.; Faddel, S. A Voltage-Based Controller for an Electric-Vehicle Charger. IEEE Trans. Veh. Technol. 2015, 65, 4185–4196. [Google Scholar] [CrossRef]
- Wiczynski, G. Analysis of Voltage Fluctuations in Power Networks. IEEE Trans. Instrum. Meas. 2008, 57, 2655–2664. [Google Scholar] [CrossRef]
- Tonkoski, R.; Lopes, L.A.C.; El-Fouly, T. Coordinated Active Power Curtailment of Grid Connected PV Inverters for Overvoltage Prevention. IEEE Trans. Sustain. Energy 2010, 2, 139–147. [Google Scholar] [CrossRef]
- Nissan. Leaf Specs. Available online: https://www.nissan.co.uk/vehicles/new-vehicles/leaf/range-charging.html (accessed on 15 January 2021).
Figure 1.
Flow chart brief overview.

Figure 2.
Flow chart for determining PGcap for different system loads.

Figure 3.
Example distribution system.

Figure 4.
Voltage and sensitivities in extreme conditions.

Figure 5.
Controller response in extreme conditions.

Figure 6.
Test primary distribution system.

Figure 7.
Secondary distribution network topology.

Figure 8.
Relationship between inputs and the output.

Figure 9.
A typical load profile.

Figure 10.
No PV system voltage profiles at (a) Node-7, (b) Node-10.

Figure 11.
Real power available from the PV systems without controllers.

Figure 12.
Base case voltage profile at (a) Node-7, (b) Node-10.

Figure 13.
On-off case voltage profile at (a) Node-7, (b) Node-10.

Figure 14.
On-off case output power generated at (a) Node-7, (b) Node-10.

Figure 15.
Droop-based controller voltage profile at (a) Node-7, (b) Node-10.

Figure 16.
Droop-based controller power generated at (a) Node-7, (b) Node-10.4.5. Proposed voltage-and-sensitivity-based controller.
Figure 16.
Droop-based controller power generated at (a) Node-7, (b) Node-10.4.5. Proposed voltage-and-sensitivity-based controller.

Figure 17.
Proposed controller voltage profile at (a) Node-7, (b) Node-10.

Figure 18.
Proposed controller power generated at (a) Node-7, (b) Node-10.

Figure 19.
Voltage profiles in a cloudy day at (a) Node-7, (b) Node-10.

Figure 20.
Power generation profiles in a cloudy day at (a) Node-7, (b) Node-10.

Figure 21.
State of charge of EVs connected at secondaries of Node-10.

Figure 22.
Power output comparison, with EVs charging at different times.

Figure 23.
Voltage profiles at EV connection points.


Table 1.
Primary and secondary distribution system parameters.
| Parameter | Value |
|---|---|
| Primary conductor | ACSR 2 |
| Max. current for primary conductors | 180 A |
| Distribution service transformer | 150 kVA |
| Secondary conductor | 350 Al, 4/0 |
| No. of customers per node | 5 |
| PV capacity per secondary bus | 140 kW |
| System frequency | 60 Hz |
Table 2.
Comparison of daily energy production (kWh).
| Control Mode | P * | SB 02 | SB 03 | SB 04 | SB 05 |
|---|---|---|---|---|---|
| Droop-based | D | 1090 | 1077 | 940 | 847 |
| U | 1086 | 1079 | 948 | 850 | |
| Proposed | D | 937 | 936 | 932 | 933 |
| U | 935 | 938 | 935 | 931 |
* P represents the primary node, whereas D and U represent downstream node (i.e., Node-7) and upstream node (i.e., Node-10), respectively.
Table 3.
Comparison of controller performances.
| Control Mode | P * | Energy Produced in a Day (kWh) | % Energy Curtailed | Fairness Addressed? | Maximum Voltage (p.u.) | Duration of Voltage Violations (Minutes) | Voltage Acceptable? | ||||
|---|---|---|---|---|---|---|---|---|---|---|---|
| Total (%) | SB 02 | SB 03 | SB 04 | SB 05 | |||||||
| Uncontrolled | D | 4198 | - | - | - | - | - | Yes | 1.067 | 286.5 | No |
| U | 4198 | - | - | - | - | - | 1.069 | 286.5 | |||
| On-Off | D | 4082.5 | 2.75 | 0 | 0 | 0.31 | 2.44 | No | 1.052 | 0.333 | Yes |
| U | 4094.7 | 2.46 | 0 | 0 | 0.16 | 2.30 | 1.052 | 0.333 | |||
| Droop-based | D | 3954.1 | 5.81 | 0 | 0.14 | 2.03 | 3.64 | No | 1.046 | 0 | Yes |
| U | 3963.7 | 5.58 | 0 | 0.08 | 1.90 | 3.60 | 1.045 | 0 | |||
| Proposed | D | 3737.9 | 10.96 | 2.70 | 2.72 | 2.78 | 2.76 | Yes | 1.051 | 19.167 | Yes |
| U | 3739.2 | 10.93 | 2.72 | 2.69 | 2.73 | 2.79 | 1.052 | 19.167 | |||
* P represents the primary node, whereas D and U represent downstream node (i.e., Node-7) and upstream node (i.e., Node-10), respectively. The bus will be reported as a high voltage violation if the voltage exceeds 1.05 p.u. % Energy curtailed is calculated using energy produced in uncontrolled case.
Table 4.
Energy produced in a day with EV charging from 30% to 100% (kWh).
| Scenarios | P * | SB 02 | SB 03 | SB 04 | SB 05 | Total |
|---|---|---|---|---|---|---|
| EVs not charging | D | 937 | 936 | 932 | 933 | 3738 |
| U | 935 | 938 | 935 | 931 | 3739 | |
| EVs charging during day | D | 953 | 962 | 955 | 957 | 3827 |
| U | 953 | 962 | 955 | 957 | 3827 |
* P represents the primary node, whereas D and U represent downstream node (i.e., Node-7) and upstream node (i.e., Node-10), respectively.
Publisher’s Note: MDPI stays neutral with regard to jurisdictional claims in published maps and institutional affiliations. |
© 2021 by the authors. Licensee MDPI, Basel, Switzerland. This article is an open access article distributed under the terms and conditions of the Creative Commons Attribution (CC BY) license (https://creativecommons.org/licenses/by/4.0/).
Share and Cite
MDPI and ACS Style
Shahid, S.; Shafiq, S.; Khan, B.; Al-Awami, A.T.; Butt, M.O. A Machine Learning-Based Communication-Free PV Controller for Voltage Regulation. Sustainability 2021, 13, 12208. https://0-doi-org.brum.beds.ac.uk/10.3390/su132112208
AMA Style
Shahid S, Shafiq S, Khan B, Al-Awami AT, Butt MO. A Machine Learning-Based Communication-Free PV Controller for Voltage Regulation. Sustainability. 2021; 13(21):12208. https://0-doi-org.brum.beds.ac.uk/10.3390/su132112208
Chicago/Turabian StyleShahid, Shabib, Saifullah Shafiq, Bilal Khan, Ali T. Al-Awami, and Muhammad Omair Butt. 2021. "A Machine Learning-Based Communication-Free PV Controller for Voltage Regulation" Sustainability 13, no. 21: 12208. https://0-doi-org.brum.beds.ac.uk/10.3390/su132112208
Note that from the first issue of 2016, this journal uses article numbers instead of page numbers. See further details here.