
Analysis of the Impact of Input Data on the Planned Costs of Building Maintenance


Faculty of Civil Engineering, Cracow University of Technology, 31-155 Cracow, Poland
*
Author to whom correspondence should be addressed.
Sustainability 2021, 13(21), 12220; https://0-doi-org.brum.beds.ac.uk/10.3390/su132112220
Submission received: 8 September 2021
/
Revised: 31 October 2021
/
Accepted: 3 November 2021
/
Published: 5 November 2021
(This article belongs to the Special Issue Architectural, Civil, and Infrastructure Engineering in View of Sustainability)
Abstract
:The aim of the article is to analyze the method of determining the maintenance costs of buildings based on the method proposed in Polish legal regulations. The analysis of the sensitivity of the method shows that the assumed number of product use cycles during the calculation period has the greatest impact, while the adopted warranty period has the lowest impact. A multi-functional building combining housing, office, service and commercial was analyzed in order to obtain a broader picture of the model’s operation. The results of the analyses allow us to conclude that despite the higher price of materials, the most durable solutions, which are the most expensive to purchase, turn out to be the most advantageous in the entire life cycle of the building. The method proposed in Polish law regulations has certain limitations. In order to level them, it was proposed to extend the method by using NPV (Net Present Value) for calculations and extending the life cycle of the building to 80 years.
1. Introduction
The costs associated with a construction object are influenced by many factors. In the broadest scope, these costs are captured as LCC—Life Cycle Costs.
Life cycle costing interests EU bodies. The EU document regulating the application of the idea of life cycle costs is the Directive 2014/24/UE of the European Parliament and the Council of 26th February 2014 on public procurement and repealing [1]. Article 67 of the Directive concerning criteria states that the most economically advantageous tender from the point of view of the contracting authority is determined based on the price or cost, using a cost-effectiveness approach such as life cycle costing in art. 68. Article 68 indicates that life cycle costing in an appropriate range shall cover some or all of the following costs during the life cycle of a product, service, or works:
- (a)
- Costs incurred by the contracting authority or other users, such as:
- Acquisition-related costs;
- Costs of use, such as consumption of energy and other resources;
- Maintenance costs;
- End-of-life costs, such as demolition and recycling costs;
- (b)
- Costs attributed to environmental externalities associated with a product, service or work over their life cycle, provided that their monetary value can be determined and verified; such costs may include greenhouse gas and other pollutant emission costs and other climate change mitigation costs.
According to the Directive, when contracting authorities estimate costs using a life cycle costing approach, they specify in the procurement documents the data that bidders should provide and the method that the contracting authority will use to determine the life-cycle costs based on these data.
There are various forms of implementation of the Directive in the European Union countries. In reference to the EU provisions, provisions regarding the calculation of life cycle costs have been included in the Polish Public Procurement Law (PPL). As a consequence of the provisions of the Public Procurement Law, on 13 July 2018, the Regulation of the Minister of Investment and Development of 11 July 2018, on the method of calculating the life cycle costs of buildings and the method of presenting information on these costs was published [2].
One of the components of life cycle costs, which are particularly difficult to determine, are the costs incurred during the operation of the building, in particular the costs of building maintenance. They are related to the natural process of decreasing the utility value of an object over time and the need to carry out construction works that restore the technical and functional features of construction objects [3].
The article analyzes the calculation of some chosen building maintenance costs (i.e., windows, doors, roofing and flooring) based on the method proposed in the regulation. The purpose of this paper was the attempt of finding weaknesses in the regulation method based on calculations given for some chosen products. The second authors’ goal was the implementation of some novelties which possibly could be useful in broadening the models’ implication possibilities. The influence of the input data on the results was analyzed, and the possibility of extending the method by NPV calculation as well as the calculation period extension up to 80 years.
2. Literature Summary
Proper maintenance of the building aims to ensure that it is maintained in a good technical and aesthetic condition throughout the entire life cycle of the building. For this purpose, the building owner/facility manager undertakes a number of activities, mainly consisting of the maintenance and repair of individual building elements.
The owner of the building, apart from the obligatory activities related to maintaining the proper technical condition of the building, resulting from the applicable regulations, has a choice of many options for repairing and improving the standard of the building. Each of them is associated with the corresponding costs. Therefore, one of the basic issues affecting the costs incurred at the operational stage of the facility is defining the building maintenance strategy.
The ISO standard 15686-5:2017 Buildings and constructed assets –Service life planning Part 5: life cycle costing [4] and standard EN 13306:2017-Maintenance-Maintenance terminology characterizes [5] synthetically two main types of maintenance. The first of the given strategies is called preventive maintenance, and the next one is called corrective maintenance. In the literature [6,7,8,9], other variants with a wider range of maintenance types can be found.
Making decisions regarding the maintenance of buildings requires taking into consideration many factors. Therefore, this problem is often solved using MCDM (Multiple Criteria Decision Making) methods [10,11,12,13,14,15,16,17,18]. Peach and Visser [19] analyze the problem of including human factors in maintenance. Much of the articles are devoted to the proper planning schedule repairs [20,21,22].
There are many attempts in the literature to develop models that would estimate the cost of building maintenance. Kim et al. [23] propose a model that determines the maintenance and repair costs by means of a statistical analysis of actual cost data. The authors conducted a study of maintenance and repair expenses in educational establishments to determine key performance indicators (KPIs) and to develop an integrated facility management cost estimation model. The study used a multiple regression analysis method to generate a model for determining maintenance and repair costs.
The authors also used the example of a university. Farahani et al. [24], to investigate the problem, presented a case study on the maintenance phase of four university buildings on the campus of the National Taiwan University. Using historical data on maintenance and repair over 42 years, a life cycle cost prediction (LCC) model was determined using three different methods: simple linear regression (SLR), multiple regression (MR), and finally, backpropagation artificial neural network (BNP). In [25], the benefits of proper monitoring of the building’s condition on the example of roofing material have been presented.
The proposed models for determining the maintenance costs of building objects use both a simple and a complex mathematical apparatus. A brief overview of simple models supporting the estimation of the budget for maintenance of buildings we can find, for instance, in [26]. The slightly more complex models include the one developed by Kwon et al. [27] based on case-based reasoning and genetic algorithm. Fregonara and Ferrando [28] developed the Stochastic Annuity Method for Supporting Maintenance Costs Planning. Determining the costs of building maintenance is often based on incomplete and imprecise data, which is well represented by fuzzy sets and neural networks [29,30,31,32]. Models in this area also often capture the risk [33]. There have also been attempts to use BIM technology to solve this problem [34,35,36,37].
3. Calculation of Maintenance Costs in Accordance to Polish Regulations
One of the options for calculating the building maintenance costs is presented in the Regulation of the Minister of Investment and Development of 11 July 2018, on the method of calculating the life cycle costs of buildings and the method of presenting information on these costs. This regulation is based on the Directive 2014/24/EU. According to the ordinance, the life cycle costs of a building are calculated as the sum of the costs of purchasing, using and maintaining a building according to the formula:
where: Cg—life cycle costs during a 30-year life cycle of the building, called “calculation period”, Cn—acquisition costs, defined based on the offer price, Cuz—costs of use, Cut—maintenance costs.
The cost of maintenance included in Formula (1) is primarily the costs of repairs and ongoing maintenance, which allow the building to maintain in a proper technical and aesthetic condition.
These costs should be calculated according to the formula:
where: i—every further product, Ai—maintenance cost of ith product in the calculation period, Bi—producers’ warranty value of the ith product.
Maintenance costs of the ith product:
where: I—number of product units, K—cost of replacement of the product unit, N—number of product use cycles during the calculation period.
Producers’ warranty value of the ith product:
where: Og—warranty period of the ith product given in years.
According to the regulation, the calculation of the life cycle cost of the building is calculated as the sum of the costs of acquisition, use and maintenance. Thirty years of building life is adopted as a calculation period. The cost of maintenance is calculated as the sum of the unit cost of maintaining products during the calculation period reduced by the contractor’s guarantee value for a given product. The unit costs of maintaining products are designated as the multiplication of the number of individual units, the costs of replacing the product unit, and the number of product use cycles during the calculation period.
In accordance with the regulation, the contracting authority specifies, among others, types of products taken into account in determining the maintenance costs paying attention to their impact on the functioning of the building and the estimated cost of products including assembly. Products listed in the regulation are: windows; doors; flooring; installations (plumbing, gas, electricity, air conditioning, etc.); elevators; façade; roofing and other products recognized by the contracting authority as valid.
The product use cycle is the period after which the product should be replaced. When specifying the number of life cycles of the product, not only the physical life of the product may be taken into consideration but also its expectations related to the need for its more frequent or rare exchange due to the nature of the building. The number of use cycles for products specifies the Annex to the Regulation. For most products, a cycle varies between 1–3 but, for example, for PVC panels floors 3–5 cycles; for roofing 2–4 cycles.
The contractor determines the product warranty period. It can apply to the whole product (e.g., a whole window or its elements; for example, a warranty for the profile is 5 years, and for the whole window only 3 years).
4. Model Sensitivity Analysis
The basic data to be assumed for the calculation of maintenance costs are therefore: I—number of product units, K—cost of replacement of the product unit, N—number of product use cycles during the calculation period as well as Og—warranty period of the ith product given in years. The authors decided to perform a simple sensitivity analysis. It shows how the adopted data influence the final results.
The following data were assumed:
- I = 2500 m2;
- K = 200 EUR;
- N = 2;
- Og = 3 years.
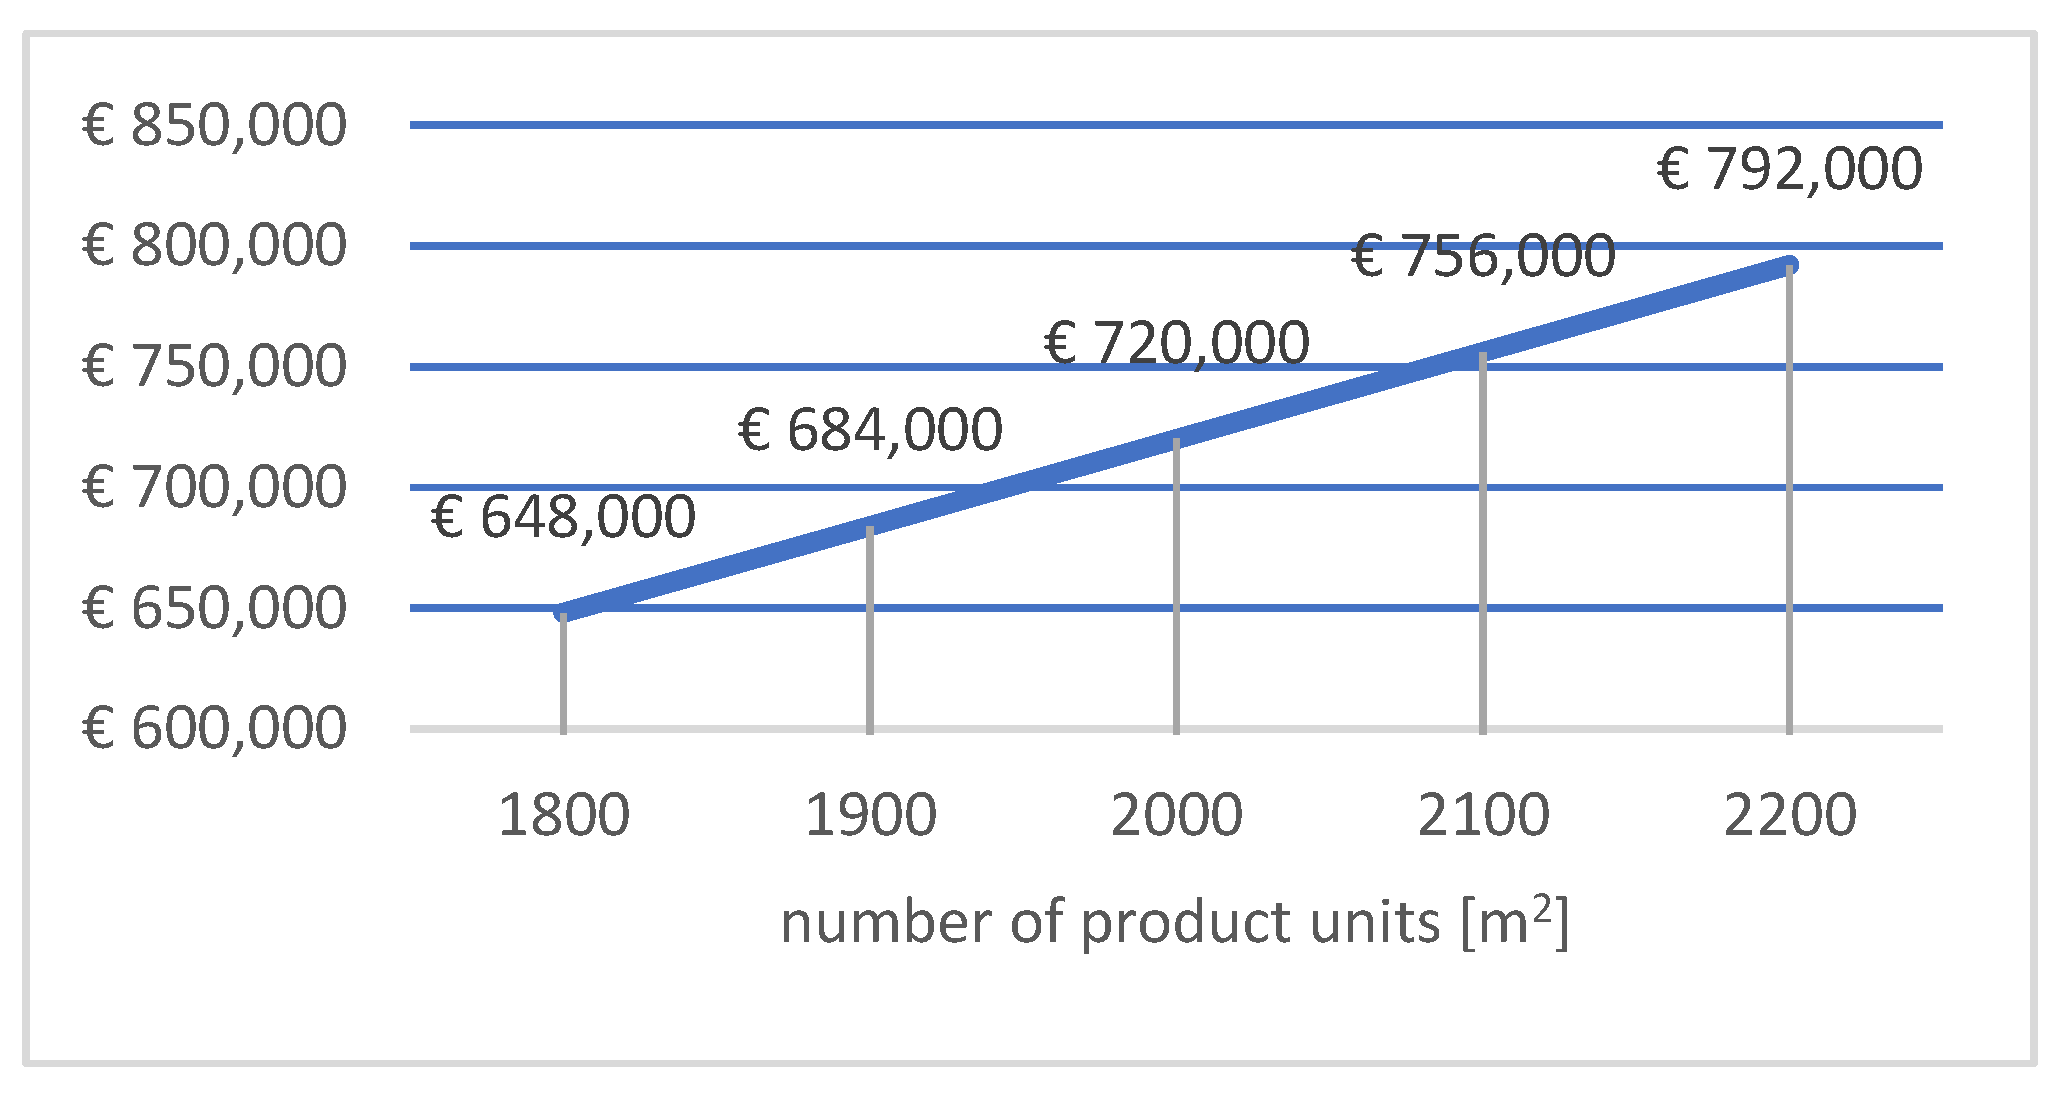
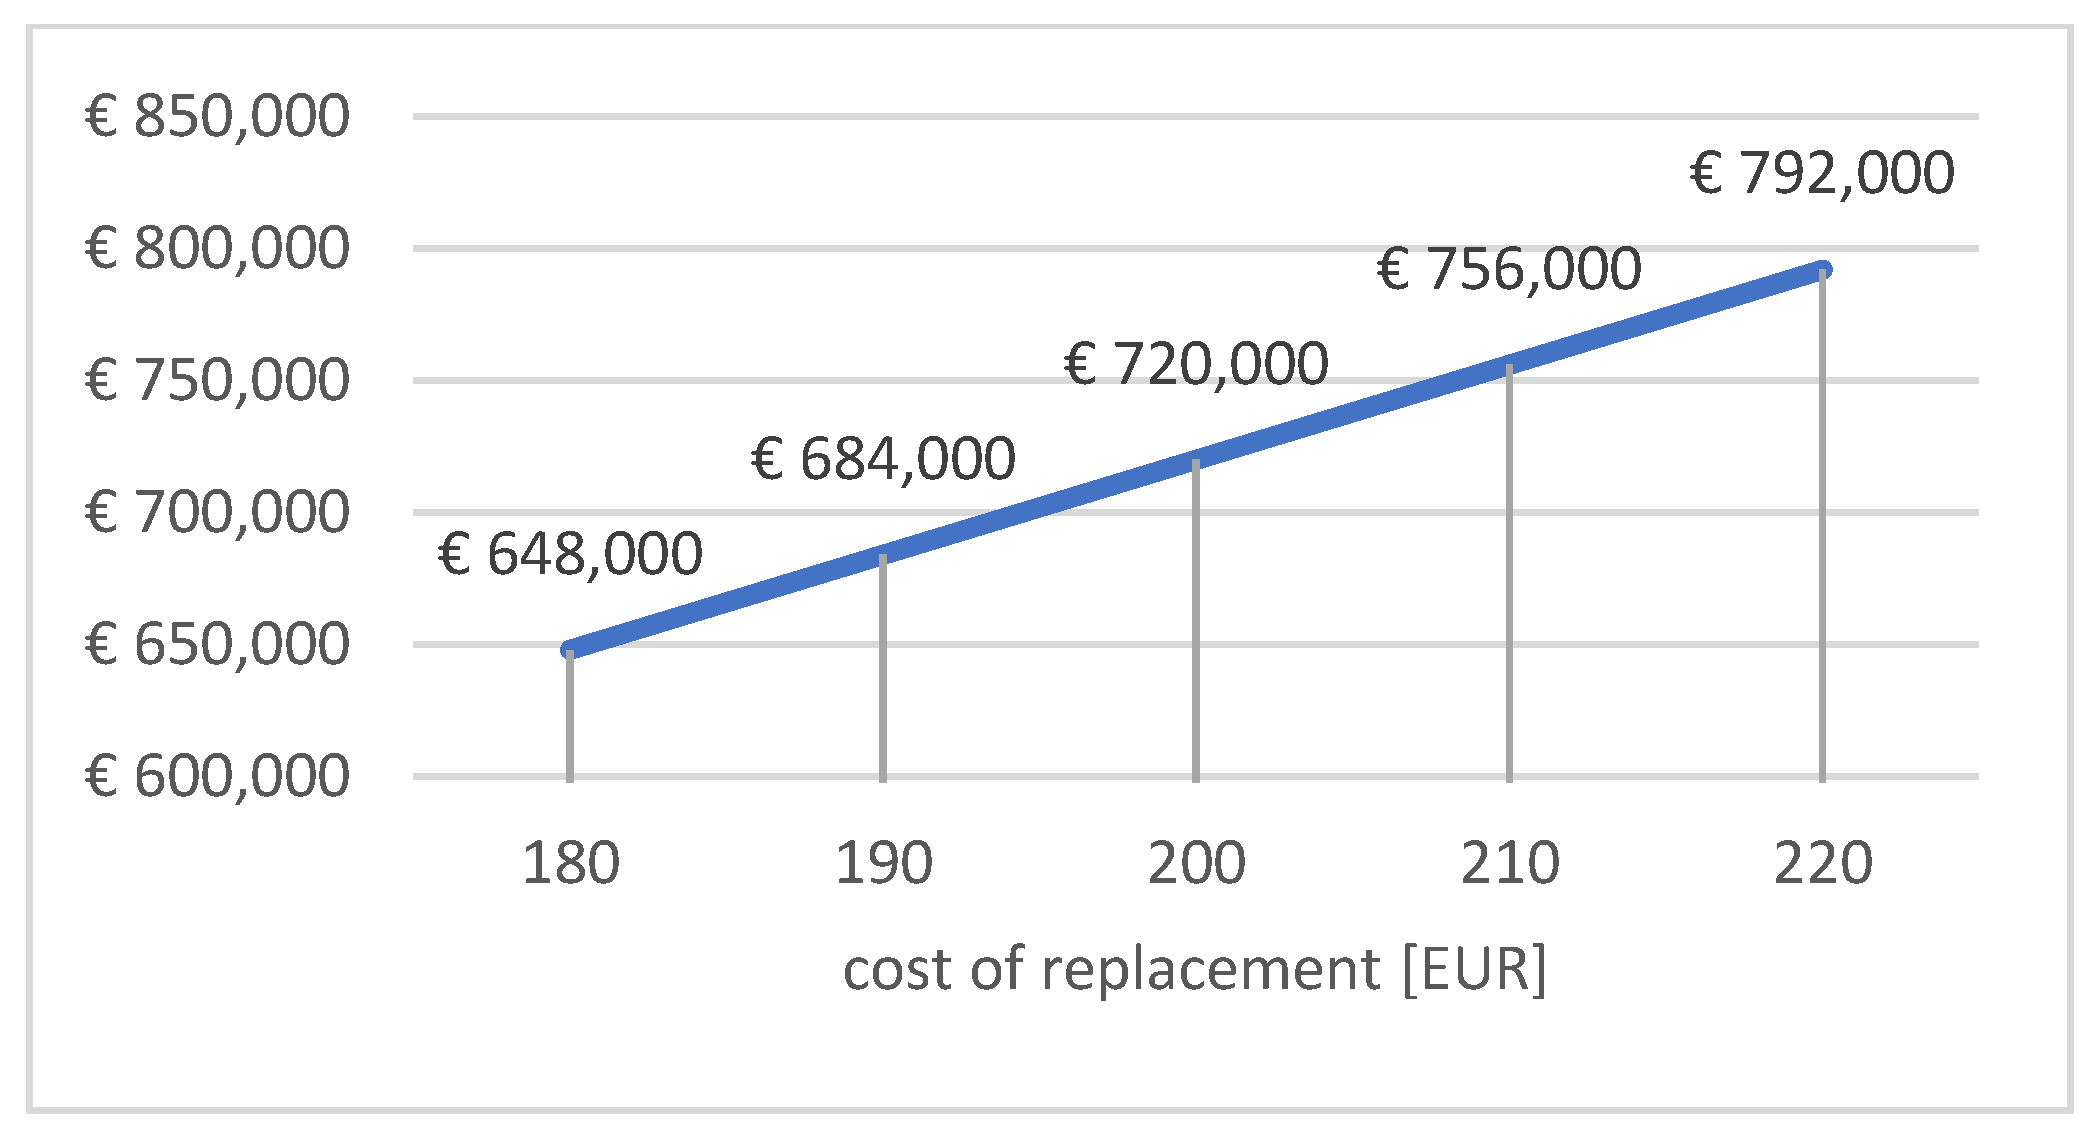
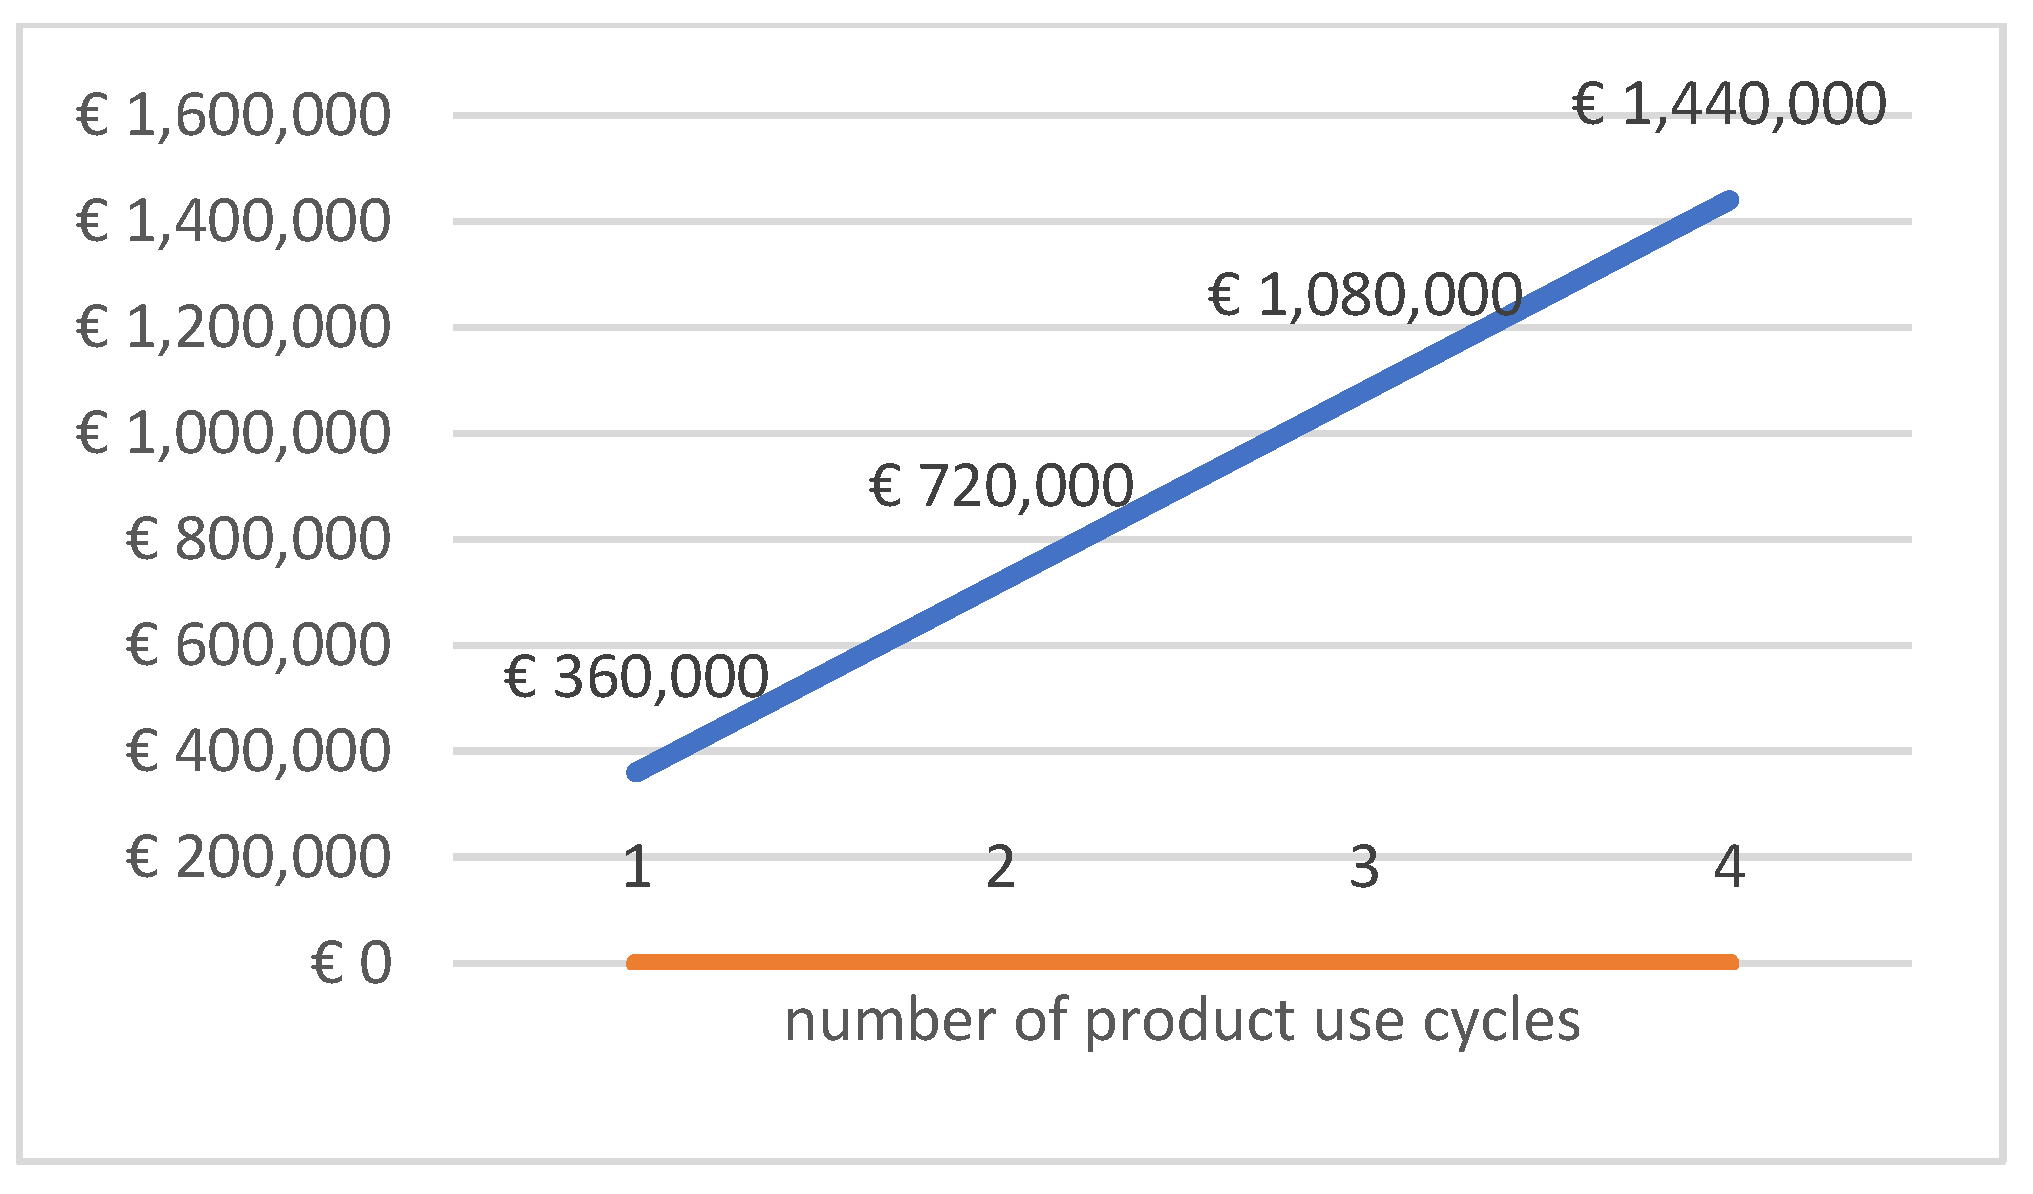
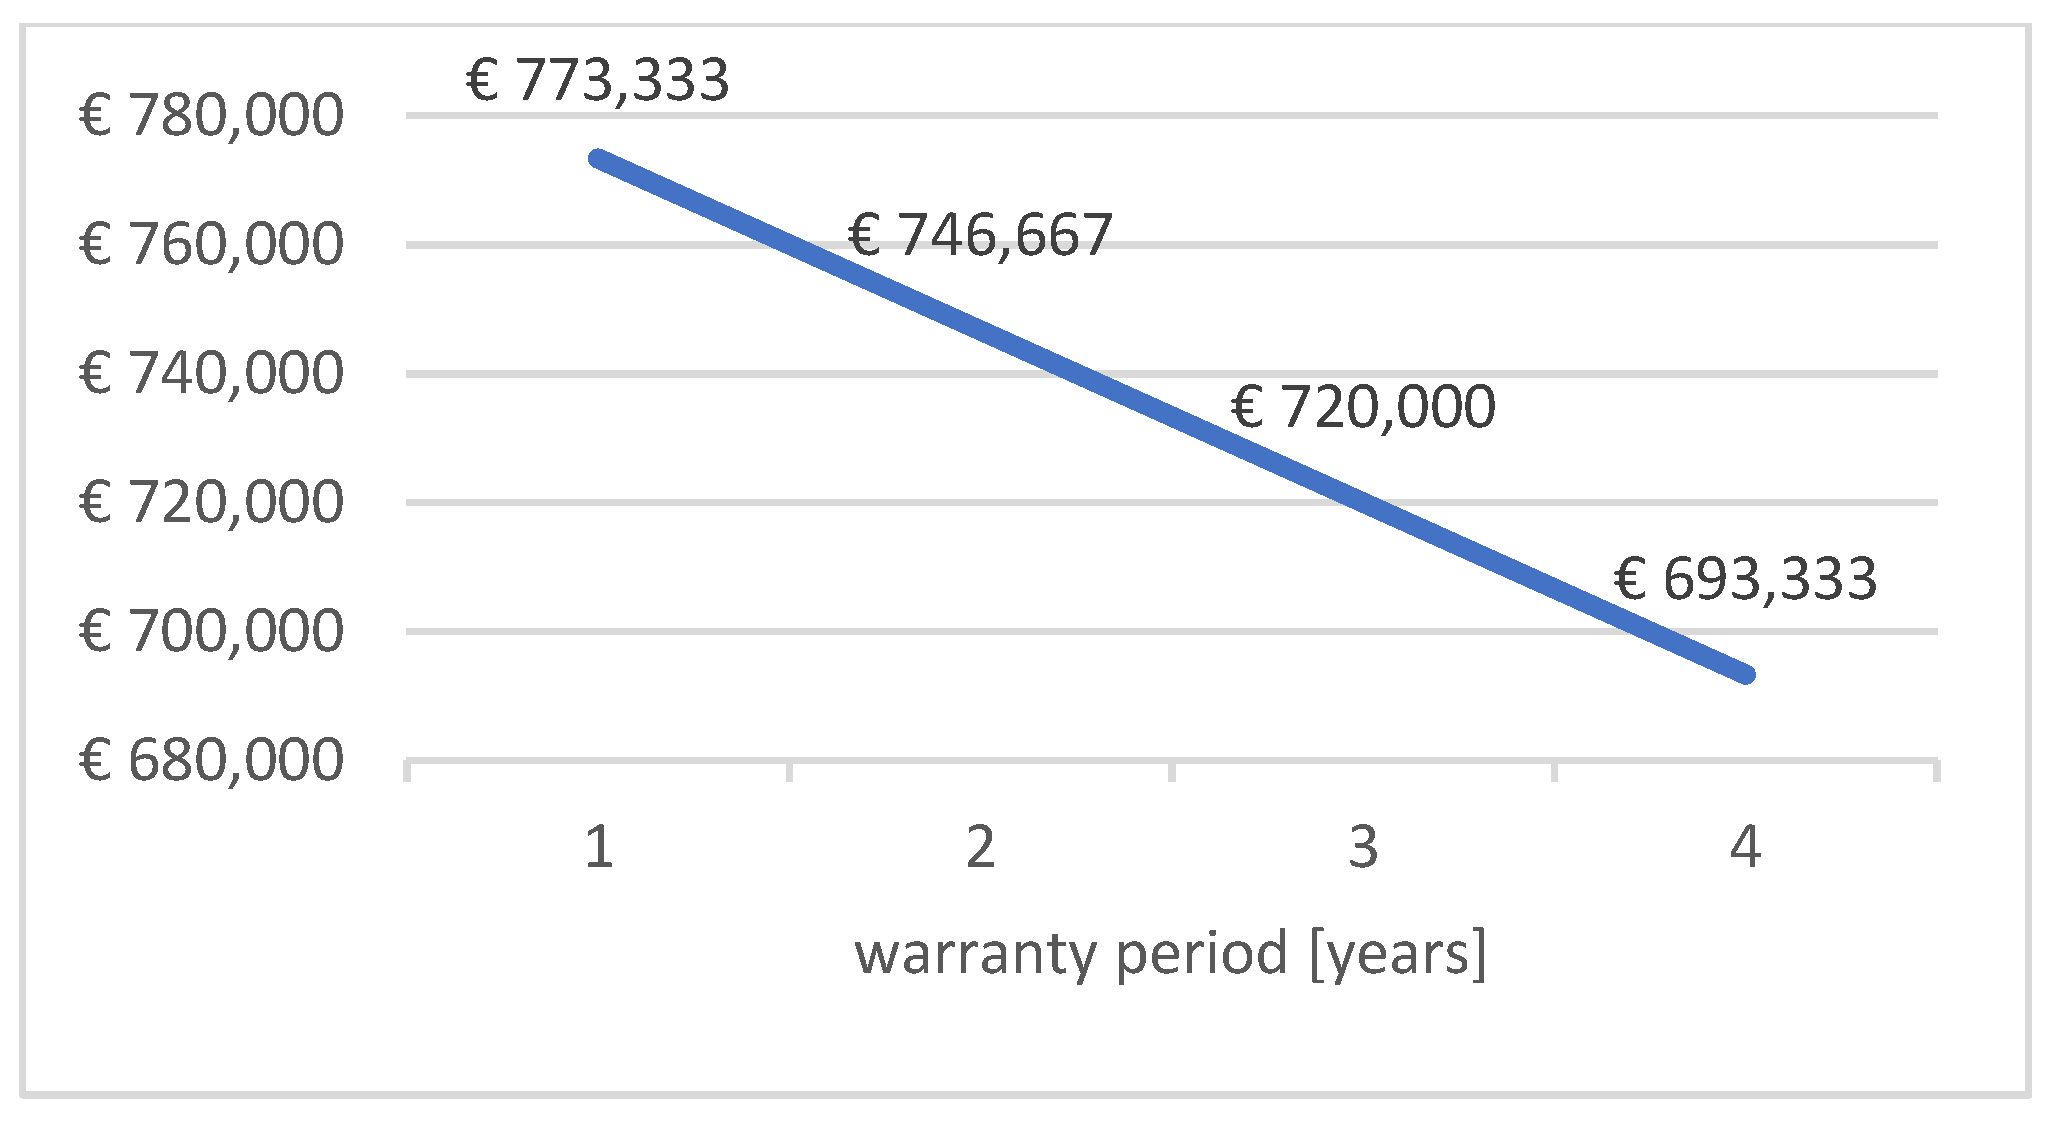
In the following variants, one of the input data (independent variable) was changed, the remaining data were taken as constants, and its influence on the obtained Cut values (dependent variable) was examined. The scope of the adopted variables and the final results are presented in Table 1. The obtained results in each variant are presented in the charts shown in Figure 1, Figure 2, Figure 3 and Figure 4.
The presented results of the sensitivity analysis show that the influence of all variables is linear. The variable N has the greatest impact. Increasing it by one cycle causes an increase in the value of the cost of living by about 25%. A change in the number of units of a product by 100 affects the end results as much as a change in the cost of replacing a unit by 10 EUR, which equals 5%. The adopted warranty period has the least impact. Extending the warranty period by 1 year reduces costs by less than 4%.
5. Model Analysis on the Example of A Multi-Functional Building
In real circumstances, dependencies in the analyzed formula, allowing the determination of maintenance costs, are more complex. For example, higher purchase costs and, at the same time, replacing a given element generate higher durability translating into a smaller number of exchange cycles and often also a longer warranty period provided by the manufacturer. It shall also be noted that the regulation does not consider the refurbishment of some items, such as, for instance, doors or windows, which require periodic maintenance to maintain their condition and operability. The formula limitations may arise from the fact that the model given in the regulation that is analyzed was designed only for a comparison of given offers and shall help in the decision of which offer is the best during public auctions.
In order to obtain a broader image of the model action, the building presented in BCO (Bulletin of Building Prices) for the first quarter of 2021, building 1122-407 on the name “Housing, office and service apartment building”, was chosen. The building has 15 stories with a 3-story underground garage. It is a multi-functional building combining housing and office functions located on the overground floors as well as service and commercial parts on the ground floor section. The property also has three underground floors where parking spaces in the garage space and technical infrastructure are located. The object is placed on a reinforced concrete foundation slab. Concrete monolithic structural walls (in the underground made in diaphragm wall technology) and all slabs are also reinforced, and monolithic concrete inverted flat roof is designed.
The analysis included four elements of the building, i.e., windows and external doors, internal doors, floors with terracotta and roofing. For each of the analyzed elements, the number of product use cycles was established during the calculation period, consistent with the compartment given in Annex 1 to the Regulation of the Minister of Investment and Development from 11 July 2018. Specified solutions were adopted for these elements, and the necessary data were established to determine the costs of living in accordance with the Regulation.
It must be noted that the analyses took into account only selected elements of the building that the contracting authority may take into account in the analysis of the maintenance costs. It is practically impossible to determine the total maintenance costs in accordance with the ordinance. As was already mentioned, the formula provided in the regulation takes into account only the cost of replacing building elements without taking into account the costs of their ongoing maintenance. For this reason, following the regulation, it is difficult to determine the maintenance costs of elements, such as pumps, elevators, HVAC equipment, escalators, lamps or water and fire devices. The assumption adopted in the regulation allows, for instance, for the inclusion of the maintenance costs of elevators, but only in the case of their replacement 1–3 times. In practice, such actions do not take place with a building’s 30-year life cycle.
5.1. Windows and External Doors
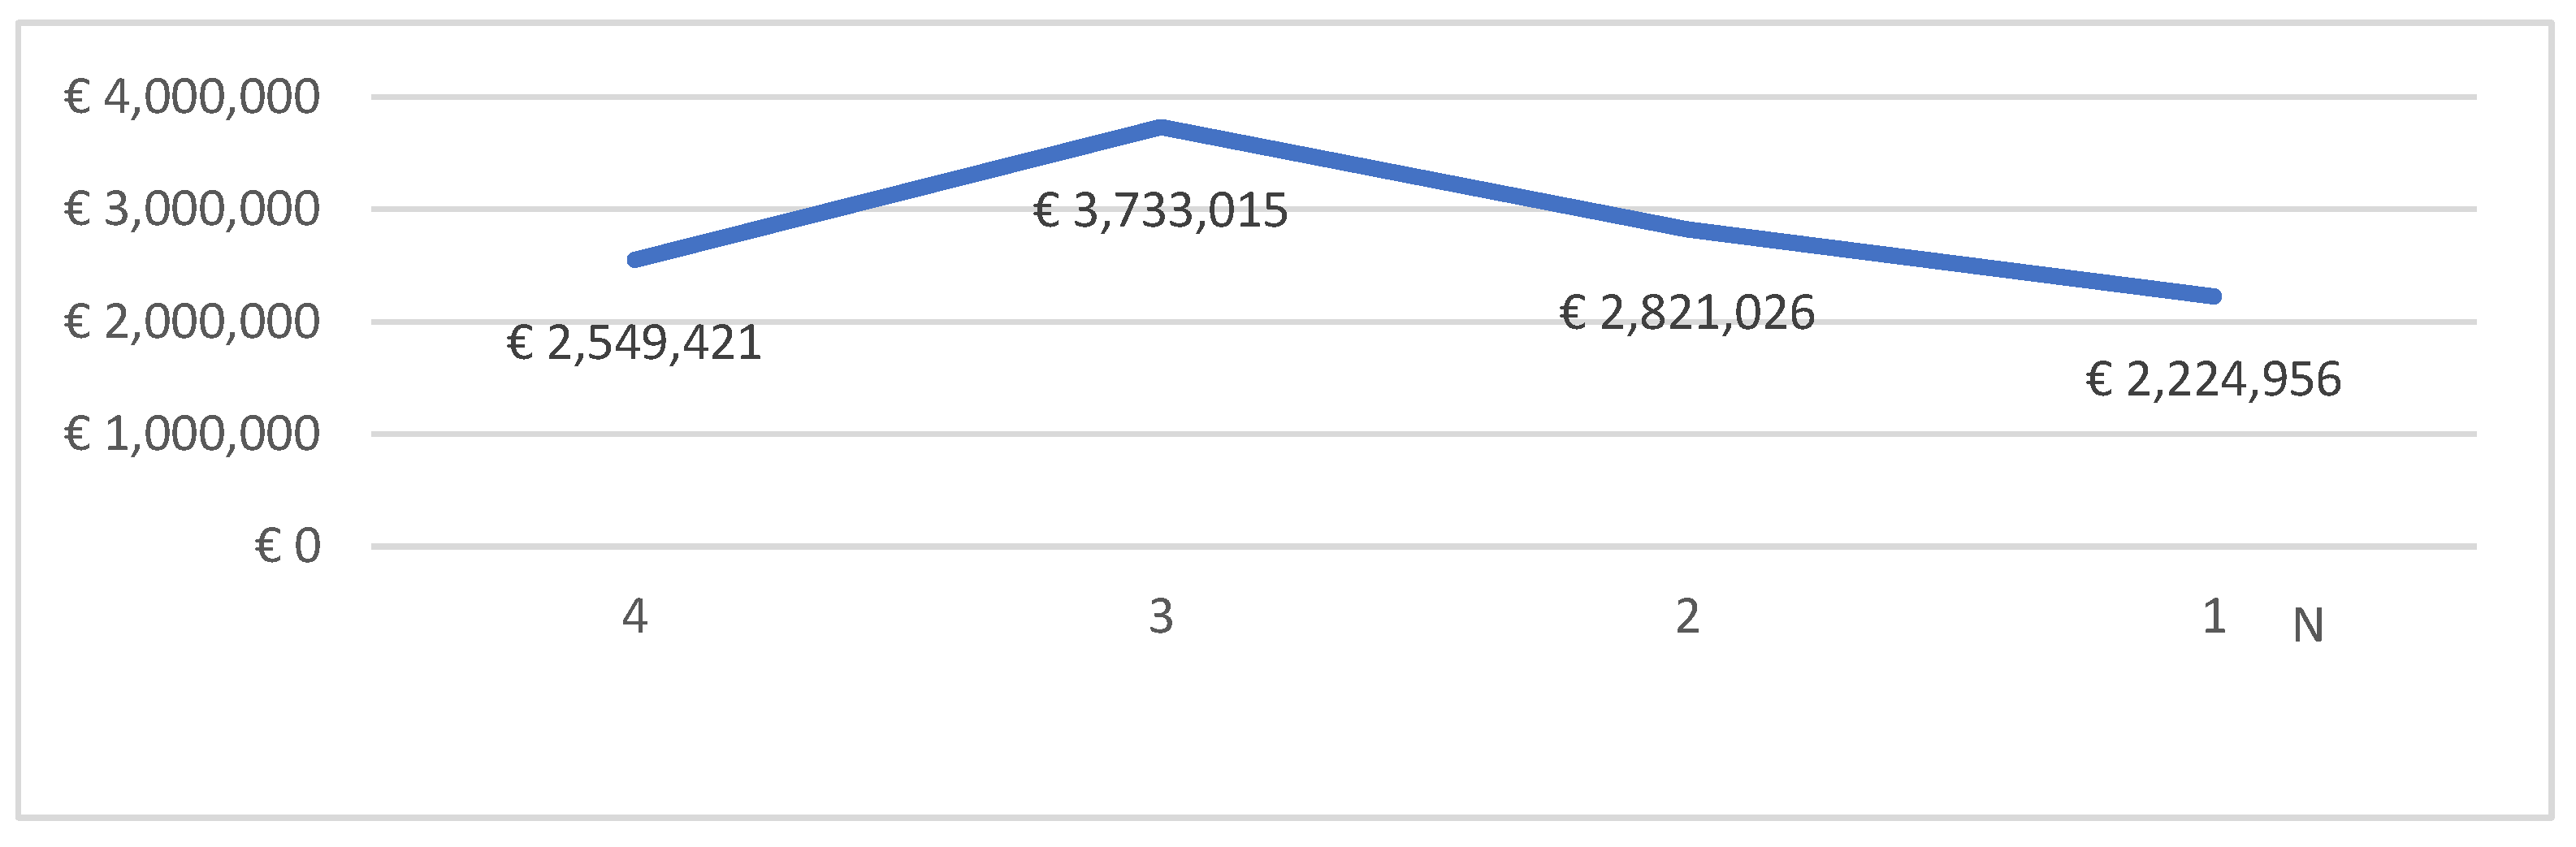
The overall surface of the windows and external doors in the analyzed building equals 5 315 m2. Four different solutions were found for windows and external doors, in which both the number of product use cycles during the calculation period, as well as the warranty period, has been changed depending on the assumed solution. For various variants, prices were found in the range of 128 EUR/m2–628 EUR/m2, and they were PVC windows, wooden windows as well as aluminum windows. Details of data adopted in specified variants are presented in Table 2.
Figure 5 shows the costs of maintaining the presented element for four solutions. The cheapest maintenance costs were obtained for the most durable solution, and thus the most expensive; however, the least durable solution did not turn out in this case, the most expensive solution from the maintaining cost point of view an element throughout the entire computing period of the building. It turned out that medium-lasting solutions are the least cost-effective, presumably due to the fact that they are more expensive than the least-durable variant, and at the same time, the number of product use cycles during the calculation period is not sufficiently reduced to comply with higher purchase costs.
5.2. Internal Doors
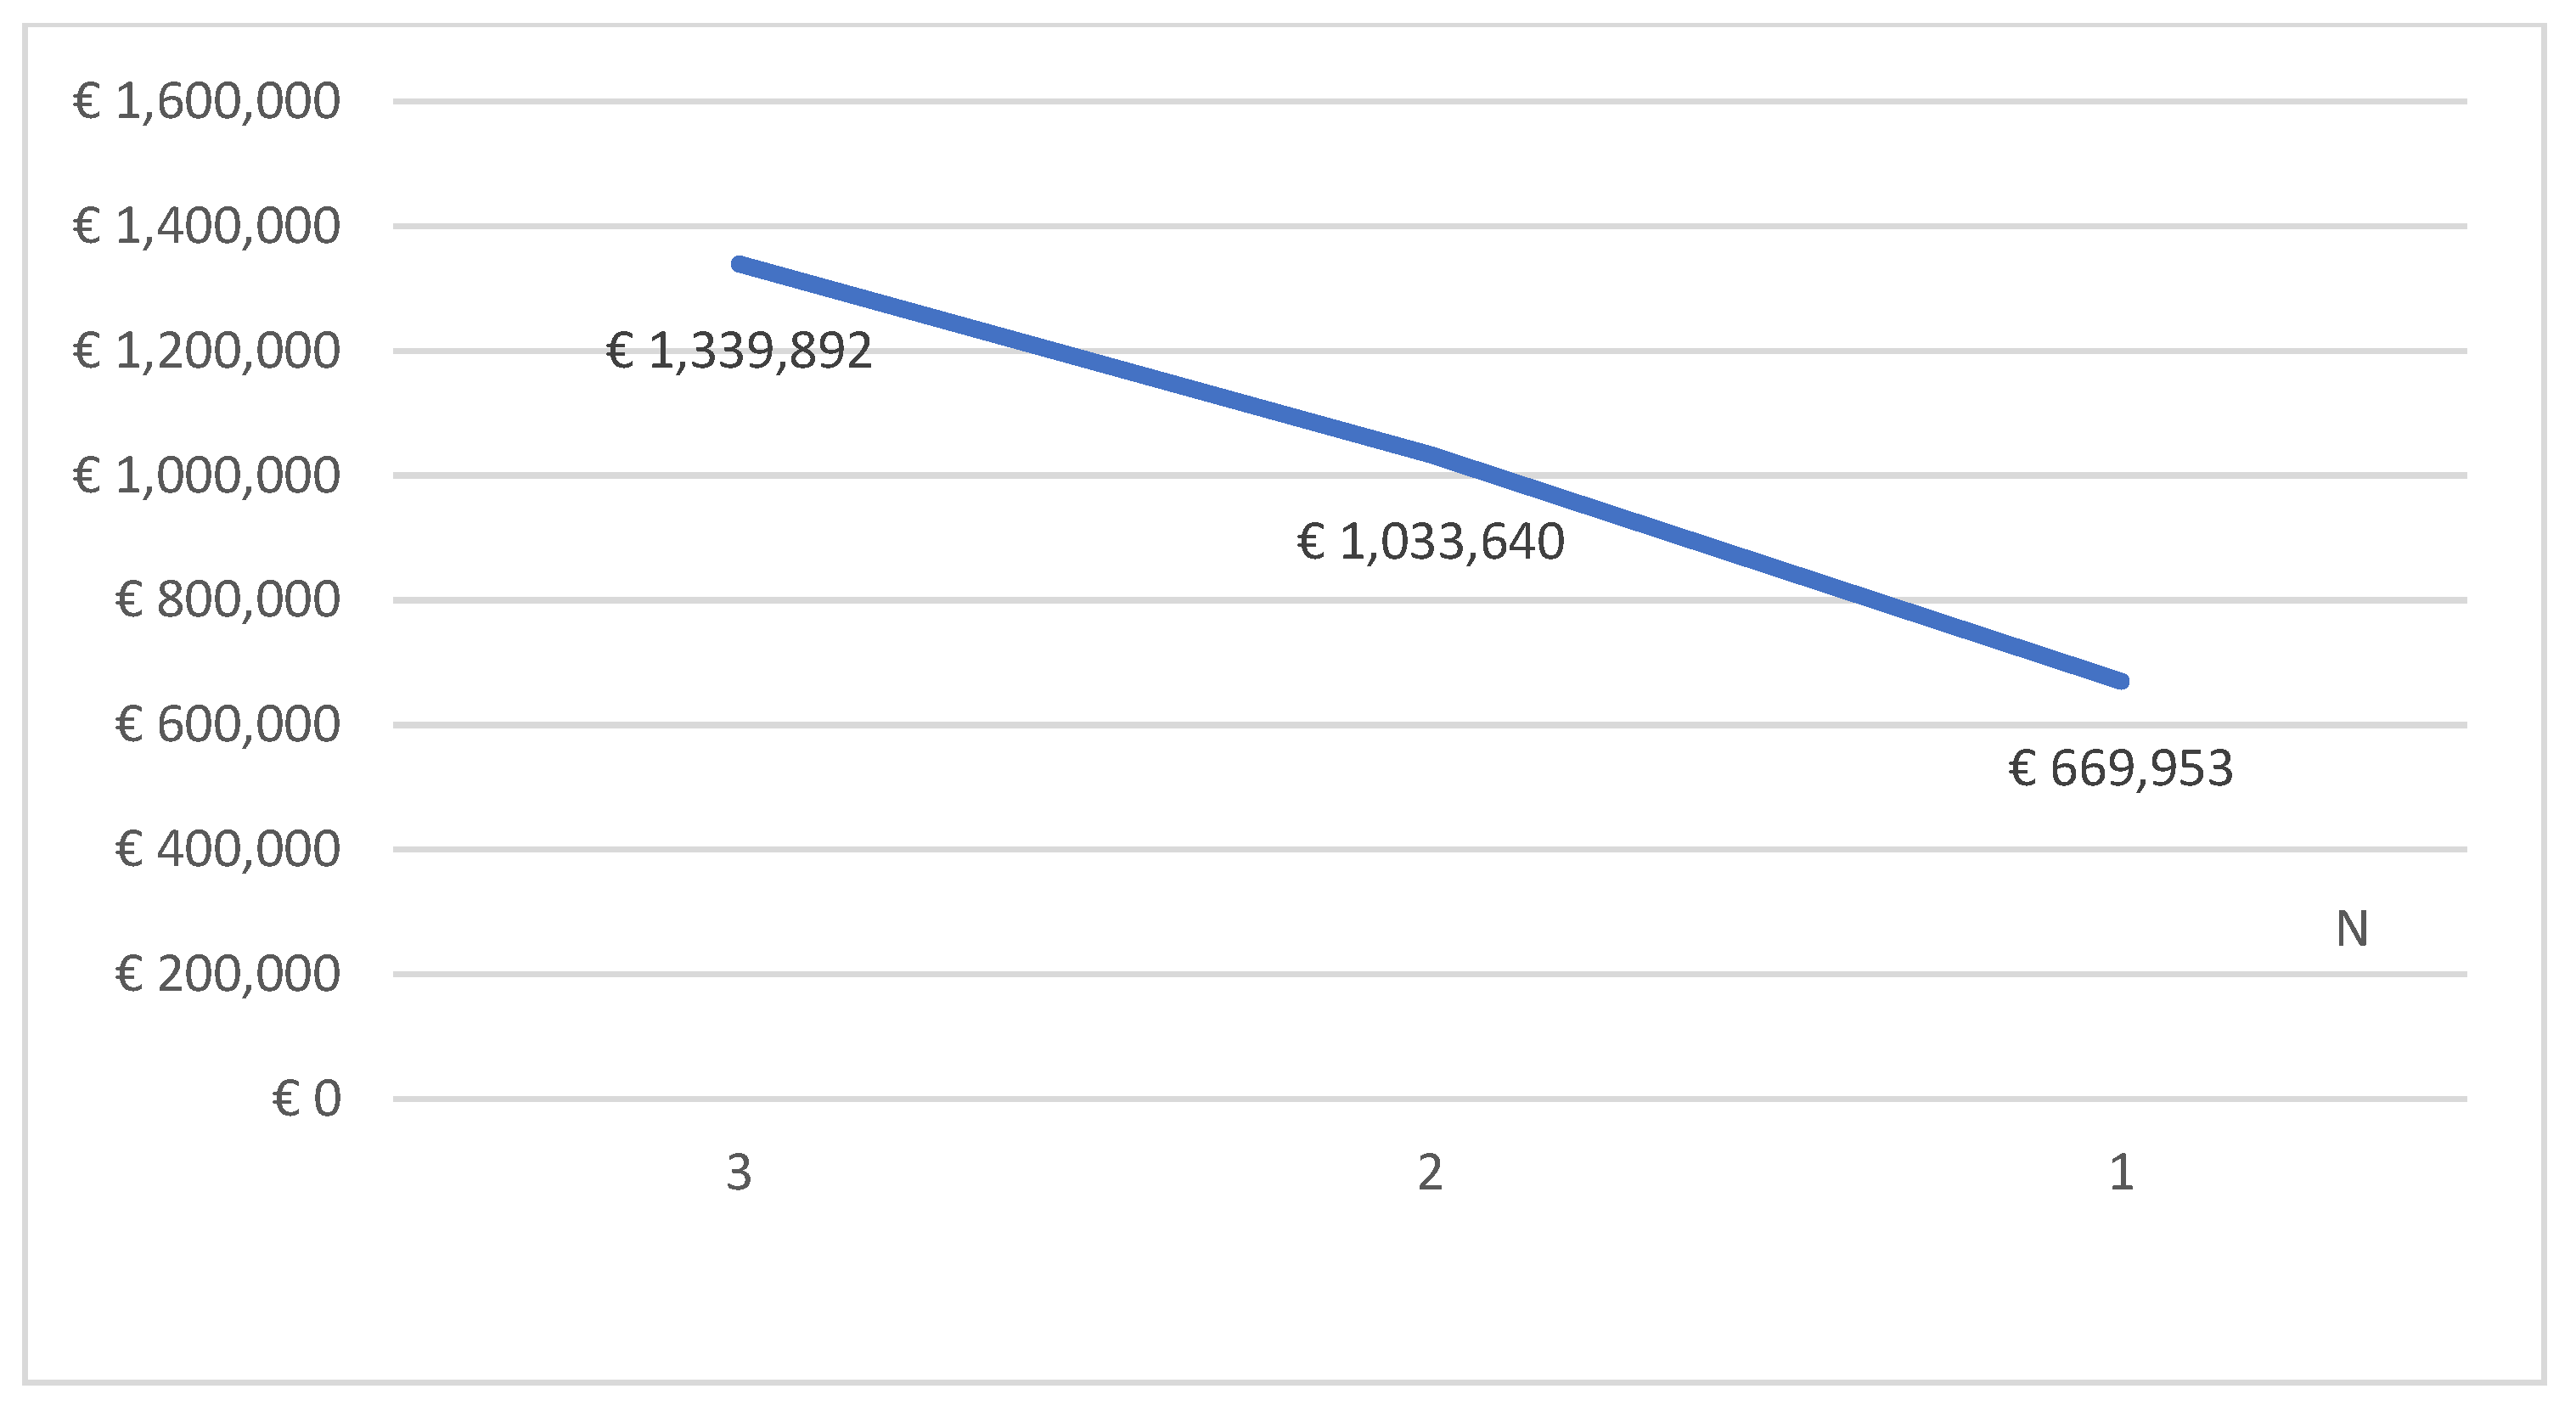
The overall surface of the internal doors in the analyzed building equals 2 496 m2. Three different solutions for internal doors were found. For various variants, prices were found in the range of 192 EUR/m2–322 EUR/m2. In this case, the economic profitability of the proposed solutions increases with increasing the durability of the element and thus the increase in the purchase price. Details of data adopted in these variants are presented in Table 3.
The internal doors maintenance costs during the whole life cycle are shown on the Figure 6.
5.3. Roof
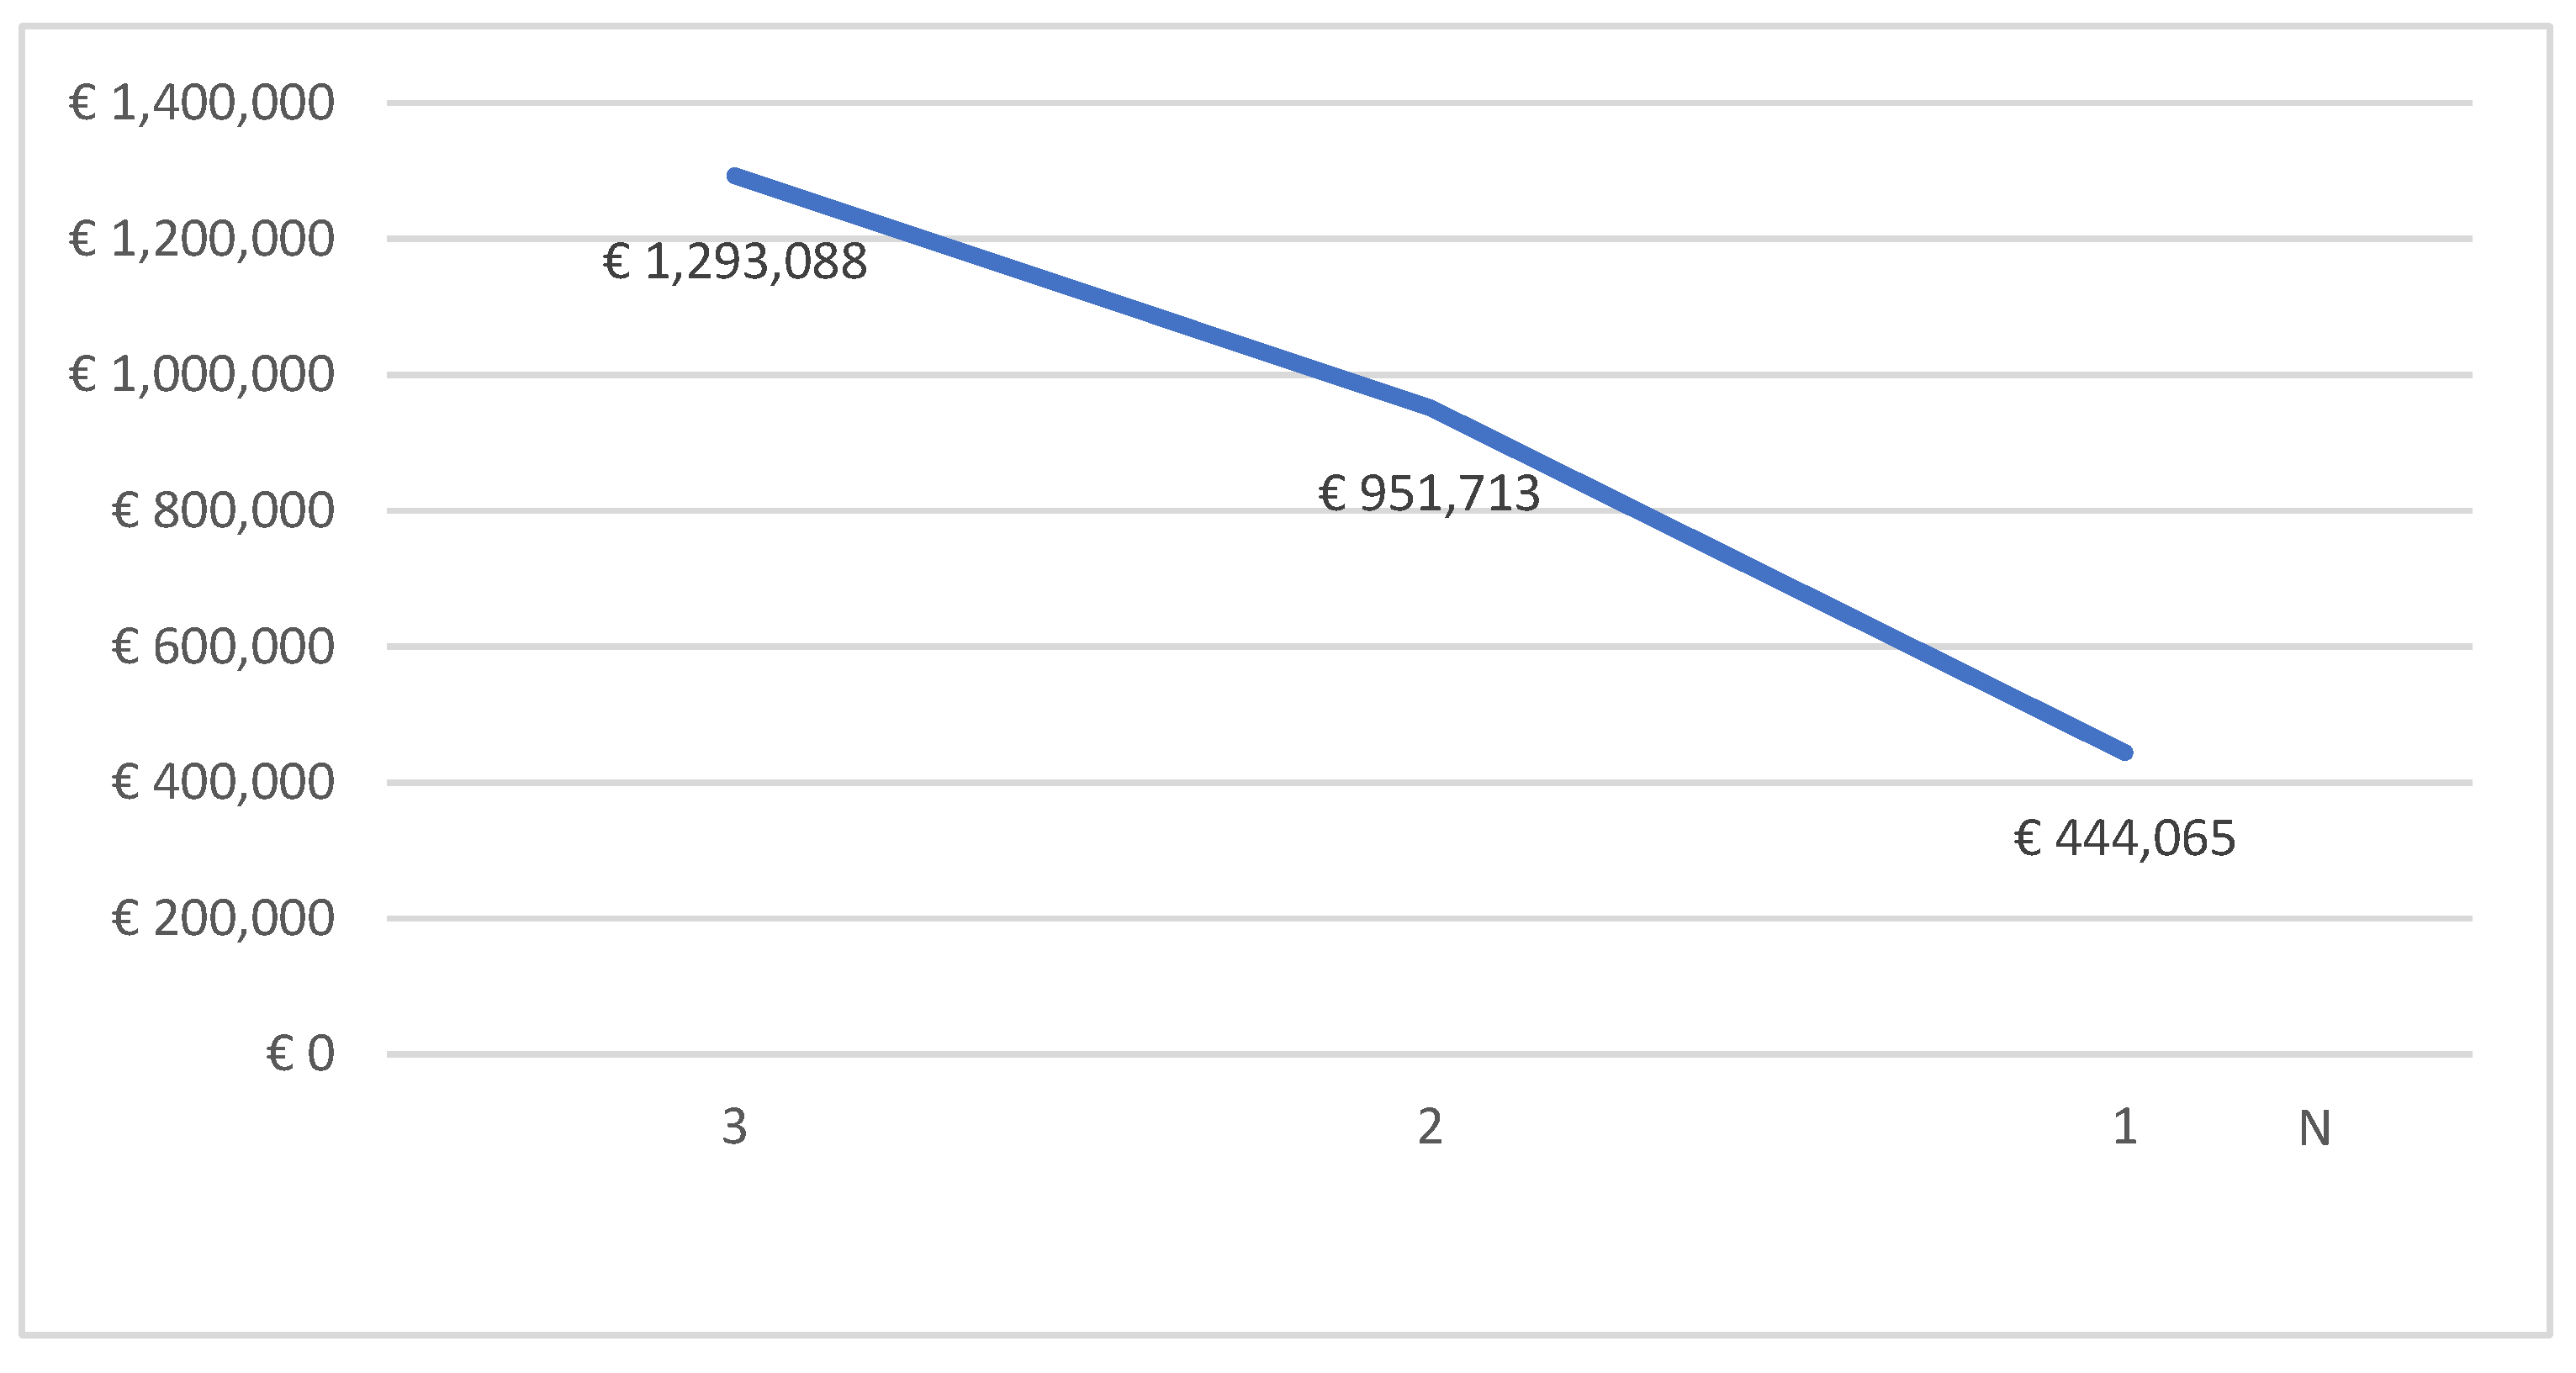
The overall surface of the roof in the analyzed building equals 3823 m2. Three different solutions for the roof were designed. For various variants, prices were found in the range of 135 EUR/m2–174 EUR/m2. For the solutions adopted for the roof as well as the floors, similar conclusions can be drawn as for interior doors. In the case of a roof, the most durable solution turns out to be the most cost-effective considering the maintenance costs of this structure element over the entire life cycle calculation period. Details of the data adopted in these variants are presented in Table 4.
The roof maintenance costs during the whole life cycle are shown on the Figure 7.
5.4. Flooring
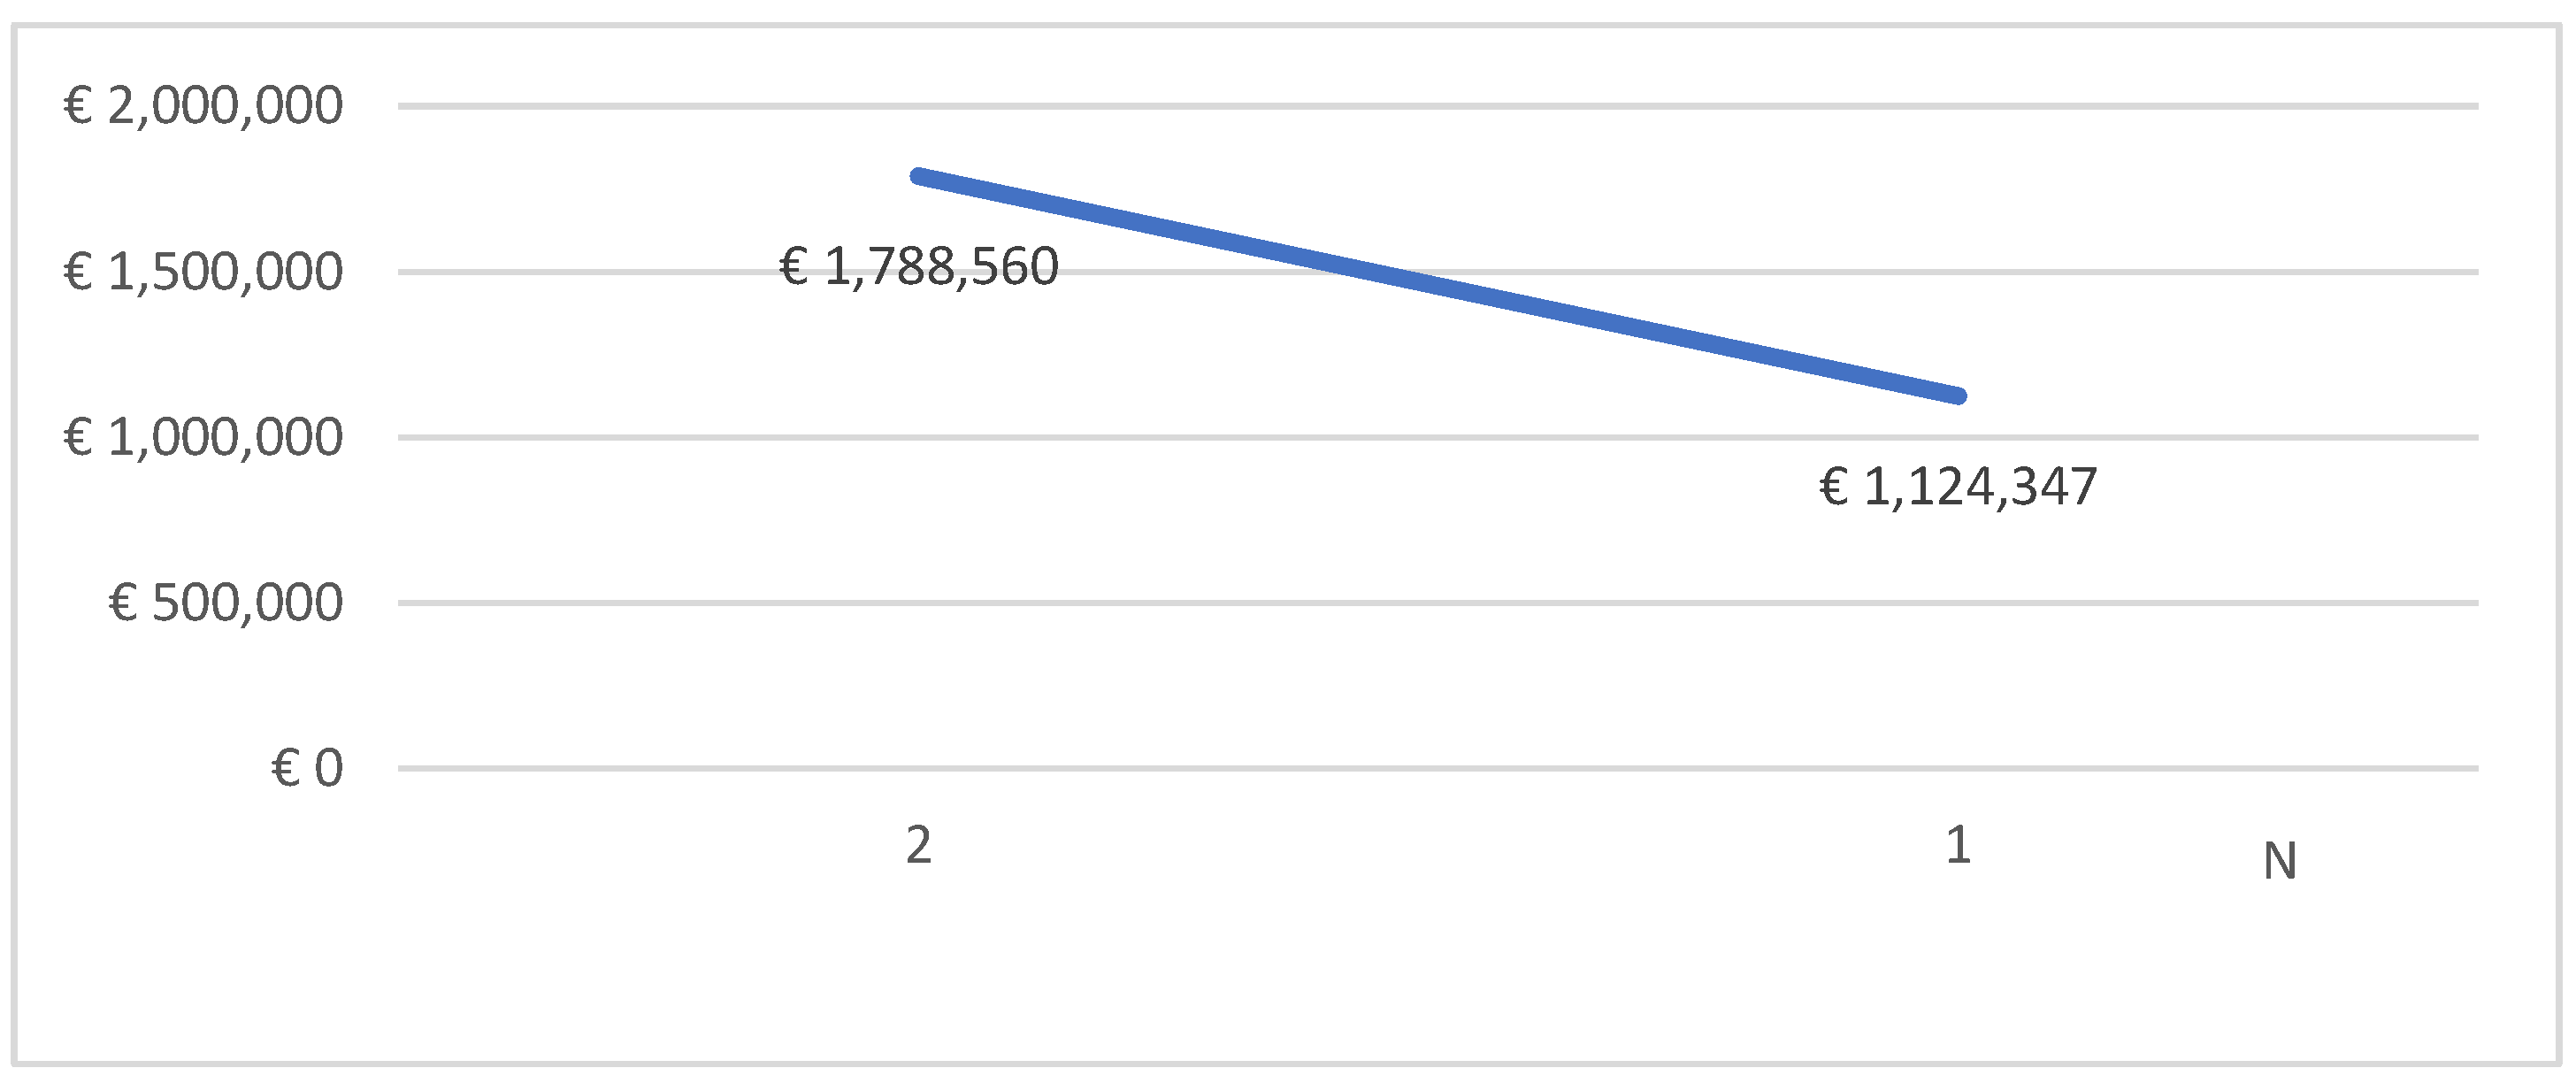
The overall surface of the flooring in the analyzed building equals 34,459 m2. Two different solutions for the terracotta flooring were designed. The difference between these variants was the durability of the flooring. The cheaper variant assumed one change of flooring in the building during the calculation period, whereas the more expensive one, as well as more durable one, assumed one flooring during the whole buildings’ life cycle. The first option was priced at 28 EUR/m2, while the second one was estimated at the point of 41 EUR/m2. Taking into account the prices, the number of product life cycles in the calculation period as well as the warranty periods, the more durable option turned out to be the more cost-effective one throughout the life cycle. Details of the data adopted in the two designed variants are presented in Table 5.
The flooring maintenance costs during the whole life cycle are shown on the Figure 8.
5.5. The Solutions Analysis
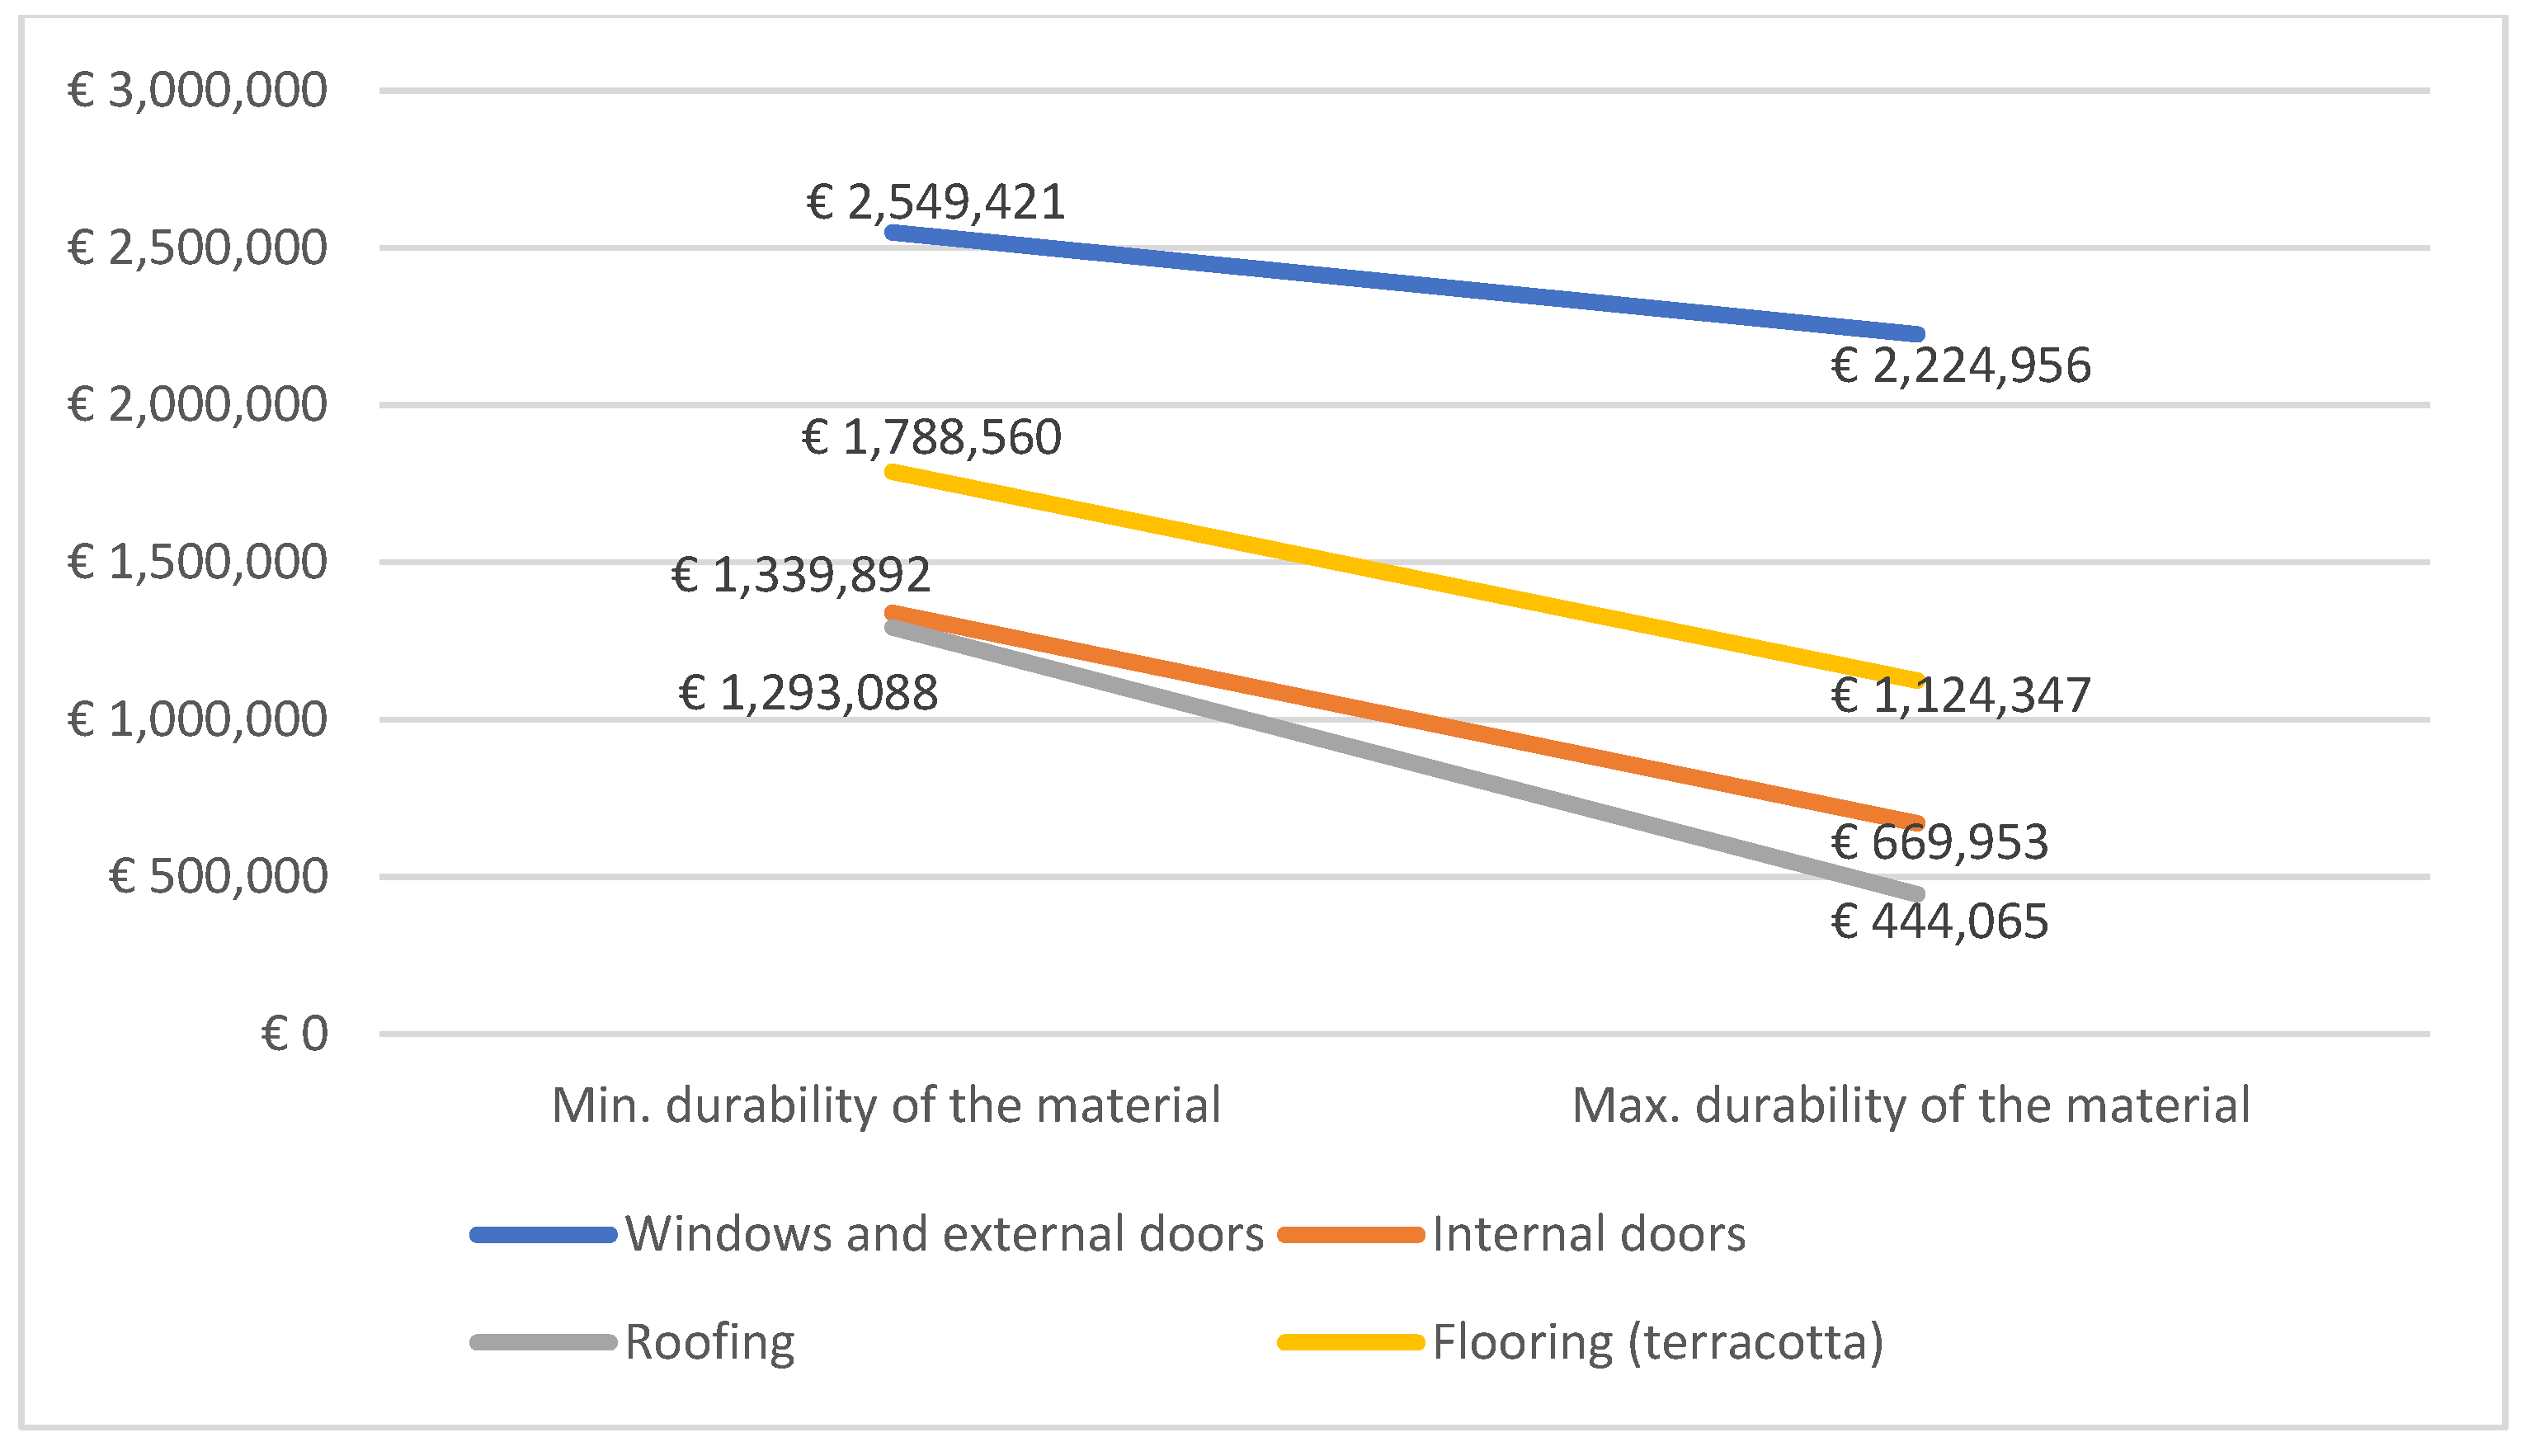
The analyses carried out in the article allowed determining the impact of variables on the maintenance costs and to select the variants generating the highest and the lowest cost values. The summary of these results is presented in Figure 9.
Figure 9 allows concluding that, despite the higher price of materials at the beginning of production, the most beneficial solutions in the entire life cycle of the facility turn out to be the most durable solutions, which are the most expensive to purchase. This trend has worked well for all four cases considered.
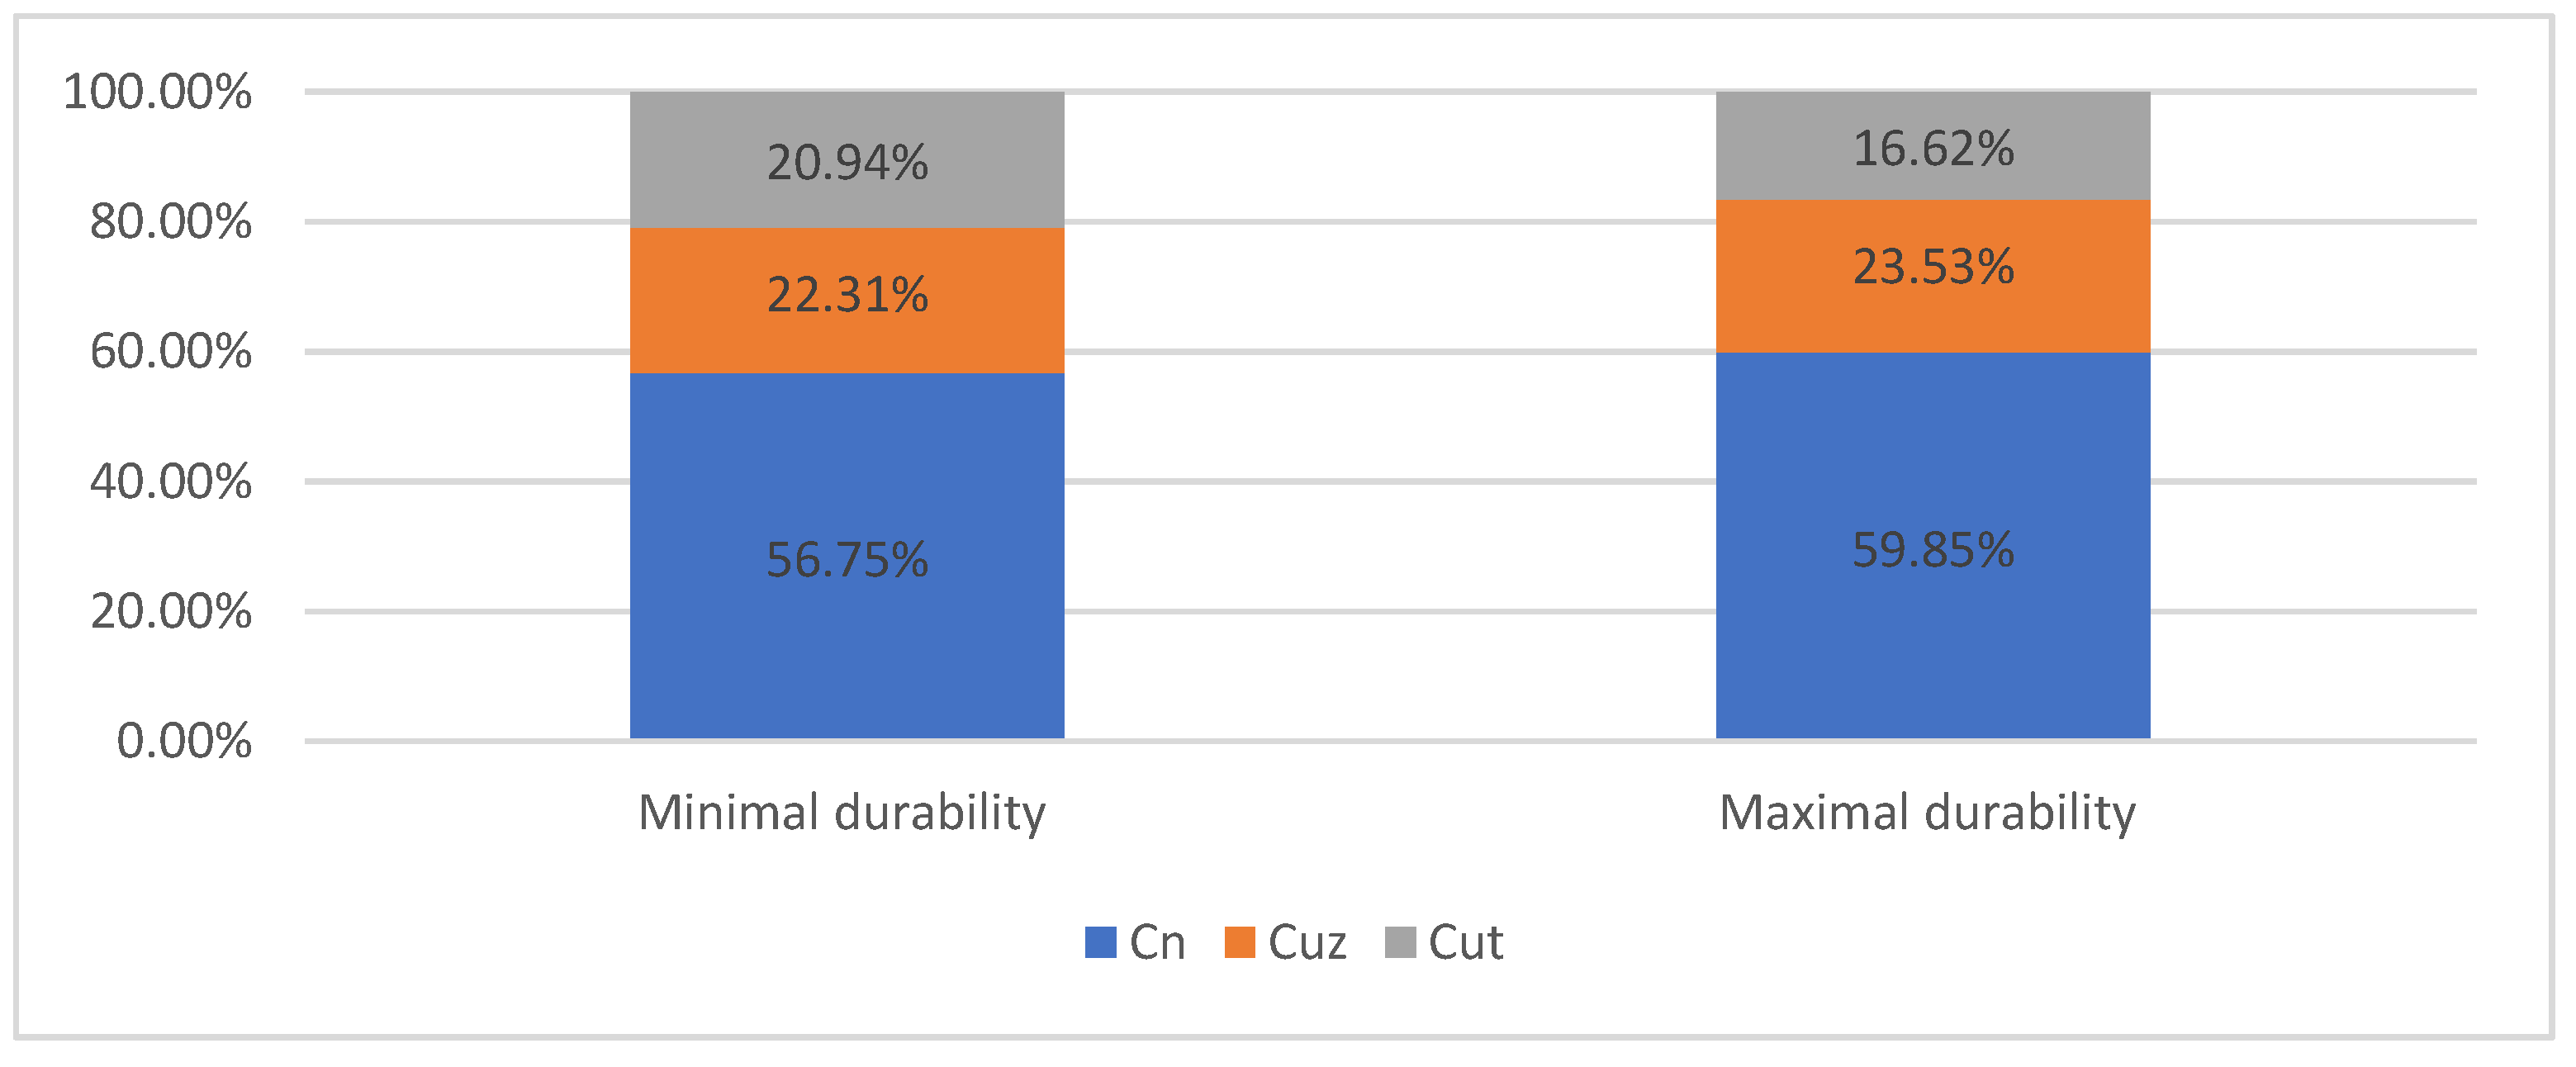
5.6. Share of Maintenance Costs in The Total Life Cycle Costs
The calculated maintenance costs of the facility during the calculation period were also analyzed in relation to the entire life cycle costs of the building over the 30-year lifetime of the building. For this purpose, acquisition costs were assumed in the amount of construction costs specified in the BCO and operating costs based on the average demand for utilities per m2 of the facility. On the basis of the calculated values, it was found that when using solutions with a lower durability, the share of calculated building maintenance costs in the total costs incurred in 30 years of use is about 5% higher compared to higher durability solutions. The conclusions described above are presented in Figure 10.
6. Extension of the Method Adopted in The Regulation
The method which is applied in the regulation is a simple method—does not take into account changes in the value of money over time. Another limitation is also the 30-year life cycle that has to be imposed.
6.1. NPV Addition
In the first stage, the obtained results were compared to the method determining the present value of NPV.
The basic calculation formula is as follows:
where: CFi—cash flow in ith year, ESL—estimated service life in years, i—subsequent year, r—discount rate.
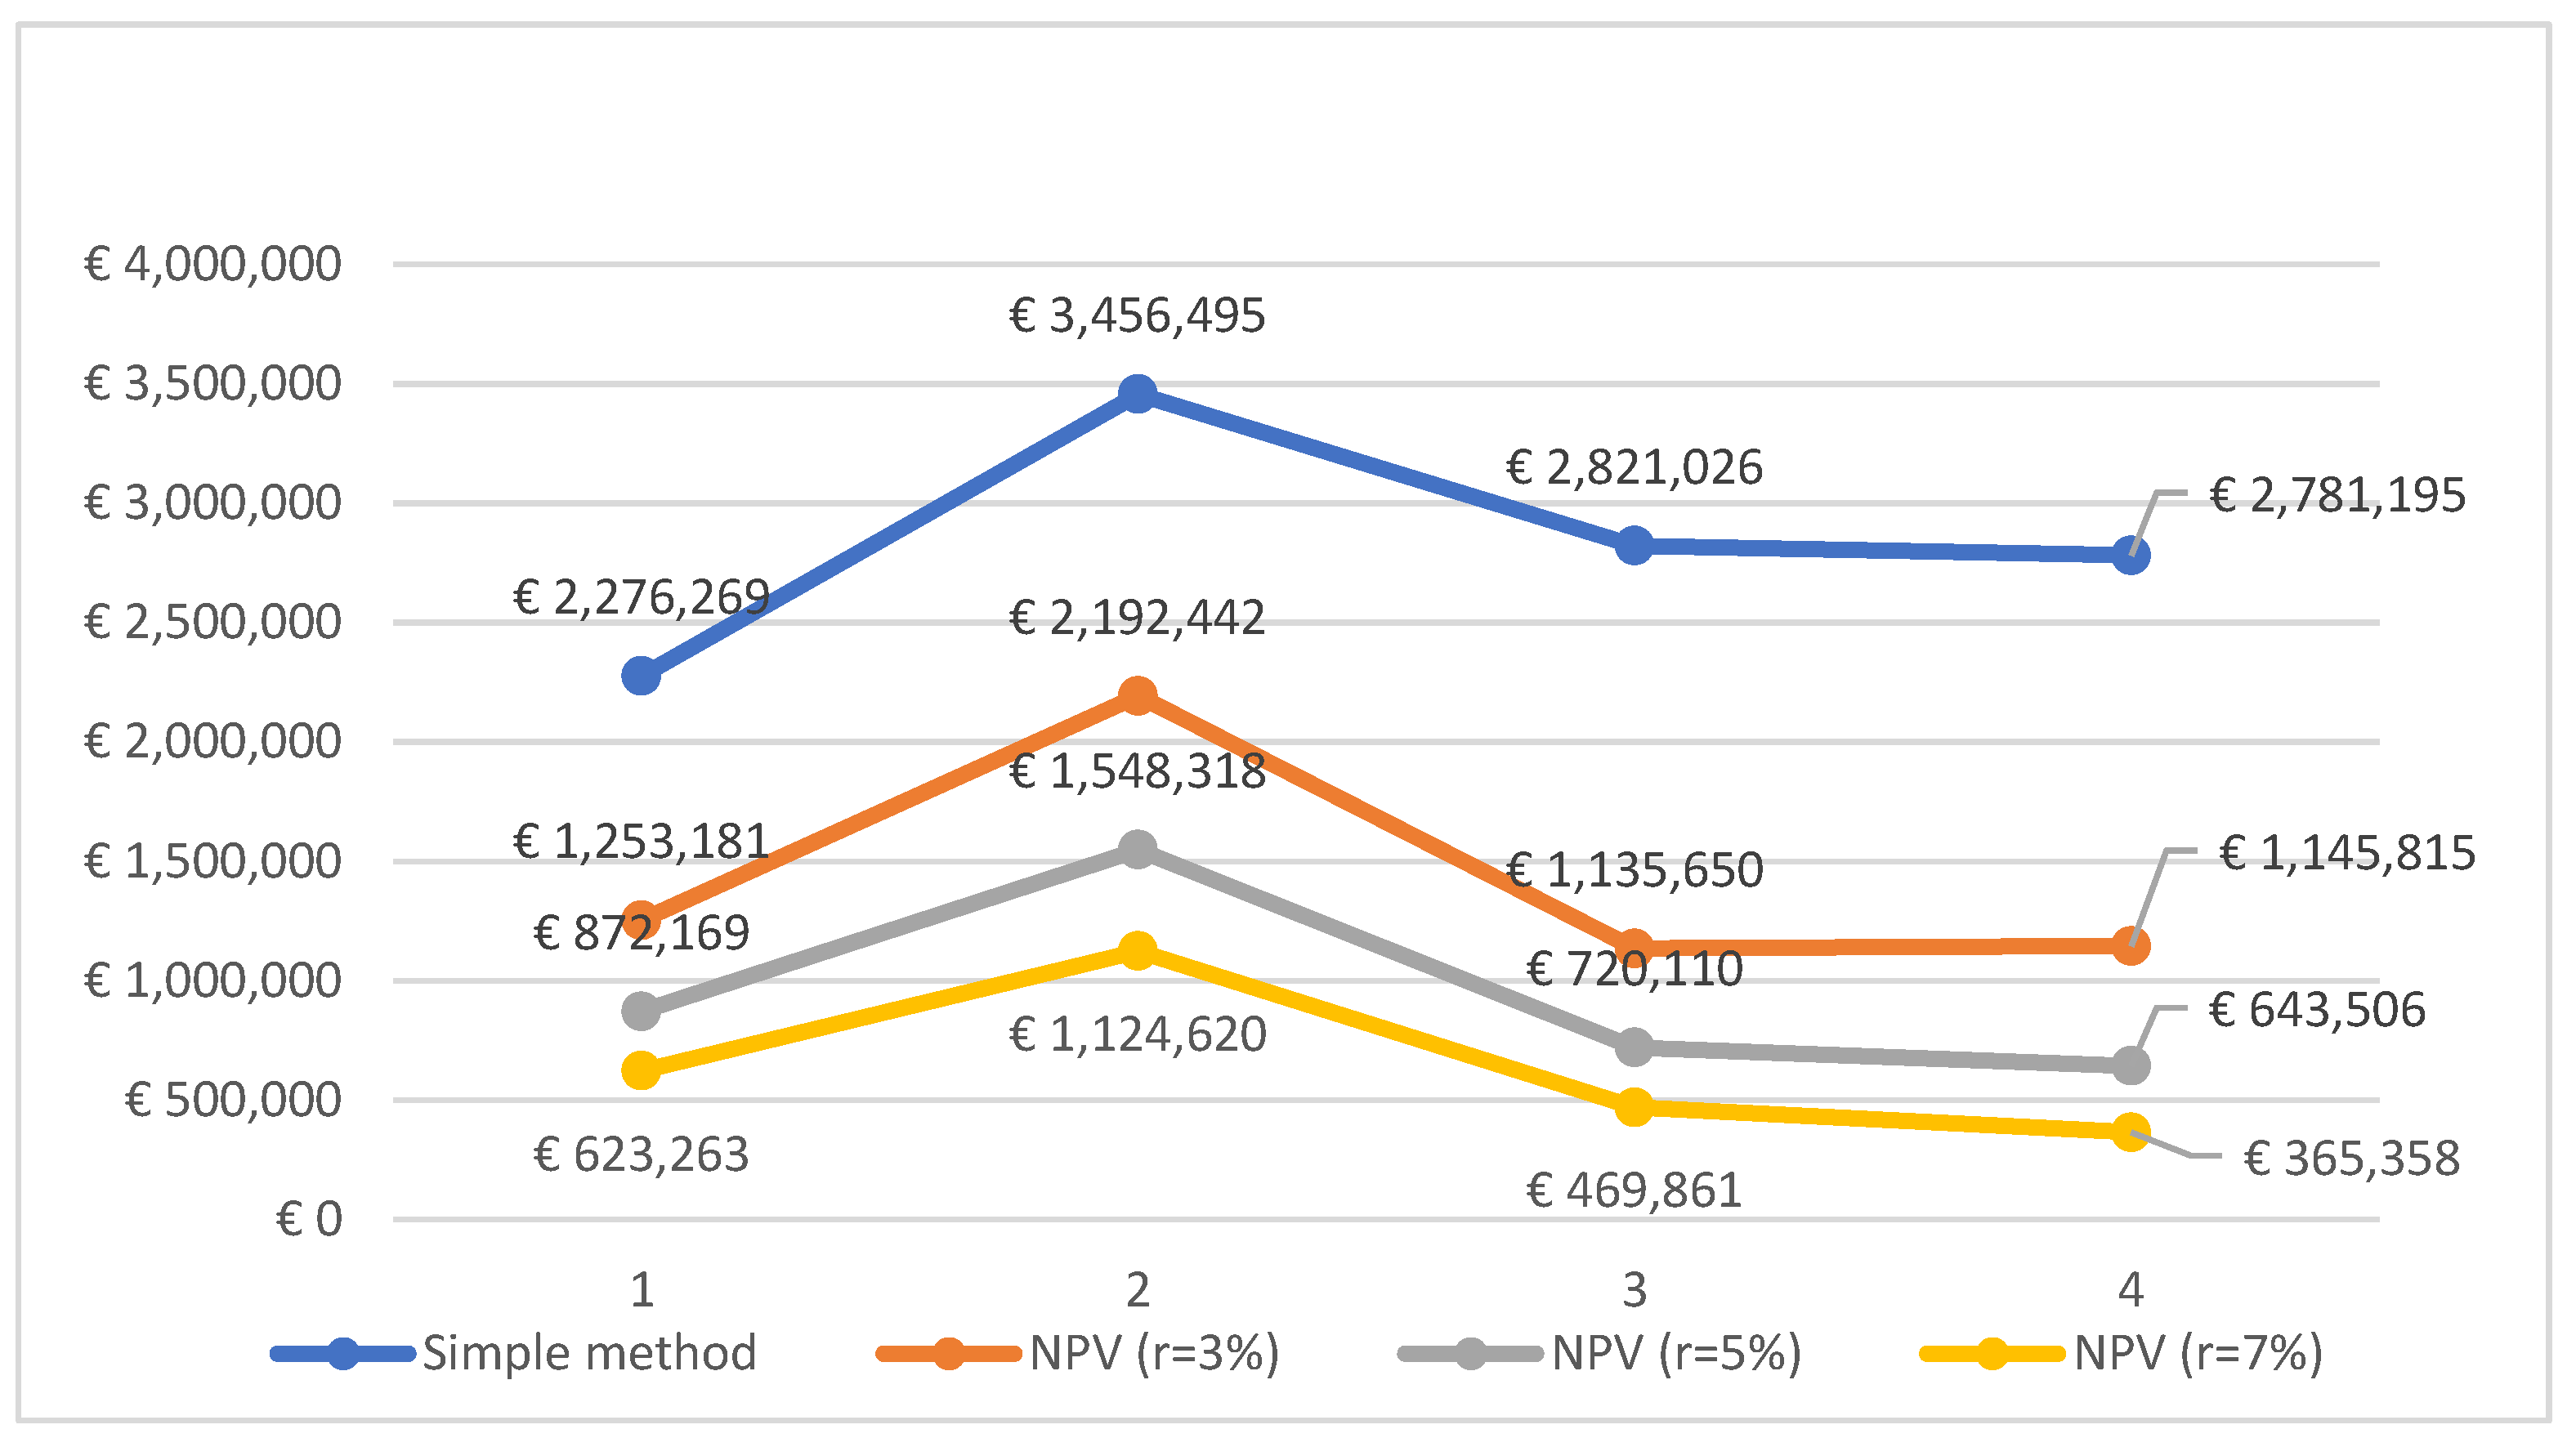
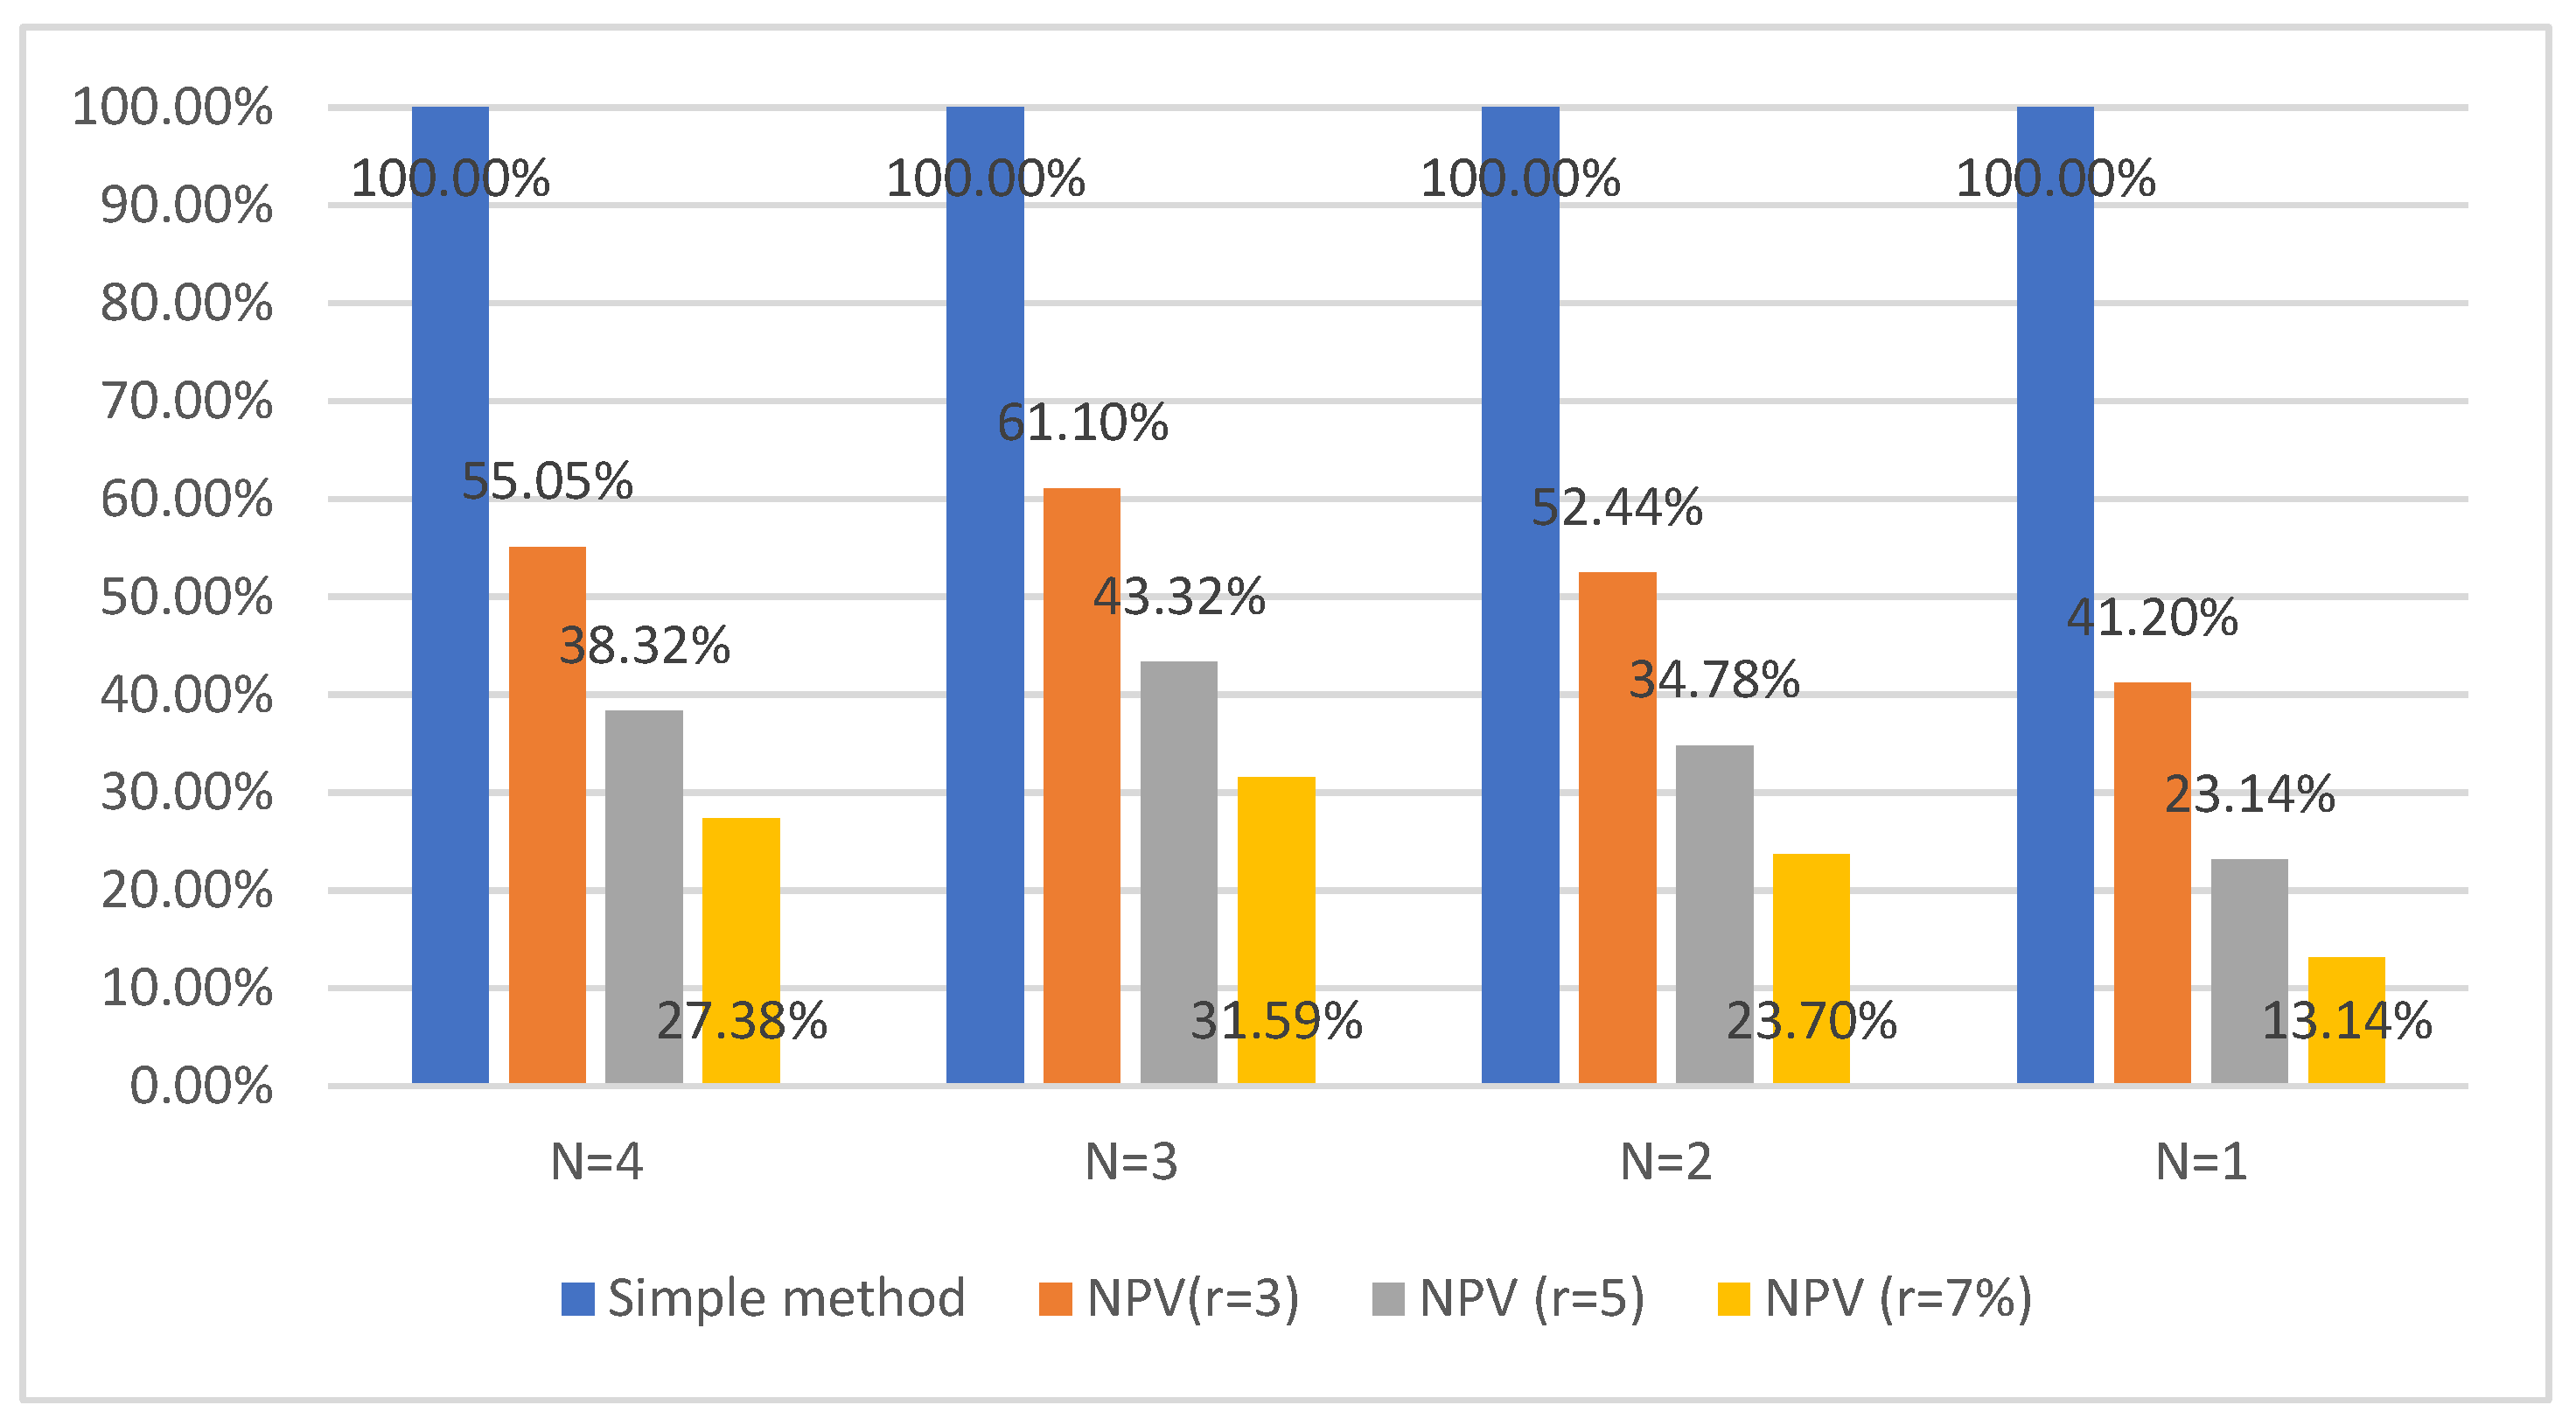
Figure 11 and Figure 12 show the results for the maintenance costs of windows and external doors determined by the simple and NPV methods, assuming different interest rates. The same cost assumptions as for the simple method and the 5-year warranty period for all variants were adopted.
The results presented above show that the most durable variant is the most profitable, assuming that the NPV discount rate is equal to 7%. Besides the calculation method choice, the most durable option turned out to be the most profitable option each time, while the least profitable one is the one assuming 3 product life cycles during the assumed calculation period.
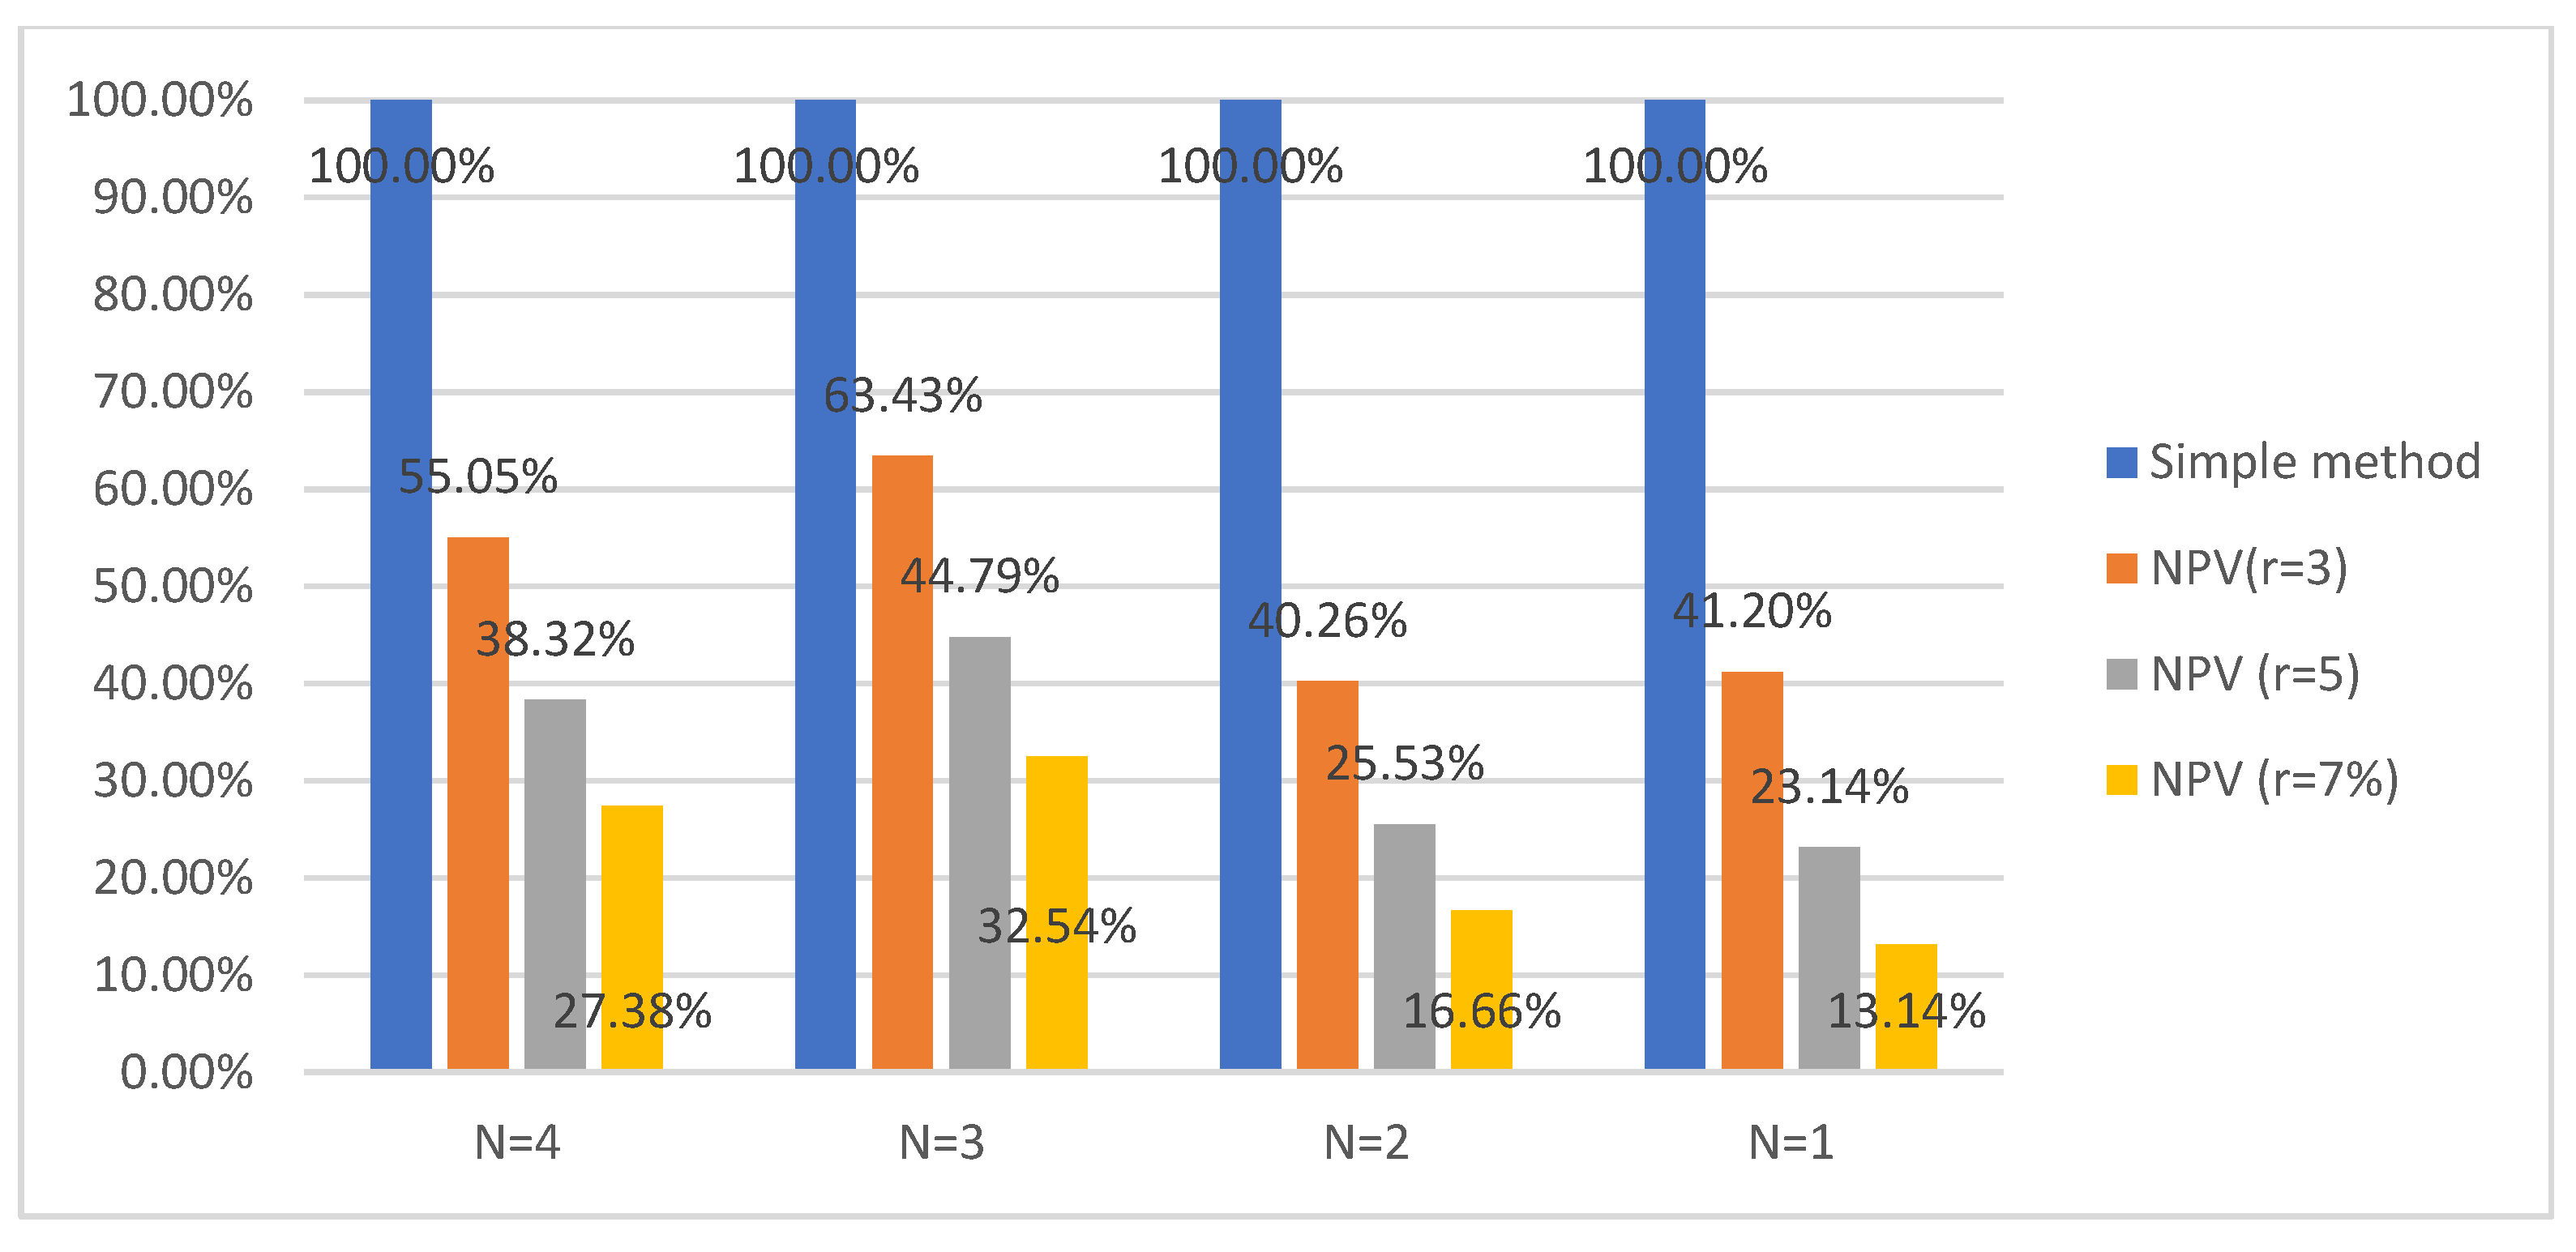
Figure 13 presents the average percentage results for all materials included in the study. The presented results also show that the most durable materials turn out to be the cheapest to maintain, taking into account the entire life cycle of the facility.
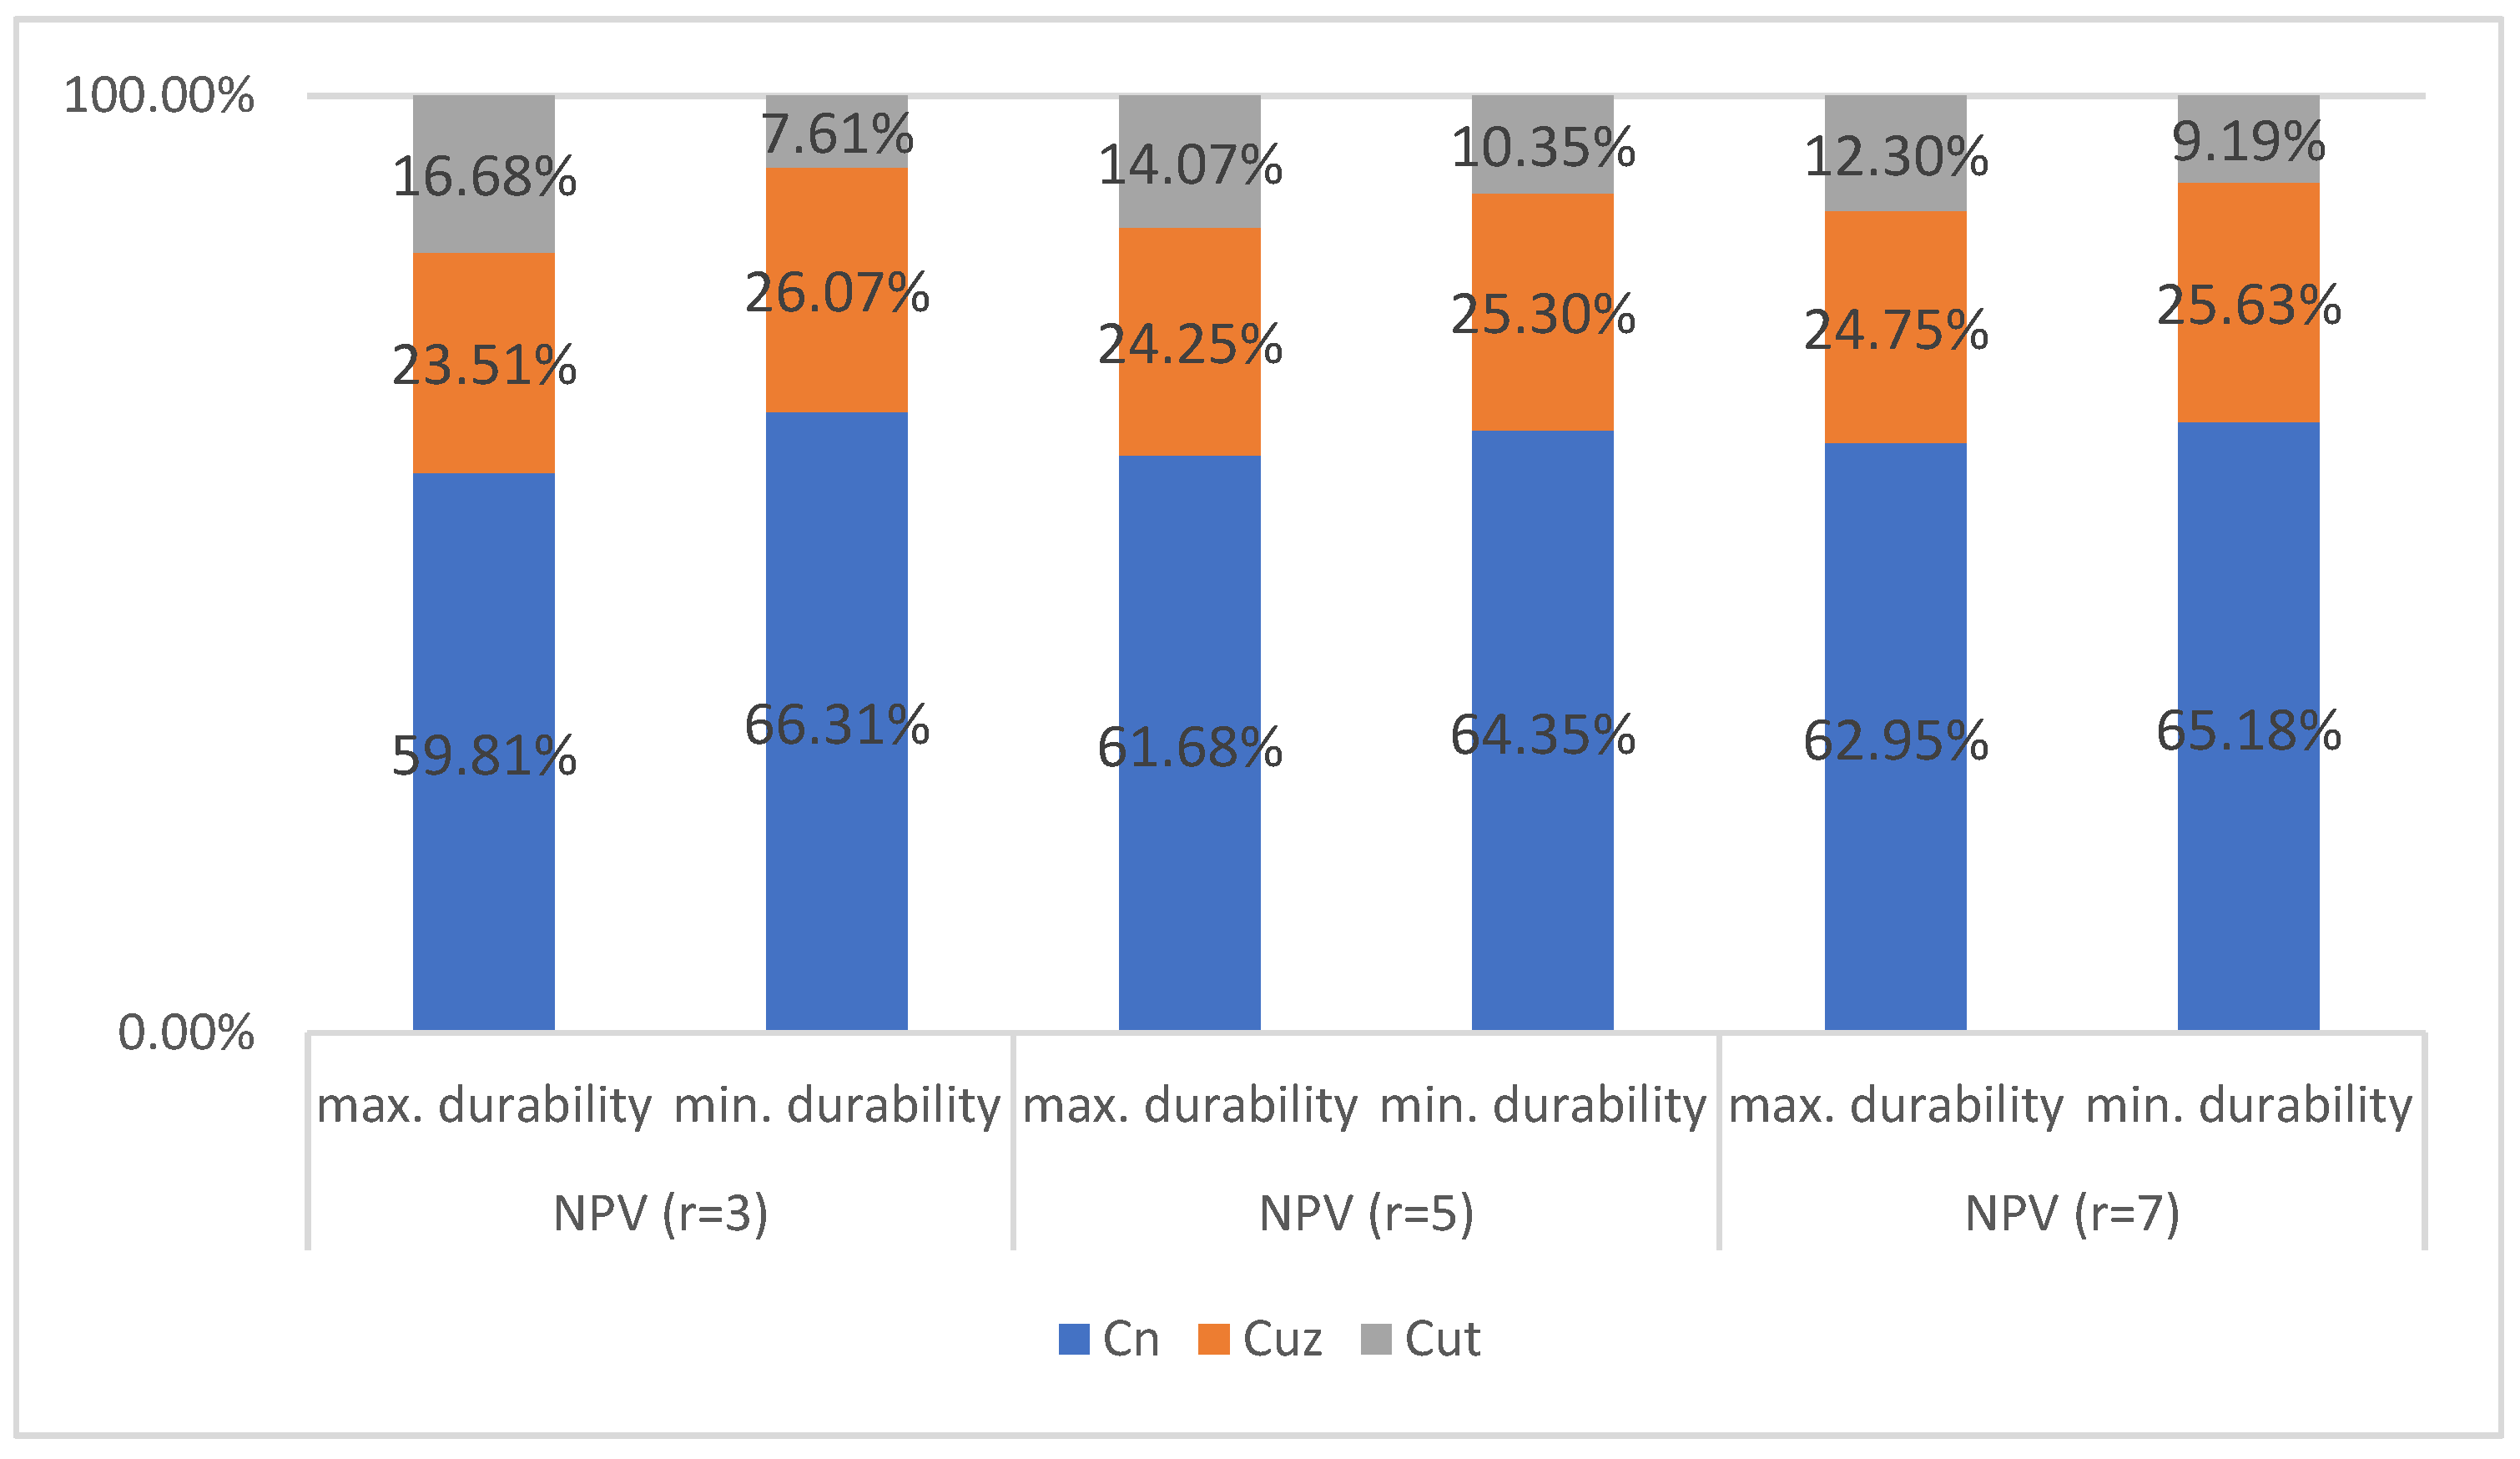
Figure 14 shows the results of the analysis for the total maintenance costs of the facility in the calculation period in relation to the entire life cycle costs of the building over the 30-year lifetime of the building. The list was prepared for the NPV variants with the assumption of a 3%, 5% and 7% discount rate.
On the basis of the calculated values, it was found that when using solutions with a lower durability, the share of calculated building maintenance costs in the total 30 years life cycle is always higher than when using solutions with higher durability. However, this difference is smaller than in the case of calculations performed in accordance with the regulation and decreases with the increase in the discount rate. Assuming a discount rate of 3%, the difference equals 2.56%, assuming a 5% discount rate, the difference equals 1.05%, while assuming a 7% discount rate, the difference equals only 0,88%.
6.2. The Life Cycle Equals 80 Years
An attempt to extend the life cycle was also made. The 30-year life cycle of the building (imposed by the regulation) was extended to 80 years.
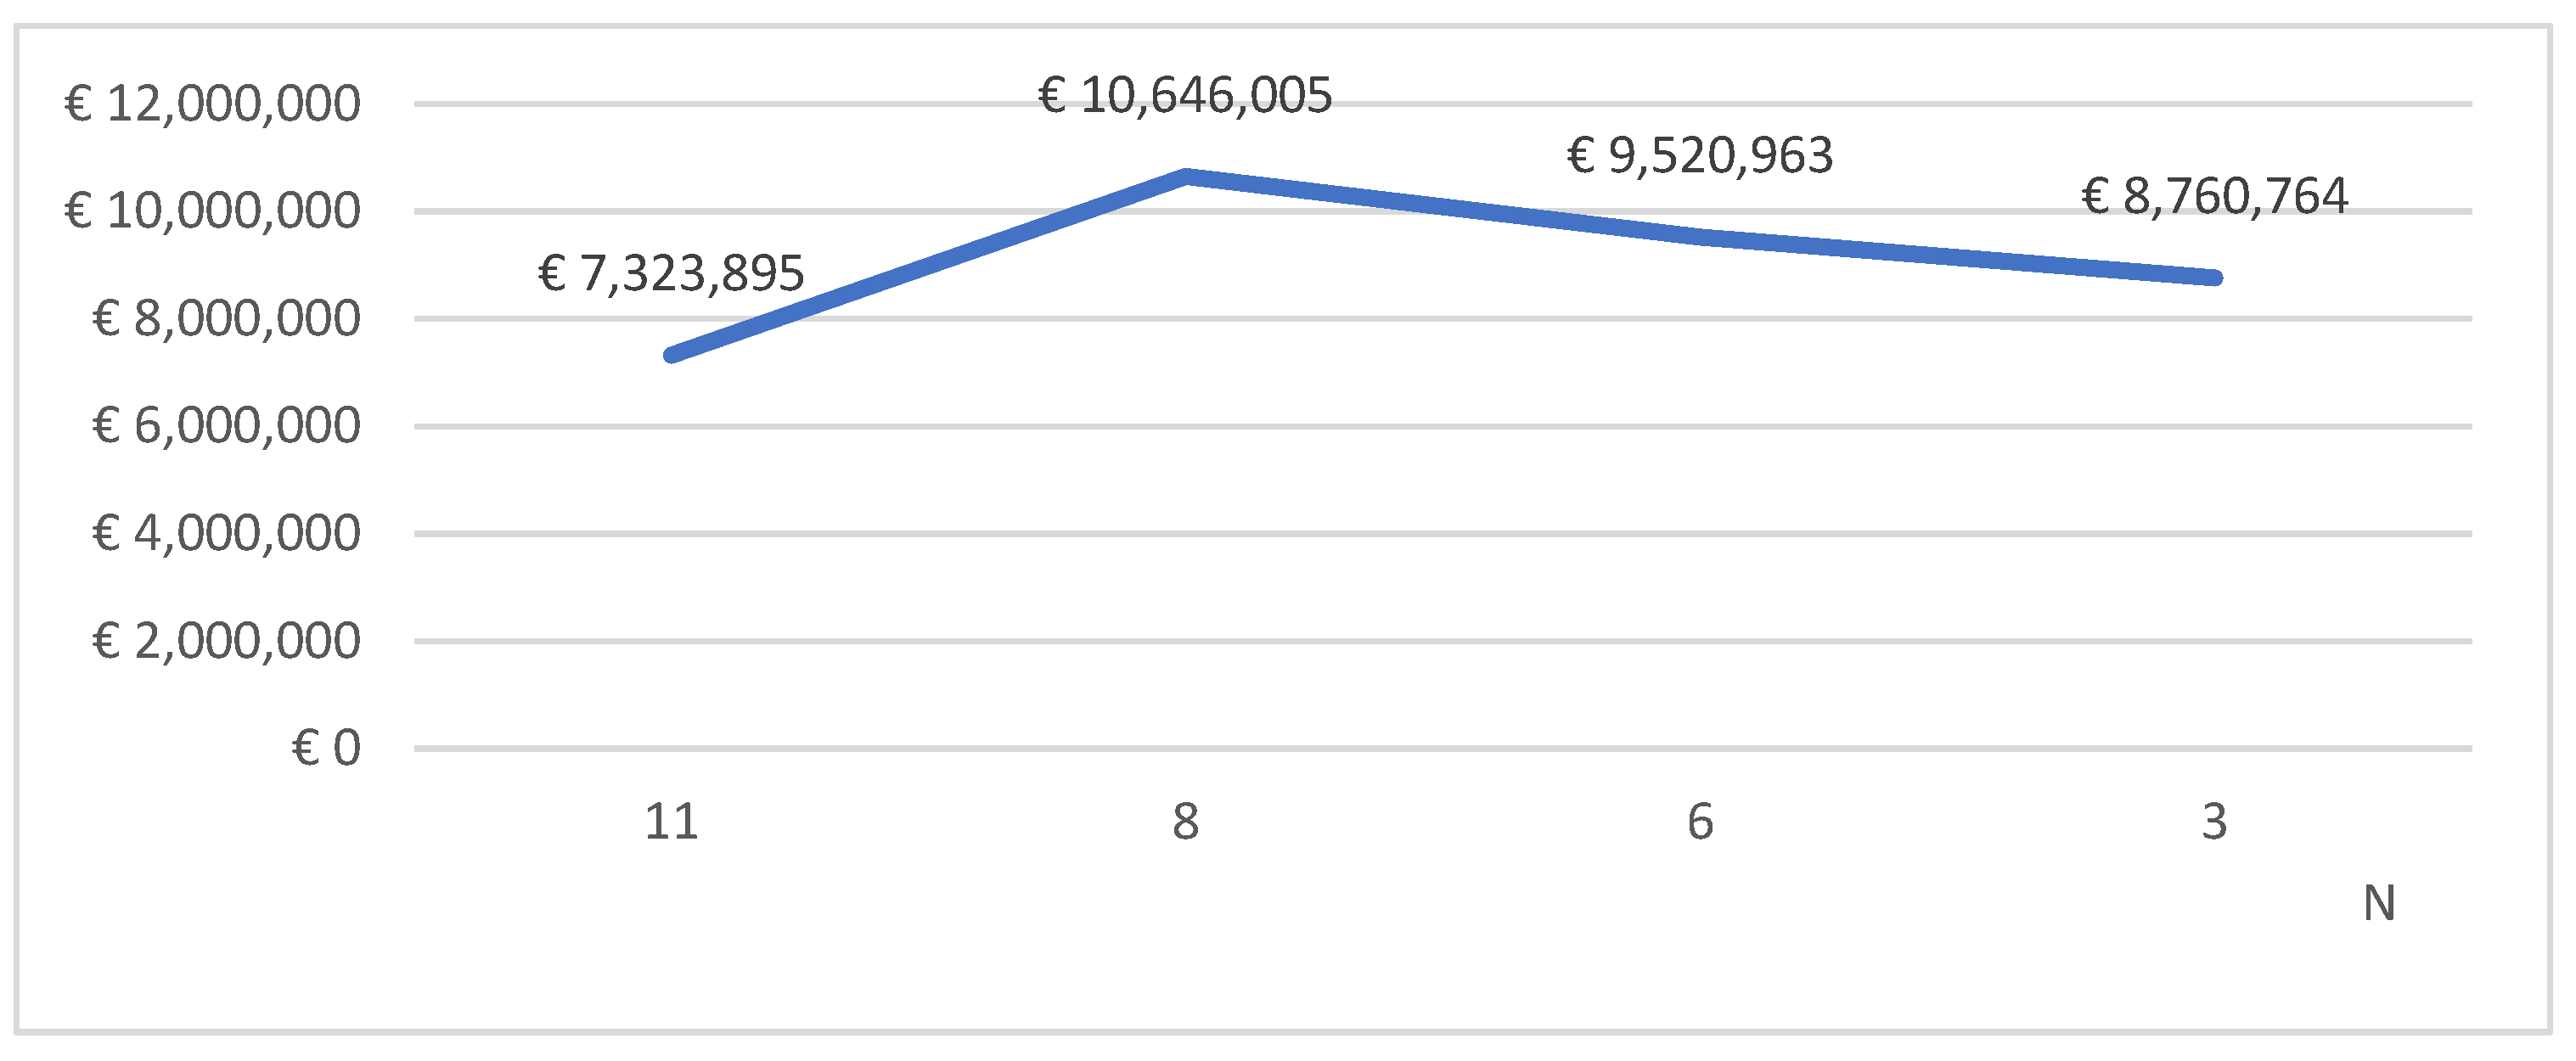
Figure 15 shows the results for the maintenance costs of windows and external doors. The same cost assumptions were adopted as for the simple method, and the number of product life cycles in the calculation period was assumed proportionally greater than the designed life cycle period.
The presented data show that in the case of windows and external doors, assuming an 80-year life cycle of the building, the least durable solution is the cheapest solution (11 life cycles of the product were assumed). Intermediate solutions are the most expensive, and the most durable option is the second most economically profitable option.
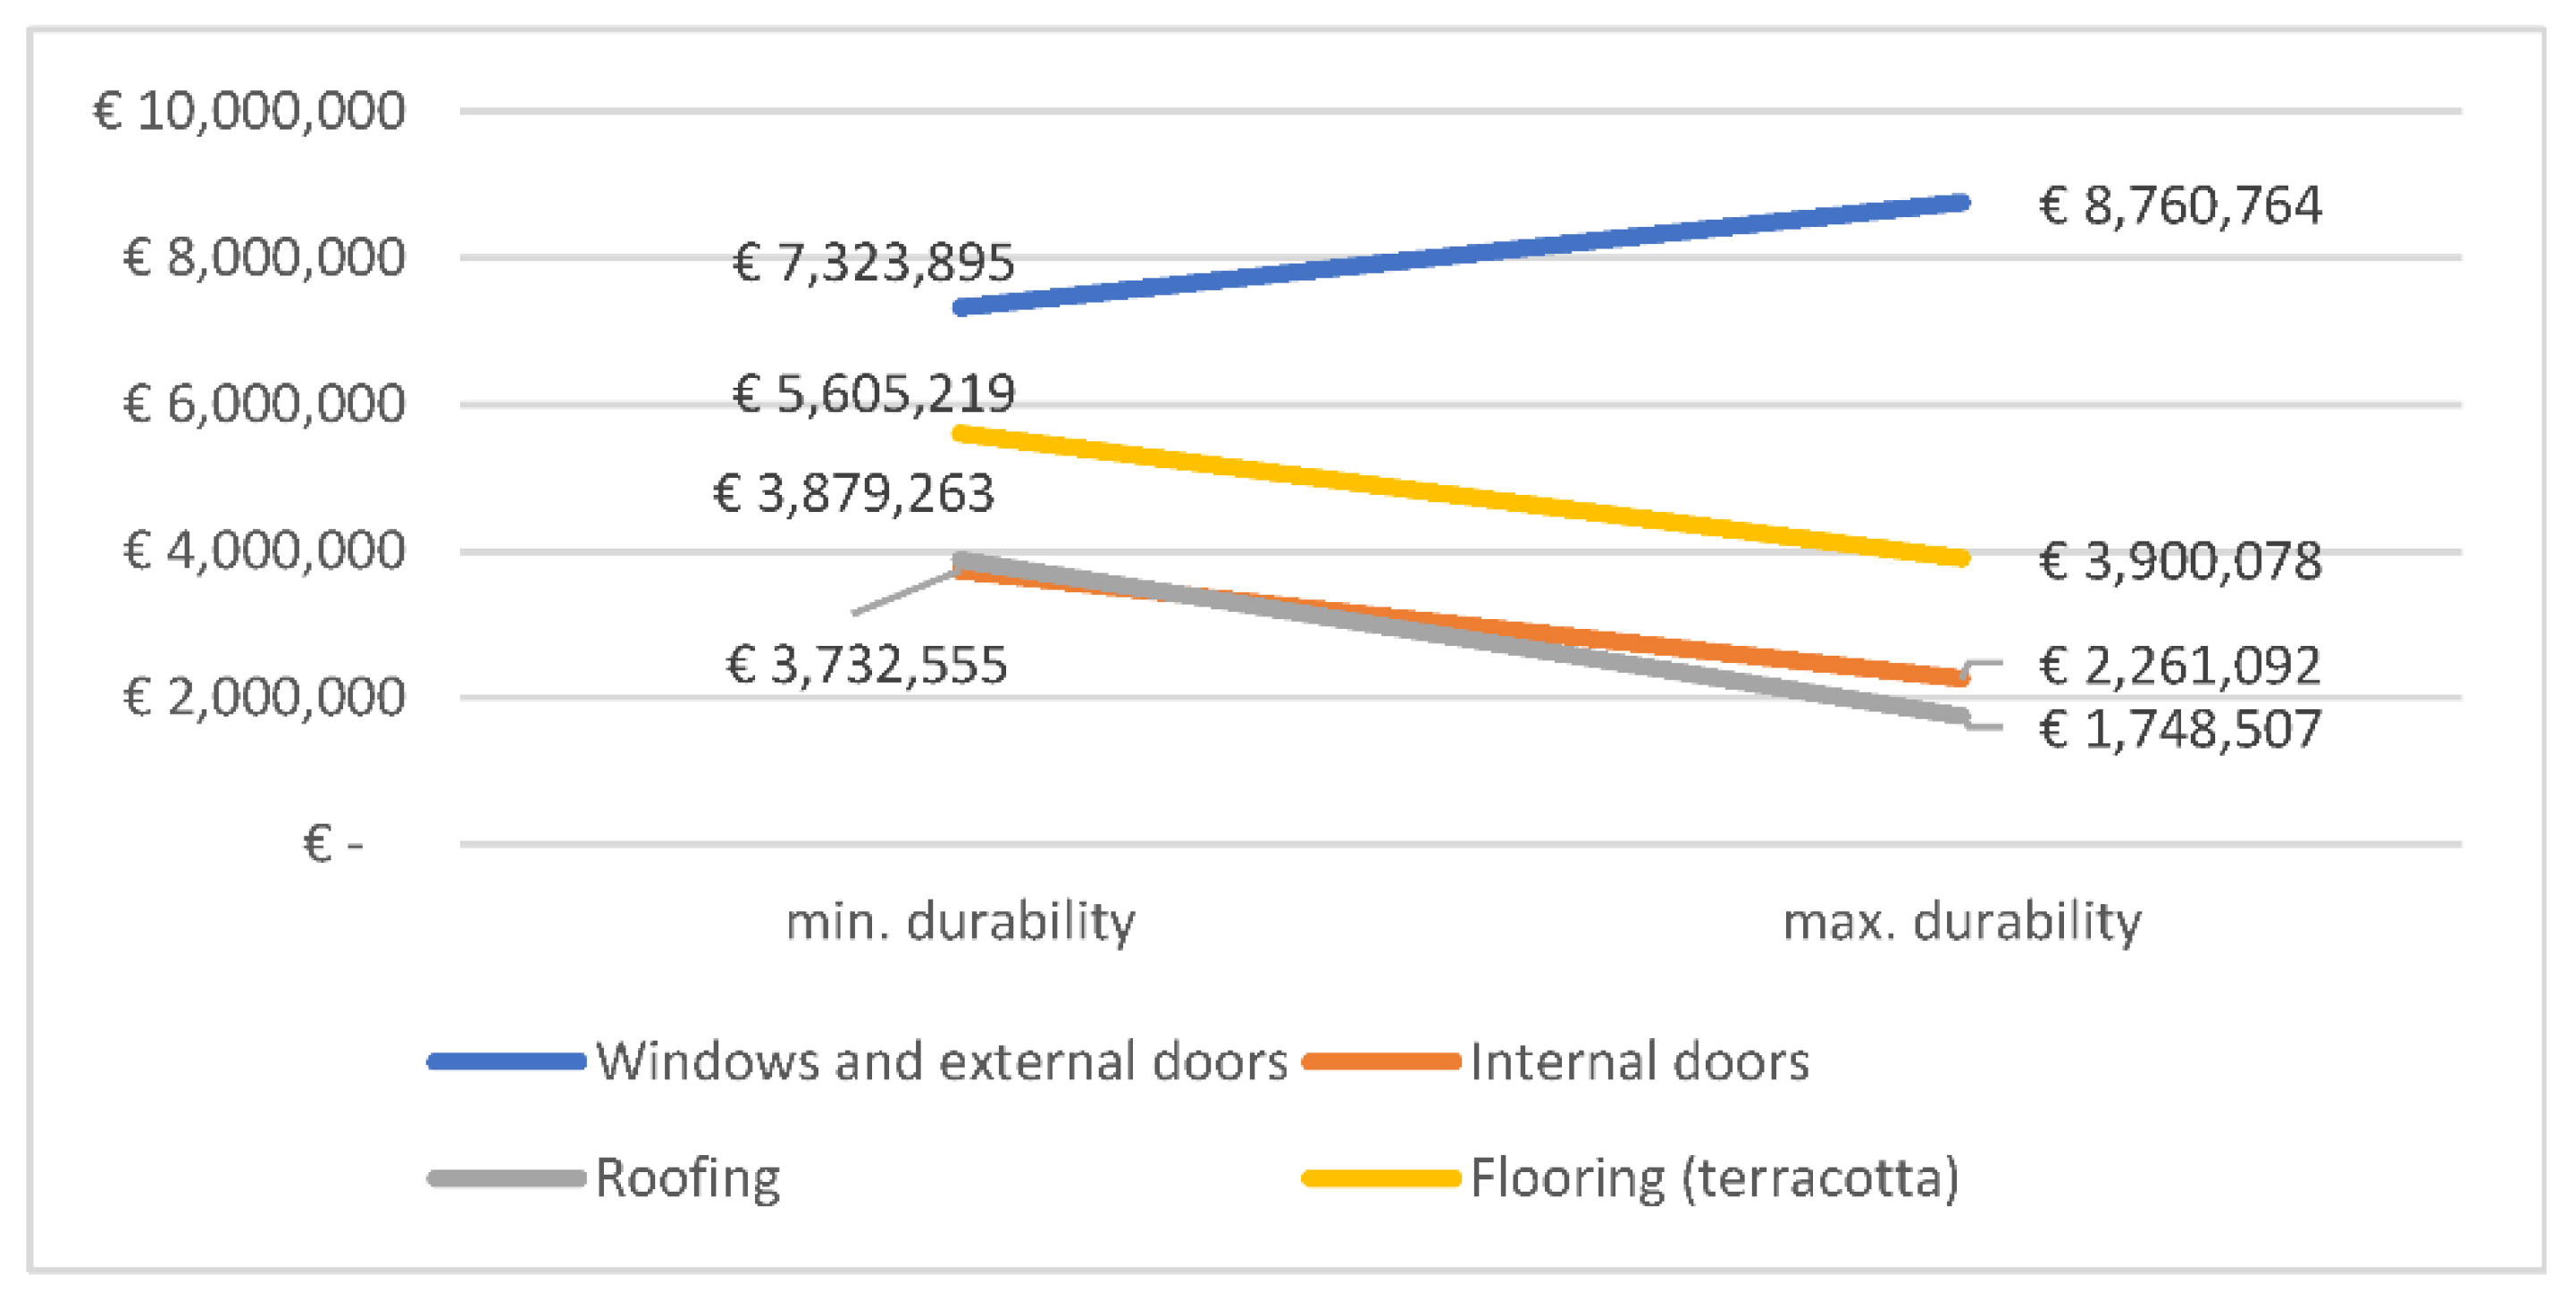
Other elements, i.e., internal doors, roof and floors, remain the cheapest in the case of choosing the most durable solutions and the most expensive in the case of choosing the least durable. Figure 16 shows the results described above.
7. Discussion
The article analyzes the determination of building maintenance costs based on the method proposed in Polish legal regulations. It should be noted here that the method proposed in Polish regulation has certain limitations. The formula is fixed, and some variables are not easy to implement in a realistic way. One of the main limitations is taking into account only the costs of replacing individual elements without the possibility of calculating refurbishment costs, which, in many cases, constitute a significant piece of the maintenance budget. The assumption made in the regulation regarding the calculation of maintenance of some elements is directly contrary to real conditions. For instance, the inclusion of the maintenance costs of elevators requires their replacement 1–3 times, and such actions do not take place in real conditions with a building’s 30-year life cycle. The method used for calculations does not take into account changes in the value of money over time. Another limitation is also the life cycle has to be designated as 30 years.
Another limitation is, for instance, that the warranty period is fixed to one period of time for the whole product calculation, which does not take into account the possibility that, in the whole calculated period, products with different warranty periods will be implemented.
The formula limitations may arise from the fact that the model analyzed, which is given in the regulation, was designed only for the comparison of given offers and shall help in making a decision of which offer is the best during the public procurement procedure. The restrictions imposition is aimed at adopting the same assumptions by all tenderers, which facilitates the evaluation of tenders by the procurer, giving a picture of how the higher initial cost translates into savings during the operation of the building. However, all the above-mentioned limitations make it practically impossible to determine the total maintenance costs in accordance with the regulation. For this reason, the authors decided to carry out a maintenance cost calculation, limited to the cost of replacement, of the selected building elements.
8. Conclusions
One of the components of the life cycle costs of a building, which is particularly difficult to determine, is its maintenance costs incurred during its operation. The article analyzes the determination of building maintenance costs based on the method proposed in Polish legal regulations.
The method’s sensitivity analysis shows that the assumed number of life cycles has the greatest impact. An increase by one cycle increases the value of the maintenance cost by about 25%. The adopted warranty period has the least impact. These are certain dependencies that should be taken into account when considering the obtained results.
In order to obtain a broader picture of the model’s usefulness, a multi-family residential, office and service building was analyzed. The results of the analyses allow us to conclude that, despite the higher price of materials, the most durable solutions, which are the most expensive to purchase, turn out to be the most advantageous in the entire life cycle of the building. It was found that when using solutions with a lower durability, the share of calculated building maintenance costs in the total costs incurred in 30 years of use is about 5% higher than when using solutions with higher durability.
In the extension of the method, the use of NPV for calculations was proposed. From the obtained results, it can be concluded that the most durable materials turn out to be the most profitable to apply, taking into account the entire life cycle of the facility. On the basis of the calculated values, it was found that when using solutions with a lower durability, the share of calculated building maintenance costs in the total costs incurred in 30 years of maintenance is always higher than when using solutions with higher durability. However, this difference is smaller than in the case of calculations in accordance with the Polish regulation and decreases with the increase in the discount rate. Extending the life cycle of a building to 80 years is primarily associated with increasing the number of product life cycles, which largely translates into the obtained results. In the case of windows and external doors, assuming an 80-year life cycle, the cheapest solution is the least durable solution (11 product life cycles were assumed). Intermediate solutions are the most expensive, and the most durable option is the second most economically profitable option. Other elements, i.e., internal doors, roof and floors, remain the most reasonable from the costing point of view for the choice of the most durable solutions, and the least durable appears to be the most expensive ones.
The formula proposed in the regulation is intended for specific purposes (comparison of tenders) and contains many generalizations and simplifications. However, in the authors’ opinion, it can be used to estimate the maintenance costs of selected building elements.
The changes proposed by the authors may enable the model given in the Polish regulation, which is used nowadays only in public procurement areas in Poland, to extend the implementation possibilities both for other areas in Poland as well as in other countries.
Author Contributions
Conceptualization, E.P.; methodology, E.P.; resources, J.G.; data curation, J.G..; writing—original draft preparation, J.G.; writing—review and editing, E.P. All authors have read and agreed to the published version of the manuscript.
Funding
This research received no external funding.
Institutional Review Board Statement
Not applicable.
Informed Consent Statement
Not applicable.
Data Availability Statement
No new data were created or analyzed in this study. Data sharing is not applicable to this article.
Conflicts of Interest
The authors declare no conflict of interest.
References
- Directive 2014/24/UE of the European Parliament and the Council of 26th February 2014 on Public Procurement and Repealing. Available online: https://www.legislation.gov.uk/eudr/2014/24/contents (accessed on 10 October 2021).
- Regulation of the Minister of Investment and Development of 11 July 2018 on the Method of Calculating the Costs of the Life Cycle of Buildings and the Method of Presenting Information on These Cost. Available online: https://isap.sejm.gov.pl/isap.nsf/DocDetails.xsp?id=WDU20180001357 (accessed on 10 October 2021). (In Polish)
- Baryłka, A.; Baryłka, J. Eksploatacja Obiektów Budowlanych. Poradnik dla Właścicieli Zarządców Nieruchomości; Wydawnictwo CRB: Łomianki, Poland, 2016. (In Polish) [Google Scholar]
- ISO 15686-5:2017-Buildings and Constructed Assets-Service Life Planning Part 5: Life cycle costing. Available online: https://www.iso.org/standard/61148.html (accessed on 10 October 2021).
- EN 13306:2017-Maintenance-Maintenance Terminology. Available online: https://standards.iteh.ai/catalog/standards/cen/5af77559-ca38-483a-9310-823e8c517ee7/en-13306-2017 (accessed on 10 October 2021).
- Burt, N. Facilities Management—Good Practice Guide; Facility Management Association of Australia Ltd.: Docklands, VIC, Australia, 2012. Available online: https://www.melbourne.vic.gov.au/SiteCollectionDocuments/good-practice-guide-facilities-management.pdf (accessed on 10 October 2021).
- Jońska, B. Zarządzanie Nieruchomościami Komercyjnymi; C.H. BECK: Frankfurt, Germany, 2014. (In Polish) [Google Scholar]
- Roper, K.; Payant, R. The Facility Management Handbook; AMACOM: New York, NY, USA, 2014. [Google Scholar]
- Sullivan, G.; Pugh, R.; Melendez, A.P.; Hunt, W.D. Operations & Maintenance Best Practices—A Guide to Achieving Operational Efficiency (Release 3). 2010. Available online: https://www.osti.gov/biblio/1034595/ (accessed on 10 October 2021).
- Kaklauskas, A.; Zavadskas, E.K.; Raslanas, S. Multivariant design and multiple criteria analysis of building refurbishments. Energy Build. 2005, 37, 361–372. [Google Scholar] [CrossRef]
- Starynina, J.; Ustinovichius, L. A multi-criteria decision-making synthesis method to determine the most effective option for modernizing a public building. Tech. Econ. Dev. Econ. 2020, 26, 1237–1262. [Google Scholar] [CrossRef]
- Nagar, A. Development of Fuzzy Multi Criteria Decision Making Method for Selection of Optimum Maintenance Alternative. Int. J. Appl. Res. Mech. Eng. 2012, 1, 206–211. [Google Scholar] [CrossRef]
- Tupenaite, L.; Zavadskas, E.K.; Kaklauskas, A.; Turskis, Z.; Seniut, M. Multiple Criteria Assessment Of Alternatives For Built And Human Environment Renovation. J. Civ. Eng. Manag. 2010, 16, 257–266. [Google Scholar] [CrossRef]
- Zavadskas, E.K.; Kaklauskas, A.; Gulbinas, A. Multiple criteria decision support web-based system for building refurbishment. J. Civ. Eng. Manag. 2004, 10, 77–85. [Google Scholar] [CrossRef]
- Bucoń, R. Model supporting decisions on renovation and modernization of public utility buildings. Open Eng. 2019, 9, 178–185. [Google Scholar] [CrossRef]
- Nowogonska, B. Preventive Services of Residential Buildings According to the Pareto Principle. IOP Conf. Series: Mater. Sci. Eng. 2019, 471, 112034. [Google Scholar] [CrossRef]
- Ighravwea, D.E.; Sunday, A.O. A multi-criteria decision-making framework for selecting a suitable maintenance strategy for public buildings using sustainability criteria. J. Build. Eng. 2019, 24, 100753. [Google Scholar] [CrossRef]
- Ji, A.; Xue, X.; Wang, Y.; Luo, X.; Zhang, M. An Integrated Multi-Objectives Optimization Approach On Modelling Pavement Maintenance Strategies For Pavement Sustainability. J. Civ. Eng. Manag. 2020, 26, 717–732. [Google Scholar] [CrossRef]
- Peach, R.H.; Visser, J.K. Measuring human factors in maintenance: A literature review. S. Afr. J. Ind. Eng. 2020, 31, 104–114. [Google Scholar]
- Zhong, S.; Pantelous, A.A.; Goh, M.; Zhou, J. A reliability-and-cost-based fuzzy approach to optimize preventive maintenance scheduling for offshore wind farms. Mech. Syst. Signal Pract. 2019, 124, 643–663. [Google Scholar]
- Batinić, D.D.; Bukvić, A. Use of OEE in Optimization of Maintenance Schedule. Available online: https://www.wirenet.org/wire-journal-international) (accessed on 10 October 2021).
- Al-Refaie, A.; Al-Shalaldeh, H.; Lepkova, N. Proposed Procedure for Optimal Maintenance Scheduling Under Emergent Failures. J. Civ. Eng. Manag. 2020, 26, 396–409. [Google Scholar] [CrossRef] [Green Version]
- Kim, J.-M.; Kim, T.; Yu, Y.-J.; Son, K. Development of a Maintenance and Repair Cost Estimation Model for Educational Buildings Using Regression Analysis. J. Asian Arch. Build. Eng. 2018, 17, 307–312. [Google Scholar] [CrossRef] [Green Version]
- Farahani, A.; Wallbaum, H.; Dalenbäck, J.-O. Optimized maintenance and renovation scheduling in multifamily buildings—A systematic approach based on condition state and life cycle cost of building components. Constr. Manag. Econ. 2018, 37, 139–155. [Google Scholar] [CrossRef] [Green Version]
- Li, C.-S.; Guo, S.-J. Life Cycle Cost Analysis of Maintenance Costs and Budgets for University Buildings in Taiwan. J. Asian Arch. Build. Eng. 2012, 11, 87–94. [Google Scholar] [CrossRef] [Green Version]
- Le, A.T.H.; Domingo, N.; Rasheed, E.; Park, K.S. Building Maintenance Cost Planning and Estimating: A Literature Review. In Proceedings of the 34th Annual Association of Researchers in Construction Management Conference, ARCOM 2018, Belfast, UK, 3–5 September 2018. [Google Scholar]
- Kwon, N.; Song, K.; Ahn, Y.; Park, M.; Jang, Y. Maintenance cost prediction for aging residential buildings based on case-based reasoning and genetic algorithm. J. Build. Eng. 2019, 28, 101006. [Google Scholar] [CrossRef]
- Fregonara, E.; Ferrando, D.G. The Stochastic Annuity Method for Supporting Maintenance Costs Planning and Durability in the Construction Sector: A Simulation on a Building Component. Sustainability 2020, 12, 2909. [Google Scholar] [CrossRef] [Green Version]
- Otmani, A.; Bouabaz, M.; Al-Hajj, A. Predicting Maintenance and Rehabilitation Cost for Buildings Based on Artificial Neural Network and Fuzzy Logic. Int. J. Comput. Intell. Appl. 2020, 19, 2050001. [Google Scholar] [CrossRef]
- Juszczyk, M.; Leśniak, A.; Zima, K. ANN Based Approach for Estimation of Construction Costs of Sports Fields. Complexity 2018, 2018, 1–11. [Google Scholar] [CrossRef]
- Leśniak, A.; Wieczorek, D.; Górka, M. Costs of facade systems execution. Arch. Civ. Eng. 2020, 66, 81–95. [Google Scholar]
- Konior, J.; Stachoń, T. Bayes Conditional Probability of Fuzzy Damage and Technical Wear of Residential Buildings. Appl. Sci. 2021, 11, 2518. [Google Scholar] [CrossRef]
- Wieczorek, D.; Plebankiewicz, E.; Zima, K. Model Estimation of the Whole Life Cost of a Building with Respect to Risk Factors. Technol. Econ. Dev. Econ. 2019, 25, 20–38. [Google Scholar] [CrossRef] [Green Version]
- Chen, C.; Tang, L. BIM-based integrated management workflow design for schedule and cost planning of building fabric maintenance. Autom. Constr. 2019, 107, 102944. [Google Scholar] [CrossRef]
- Lee, M.; Lee, U.-K. A framework for evaluating an integrated BIM ROI based on preventing rework in the construction phase. J. Civ. Eng. Manag. 2020, 26, 410–420. [Google Scholar] [CrossRef]
- Leśniak, A.; Górka, M.; Skrzypczak, I. Barriers to BIM Implementation in Architecture, Construction, and Engineering Projects—The Polish Study. Energies 2021, 14, 2090. [Google Scholar] [CrossRef]
- Zima, K.; Plebankiewicz, E.; Wieczorek, D. A SWOT analysis of the use of BIM technology in the Polish construction industry. Buildings 2020, 10, 16. [Google Scholar] [CrossRef] [Green Version]
Figure 1.
Obtained results for variant I.

Figure 2.
Obtained results for variant II.

Figure 3.
Obtained results for variant III.

Figure 4.
Obtained results for variant IV.

Figure 5.
Summary of the assumed solutions for the widows and external doors.

Figure 6.
Summary of the assumed solutions for the interior doors element.

Figure 7.
Summary of the assumed solutions for the roof element.

Figure 8.
Summary of the assumed solutions for the terracotta flooring element.

Figure 9.
The most and least preferred solutions summary.

Figure 10.
Percentage life cycle costs summary of the most and the least preferred solutions summary for the maintenance costs.
Figure 10.
Percentage life cycle costs summary of the most and the least preferred solutions summary for the maintenance costs.

Figure 11.
Cost breakdown for windows and external doors element for each variant calculated using simple and NPV methods.
Figure 11.
Cost breakdown for windows and external doors element for each variant calculated using simple and NPV methods.

Figure 12.
Percentage life cycle costs summary of each variant of windows and external doors element calculated using simple and NPV methods.
Figure 12.
Percentage life cycle costs summary of each variant of windows and external doors element calculated using simple and NPV methods.

Figure 13.
Percentage average results summary of all materials calculated using simple and NPV methods.
Figure 13.
Percentage average results summary of all materials calculated using simple and NPV methods.

Figure 14.
Percentage life cycle costs summary of the most and the least preferred solutions summary for the maintenance costs. (NPV).
Figure 14.
Percentage life cycle costs summary of the most and the least preferred solutions summary for the maintenance costs. (NPV).

Figure 15.
The cost breakdown for each variant of windows and external doors element assuming 80-year life cycle period.
Figure 15.
The cost breakdown for each variant of windows and external doors element assuming 80-year life cycle period.

Figure 16.
Cost breakdown for each element assuming 80-year life cycle period.


Table 1.
Assumed variants and results presentation.
| Variant | Independent Variable | Range of the Variables | Interval | The Dependent Variable Difference (EUR) |
|---|---|---|---|---|
| I | I (m2) | 1800–2200 | 100 | 144,000 |
| II | K (EUR) | 180–220 | 10 | 144,000 |
| III | N (cycle) | 1–4 | 1 | 1,080,000 |
| IV | Og (lata) | 1–4 | 1 | 8000 |
Table 2.
Data given for the windows and external doors.
| Variant | K (EUR/m2) | N | Og (Years) | Cut (EUR) |
|---|---|---|---|---|
| PVC windows (1) | 128 | 4 | 2 | 2,549,421 |
| PVC windows (2) | 260 | 3 | 3 | 3,733,015 |
| wooden windows | 318 | 2 | 5 | 2,821,026 |
| wooden coated aluminum windows | 628 | 1 | 10 | 2,224,956 |
Table 3.
Data given for the interior doors.
| Variant | K (EUR/m2) | N | Og (Years) | Cut (EUR) |
|---|---|---|---|---|
| interior doors (1) | 192 | 3 | 2 | 1,339,891 |
| interior doors (2) | 230 | 2 | 3 | 1,033,640 |
| interior doors (3) | 322 | 1 | 5 | 669,953 |
Table 4.
Data given for the roof.
| Variant | K (EUR/m2) | N | Og (Years) | Cut (EUR) |
|---|---|---|---|---|
| roofing | 135 | 3 | 5 | 1,293,088 |
| green roof (1) | 162 | 2 | 7 | 951,713 |
| green roof (2) | 174 | 1 | 10 | 444,065 |
Table 5.
Data given for the floors.
| Variant | K (EUR/m2) | N | Og (Years) | Cut (EUR) |
|---|---|---|---|---|
| flooring (1) | 28 | 2 | 2 | 1,788,560 |
| flooring (2) | 41 | 1 | 6 | 1,124,347 |
Publisher’s Note: MDPI stays neutral with regard to jurisdictional claims in published maps and institutional affiliations. |
© 2021 by the authors. Licensee MDPI, Basel, Switzerland. This article is an open access article distributed under the terms and conditions of the Creative Commons Attribution (CC BY) license (https://creativecommons.org/licenses/by/4.0/).
Share and Cite
MDPI and ACS Style
Plebankiewicz, E.; Gracki, J. Analysis of the Impact of Input Data on the Planned Costs of Building Maintenance. Sustainability 2021, 13, 12220. https://0-doi-org.brum.beds.ac.uk/10.3390/su132112220
AMA Style
Plebankiewicz E, Gracki J. Analysis of the Impact of Input Data on the Planned Costs of Building Maintenance. Sustainability. 2021; 13(21):12220. https://0-doi-org.brum.beds.ac.uk/10.3390/su132112220
Chicago/Turabian StylePlebankiewicz, Edyta, and Jakub Gracki. 2021. "Analysis of the Impact of Input Data on the Planned Costs of Building Maintenance" Sustainability 13, no. 21: 12220. https://0-doi-org.brum.beds.ac.uk/10.3390/su132112220
Note that from the first issue of 2016, this journal uses article numbers instead of page numbers. See further details here.