
Building Circularity Assessment in the Architecture, Engineering, and Construction Industry: A New Framework


Information Systems in the Built Environment, Eindhoven University of Technology, P.O. Box 513, 5600 MB Eindhoven, The Netherlands
*
Author to whom correspondence should be addressed.
Sustainability 2021, 13(22), 12466; https://0-doi-org.brum.beds.ac.uk/10.3390/su132212466
Submission received: 12 September 2021
/
Revised: 22 October 2021
/
Accepted: 29 October 2021
/
Published: 11 November 2021
(This article belongs to the Special Issue Architectural, Civil, and Infrastructure Engineering in View of Sustainability)
Abstract
:Circular Economy (CE) has proved its contribution to addressing environmental impacts in the Architecture, Engineering, and Construction (AEC) industries. Building Circularity (BC) assessment methods have been developed to measure the circularity of building projects. However, there still exists ambiguity and inconsistency in these methods. Based on the reviewed literature, this study proposes a new framework for BC assessment, including a material flow model, a Material Passport (MP), and a BC calculation method. The material flow model redefines the concept of BC assessment, containing three circularity cycles and five indicators. The BC MP defines the data needed for the assessment, and the BC calculation method provides the equations for building circularity scoring. The proposed framework offers a comprehensive basis to support a coherent and consistent implementation of CE in the AEC industry.
1. Introduction
The world is experiencing a growing threat of waste, emissions, and other environmental changes. An agile transformation in the construction sector [1] is needed to mitigate these threats. Since 36% of CO2 in the world originated from the architecture, engineering, and construction (AEC) activities [2], the AEC industry has huge potential in reducing waste and emissions in all the phases of design, construction, and demolishment.
Circular Economy (CE) is recently recognized as a possible solution to solve waste and emissions problems in the AEC industry. It contrasts with the “take-make-dispose” linear economy and refers to an industrial economy based on closed loops [3]. By retaining the added value in the loops as long as possible, CE saves material, eradicates waste, and creates opportunities for moving towards more sustainable development.
In the AEC industry, Countries and agencies have set goals to reduce waste and promote circularity. For example, the EU Waste Framework Directive requires all EU countries to have a minimum recycling rate of 70% for Construction and Demolition Waste (CDW) generated by 2020 [4]. The Netherlands has set the target to operate with the CE principle by 2050, and the construction sector is one of the five priority sectors [5].
Researchers investigated the application of CE in the AEC industry for different aspects. Butkovic et al. reviewed 96 published papers and summarized five aspects of CE according to the papers: waste management, reducing the impact on the environment, material & product design, building design, and others [6]. Researchers focus on all stages of buildings, including the design stage [7]. Sparrevik et al. proposed and compared several methods based on LCA for analyzing the environmental performance of buildings. They came to the conclusion that methods at lower systemic levels as well as higher systemic levels can benefit the circular development in the built environment [8]. However, the assessment of CE in the AEC industry is still not yet unequivocally defined and is especially lacking practical approaches [9].
Much research about Building Circularity (BC) focuses on the material flow during the whole lifecycle of a building, especially in the recycling process of building materials and components. Research shows that in the United States, only 6% to 7% of the metallic aluminum has been lost to the environment since 1900. About 68% to 69% are still in use, while about 25% have no clear destination [10]. BC assessment can provide insight into the material flow by indicating the material flow’s completeness and tightness (i.e., the circularity rate). Various research has been executed on circularity assessment approaches in the AEC industry [11]. Almost all the existing methods used in the AEC sector are based on a CE general assessment framework, such as the Material Circularity Indicator (MCI) [12], which is also widely used in other industries. Research about indicators and metrics are conducted to measure the circularity of products and systems. For example, Mesa et al. reviewed the existing CE indicators and developed a new set of indicators for measuring the circularity performance of product families [13]. Parchomenko et al. executed a multiple correspondence analysis of 63 metrics and proposed a standardized visualization framework for CE metrics. This framework is provided for integrating existing complementary CE metrics and facilitating further CE metrics [14]. Ruiz-Pastor et al. measured the relationship between personal intrinsic factors and circularity in design [15]. Vinante et al. collected and analyzed CE assessment indicators at firm-level metrics and organized them in a framework which matches metrics and functions and facilitates user individuation [16]. R strategy factors are developed to 10R in CE assessment [17]. However, by its nature, a building is a large industrial product with many materials and components. Size is more prominent than for other industrial products, and its lifetime is longer than most other industrial products. The assessment of CE in the AEC industry, defined as Building Circularity (BC) assessment in this paper, is relatively underexplored.
This research aims to fill the following observed research gaps:
- While different tools are created for BC assessment, many assessment methods are limited to the perspective of a specific cycle, such as the environmental or technical cycle, which leads to an incomprehensive assessment.
- Comprehensive dedicated circularity models with indicators for the AEC industry according the material flow in building construction are lacking.
- The application of R strategy factors is far from practical for BC assessment.
In this paper, Building Circularity (BC) assessment is explored, focusing on the AEC domain. The framework developed in this paper contains three main parts: a material flow model, a BC Material Passports (MP), and a BC calculation method. The material flow model is the core part of the framework that redefines the concept of BC assessment, containing three circularity cycles and five indicators. It contains different circularity loops with R strategy factors. And all the R strategy factors are defined. The MP and the detailed BC calculation methods are combined with the material flow model to store data and complete specific calculations. Therefore, a systematic review is executed, and a new framework is proposed. Section 2 introduces the systematic review approach used in this paper. Section 3 addresses the material flow model, followed by the discussion of material passports in Section 4. Section 5 shows the BC calculation method. In Section 6, conclusions are drawn on the contribution to BC assessment and the limitations of the proposed framework.
2. Systematic Review Exiting Building Circularity Assessment Methods
The literature review of existing BC assessment methods is conducted by searching, selecting, and reviewing papers relevant to CE assessments in the AEC industry. In this research, Scopus was used to search for relevant papers. Since CE is a new concept, related terms are used to find more results. With the search term 1 “circular economy “or “circularity”, used in combination with term 2 “construction”, and term 3 “indicator” or “assessment”, 442 articles were found. Many of the papers found in this first step have no clear relationship with the topic of this work. Therefore, they were excluded in the second step of selection, leaving 38 relevant papers. Nine of these papers are duplicated, so 27 papers are reviewed in this work. These papers showed that most of the developed assessment methods have been published since 2016. Table 1 shows the stepwise process, including the keywords and the number of found papers.
Next, the search was expanded with other keywords associated with the CE in the AEC industry. The keywords chosen here are the words that have a similar meaning relevant to CE, such as “recycling”, or that are related to BC assessment, such as “sustainable development” and “waste management”. We found this extension necessary because research in these fields has a long tradition and is more mature. Besides these academic papers, other documents published by companies, for example, the description of the CE calculation method for a building from the company Madaster [18], were included. Finally, 60 pieces of research were selected and reviewed to develop the new BC assessment framework presented in the following sections. All the scientific articles analyzed in this work have been published before September 2021.
The selected papers are categorized into three main BC assessment aspects: (1) material flow model, (2) material passports, and (3) BC calculation method, altogether constituting a novel BC assessment framework. These three BC assessment aspects are presented in the following sections subsequently. Every section has the same structure. First, the existing situation is discussed using the selected literature. Second, a new model or method is proposed, addressing the AEC demands. Third, an analysis of the new proposed model/methods is presented, highlighting the differences with the existing situation.
3. Material Flow Model
3.1. Existing Material Flow Models
The existing material flow models review starts from the definition of CE in general and CE in the AEC industry. CE is a new concept, which caused extensive discussion in recent years. Saidani et al. [19] showed that a good definition of CE is still lacking, while the number of CE indicators has reached 55. CE, as a complex and fuzzy concept, is hard to summarize as a generic concept. However, a suitable CE concept is needed to guide the successful implementation. One of the most used CE definitions that originate from the Ellen MacArthur Foundation is “an economic and industrial model that is restorative by intent and design” [20]. “Taking a new systemic perspective, it replaces the concept of waste with the one of restoration and aims to decouple economic growth from the use of virgin resources.” Collecting and analyzing 114 CE definitions, Kirchherr et al. [21] conclude that “CE is an economic system that replaces the ‘end-of-life’ concept with reducing, alternatively reusing, recycling and recovering materials in production/distribution and consumption processes.”.
While there are the concepts of CE in general, the concept for CE in the AEC industry, Building Circularity (BC), requires a dedicated definition within the AEC context. A CE definition in the AEC industry was found in CB23 [22], which states that “Circular construction means the development, use, and reuse of buildings, areas, and infrastructure without unnecessarily depleting natural resources, polluting the environment and affecting ecosystems.” Research is needed for CE development in the AEC industry to develop a more consolidated theory on CE in construction and provide planning mechanisms to assist decision making.
Life Cycle Assessment (LCA) is a method for assessing the environmental impacts associated with all stages of the lifecycle of a commercial product, process, or service, and it has already become an important method for sustainability and waste assessment. Weissenberger and Ortiz’s work reviewed the development of LCA for the assessment of environmental impact for buildings. Their work shows that the development of LCA has already contributed significantly to sustainability in the AEC industry [23,24] and has the potential to contribute to BC.
Waste management is an important theme of BC [25,26]. The structure and content of the waste management model have been studied for many years. As early as 1994, Craven et al. [27] had developed a linear production and consumption model with the four steps of resources: Virgin–Production–Use–Waste. Meibodi et al. [28] suggested that recycling waste can simultaneously solve several problems, such as decreasing the landfill and cost-saving. Gharfalkar et al. [29] summarized existing “waste hierarchy” and proposed alternative definitions of them. The concept of waste management hierarchy developed by Gertsakis et al. [30] made systematic classification and assessment of the waste in the construction process, which could also be an essential part of the material flow management under BC. It shows that avoiding waste should proceed with recycling and disposal. The hierarchy proposed in the research contains reduce, reuse, recycle, treatment, and disposal, ranging from most desirable to least desirable.
Many other researchers proposed their alternative waste hierarchy structure by R strategies. The research by Gehin et al. [31] presented a 3R strategy: reuse–remanufacturing–recycle, and a framework that applies the 3R strategy in designing products in the early phase. Li [32] developed a 5R framework for a comprehensive CE assessment, in which the indexes of element, environment, economy, social, and management are included. The research by Yeheyis et al. [33] developed a 3R framework of reduce–reuse–recycle and a comprehensive strategy for implementing the framework for the decision-making of selection, classification, and management of materials. Bakker et al. [34] introduced three hierarchical design strategies for product life extension and recycling: prevention–reuse–recycling. Vermeulen et al. expanded the R strategies to 10R and redefined each of them [17].
Few studies focused on R strategies in the AEC industry. Ping et al. [35] used a case study in Taiwan to show their 5R strategy of CE in a construction project. In this research, 5R of rethink–reduce–reuse–repair–recycle is adopted. Table 2 shows an overview of the R strategies chosen by these different pieces of research.
Publication reports increased in recent years on the topic of BC assessment models. We will discuss the recently published papers about BC assessment, followed by the influential BC assessment models in the AEC industry from MCI, Madaster, and CB′23 in more detail.
The papers reviewed here assessed the circularity of buildings under different dimensions and different types of buildings. Zimmermann et al. proposed a framework including scenarios for preservation and renovation to evaluate circular economy strategies in existing buildings [36], while Gravagnuolo et al. focused on the environmental impacts of historic buildings conservation under the CE perspective [37]. Wolf et al. analyzed the environmental impact of buildings according to the CE principles [38]. Eberhardt et al. made a comparison of allocation approaches to solving the problems of allocating benefits and burdens between systems [39]. Antonini et al. studied the indicators of reversibility and durability in the BC assessment [40]. Abadi pointed out a development direction of the BC assessment model, including twelve indicators [41]. Nuñez-Cacho analyzed the development of a CE measurement scale and created a framework in seven dimensions [42], and Charef summarized 64 indicators and 5 entities [43]. Hossain reviewed the existing research and concluded that the environmental dimension and policy framework are only studied by a small percentage of research. Moreover, the economic and social dimensions of CE in the AEC industry are ignored in the existing studies. Further comprehensive evaluation strategies adopting the CE principle in the AEC industry which considers the full life cycle of buildings and the multiple dimensions are needed [44].
The MCI model, “calculating a Material Circularity Indicator for manufactured products and companies”, is currently used to make assessments about the circularity of products in general [12]. The platform from Madaster functions as “a missing link in the transition to a circular economy: a central platform where the identity, quality, as well as the location of materials in buildings can be registered.” The model is designed to “objectively measure the circularity level of both technical and biological lifecycles, and to determine a single Madaster score” [45]. CB′23 is a model established for “providing insight into the degree of circularity of a material, product, structure or area” [22].
In MCI, there are two cycles in the circular process: the technical cycle—the recycled properties of materials and the biological cycle—the environmental influence. Material source in input and output, and the efficiency of the recycling process are used as indicators for the material flow; the lifetime and the functional units achieved during the product lifetime are used as indicators for utility. By using these indicators, it calculates the circularity of products and gets a score as the assessment [12]. MCI provides scores of Circularity, Value capture, Recycled content and Reuse index [46]. Madaster only focuses on the technical cycle [18]. Since MCI is the most popular circularity model for all industries, the model from Madaster borrowed the basic concepts from MCI and made some adjustments. In the model, three scores for the three-phase of buildings are calculated separately: the production phase, the usage phase, and the demolishment phase. CB′23 claims the inclusion of the biological cycle. This model first classifies the materials and then calculates the circularity of each material with several different indicators.
3.2. New Material Flow Model
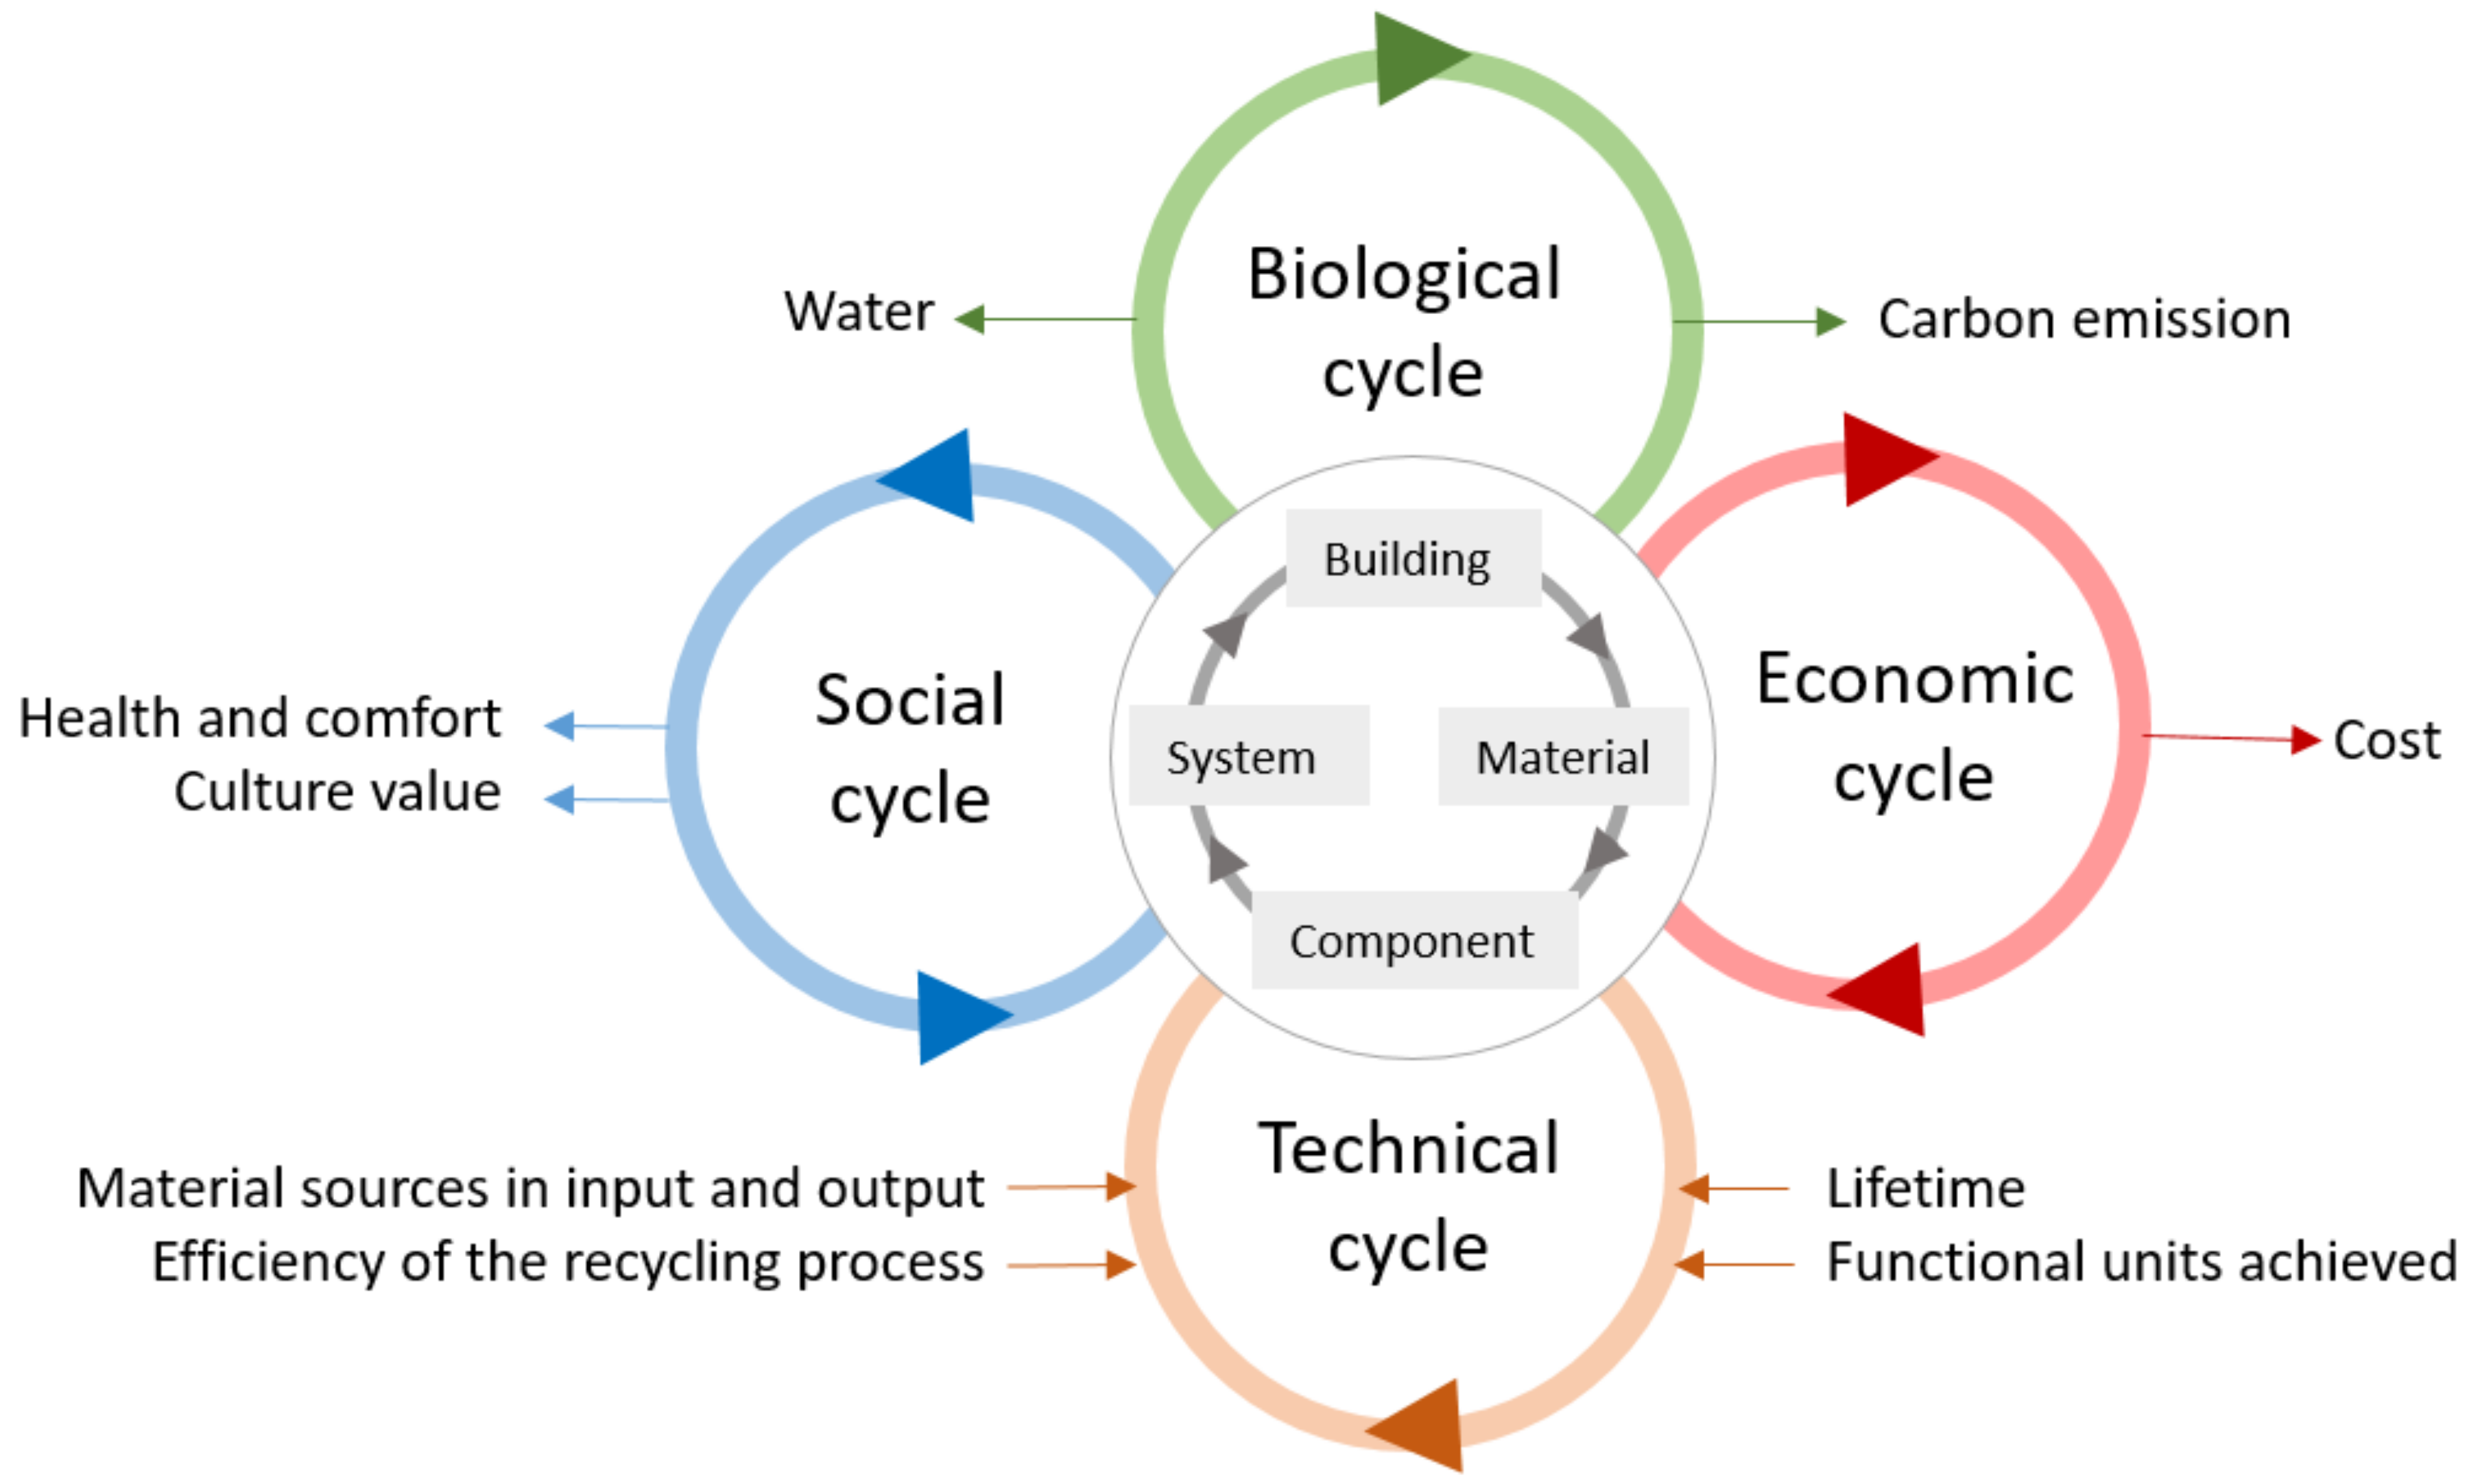
A new material flow model is introduced in this paper. As mentioned before, currently, there is no clear BC definition. When combining CE’s definition [21] with the activities’ characteristics in the AEC industry, the new definition of BC can be derived. BC is a building property that describes the circular capability, including its construction activities to create environmental quality, economic prosperity, and social equity by repair, reuse, refurbish, remanufacture, and recycle.
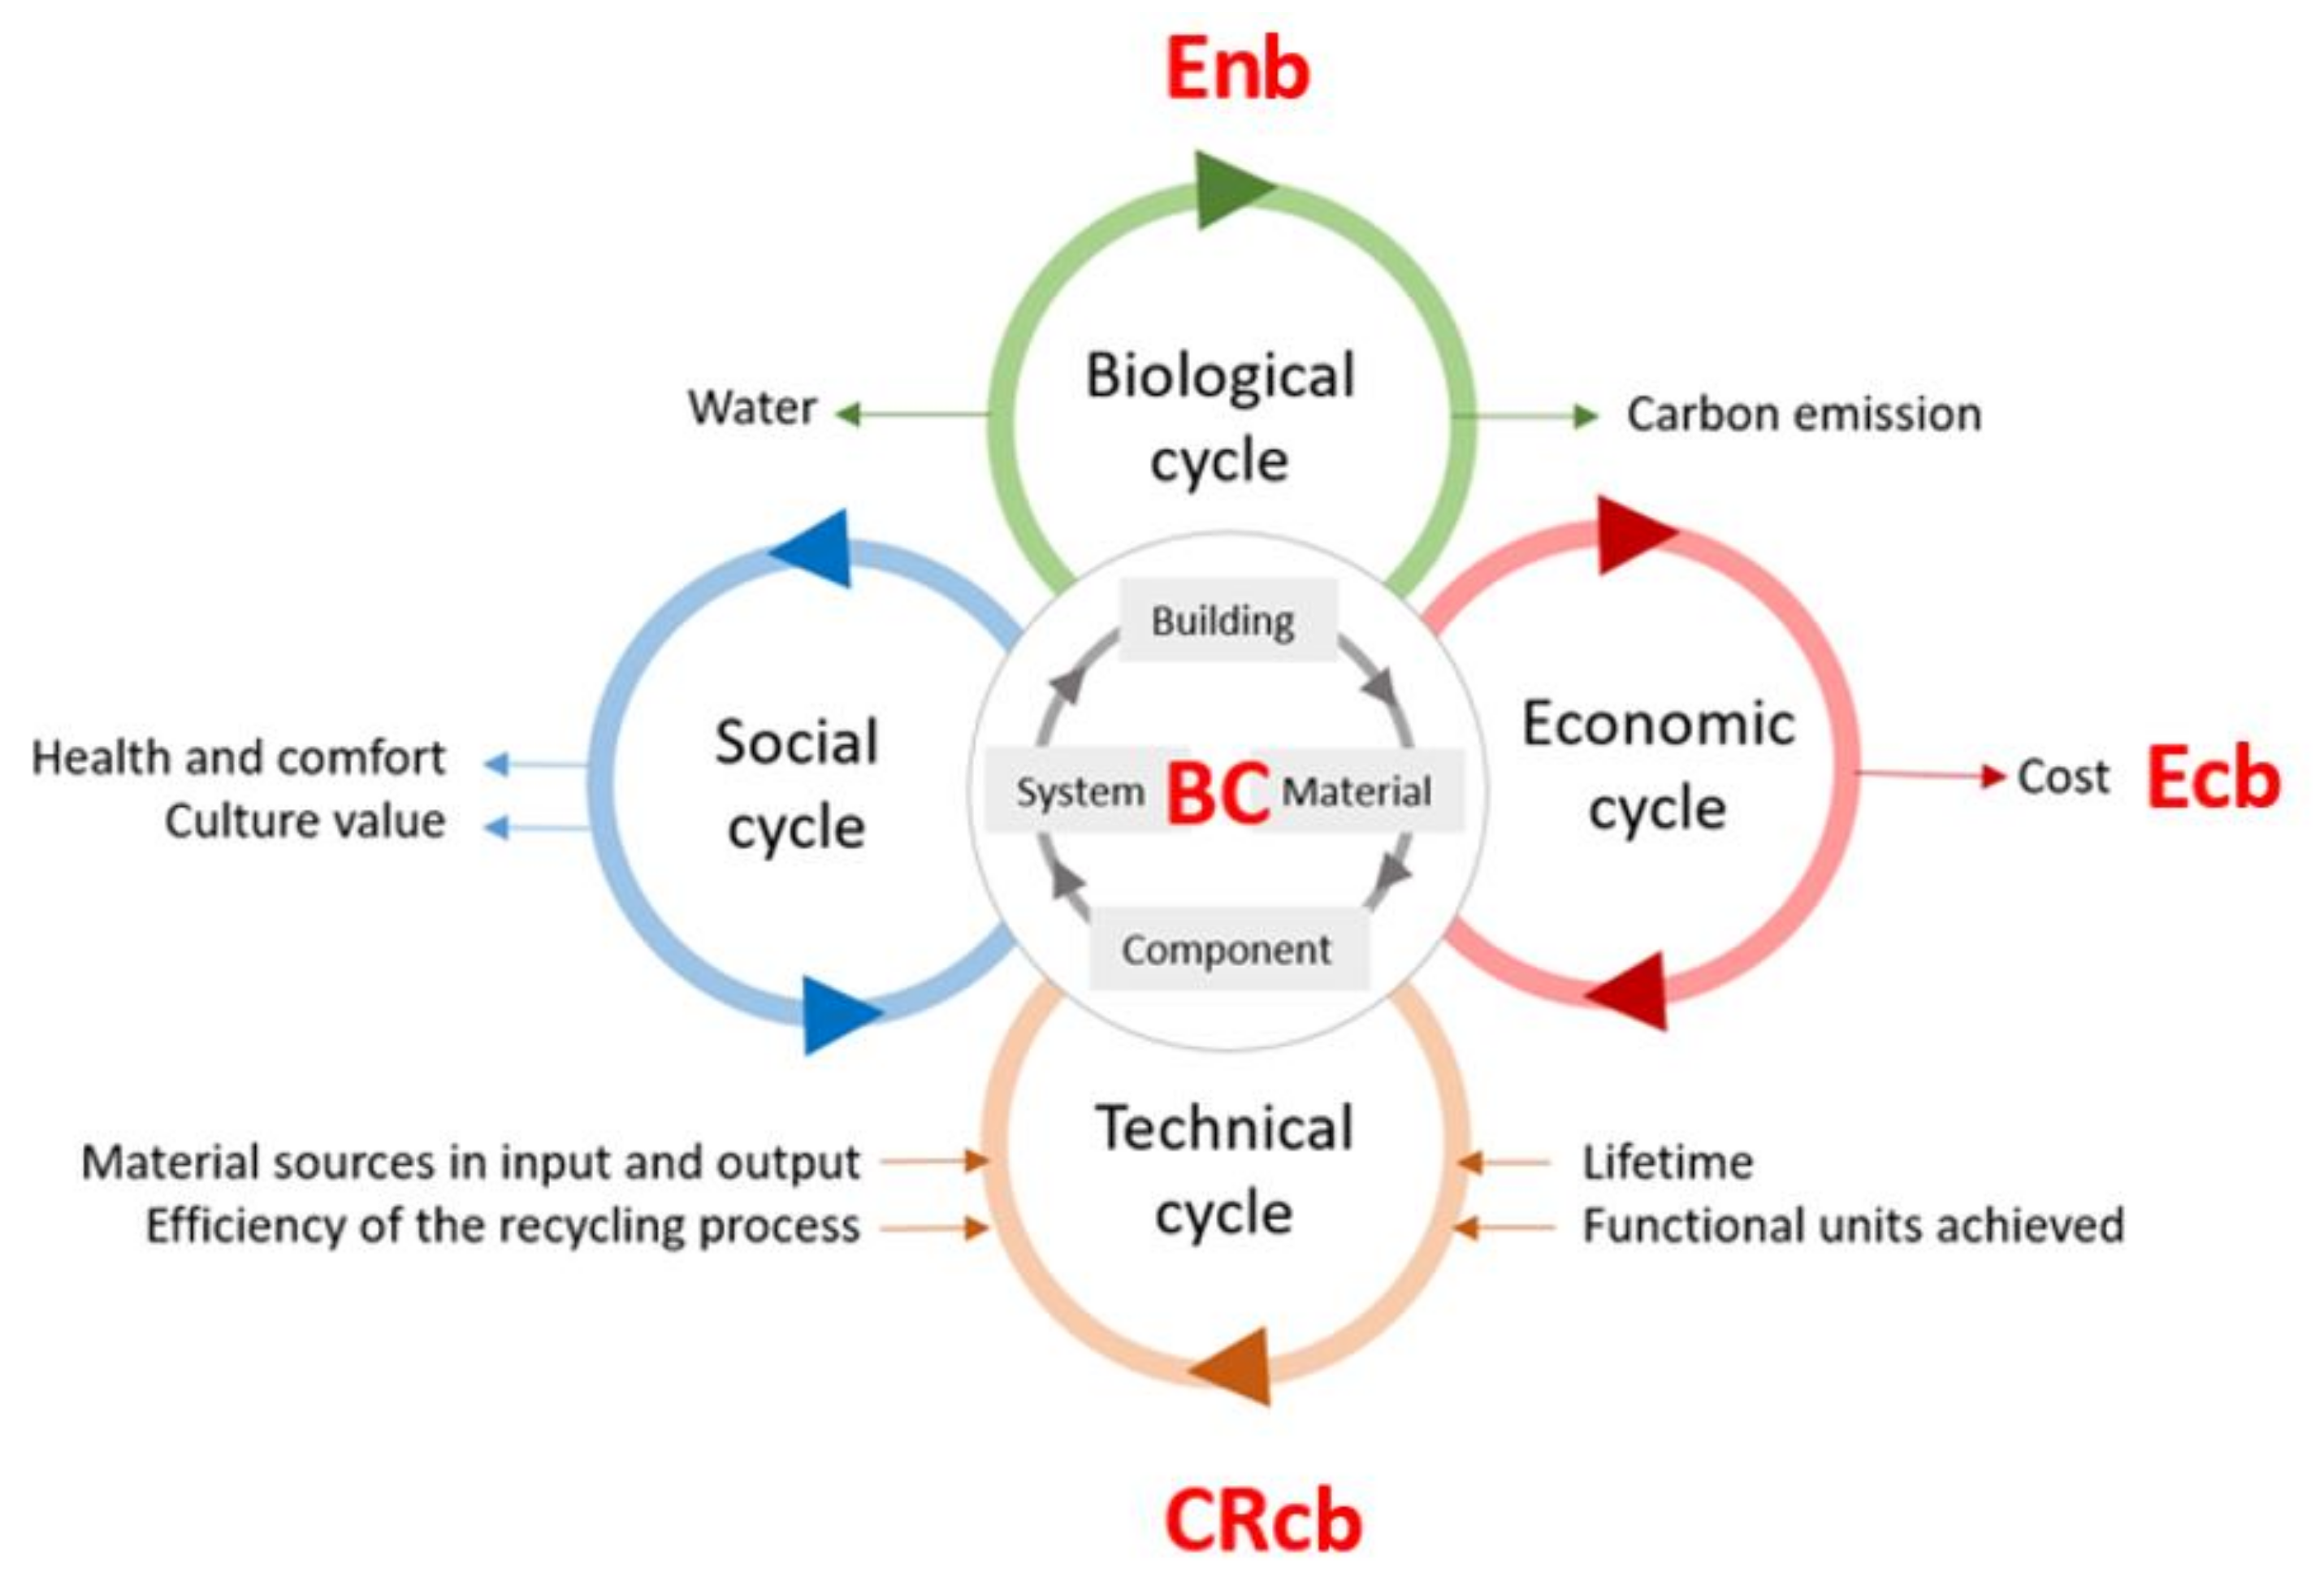
In line with the definition, the BC is assessed through all four aspects of the environment, economy, society, and technology, shown in Figure 1. The model contains both the technical and biological cycles and adds the social and economic cycles. The circularity calculation of the biological cycle builds on the existing LCA methods and data, while the circularity calculation of the economic cycle takes the existing Life Cycle Cost (LCC) method and data as the starting point. The social aspect is hard to quantify and not further elaborated here.
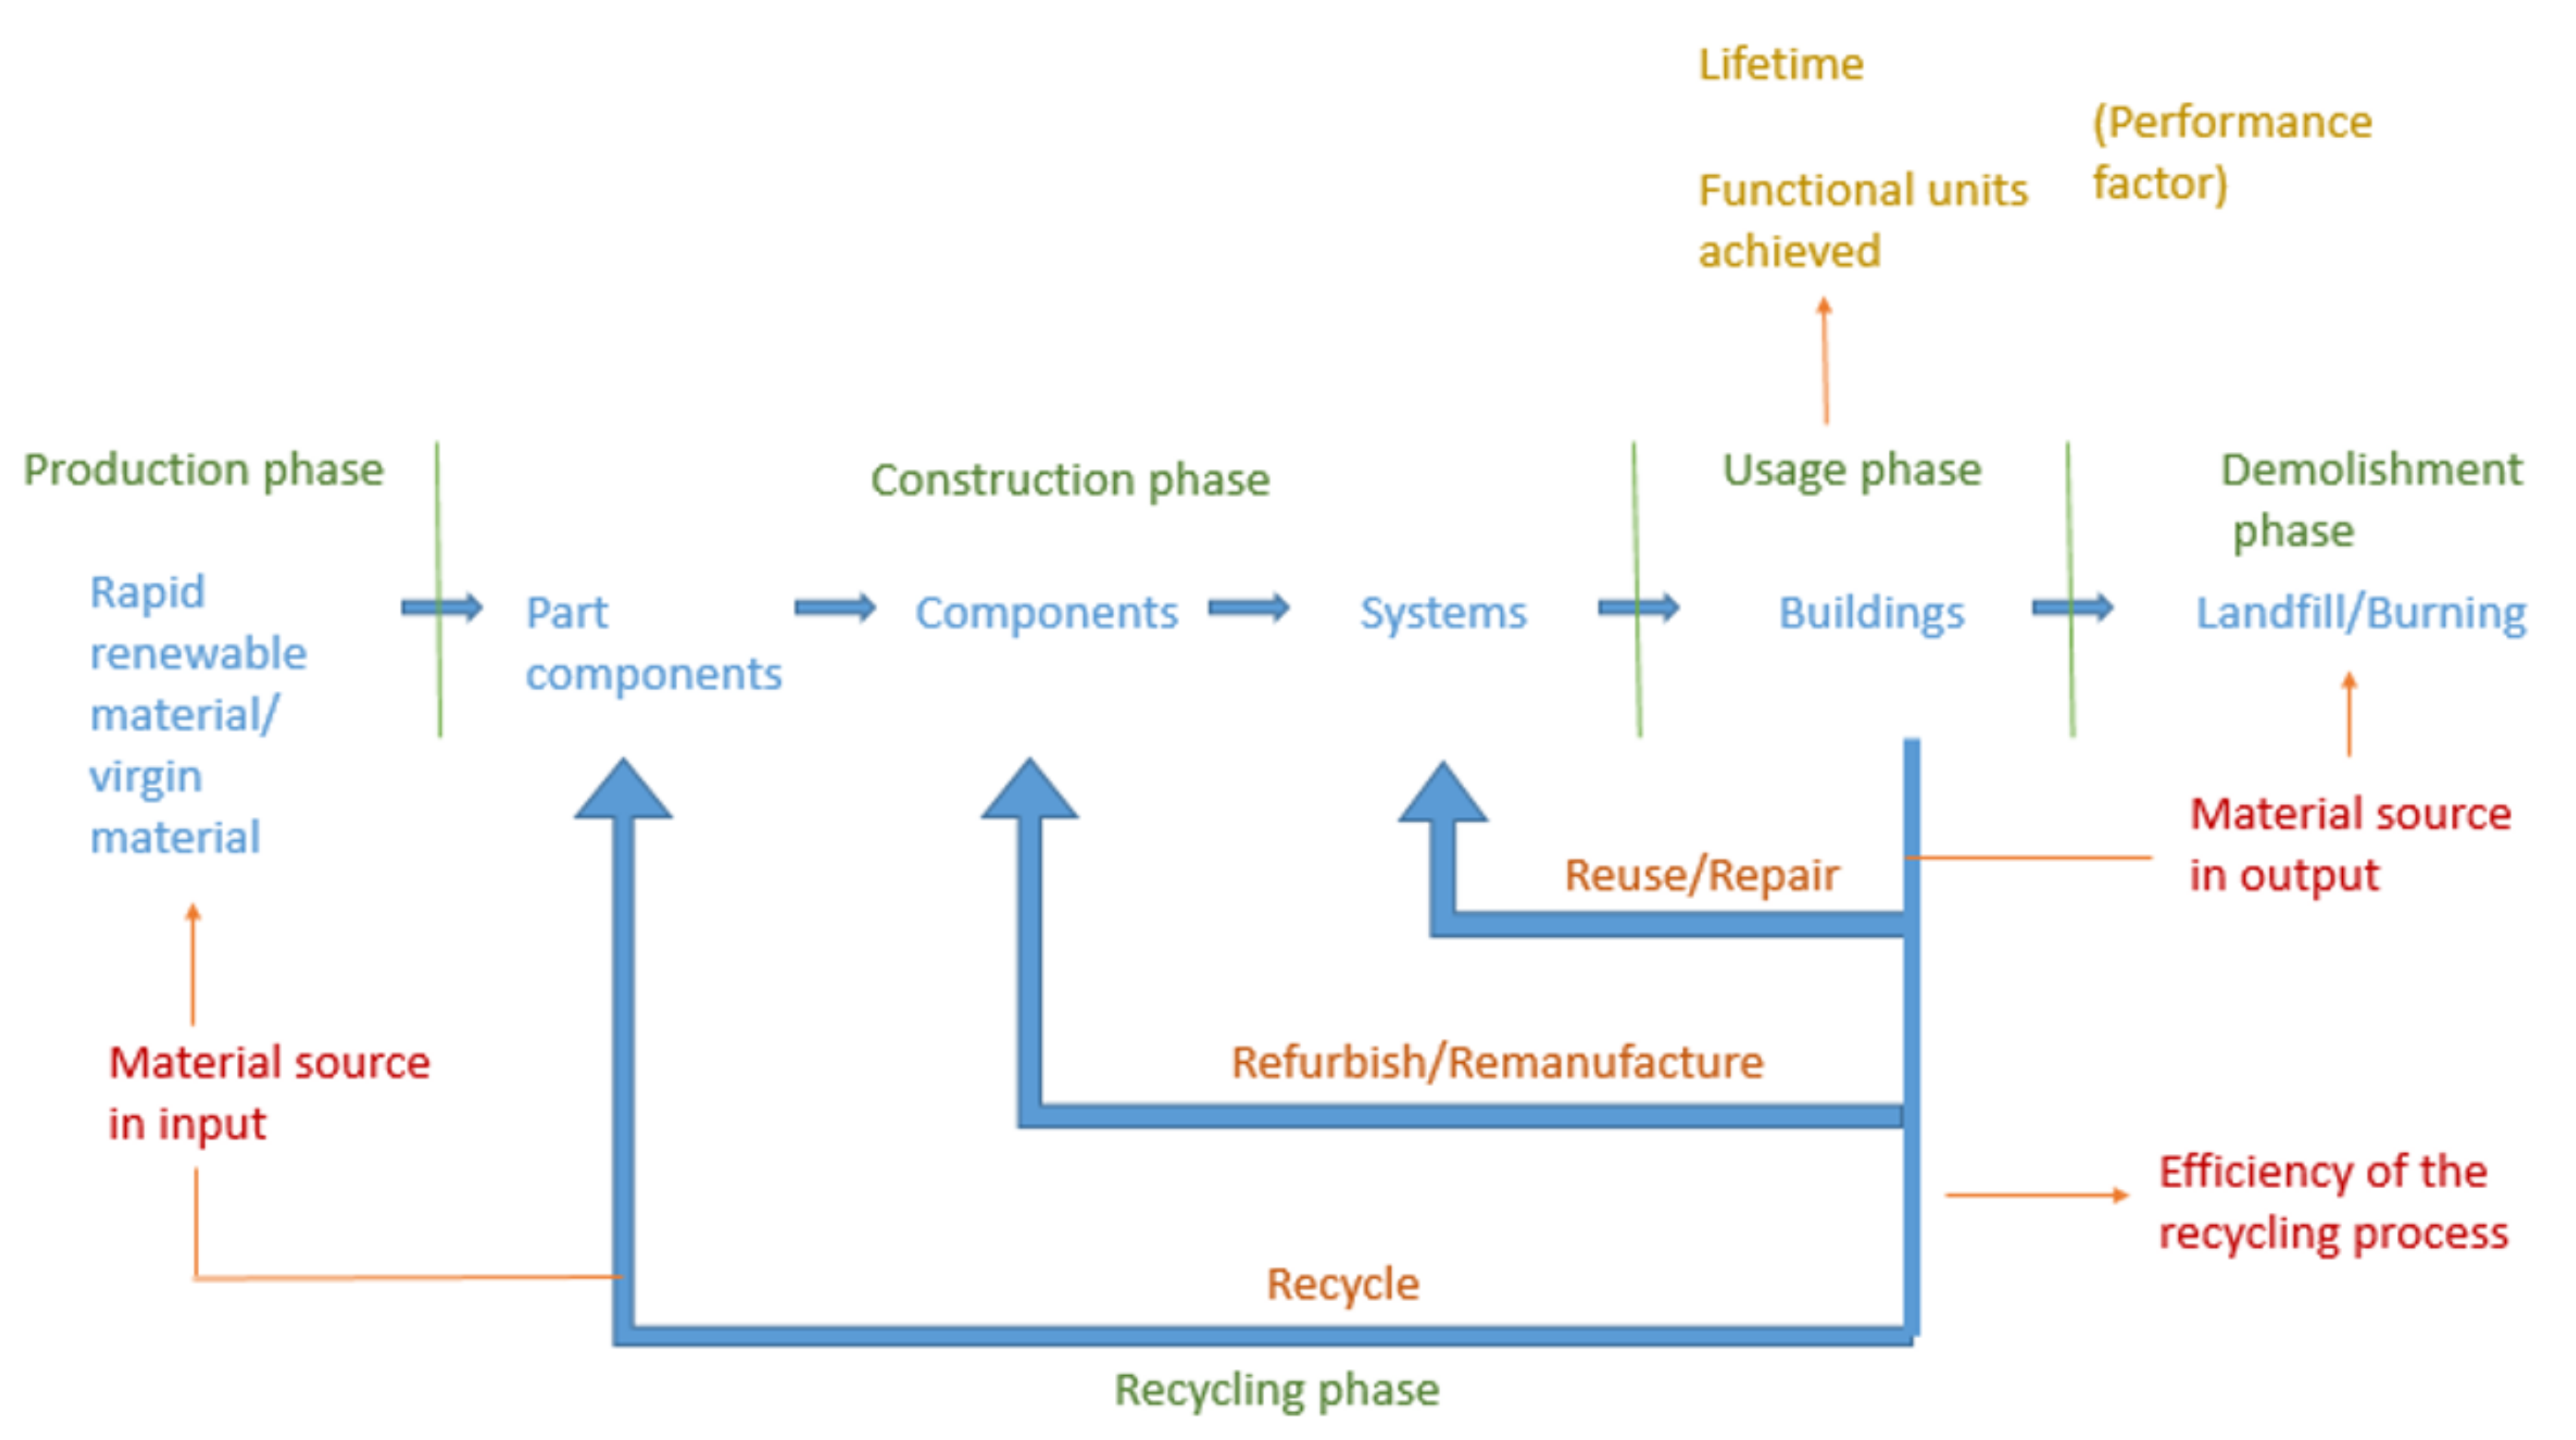
Figure 2 shows the new material flow model and the different indicators that influence BC in different phases during the buildings’ whole technical, economic, and biological lifecycle. The materials undergo the process of “rapid renewable material or virgin material” in the production phase; “part components”, “components”, and “systems” in the construction phase; “buildings” in the usage phase; and “landfill or burning” in the demolishment phase in the linear economy [47]. In the building lifecycle, there are other, new phases—recycling that includes reuse, repair, refurbish, remanufacture, and recycle (shown in Figure 2). Material source in input and output is influenced by the length of loops in the recycling process, and all the circularity loops here are closed. There are several kinds of loops here. In the shortest loop, the recycling of the systems is conducted directly, while in the longer loop, the systems are further disassembled into components and circulated. Material recycling exists in the longest loop. In the actual recycling of construction, there may be a mixture of each loop.
Five indicators are included in the loops. “Material source in input” is the input of material entering the production phase and recycling process. “Material source in output” is the output of material in the demolishment and recycling phase. In the loop, the resource can get lost in the “efficiency of the recycling process”, which is associated with the concept of “disassembly”. “The functional units archived” of a product system is a quantified description of the performance requirements that the product system fulfills. It means how many people use these buildings during their lifetime. “The lifetime” is the duration of materials, components, or buildings being used. All of the indicators are shown in Figure 2.
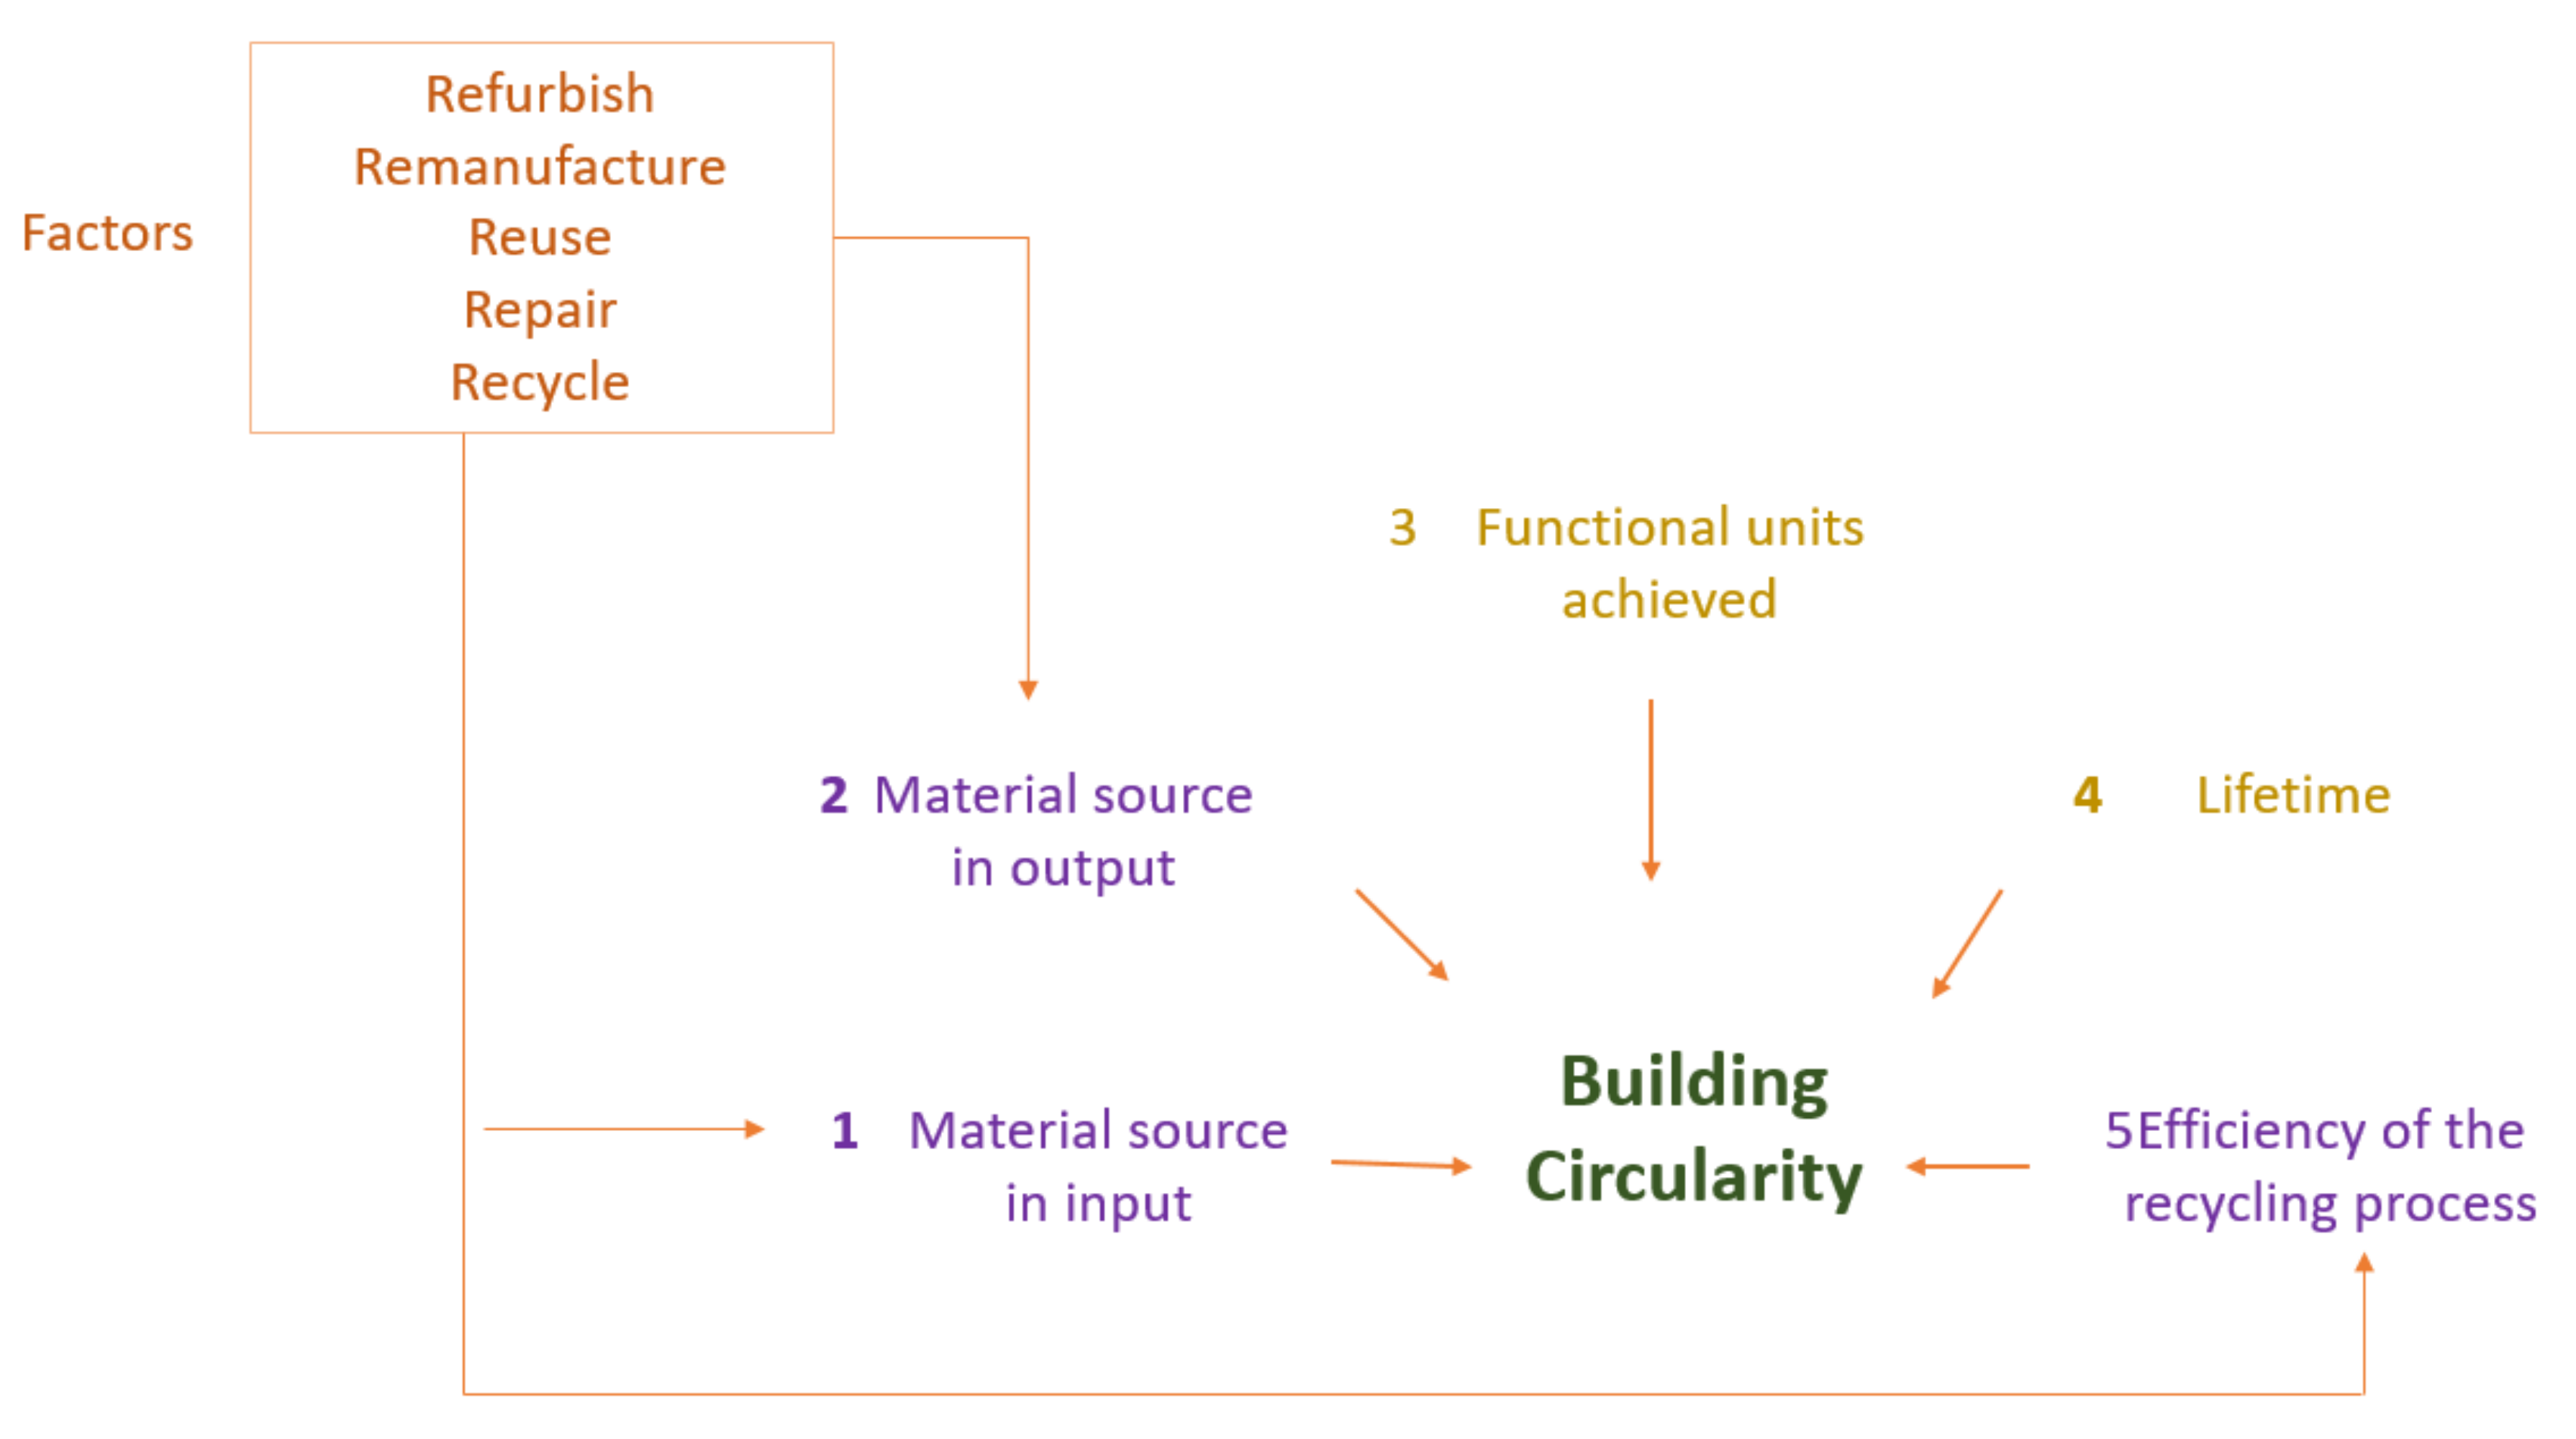
A new concept, “Factor”, is defined here, referring to properties of the recycling phase in R strategy that describe the source and destination of material sources in the material flow. The factors are shown in Figure 3, including reuse, repair, refurbish, remanufacture, and recycle. All five material flow factors of R strategy are defined: Reuse—the building/component/system is used in other buildings directly without any process; Repair—the building/component/system is changed partly, and the renewed one is the same as the old one; Refurbish—most of the building/component/system is changed, and the renewed one is almost the same as the old one; Remanufacture—the building/component/system are completely remanufactured and used again for the same purpose; Recycle—the material/component/system are used again for a different purpose. To calculate these factors more systematically, the circularity level of these factors should be defined. For example, the circularity level of reuse should be the highest among all these factors. Therefore, “recycle” should be less circular than “reuse”. It is also a more BC-friendly choice to use rapidly renewable material rather than other virgin materials, but it is not as circular as reused materials. At the end of the recycling process, the materials finally become waste and enter the demolishment phase. We can assign weights to these different factors for calculation purposes.
Figure 3 shows the relationship between the used BC indicators and the factors in material flows. All five indicators are used for the calculation of the BC. Among them, the three BC indicators (Material source in input, Material source in output, Efficiency of the recycling process) are indicators influenced by the factors, while the other two indicators (Functional units achieved, Lifetime) have no relationship with the factors.
3.3. Material Flow Model Analysis
The application scopes of MCI, Madaster, CB′23, and new material flow model differ, as shown in Table 3 [12,18,22]. While MCI is established for all industries, the other three models are created for the AEC industry only. The material flow model contains the three cycles in the assessment: the technical cycle, the biological cycle, and the economic cycle. The cycle comparison is shown in Table 3.
Table 4 shows the comparison of indicators used in these models. For example, the model of Madaster ignores the indicators for the efficiency of the recycling process and functional units achieved [48]. The material flow model includes the indicator of functional units achieved. This indicator refers to the average number of people who use the building every day during the whole life cycle of the building.
Madaster uses the same R strategy factors as MCI. Despite using different words, the factors defined in MCI and CB′23 are similar, such as “reuse materials” and “secondary material from reuse”. There are a few differences between these two models. CB23 divides the material by input and output and defines waste scenarios for loss, burning, and landfill. In contrast, MCI defines material for refurbishment and remanufacture. The material flow model includes five defined factors: recycling, refurbishment, remanufacture, reuse, and repair. However, it does not include waste scenarios for loss, burning, and landfill, because these are not part of the recycling phase (see Figure 2).
R strategy factors in the model are used to calculate the indicators in the BC assessment models. Although the material flow model factors are the same for input and output, the values are different. The input value shows the material flow before the building/system/component was installed/constructed, while the output value denotes the estimated material flow after recycling.
4. Material Passports
4.1. Existing Material Passports
BC assessment needs data that provide detailed information on materials and components. Data used for the material flow models mentioned in Section 3 are reviewed here. Building as Material Banks [49] is a type of Material Passport (MP) that provides a European data set that focuses on the circularity information of the materials and components, such as the amount of material used from recycling. The model from Madaster uses two local Material Databases (MD): the Netherlands Institute for Building Biology and Ecology (NIBE) and Nationale Milieudatabase (NMD) [50,51]. MD such as NIBE and NMD and MP such as BAMB all provide information on materials and components. The distinction is that MD does not record information for materials and components in building projects, while MP follows the development of the materials and components during their whole lifecycle, including the recycling process. MD and MP can exist at different levels: building, system, component, and material. The higher levels contain aggregated data from the lower levels. The following screenshots are adapted from the official website of these databases and translated from Dutch to English if needed.
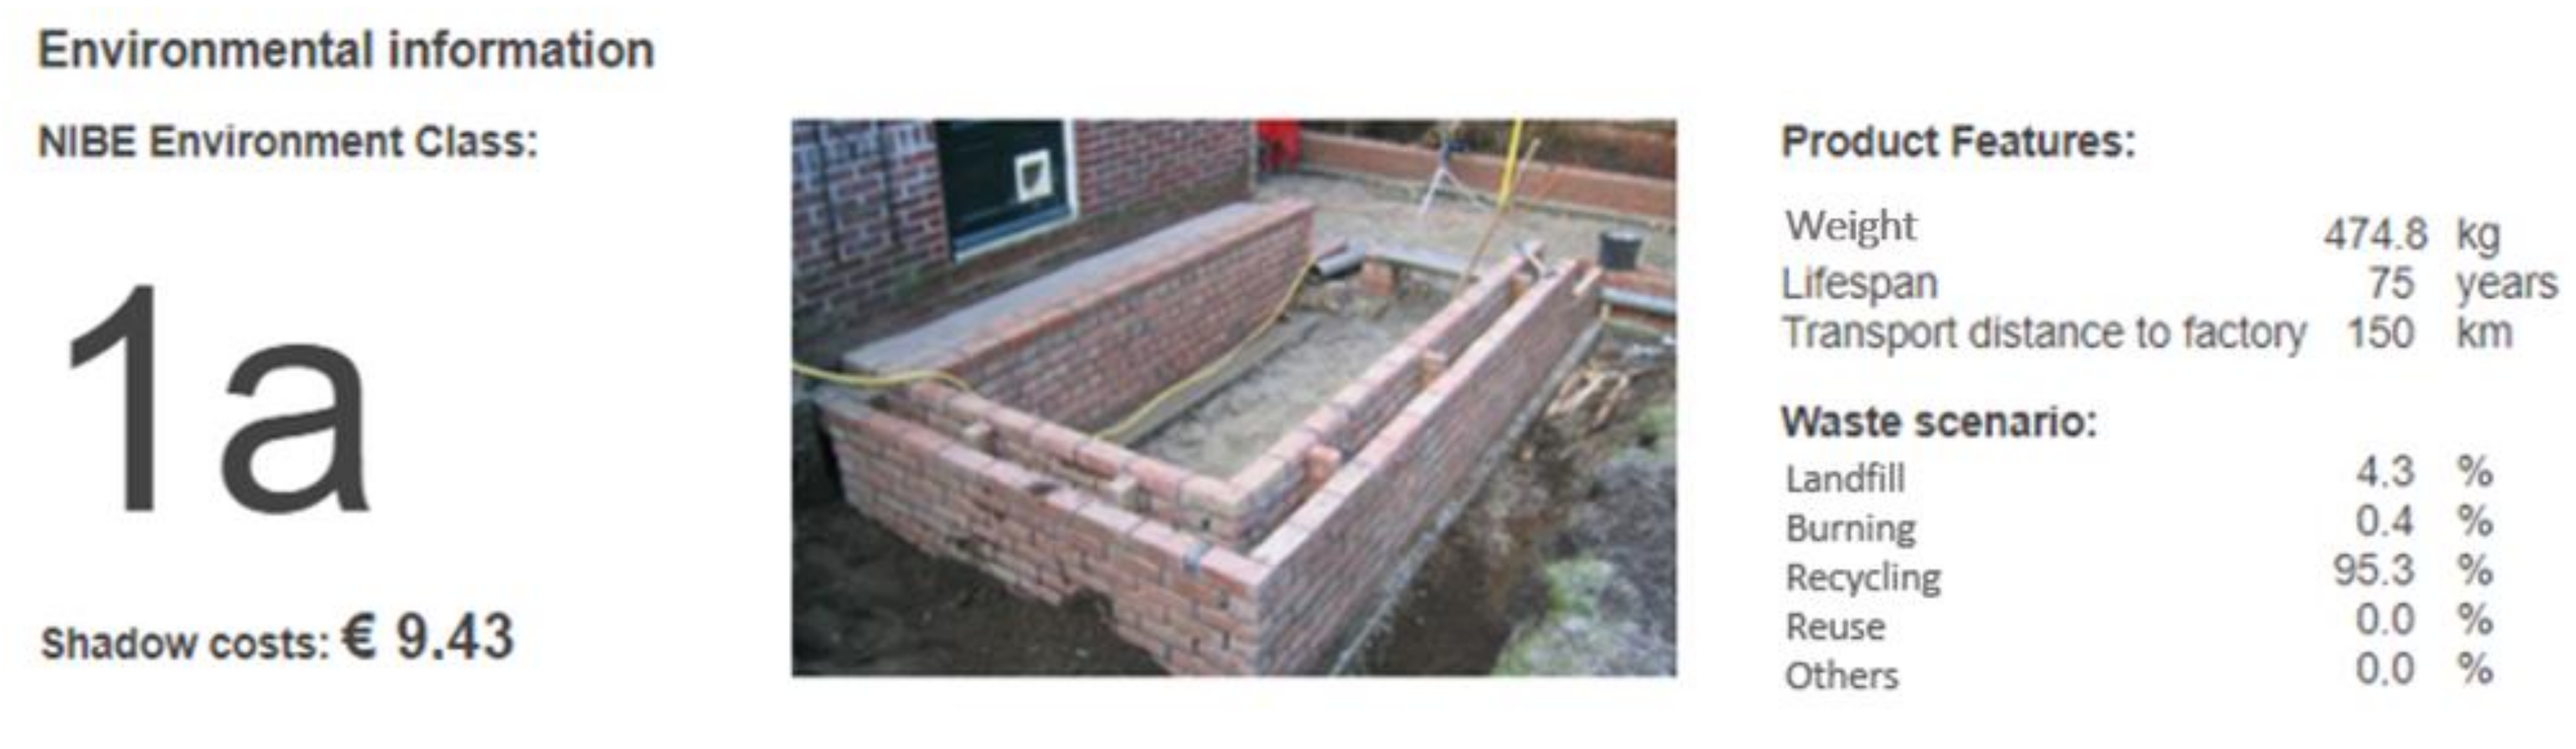
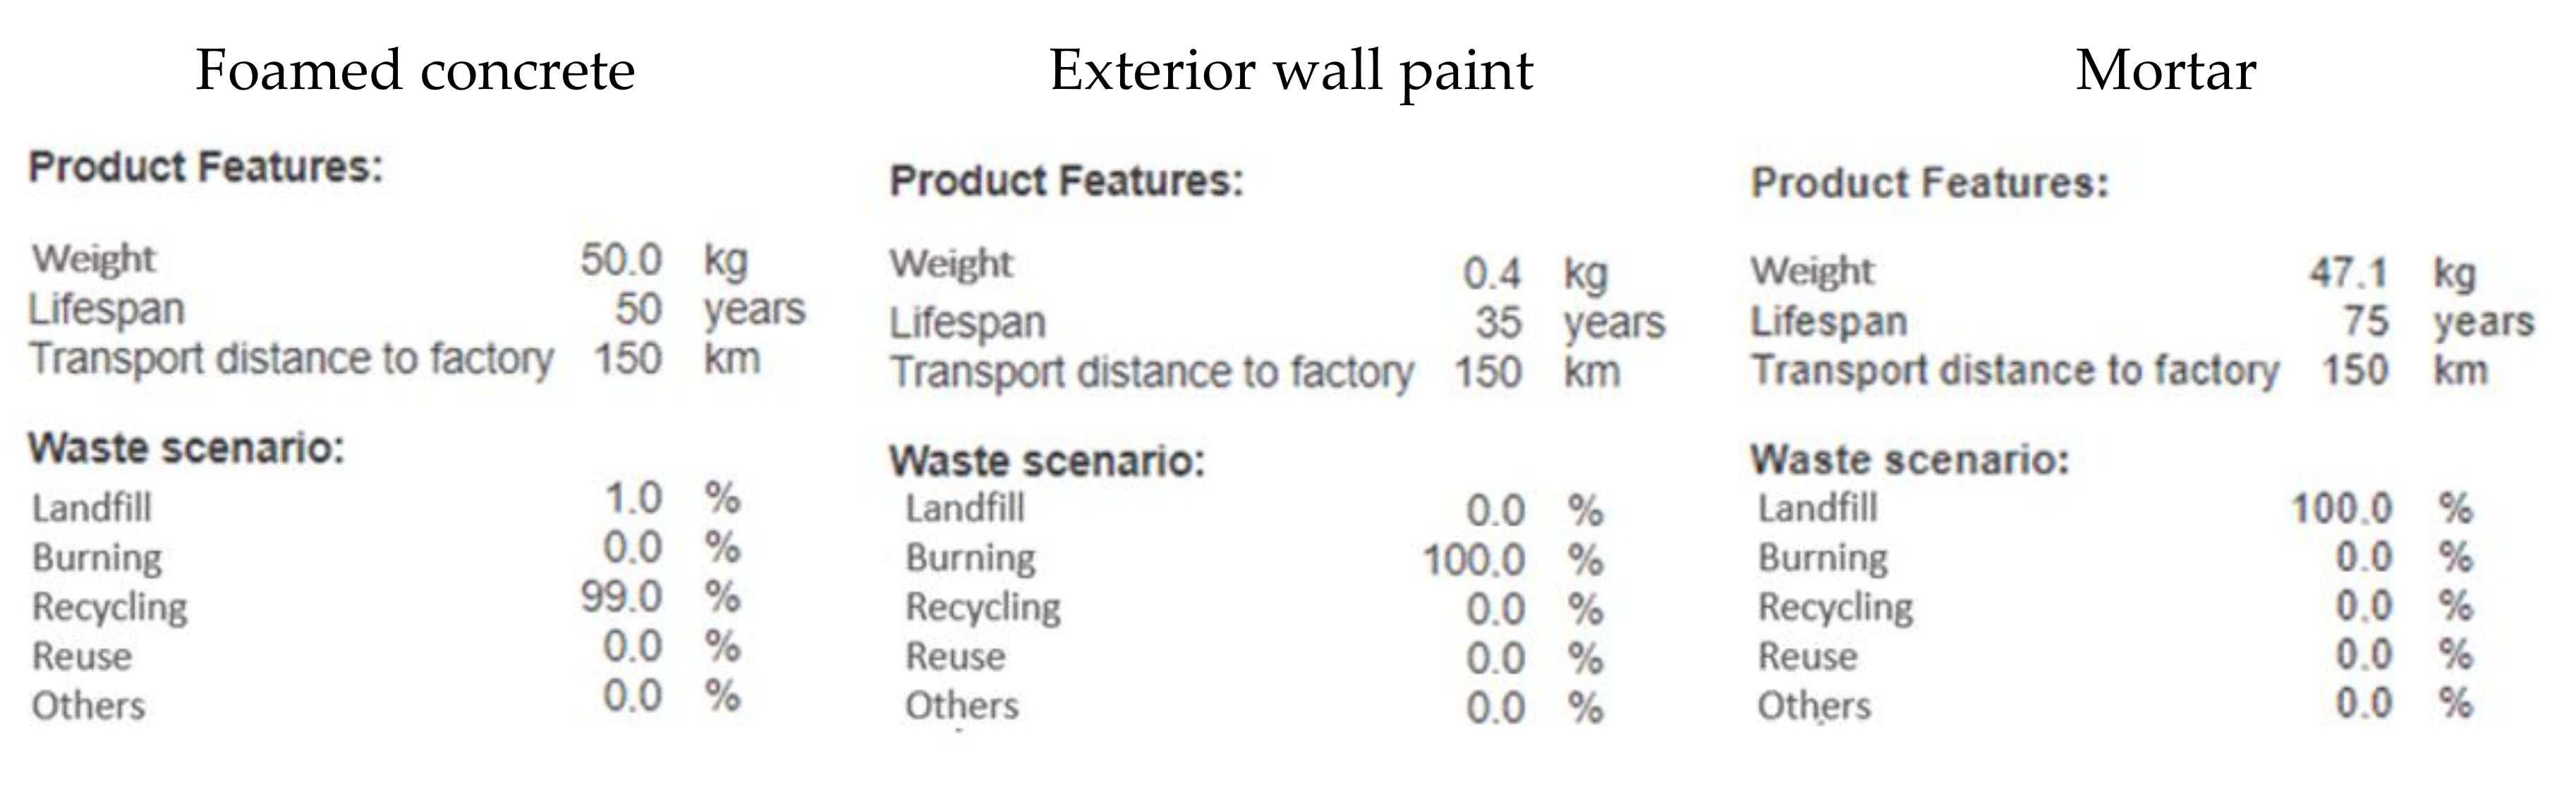
NIBE is a Dutch MD, providing the data of components, including a brief description and the data of properties. This MD collects data from various companies. It includes the lifetime of the components, and it divides the amount of material in the waste scenario into five kinds of categories: landfill, burning, reuse, recycling, and others. Figure 4 shows a screenshot of NIBE [50], including a figure, shadow costs, weight, lifetime, and the waste scenario. The shadow cost is an estimated measurement of environmental impacts, while the waste scenario divided the material into five categories by percentages. NIBE also provides the average distance for transport from the factory to the construction site. In the example shown in Figure 5 [50], the lifetimes of the materials foamed concrete, exterior wall paint, and mortar are 50 years, 35 years, and 75 years, respectively. The exterior wall paint and mortar are 100% burning and landfill, respectively, while the foamed concrete is 99% recycling.
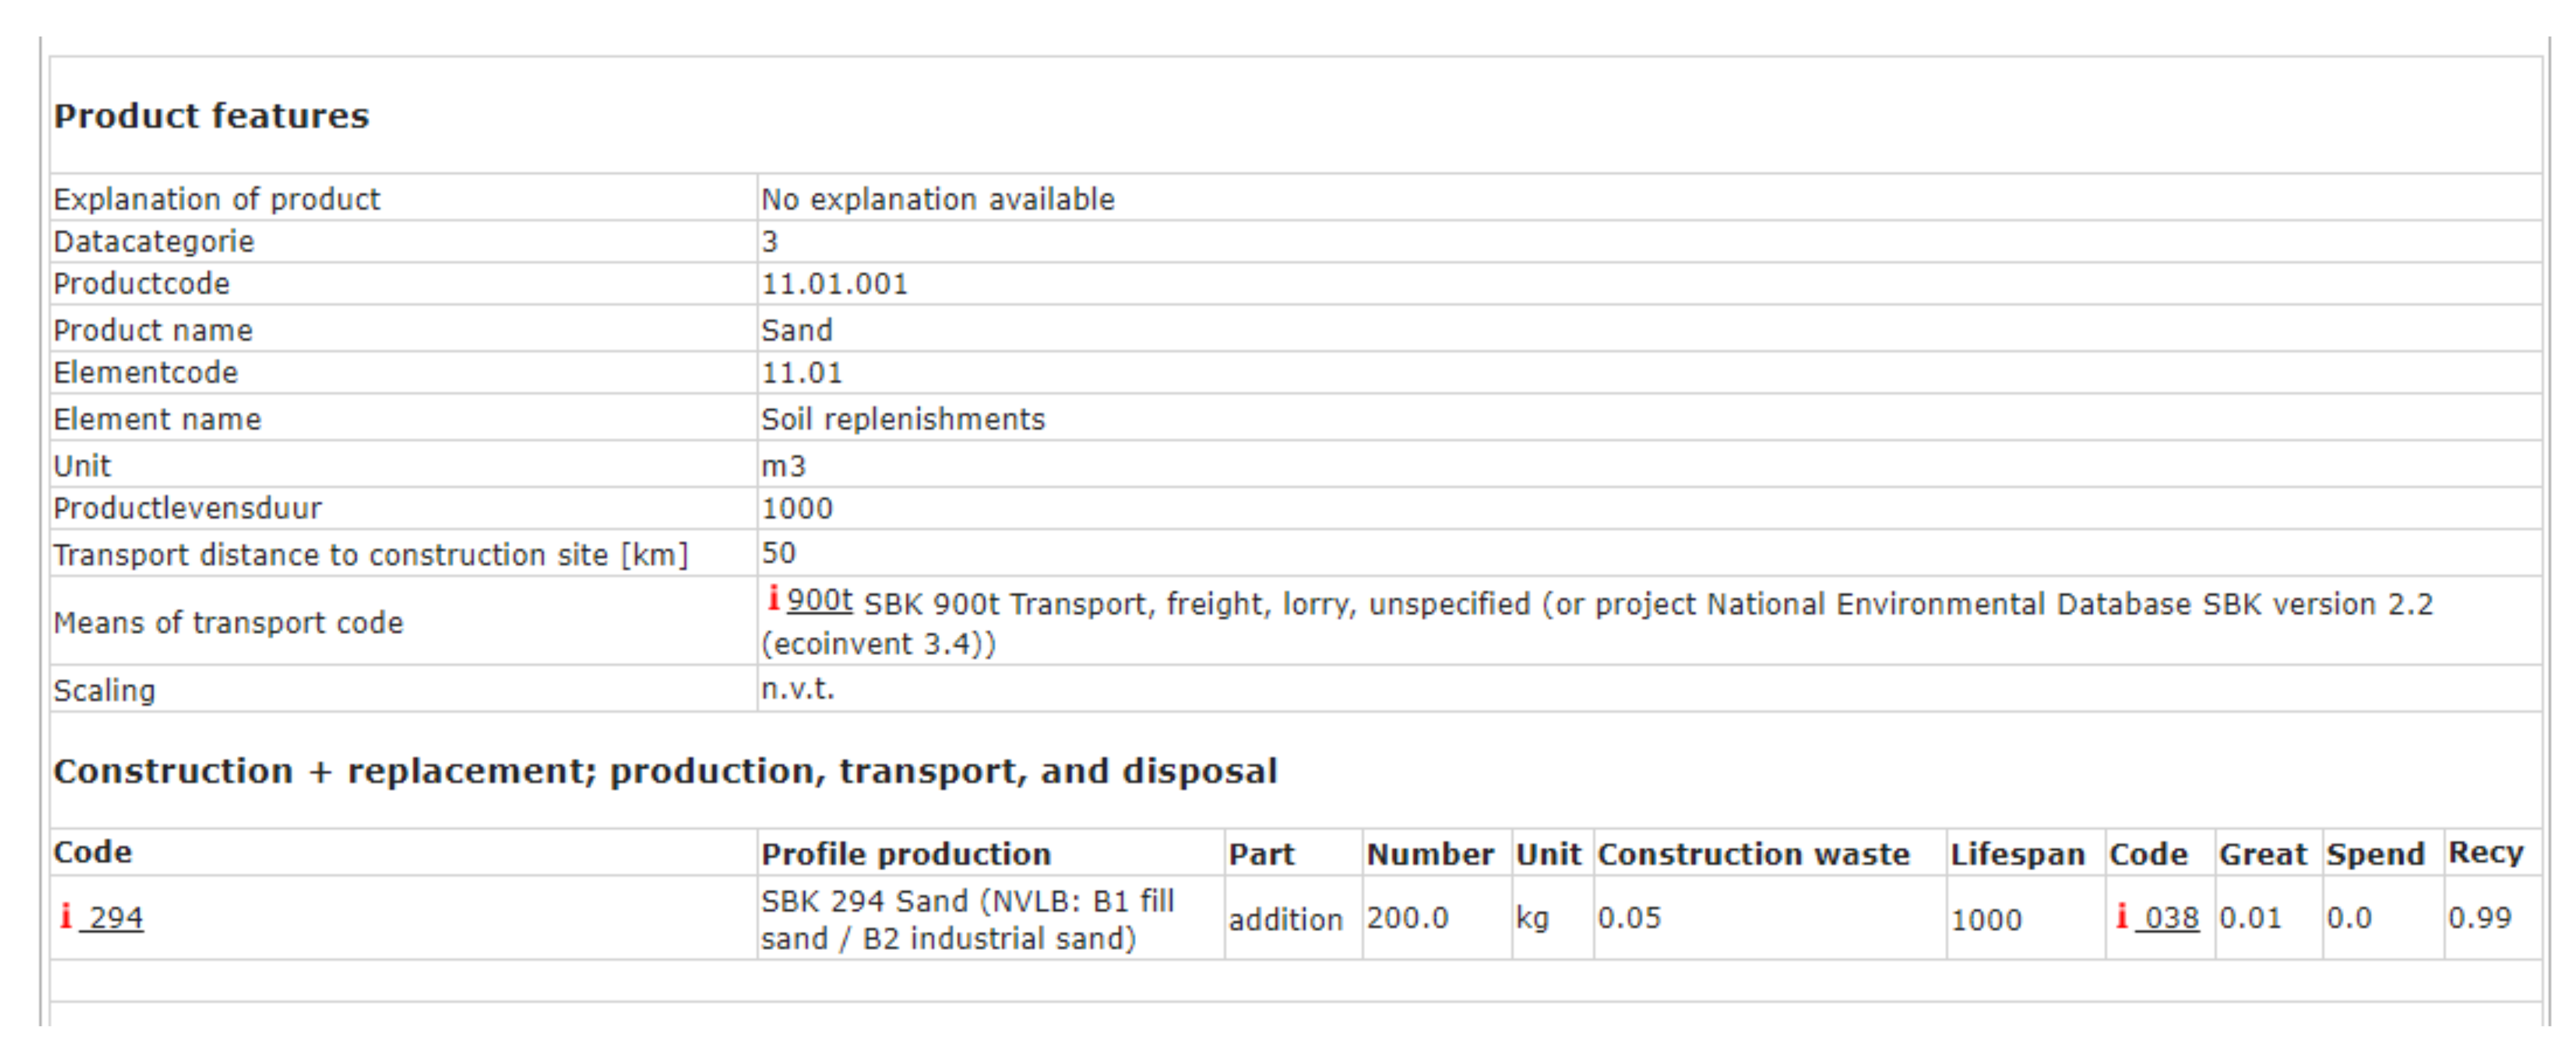
NMD provides some data of the whole components, such as the component name and code. At the same time, it also provides some data of each material in the component, such as the material weight and lifetime. NMD divides the material in the waste scenario proportionally into three categories: burning, landfill, and recycling. Figure 6 is the screenshot of NMD [51]. Both the NIBE and NMD material databases provide environmental data that calculate the material’s environmental impact by the shadow cost, which is an estimated price for the environment’s intangible assets. For example, in the NMD, for curtain walls with the ID 21.03.007, the shadow price of Global Warming Potential (GWP) is 0.13169154, and that of Acidification is 0.00057094. The sum of these shadow prices of material is used to assess the environmental impact.
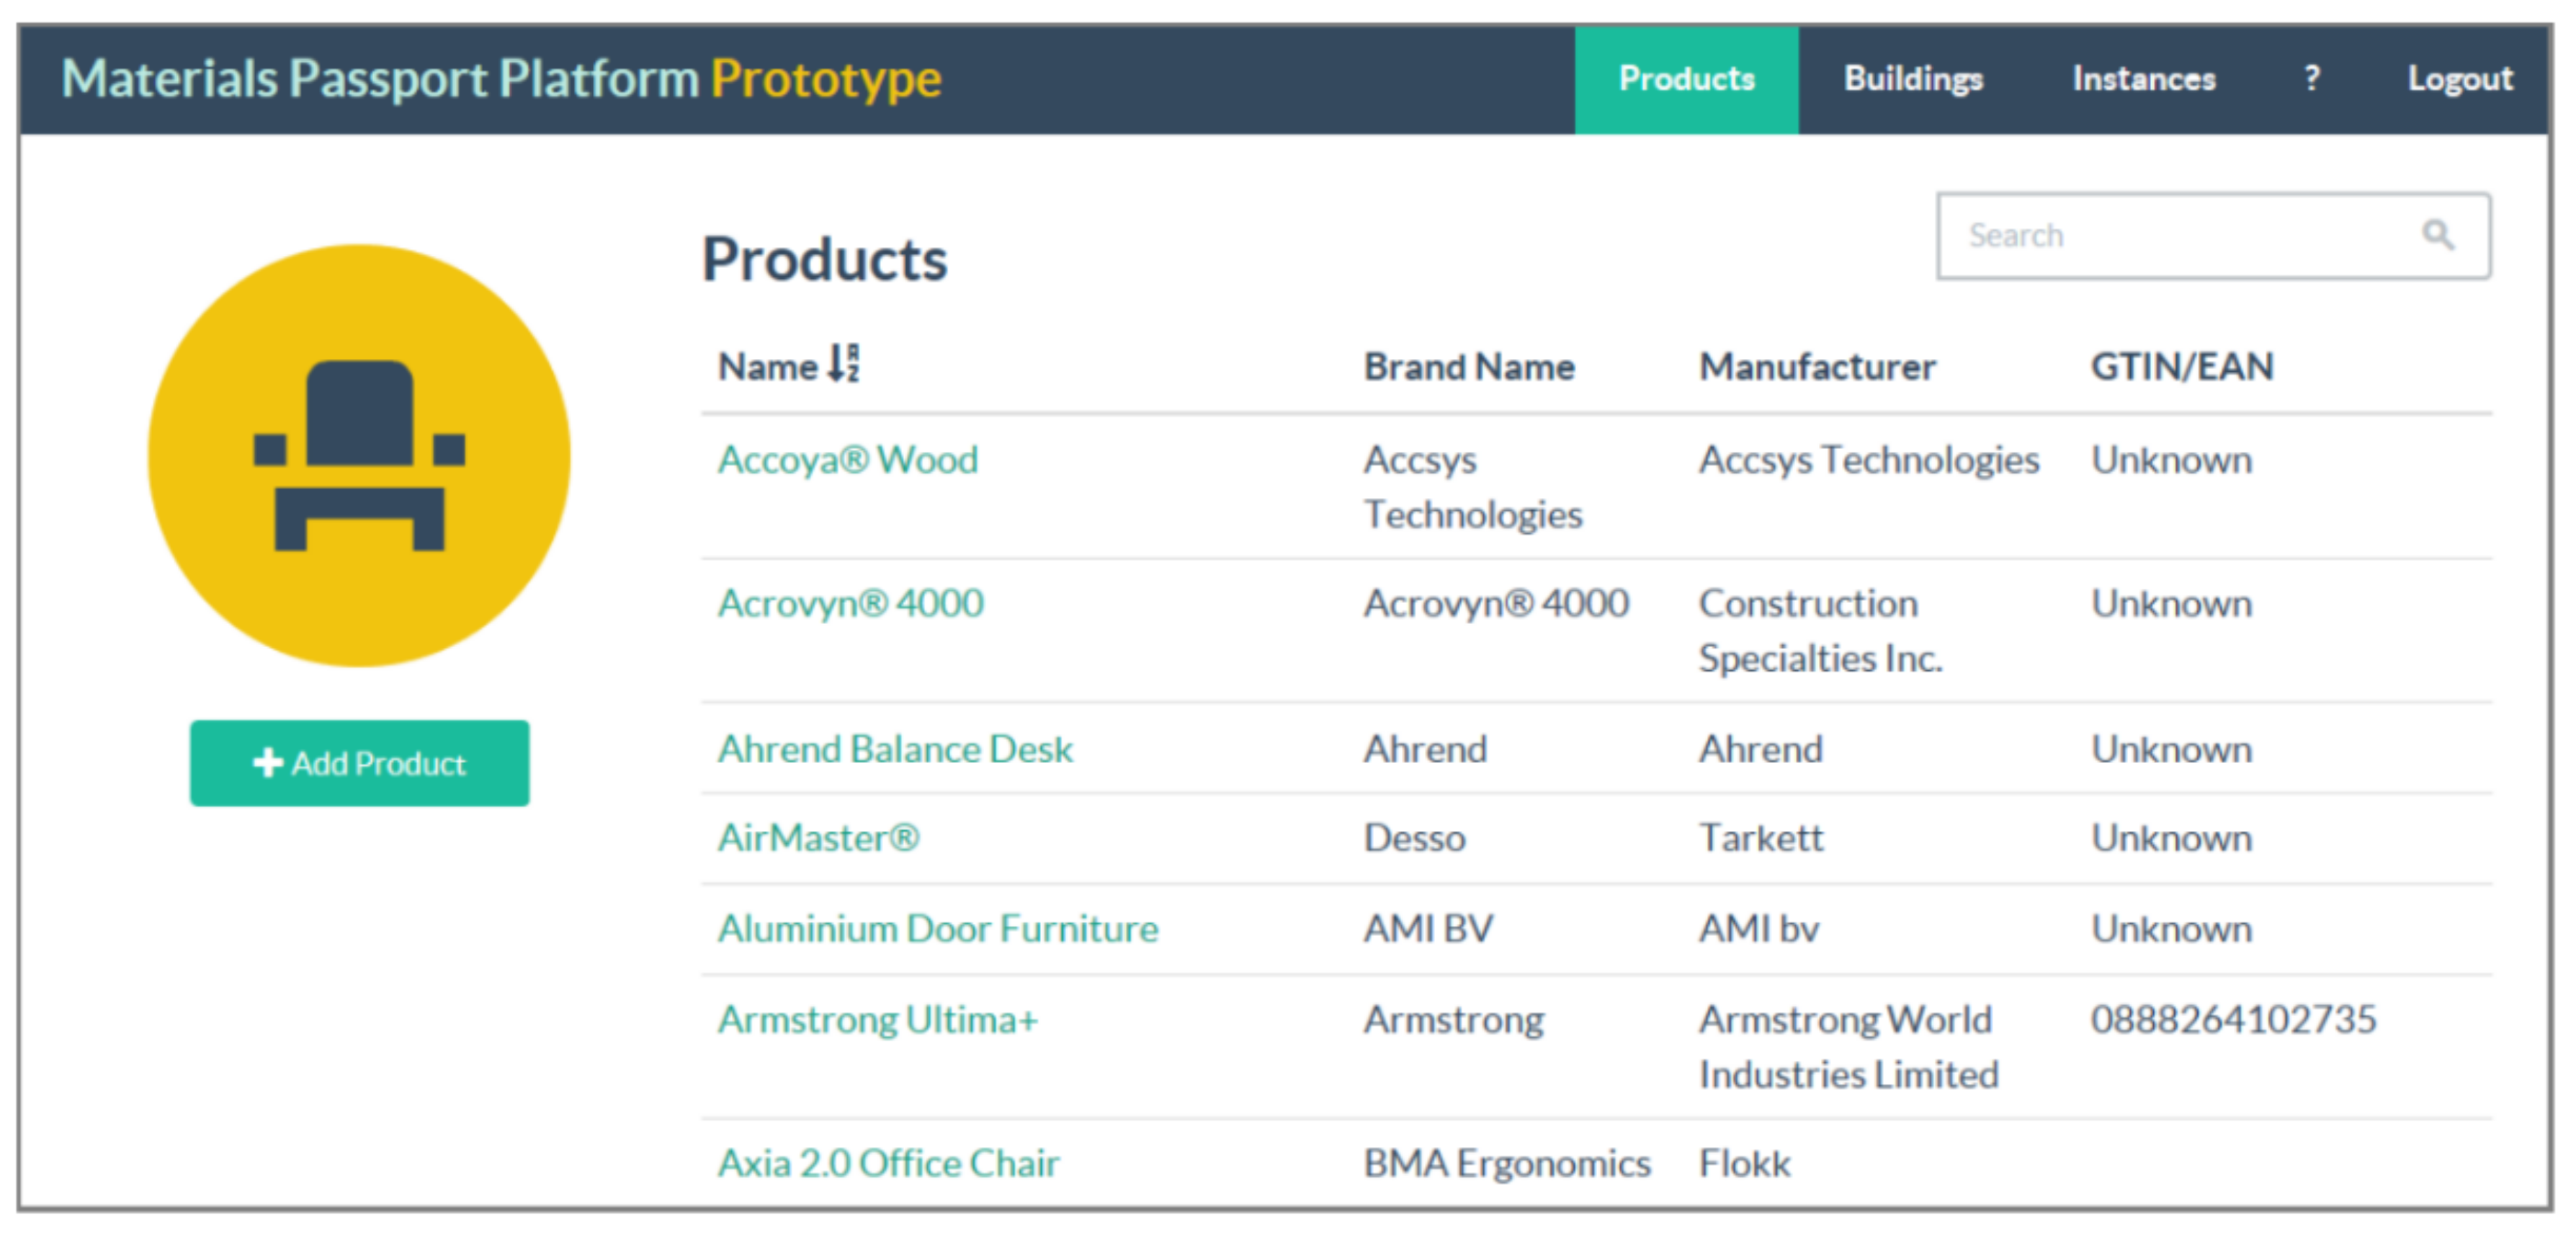
MP developed in BAMB are sets of data describing the defined characteristics of materials in products providing percentages for recovery and reuse, as shown in Figure 7 [52]. BAMB also contains information about the manufacturers. Currently, BAMB contains MP for a selection of materials, part components, and components. Moreover, it provides data on material health [49].
Other researchers have developed a database or MP for specific purposes. Heeren et al. [53] provided a database framework that contains a coding system and data structure with additional climate indicators. Honic et al. [54,55] developed an MP using Building Information Modeling (BIM) for design optimization. MP has shown its potential in storing data and facilitating analysis [56,57].
4.2. New Material Passport (MP)
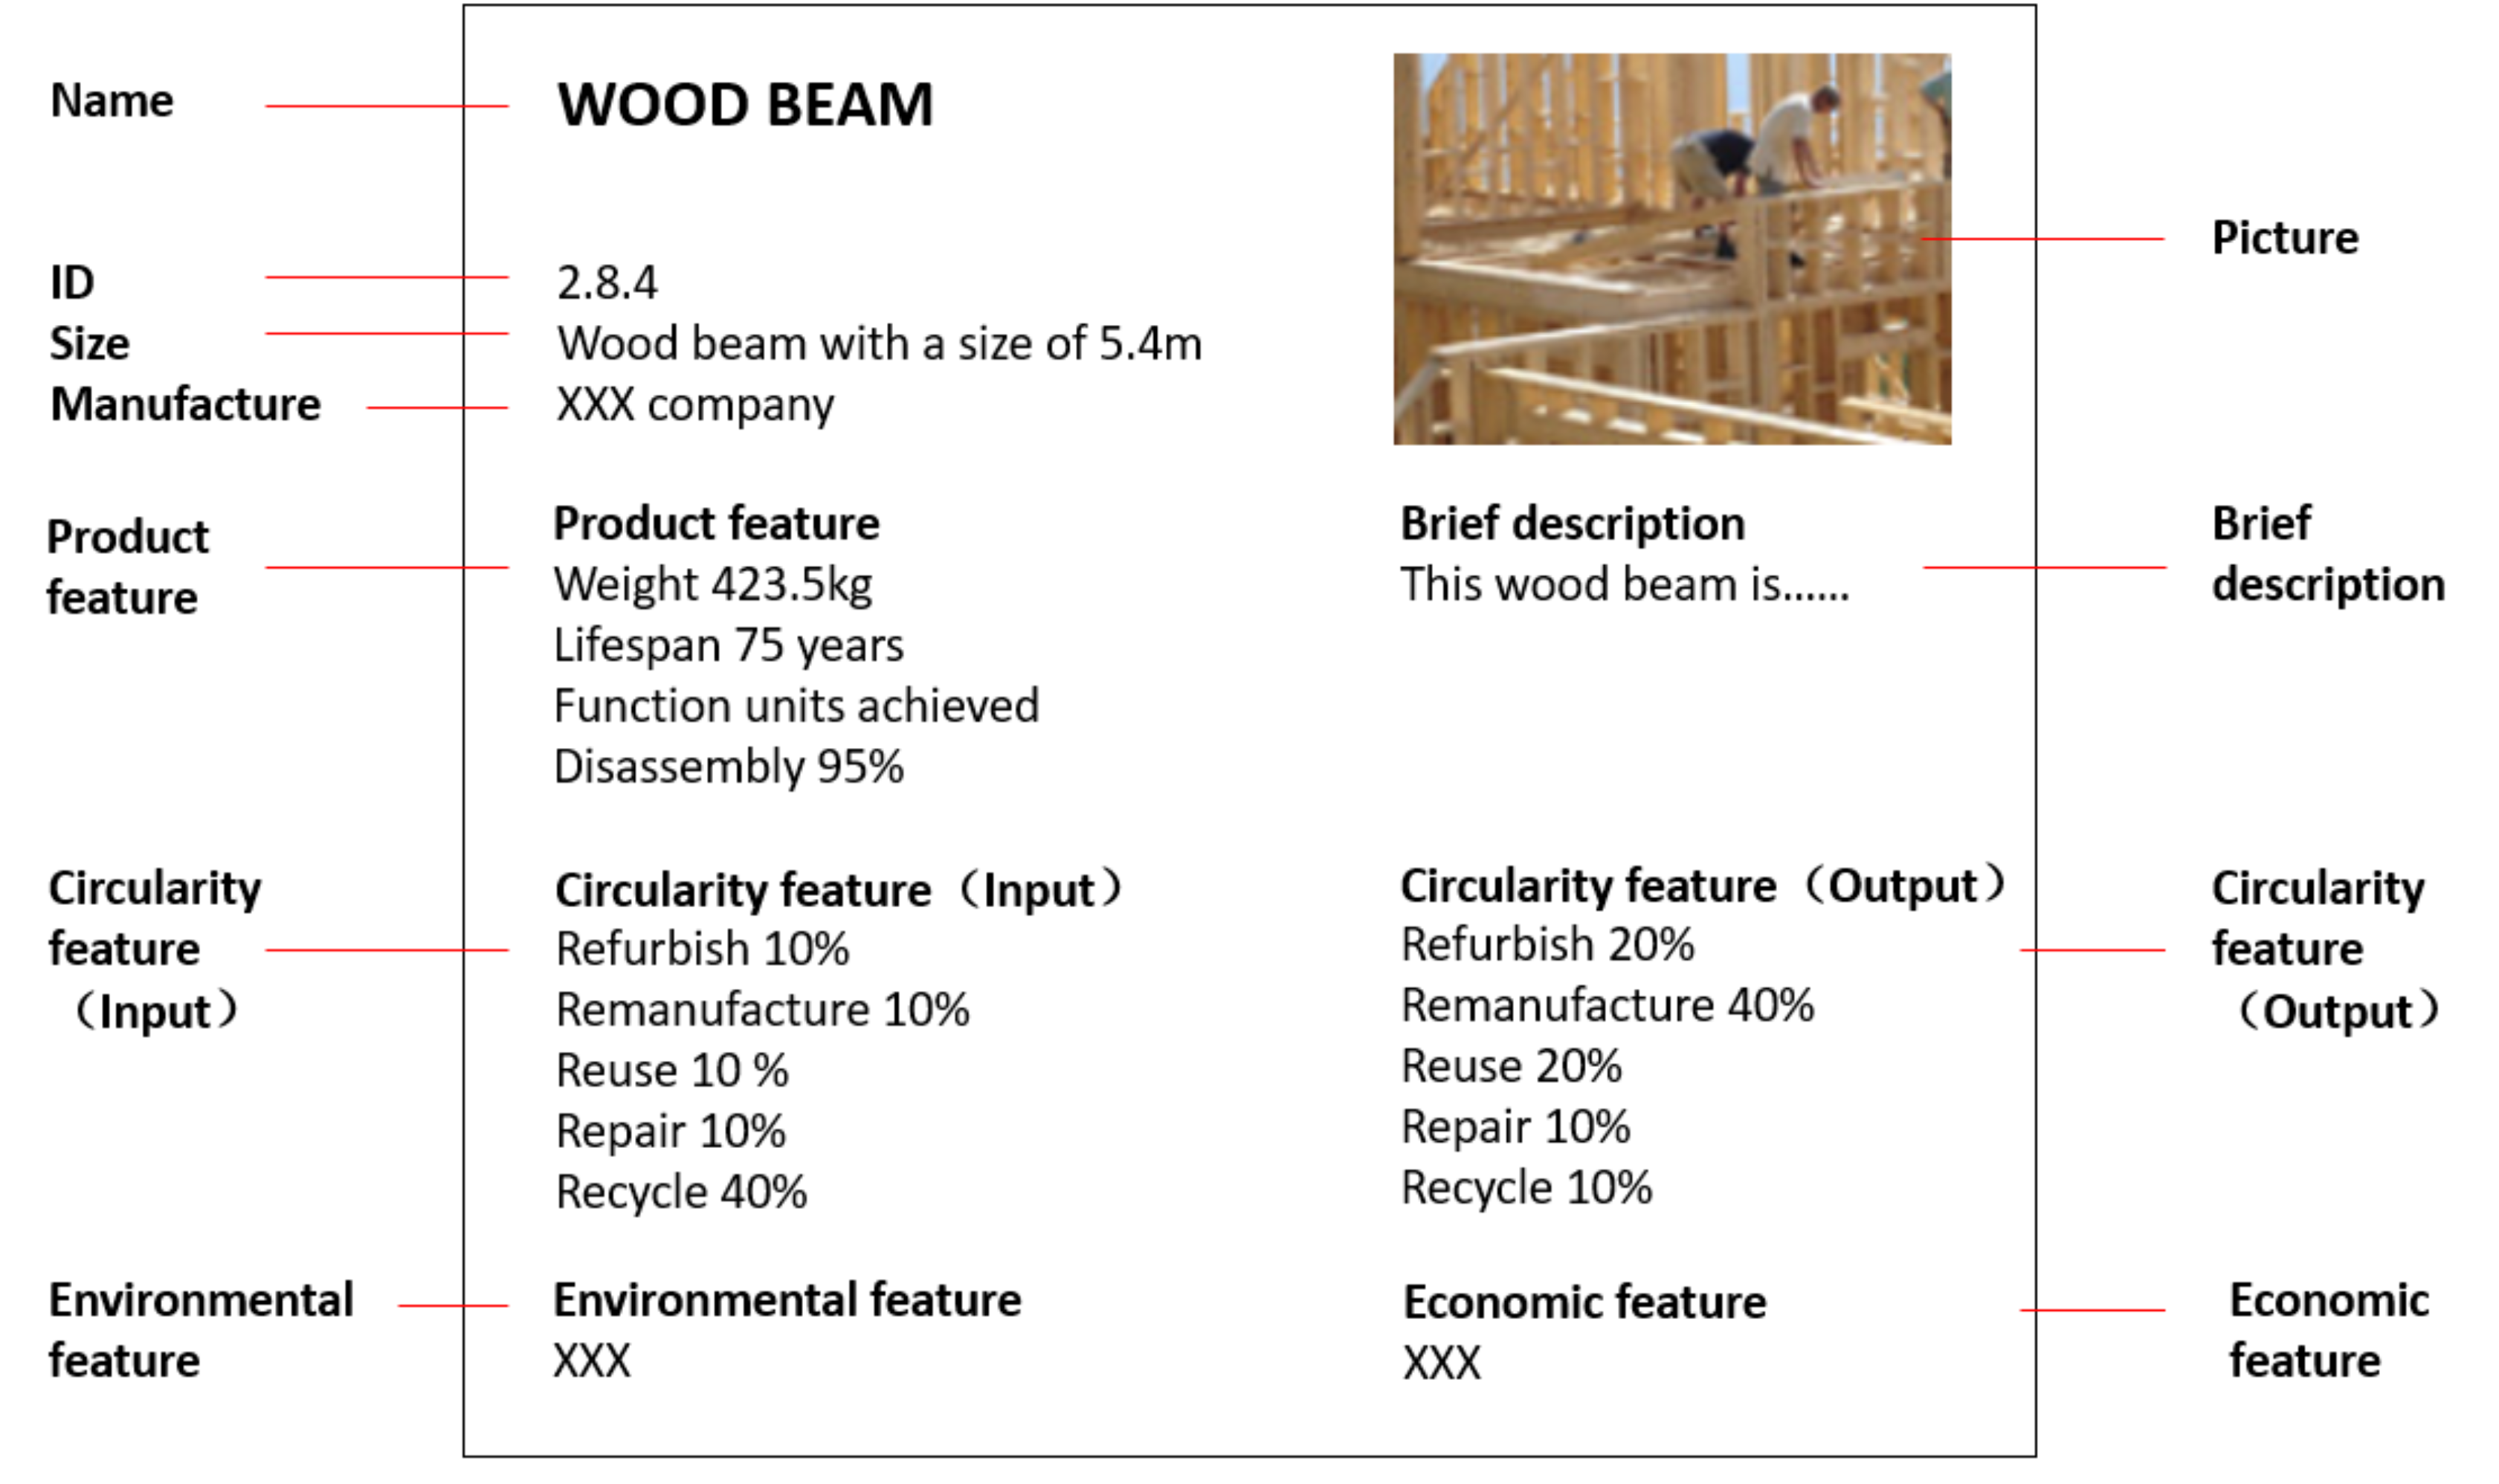
The new BC MP presented in this paper focuses on the circularity features of materials and components. The BC MP records the recycling information of materials and components in the project. Figure 8 shows an example of the newly proposed BC MP. It contains all the data needed for the proposed material flow model (see Figure 2), including five parts: (1) The basic information—the name, ID, size, and manufacturer; (2) The product feature—the weight, lifetime, functional units achieved and a brief description of the material or component; (3) The circularity feature—the data of five factors in percentages for input and output; (4) The environmental feature; (5) The economic feature.
The economic data contain the costs during the production and construction of the material or component, while the environmental data contain the data that show the environmental performance of the material or component, such as the carbon emissions. The data collected contain information both for materials and components, as sometimes the components information is collected directly, while in other cases only the materials information is available. Consequently, the calculation process may start at either materials or components.
4.3. New Material Passport Analysis
Table 5 and Table 6 show the comparison between the existing MD and MP and the proposed BC MP for the indicators and the factors (see Figure 3) [49,50,51]. The existing MD contain several recycling data but fail to provide all the data needed for the material flow. They focus on recycling in output but do not give detailed information. For example, in the MD of NIBE, there are no data for material source in input. The only way to get the material source in input is to interpret information from the brief description of the material or component, such as “This wood beam comes from the rapidly renewable forest”. However, this is not quantified data and is inaccurate. Furthermore, functional units achieved of the components and materials are also missed in all the existing MD. Last but most importantly, although the existing MD provide the lifetime of the materials and components, the data are not useful. The lifetime of a large number of materials and components are all set to be 1000 years in this database. In the BC MP, the material sources, both in input and output, are provided, along with functional units achieved and lifetime. It also provides data on the efficiency of the recycling process (disassembly). Almost all the existing MD only provide the data of reuse and recycle, while in the proposed BC MP, all required recycling features are described by a percentage for each factor. Table 5 provides an overview of the indicators covered by the different MD databases. Indicators of material source in input and output are calculated by the factors in Table 6.
As shown in Figure 2, the building construction process includes material–part component–component–system–building, which requires data at different levels. Both NIBE and NMD focus on the part component level. NIBE provides a group of data for the part component, while NMD provides several groups of data for each material in the part component. It means that from NIBE, data of the whole part component can be collected, but the data of each material in the part component are missing. Detailed data of each material in the part component from NMD can be collected, but the data of the part component need to be calculated. Both BMAB and BC MP focus on more levels—material and part component—and their data are provided at these different levels. In the new BC MP, the detailed data of each material in the component and for the whole component are provided.
The mentioned MD are based on the coding from the Nf/sfb database, but there are also differences. Since NIBE focuses on the part component level, it uses only codes with two digits that indicate the part component system, such as “21” for exterior walls. In NMD, the codes consist of three groups with seven digits in total. For example, “23.01.003” is the third type of concrete floor that can be found in NMD. The “23”, “01”, and “003” codes indicate the system, the material, and the sequence number, respectively. In the new BC MP, a material is coded with seven digits, while a part component only uses the first two digits. Both material and part component codes follow the Nf/sfb coding system, which allows for linking to the existing MD databases.
5. Building Circularity Calculation Method
5.1. Existing Building Circularity Calculation Methods
Among all the existing BC calculation methods, the method of MCI is one of the most used methods. MCI is a method for all industries, and it is recognized as a basic method [12]. Many other methods are revised from MCI and tailored to a specific industry. Two main indicators from the technical cycle calculate the circularity rate: the linear flow index and the utility factor built as a functional of the utility of a product. The former is determined by the material source of the components, which refers to the percentages of virgin material, recycled material, reused material, and waste of the materials and components. The latter is determined by the lifetime and functional units achieved during the lifecycle of the building.
In Equation (1) “MCI” is Material Circularity Indicator, “LFI” is Linear Flow Index, and X is the utility factor of a product. LFI in Equation (2) is determined by “V” as the mass of virgin feedstock used in a product and “W” as the mass of unrecoverable waste associated with a product. “M” is the mass of a product, “WF” is the mass of unrecoverable waste generated when producing recycled feedstock for a product, and “WC” is the mass of unrecoverable waste generated in the process of recycling parts of a product. Utility factor X in Equation (3) is a functional of the utility of a product, where “L” is the actual average lifetime of a product, “Lav” is the actual average lifetime of an industry-average product of the same type, “U” is the actual average number of functional units achieved during the use phase of a product, and “Uav” is the actual average number of functional units achieved during the use phase of an industry-average product of the same type.
The BC calculation method from Madaster is similar to the MCI method, but it ignores some indicators, such as the functional units. In the method from CB′23, it classifies the materials into several categories and calculates the circularity rate of each of them. The equation used for the circularity rate calculation of one specific material is:
where “Mi” is the mass of a (partial) object (i) and “Mvi” is the mass percentage of primary (virgin) raw materials in a (sub) object. “VX” represents the percentage of primary raw materials. The share of primary raw materials is calculated per (sub) object.
5.2. New Building Circularity Calculation Method
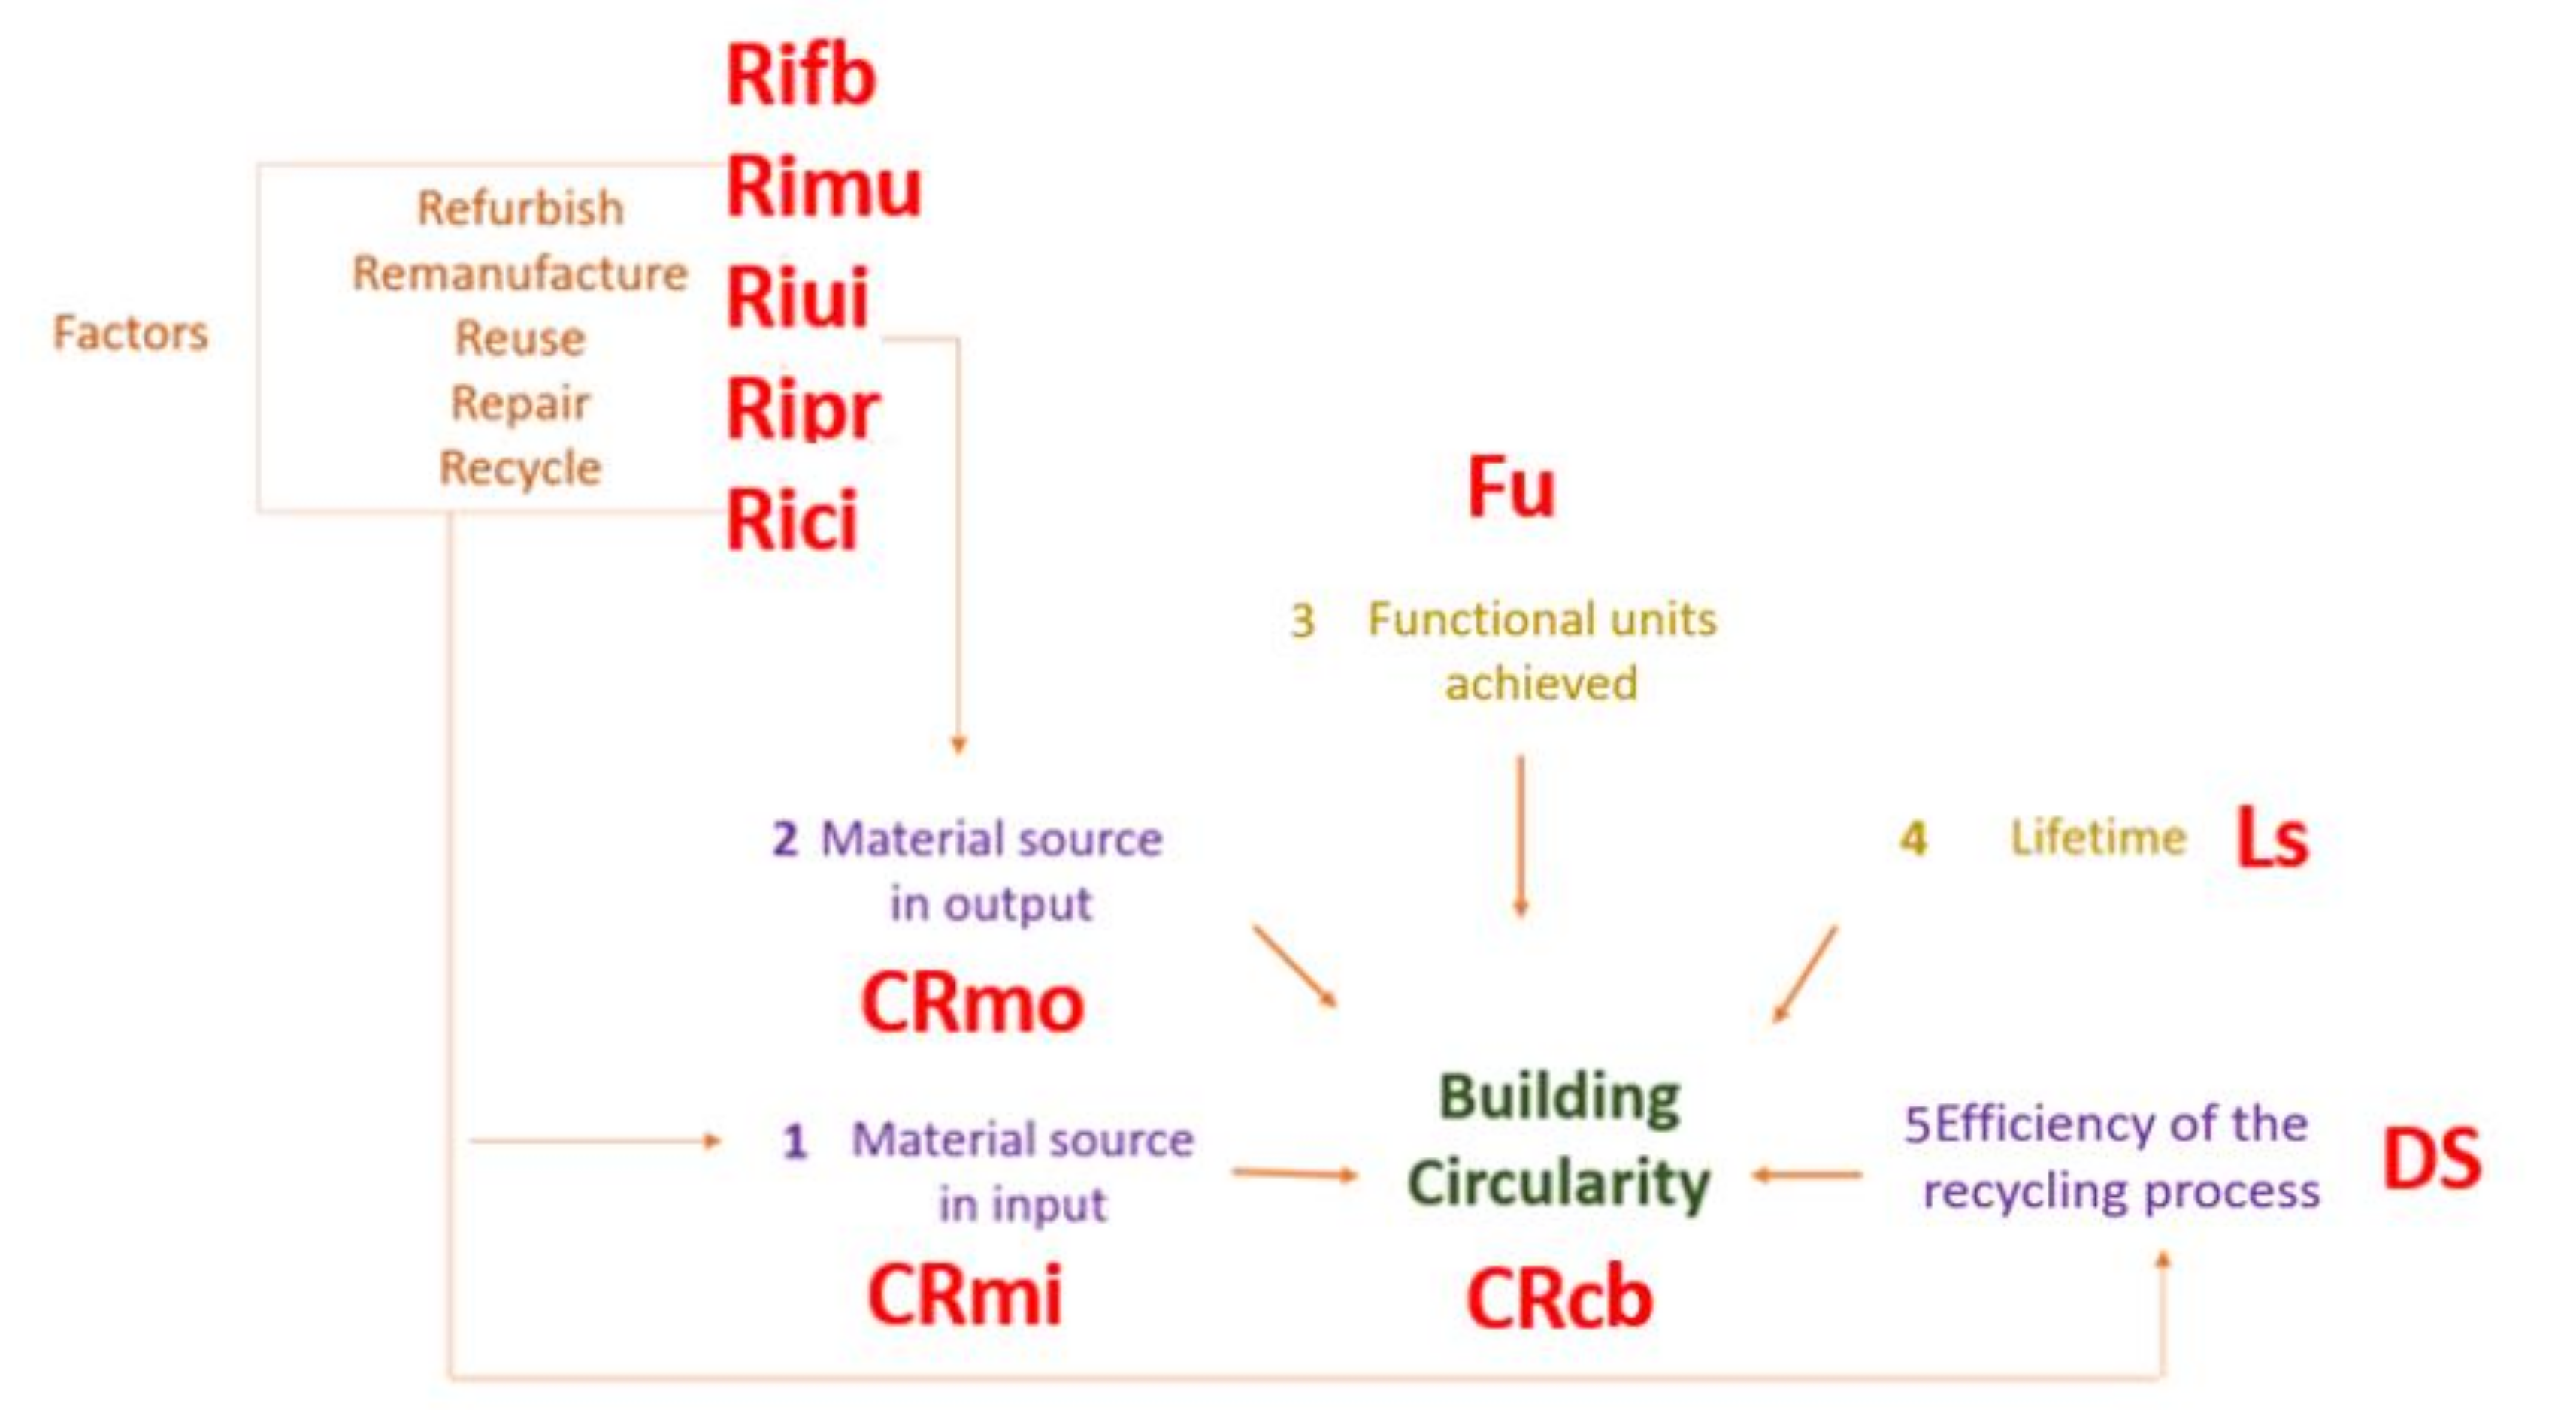
A new method is developed in this paper for accurate calculation based on a more comprehensive understanding of the BC concept and the indicators and factors that influence the circularity of buildings, shown in Figure 9 and Figure 10 with their corresponding symbols. It borrow from existing research in CE indicators, which focus on products and components as references, such as MCI, Total Restored Products, Circular Economy Index, and Longevity indicator [12,58,59,60]. The BC calculation method follows the proposed material flow model, which contains three cycles: the technical cycle, the environmental cycle, and the economic cycle (i.e., the social cycle is left out in this paper). From the technical cycle, all five indicators (CRmi, CRmo, Fu, Ls, DS) are considered for the calculation of BC, and for the calculation of material source in input and output, all five factors (Rifb, Rimu, Riui, Ripr, Rici) are used (see Figure 9). The calculation of indicators in the technical cycle is based on the MCI. The BC calculation follows the order of material–component–system–building (see Figure 2). First, the circularity of the material is calculated. The circularity of the component is the sum of all the materials’ circularity that it consists of. A definition of every symbol (in bold) used in Figure 9 and Figure 10 is provided, together with its calculation equation. The calculations of the environmental cycle and economic cycle are based on existing LCA and LCC research. The proposed method focuses on the calculation from the material level.
Building circularity (BC): “BC” is the building circularity. “CRcb” is the technical circularity rate. “Enb” is the environmental impact. “Ecb” is the economic impact. “m” is the number of materials. “n” is the number of components. “l” is the number of systems. BC is calculated as presented in Equation (5).
Environmental impact (Enb): The handbook on lifecycle assessment shows the basic assessment method of environmental impact [61]. The calculation of Enb employs the current LCA method, using the shadow cost [62]. The calculation needs both environmental data from an existing LCA database and the project data of the building. The proposed BC MP provides the project data of each material and component, as shown in Figure 8, such as the weight.
Economic impact (Ecb): Ecb is calculated by employing the existing LCC method, which extracts economic data from the LCC database and the project data from the proposed BC MP, as shown in Figure 8.
Technical circularity rate (CRcb): The five indicators result in a CRcb score between 1 (fully circular) and 0 (fully linear). “CRmi” is the material source in input. “CRmo” is the material source in output. “DS” is disassembly (Efficiency of the recycling process). “LS” is the lifetime. “Fu” is functional units achieved. CRcb is calculated as shown in Equation (6):
Material source in input (CRmi): “CRmi” is the technical circularity rate in the material input. During the production of the components, “Rici” is the percentage of recycled materials, “Rimu” is the percentage of remanufacturing materials, “Rifb” is the percentage of refurbishing materials, “Ripr” is the percentage of repair materials, “Riui” is the percentage of reused materials. “a, b, c, d”, “e” is the weight for each of the factors. CRmi is calculated as shown in Equation (7):
The weights “a, b, c, d, e” are developed for different factors in the R strategy, and they show the circular level of each factor. For example, the R strategy of reuse has the highest circular level, as it means that the demolished one can be used again directly and does not need additional manufacturing. Now, the values of “a, b, c, d, e” are not decided yet; further research is needed to solve this.
To show the implication of Equation (7), we make the following assumptions: weight factor (a) for recycling percentage is 0.5, weight factor (b) for remanufacturing percentage is 0.6, weight factor (c) for refurbishing percentage is 0.7, weight factor (d) for repair percentage is 0.8, and weight factor (e) for reuse is 1. Under these assumptions, the circularity rate in the material input of a component (CRmi) that is produced with 100% reused material (Riui) calculates to 1, while, in case a component is produced with 100% recycled material (Rici), the CRmi calculates to 0.5. In case of a component that is 50% made of reused material and 50% made of recycled material, the circularity rate in the material input (CRmi) calculates to 0.75, showing the sensitivity of the CRmi value to the weights that are used given the (local) standards and conditions.
Material source in output (CRmo): “CRmo” is the technical circularity rate in the material source in output. The calculation of it is similar to the circularity rate in the material source in input. “Roci” is the percentage of recycled materials, “Romu” is the percentage of remanufacturing materials, “Rofb” is the percentage of refurbishing materials, “Ropr” is the percentage of repair materials, and “Roui” is the percentage of reused materials. “a, b, c, d, e” is the weight for the factors. CRmo is calculated as shown in Equation (8):
The weight factors “a, b, c, d, e” in the calculation for output are the same as in the calculation for input. The implications of the applied weight factors on the calculated CRmo value are also similar to what was discussed for Material source in input (CRmi).
Disassembly: The Design for Disassembly (DS) is adopted from the industrial engineering sector. The disassembly factor of a building shows the efficiency of the recycling process in the demolishment of the building. DS is calculated considering two aspects: first, the wear and tear of the material (DSa), which is determined by material properties; second, the connection type with other materials (DSb), which is determined by the project. Data for the calculation of the first aspect (DSa) are extracted from MP directly. For the second aspect (DSb), the disassembly is calculated following the methods developed by Durmisevic (2002). DS is calculated as shown in Equation (9):
Lifetime: The lifetime “LS” is calculated from the design value of the building/system/component and the actual life time until being demolished. “LSdv” is an average lifetime of a kind of building/system/component, which can be extracted from the MP. “LSau” is the lifetime of the building/system/component, and the designer could provide a figure for it. LS is calculated as shown in Equation (10):
For every material/component/system, their own life time is considered as LSau. For example, in case of a beam in the building, the actual usage time of the beam can be 20 years, while the lifetime of the (temporary) building is only ten years. During the demolishment process of the building, the beam is moved to another building that exists for ten years more. After the demolishment of the second building, the beam is landfilled. In that case, for the BC calculation of the beam, the lifetime is 20 years.
Functional units achieved: The functional units achieved “Fu” is calculated from the number of users of the building during its lifetime. “Fau” is the actual functional units (i.e., actual number of building users) achieved, which means the average user of the building every day during the lifetime of the building. The designer could give a figure for it. “Fdv” is the average functional units achieved (i.e., average number of building users) for a specific building type, which means the average user every day of a specific building type. Fu is calculated as shown in Equation (11):
5.3. Building Circularity Calculation Method Analysis
Several problems exist in the current assessment methods, including issues related to the circularity cycles, the indicators, and the factors in BC assessment. The proposed BC calculation method in Section 5.2 can overcome these problems. The most prominent problems in the current BC methods are discussed in more detail in the following sections, with reference to the proposed calculation method in Section 5.2.
5.3.1. Problems Related to the Circularity Cycles
Studies of BC assessment in the AEC industry focus on specialized areas and fail to develop a holistic framework [63,64]. Equally important as the technical cycle, the biological cycle and the economic cycle are integral parts of the proposed BC calculation method that follows the proposed material flow model (see Figure 2). Consequently, the proposed BC assessment is more comprehensive.
5.3.2. Problems Related to Indicators
For the technical cycle, many indicators in the current methods need to be calculated more systematically. They are either completely ignored or have to be entered manually by the user. For example, in some models, the indicator for the efficiency of the recycling process is missing [65]. As a consequence, this method can only be used in a building with components that can be disassembled without any loss of material.
To illustrate the implication of the shortcomings, we present Table 7, showing the circularity calculation of a beam under different settings. The example proves that ignoring the disassembly indicator influences the BC results significantly. In Setting 1, the disassembly factor is ignored. In comparison, setting 2 in the proposed material flow model is followed, which considers the disassembly and has a DS value of 50%. The results show that due only to the inclusion of the DS (Disassembly) factor, the calculated BC is significantly lower.
5.3.3. Problems Related to the Factors
In the current BC calculation models, the number of considered R strategy factors is less than in the traditional models of waste management. Moreover, the R strategy factors for material source in input and output are all considered equally circular.
Using the example of the beam presented in Table 7, the implications can be illustrated using the current model and the proposed material flow model. Setting 3 is the current Madaster model [48], which considers the recycling materials and the reused materials equally circular. Setting 4 is the proposed material flow model, with the weight of the recycling material set to 0.4, assuming that the recycling material is less circular than the reusing material. The result of the BC calculation according to setting 3 is 50%, while for setting four, the results are lower, namely 20%, as shown in Table 7. It is evident that providing weights for different factors can help give more insights into the effect of different recycling strategies and generate more accurate BC values.
6. Conclusions
6.1. Discussion of Contributions
In this research, we proposed a new framework for BC assessment, including a material flow model, an MP, and a BC calculation method. It contributes to improving the BC assessment on three aspects: the assessment cycles, the assessment indicators, and the assessment R strategy factors. This effort could be highly valuable both for different stakeholders and future research.
This work promotes the BC assessment to a more comprehensive degree, based on accurate content. By improving the assessment model, policymakers can make more detailed regulations to promote circularity in the AEC industry. This work can also benefit building designers and engineers with convenient, comprehensive, and easy to understand results about the BC value of their design and help them improve the circularity of their design. Further, the proposed BC assessment methods can be used to determine the circular level of a building as part of the building quality assessment.
It also promotes the development of BC assessment in the academic field. The BC assessment framework provides a wide perspective and facilities the future research both in holistic and specific research. In more detail, the framework contributes to existing literature as follows. First, while CE influences in the AEC industry are related to the technical cycle, the environmental cycle, the economic cycle, and the social cycle, some existing models fail to include them all. In this research, the proposed material flow model contains three cycles for a comprehensive assessment. Second, some of the important indicators are lost in the current assessment methods. The material flow model proposed here includes significant indicators for more accurate calculation results. Third, in the current BC assessment models, R strategy factors are far from well-researched, and they are assumed to be equally weighted. This research redefines the R strategy factors in a consistent manner and provides calculation methods for each of them. Distinguishing different R strategy factors can encourage users to choose a recycling strategy that is more effective and efficient.
6.2. Limitations and Further Research
The main limitation of this work is that the proposed material flow model and assessment framework are built based on the available economic and environmental assessment metrics and fail to add the entire new, not yet widely accepted calculation metrics of the economic and environmental cycle according to the CE. In the future, a more comprehensive calculation model may be developed following these developments. Secondly, different stakeholders participate in the design process, and their different views on BC assessment should be considered. While currently the application of the BC framework is most dominant in the building design stage, future research may adjust the BC assessment method to accommodate the requirements of other stakeholders after building construction while maintaining a unified standard. Thirdly, the weights for R strategies factors in the circularity calculation of material source in input and output require more research to determine their value for a specific building project. Finally, a standardized data collection of the recycling properties of materials and components is needed. This research proposed a new data structure to support the data collection. However, the data collection of recycling properties is still in the early development phases, and further study should focus on the data collection approaches in practice. A comprehensive and reliable data collection on material and components is paramount to a standardized BC assessment in the AEC industry.
Author Contributions
Conceptualization, N.Z., Q.H., B.d.V.; methodology, N.Z., Q.H., B.d.V.; writing—original draft preparation, N.Z.; writing—review and editing, Q.H., B.d.V.; supervision, Q.H., B.d.V. All authors have read and agreed to the published version of the manuscript.
Funding
This research received no external funding.
Institutional Review Board Statement
Not applicable.
Informed Consent Statement
Not applicable.
Data Availability Statement
Not applicable.
Conflicts of Interest
The authors declare no conflict of interest.
References
- IPCC. Climate Change 2014: Synthesis Report. Contribution of Working Groups I, II and III to the Fifth Assessment Report of the Intergovernmental Panel on Climate Change; UN: New York, NY, USA, 2014; ISBN 9789291691432. [Google Scholar]
- Mousa, M.; Luo, X.; McCabe, B. Utilizing BIM and Carbon Estimating Methods for Meaningful Data Representation. Procedia Eng. 2016, 145, 1242–1249. [Google Scholar] [CrossRef] [Green Version]
- Lazarevic, D.; Valve, H. Narrating expectations for the circular economy: Towards a common and contested European transition. Energy Res. Soc. Sci. 2017, 31, 60–69. [Google Scholar] [CrossRef]
- Construction and Demolition Waste. Available online: https://ec.europa.eu/environment/topics/waste-and-recycling/construction-and-demolition-waste_en (accessed on 11 September 2021).
- Netherlands Enterprise Agency. A Circular Economy in The Netherlands by 2050; Government of the Netherlands: The Hague, The Netherlands, 2019; 72p. [Google Scholar]
- Lovrenčić Butković, L.; Mihić, M.; Sigmund, Z. Assessment methods for evaluating circular economy projects in construction: A review of available tools. Int. J. Constr. Manag. 2021, 1–10. [Google Scholar] [CrossRef]
- Eberhardt, L.C.M.; Birkved, M.; Birgisdottir, H. Building design and construction strategies for a circular economy. Archit. Eng. Des. Manag. 2020, 1–21. [Google Scholar] [CrossRef]
- Sparrevik, M.; de Boer, L.; Michelsen, O.; Skaar, C.; Knudson, H.; Fet, A.M. Circular economy in the construction sector: Advancing environmental performance through systemic and holistic thinking. Environ. Syst. Decis. 2021, 41, 392–400. [Google Scholar] [CrossRef]
- Antwi-Afari, P.; Ng, S.T.; Hossain, M.U. A review of the circularity gap in the construction industry through scientometric analysis. J. Clean. Prod. 2021, 298, 126870. [Google Scholar] [CrossRef]
- Chen, W.Q. Recycling rates of aluminum in the United States. J. Ind. Ecol. 2013, 17, 926–938. [Google Scholar] [CrossRef]
- Heisel, F.; Nelson, C. RhinoCircular: Development and Testing of a Circularity Indicator Tool for Application in Early Design Phases and Architectural Education. In Proceedings of the 2020 AIA/ACSA Intersections Research Conference: CARBON, online, 30 September–2 October 2020; pp. 1–6. [Google Scholar]
- Ellen MacArthur Foundation. Ellen MacArthur Foundation Circularity Indicators: An Approach to Measuring Circularity; Ellen MacArthur Foundation: Cowes, UK, 2015; p. 12. [Google Scholar]
- Mesa, J.; Esparragoza, I.; Maury, H. Developing a set of sustainability indicators for product families based on the circular economy model. J. Clean. Prod. 2018, 196, 1429–1442. [Google Scholar] [CrossRef]
- Parchomenko, A.; Nelen, D.; Gillabel, J.; Rechberger, H. Measuring the circular economy—A Multiple Correspondence Analysis of 63 metrics. J. Clean Prod. 2019, 210, 200–216. [Google Scholar] [CrossRef]
- Ruiz-Pastor, L.; Chulvi, V.; Mulet, E.; Royo, M. The relationship between personal intrinsic factors towards a design problem and the degree of novelty and circularity. Res. Eng. Des. 2021. [Google Scholar] [CrossRef]
- Vinante, C.; Sacco, P.; Orzes, G.; Borgianni, Y. Circular economy metrics: Literature review and company-level classification framework. J. Clean. Prod. 2021, 288, 125090. [Google Scholar] [CrossRef]
- Vermeulen, W.J.V.; Reike, D.; Witjes, S. Circular Economy 3.0: Getting Beyond the Messy Conceptualization of Circularity and the 3R’s, 4R’s and More. In CEC4Europe Factbook; Circular Economy Coalition for Europe: Vienna, Austria, 2018; pp. 1–6. [Google Scholar]
- Madaster Services B.V. Madaster Circularity Indicator Explained; Madaster Services, B.V.: Laren, The Netherlands, 2018; 17p. [Google Scholar]
- Saidani, M.; Yannou, B.; Leroy, Y.; Cluzel, F.; Kendall, A. A taxonomy of circular economy indicators. J. Clean Prod. 2019, 207, 542–559. [Google Scholar] [CrossRef] [Green Version]
- MacArthur, E. Towards the Circular Economy, Economic and Business Rationale for an Accelerated Transition; Ellen MacArthur Foundation: Cowes, UK, 2013. [Google Scholar]
- Kirchherr, J.; Reike, D.; Hekkert, M. Conceptualizing the circular economy: An analysis of 114 definitions. Resour. Conserv. Recycl. 2017, 127, 221–232. [Google Scholar] [CrossRef]
- Platform CB’23. Guide for Measuring Circularity (Platform CB’23, 2020c): Core Method for Measuring Circularity in the Construction Sector; Platform CB’23: The Hague, The Netherlands, 2020. [Google Scholar]
- Weißenberger, M.; Jensch, W.; Lang, W. The convergence of life cycle assessment and nearly zero-energy buildings: The case of Germany. Energy Build. 2014, 76, 551–557. [Google Scholar] [CrossRef] [Green Version]
- Ortiz, O.; Castells, F.; Sonnemann, G. Sustainability in the construction industry: A review of recent developments based on LCA. Constr. Build. Mater. 2009, 23, 28–39. [Google Scholar] [CrossRef]
- Mesa, J.A.; Fúquene, C.E.; Maury-Ramírez, A. Life cycle assessment on construction and demolition waste: A systematic literature review. Sustainability 2021, 13, 7676. [Google Scholar] [CrossRef]
- Hossain, M.U.; Thomas Ng, S. Influence of waste materials on buildings’ life cycle environmental impacts: Adopting resource recovery principle. Resour. Conserv. Recycl. 2019, 142, 10–23. [Google Scholar] [CrossRef]
- Craven, D.J.; Okraglik, H.M.; Eilenberg, I.M. Construction Waste and a New Design Methodology. Sustain. Constr. 1994, 16, 89–98. [Google Scholar]
- Meibodi, A.B.; Kew, H.; Haroglu, H. Most popular methods for minimizing in-situ concrete waste in the UK. N. Y. Sci. J. 2014, 7, 111–116. [Google Scholar]
- Gharfalkar, M.; Court, R.; Campbell, C.; Ali, Z.; Hillier, G. Analysis of waste hierarchy in the European waste directive 2008/98/EC. Waste Manag. 2015, 39, 305–313. [Google Scholar] [CrossRef]
- Gertsakis, J.; Lewis, H. Sustainability and the Waste Management Hierarchy. EcoRecycle Vic. 2003, 16. [Google Scholar]
- Gehin, A.; Zwolinski, P.; Brissaud, D. A tool to implement sustainable end-of-life strategies in the product development phase. J. Clean Prod. 2008, 16, 566–576. [Google Scholar] [CrossRef]
- Li, W. Comprehensive evaluation research on circular economic performance of eco-industrial parks. Energy Proc. 2011, 5, 1682–1688. [Google Scholar] [CrossRef] [Green Version]
- Yeheyis, M.; Hewage, K.; Alam, M.S.; Eskicioglu, C.; Sadiq, R. An overview of construction and demolition waste management in Canada: A lifecycle analysis approach to sustainability. Clean Technol. Environ. Policy 2013, 15, 81–91. [Google Scholar] [CrossRef]
- Bakker, C.; Wang, F.; Huisman, J.; Den Hollander, M. Products that go round: Exploring product life extension through design. J. Clean Prod. 2014, 69, 10–16. [Google Scholar] [CrossRef]
- Ping Tserng, H.; Chou, C.M.; Chang, Y.T. The key strategies to implement circular economy in building projects-a case study of Taiwan. Sustainability 2021, 13, 754. [Google Scholar] [CrossRef]
- Zimmermann, R.K.; Kanafani, K.; Rasmussen, F.N.; Andersen, C.; Birgisdóttir, H. LCA-Framework to evaluate circular economy strategies in existing buildings. IOP Conf. Ser. Earth Environ. Sci. 2020, 588. [Google Scholar] [CrossRef]
- Gravagnuolo, A.; Angrisano, M.; Nativo, M. Evaluation of Environmental Impacts of Historic Buildings Conservation through Life Cycle Assessment in a Circular Economy Perspective. Aestimum 2020, 2020, 241–272. [Google Scholar] [CrossRef]
- De Wolf, C.; Hoxha, E.; Fivet, C. Comparison of environmental assessment methods when reusing building components: A case study. Sustain. Cities Soc. 2020, 61, 102322. [Google Scholar] [CrossRef]
- Malabi Eberhardt, L.C.; Van Stijn, A.; Rasmussen, F.N.; Birkved, M.; Birgisdottir, H. Towards circular life cycle assessment for the built environment: A comparison of allocation approaches. IOP Conf. Ser. Earth Environ. Sci. 2020, 588. [Google Scholar] [CrossRef]
- Antonini, E.; Boeri, A.; Lauria, M.; Giglio, F. Reversibility and durability as potential indicators for circular building technologies. Sustainability 2020, 12, 7659. [Google Scholar] [CrossRef]
- Abadi, M.; Sammuneh, M.A. Integrating circular economy and constructability research: An initial development of a lifecycle “circularity” assessment framework and indicators. In Proceedings of the 36th Annual ARCOM Conference, Leeds, UK, 7–8 September 2020; pp. 516–525. [Google Scholar]
- Nuñez-Cacho, P.; Górecki, J.; Molina-Moreno, V.; Corpas-Iglesias, F.A. What gets measured, gets done: Development of a Circular Economy measurement scale for building industry. Sustainability 2018, 10, 2340. [Google Scholar] [CrossRef] [Green Version]
- Charef, R.; Lu, W. Factor dynamics to facilitate circular economy adoption in construction. J. Clean Prod. 2021, 319, 128639. [Google Scholar] [CrossRef]
- Hossain, M.U.; Ng, S.T.; Antwi-Afari, P.; Amor, B. Circular economy and the construction industry: Existing trends, challenges and prospective framework for sustainable construction. Renew. Sustain. Energy Rev. 2020, 130, 109948. [Google Scholar] [CrossRef]
- Platform—Madaster. Available online: https://madaster.com/platform/ (accessed on 11 June 2020).
- Ellen MacArthur Foundation. Circularity Calculator. Available online: http://www.circularitycalculator.com/ (accessed on 15 October 2021).
- Durmisevic, E.; Ciftcioglu, Ő.; Anumba, C.J. Knowledge Model for Assessing Disassembly Potential of Structures; Delft University of Technology: Delft, The Netherlands, 2003. [Google Scholar]
- Heisel, F.; Rau-Oberhuber, S. Calculation and evaluation of circularity indicators for the built environment using the case studies of UMAR and Madaster. J. Clean Prod. 2020, 243, 118482. [Google Scholar] [CrossRef]
- Materials Passports—BAMB. Available online: https://www.bamb2020.eu/topics/materials-passports/ (accessed on 10 June 2020).
- Milieuclassificaties van Bouwproducten. Available online: https://www.nibe.info/nl/milieuclassificaties (accessed on 10 June 2020).
- Database—Nationale Milieudatabase. Available online: https://milieudatabase.nl/database/ (accessed on 10 June 2020).
- Smeets, A.; Wang, K.; Drewniok, M.P. Can Material Passports lower financial barriers for structural steel re-use? IOP Conf. Ser. Earth Environ. Sci. 2019, 225. [Google Scholar] [CrossRef]
- Heeren, N.; Fishman, T. A database seed for a community-driven material intensity research platform. Sci. Data 2019, 6, 23. [Google Scholar] [CrossRef] [PubMed]
- Honic, M.; Kovacic, I.; Rechberger, H. BIM-Based Material Passport (MP) as an Optimization Tool for Increasing the Recyclability of Buildings. Appl. Mech. Mater. 2019, 887, 327–334. [Google Scholar] [CrossRef]
- Honic, M.; Kovacic, I.; Sibenik, G.; Rechberger, H. Data- and stakeholder management framework for the implementation of BIM-based Material Passports. J. Build. Eng. 2019, 23, 341–350. [Google Scholar] [CrossRef]
- Honic, M.; Kovacic, I.; Aschenbrenner, P.; Ragossnig, A. Material Passports for the end-of-life stage of buildings: Challenges and potentials. J. Clean Prod. 2021, 319, 128702. [Google Scholar] [CrossRef]
- Atta, I.; Bakhoum, E.S.; Marzouk, M.M. Digitizing material passport for sustainable construction projects using BIM. Resour. Conserv. Recycl. 2021, 43, 103233. [Google Scholar] [CrossRef]
- Pauliuk, S. Critical appraisal of the circular economy standard BS 8001:2017 and a dashboard of quantitative system indicators for its implementation in organizations. Resour. Conserv. Recycl. 2018, 129, 81–92. [Google Scholar] [CrossRef]
- Di Maio, F.; Rem, P.C. A robust indicator for promoting circular economy through recycling. J. Environ. Prot. 2015, 6, 1095–1104. [Google Scholar] [CrossRef] [Green Version]
- Franklin-Johnson, E.; Figge, F.; Canning, L. Resource duration as a managerial indicator for Circular Economy performance. J. Clean Prod. 2016, 133, 589–598. [Google Scholar] [CrossRef]
- De Bruijn, H.; van Duin, R.; Huijbregts, M.A.J.; Guinee, J.B.; Gorree, M.; Heijungs, R.; Huppes, G.; Kleijn, R.; de Koning, A.; van Oers, L.; et al. (Eds.) Handbook on Life Cycle Assessment; Springer: Dordrecht, The Netherlands, 2002; p. 7. [Google Scholar] [CrossRef]
- ISO. ISO 14040:2006—Environmental Management—Life Cycle Assessment—Principles and Framework. Available online: https://www.iso.org/standard/37456.html (accessed on 11 September 2021).
- Akhimien, N.G.; Latif, E.; Hou, S.S. Application of circular economy principles in buildings: A systematic review. J. Build. Eng. 2021, 38. [Google Scholar] [CrossRef]
- Lei, H.; Li, L.; Yang, W.; Bian, Y.; Li, C.-Q. An analytical review on application of life cycle assessment in circular economy for built environment. J. Build. Eng. 2021, 44, 103374. [Google Scholar] [CrossRef]
- Zhai, J. BIM-Based Building Circularity Assessment from the Early Design Stages A BIM-Based Framework for Automating the Building Circularity Assessment from Different Levels of a Building’s Composition and Providing the Decision-Making Support on the Design of the Circular Building from the Early Design Stages. Master’s Thesis, Eindhoven University of Technology, Eindhoven, The Netherlands, September 2020. [Google Scholar]
Figure 1.
Circular cycles in BC.

Figure 2.
The new material flow model.

Figure 3.
Factors and Indicators (1–5) for the new BC model.

Figure 4.
Data provided in NIBE [50].
Figure 4.
Data provided in NIBE [50].

Figure 5.
Data provided in NIBE for foamed concrete, exterior wall paint, and mortar [50].
Figure 5.
Data provided in NIBE for foamed concrete, exterior wall paint, and mortar [50].

Figure 6.
Data provided in NMD [51].
Figure 6.
Data provided in NMD [51].

Figure 7.
Data provided in BAMB [49].
Figure 7.
Data provided in BAMB [49].

Figure 8.
An example of the new BC MP.

Figure 9.
Circularity cycles in the BC calculation method.

Figure 10.
Symbols of indicators and factors in the BC calculation method.


Table 1.
Searching process for the reviewed papers.
| Term 1 | Term 2 | Term 3 | Paper Found in the First Step | Remaining Paper in the Second Step |
|---|---|---|---|---|
| Circular economy | Construction | Indicator | 95 | 9 |
| Circular economy | Construction | Assessment | 281 | 17 |
| Circularity | Construction | Indicator | 22 | 4 |
| Circularity | Construction | Assessment | 44 | 8 |
| Total | 442 | 38 |
Table 2.
R strategies in the research of waste management.
| R Strategy | Gertsakis et al., 2003 [30] | Gehin et al., 2007 [31] | Yeheyis et al., 2013 [33] | Bakker et al., 2014 [34] | Ping et al., 2021 [35] | Vermeulen et al., 2018 [17] |
|---|---|---|---|---|---|---|
| Refuse | √ | |||||
| Reduce | √ | √ | √ | √ | ||
| Reuse | √ | √ | √ | √ | √ | √ |
| Repair | √ | √ | ||||
| Refurbish | √ | |||||
| Remanufacture | √ | √ | ||||
| Repurpose | √ | |||||
| Recycle | √ | √ | √ | √ | √ | √ |
| Recover energy | √ | |||||
| Remine | √ | |||||
| Treatment | √ | |||||
| Disposal | √ | |||||
| Prevention | √ | |||||
| Rethink | √ |
Table 3.
Cycle comparison between MCI, Madaster, CB′23, and the material flow model.
| Item | MCI [12] | Madaster [18] | CB′23 [22] | Material Flow Model | |
|---|---|---|---|---|---|
| Application domain | All industries | AEC industry | AEC industry | AEC industry | |
| Cycles | Technical cycle | Yes | Yes | Yes | Yes |
| Biological cycle | Yes | No | Yes | Yes | |
| Economic cycle | No | No | No | Yes | |
Table 4.
Indicators comparison between MCI, Madaster, CB′23 and the material flow model.
| Indicators Included in the Technical Cycle | MCI [12] | Madaster [18] | CB′23 [22] | Material Flow Model |
|---|---|---|---|---|
| Material source in input | Yes | Yes | Yes | Yes |
| Material source in output | Yes | Yes | Yes | Yes |
| Efficiency of the recycling process (Disassembly) | Yes | No | Yes | Yes |
| Lifetime | Yes | Yes | No | Yes |
| Functional units achieved | Yes | No | No | Yes |
Table 5.
Indicators in MD and MP.
| Class | Name | Material Source in Input | Material Source in Output | Functional Units Achieved | Lifetime | Efficiency of the Recycling Process |
|---|---|---|---|---|---|---|
| MD | NIBE [50] | × | √ | × | √ | × |
| NMD [51] | × | √ | × | √ | × | |
| MP | BAMB [49] | √ | √ | × | √ | √ |
| BC MP | √ | √ | √ | √ | √ |
Table 6.
Factors in MD and MP.
| Class | Name | Refurbish | Remanufacture | Reuse | Repair | Recycle |
|---|---|---|---|---|---|---|
| MD | NIBE [50] | × | × | √ | × | √ |
| NMD [51] | × | × | × | × | √ | |
| MP | BAMB [49] | × | × | √ | × | √ |
| BC MP | √ | √ | √ | √ | √ |
Table 7.
Different settings for the efficiency and factors of the recycling process.
| Indicator | Setting 1 (Jianli et al.) [65] | Setting 2 (Material Flow Model) | Setting 3 (Madaster) [48] | Setting 4 (Material Flow Model) | |
|---|---|---|---|---|---|
| CRmi | Rici | 0% | 0% | 0% | 0% |
| Rimu | 0% | 0% | |||
| Rifb | 0% | 0% | |||
| Ripr | 0% | 0% | |||
| Riui | 0% | 0% | 0% | 0% | |
| CRmo | Roci | 0% | 0% | 100% | 100% (weight: 0.4) |
| Romu | 0% | 0% | |||
| Rofb | 0% | 0% | |||
| Ropr | 0% | 0% | |||
| Roui | 100% | 100% | 0% | 0% | |
| DS | -- | 50% | 100% | 100% | |
| LS | 100% | 100% | 100% | 100% | |
| Fu | 100% | 100% | |||
| BC | 50% | 25% | 50% | 20% | |
Bold text highlights the differences between setting 1 and 2, 3 and 4.
Publisher’s Note: MDPI stays neutral with regard to jurisdictional claims in published maps and institutional affiliations. |
© 2021 by the authors. Licensee MDPI, Basel, Switzerland. This article is an open access article distributed under the terms and conditions of the Creative Commons Attribution (CC BY) license (https://creativecommons.org/licenses/by/4.0/).
Share and Cite
MDPI and ACS Style
Zhang, N.; Han, Q.; de Vries, B. Building Circularity Assessment in the Architecture, Engineering, and Construction Industry: A New Framework. Sustainability 2021, 13, 12466. https://0-doi-org.brum.beds.ac.uk/10.3390/su132212466
AMA Style
Zhang N, Han Q, de Vries B. Building Circularity Assessment in the Architecture, Engineering, and Construction Industry: A New Framework. Sustainability. 2021; 13(22):12466. https://0-doi-org.brum.beds.ac.uk/10.3390/su132212466
Chicago/Turabian StyleZhang, Nuo, Qi Han, and Bauke de Vries. 2021. "Building Circularity Assessment in the Architecture, Engineering, and Construction Industry: A New Framework" Sustainability 13, no. 22: 12466. https://0-doi-org.brum.beds.ac.uk/10.3390/su132212466
Note that from the first issue of 2016, this journal uses article numbers instead of page numbers. See further details here.