
A Stated Preference Survey for Evaluating Young Pedestrians’ Preferences on Walkways


Department of Civil Engineering, University of Calabria, 87036 Rende, Italy
*
Author to whom correspondence should be addressed.
Sustainability 2021, 13(22), 12434; https://0-doi-org.brum.beds.ac.uk/10.3390/su132212434
Submission received: 30 July 2021
/
Revised: 5 November 2021
/
Accepted: 9 November 2021
/
Published: 11 November 2021
(This article belongs to the Special Issue Tendencies and Strategies of Active Mobility to Promote Urban Sustainable Transportation Systems)
Abstract
:For promoting pedestrian mobility, the quality levels of pedestrian paths should be increased. Many researchers suggest methodologies for determining the pedestrian level of service. Among these, some studies consider both paths’ physical characteristics and users’ perception about the walkways. Investigating users’ perceptions represents a good strategy for implementing interventions aimed at increasing the quality of service. The aim is recording pedestrians’ perceptions about the characteristics of the path and detecting the choices they would make in a hypothetical scenario. This work proposes the design of a Stated Preferences survey and the analysis of the preliminary results. A questionnaire was sent out to a sample of 240 pedestrians, prevalently students, about a walkway located in the University Campus of Rende (Italy). The collected data were analyzed by means of a discrete choice model for assessing the importance assigned by pedestrians to each aspect included in the analysis. The results showed that the environment can be considered as the most important aspect for young pedestrians, while the width of the path is not significant. The outcomes also highlighted the aspects it is necessary to change in order to make pedestrian paths increasingly attractive and to encourage users towards active mobility.
1. Introduction
Car traffic increasing undermines the quality of life in urban areas. Motorized traffic has grown so much that many important aspects of urban life are inhibited, so that the issue of sustainability has become a fundamental topic. Promoting walking as an alternative to short trips made by car represents an important strategy to enact sustainability in more densely inhabited areas [1].
Benefits of increased walking include not only reductions in traffic congestion, air pollution and emissions, but also improvements in public and private health, community relations and a positive sense of place, as well as improvements in economic and real estate performance [2].
Walkability can be defined as the extent to which a built environment enables walking [3] and is pedestrian friendly [4,5]. Some studies emphasize different environmental features that a pedestrian facility has to own, including areas being traversable, compact and safe, as well as the places have to be lively, enhancing sustainable transportation options and encouraging outdoor exercise and leisure [6,7,8]. In this context, it becomes fundamental to investigate the direct users of the facilities about their perceptions and preferences concerning the service quality characterizing pedestrian environment. Understanding the service quality requires users to be asked about their perception of what is relevant to them [9]. The relationship between pedestrian perceptions and service quality is still nascent. Many studies aim to calculate a performance indicator as pedestrian level of service (PLOS). This indicator was derived from the level of service concept for highway design contained in the Highway Capacity Manual [10]. In its first definition, PLOS was determined according to the pedestrian flow and the geometric characteristics of the sidewalk [11]. Subsequently, the definition of PLOS was enriched with other attributes, strictly dependent on the perceptions of pedestrians.
In the literature, the majority of the recent studies that focus on PLOS determination are based on the collection of pedestrian perceptions in terms of ratings expressed on evaluation scales. The research conducted by [12] proposed a PLOS model that covers various street conditions for pedestrians with different ranges of abilities. They included in the analysis many attributes related to the characteristics of the sidewalk and to the street condition. Among the attributes evaluated by the pedestrians, there are: slower traffic speed, buffers and barriers, fewer traffic lanes, landscape and trees, furniture, footpath pavements, markings (crosswalks), width of footpath, lighting, slope, tactile pavement, ramp, bench and seating areas and drinking fountains.
An alternative walking index, the Quality of Pedestrian Level of Service (Q-PLOS) was developed by [13]. This novel method is based on the quality of urban design for pedestrians and their relationship with walking needs. They grouped the factors considering the following walking needs: accessibility, safety, comfort and attractiveness. Then, they defined the relevant factors in pedestrian mobility publications according to the ratio taken from the total number of papers analyzed from journals over the last 20 years. The indicators involved in the analysis were selected on the basis of relevance, applicability and understanding criteria. The variables included in the model were connectivity, pavement width, traffic speed, tree density and commercial density.
On the basis of the pedestrian perception, [14] elaborated a Structural Equation Model (SEM) to summarize many factors that affect pedestrian mobility in a few latent variables. Their results suggested that pedestrian perceptions of sidewalk characteristics are the most relevant for improving perceived service quality. Increasing the perceived quality of the sidewalk characteristics (i.e., width, condition, furniture, trees, public transport access, and signage) is essential when it comes to improving urban sidewalks. Improving pedestrian infrastructure is a necessary condition for consolidating a positive perception of the surroundings (weather, lighting, odor, environment, cleanliness and landscape), protection (security, sidewalk safety and road safety) and amenities (restrooms, shops and shade).
Other studies found that wider sidewalks are generally preferred [13,15] and lateral separation from traffic increase paths’ attractiveness [16]. The presence of trees is appreciated [13].
On the other hand, some studies investigate pedestrian perceptions adopting the Stated Preferences (SP) approach, according to which actual or potential users are asked to rate or rank the attractiveness of existing or hypothetical scenarios [3,17,18]. The importance (utility) of the various service attributes is estimated based on the respondents’ preferences. SP scenarios are typically presented in text format showing attributes and their levels, but sometimes photos or videos are adopted [19]. The existing literature confirms that the SP method is suitable for analyzing pedestrian perceptions. However, few studies still apply this method for analyzing pedestrian perceptions on walkways. Therefore, this paper wants to provide a contribution to the literature of the studies proposing SP experiments for investigating on pedestrian preferences, with a focus on preferences expressed by young pedestrians. For facilitating the users in expressing their opinions, we also adopted photos representing the characteristics of the alternative pedestrian environments proposed to the users to make a choice. After a deep study of the literature review and on the basis of the preliminary results of a survey previously conducted, we selected four attributes to introduce in the SP experiment: width of the pedestrian path; pavement of the pedestrian path; equipment present along the pedestrian path; environment where the pedestrian path develops. Interesting findings emerge from the observations of the choice of the various alternatives made by the users. In order to validate the SP survey and bring out the findings of the analysis of the preferences expressed by the users, a Multinomial Logit (MNL) model was calibrated. We found that the environment where the pedestrian path develops is the most important aspect for the users.
2. Materials and Methods
2.1. Stated Preference Survey Design
The Stated-Preferences approach is a particular type of survey where two or more hypothetical scenarios are proposed to the interviewee. The interviewee is asked to choose the scenario they prefer most or to rank the scenarios according to their personal level of preference. Defining the attributes and the attributes levels to be used in an SP experiment is not an easy task, requiring several important decisions to be made by the analyst [20]. Therefore, a deeper analysis of the literature review and a preliminary survey should be made before choosing the attributes to be included in the study.
The SP survey planned in this work was referred to as the detection of the perceived degree of comfort of a pedestrian path. The comfort attributes of a pedestrian path are countless; for this reason, the most recurring comfort attributes were selected from the literature review and a preliminary survey was carried out on the same walkway under study. Respondents were asked to express their preferences on comfort attributes such as, width of the pedestrian path, continuity of the pedestrian path, pavement, furniture, presence of trees, access to public transport, demarcation of the pedestrian path, lighting, environment in proximity of the path, cleanliness, presence of shops, disturbance due to the presence of other pedestrians, disturbance due to the presence of bicycles, disturbance due to vehicular traffic.
From these analyses, four attributes have been identified:
- width of the pedestrian path;
- pavement of the pedestrian path;
- equipment present along the pedestrian path;
- environment where the pedestrian path develops.
These attributes have also emerged in other studies conducted on routes in the same urban area under study [21].
Each attribute (or variable) varies on two levels or categories in order to have two completely different situations. Intermediate levels were not considered to avoid complicating the choice that the interviewee will have to make. As recognized by [20], reducing the number of levels within the design of an SP survey involve a loss of information gained; however, such a reduction will dramatically reduce the design size. A strategy often employed in the experimental design is to utilize the attribute levels at the extremes only, where each attribute will have only two attribute levels, both at the two extremes of the attribute level range. Such design is known as end-point design [22], and it is particularly useful if the analyst is using the experiment as an exploratory tool [20].
The interviewee’s task was facilitated by the inclusion of images relating to the different levels of the attributes considered in the survey form. As reported in [20], a requirement of an SP experiment is that the levels of the attribute be well defined, that is they have the same meaning to all decision makers surveyed. Attribute levels may be ambiguously interpreted particularly in the case of qualitatively defined attributes. In these cases, “a picture is worth a thousand words”. Introducing images in the card is just to help the respondent in understanding the attributes, which may not be clear to those who are not specialists in the field of pedestrian infrastructures. In fact, the images in the SP surveys better capture the attention of the interviewee and provide a concrete idea of the attribute by increasing its realism [23]. By also following the results obtained by [24], we definitively decided to adopt photos for describing the categories of the attributes.
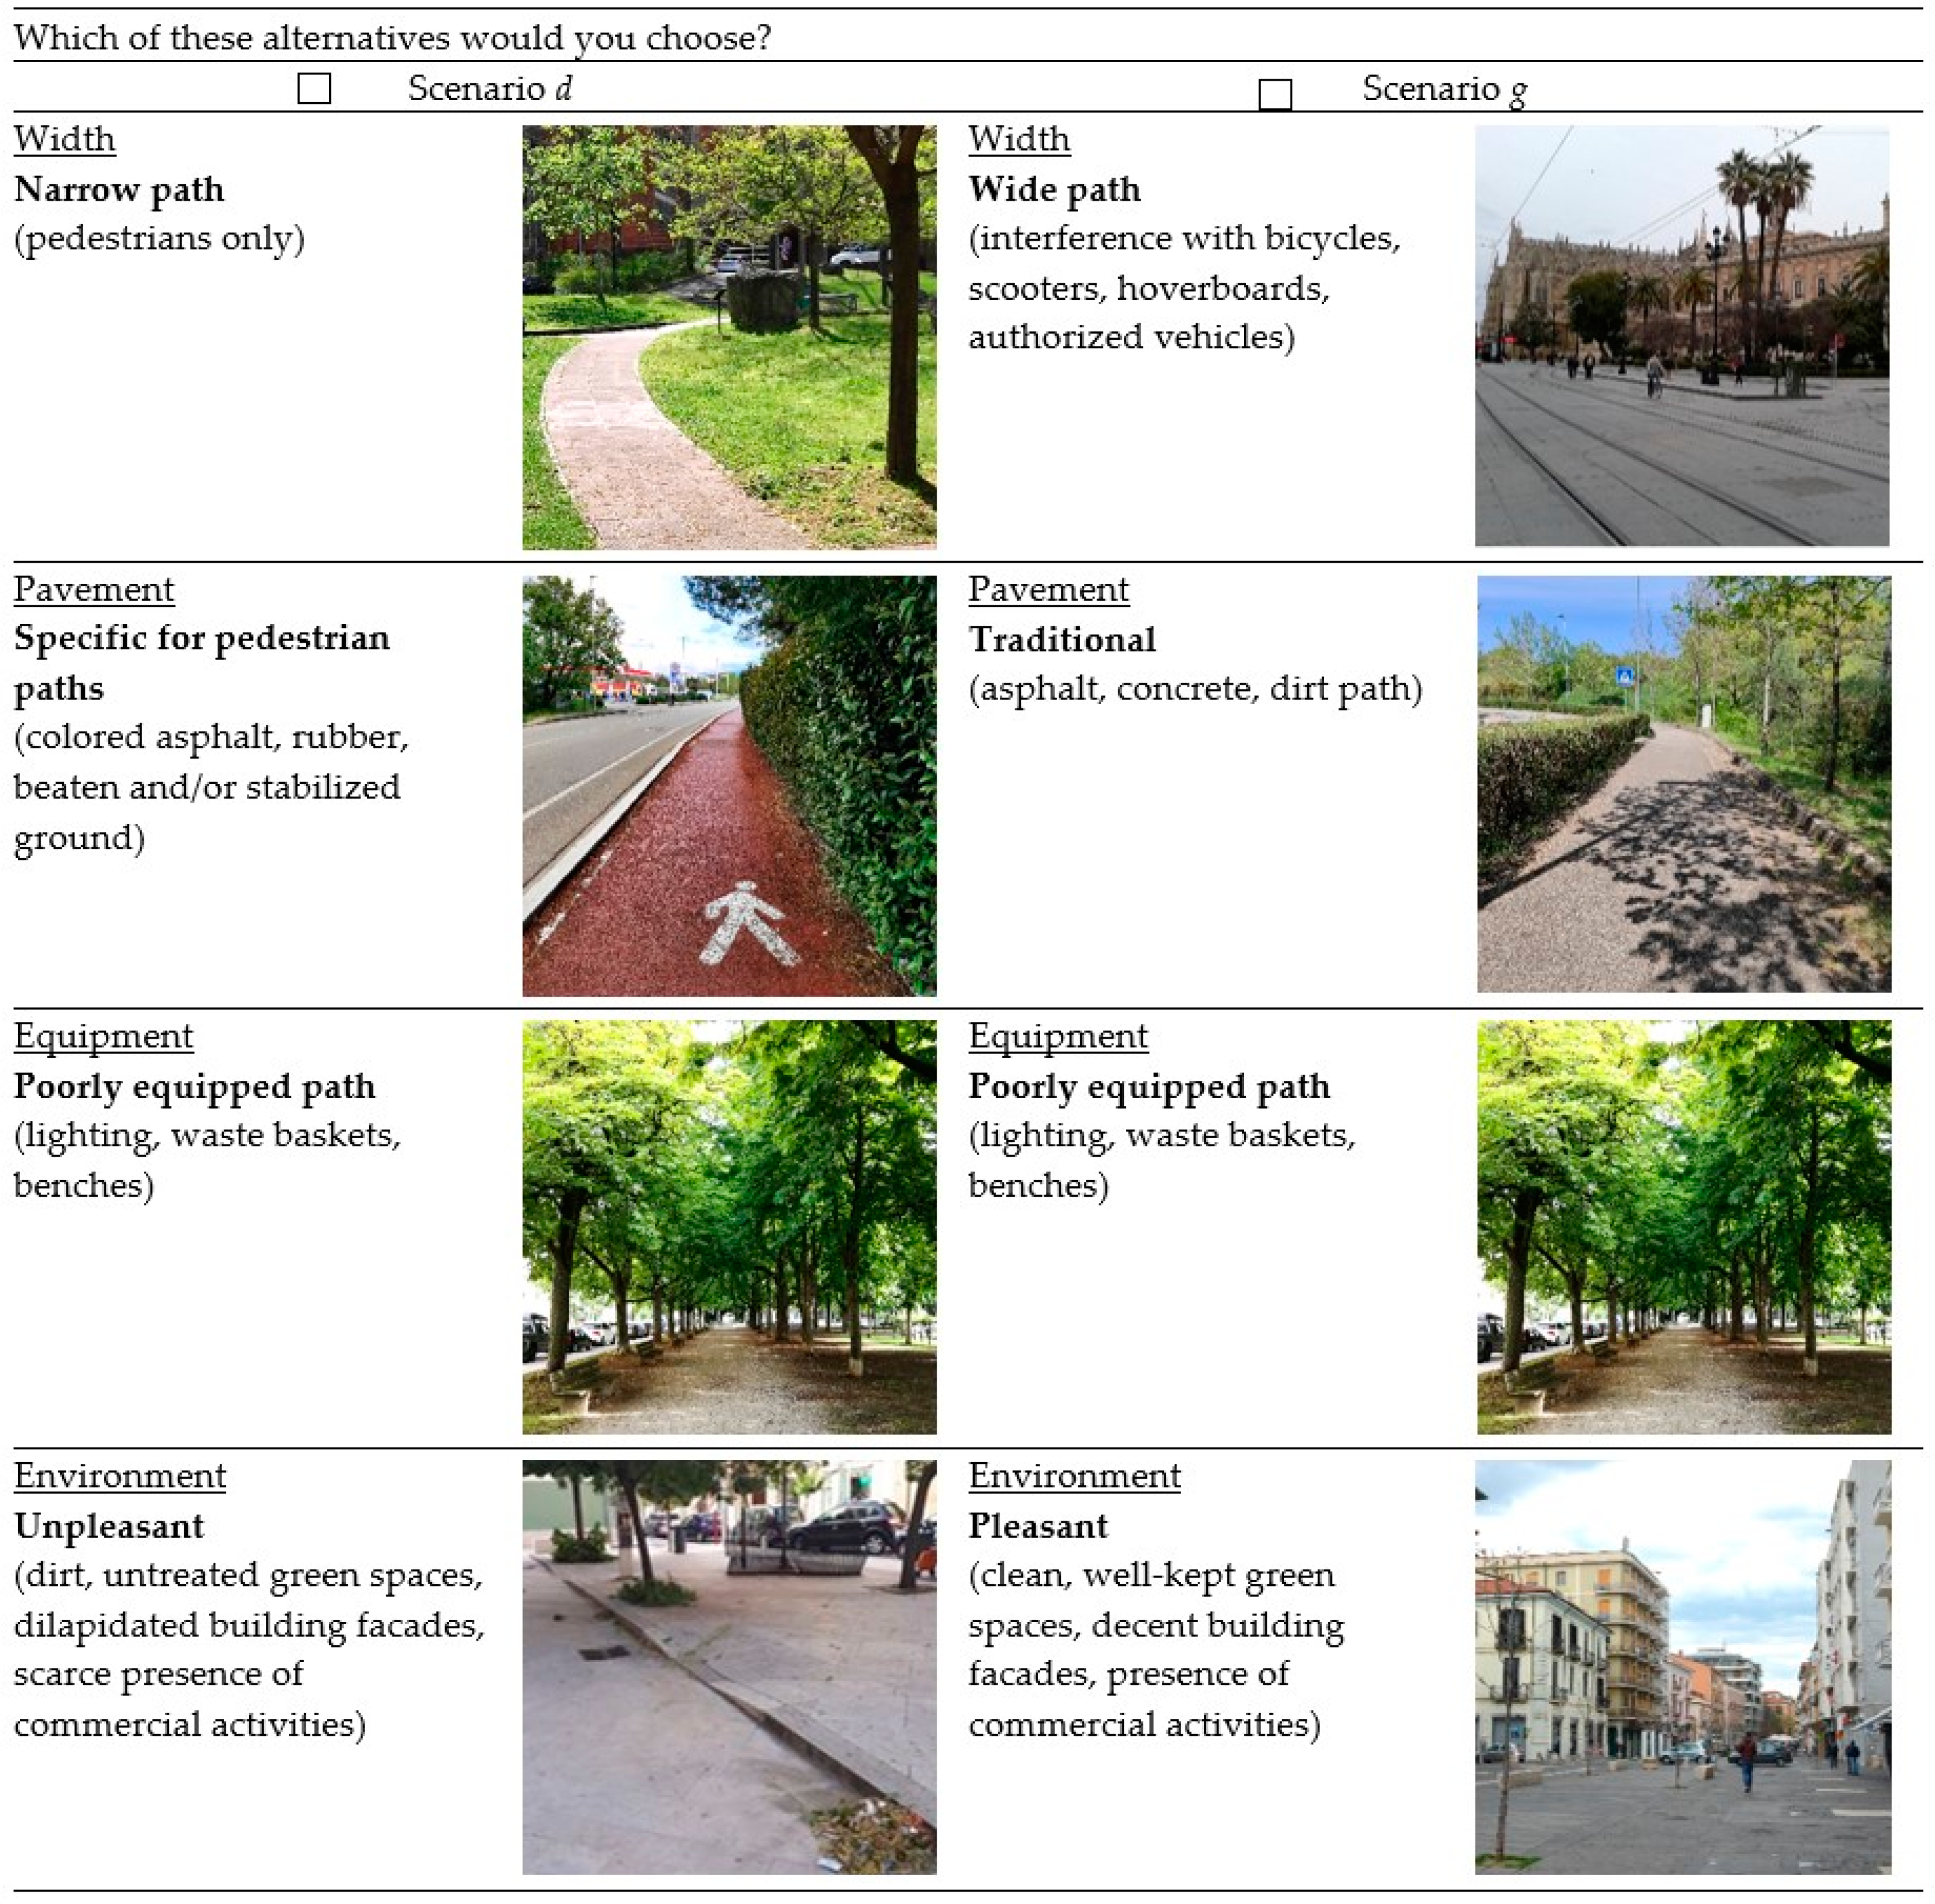
Specifically, the categories relating to the width attribute are narrow path (pedestrians only) and wide path (interference with bicycles, scooters, hoverboards, authorized vehicles). The pavement can be traditional (asphalt, concrete, dirt path) or specific for pedestrian paths (colored asphalt, rubber, beaten and/or stabilized ground). Along the route there may be more or less equipment, distinguishing between a poorly equipped path (lighting, waste baskets, benches) or an equipped path (lighting, waste baskets, benches and/or seats, beverage and food distributors, Wi-Fi and charging stations, protection from atmospheric agents). The environment can be unpleasant (dirt, untreated green spaces, dilapidated building facades, scarce presence of commercial activities) or pleasant (clean, well-kept green spaces, decent building facades, presence of commercial activities).
After establishing the levels of each attribute, hypothetical scenarios were constructed. A scenario is given by a set of level attribute combinations. For example, a scenario could be composed of a wide path, specific pavement, poorly equipped path and unpleasant environment. When all possible scenarios are considered, the survey project takes the name of Full Factorial Design. Specifically, we have considered four attributes at two levels, for which the Full Factorial Plan consists of 16 scenarios (24).
Often the Full Factorial Plan is too numerous or presents irrelevant scenarios, so a reduction in the total number of scenarios is implemented. The Fractional Factorial Plan is a plan reduced through appropriate exclusions of scenarios in order to lose the least possible amount of information (variance explained) considering only the main effects of the attributes and neglecting some or all interactions. In our case, four scenarios have been eliminated which correspond to cases in which we have traditional flooring and an equipped path. In fact, an equipped path is not compatible with an ordinary sidewalk with poor quality pavement. As reported in Table 1, twelve scenarios were included in the survey. The scenarios have been indicated with the letters of the alphabet from a to n.
Once the scenarios have been defined, it is necessary to combine them in order to identify the set of choices. The scenarios were combined in pairs, obtaining 64 sets of choices. In this work, a set of choices has been named “card”. Each card contains two scenarios. Figure 1 shows an example of card where we combined scenario d (narrow path, specific pavement, poorly equipped path and unpleasant environment) with scenario g (wide path, traditional pavement, poorly equipped path and pleasant environment).
Two combinations were discarded, as one scenario was clearly better than the other, in order to avoid too expectable choices. The interviewee had to administer a block consisting of 8 cards. For each card the interviewee was asked to choose one of the two scenarios.
2.2. Data Analysis and Modelling
The survey was carried out in November and December 2019 by interviewing a sample of 240 people along a pedestrian path located in the University Campus of Rende (Italy). Each pedestrian interviewed answered only one block, so for each block we collected the answers of 30 respondents. The interviews were conducted face-to-face. The interviewer stopped respondents along the pedestrian path. The sample is divided almost equally between males (51%) and females (49%). As the survey was carried out on the university campus, most of the interviewees are students (99%) aged 25 or under. About 96% of the interviewed pedestrians walks on the path to reach the study areas. Most (about 87%) make this trip at least once a day. Since the sample is mainly made up of university students, the results obtained are generalizable for young pedestrians.
The collected data were preliminarily analyzed applying the descriptive statistics techniques. Subsequently, a Multinomial Logit model (MNL) was calibrated for validating the SP survey and deriving the importance of each attribute in the pedestrians’ evaluation. All the four attributes (width, pavement, equipment and environment) were included in the model elaborated through NLogit software [25].
3. Results
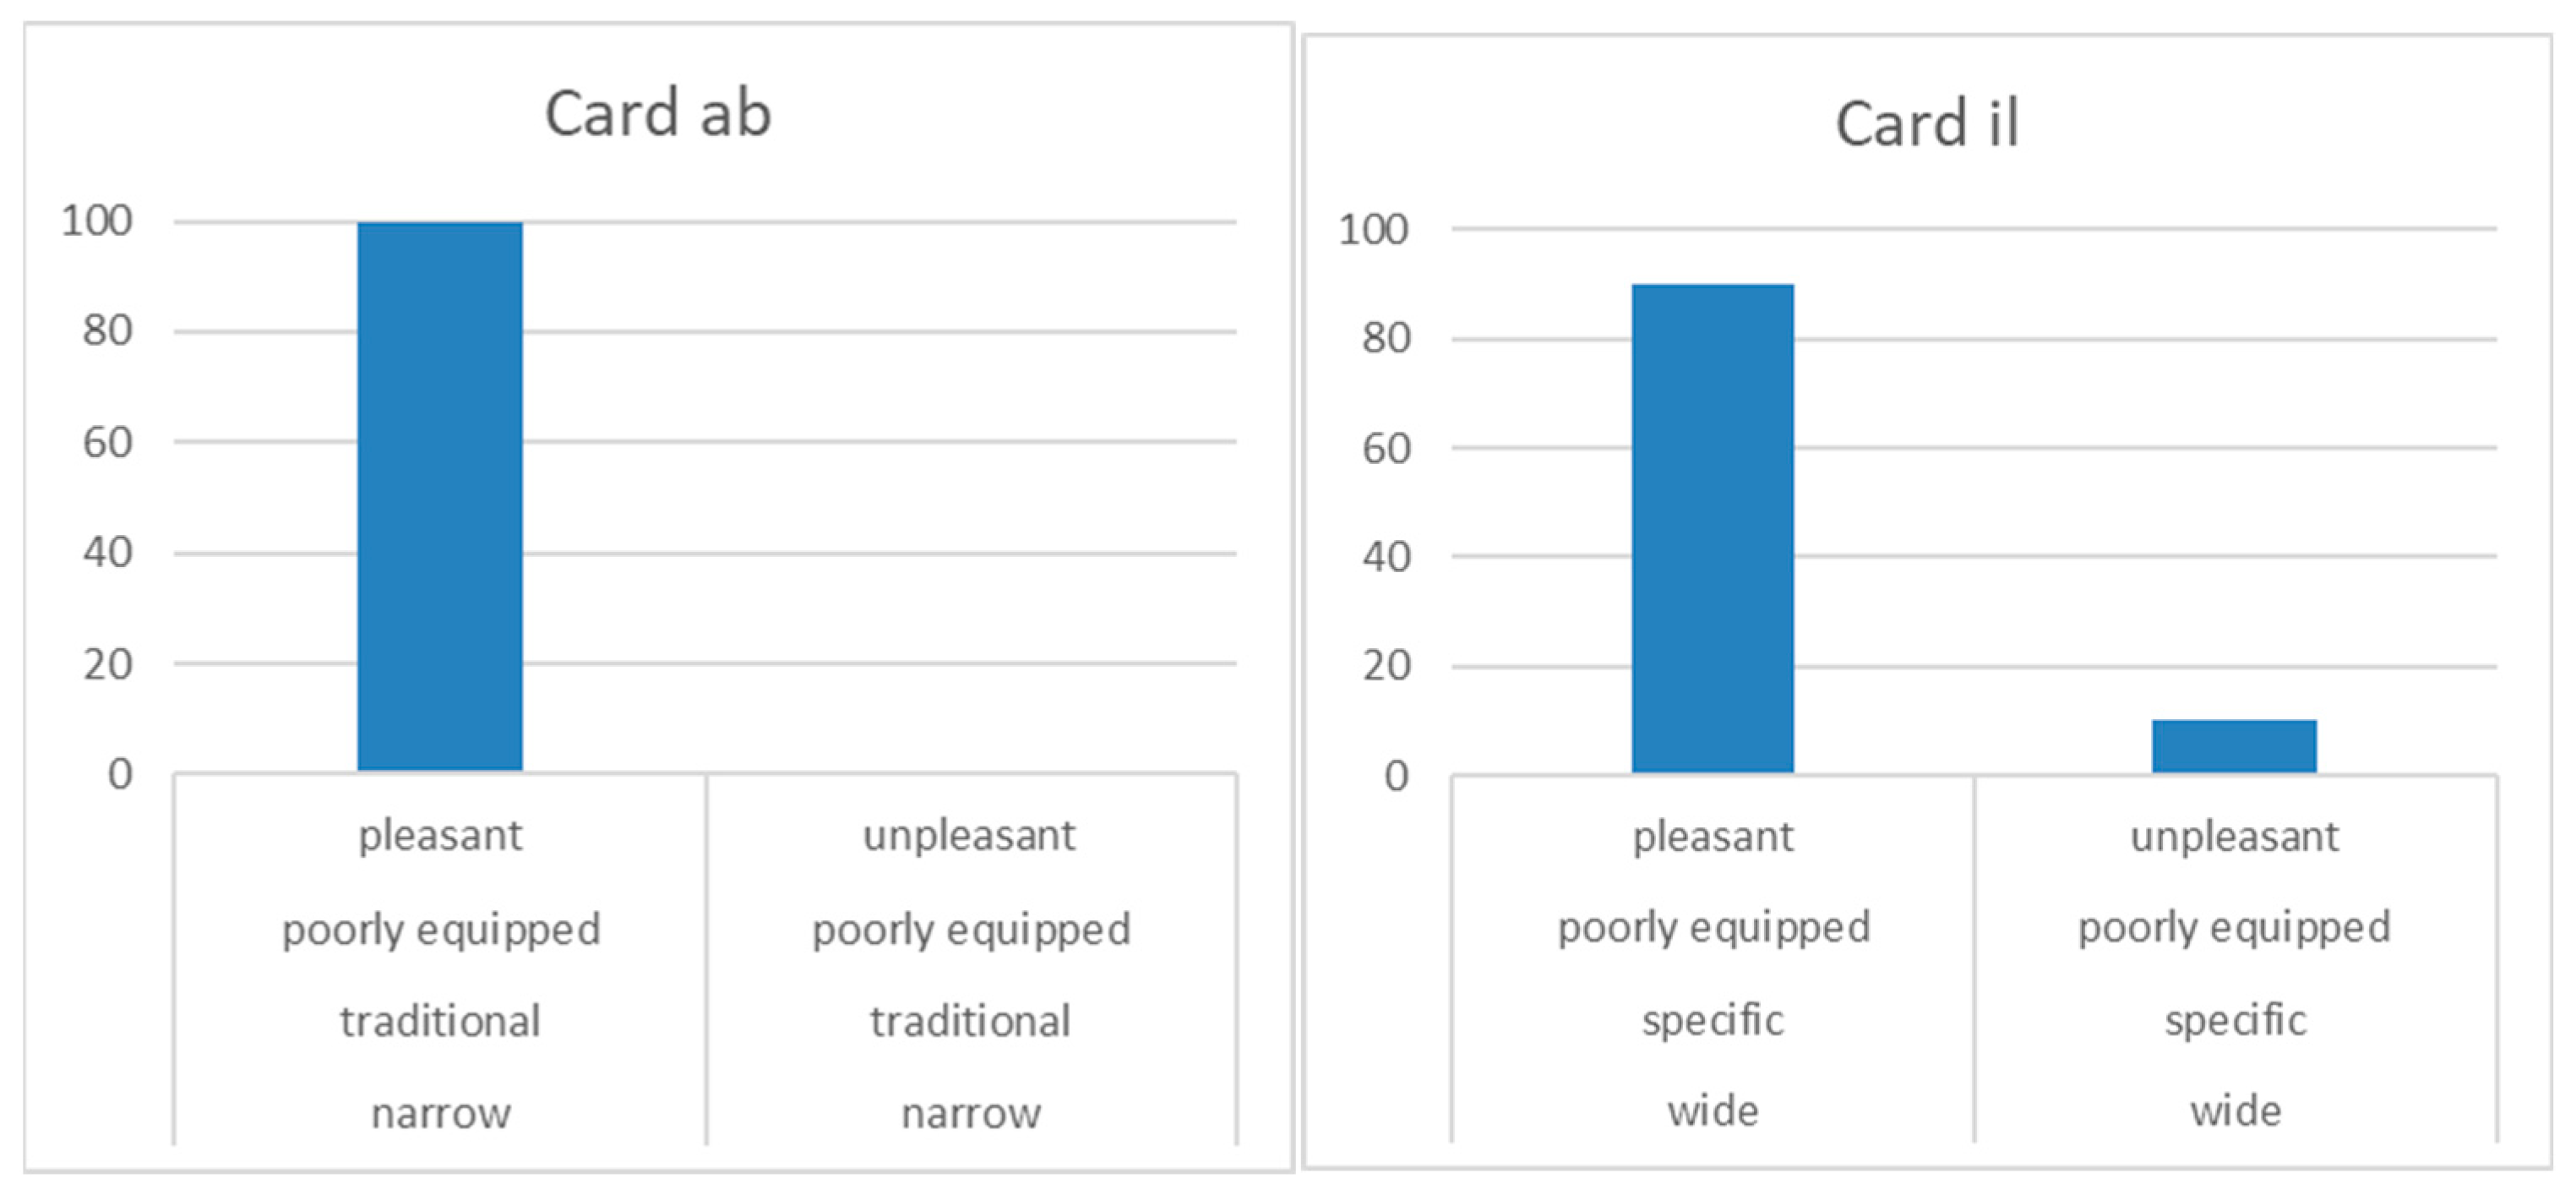
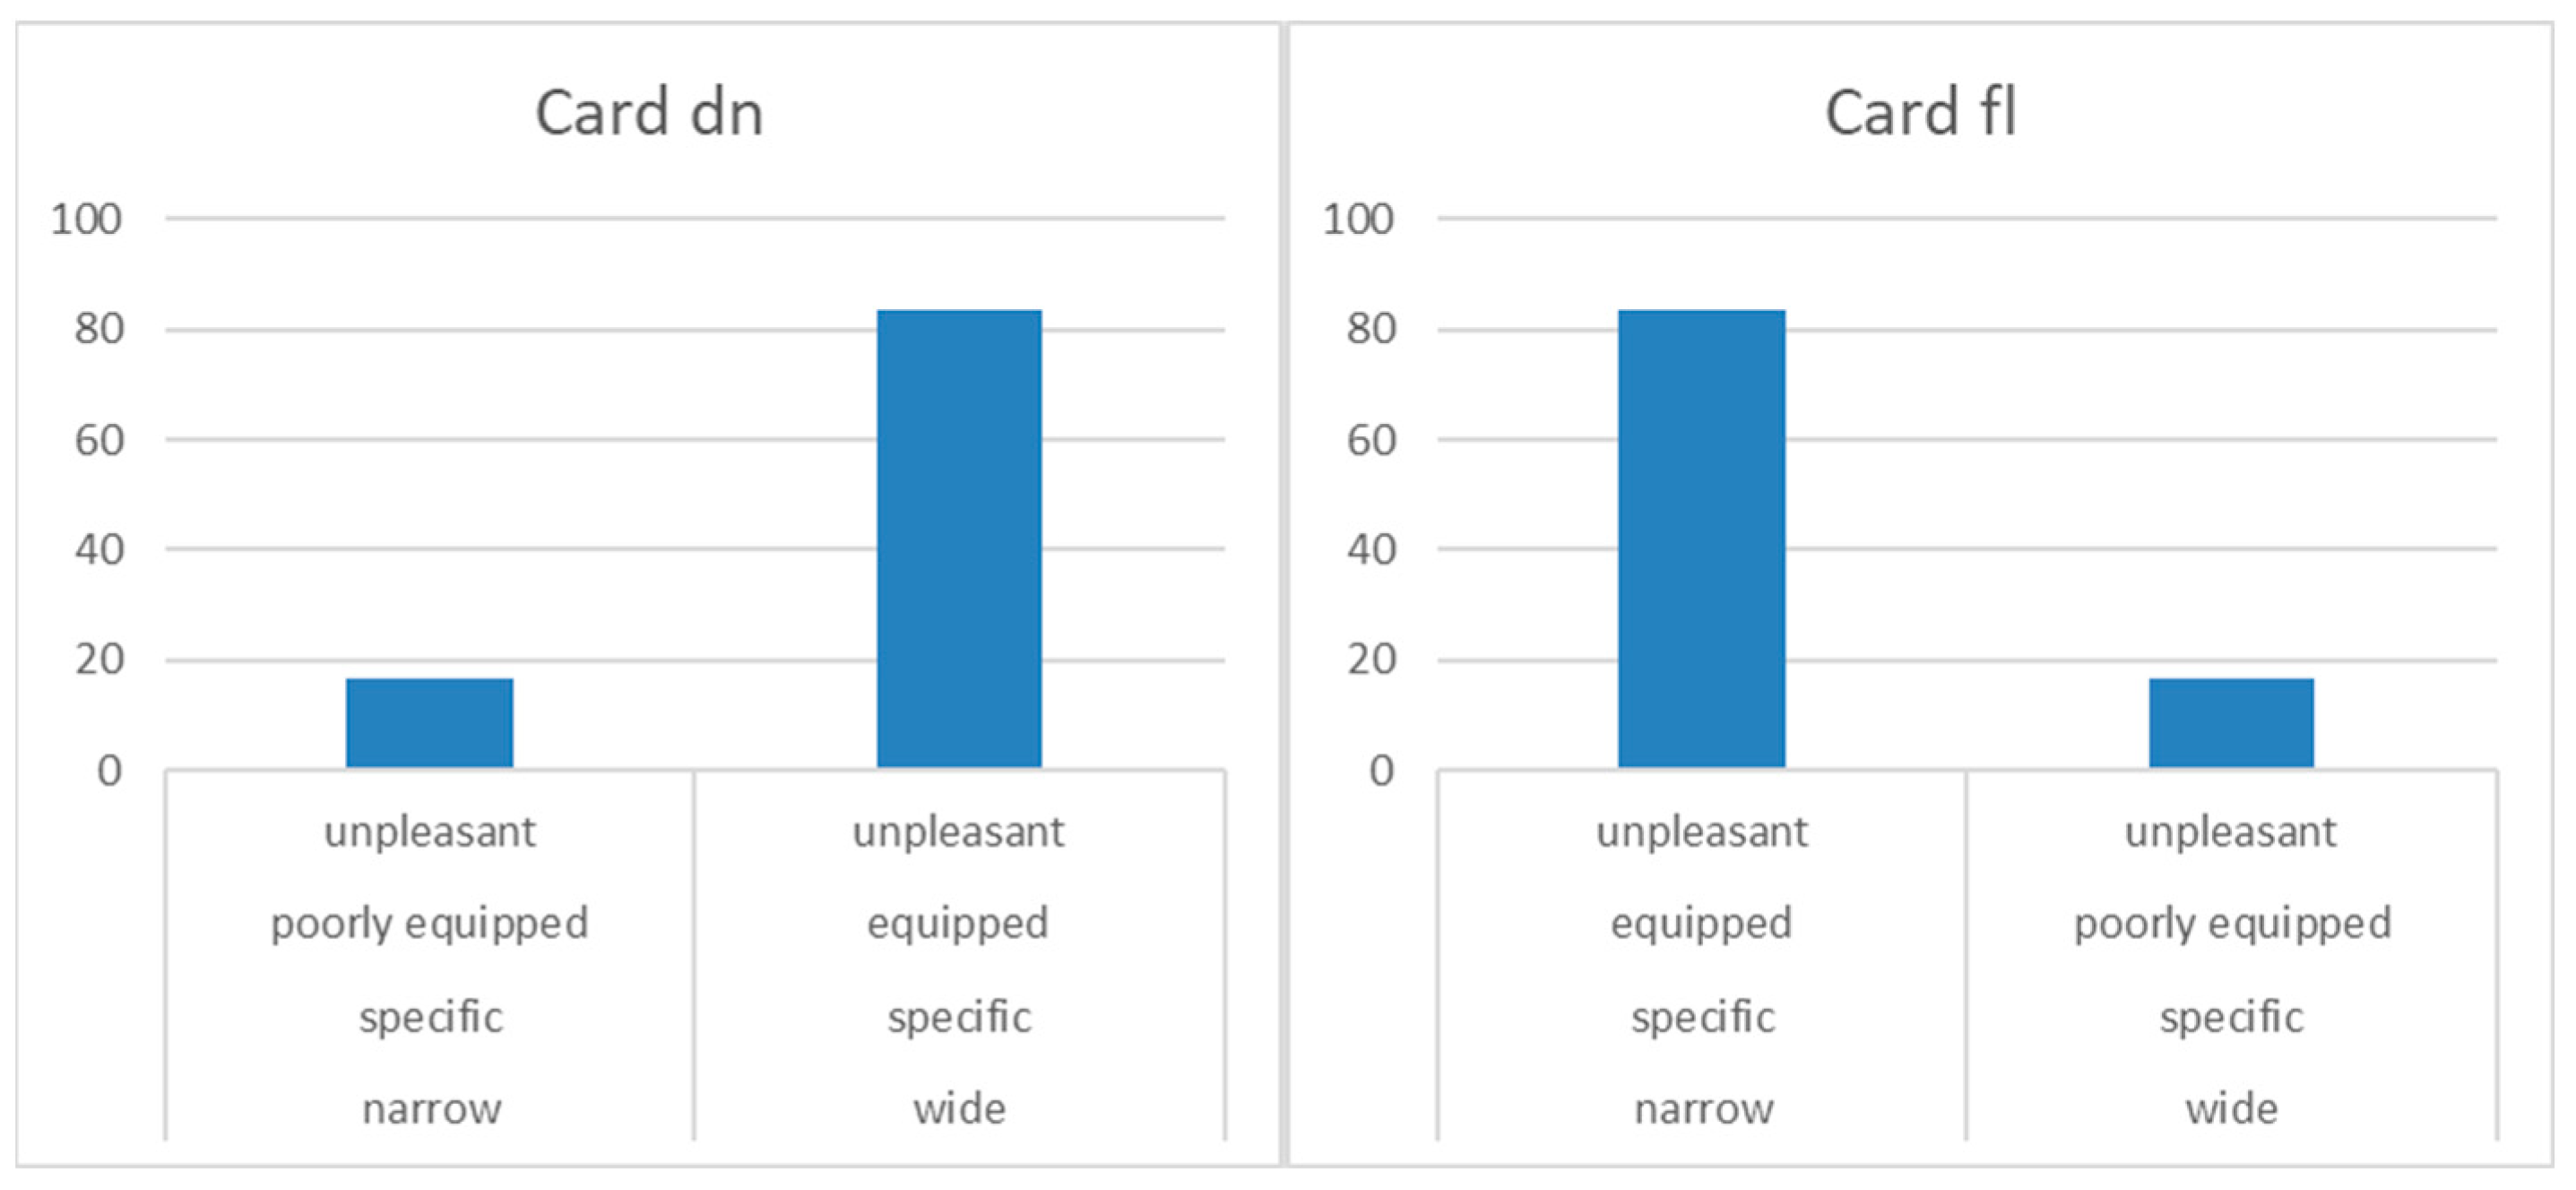
From the preliminary analysis of the data collected, it emerged that for each pair of scenarios where the possibility of choosing between a pleasant and unpleasant environment appears, most of the pedestrians have chosen the scenario characterized by a pleasant environment. As can be seen from the two bar diagrams in Figure 2, there are few (or even zero for card ab) pedestrians who, with all other things being equal, choose a path with an unpleasant environment.
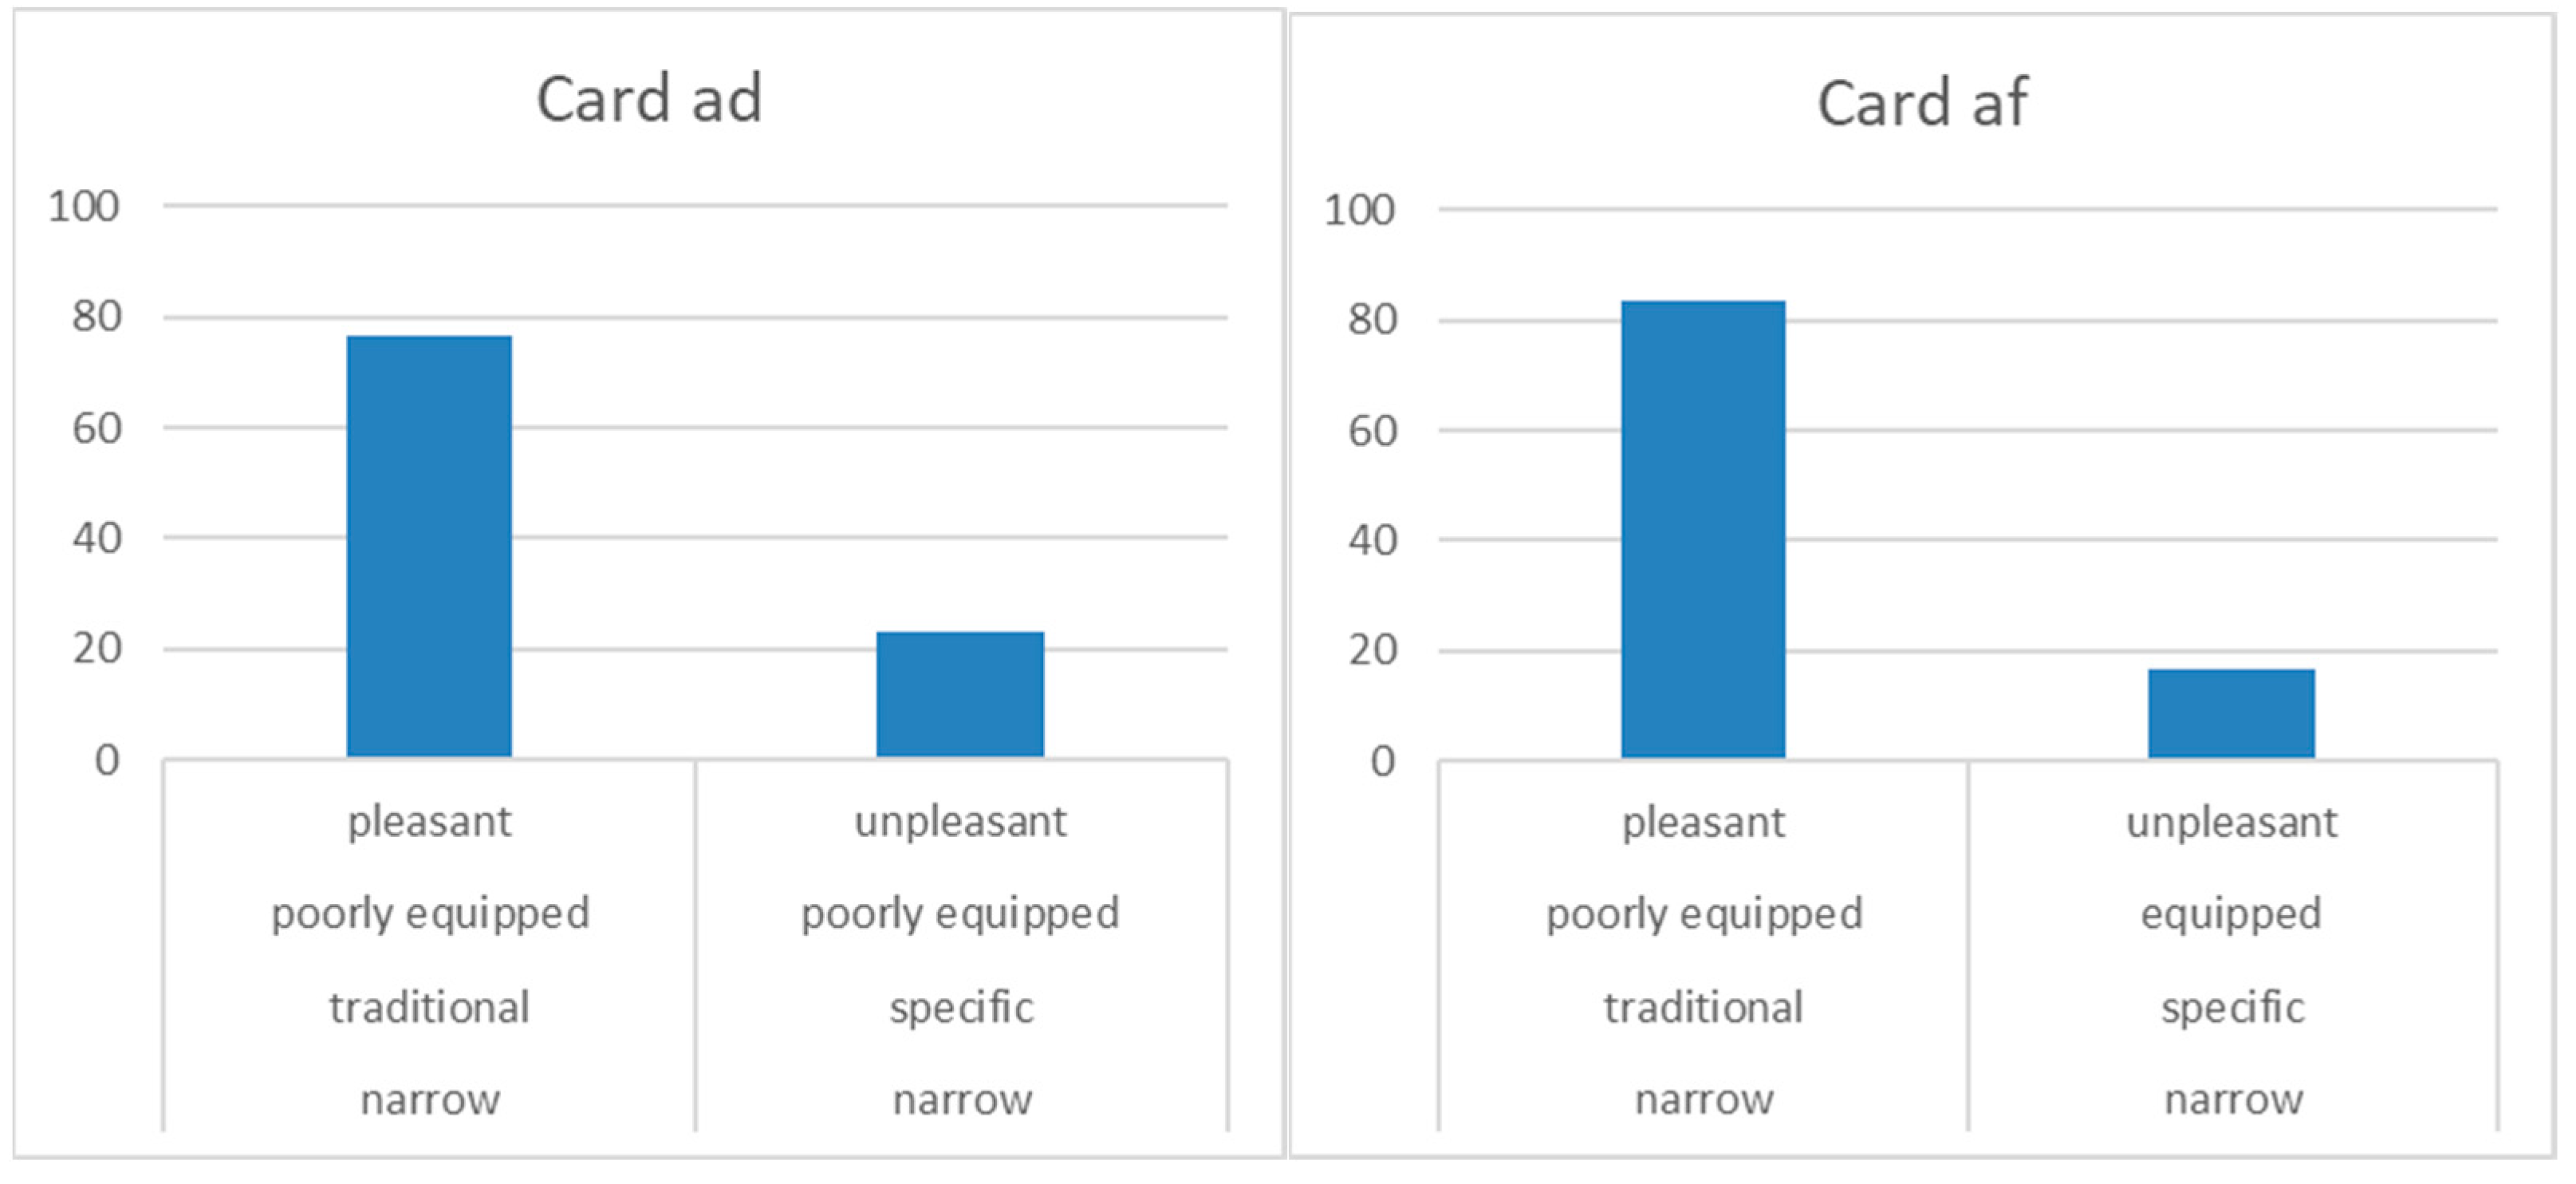
When comparing scenarios that also have other attributes that may vary in addition to the environment, most users continue to choose scenarios where the environment is pleasant. For example, observing the card ad in Figure 3, it can be seen that the scenario with a pleasant environment and traditional pavement is chosen by 77% of pedestrians, while that with an unpleasant environment and specific pavement is chosen by only 23%. In the af card, the scenario with a pleasant environment, traditional flooring and a poorly equipped path is chosen by 83% of the interviewees, while the scenario with specific flooring, an equipped path and an unpleasant environment is chosen only by the remaining 17%.
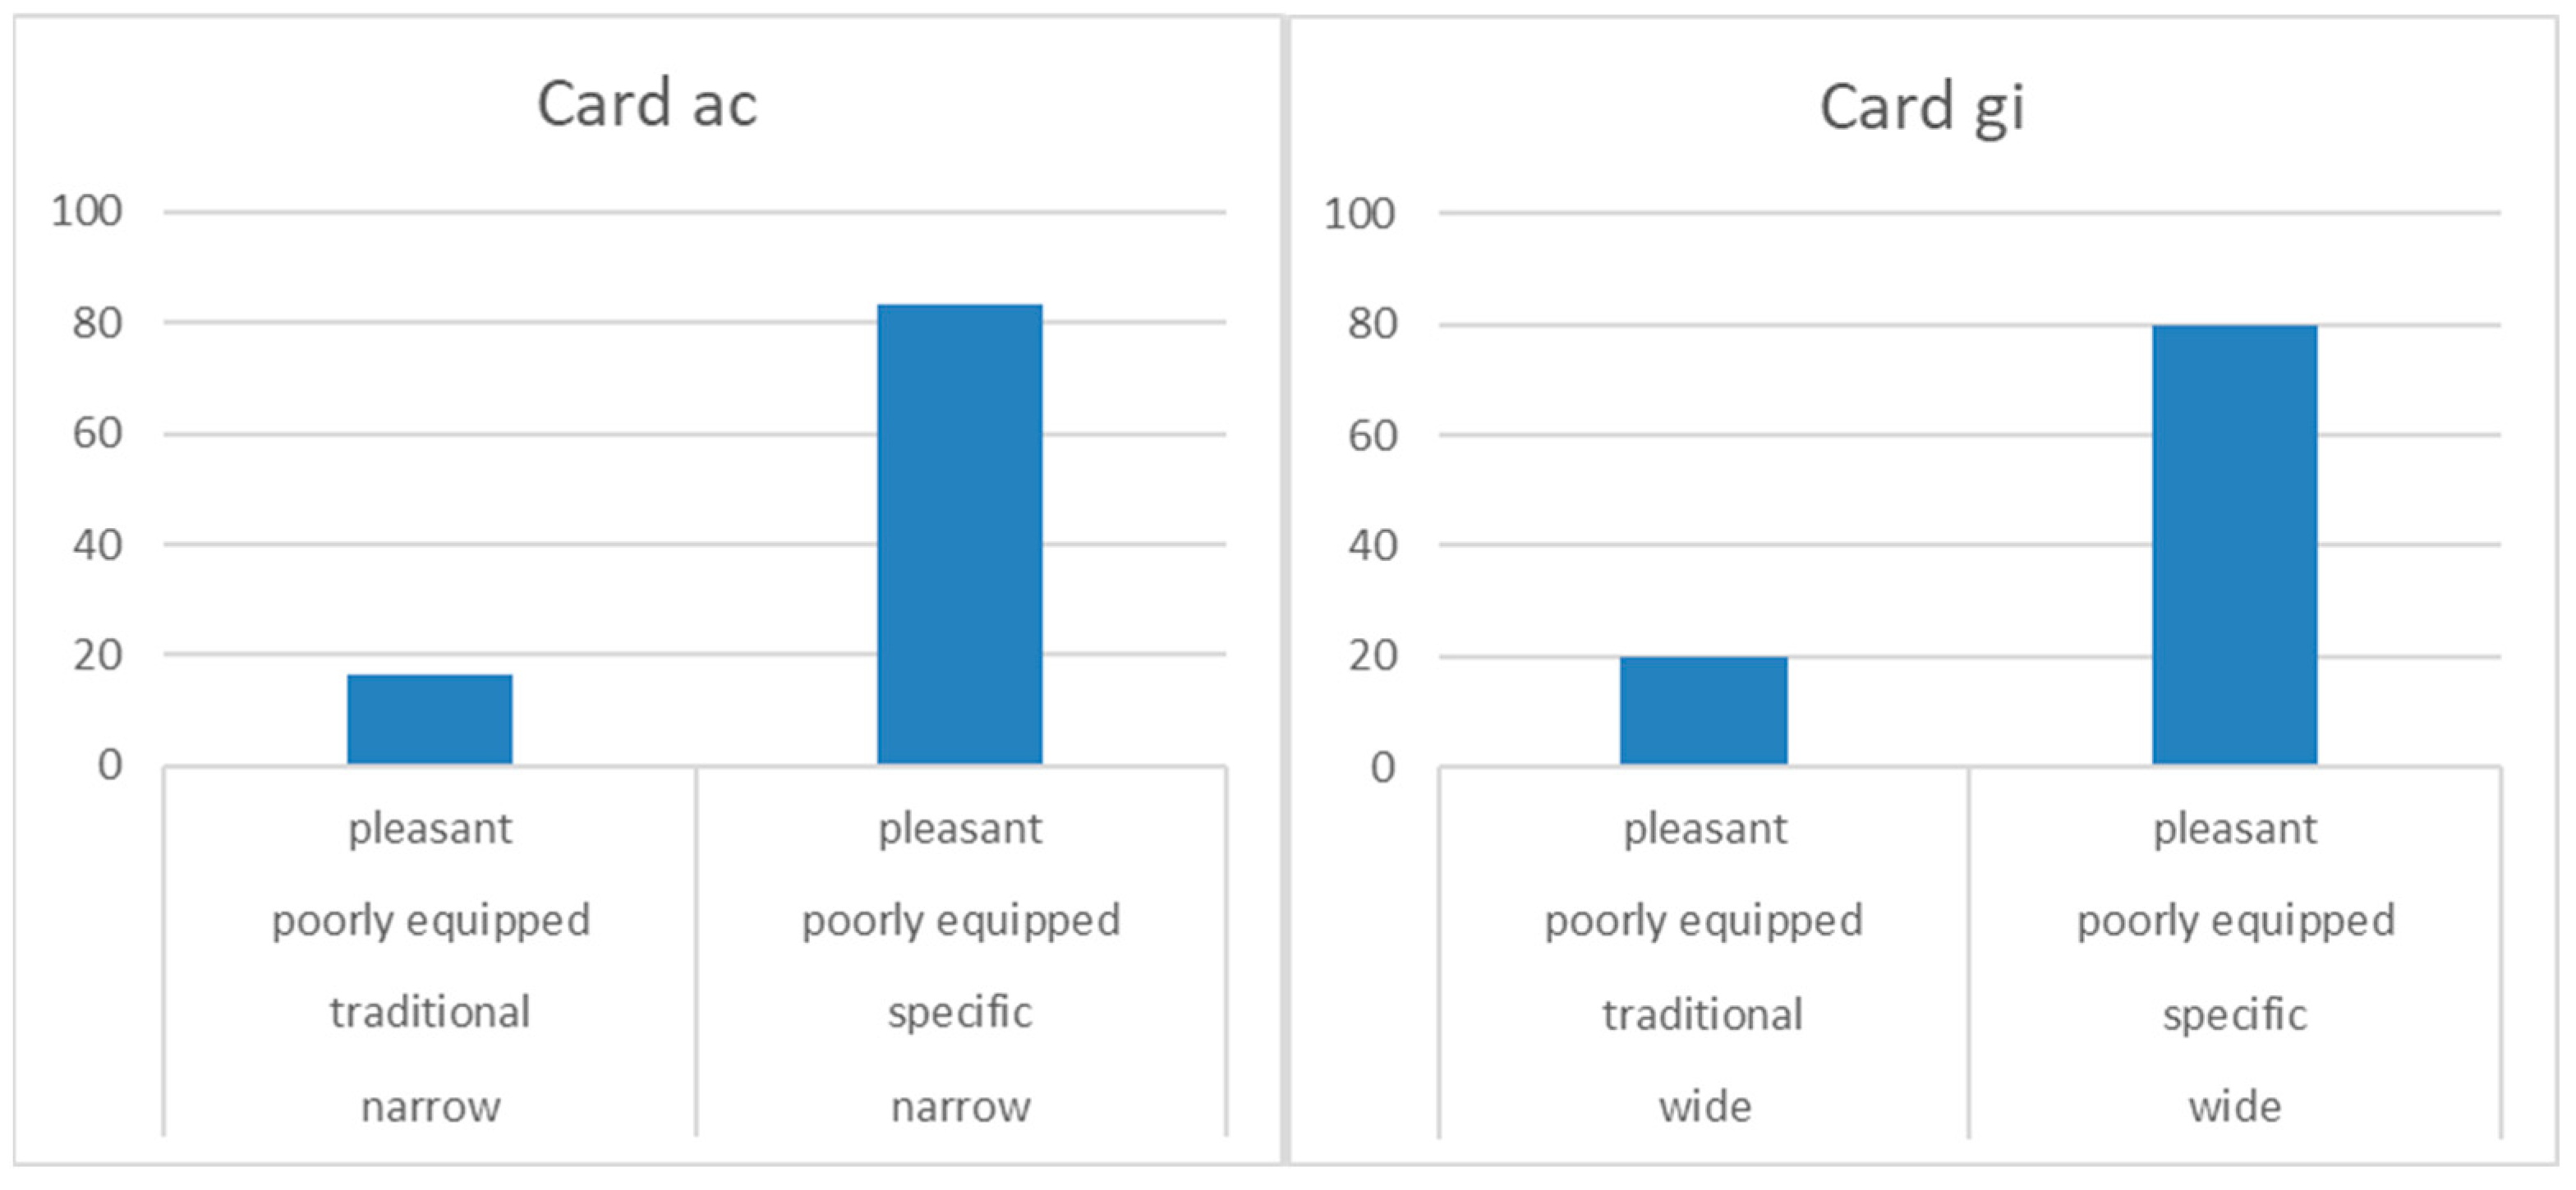
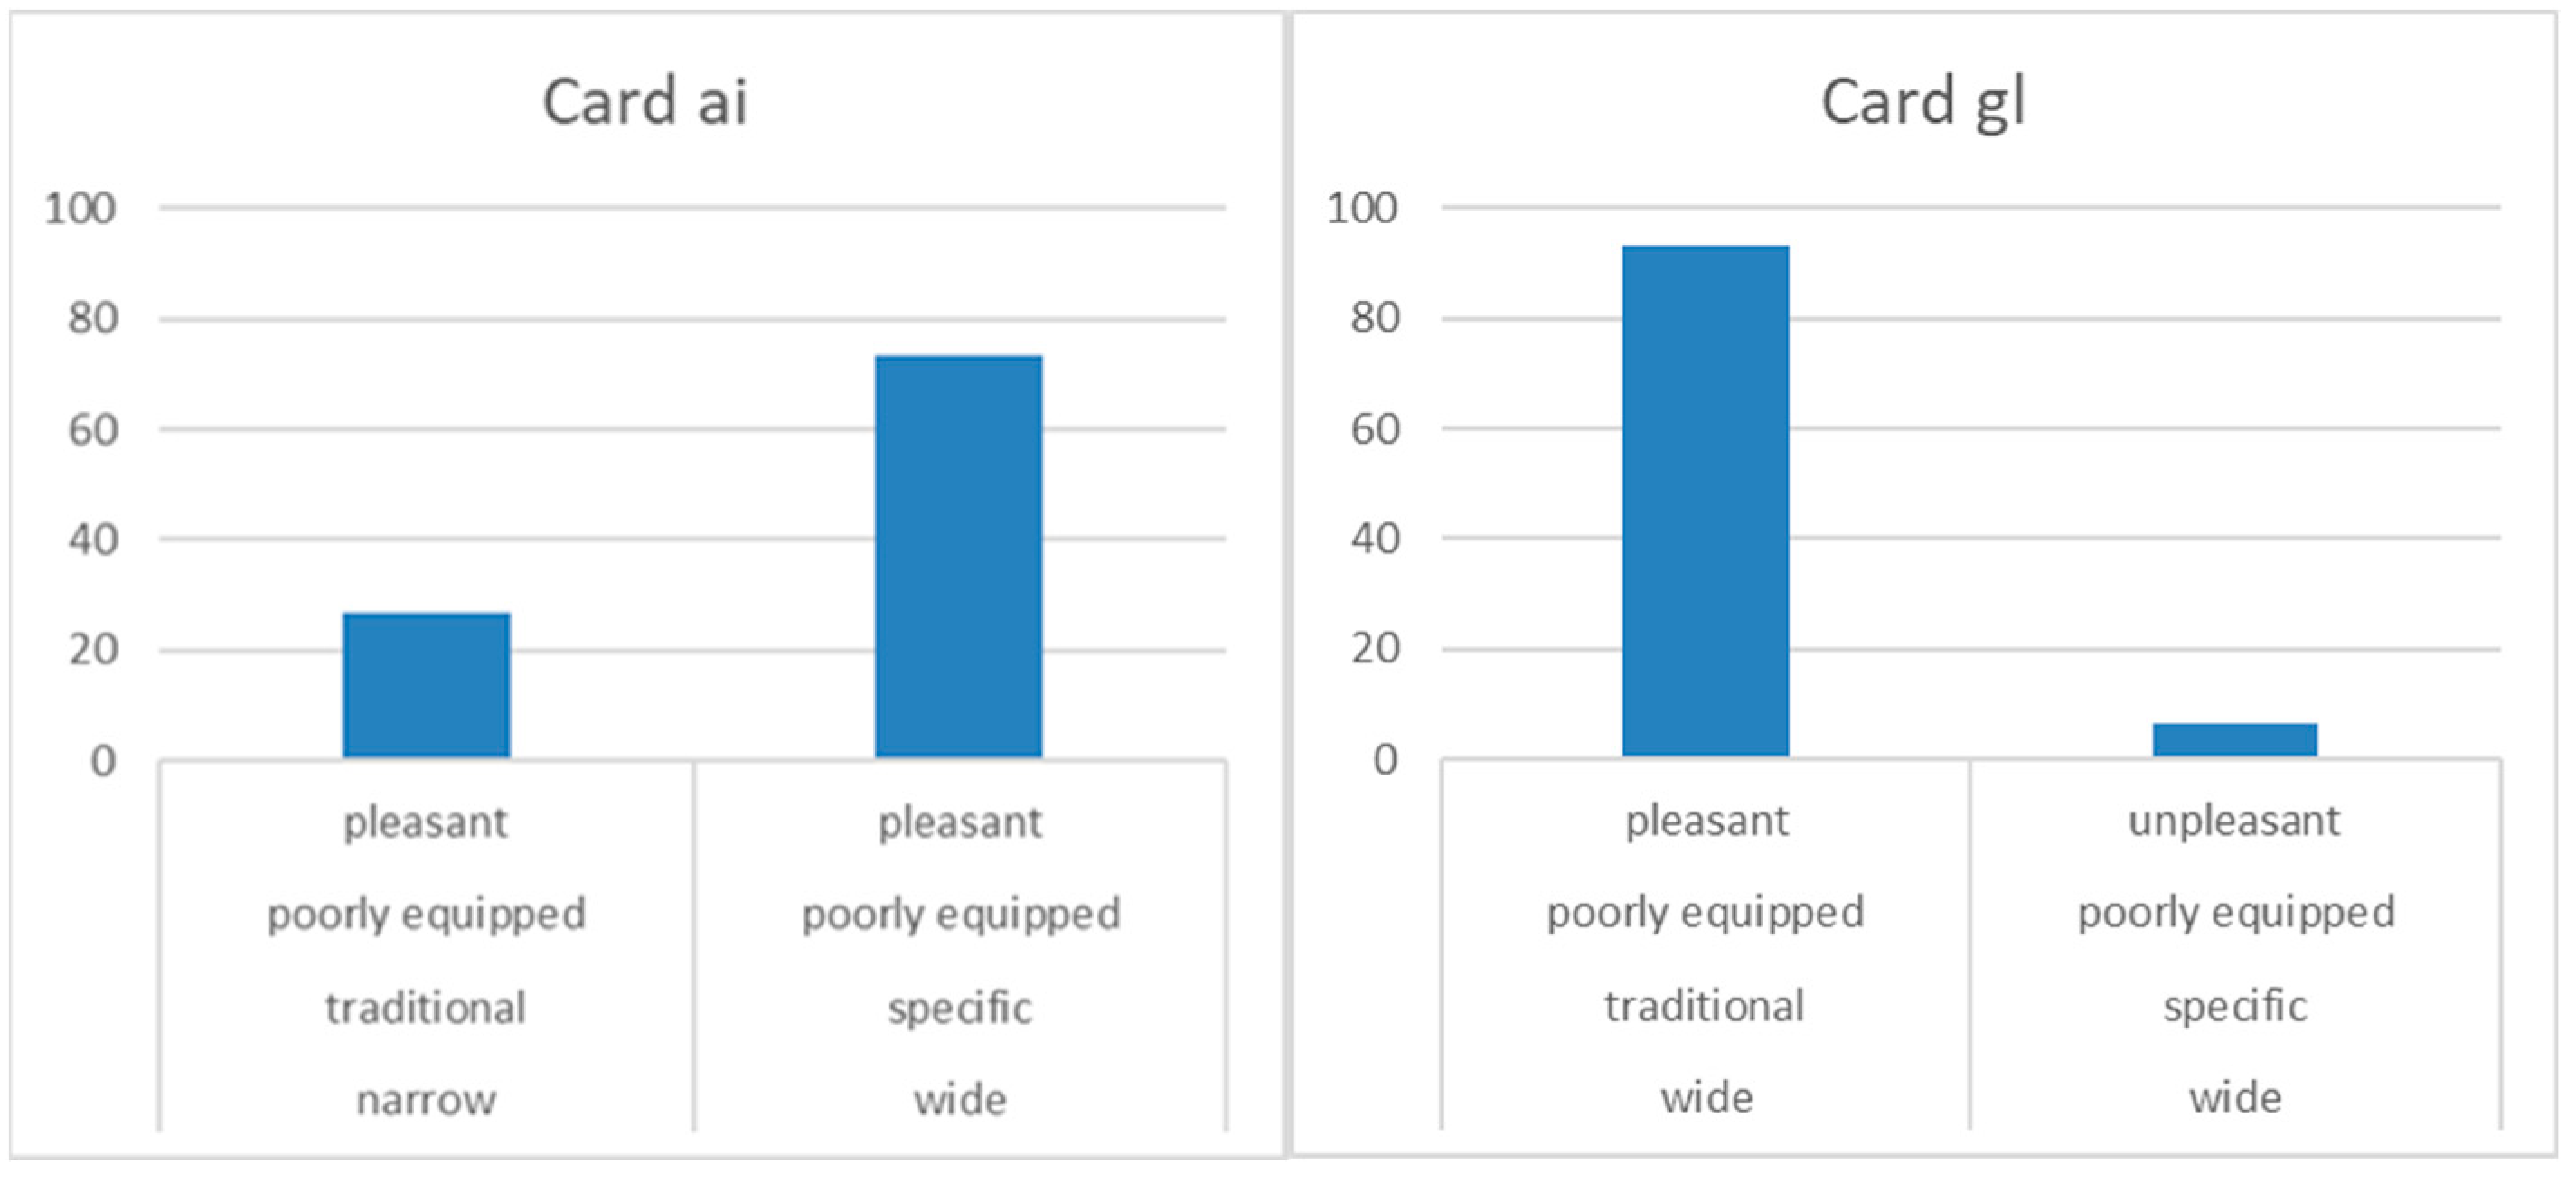
For the cards where two scenarios with the same characteristics are compared, except for the pavement, the one preferred by most of the interviewed pedestrians is the scenario with a specific pavement. For example, in card ac and card gi (Figure 4), the scenario with a specific pavement was chosen by almost 80% of the interviewed pedestrians. The scenario with a specific pavement is the most chosen one even when other attributes, such as equipment and width, are considered. For example, in Figure 5, in card ai the most chosen scenario is that with specific pavement (73%), even if the scenarios are different regarding the width. When the two scenarios differ also in terms of environment as well as pavement, the most chosen scenario is always the one that presents the pleasant ambient alternative, regardless of the pavement. For example, in card gl in Figure 5, the most chosen scenario is the one in which there is a traditional pavement and a pleasant environment (93%).
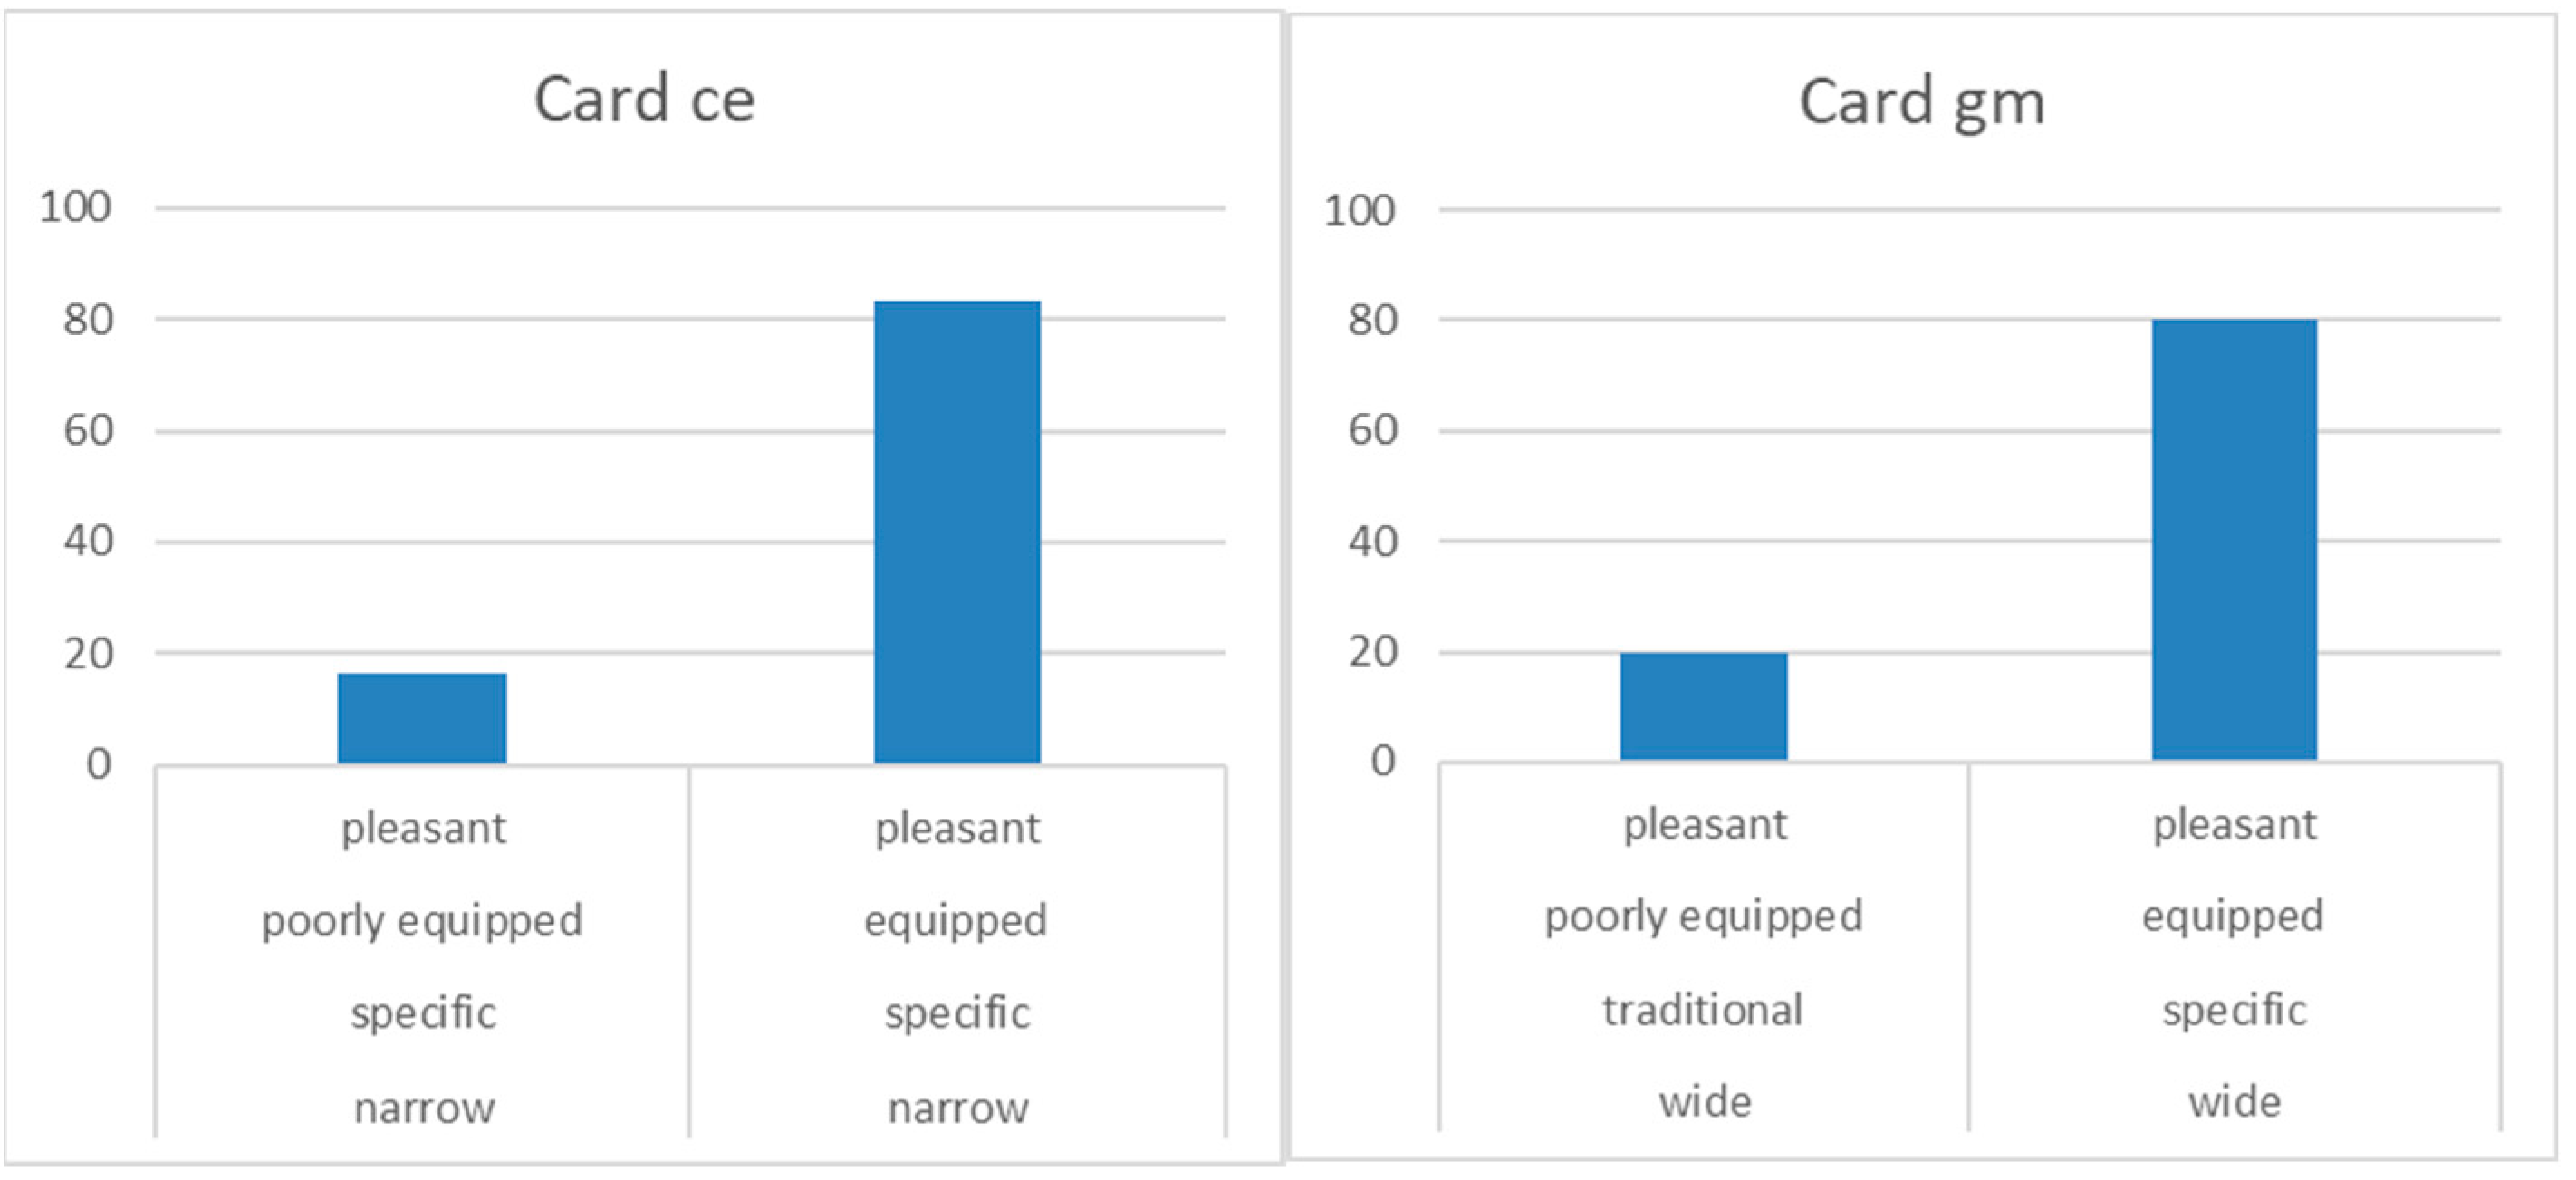
By comparing scenarios with the same characteristics but different equipment (card ce in Figure 6), the equipped path is the one chosen by most of the interviewees (about 83%). The equipped path continues to be the most chosen one (80% of the respondents) when the environment is pleasant and when the pavement is specific, as reported in card gm (Figure 6). As can be seen from the graphs shown in Figure 7, the width of the path does not seem relevant with respect to the equipment attribute.
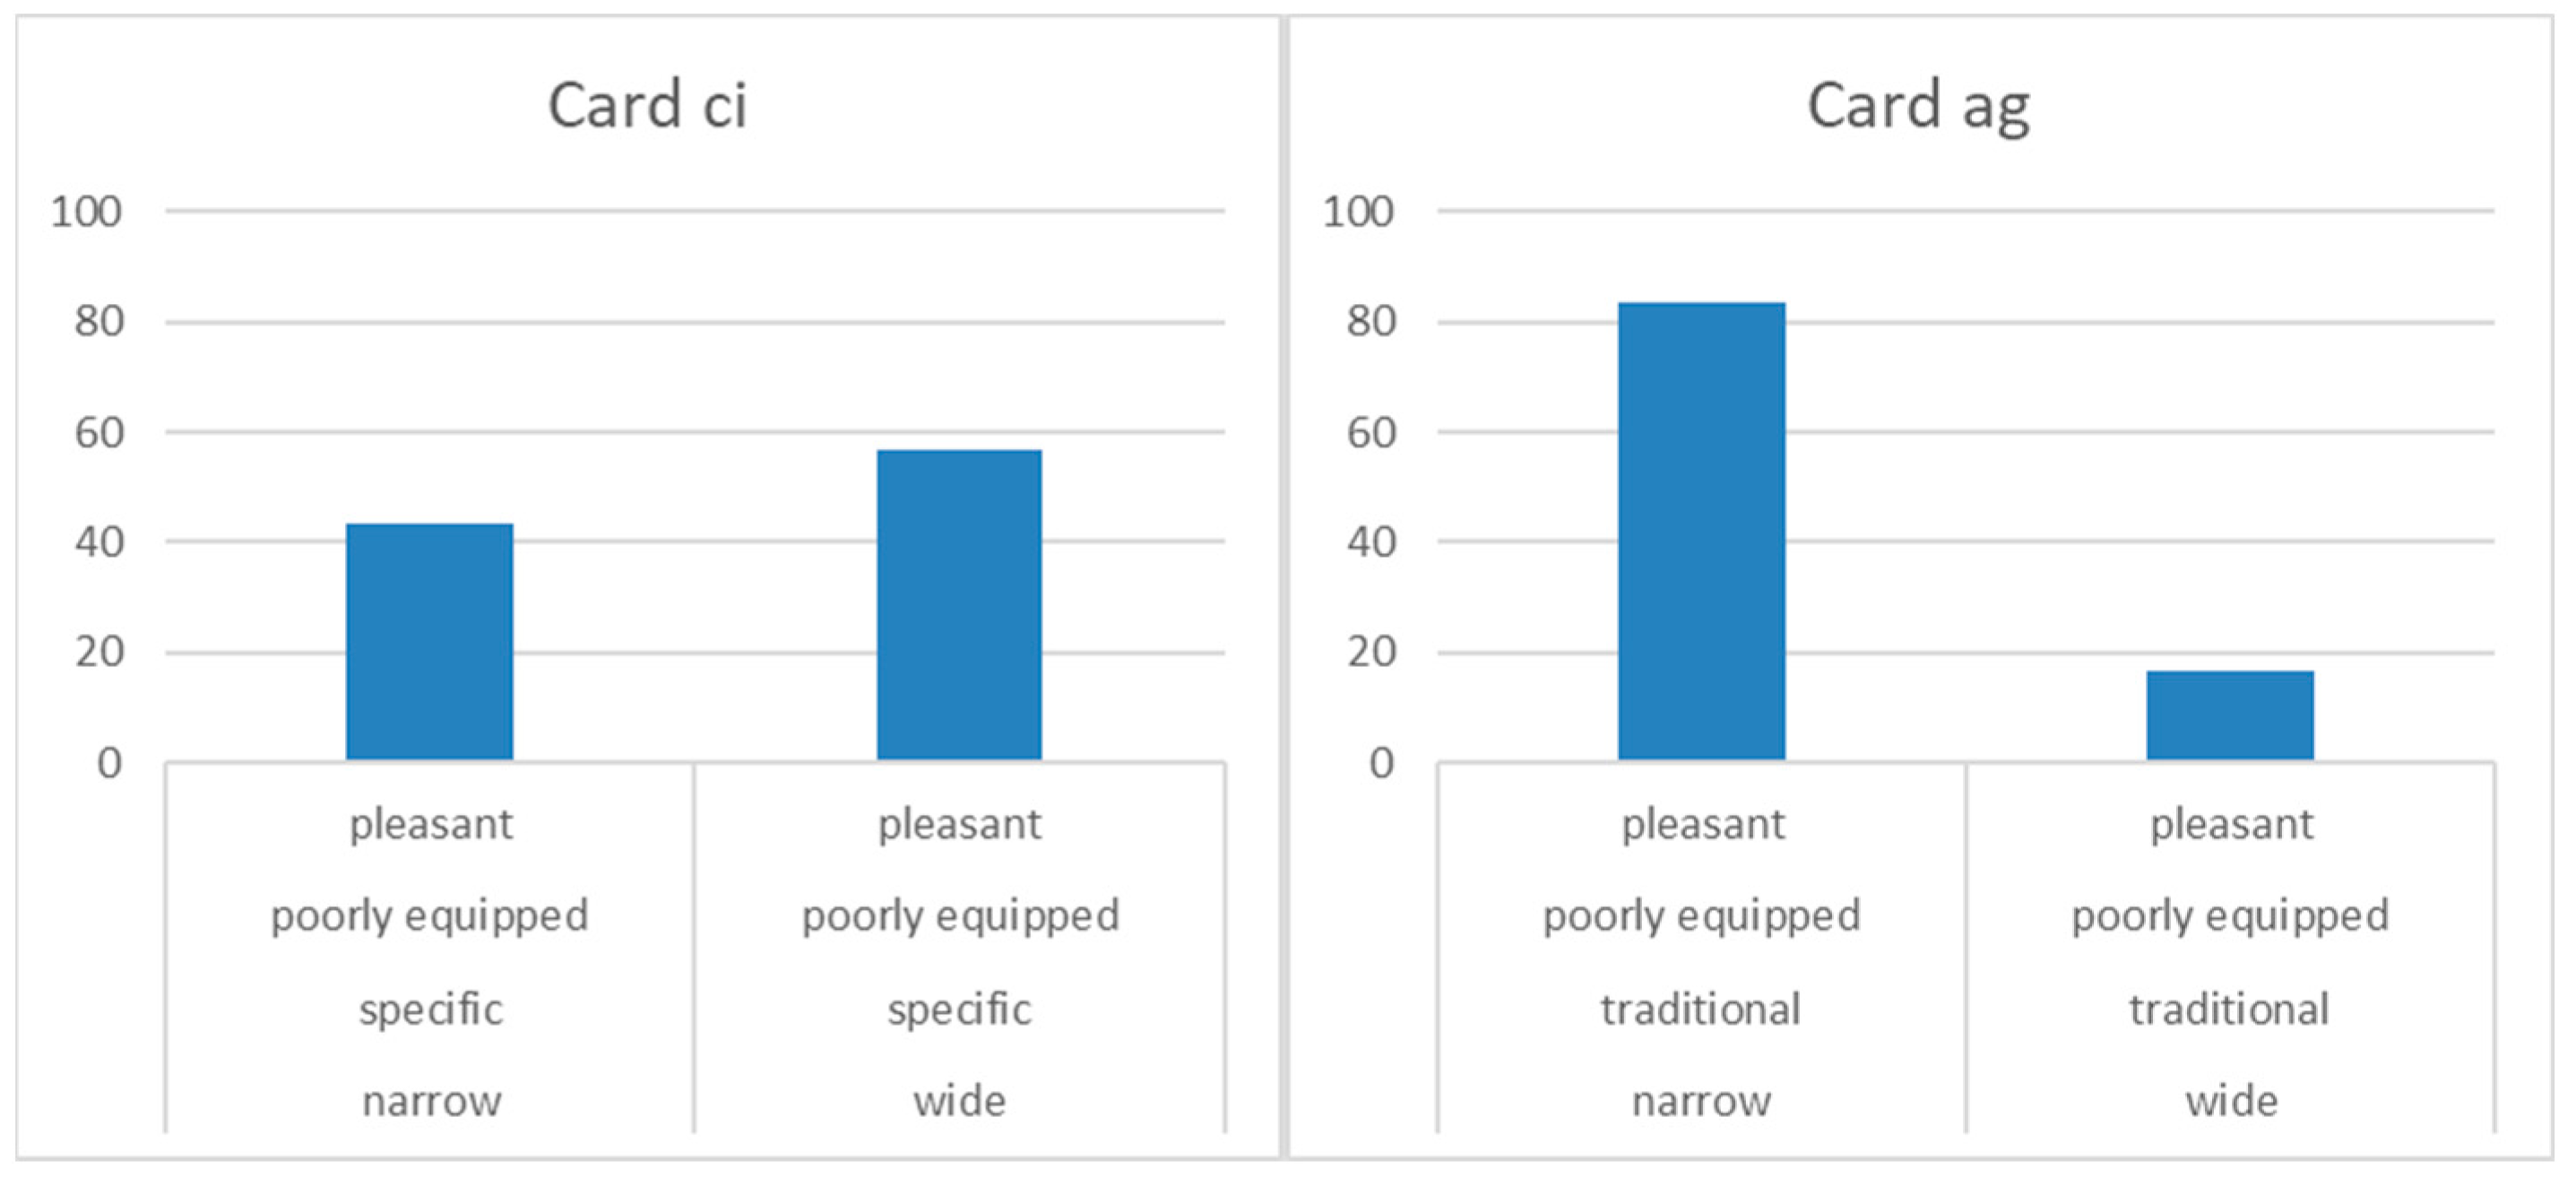
The width attribute is the one with the most variability. From the analysis of the results of the survey, it is clear that for some pairs of scenarios, the most chosen scenario is the one with the wide path (card ci in Figure 8), and for others, the narrow path (card ag in Figure 8).
Looking at the results related to the cards, where other attributes also vary, the width attribute seems to be the least relevant and the choice of scenario seems to be guided by the other variables.
From this preliminary statistical analysis, the environment where the walkway is located seems to be the most important aspect of evaluation for young pedestrians.
The next step of the methodology was the calibration of the Multinomial Logit model (MNL), with the aim of validating the SP survey and quantifying the importance of each attribute. The variables included in the model are:
- “width”, the pedestrian path can be narrow (1) or wide (2);
- “pavement”, which can be traditional (1) or specific for pedestrian paths (2);
- “equipment”, the walkway can be a poorly equipped path (1) or an equipped path (2);
- “environment”, the pedestrian path can be located in an unpleasant environment (1) or a pleasant environment (2).
The choice set consists of 64 alternatives, e.g., the cards obtained as a combination of the 12 scenarios.
The model performs the data well. The initial log-likelihood and the final log-likelihood are, respectively, −1325.1328 and −985.7270. The Akaike Information Criterion (AIC) is 1979.5 and AIC/N is 1.031, where N is the number of observations. Coefficient of determination R-squared is 0.2561, while Adjusted R-squared is 0.2546, acceptable values for an MNL model.
The results of the MNL model are reported in Table 2. In our analysis, the results of the MNL model checked the validity of the SP survey. All the obtained coefficients have the correct sign. The coefficients’ correct signs and their high statistical significance indicate that the interviewees interpreted the variables in the correct way and the SP survey can be considered statically valid as well. Only the variable “width” is not statistically significant; however, it has the correct sign. This means that in this study the width of the path is not an important element in the pedestrians’ evaluation.
The results of the model seem to confirm what was observed in the statistical analysis of the data. “Environment” is the variable with the highest coefficient. This means that, in this study, the environment of the walkway is the most important attribute for young pedestrians. “Pavement” and “equipment” variables are also relevant, but the coefficients are lower. In particular, the coefficient of “pavement” is higher than that of “equipment”. Even this result confirms what was observed when analyzing the data. The variable “width” is not significant. This means that in this study, the width of the path is not an important element in the pedestrians’ evaluation.
4. Discussion
The proposed analysis provides important points for discussion. “Environment” is the variable that most strongly affects the scenario selection in the set of choices. Among the variables included in the model, the environment can be considered as the most important aspect for young pedestrians. This result is also amply confirmed by other studies in the literature [26,27]. In particular, “environment” is one of the most relevant attributes, especially when its definition also includes the concept of security [28].
The results also show that type of pavement has less importance than environment, but it is still relevant in the evaluation of quality. In the literature, the pavement as a structural element is poorly treated. Many studies consider the condition of the pavement in general as variable [5,28,29,30].
The variables that refer to the equipment along the walkway are often present in studies on the quality of pedestrian paths. As reported by [31], the presence of good furniture improves pedestrian comfort.
In the present study, the variable “width” is not statistically significant. This means that having a more or less wide path does not influence the pedestrian’s evaluation. In other studies, instead, width is a significant variable [13,15]. Streets with more lanes and streets where automobiles and bicycles are mixed have higher pedestrian numbers than pedestrian-only streets [32]. In our case, not statistical significance of “width” is due to the other attributes. In fact, during the choice, the interviewee had to take into account all the attributes present in the card. Therefore, by comparing the alternatives of each card, the respondents probably mainly focused their attention to the environment, pavement and equipment.
Regarding the methodology, the results of the MNL model checked the validity of the SP survey, confirming that the SP experiment is suitable for analyzing the pedestrians’ preferences on walkways. Considering hypothetical scenarios, respondents are faced with an unknown situation, so that their answers are not influenced by habit and knowledge of the path. In addition, the choice of including images representative of the different levels of the variables contributed to reducing any errors in understanding the question.
Ultimately, the results give indications regarding territorial and transport policies to be pursued in the future for increasing pedestrian mobility. Environments where the pedestrian path is inserted is the aspect needing more attention. It is clear that pedestrians prefer to walk in a pleasant and clean environment, with well-kept green spaces, decent building facades and the presence of commercial activities. The objective has to avoid the production of an unpleasant environment, characterized by dirt, untreated green spaces, dilapidated building facades and a lack of commercial activities.
5. Conclusions
This paper proposed an SP experiment for investigating pedestrian preferences, with a focus on preferences expressed by young pedestrians. During the interview, the respondents were facilitated in expressing their choices by the adoption of photos representing the characteristics of the alternative pedestrian environments. Four attributes were included in the SP experiment: width of the pedestrian path; pavement of the pedestrian path; equipment present along the pedestrian path; environment where the pedestrian path develops. A Multinomial Logit (MNL) model was calibrated with the specific aim of validating the SP survey and synthetizing the findings emerged from the analysis of the preferences expressed by the users. The analysis of the respondents’ preferences and the findings of the MNL model showed that environment is the most important aspect for young people among the four considered variables. On the other side, the width of the pedestrian path was found to be not significant.
The analysis provided satisfactory results, and it will be possible to continue to increase the proposed methodology. However, it is opportune to highlight that this is a preliminary study focusing on young pedestrians’ perceptions; therefore, the obtained results cannot be generalized to all pedestrians.
Another limit of this study regards the variables considered in the SP experiment and included in the model. Other aspects could be included in the survey. As an example, an attribute relating to the presence of trees along the walkway could be inserted among the physical characteristics of the path. In fact, it was observed that pedestrians like to walk along tree-lined paths because the trees offer protection from the sun’s rays and heat. Another potential important aspect could be the presence of restaurant and bar activities. Other studies, in fact, have shown that the presence of these activities makes the walkway more pleasant for the pedestrian.
Research perspectives expect to explore other age groups’ perceptions in different walkway environments. In addition, more advanced logit models could be adopted for better analyzing the data, as random parameter and/or error component logit models account for the panel effect due to the multiple responses by the same users and the heterogeneity due to the sociodemographic characteristics of the interviewed people.
Author Contributions
Conceptualization, M.G.B., C.F. and G.M.; methodology, M.G.B., C.F. and G.M.; validation, M.G.B., C.F. and G.M.; formal analysis, M.G.B., C.F. and G.M.; investigation, M.G.B., C.F. and G.M.; data curation, M.G.B. and C.F.; writing—original draft preparation, M.G.B., C.F. and G.M.; writing—review and editing, M.G.B., C.F. and G.M.; supervision, G.M. All authors have read and agreed to the published version of the manuscript.
Funding
This research received no external funding.
Data Availability Statement
The data presented in this study are available on request from the corresponding author. The data are not publicly available due to privacy restrictions.
Acknowledgments
Support from “POR Calabria FESR-FSE 2014/2020–Linea B) Azione 10.5.12” is gratefully acknowledged.
Conflicts of Interest
The authors declare no conflict of interest.
References
- Amoroso, S.; Castelluccio, F.; Maritano, L. Indicators for sustainable pedestrian mobility. WIT Trans. Built Environ. 2016, 128, 173–185. [Google Scholar]
- Hall, C.M.; Ram, Y. Walk score® and its potential contribution to the study of active transport and walkability: A critical and systematic review. Transp. Res. Part D 2018, 61, 310–324. [Google Scholar] [CrossRef]
- Kelly, C.E.; Tight, M.R.; Hodgson, F.C.; Page, M.W. A comparison of three methods for assessing the walkability of the pedestrian environment. J. Transp. Geogr. 2011, 19, 1500–1508. [Google Scholar] [CrossRef]
- Gebel, K.; Bauman, A.; Owen, N. Correlates of nonconcordance between perceived and objective measures of walkability. Ann. Behav. Med. 2009, 37, 228–238. [Google Scholar] [CrossRef] [PubMed]
- Moura, F.; Cambra, P.; Gonçalves, A.B. Measuring walkability for distinct pedestrian groups with a participatory assessment method: A case study in Lisbon. Landsc. Urban Plan. 2017, 187, 282–296. [Google Scholar] [CrossRef]
- Forsyth, A. What is a walkable place? The walkability debate in urban design. Urban Des. Int. 2015, 20, 274–292. [Google Scholar] [CrossRef]
- Saelens, B.E.; Handy, S.L. Built environment correlates of walking: A review. Med. Sci. Sports Exerc. 2008, 40, S550–S566. [Google Scholar] [CrossRef] [Green Version]
- Hall, C.M.; Ram, Y. Measuring the relationship between tourism and walkability? Walk Score and English tourist attractions. J. Sustain. Tour. 2018, 27, 223–240. [Google Scholar] [CrossRef]
- Rodriguez-Valencia, A.; Barrero, G.A.; Ortiz-Ramirez, H.A.; Vallejo-Borda, J.A. Power of User Perception on Pedestrian Quality of Service. Transp. Res. Rec. 2020, 2674, 250–258. [Google Scholar] [CrossRef]
- Manual, H.C. Highway Capacity Manual; Highway Research Board Special Report 87; Transportation Research Board: Washington, DC, USA, 1965. [Google Scholar]
- Fruin, J.J. Designing for pedestrians: A level-of-service concept Retrieved from. Highw. Res. Rec. 1971, 355, 1–15. [Google Scholar]
- Asadi-Shekari, Z.; Moeinaddini, M.; ZalyShah, M. A pedestrian level of service method for evaluating and promoting walking facilities on campus streets. Land Use Policy 2014, 38, 175–193. [Google Scholar] [CrossRef]
- Talavera-Garcia, R.; Soria-Lara, J.A. Q-PLOS, developing an alternative walking index. A method based on urban design quality. Cities 2015, 45, 7–17. [Google Scholar] [CrossRef]
- Vallejo-Borda, J.A.; Cantillo, V.; Rodriguez-Valencia, A. A perception-based cognitive map of the pedestrian perceived quality of service on urban sidewalks. Transp. Res. Part F 2020, 73, 107–118. [Google Scholar] [CrossRef]
- Kim, T.; Park, J.; Lim, J.; Joo, Y. A Development of Integrated Evaluation Criteria for Quality of Service on Pedestrian Networks by Using Multi-Criteria Decision Analysis. In Proceedings of the ISARC 2011: The 28th International Symposium on Automation and Robotics in Construction, Seoul, Korea, 29 June 2011–2 July 2011; pp. 603–608. [Google Scholar]
- Adkins, A.; Dill, J.; Luhr, G.; Neal, M. Unpacking walkability: Testing the influence of urban design features on perceptions of walking environment attractiveness. J. Urban Des. 2012, 17, 499–510. [Google Scholar] [CrossRef]
- Kaparias, I.; Bell, M.G.H.; Miri, A.; Chan, C.; Mount, B. Analysing the perceptions of pedestrians and drivers to shared space. Transp. Res. Part F Traffic Psychol. Behav. 2012, 15, 297–310. [Google Scholar] [CrossRef]
- Lusk, A.C.; Da Silva Filho, D.F.; Dobbert, L. Pedestrian and cyclist preferences for tree locations by sidewalks and cycle tracks and associated benefits: Worldwide implications from a study in Boston, MA. Cities 2018, 106, 102111. [Google Scholar] [CrossRef]
- Kasraian, D.; Adhikari, S.; Kossowsky, D.; Luubert, M.; Hall, B.G.; Hawkins, J.; Habib, K.N.; Roorda, M.J. Evaluating pedestrian perceptions of street design with a 3D stated preference survey. Environ. Plan. B Urban Anal. City Sci. 2020, 48, 1–19. [Google Scholar] [CrossRef]
- Hensher, D.A.; Rose, J.M.; Greene, W.H. Applied Choice Analysis: A Primer; Cambridge University Press: Cambridge, UK, 2007. [Google Scholar]
- Bellizzi, M.G.; Eboli, L.; Forciniti, C. Segregation vs interaction in the walkways: An analysis of pedestrians’ perceptions. Res. Transp. Bus. Manag. 2019, 33, 100410. [Google Scholar] [CrossRef]
- Louviere, J.J.; Hensher, D.A.; Swait, J.D. Stated Choice Methods: Analysis and Application; Cambridge University Press: Cambridge, UK, 2004. [Google Scholar]
- Cherchi, E.; Hensher, D.A. Workshop synthesis: Stated preference surveys and experimental design, an audit of the journey so far and future research perspectives. Transp. Res. Procedia 2015, 11, 154–164. [Google Scholar] [CrossRef] [Green Version]
- Sottile, E.; Cherchi, E.; Meloni, I. Measuring soft measures within a stated preference survey: The effect of pollution and traffic stress on mode choice. Transp. Res. Procedia 2015, 11, 434–451. [Google Scholar] [CrossRef] [Green Version]
- Greene, W.H. Nlogit Reference Guide: Version 6.0.; Econometric Software Inc.: Plainview, NY, USA, 2016. [Google Scholar]
- Vallejo-Borda, J.A.; Ortiz-Ramirez, H.A.; Rodriguez-Valencia, A.; Hurtubia, R.; Ortúzar, J.D.D. Forecasting the quality of service of Bogota’s sidewalks from pedestrian perceptions: An Ordered Probit MIMIC approach. Transp. Res. Rec. J. Transp. Res. Board 2020, 2674, 205–216. [Google Scholar] [CrossRef]
- Motamed, B.; Bitaraf, A. An Empirical Assessment of the Walking Environment in a Megacity: Case Study of Valiasr street, Tehran. Int. J. Archit. Res. 2016, 10, 76–99. [Google Scholar] [CrossRef] [Green Version]
- Bivina, G.R.; Parida, M. Modelling perceived pedestrian level of service of sidewalks: A structural equation approach. Transport 2019, 34, 339–350. [Google Scholar] [CrossRef] [Green Version]
- Asadi-Shekari, Z.; Moeinaddini, M.; Zaly Shah, M. Non-motorised Level of Service: Addressing Challenges in Pedestrian and Bicycle Level of Service. Transp. Rev. 2013, 33, 166–194. [Google Scholar] [CrossRef]
- Banerjee, A.; Maurya, A.K.; Lämmel, G. Pedestrian flow characteristics and level of service on dissimilar facilities: A critical review. Collect. Dyn. 2018, 3, A17. [Google Scholar] [CrossRef]
- Sarkar, S. Qualitative Evaluation of Comfort Needs in Urban Walkways in Major Activity Centers. Transp. Q. 2003, 7, 39–59. [Google Scholar]
- Sung, H.; Go, D.; Choi, C.; Cheon, S.; Park, S. Effects of street-level physical environment and zoning on walking activity in Seoul. Land Use Policy 2015, 49, 152–160. [Google Scholar] [CrossRef]
Figure 1.
Example of card where scenario d and scenario g are combined.

Figure 2.
SP results: difference between a pleasant and unpleasant environment.

Figure 3.
SP results: difference between pleasant and unpleasant environment in relation to other attributes.
Figure 3.
SP results: difference between pleasant and unpleasant environment in relation to other attributes.

Figure 4.
SP results: difference between traditional and specific pavement.

Figure 5.
SP results: difference between traditional and specific pavement in relation to other attributes.
Figure 5.
SP results: difference between traditional and specific pavement in relation to other attributes.

Figure 6.
SP results: difference between poorly equipped and equipped path.

Figure 7.
SP results: difference between poorly equipped and equipped paths in relation to other attributes.
Figure 7.
SP results: difference between poorly equipped and equipped paths in relation to other attributes.

Figure 8.
SP results: difference between narrow and wide path.


Table 1.
Fractional Factorial Plan.
| Scenario | Width | Pavement | Equipment | Environment |
|---|---|---|---|---|
| a | narrow | traditional | poorly equipped | pleasant |
| b | narrow | traditional | poorly equipped | unpleasant |
| c | narrow | specific | poorly equipped | pleasant |
| d | narrow | specific | poorly equipped | unpleasant |
| e | narrow | specific | equipped | pleasant |
| f | narrow | specific | equipped | unpleasant |
| g | wide | traditional | poorly equipped | pleasant |
| h | wide | traditional | poorly equipped | unpleasant |
| i | wide | specific | poorly equipped | pleasant |
| l | wide | specific | poorly equipped | unpleasant |
| m | wide | specific | equipped | pleasant |
| n | wide | specific | equipped | unpleasant |
Table 2.
MNL output.
| Variable | Standard Coefficient | Error | z | Prob. |z| < Z * | Confidence Interval | ||
|---|---|---|---|---|---|---|---|
| Width | 0.02365 | 0.07200 | 0.33 | 0.7425 | −0.11747 | 0.16477 | |
| Pavement | 0.60991 | *** | 0.09706 | 6.28 | 0.000 | 0.41967 | 0.80015 |
| Equipment | 0.49662 | *** | 0.09064 | 5.48 | 0.000 | 0.31897 | 0.67428 |
| Environment | 1.93261 | *** | 0.09334 | 20.71 | 0.000 | 1.74968 | 2.11554 |
*** ==> Significance at 1% level.
Publisher’s Note: MDPI stays neutral with regard to jurisdictional claims in published maps and institutional affiliations. |
© 2021 by the authors. Licensee MDPI, Basel, Switzerland. This article is an open access article distributed under the terms and conditions of the Creative Commons Attribution (CC BY) license (https://creativecommons.org/licenses/by/4.0/).
Share and Cite
MDPI and ACS Style
Bellizzi, M.G.; Forciniti, C.; Mazzulla, G. A Stated Preference Survey for Evaluating Young Pedestrians’ Preferences on Walkways. Sustainability 2021, 13, 12434. https://0-doi-org.brum.beds.ac.uk/10.3390/su132212434
AMA Style
Bellizzi MG, Forciniti C, Mazzulla G. A Stated Preference Survey for Evaluating Young Pedestrians’ Preferences on Walkways. Sustainability. 2021; 13(22):12434. https://0-doi-org.brum.beds.ac.uk/10.3390/su132212434
Chicago/Turabian StyleBellizzi, Maria Grazia, Carmen Forciniti, and Gabriella Mazzulla. 2021. "A Stated Preference Survey for Evaluating Young Pedestrians’ Preferences on Walkways" Sustainability 13, no. 22: 12434. https://0-doi-org.brum.beds.ac.uk/10.3390/su132212434
Note that from the first issue of 2016, this journal uses article numbers instead of page numbers. See further details here.