
Evaluating Walkability through a Multi-Criteria Decision Analysis Approach: A Lisbon Case Study

1
INESC Coimbra (INESCC), DEEC, Universidade de Coimbra, 3030-290 Coimbra, Portugal
2
NOVA Information Management School (NOVA IMS), Universidade Nova de Lisboa, 1070-312 Lisboa, Portugal
*
Author to whom correspondence should be addressed.
Sustainability 2021, 13(3), 1450; https://0-doi-org.brum.beds.ac.uk/10.3390/su13031450
Submission received: 10 January 2021
/
Revised: 18 January 2021
/
Accepted: 26 January 2021
/
Published: 30 January 2021
(This article belongs to the Special Issue Tendencies and Strategies of Active Mobility to Promote Urban Sustainable Transportation Systems)
Abstract
:New strategies to improve the quality of urban pedestrian environments are becoming increasingly important in sustainable city planning. This trend has been driven by the advantages that active mobility provides in terms of health, social, and environmental aspects. Our work explores the idea of walkability. This concept refers to the friendliness of the urban environment to pedestrian traffic. We propose a framework based on the multi-criteria decision analysis (MCDA) methodology to rank streets in terms of walkability levels. The city of Lisbon (Portugal) is the location of the streets under examination. Findings confirmed the framework’s replicability and suggested the possibility of this strategy being used as a support tool for designing urban policies.
1. Introduction
Access to urban places and resources by walking is one of the most important features that must be considered when decision-makers (DM) undertake sustainable planning [1,2]. This attribute is closely linked to improving communities’ quality of life, such as health, social, and environmental benefits [3,4,5]. Besides the well-known advantages of a healthy lifestyle, cities that promote policies to enhance citizens’ physical activities—in which walking plays an important role—can enjoy considerable savings in public health and transportation costs [6]. Some studies also highlight the link between walking and positive impacts on the economy, lower crime, and rising home values [7,8,9,10]. Moreover, with the COVID-19 outbreak, mobility choices have been profoundly affected and disturbed [11]. Long-distance travel, notably on an international scale, has been banned or restricted to restrict the spread of the virus. On a short-distance scale, mobility has also been controlled in order to contain coronavirus infections in urban areas. Thus, individual mobility becomes the key element in avoiding the spread of the disease at a local level. As a result, more active and non-motorized means of transportation have been chosen by many city dwellers as the principal method to move about [12,13].
The notion of walkability has recently gained attention in city-planning research. The concept, which refers to how friendly an environment is to pedestrian mobility [14,15], has been used in several studies to describe the quality of walking conditions, including safety, comfort, and convenience [16,17]. The seminal paper of [18] affirms that “in order to understand walkability, it is important to consider how pedestrians are defined and the discourses that shape the development of pedestrian space.” To do so, it is important to determine what the factors are that can influence the choice of walking. In a more tangible sense, the structure, organization, and investments of a city in more walkable paths can be crucial to encourage citizens to move about on foot. However, there are also subjective elements, including social and demographic factors, that can affect the choice of walking [19]. Both the infrastructure and social context are important factors regarding walkability. Herein we focus on the first of these. Many indices have been conceived (e.g., Walk Score®, WalkabiliTO, Pedshed, Movability index, etc.) to measure the qualities of the urban street environment [20,21]. These indices typically differ in terms of method, data, unit of analysis, main goal, and variables considered [22]. Thus, the decision-aid process involving walkability analysis begins with choosing the most appropriate option considering these several criteria.
The current work proposes a multi-criteria decision analysis (MCDA) methodology for studying walkability. MCDA copes with complex problems distinguished by multiple, conflicting, and incommensurate objectives [23]. The different MCDA methods can be applied in different natures of queries, such as economic, environmental, quality of service, social, and others [24]. The decision-aid process must be structured into potential actions (alternatives) and criteria to do so [25]. In this paper, the outranking PROMETHEE (Preference Ranking Organization METHod for Enrichment of Evaluations) method was selected as the evaluation tool (Appendix A describes the mathematical formulation employed by this method in detail) [26,27,28]. The selection was based on the following considerations:
- Qualitative scales: The PROMETHEE method’s ability to evaluate alternatives in qualitative scales can be advantageous when analyzing walkability criteria, as they can present more subjective measures.
Starting from these considerations, the goals of this paper are twofold. First, we sought to improve the methodological background of walkability assessment using an MCDA methodology. Second, we sought to develop a case study in Lisbon (Portugal), collect reliable data, choose among alternatives, and propose improvements in the study area. This work’s main contribution is to provide a solid MCDA framework that can be replicated and used as a support tool for the design of urban public policies worldwide.
The paper is organized as follows: Section 2 presents the literature review; Section 3 presents the methodological approach developed in this project, describing the selected criteria, alternatives, and data collected; Section 4 introduces the PROMETHEE ranking results; Section 5 discuss the outcomes of the research, presenting suggestions for improvements to the streets analyzed seeking to enhance their walkability; and Section 6 concludes and provides thoughts on directions for future work.
2. Literature Review
Walkability is a complex field that recently has been receiving greater attention from the scholarly community [31,32,33]. Even for experts, however, defining the appropriate evaluation indicators is a challenging task [34]. Some works that address the application of an index and selection of indicators to measure and score walkability are presented below. Thereafter, the second part of the bibliography review is devoted to finding MCDA methods applied to walkability measurement and ranking.
2.1. Walkability Indicators
We first sought to find works presenting techniques and indicators to understand the most common methods for evaluating walkability levels in urban environments. The study of [35] presents an analysis of walking indicators related to the road network structure, differentiated by measures of quality, connectivity, and proximity of the road network. The four main objectives therein are: (i) to understand which measures are most suitable to score walkability; (ii) to determine the optimal combination of measures to describe walkability; (iii) to define walkability measures’ benchmark values; (iv) and to acquire guidelines to define a pedestrian-oriented road network. The case study was performed in the cities of Rome, Luca, and Venice (Italy). The outcomes demonstrated that the number of nodes and the size of the blocks are explanatory variables in realizing pedestrian-oriented development, and the crossing of large roads cannot be ignored in the analysis. Moreover, the combination of various measures could be more effective to score walkability (e.g., the number of nodes and the size of the blocks), and that 800 m is the maximum walking distance for a pedestrian-friendly street in the cities studied.
The study of [36] analyzed walkability from the standpoint of a tourist perspective. The authors investigated the relationships between walkability and successful tourist attractions in London (UK). Visitor numbers and TripAdvisor reviews were used as measurement parameters to select the 330 top visitor attractions in the city. The Walk Score® index was used to score the walkability of the locations selected. The analysis identified no significant relationship between London’s attractions and high walkability scores. The authors concluded that a tourism-specific assessment of walkability and transport choice are required to encourage visitors to use active transport to destinations.
In [37], the authors highlight the importance of walkability to enhance quality of life among the elderly. The authors sought to determine the aspects and features that the elderly consider to be most important to encourage and improve urban walkability. The study was based on a survey developed in the area of Catania (Italy), in which 645 persons over the age of 70 participated. A multiple correspondence analysis (MCA) was developed to analyze the data. The results indicated that elderly pedestrians gave greater importance to walkability along the road, focusing on levels of comfort and safety when crossing the road. Moreover, traveling by automobile was found to have little influence on their priorities for neighborhood walkability.
In [38], the authors measured the reliability of different walkability indices using three different methods: Pearson’s R, a Brand–Altman plot with limit of agreement (LOA), and intraclass correlation coefficient (ICC). A case study in the city of Seoul (Korea) was carried out to validate the results. The outcomes indicated a relatively high level of measurement reliability among the indices analyzed.
2.2. MCDA Applied to Walkability
MCDA approaches have been extensively applied to measure and classify routes, paths, and streets in terms of walkability levels [39]. The study of [40] presents a conceptual framework for the walkability evaluation of pedestrian accessibility into rail transit services. The methodology is based on spatial-MCDA. The main goals of [40]’s research were: (i) to create an indoor walking environment spatial model to apply in walkability measurement; (ii) to use an analytical network process (ANP) to evaluate the priorities for each of the walkability criteria; and (iii) to measure pedestrian walkability by using a geographic information system (GIS). The study’s main outcome was the development of a walkability index for pedestrian routes using an ANP approach.
Ref. [41] presents a study that compared different MCDA methods to assess walkability. The paper’s main objective was to determine a weighted walkability index, constructed based on the relative importance of the methods’ attributes. The weights were determined by implementing a robust multi-criteria method known as a fuzzy analytic hierarchy process (FAHP). To obtain sounder results, the FAHP method was compared with other simpler methods, and a chi-square test for homogeneity was computed to compare the values obtained. A case study in the city of Porto Alegre (Brazil) was developed to assess the effect of changes on attributes in walkability. The research outcomes indicated that the three most important walkability attributes are: public security, traffic safety, and pavement quality.
The study of [42] presents a subjective value theory approach to map walkability. The researchers proposed an MCDA method to design walkability decision maps for different groups of pedestrians. The maps reflected the different capabilities of the citizens to walk in the urban environment. A case study in Alghero (Italy) was performed. First, the authors employed a normative model named capability wise walkability score (CAWS) to analyze walkability; then, a survey of 358 participants was performed in order to evaluate the influence of their choices to walk; and finally, by joining GIS and MCDA, a set of decision maps representative of the walkability of the 11 groups of citizens was developed. This paper’s results indicated the importance of citizens’ values for policy design, providing new suggestions for the formulation of walkability-oriented urban policies. Furthermore, the results confirmed the usability of the general method as a decision-support tool in the design of urban policies.
In [43], a participatory assessment method was developed to measure walkability for distinct groups. The framework considered trip purposes (e.g., utilitarian, leisure) and diverse pedestrian groups (adults, children, seniors, and impaired mobility pedestrians). A seven-key-dimensions method (7Cs layout) was developed and implemented to express the walkability, and a case study in Lisbon (Portugal) was carried out. The outcomes indicated clear differences in walkability scores for different pedestrian groups, namely between adults and seniors or impaired pedestrians. Home-based surveys were conducted within the study area to validate the results.
In [44], the authors conducted a study seeking to identify a set of criteria for properly evaluating the walkability level in a neighborhood in Jeddah (Saudi Arabia). The authors gathered the data through a survey questionnaire and derived the criteria through the FAHP method. Their findings revealed the ability of the method to measure a neighborhood’s walkability.
3. Methodology and Methods
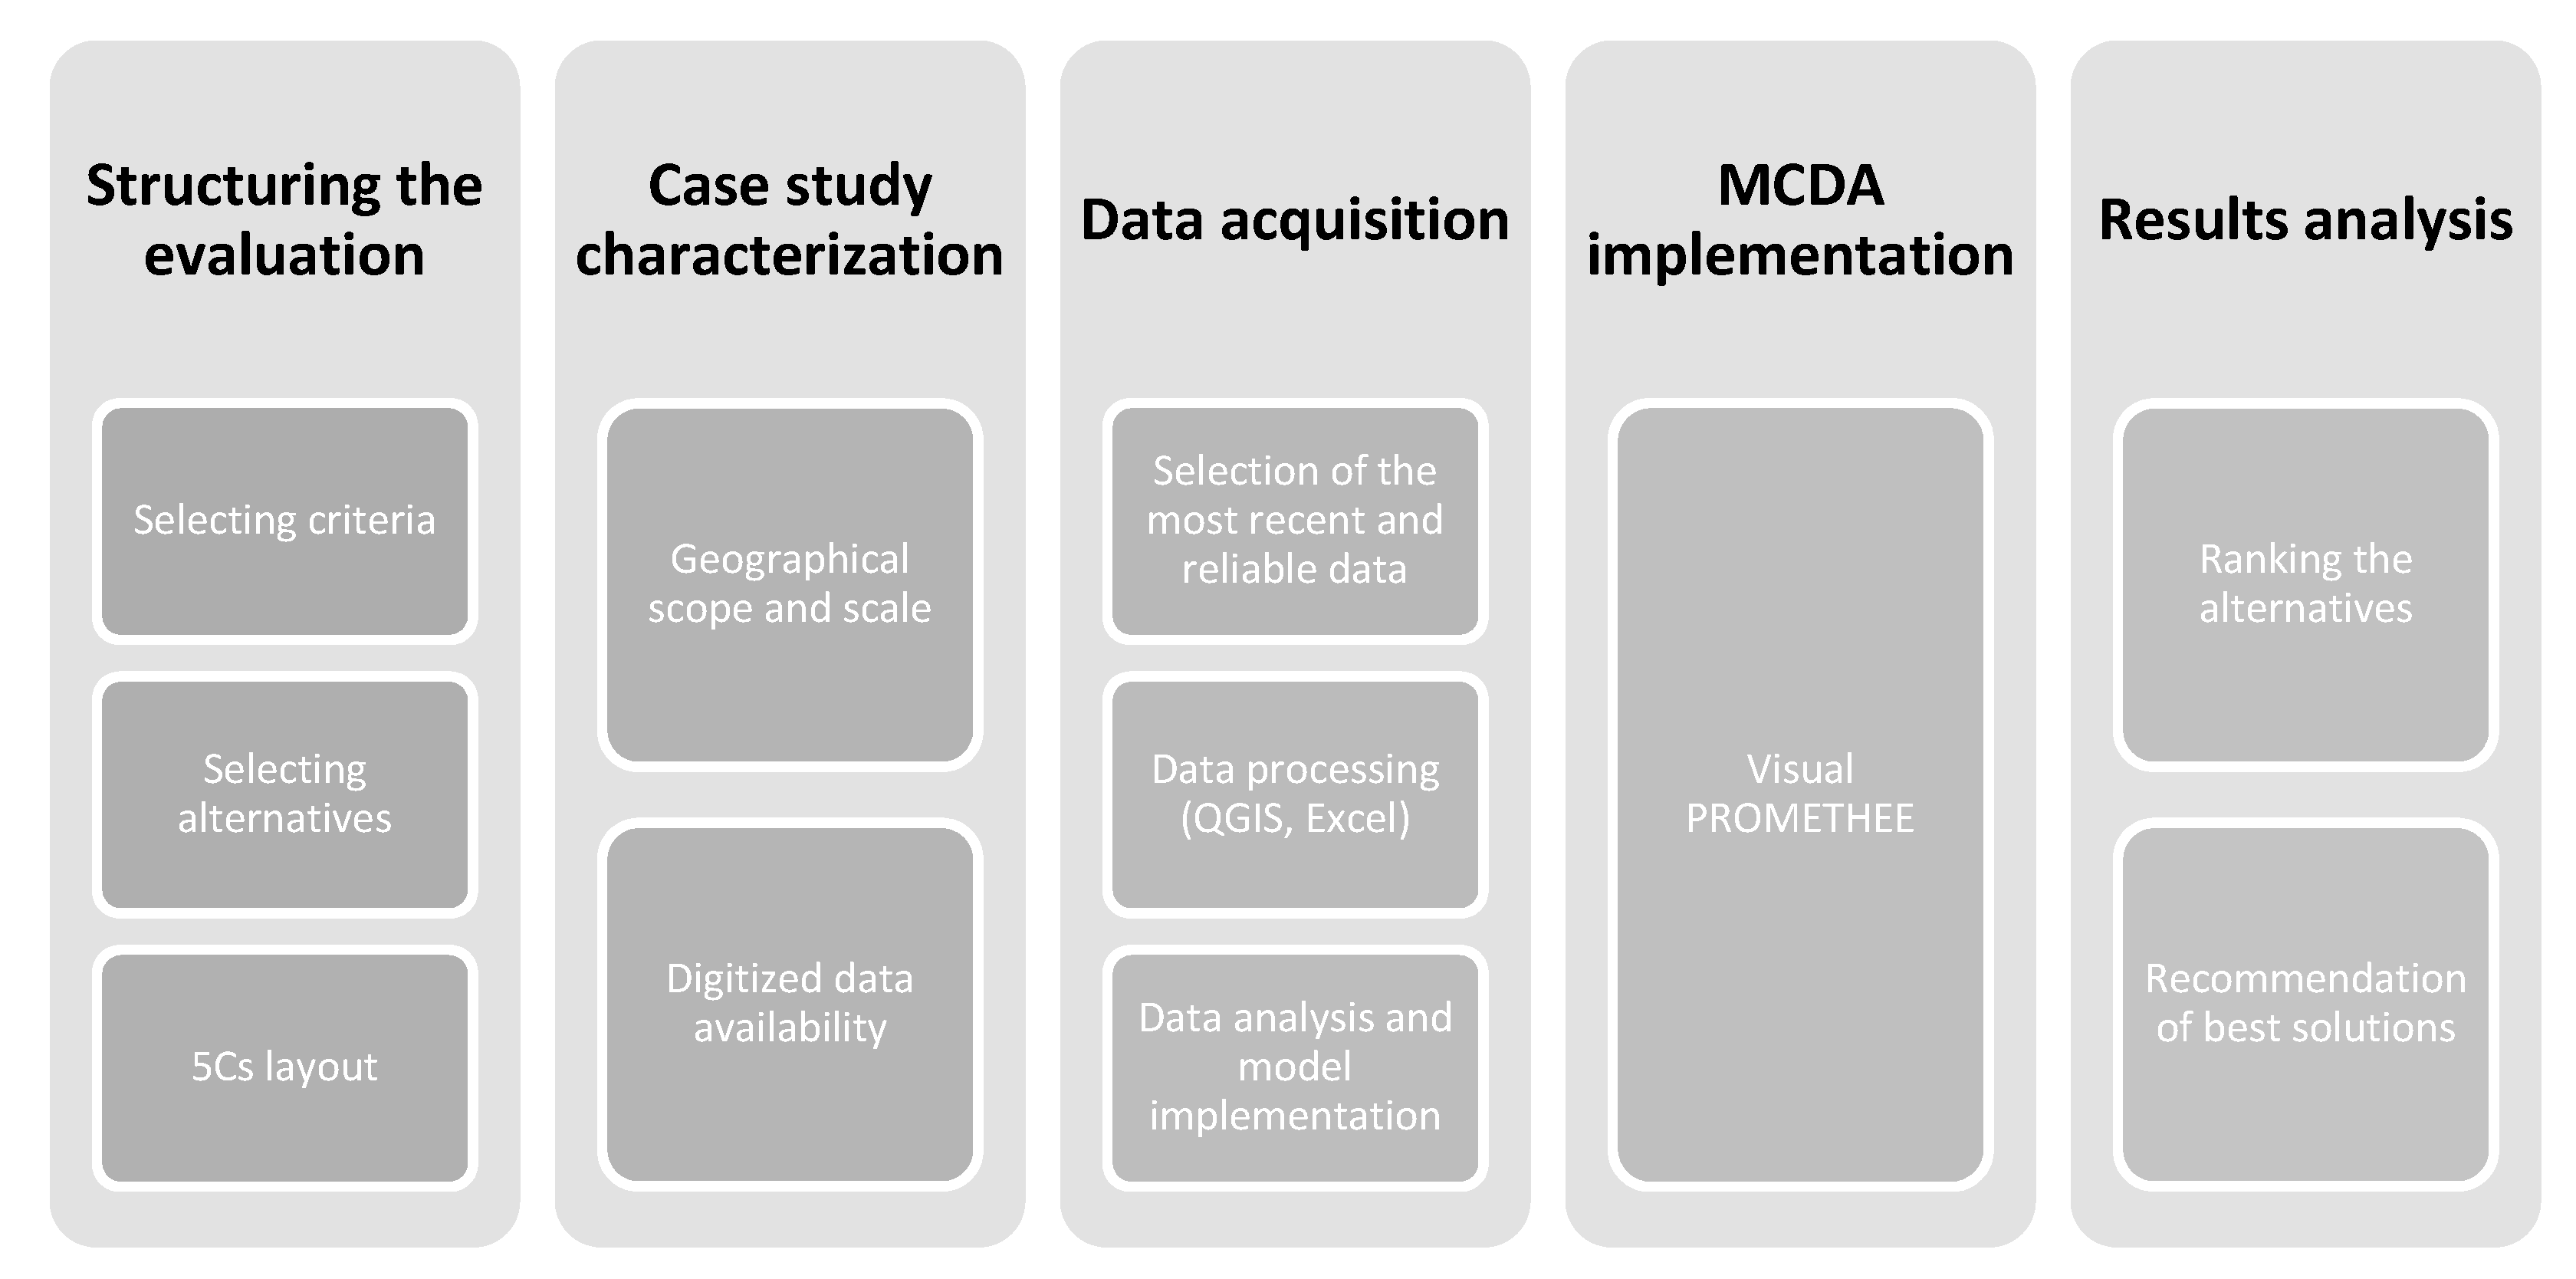
This section presents the MCDA-based analysis framework to assess walkability developed in this paper. Figure 1 describes the process flow applied in the analysis.
- Structuring the evaluation: The first phase of the analysis was dedicated to structuring the evaluation factors, namely the criteria and the alternatives. The 5Cs layout methodology was used as a base to choose the most important criteria for the study.
- Case study characterization: The second step was focused on characterizing the geographical scope and scale of the study area, as well as finding the data availability for the model. Roads located in the eastern zone of the city were selected.
- Data acquisition: An exhaustive search in official database sources (government, private companies, open-source applications) was carried out to obtain the most reliable data to run the MCDA and acquire sounder results.
- MCDA implementation: This step was dedicated to developing the MCDA model and computational implementation (The Visual PROMETHEE Multicriteria Decision Aid software was used to obtain the results (www.promethee-gaia.net)).
- Results analysis: This step provided the generation of the PROMETHEE’s complete ranking of alternatives and the evaluation of the rankings to determine the best actions for the case study. Furthermore, suggestions for improvement in the area studied were introduced.
3.1. Evaluation Criteria
First, the study focused on using the multidimensional 5Cs layout, developed by the Greater London Authority (GLD), as the basis for choosing the evaluation criteria. This framework defines five factors (connectivity, convenience, comfortability, conviviality, and conspicuousness) as fundamental to allow pedestrians to walk with high-quality levels in urban environments [43]. These factors are described below.
- Connectivity: for measuring how the footpath network connects to the main origins and destinations of the journey, as well as the extent of the connections between the different routes of the network. In our work, this factor is assessed by criteria regarding street connectivity.
- Convenience: for measuring the diversity of land uses and functions conveniently accessible on foot, or accessibility to other means of transport. In our work, this factor is assessed employing criteria regarding transport integration.
- Comfortability: for measuring how walking is accommodated to the capabilities and skills of all types of pedestrians. In our work, this factor is assessed by criteria regarding route conditions.
- Conviviality: for measuring the extent to which walking is a pleasant activity, in terms of interaction with people, the built and natural environment, and encompassing social and recreation activities. In our work, this factor is assessed by criteria regarding aesthetics and attractiveness.
- Conspicuousness: for measuring the extent to which walking routes and public spaces are discernible and inviting for pedestrians, in terms of clear and legible signage and information and in terms of spatial legibility, complexity, and coherence. In our work, this factor is assessed by criteria regarding route safety.
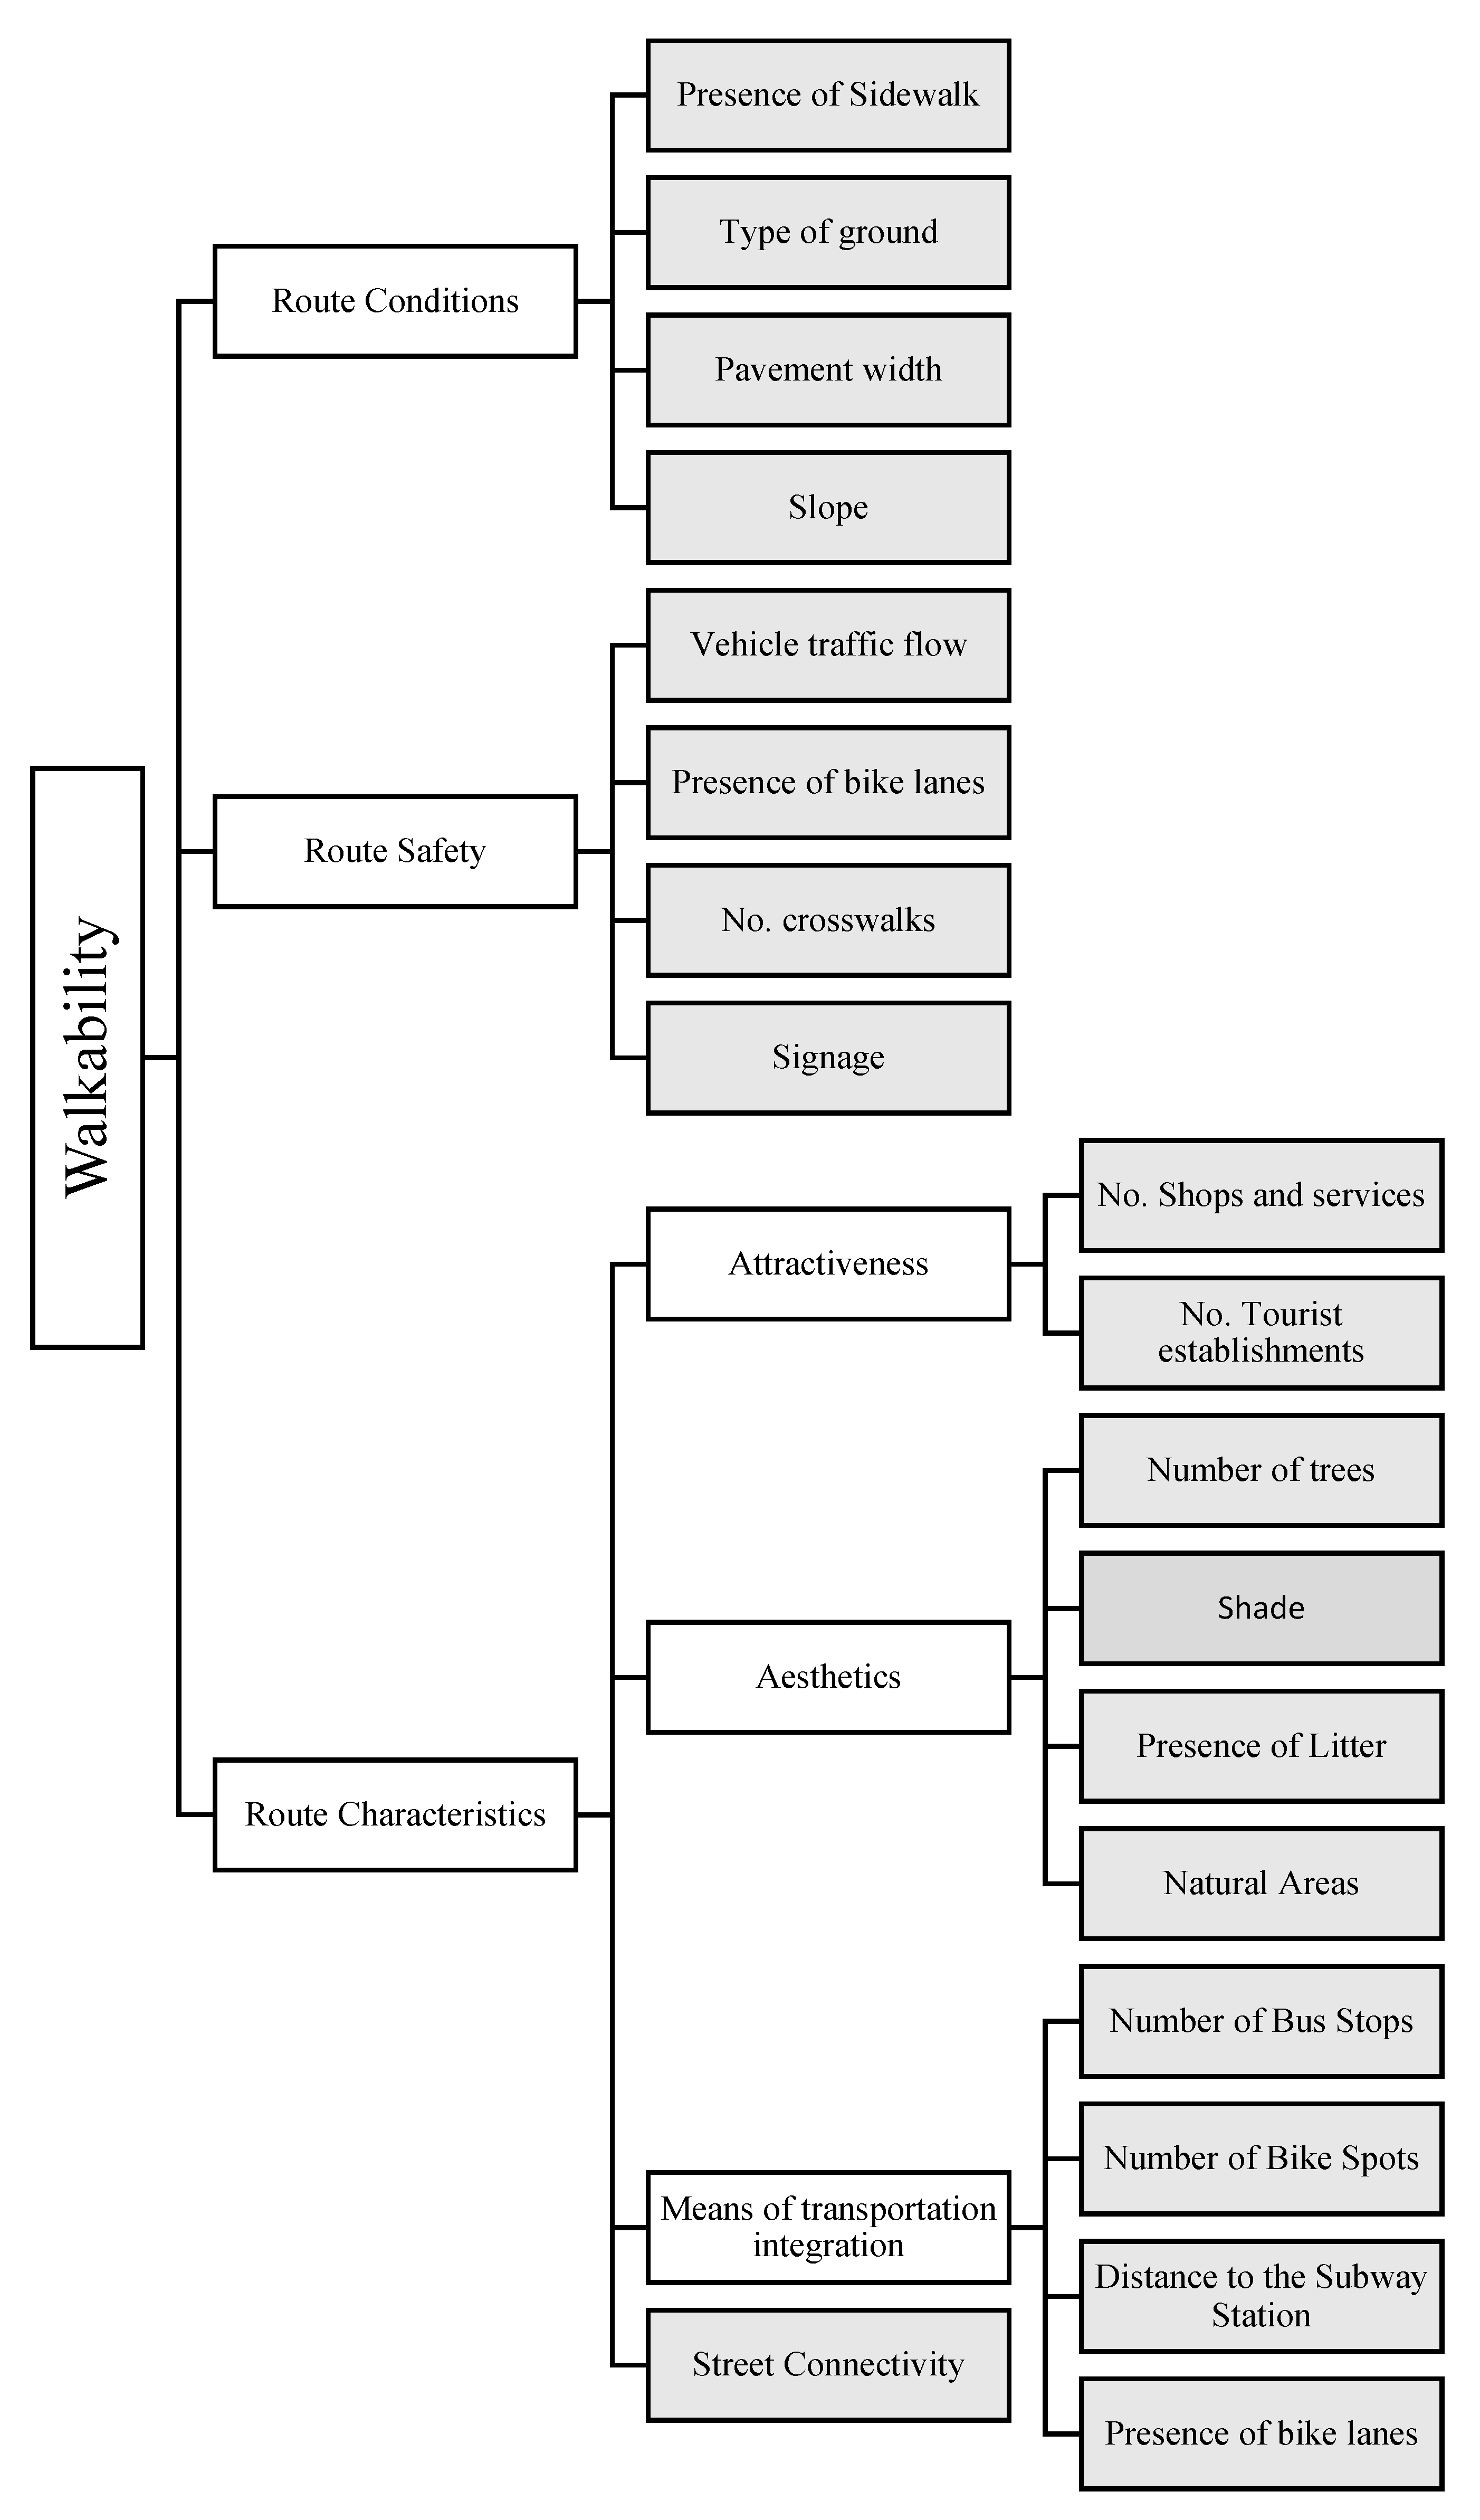
Based on the above factors, the most important criteria for developing the analysis began to be outlined. First, three main categories were defined: (a) route conditions, (b) route safety, and (c) route characteristics. The next step was to structure the hierarchy of the fundamental objectives. This concept can be defined as an evaluation of how the available alternatives should be assessed, expressing the motivations of a DM in the decision-aid process to choose an alternative [45]. We came up with the tree of fundamental objectives through this procedure, which encompasses the most important dimensions to assess walkability (Figure 2). The gray boxes represent the selected evaluation criteria.
3.2. Alternatives
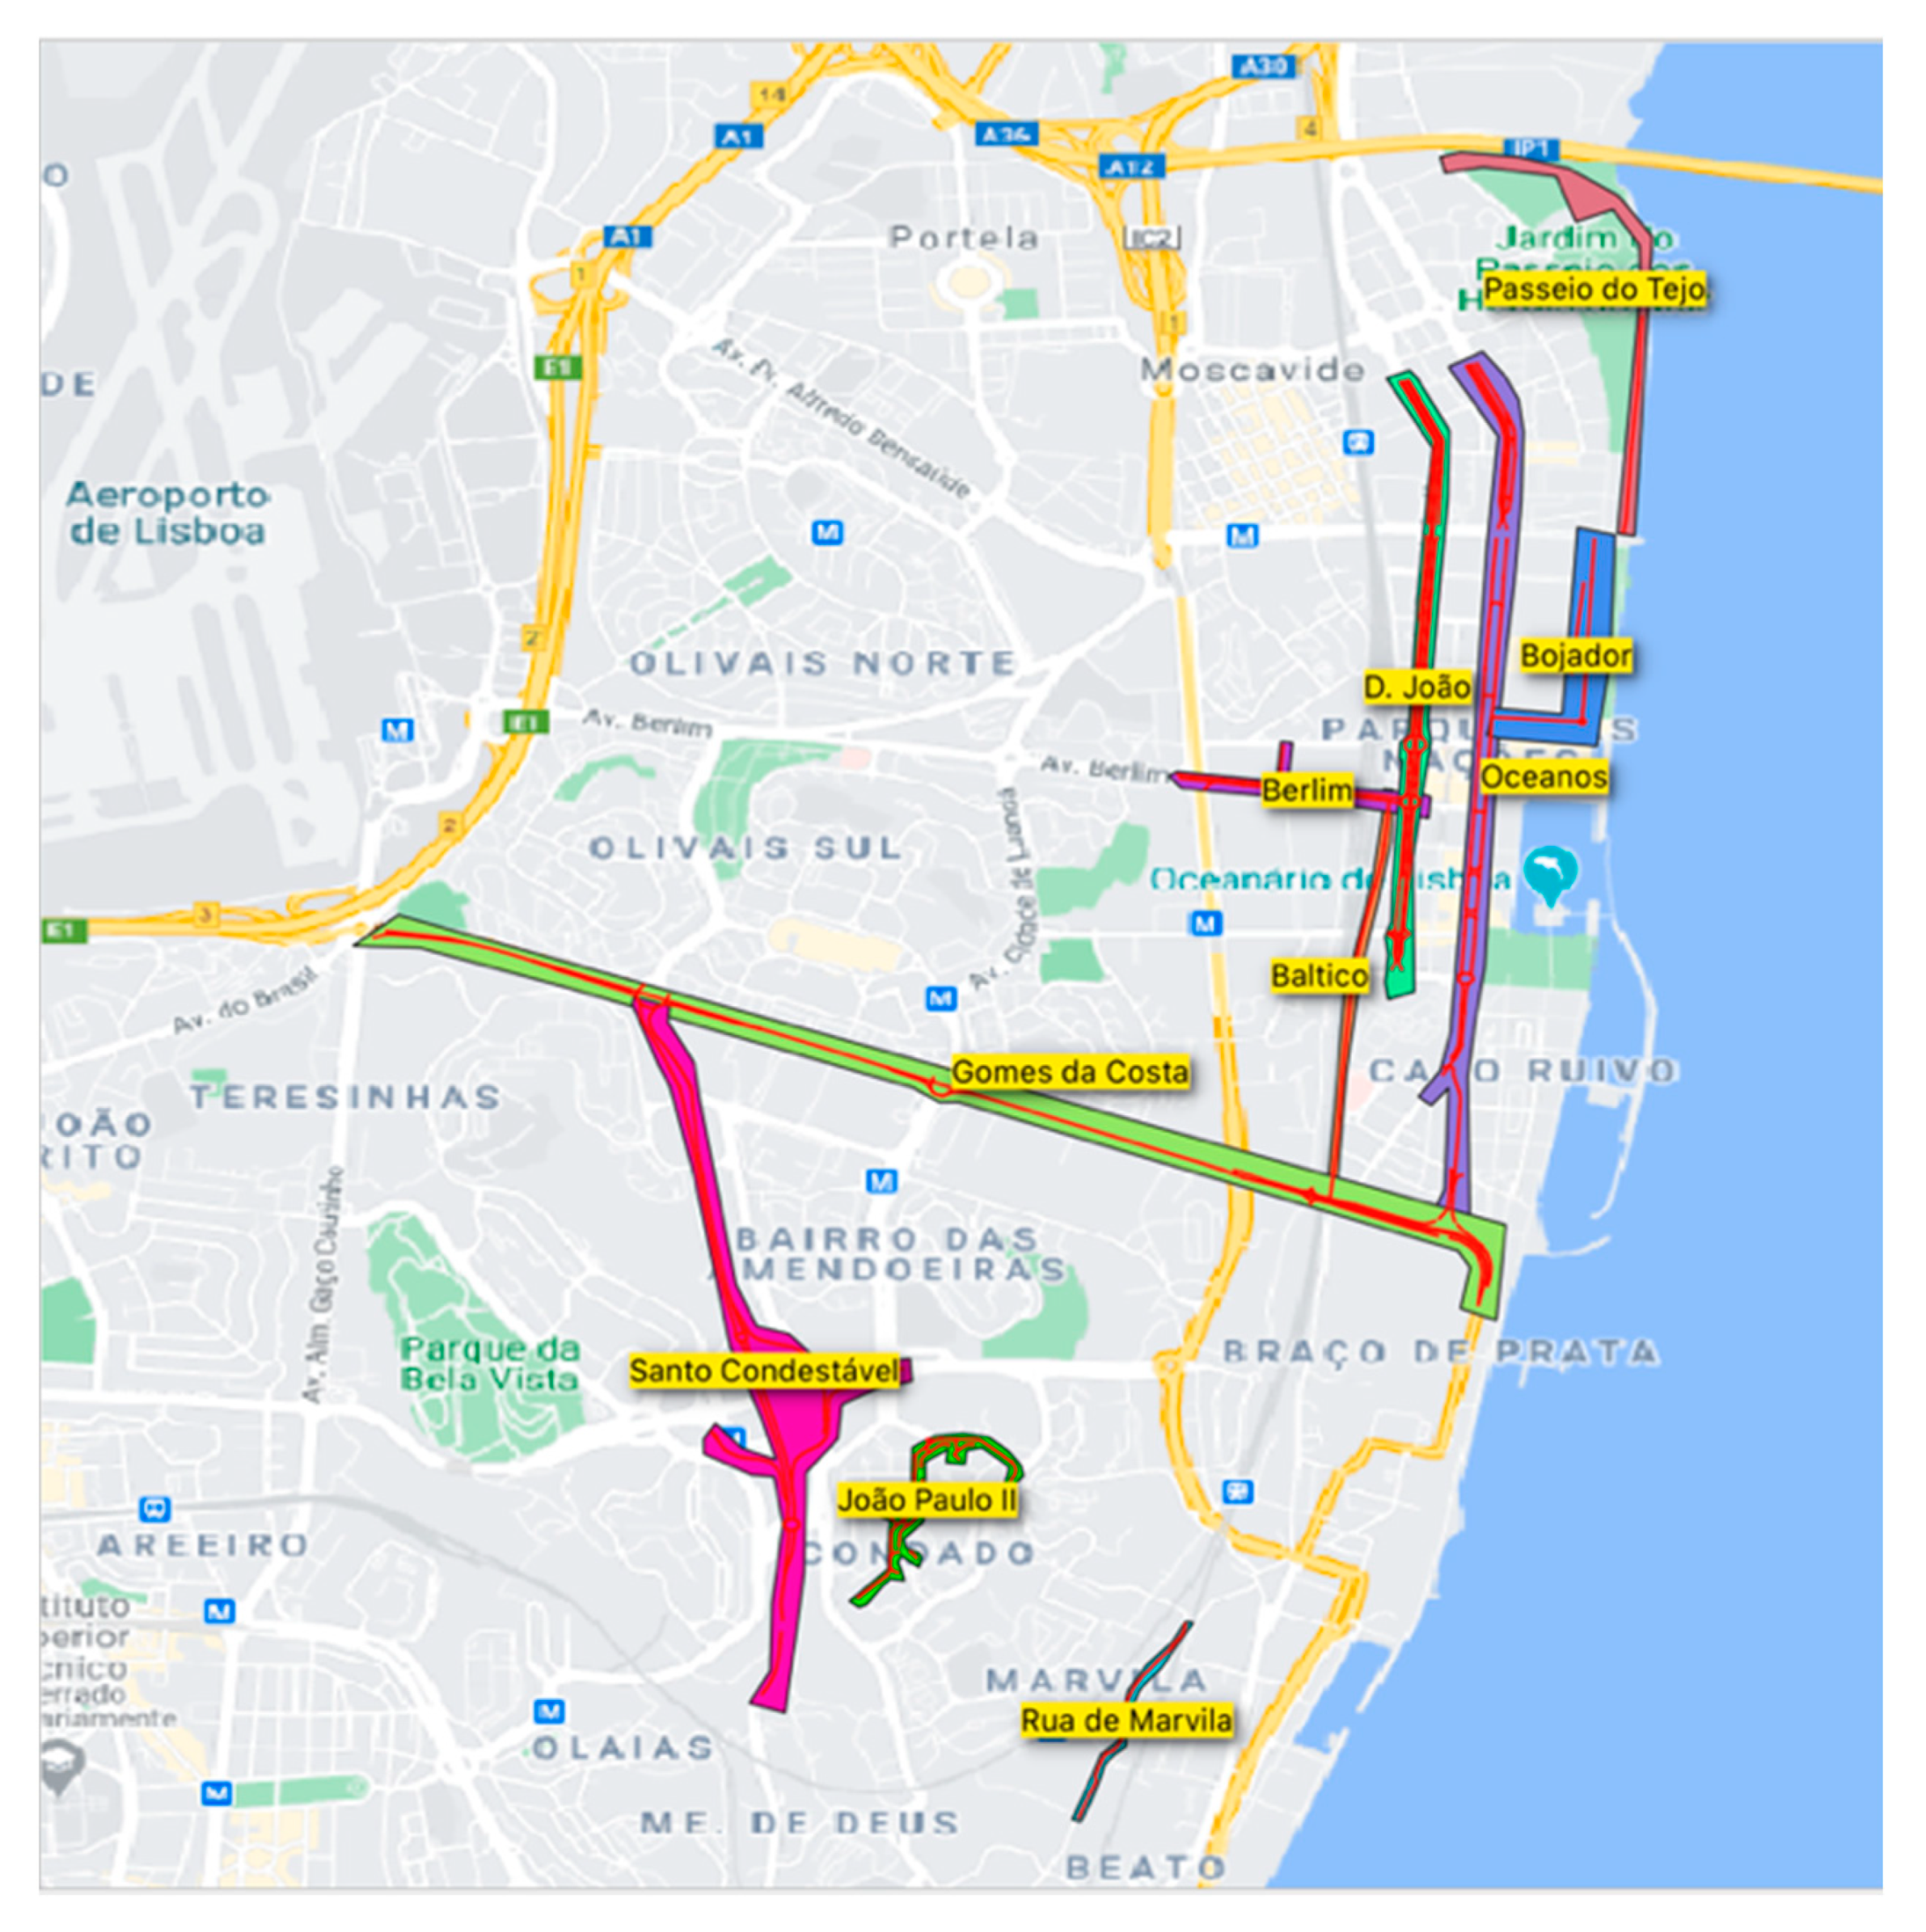
The eastern zone of Lisbon, more specifically the area that includes Parque das Nações and Marvila parishes, was selected as the sector in which to conduct the case study. This zone presents a varied sample space of streets and avenues, with some regions more focused on commerce, others more residential, and still others that are more touristic. Ten routes located in different zones of the study area were selected randomly. Thus, the MCDA model was evaluated for varied situations of walkability. Table 1 presents the selected alternatives’ names, the road’s zone, and the total area.
Six alternatives are located in the Parque das Nações zone. This parish includes an urban renewal area, located on the banks of the Tagus River. The region was transformed into a modern commercial and residential district in 1998, as a project for the Lisbon World Exposition (Expo’98). Thus, this parish presents buildings with contemporary architecture, pedestrian spaces, parks, hotels, and tourist attractions. It is estimated that 31,000 people currently live there. This zone can be recognized as the site of one of the best urban renewal projects in Portugal, since in the early 1990s this region was an industrial area, while today is one of the most important places in Lisbon. Four alternatives are located in the Marvila zone. This is one of the oldest parishes in the city of Lisbon, presenting parochial and industrial architecture. It is mainly a residential zone. The area has benefited from the urban-renewal project regarding Expo’98, as most of the industrial warehouses were repurposed as cultural centers. However, there are still signs of agricultural activity in the area. Currently, an estimated 37,793 people reside in the area. Figure 3 depicts the study area and the geographic location of each of the selected alternatives.
3.3. Data Acquisition
An extensive search was conducted to obtain the most up-to-date and consistent data. The process was divided into acquiring raw data from official sources, processing it if necessary, then applying geographic information system (GIS) software for visualization, and finally obtaining the usable data. Most of the data were gathered in partnership with the Lisbon city council through the Lisboa Aberta database platform (http://lisboaaberta.cm-lisboa.pt/index.php/pt/). Table 2 presents the selected criteria by name, description, measurement scale (quantitative or qualitative), and data source.
The process of acquiring each element of the data needed for the 18 criteria is briefly described below. Table 3 presents the data values used in the analysis.
- Presence of sidewalk: This binary qualitative criterion describes the presence or absence of pedestrian sidewalks. Google Street View was used as an evaluation tool to observe the existence of pavement.
- Ground conditions: This qualitative criterion describes the quality of the project, construction, and pavement maintenance. The number of occurrences on the Minha Rua LX app concerning pavement conditions and maintenance in a timeframe of two years was carried out to assess it. In addition, Google Street View was used to assess the sidewalk conditions.
- Pavement width: This qualitative criterion evaluates how much effective pavement width is able for walking, considering the presence of obstacles (e.g., street furniture, lampposts). Google Street View was used as an evaluation tool to measure the sidewalk width. The qualitative scale represents the following measurements: Large (5 to 3 m), Medium (3 to 1 m), Narrow (1 to 0 m), Non-existent (0 m).
- Slope: This qualitative criterion evaluates the inclination of the route’s pavement. To assess it, open data provided by the Lisbon city council concerning the inclination of the streets were used. QGIS 3.14 (a free and open-source desktop geographic information system (GIS) application that supports viewing, editing, and analyzing geospatial data (https://qgis.org/en/site/)) software was used as a support-aid tool to assess the data and calculate the slope on the selected routes. The qualitative scale represents the following measurements: High (at least 50% of the route has more than 20 m slope), Medium (at least 90% of the route has less than 20 m slope), Flat (at least 90% of the route has less than 5 m slope).
- Vehicle traffic flow: This qualitative criterion evaluates the pedestrians’ sense of safety pertaining to the presence of high vehicle traffic flow. To assess it, data concerning the number of traffic jams during rush hours (8–11 a.m. and 6–9 p.m.), provided by Waze® and Google Street Maps, were analyzed. The qualitative scale represents the following measurements: High (at least more than 75% of traffic jams reported daily in the time period analyzed), Medium (at least 75% to 50% of traffic jams reported daily in the period), Low (at least less than 50% of traffic jams reported daily in the period).
- Number of crosswalks: This quantitative criterion evaluates the number of crosswalks in the route per square kilometer. Google Street View was used as an evaluation tool to measure the number of sidewalks. The data were divided by the area of each selected alternative in order to normalize the results.
- Signage: This qualitative criterion evaluates the pedestrians’ sense of safety due to the presence of signage. To determine it, open data from the Lisbon city council concerning the number of traffic signs and information posts in the area studied were collected. Additionally, occurrences on the Minha Rua LX app concerning roads and signage were taken into account.
- Presence of litter: This quantitative criterion evaluates the presence of litter on the route. The number of occurrences on the Minha Rua LX app concerning urban cleaning in a timeframe of two years was considered to determine it.
- Number of trees: This quantitative criterion evaluates the presence of trees on the route. Open data from the Lisbon city council concerning the number of trees in the studied area were used to determine it. The data were divided by the area of each selected alternative in order to normalize the results. QGIS 3.14 software was used as a support aid tool to assess and manipulate the data.
- Natural areas: This binary qualitative criterion evaluates the presence of natural areas (mainly parks) in the selected alternatives. To determine it, open data from the Lisbon city council concerning the location of parks in the city were collected.
- Shade: This quantitative criterion evaluates the total area of the street that is in shade throughout the day. A 3D model of the area studied was developed and ArcGIS Pro (a geographic information system application for working with maps and geographic information maintained by the Environmental Systems Research Institute (Esri)) software was used as a support tool to assess and acquire the data. The days with the most sunlight were selected to obtain the percentage of shade during the day. After setting the time period, the simulation was carried out to provide the shade incident during the day and its location. The percentage of the street falling into shade was calculated through this approach.
- Number of shops and services: This quantitative criterion evaluates the number of shops and services on the route (e.g., bakeries, markets, pharmacies, restaurants, bars). Open data from the Lisbon city council concerning the number of shops and services in the area studied were collected to determine it. The data were divided by the area of each selected alternative in order to normalize the results. QGIS 3.14 software was used as a support tool to assess and manipulate the data.
- Number of tourist establishments: This quantitative criterion evaluates the number of tourist establishments (e.g., museums, hotels, sightseeing spots, points of interest). To determine it, open data from the Lisbon city council concerning the number of tourist establishments in the area studied were collected. The data were divided by the area of each selected alternative in order to normalize the results. QGIS 3.14 software was used as a support tool to assess and manipulate the data.
- Bus stops: This quantitative criterion evaluates the presence of bus stops on the route. To determine it, open data from the Lisbon city council for the number of bus stops in the area studied were collected. The data were divided by the length of each selected alternative in order to normalize the results. QGIS 3.14 software was used as a support tool to assess and manipulate the data.
- Subway stations: This quantitative criterion evaluates the mean distance to a subway station. To determine it, open data from the Lisbon city council for the location of the subway stations were collected. The centroid of the routes was calculated to evaluate the distance to the nearest subway station, and the minimum distance from the centroid to the nearest station was measured. QGIS 3.14 software was used as a support tool to assess and manipulate the data.
- Bicycle-sharing stations: This quantitative criterion evaluates the presence of bicycle-sharing stations in the route. To determine it, data from GIRA (GIRA is the official Lisbon shared bicycle service provider) concerning the number of sharing stations in the area studied were collected. The data were divided by the area of each selected alternative in order to normalize the results. QGIS 3.14 software was used as a support tool to assess and manipulate the data.
- Bike lanes: This quantitative criterion evaluates the presence of bicycle lanes in the route. To determine it, open data from the Lisbon city council concerning the location and length of bike lanes in the area studied were collected. The data were divided by the total route length in order to obtain the percentage relationship of bike lanes in the selected alternatives. QGIS 3.14 software was used as a support tool to assess and manipulate the data.
- Street connectivity: This qualitative criterion describes how the footpath network connects to the main origins and destinations of the journey, as well as the extent of the connections between the different routes of the network. Google Street View was used as an evaluation tool to assess it.
4. Results
In this section, we present and discuss the final outcomes of the MCDA. The PROMETHEE method was selected as the supporting tool to assess the streets’ walkability ranking. This outranking family of methods comprehends a vast number of diverse approaches. Version II is more frequently used in the literature, and was therefore applied in this work. For all data used, the weights are equal and the preference functions for all criteria are set up as “Usual” (see Appendix A). This step was taken in order to avoid any discrepancy in the results. Nevertheless, some DMs could perform the analysis, varying the preference functions and weights in order to design different analysis scenarios. The study outcomes are presented in three visualizations: ranking flow table, PROMETHEE Diamond, and PROMETHEE Rainbow. The PROMETHEE complete ranking flow table is presented below and introduces the positive, negative, and complete outranking flow scores of the analysis (Table 4).
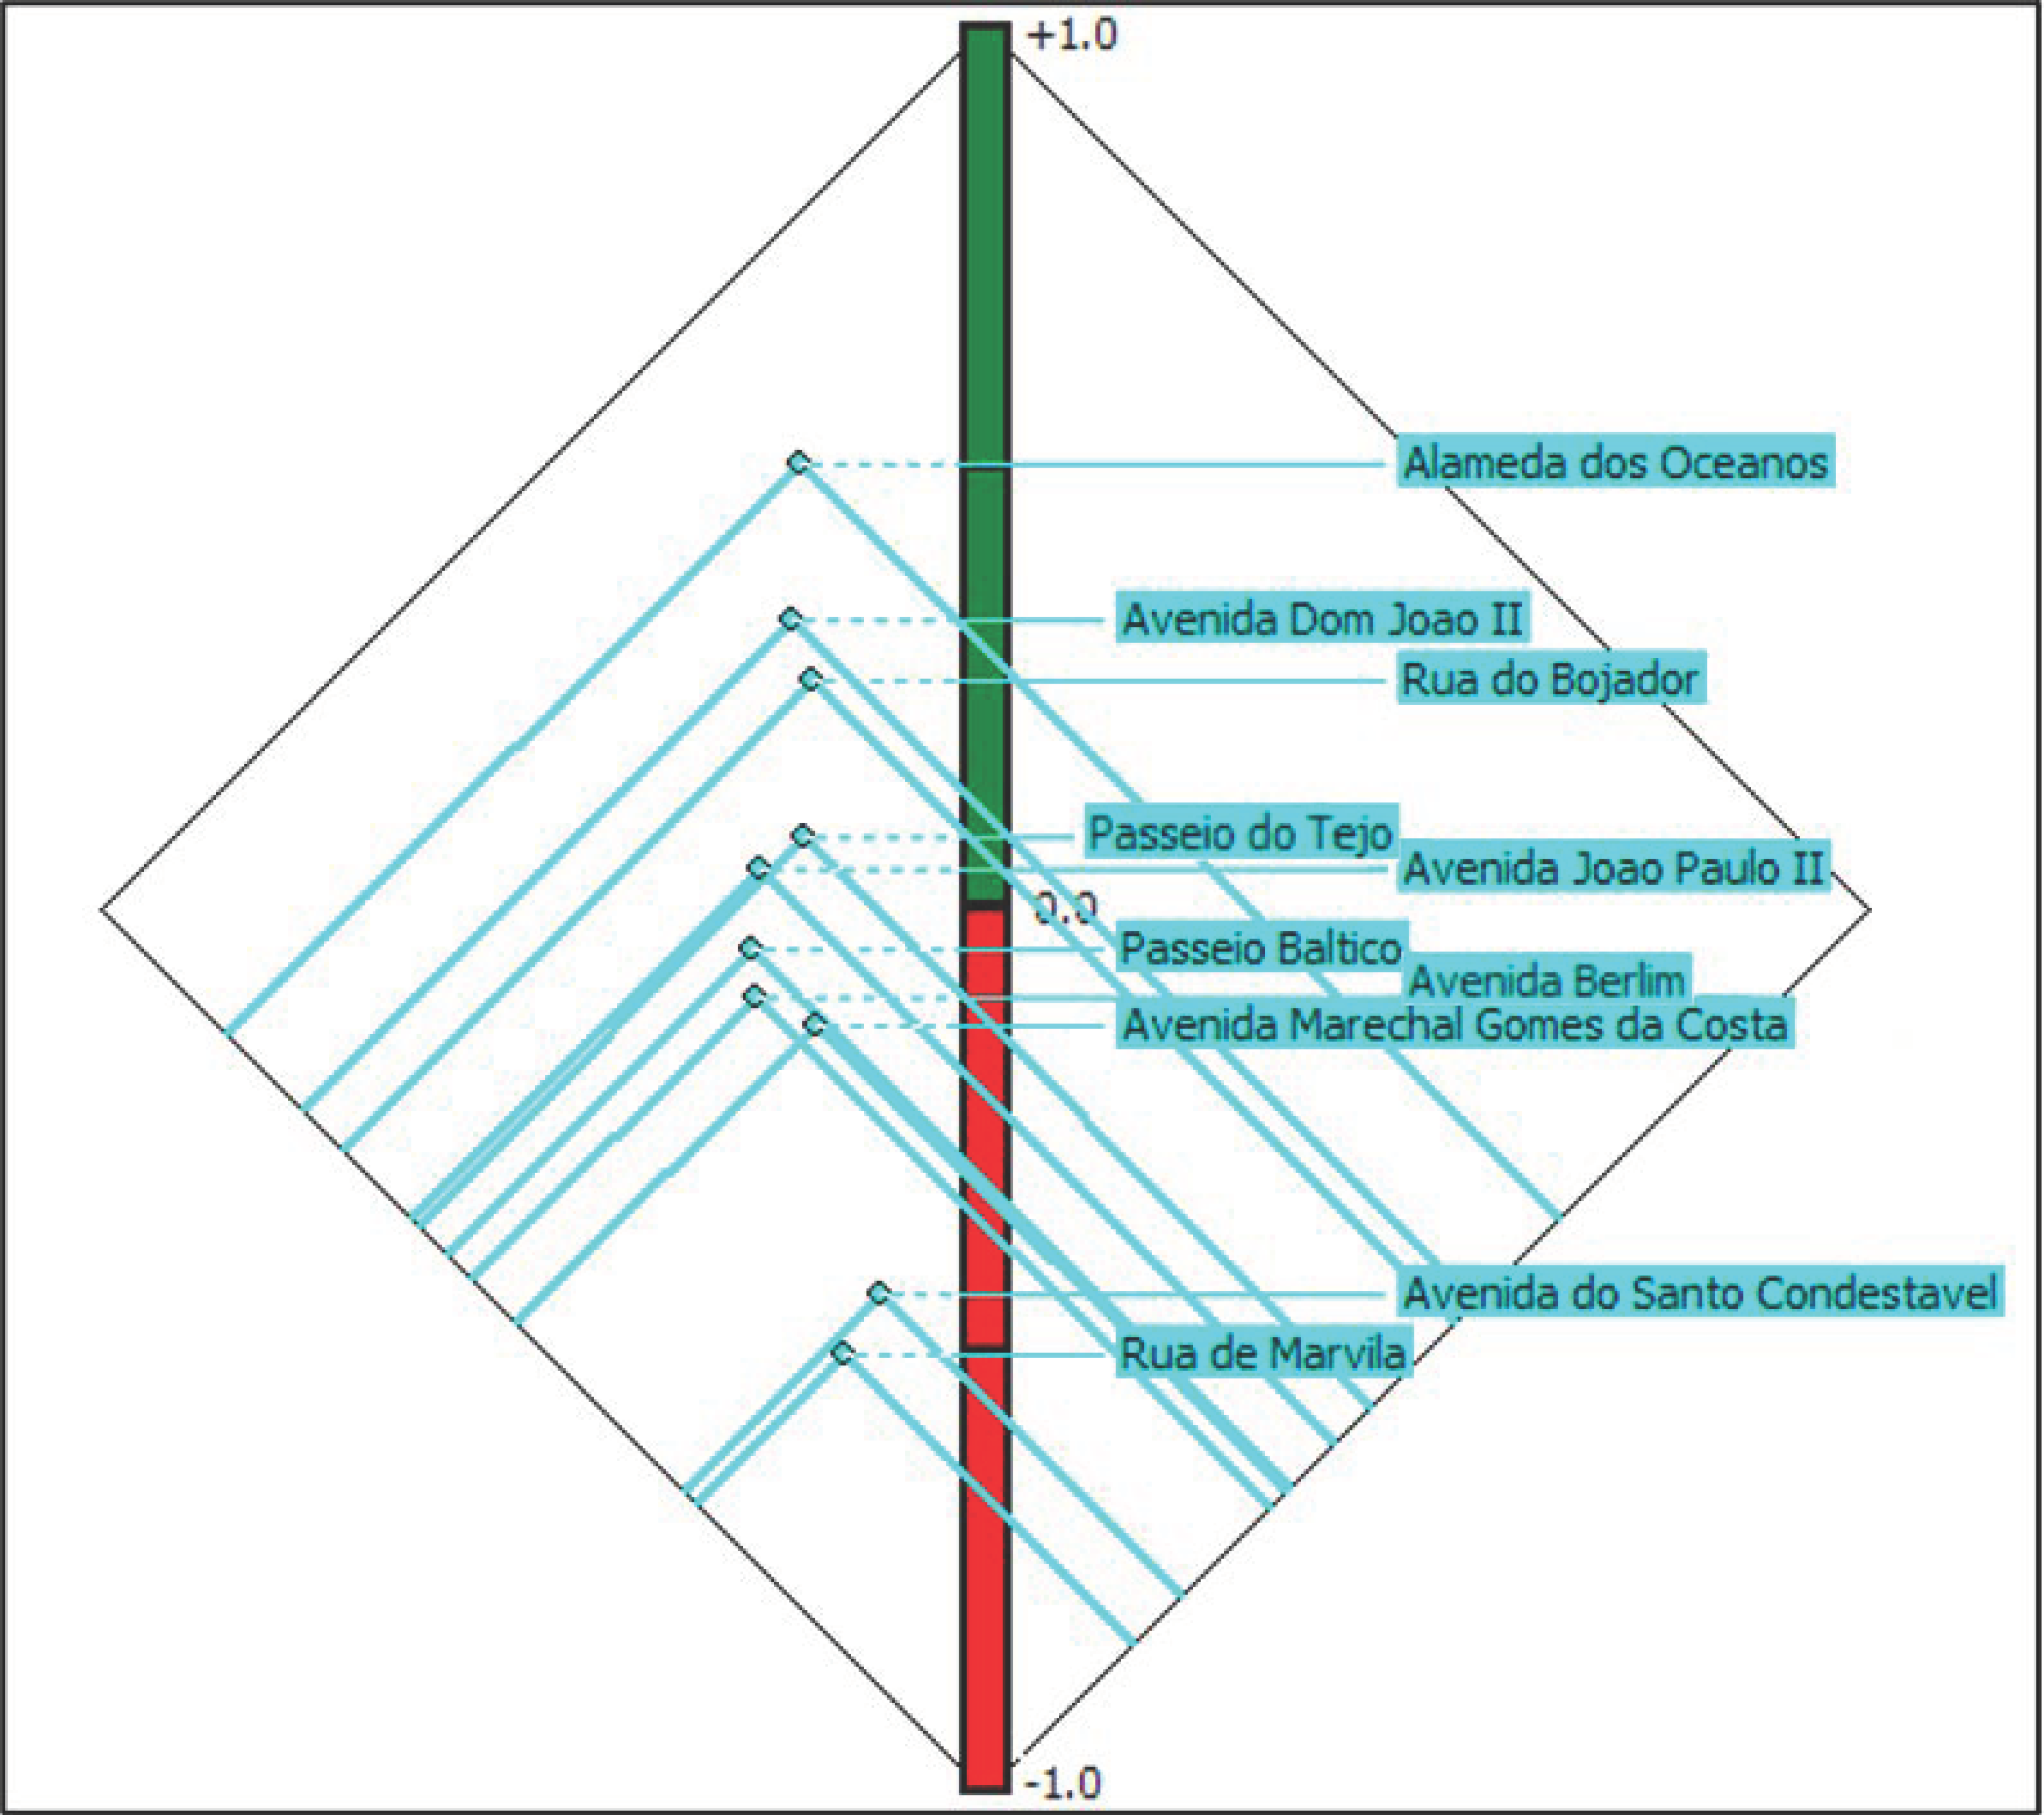
Figure 4 presents the PROMETHEE Diamond representation of the results. In the visualization the points in the (ϕ+, ϕ−) plane represent each of the alternatives analyzed. The plane is angled at 45° degrees so that the vertical dimension (green-red axis) corresponds to the ϕ net flow.
The blue cone drawn for each alternative represents the outranking or incomparability relationships between the alternatives. If the cone overlaps another one, it means that the overlapping cone is preferred. Intersecting cones correspond to alternatives that cannot be compared. For instance, the “Alameda dos Oceanos” alternative is preferred to all the others, followed by “Avenida Dom João II” and “Rua do Bojador.” On the other hand, according to the evaluation the “Rua de Marvila” is the poorest alternative. The diamond representation also shows that the “Passeio do Tejo” and “Avenida João Paulo II” cannot be compared, nor can the “Avenida de Berlim” and “Avenida Marechal Gomes da Costa.”
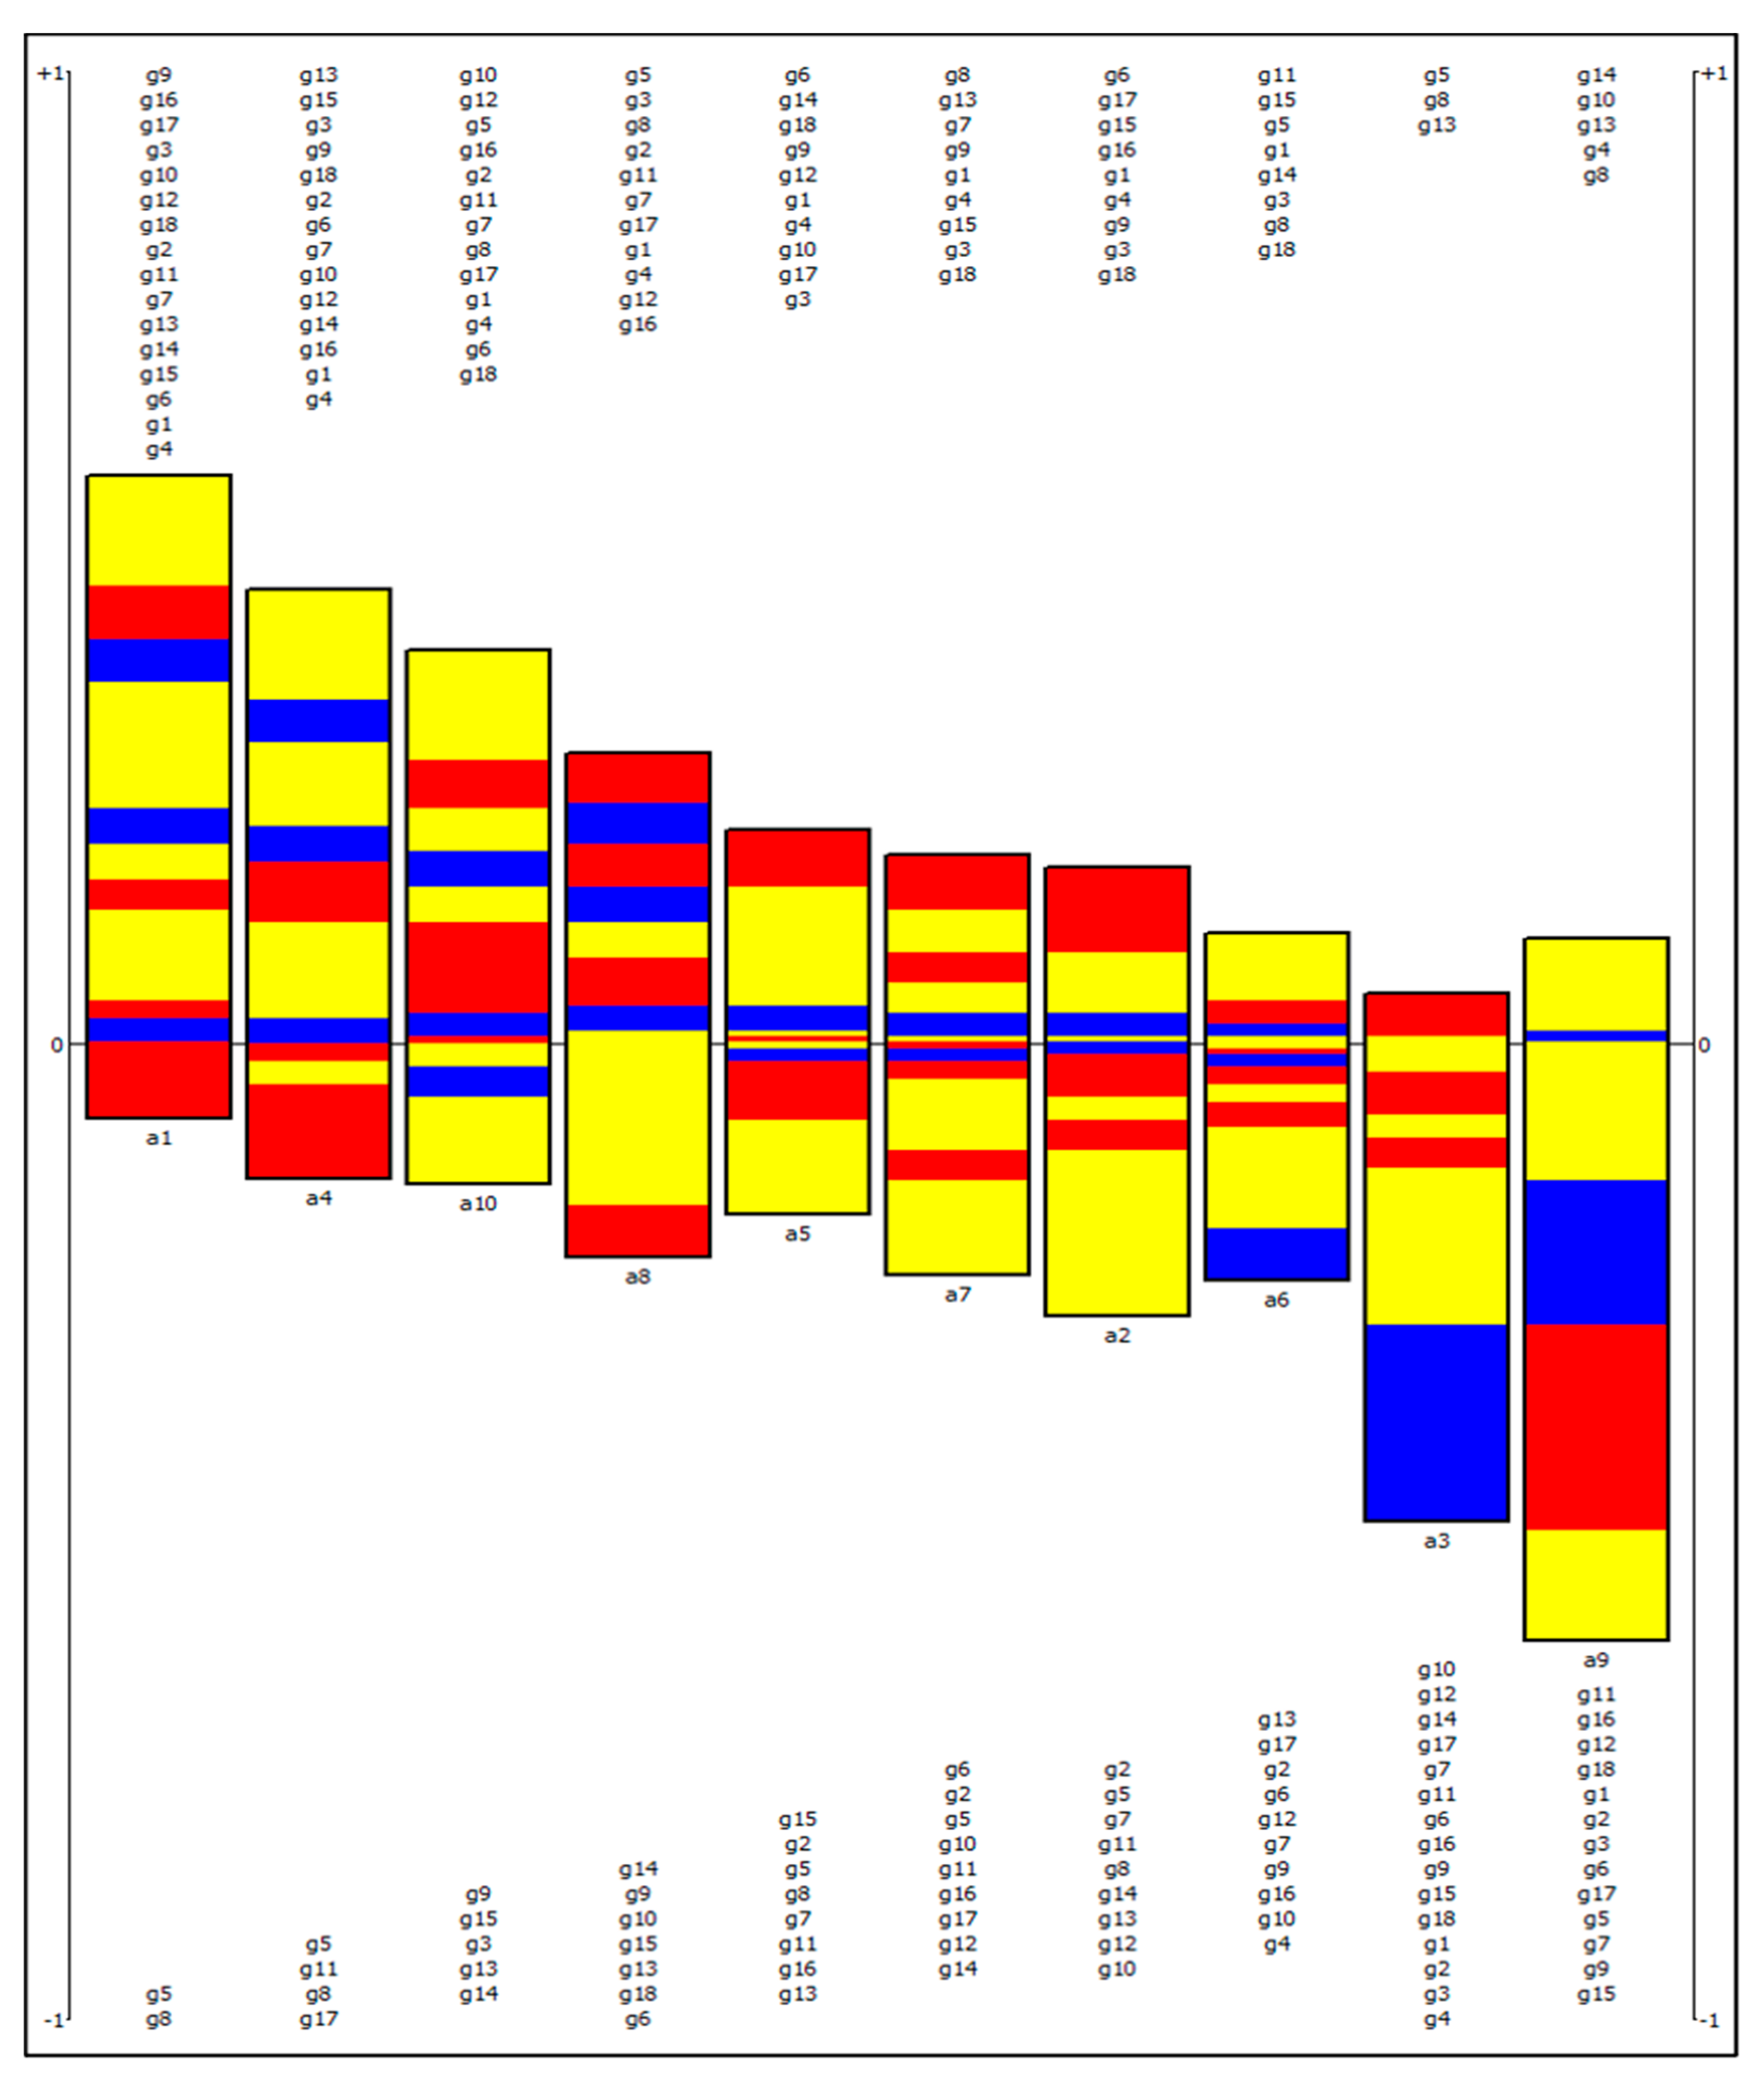
Figure 5 displays the PROMETHEE Rainbow representation of the results. This type of visualization enables the DM to notice the strengths and weaknesses of an alternative. Each bar has different colored slices that represent the different criteria of the alternatives. The slices are proportional to the contribution of each criterion (flow value times the weight of the criterion) to the ϕ net flow score of the action. The bar’s upper end corresponds to good criteria evaluation, while the lower end corresponds to weaknesses.
For instance, the alternative “Alameda dos Oceanos” (a1) presents 16 strengths and only 2 weaknesses. On the other hand, “Av. do Santo Condestável” (a3) presents 15 weaknesses and only 3 strengths. The results concerning strengths and weaknesses of the best three alternatives (a1, a4, a10) and the two poorest alternatives (a3, a9) are discussed in the next section, as well as suggestions for improvements in the alternatives analyzed.
5. Discussion
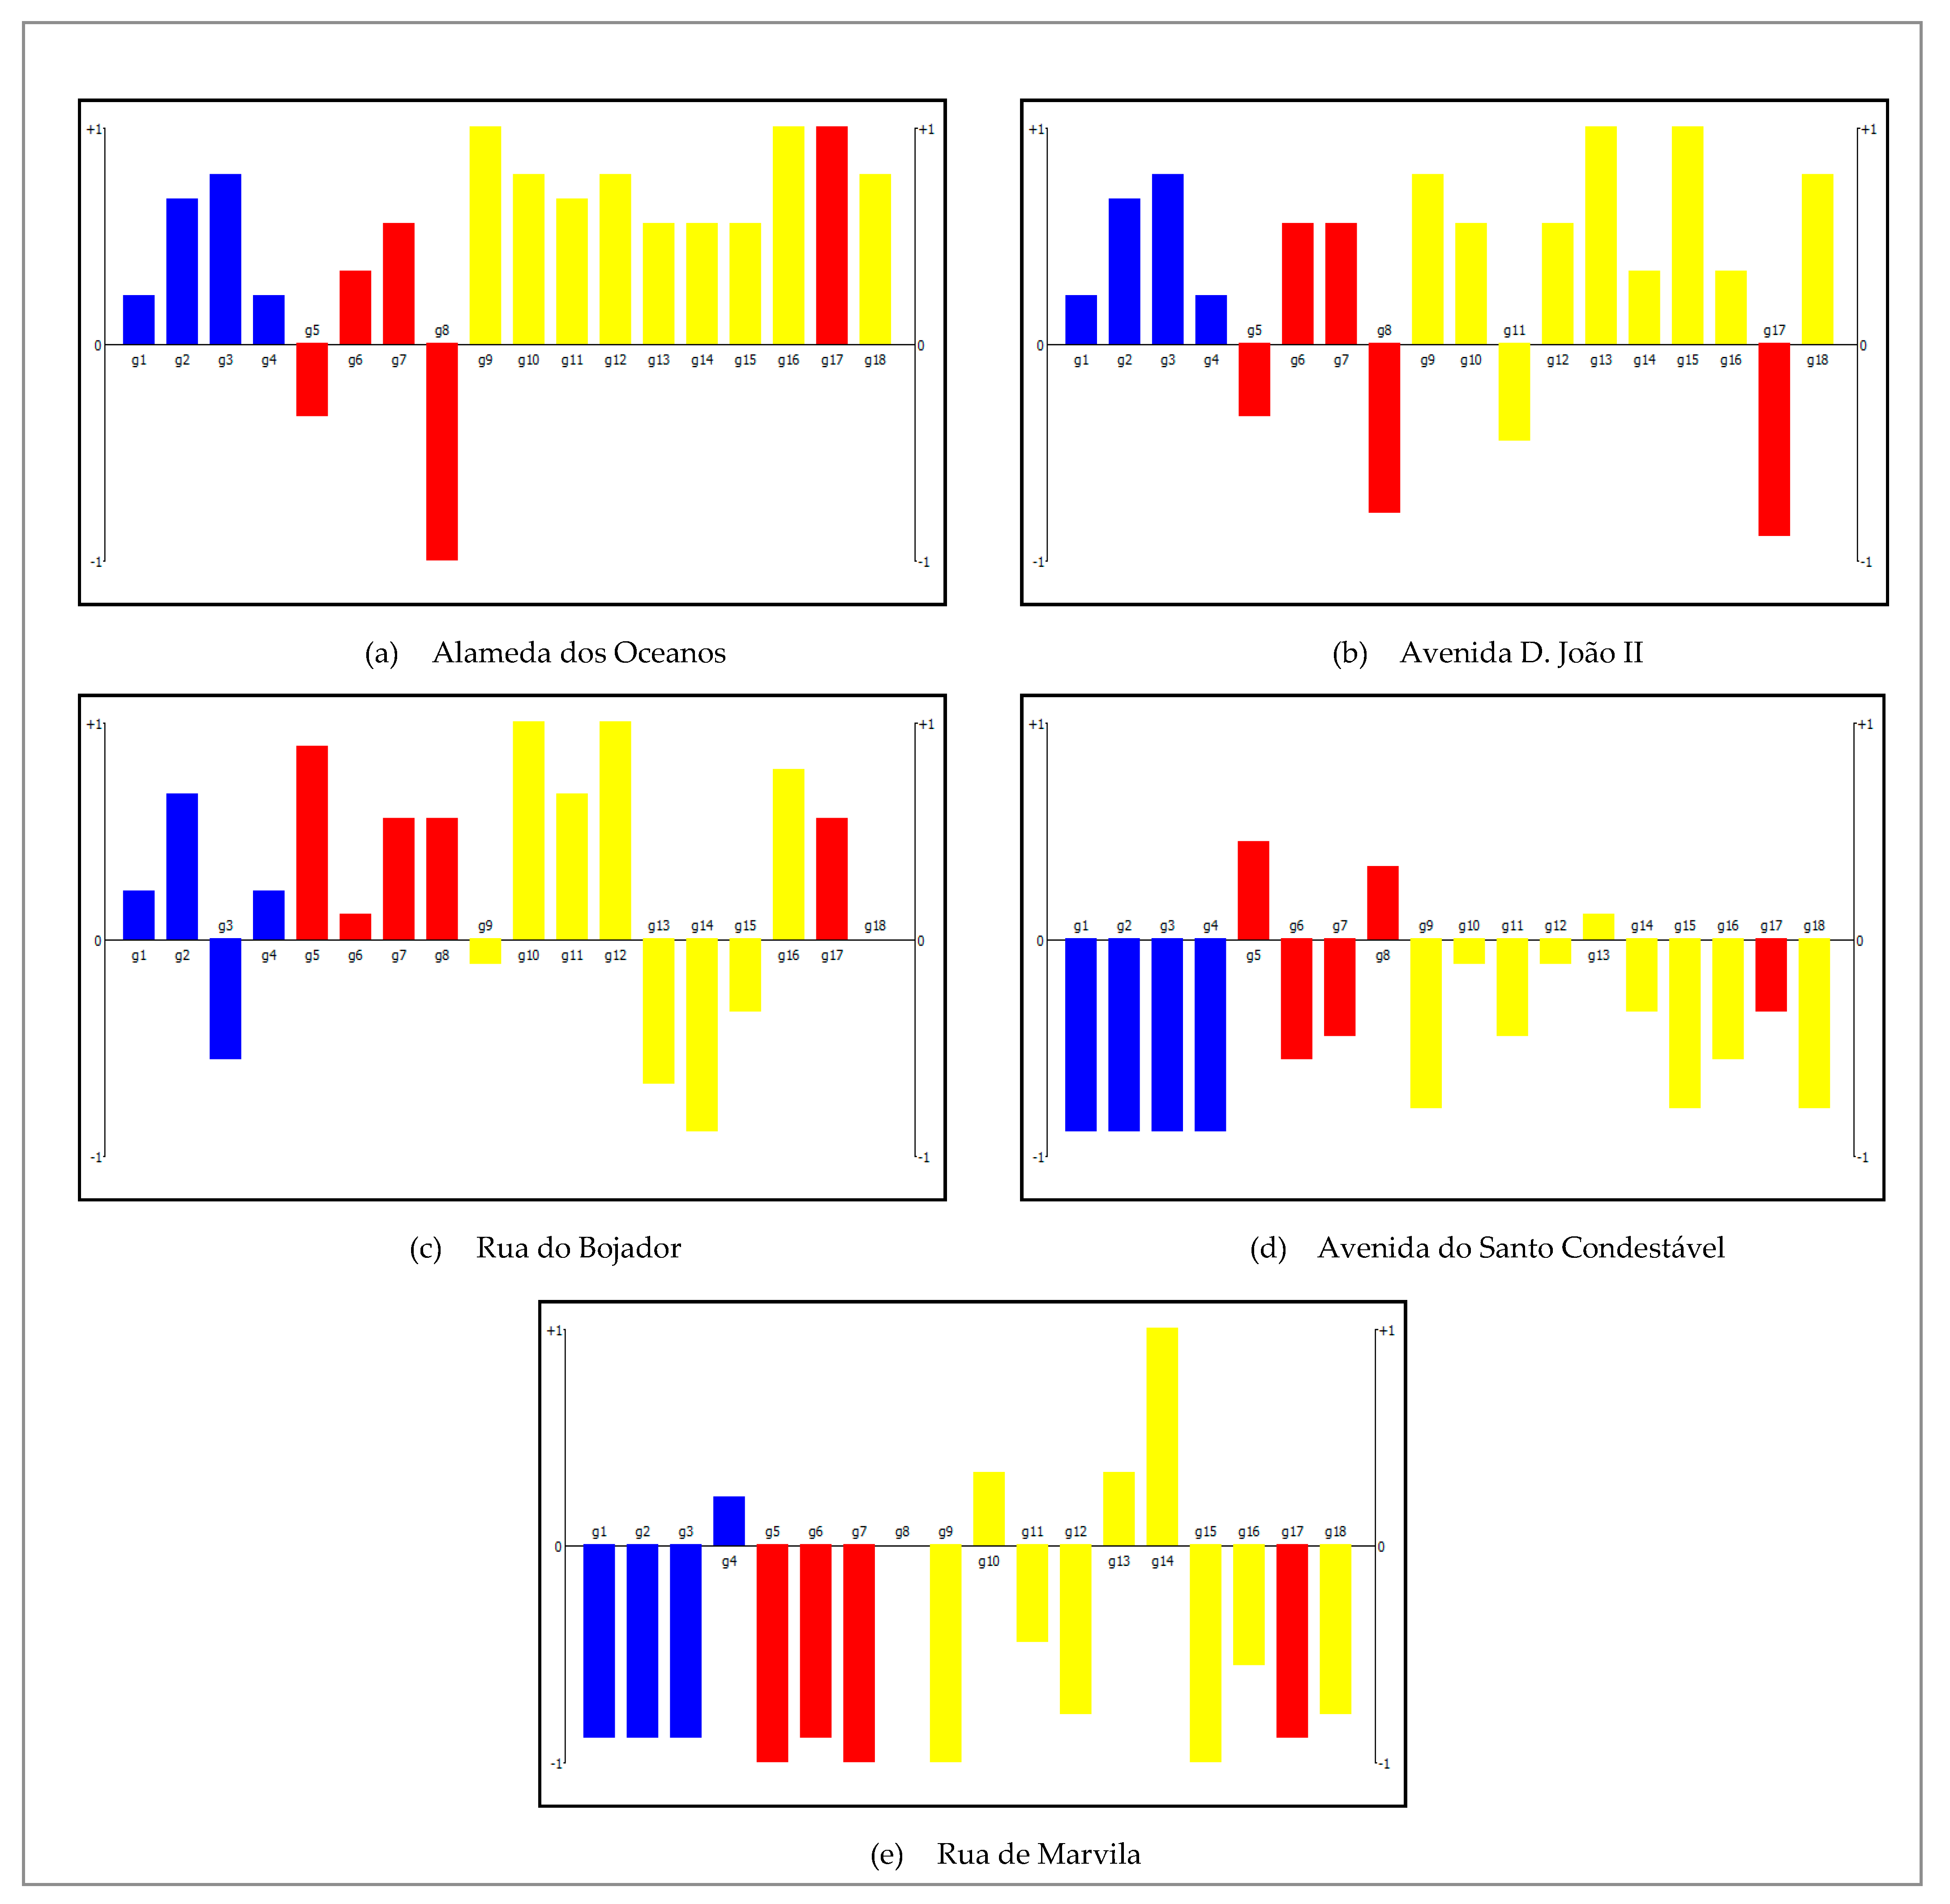
A brief discussion concerning the best three ranked options and the two poorest is now presented. The PROMETHEE action profile of the selected alternatives is presented to enhance the analysis. This visualization category shows a graphical representation of the unicriterion net flow scores for the selected action.
- Alameda dos Oceanos: The outcomes indicate that “Alameda dos Oceanos” has the best ranking among all alternatives. As can be seen in Figure 5, it has 16 strengths and only 2 weaknesses. This result is driven by its outstanding performance in all of the criteria evaluated. For instance, this alternative ranks first in 10 of 18 possible alternatives, representing 55% of the total. Furthermore, it is in second place in four criteria, which means that “Alameda dos Oceanos” performs in at least second place in 78% of all selected criteria. Figure 6 displays the action profile of this alternative. When analyzing the image, it becomes clear that improvements in the road to reduce the vehicle traffic flow (g5) during rush hours and the street’s cleanliness to avoid the presence of litter (g8) must be made.
- Avenida Dom João II: This avenue is in second place in the MCDA. This result is driven by its good performance in some criteria, performing in the first place in seven of 18 possible alternatives, representing 39% of the total. However, it can be noted that this alternative has four weaknesses. After analyzing Figure 6, some improvements are suggested to increase this alternative’s walkability. First, road improvements to reduce the vehicle traffic flow (g5) during rush hours could be made. The presence of litter (g8) also appears as a problem; therefore, the street’s cleanliness should be improved. A green area (e.g., park or square) could be constructed to improve this alternative’s aesthetics levels. This alternative presents only 3% of bike lanes in its extension; therefore, more bikeways could be added (g17).
- Rua do Bojador: This road appears just behind “Avenida D. João II,” i.e., in third place of the MCDA. This alternative is in first place in seven of 18 possible alternatives, representing 39% of the total. Concerning the weaknesses, it presents five (Figure 6). Some improvements are suggested to improve the alternative’s walkability. The sidewalk length could be extended by replacing parking spots by walkable routes (g3). Some parts of this street are treeless and thus more could be planted in the area (g9). More integration with bus transportation should be addressed (g14).
- Avenida do Santo Condestável: This avenue appears as the second-poorest ranked alternative among all. This result is driven by its poor performance in most of the criteria. This alternative is in the last place in seven of 18 possible alternatives, representing 39% of the total Figure 6 depicts the action profile of this alternative, which shows 14 weaknesses. More investment in infrastructure (g1, g2, g3, g4) must be made to improve this alternative’s walkability, since it performs poorly in all criteria related to the condition of the route. Sidewalks should be constructed to improve pedestrian walking quality (g1). This route’s pavement is also of bad quality, and a renovation must be done (g2). More signage (g6) and crosswalks (g7) must be implemented to improve pedestrian safety. More green areas could be incorporated to improve the number of trees (g9, g11) and the presence of shade (g10) in the area. More services could be incorporated into the area to improve pedestrian interest in the route. Finally, the integration with other means of transportation must be improved (g14, g15, g16), mainly buses.
- Rua de Marvila: This alternative appears as the poorest ranking. This result is driven by its poor performance in most of the criteria. This alternative is in last place in 13 of 18 possible alternatives, representing 72% of the total. Many changes must be made to improve the area’s walkability, including for instance, infrastructure investment (installation of sidewalks, signage, maintenance) and integration with other means of transportation. This result is more critical for the reason that this alternative is located in a residential area. Figure 6 shows the action profile of this alternative, which has 13 weaknesses. Despite all of the problems mentioned, it is important to highlight that this alternative has the best performance in terms of bus-stop density (g14); otherwise, the overall performance would be even poorer.
As can be noted, the best-ranked alternatives are located in the Parque das Nações parish. This is a result of the region’s urban renewal. Most of the streets in this area were designed to be pedestrian-friendly. On the other hand, the Marvila region still lacks more infrastructure investment and development. Further, the selected criteria encompass relevant attributes of urban environments. Based on the results, we identified ways to enhance the walkability of the alternatives analyzed, and made suggestions regarding improvement.
Nevertheless, there remains room for further studies and improvements. (i) Scenario analysis could a topic to be addressed in the future. The scenarios could be related to natural features (e.g., greener areas), infrastructure (e.g., pavement quality), region economy (e.g., more restaurants and attractions). To do so, different weights can be applied in the framework’s criteria. This approach could offer more variety to DMs who seek specific solutions for upgrading urban environments. (ii) The scope of this study was to present a framework that could be employed in strategic road planning, and therefore only 10 alternatives were selected. Since the work developed proved to be consistent, a complete mapping of Lisbon’s eastern zone could be undertaken to evaluate the city in an overall walkability scenario—identifying areas that could be improved and which features of those areas could improve. (iii) This work employed the PROMETHEE method as an evaluation tool. However, there are many other methods described in the literature, meaning that future work could explore different MCDA methods in the framework.
6. Conclusions
New strategies to assess the level of walkability quality in urban environments are becoming increasingly important and crucial for sustainable city planning. Walking is directly related to improving the quality of life, taking into account health, social, and environmental aspects. Supported by the findings, this work presents a reliable framework that comprises important metrics for improving streets and public spaces in urban contexts.
The PROMETHEE method was selected as a support tool to implement the multi-criteria analysis mainly because it is an outranking model that allows the use of quantitative and qualitative scales. First, the 18 most suitable criteria for evaluating walkability levels were defined based on the 5Cs layout and literature review. Thereafter, an analysis of the chosen area was carried out to execute the case study. Ten alternative walking routes were chosen and evaluated in the analysis. The choice of criteria and routes was followed by the acquisition of data. The most varied sources were used to obtain the data, such as official sources from the Lisbon municipality, private companies, and open-source applications. QGIS and ArcGIS were used to assess and manipulate a large part of the data.
The last part of the work focused on building the MCDA and implementing the model. For this purpose, the Visual PROMETHEE software was used. From this analysis it was possible to rank the alternatives, in which the “Alameda dos Oceanos” proved to be the best alternative among all, by a large margin. “Avenida Dom João II” and “Rua do Bojador” also obtained favorable results, performing in second and third place, respectively. It is important to highlight that in this case study all of the attributes’ weights were equal as well as the preference function, meaning that the criteria evaluated had the same impact in the final evaluation. However, other DMs could create different scenarios by varying the above-mentioned characteristics. Such a procedure could also be implemented to give more impact value to different criteria.
This work’s greatest contribution is to present a solid framework for the walkability evaluation based on local circumstances and expertise, with the possibility of replicability in other urban contexts. For further studies, we suggest applying different weights to the criteria in order to create different analysis scenarios. Also, a greater number of routes could be analyzed in the future, perhaps carrying out a complete mapping of Lisbon’s eastern zone in walkability rankings. A study evaluating different MCDA methods applied to the same framework developed in this work could also be performed. Finally, a study relating to pedestrians’ density and walkability levels in the streets analyzed could be undertaken to improve the model’s validation.
Author Contributions
Conceptualization, A.O., J.A.M. and M.d.C.N.; methodology, A.O. and J.A.M.; software, A.O. and J.A.M.; validation, J.A.M.; formal analysis, J.A.M.; investigation, J.A.M.; resources, M.d.C.N.; data curation, A.O., J.A.M. and M.d.C.N.; writing—original draft preparation, J.A.M.; writing—review and editing, A.O. and M.d.C.N.; visualization, J.A.M.; supervision, A.O. and M.d.C.N.; project administration, M.d.C.N.; funding acquisition, M.d.C.N. All authors have read and agreed to the published version of the manuscript.
Funding
The Project C-TECH—Climate Driven Technologies for Low Carbon Cities (POCI-01-0247-FEDER-045919 | LISBOA-01-0247-FEDER-045919) leading to this work is co-financed by the ERDF—European Regional Development Fund through the Operational Program for Competitiveness and Internationalization—COMPETE 2020, the Lisbon Portugal Regional Operational Program—LISBOA 2020 and by the Portuguese Foundation for Science and Technology—FCT under MIT Portugal Program.
Institutional Review Board Statement
Not applicable.
Informed Consent Statement
Not applicable.
Data Availability Statement
Data generated are publicly available and cited in accordance with the journal’s guidelines. All data used to support the results, as well as publicly archived data sets, analyzed or generated during the study were cited within the text. There are no ethical, legal, or privacy issues, and there are no limitations in the declaration on data availability.
Conflicts of Interest
The authors declare no conflict of interest.
Appendix A
MCDA methods use different strategies to evaluate a set of alternatives according to multiple criteria for different problems (choice, ranking, sorting). The methods are based on different philosophies and assumptions, namely regarding preference information parameters. Appendix A presents the mathematical approach behind the PROMETHEE method.
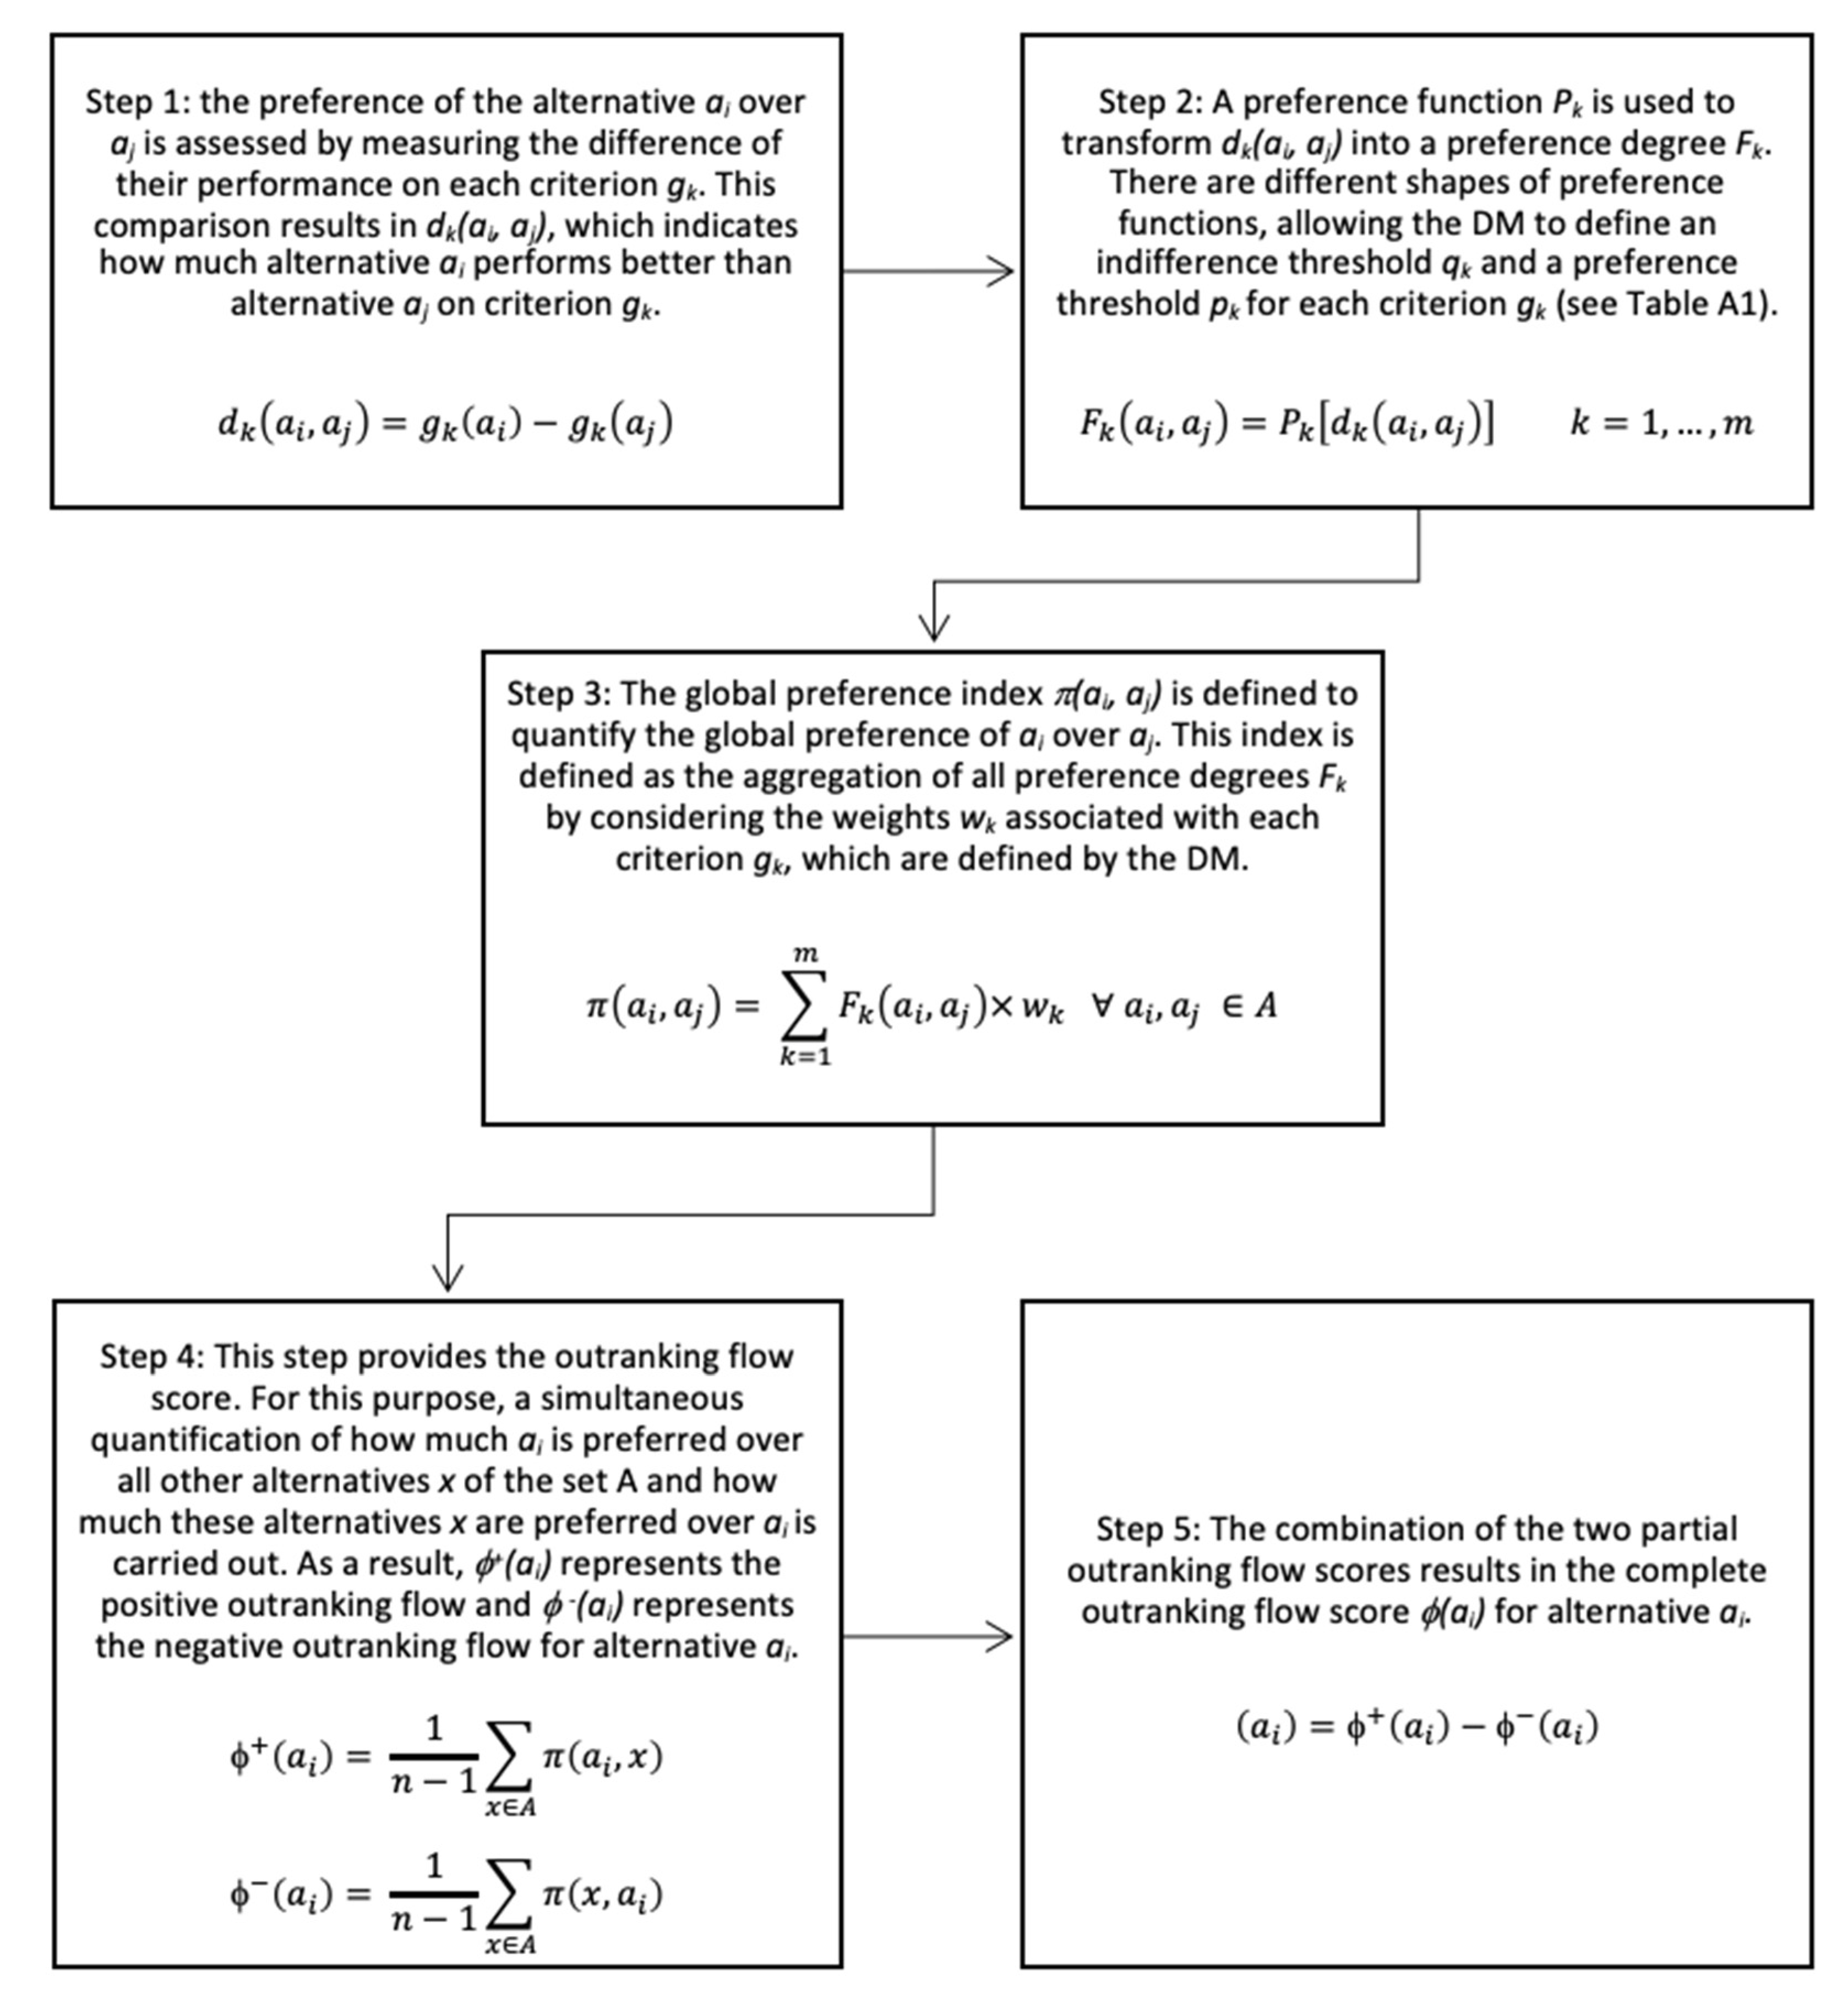
Let A = {a1, …, an} be the set of alternatives and G = {g1, …, gm} the set of evaluation criteria. For each criterion gk, k = 1, …, m, the performance of alternative ai, i = 1, …, n, is evaluated against alternative aj, j = 1, …, n. Taking the set of alternatives and criteria into account, Figure A1 describes the PROMETHEE method step-by-step.
Figure A1.
PROMETHEE method stepwise.

Table A1 shows the preference function shapes used to set the preference and indifference functions.

Table A1.
Preference function shapes. Source: [46].
Table A1.
Preference function shapes. Source: [46].
| Generalized Criterion | Definition | Parameters |
|---|---|---|
 | - | |
 | ||
 | ||
 | , | |
 | , | |
 |
References
- Talen, E. Pedestrian access as a measure of urban quality. Plan. Pract. Res. 2002, 17, 257–278. [Google Scholar] [CrossRef]
- Cutini, V.; Di Pinto, V.; Rinaldi, A.M.; Rossini, F. Proximal cities: Does walkability drive informal settlements? Sustainability 2020, 12, 756. [Google Scholar] [CrossRef] [Green Version]
- Rogers, S.H.; Halstead, J.M.; Gardner, K.H.; Carlson, C.H. Examining Walkability and Social Capital as Indicators of Quality of Life at the Municipal and Neighborhood Scales. Appl. Res. Qual. Life 2011, 6, 201–213. [Google Scholar] [CrossRef]
- Kato, H. Effect of walkability on urban sustainability in the Osaka metropolitan fringe area. Sustainability 2020, 12, 9248. [Google Scholar] [CrossRef]
- Rebecchi, A.; Buffoli, M.; Dettori, M.; Appolloni, L.; Azara, A.; Castiglia, P.; D’Alessandro, D.; Capolongo, S. Walkable environments and healthy urban moves: Urban context features assessment framework experienced in Milan. Sustainability 2019, 11, 2778. [Google Scholar] [CrossRef] [Green Version]
- Eynard, E.; Santangelo, M.; Tabasso, M. Smart City—Planning for Energy, Transportation and Sustainability of the Urban System. In Proceedings of the 8th International Conference INPUT, Naples, Italy, 4–6 June 2014; pp. 365–375. [Google Scholar]
- Gilderbloom, J.I.; Riggs, W.W.; Meares, W.L. Does walkability matter? An examination of walkability’s impact on housing values, foreclosures and crime. Cities 2015, 42, 13–24. [Google Scholar] [CrossRef]
- Kim, E.J.; Kim, H. Neighborhood walkability and housing prices: A correlation study. Sustainability 2020, 12, 593. [Google Scholar] [CrossRef] [Green Version]
- Washington, E. Role of walkability in driving home values. Leadersh. Manag. Eng. 2013, 13, 123–130. [Google Scholar] [CrossRef]
- Pivo, G.; Fisher, J.D. The walkability premium in commercial real estate investments. Real Estate Econ. 2011, 39, 185–219. [Google Scholar] [CrossRef]
- Campisi, T.; Basbas, S.; Skoufas, A.; Akgün, N.; Ticali, D.; Tesoriere, G. The impact of covid-19 pandemic on the resilience of sustainable mobility in Sicily. Sustainability 2020, 12, 8829. [Google Scholar] [CrossRef]
- Saelens, B.E.; Handy, S.L. Built environment correlates of walking: A review. Med. Sci. Sports Exerc. 2008, 40, S550. [Google Scholar] [CrossRef] [PubMed] [Green Version]
- Gondauri, D.; Batiashvili, M. The study of the effects of mobility trends on the statistical models of the covid-19 virus spreading. Electron. J. Gen. Med. 2020, 17, em243. [Google Scholar] [CrossRef]
- Litman, T.A. Economic Value of Walkability. Transp. Res. Rec. 2003, 1828, 3–11. [Google Scholar] [CrossRef] [Green Version]
- Burden, D. Building communities with transportation. Transp. Res. Rec. 2001, 1773, 5–20. [Google Scholar] [CrossRef] [Green Version]
- Leslie, E.; Saelens, B.; Frank, L.; Owen, N.; Bauman, A.; Coffee, N.; Hugo, G. Residents’ perceptions of walkability attributes in objectively different neighbourhoods: A pilot study. Health Place 2005, 11, 227–236. [Google Scholar] [CrossRef]
- Ewing, R.; Handy, S. Measuring the unmeasurable: Urban design qualities related to walkability. J. Urban Des. 2009, 14, 65–84. [Google Scholar] [CrossRef]
- Lo, R.H. Walkability: What is it? J. Urban. 2009, 2, 145–166. [Google Scholar] [CrossRef]
- Eynard, E.; Melis, G.; Tabasso, M. Walkable Urban Environments for Wellbeing: An Analysis of Walkability in the City of Torino. Int. J. Urban Plan. Smart Cities 2020, 1. [Google Scholar] [CrossRef]
- Hall, C.M.; Ram, Y. Walk score® and its potential contribution to the study of active transport and walkability: A critical and systematic review. Transp. Res. Part D Transp. Environ. 2018, 61, 310–324. [Google Scholar] [CrossRef]
- Lefebvre-Ropars, G.; Morency, C.; Singleton, P.A.; Clifton, K.J. Spatial transferability assessment of a composite walkability index: The Pedestrian Index of the Environment (PIE). Transp. Res. Part D Transp. Environ. 2017, 57, 378–391. [Google Scholar] [CrossRef] [Green Version]
- Zegras, C. The built environment and motor vehicle ownership and use: Evidence from Santiago de Chile. Urban Stud. 2010, 47, 1793–1817. [Google Scholar] [CrossRef]
- Vincke, P. Multicriteria decision-aid. J. Multi Criteria Decis. Anal. 1994, 3, 131. [Google Scholar] [CrossRef]
- Munda, G. Multiple Criteria Decision Analysis: State of the Art Surveys; Springer: New York, NY, USA, 2005; Volume 78, ISBN 0-387-23067-X. [Google Scholar]
- Roy, B. Paradigms and challenges. Int. Ser. Oper. Res. Manag. Sci. 2016, 233, 19–39. [Google Scholar] [CrossRef]
- Doan, N.A.V.; De Smet, Y. An alternative weight sensitivity analysis for PROMETHEE II rankings. Omega 2018, 80, 166–174. [Google Scholar] [CrossRef]
- Campos, A.C.S.M.; Mareschal, B.; De Almeida, A.T. Fuzzy FlowSort: An integration of the FlowSort method and Fuzzy Set Theory for decision making on the basis of inaccurate quantitative data. Inf. Sci. 2015, 293, 115–124. [Google Scholar] [CrossRef]
- Calders, T.; Van Assche, D. PROMETHEE is not quadratic: An O(qnlog(n)) algorithm. Omega 2018, 76, 63–69. [Google Scholar] [CrossRef] [Green Version]
- Roy, B. The Outranking Approach and the Foundations of ELECTRE Methods. In Readings in Multiple Criteria Decision Aid; Springer: Berlin/Heidelberg, Germany, 1990; pp. 155–183. [Google Scholar]
- Bouyssou, D.; Vincke, P. Ranking alternatives on the basis of preference relations: A progress report with special emphasis on outranking relations. J. Multi-Criteria Decis. Anal. 1997, 6, 77–85. [Google Scholar] [CrossRef]
- Kim, E.J.; Won, J.; Kim, J. Is Seoul walkable? Assessing a walkability score and examining its relationship with pedestrian satisfaction in Seoul, Korea. Sustainability 2019, 11, 6915. [Google Scholar] [CrossRef] [Green Version]
- Liao, B.; van den Berg, P.E.W.; van Wesemael, P.J.V.; Arentze, T.A. Empirical analysis of walkability using data from the Netherlands. Transp. Res. Part D Transp. Environ. 2020, 85, 102390. [Google Scholar] [CrossRef]
- Dovey, K.; Pafka, E. What is walkability? The urban DMA. Urban Stud. 2020, 57, 93–108. [Google Scholar] [CrossRef]
- Lamíquiz, P.J.; López-Domínguez, J. Effects of built environment on walking at the neighbourhood scale. A new role for street networks by modelling their configurational accessibility? Transp. Res. Part A Policy Pract. 2015, 74, 148–163. [Google Scholar] [CrossRef] [Green Version]
- Gori, S.; Nigro, M.; Petrelli, M. Walkability indicators for pedestrian-friendly design. Transp. Res. Rec. 2014, 2464, 38–45. [Google Scholar] [CrossRef]
- Hall, C.M.; Ram, Y. Measuring the relationship between tourism and walkability? Walk Score and English tourist attractions. J. Sustain. Tour. 2019, 27, 223–240. [Google Scholar] [CrossRef]
- Distefano, N.; Pulvirenti, G.; Leonardi, S. Neighbourhood walkability: Elderly’s priorities. Res. Transp. Bus. Manag. 2020, 100547. [Google Scholar] [CrossRef]
- Kim, E.J.; Kim, Y.J. A Reliability check of walkability indices in Seoul, Korea. Sustainability 2020, 12, 176. [Google Scholar] [CrossRef] [Green Version]
- Pelegrina, G.D.; Duarte, L.T.; Romano, J.M.T. Application of independent component analysis and TOPSIS to deal with dependent criteria in multicriteria decision problems. Expert Syst. Appl. 2019, 122, 262–280. [Google Scholar] [CrossRef] [Green Version]
- Naharudin, N.; Salleh, A.H.; Halim, M.A.; Latif, Z.A. Conceptual Framework for Walkability Assessment for Pedestrian Access to Rail Transit Services by using Spatial-MCDA. IOP Conf. Ser. Earth Environ. Sci. 2020, 540, 012023. [Google Scholar] [CrossRef]
- Ruiz-Padillo, A.; Pasqual, F.M.; Larranaga Uriarte, A.M.; Cybis, H.B.B. Application of multi-criteria decision analysis methods for assessing walkability: A case study in Porto Alegre, Brazil. Transp. Res. Part D Transp. Environ. 2018, 63, 855–871. [Google Scholar] [CrossRef]
- Fancello, G.; Congiu, T.; Tsoukiàs, A. Mapping walkability. A subjective value theory approach. Socioecon. Plann. Sci. 2020, 72, 100923. [Google Scholar] [CrossRef]
- Moura, F.; Cambra, P.; Gonçalves, A.B. Measuring walkability for distinct pedestrian groups with a participatory assessment method: A case study in Lisbon. Landsc. Urban Plan. 2017, 157, 282–296. [Google Scholar] [CrossRef]
- Alshareef, F.; Aljoufie, M. Identification of the proper criteria set for neighborhood walkability using the fuzzy analytic hierarchy process model: A case study in Jeddah, Saudi Arabia. Sustainability 2020, 12, 9286. [Google Scholar] [CrossRef]
- Keeney, R.L.; Raiffa, H. Decisions with Multiple Objectives–Preferences and Value Tradeoffs; Cambridge University Press: Cambridge, UK; New York, NY, USA, 1994; Volume 39. [Google Scholar]
- De Smet, Y. Beyond Multicriteria Ranking Problems: The Case of PROMETHEE. In New Perspectives in Multiple Criteria Decision Making; Doumpos, M., Rui Figueira, J., Greco, S., Zopounidis, C., Eds.; Springer: Cham, Switzerland, 2019; pp. 95–115. ISBN 978-3-030-11481-7. [Google Scholar]
Figure 1.
Framework process flow chart.

Figure 2.
Tree of fundamental objectives.

Figure 3.
Geographical location of the selected alternatives.

Figure 4.
Diamond representation of the case study’s results.

Figure 5.
Rainbow representation of the case study’s results.

Figure 6.
PROMETHEE’s action profile of the alternatives.

Table 1.
Selected Alternatives.
| Ref. | Alternative | Zone | Area (km2) |
|---|---|---|---|
| a1 | Alameda dos Oceanos | Parque das Nações | 0.2173 |
| a2 | Avenida de Berlim | Parque das Nações | 0.0428 |
| a3 | Avenida do Santo Condestável | Marvila | 0.2508 |
| a4 | Avenida Dom João II | Parque das Nações | 0.1225 |
| a5 | Avenida João Paulo II | Marvila | 0.0458 |
| a6 | Avenida Marechal Gomes da Costa | Marvila | 0.3193 |
| a7 | Passeio Báltico | Parque das Nações | 0.0383 |
| a8 | Passeio do Tejo | Parque das Nações | 0.0616 |
| a9 | Rua de Marvila | Marvila | 0.0175 |
| a10 | Rua do Bojador | Parque das Nações | 0.0889 |
Table 2.
Criteria summary.
| Ref. | Attribute | Description | Unit | Source |
|---|---|---|---|---|
| g1 | Presence of sidewalk | Presence of sidewalk on the route. | Y/N | Google Street View |
| g2 | Ground conditions | Quality of project, construction, and maintenance of the pavement | Good, Medium, Bad | Minha Rua LX |
| g3 | Pavement width | Effective pavement width for walking. | Large, Medium, Narrow, Inexistent | Google Street View |
| g4 | Slope | Inclination of the street, particularly of the pavement | High, Medium, Flat | Lisboa Aberta |
| g5 | Vehicle traffic flow | Pedestrians’ sense of safety while walking in the neighborhood, due to the presence of high vehicle traffic flow | High, Medium, Low | Waze |
| g6 | No. crosswalks | Number of crosswalks on the route | [number/m2] | Google Street View |
| g7 | Signage | Pedestrians’ sense of safety due to the presence of signage (transit board, information) | High, Medium, Low | Minha Rua LX |
| g8 | Presence of litter | Presence of litter on the route | Number of occurrences | Minha Rua LX |
| g9 | No. trees | Number of trees in the route area | [number/m2] | Lisboa Aberta |
| g10 | Shade | Presence of shade in the route area | % total area | Lisboa Aberta |
| g11 | Natural areas | Presence of natural areas (parks, squares) in the route area | Y/N | Lisboa Aberta |
| g12 | No. shopping and services | Number of shops and services on the route (bakeries, markets, pharmacies, restaurants, bars) | [number/m2] | Lisboa Aberta |
| g13 | No. tourist establishments | Number of tourist establishments on the route (museums, hotels, sightseeing spots, points of interest) | [number/m2] | Lisboa Aberta |
| g14 | Bus stops | Presence of bus stops | [number/m2] | Lisboa Aberta |
| g15 | Subway station distance | Distance of the nearest subway station | [km] | Lisboa Aberta |
| g16 | Bike-sharing stations | Number of bicycle-sharing stations in the street | [number/m2] | Gira |
| g17 | Bike lanes | Percentage of the route that presents bicycle lanes | % total length | Lisboa Aberta |
| g18 | Street connectivity | Density of routes that the selected street is connected with | High, Medium, Low | Google Street View |
Table 3.
Data acquired to perform the MCDA study.
| a1 | a2 | a3 | a4 | a5 | a6 | a7 | a8 | a9 | a10 | |
|---|---|---|---|---|---|---|---|---|---|---|
| g1 | y | y | n | y | y | y | y | y | n | y |
| g2 | Good | Medium | Bad | Good | Medium | Medium | Medium | Good | Bad | Good |
| g3 | Large | Medium | Non-existent | Large | Narrow | Narrow | Large | Large | Non-existent | Medium |
| g4 | Flat | Flat | High | Flat | Flat | High | Flat | Flat | Flat | Flat |
| g5 | Medium | Medium | Low | Medium | Medium | Low | Medium | None | High | None |
| g6 | 7.05 | 7.31 | 0.41 | 7.11 | 11.06 | 1.58 | 3.75 | 0 | 0 | 7 |
| g7 | Good | Medium | Medium | Good | Medium | Medium | Good | Good | Bad | Good |
| g8 | 109 | 49 | 21 | 82 | 33 | 25 | 0 | 6 | 25 | 20 |
| g9 | 7 | 1.5 | 0 | 5.6 | 1.9 | 0.5 | 4.1 | 0.6 | 0 | 1.1 |
| g10 | 91.68 | 39.01 | 76.14 | 89.2 | 81.72 | 56.87 | 71.07 | 63.86 | 83.32 | 99.4 |
| g11 | y | n | n | n | n | y | n | y | n | y |
| g12 | 0.16 | 0 | 0.01 | 0.09 | 0.07 | 0.01 | 0 | 0.06 | 0 | 0.27 |
| g13 | 0.07 | 0 | 0.03 | 0.63 | 0 | 0.02 | 0.1 | 0 | 0.06 | 0 |
| g14 | 3.52 | 0.81 | 1.25 | 2.99 | 6.63 | 2.53 | 0 | 1.33 | 9.87 | 0 |
| g15 | 0.35 | 0.35 | 1.9 | 0.3 | 0.95 | 0.35 | 0.65 | 1.6 | 2.1 | 1.3 |
| g16 | 8.52 | 0.81 | 0 | 0.74 | 0 | 0 | 0 | 0.66 | 0 | 5.84 |
| g17 | 100 | 47 | 3 | 0 | 18 | 11 | 1 | 27 | 0 | 30 |
| g18 | High | Medium | Low | High | High | Medium | Medium | Low | Low | Medium |
Table 4.
Flow table results for the case study.
| Ranking | Action | ϕ | ϕ+ | ϕ− |
|---|---|---|---|---|
| 1 | Alameda dos Oceanos | 0.5062 | 0.6481 | 0.142 |
| 2 | Avenida Dom João II | 0.3272 | 0.5556 | 0.2284 |
| 3 | Rua do Bojador | 0.2593 | 0.5309 | 0.2716 |
| 4 | Passeio do Tejo | 0.0802 | 0.4383 | 0.358 |
| 5 | Avenida João Paulo II | 0.0432 | 0.3951 | 0.3519 |
| 6 | Passeio Báltico | −0.0432 | 0.3457 | 0.3889 |
| 7 | Av. de Berlim | −0.0988 | 0.321 | 0.4198 |
| 8 | Av. Marechal Gomes da Costa | −0.1296 | 0.3395 | 0.4691 |
| 9 | Av. do Santo Condestável | −0.4383 | 0.2222 | 0.6605 |
| 10 | Rua de Marvila | −0.5062 | 0.1667 | 0.6728 |
Publisher’s Note: MDPI stays neutral with regard to jurisdictional claims in published maps and institutional affiliations. |
© 2021 by the authors. Licensee MDPI, Basel, Switzerland. This article is an open access article distributed under the terms and conditions of the Creative Commons Attribution (CC BY) license (http://creativecommons.org/licenses/by/4.0/).
Share and Cite
MDPI and ACS Style
Manzolli, J.A.; Oliveira, A.; Neto, M.d.C. Evaluating Walkability through a Multi-Criteria Decision Analysis Approach: A Lisbon Case Study. Sustainability 2021, 13, 1450. https://0-doi-org.brum.beds.ac.uk/10.3390/su13031450
AMA Style
Manzolli JA, Oliveira A, Neto MdC. Evaluating Walkability through a Multi-Criteria Decision Analysis Approach: A Lisbon Case Study. Sustainability. 2021; 13(3):1450. https://0-doi-org.brum.beds.ac.uk/10.3390/su13031450
Chicago/Turabian StyleManzolli, Jônatas Augusto, André Oliveira, and Miguel de Castro Neto. 2021. "Evaluating Walkability through a Multi-Criteria Decision Analysis Approach: A Lisbon Case Study" Sustainability 13, no. 3: 1450. https://0-doi-org.brum.beds.ac.uk/10.3390/su13031450
Note that from the first issue of 2016, this journal uses article numbers instead of page numbers. See further details here.