1. Introduction
Hazardous chemical transportation accidents are different from other types of transportation accidents because they usually cause serious consequences, such as burning, explosion, and leakage, resulting in social problems, such as economic losses, environmental pollution, ecological damage, and injury [
1].
There are models for accident cause analysis, such as the Swiss cheese model [
2,
3], human factor analysis and classification system (HFACS) [
4], 24Model [
5], functional resonance analysis method (FRAM) [
6], accident map (Accimap) model [
7], cognitive reliability and error analysis method (CREAM) [
8], job demands resources (JD-R) model proposed [
9], and systems-theoretic accident model and process (STAMP) model [
10].
Both the 24Model and CREAM are systematic accident causation and modular models. The 24Model regards the organization where the accident occurs as a system, the safety culture and safety management system as contact media. Additionally, it reflects their interactions in a simple linear relationship that reflects the actual situation of complex systems [
11,
12]. In addition, the 24Model distinguishes organizational behavior from personal behavior. The former is the radical cause and root cause of the accident, while the latter is the immediate or indirect cause of the accident. The 24Model provides a systematic framework for accident analysis. The CREAM model focuses on the mechanism of human behavior. By describing the accident path through the system network structure, the qualitative analysis of human factors and the quantitative prediction of human error probability can be carried out. In some cases, it also includes studies of the possibility of human error in human observation, diagnosis, decision making, and other cognitive activities. Its unique cognitive model and framework provide a two-way analysis of tracking performance predictions, the “consequence–antecedent list” enables researchers to track the root cause of human error events, and each cause category has specific details.
The 24Model does provide a clear but not detailed classification of accident causes, although it provides a framework for cause analysis. Analysts may be limited by their own level and subjective consciousness to influence the analysis results in this framework. The CREAM provides a specific cause classification; however, when analyzing specific industries, analysts need expertise to choose the appropriate antecedent–consequence classification. The 24Model and CREAM represent two different accident analysis model characteristics; therefore, this paper tries to discover whether the accident results obtained by these two models have different emphases.
Gray correlation analysis and regression analysis were chosen to further investigate the accident analysis results of the two models. Gray correlation analysis is a common analysis method used to determine the degree of correlation among variables, and is used in fault diagnosis, optimal solution selection, and stability evaluation of projects [
13,
14,
15]. Regression analysis is a statistical method used to determine the relationship among variables, and trend prediction analysis to determine the distribution type of variables and clarify the correlation among influencing factors [
16,
17].
Based on this, the paper studied the characteristics and differences between the 24Model and CREAM in the hazardous chemical transportation accident analysis, and gave quantitative results using gray correlation analysis and regression analysis.
2. Material and Methods
The 24Model was first proposed in 2005 [
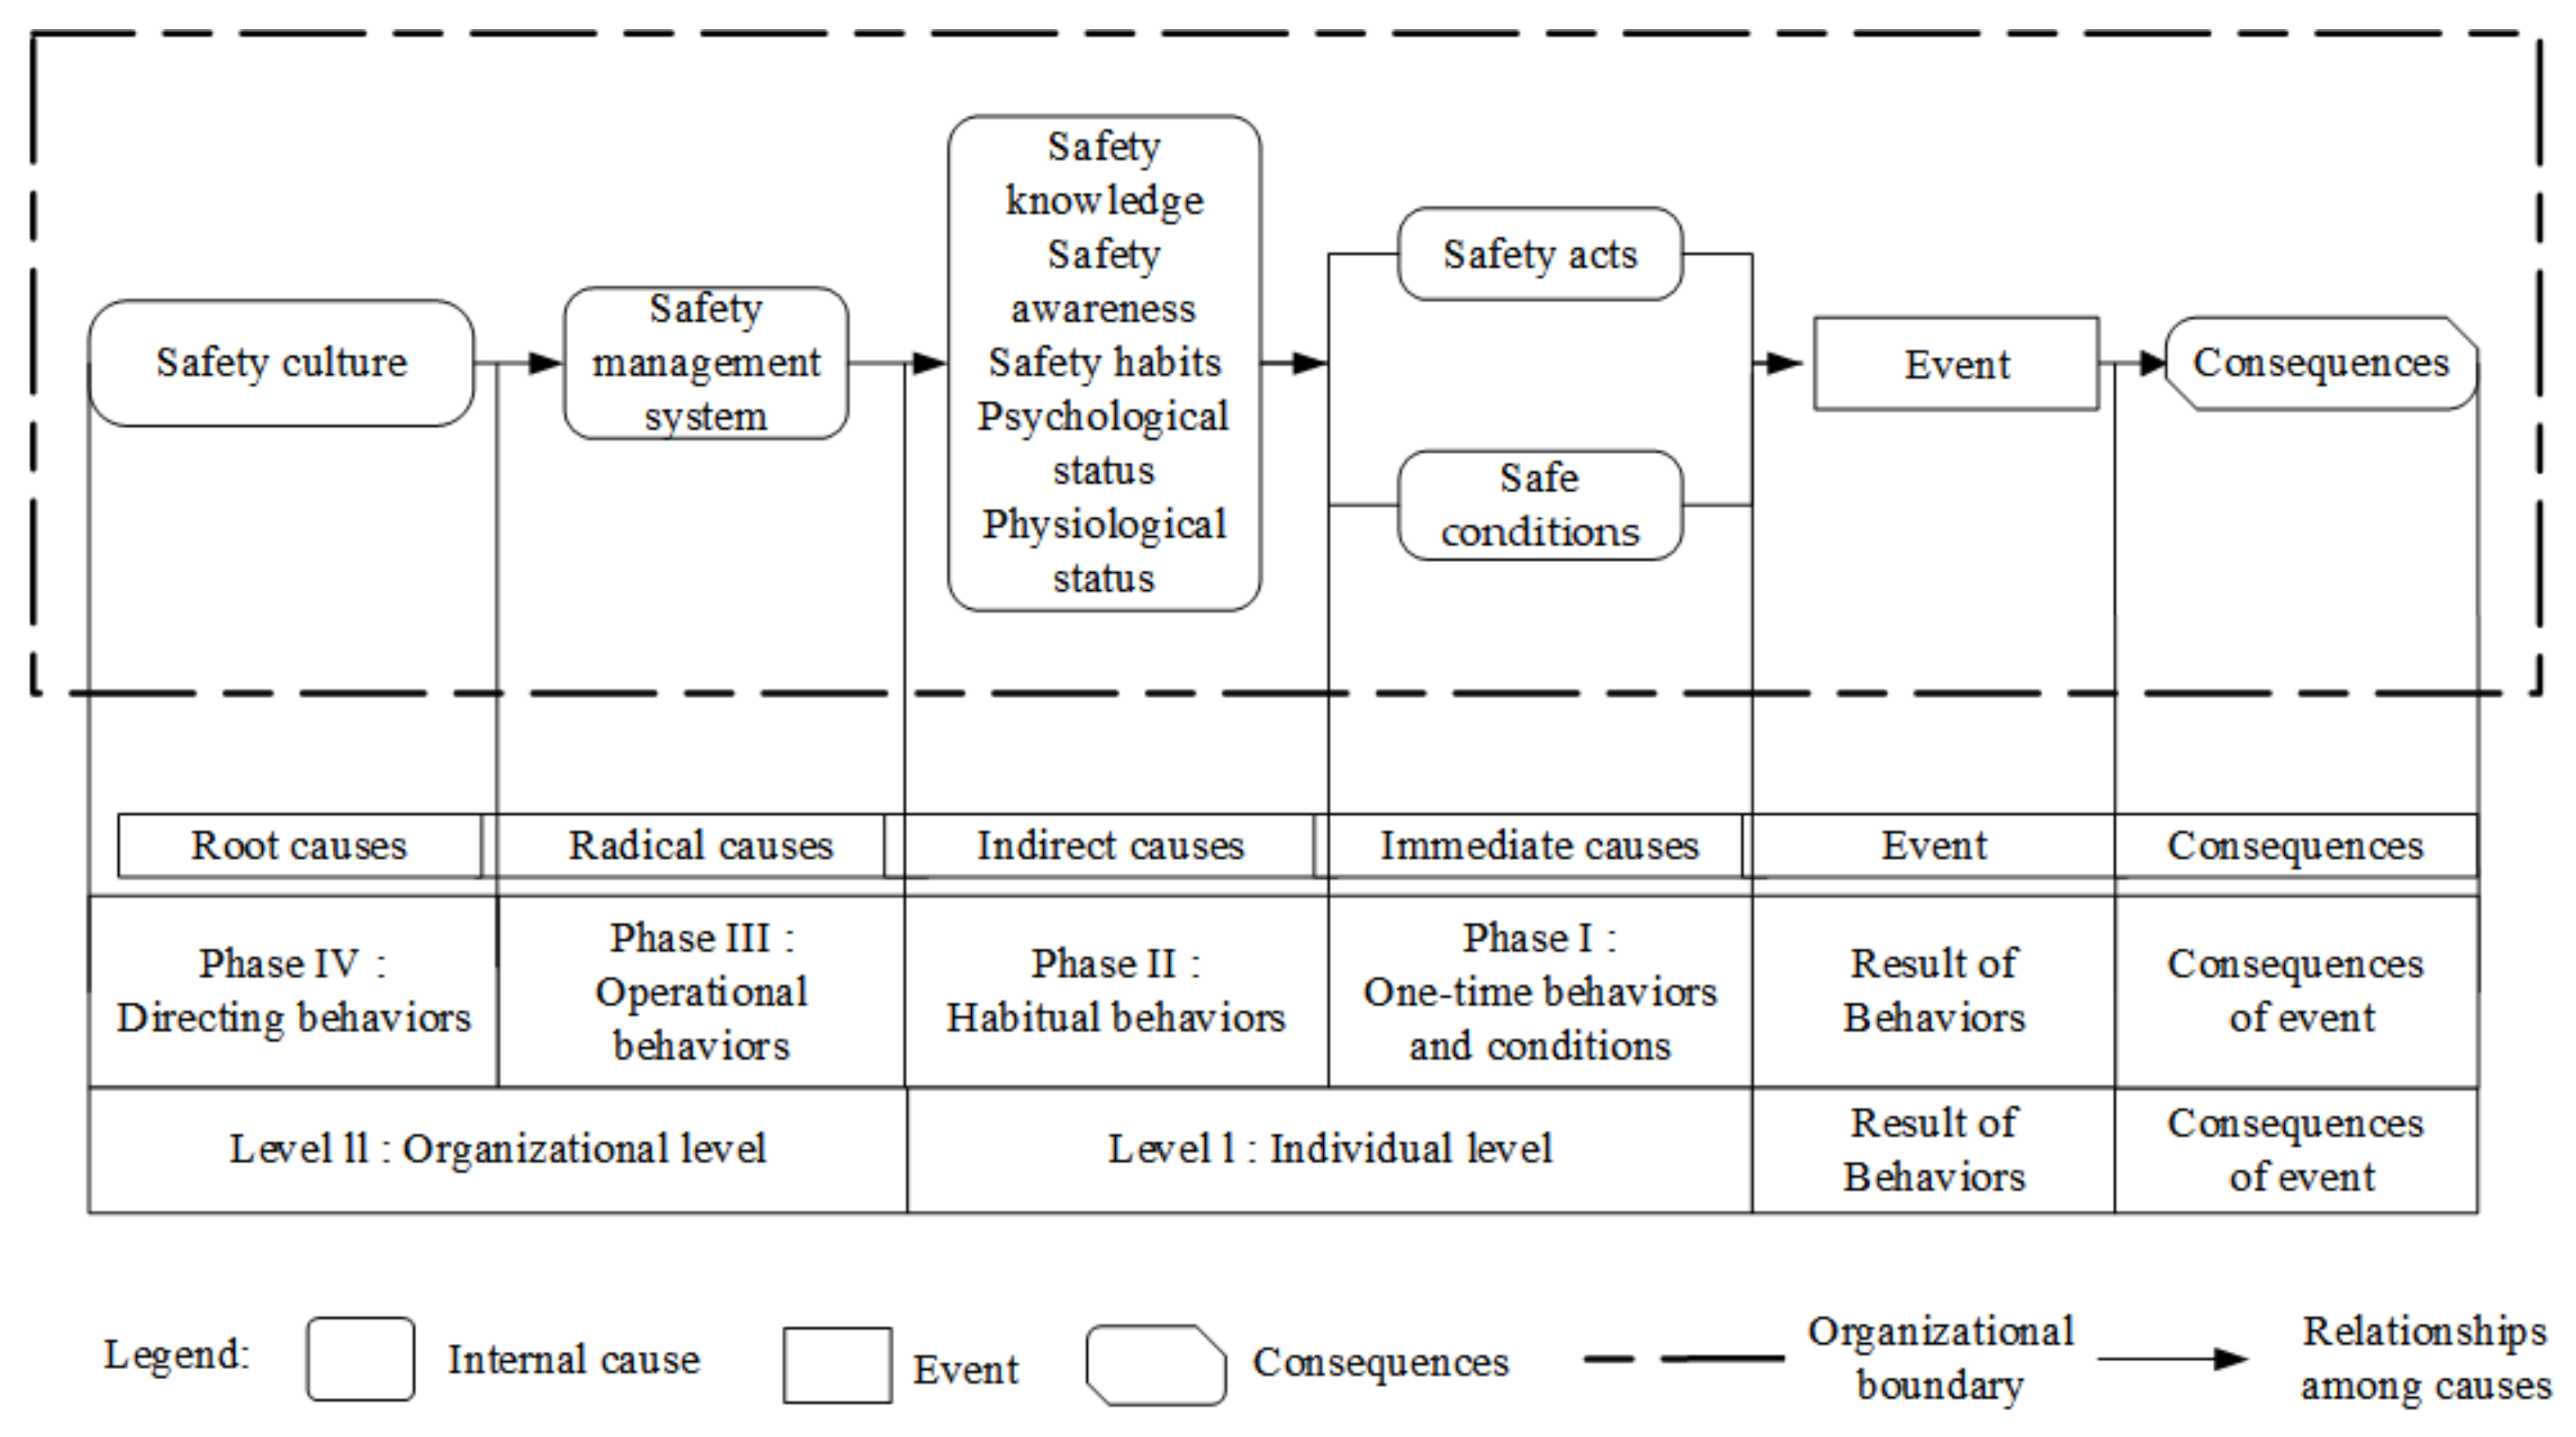
5], and the fifth edition was published in 2019, shown in
Figure 1. The 24Model classifies accidents as having organizational causes, arguing that any accident occurs at least within an organization, and further divides accident causes into internal and external levels. Internal level includes organizational behaviors and individual behaviors. Organizational behaviors can be further divided into two stages, safety culture (root cause) and safety management system (radical cause). Individual behaviors include habitual behaviors (indirect cause), one-time behaviors, and conditions (immediate cause). Root cause, radical cause, indirect cause, and immediate cause were linked together to form the 24Model. By applying the 24Model, the immediate causes, indirect causes, radical causes, and root causes can be gradually deduced from the occurrence of an accident. The immediate causes of the accident are unsafe acts and unsafe conditions; the indirect causes are knowledge, psychology, consciousness, habits, and physiology; the radical causes are the safety management system; and the root causes are the safety culture.
The 24Model describes the accident path as a system network structure, covering a clear classification and comprehensive accident causes. Its analysis process is simple and easy to analyze accident causal factors and enables effective analysis of individual and organizational behaviors in accident causal factors divided. However, the analysis results are relatively broad and weakly targeted, and the model description in the probabilistic analysis of accident causes needs to be further enhanced [
18,
19].
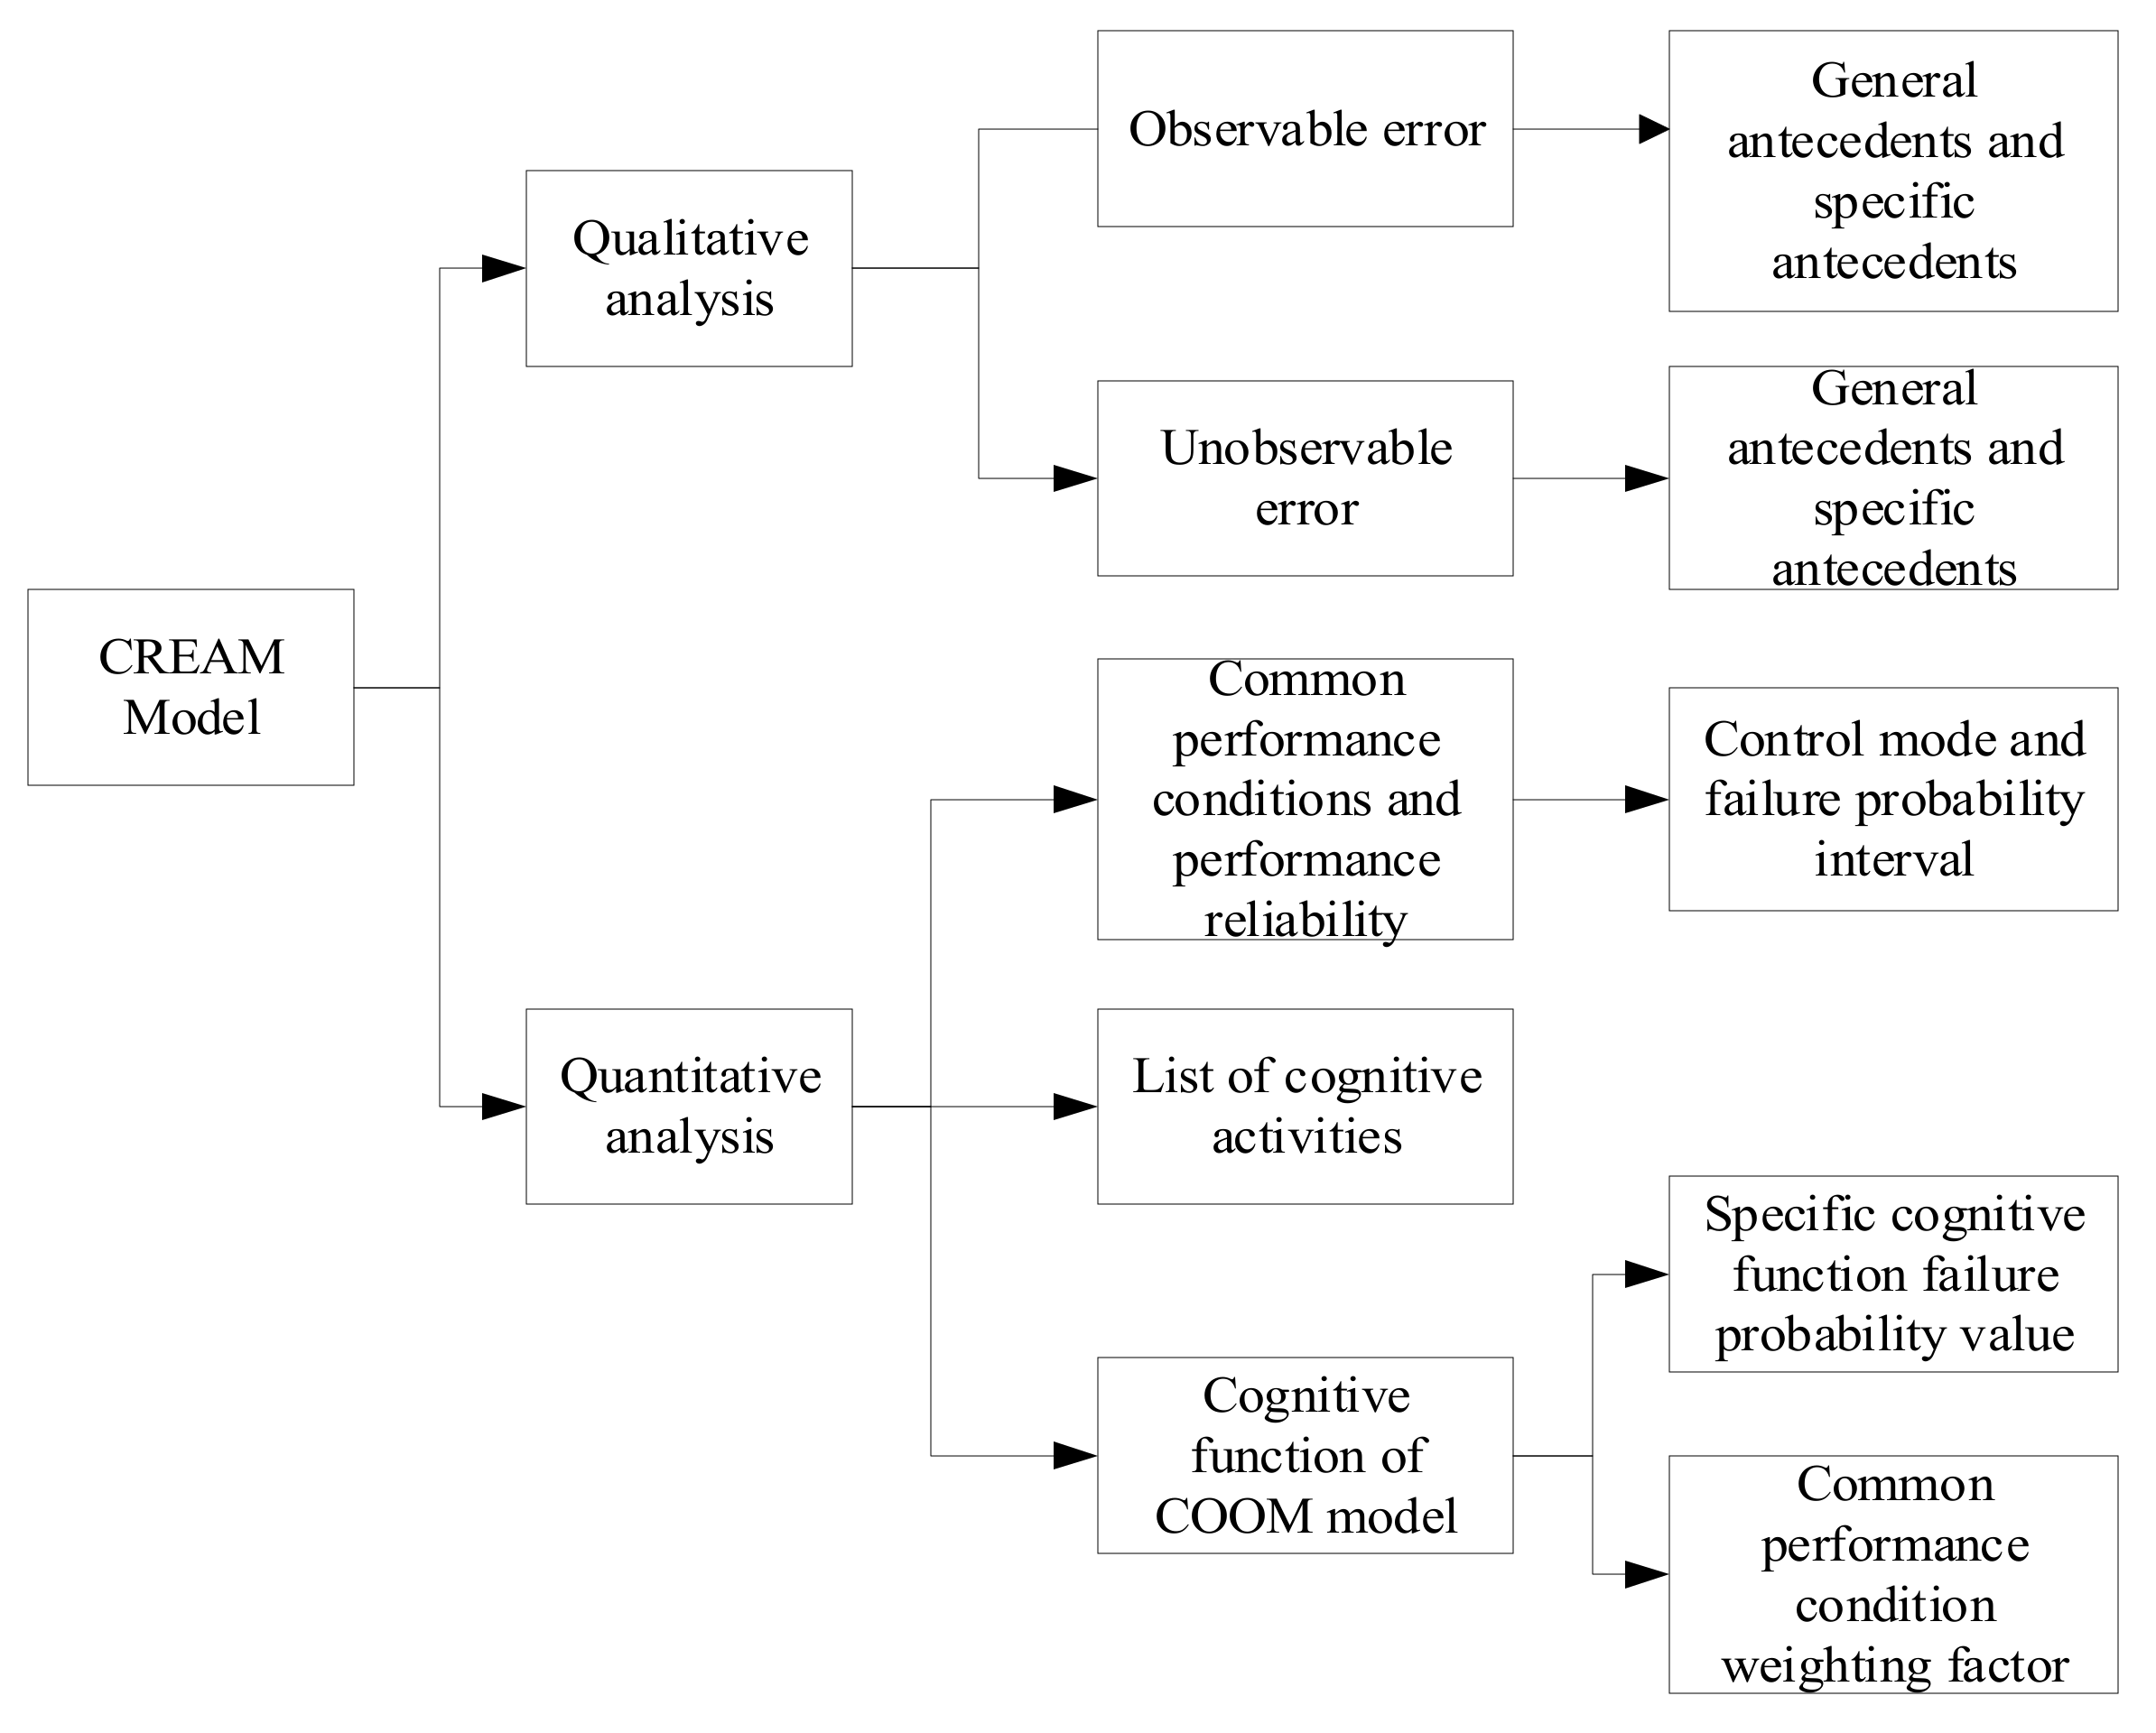
The cognitive reliability and error analysis method (CREAM) is developed based on the systematic criticism of traditional HRA (human reliability analysis, referring to the quantitative or qualitative assessment of human errors that affect the availability or operational reliability of engineered safety features and components) principles and methods [
8]. Its core ideas include general performance conditions, observable and unobservable errors, cyclic behavior models, human cognition, control modes, and bidirectional functions [
20]. The CREAM model’s contents are shown in
Figure 2.
The CREAM is a critical tool for the reliability of human factor analysis, performing qualitative analysis of human factors, and quantitative prediction of human error probability. In the field of human factor reliability analysis, the CREAM model has important significance [
21,
22]. However, the analysis takes human-caused errors as the starting point, having a higher demand for analysts in the quantitative prediction part of the process, which may be less efficient when applied in practice. In addition, when tracing the CREAM accident cause, a new antecedent–consequence classification table needs to be recreated for different areas, and the original cause classification is not detailed enough to obtain a more comprehensive cause [
23].
To make the accident analysis more comprehensive, 30 cases were collected from the Ministry of Emergency Management of the People’s Republic of China, Provincial Emergency Department (Bureau), China Chemical Safety Association, Registration Center for Chemicals of the Ministry of Emergency Management, other websites, and related papers and books to establish a sample database. The case contains four levels, including general, serious, major, and particularly serious hazardous chemical transportation accidents from 2000 to 2018. The criteria for the four levels are based on the Chinese law: Report on production safety accident and regulations of investigation and treatment [
24]. The specific accident classification criteria are shown in
Table 1. Any aspect that meets the criteria for a more serious accident level will result in the accident being classified as more serious. For example, an accident with fewer than 30 fatalities but with direct economic losses greater than RMB 100 million would be classified as a particularly serious accident. Therefore, some particularly serious accidents do not have as many fatalities as major accidents, but are classified as particularly serious accidents because of the economic losses or serious injuries, meeting the criteria for a special major accident.
According to the China Chemical Accident Information Network, there were 2475 hazardous chemical transportation accidents in China during 2000–2018, of which 2421 were below general accident (did not result in fatalities or caused minimal economic losses), 29 were general accidents, 14 were serious accidents, 5 were major accidents, and 6 were particularly serious accidents. Among them, 2421 below general accidents did not have an accident investigation report and could not be studied in further depth. For the remaining accidents, due to the fact that some accidents occurred long ago and information is missing or less influential, this paper finally selected 30 hazardous chemical transportation accidents with complete information of accident investigation reports and more influential or serious losses. All the valuable cases that could be collected were gathered as much as possible.
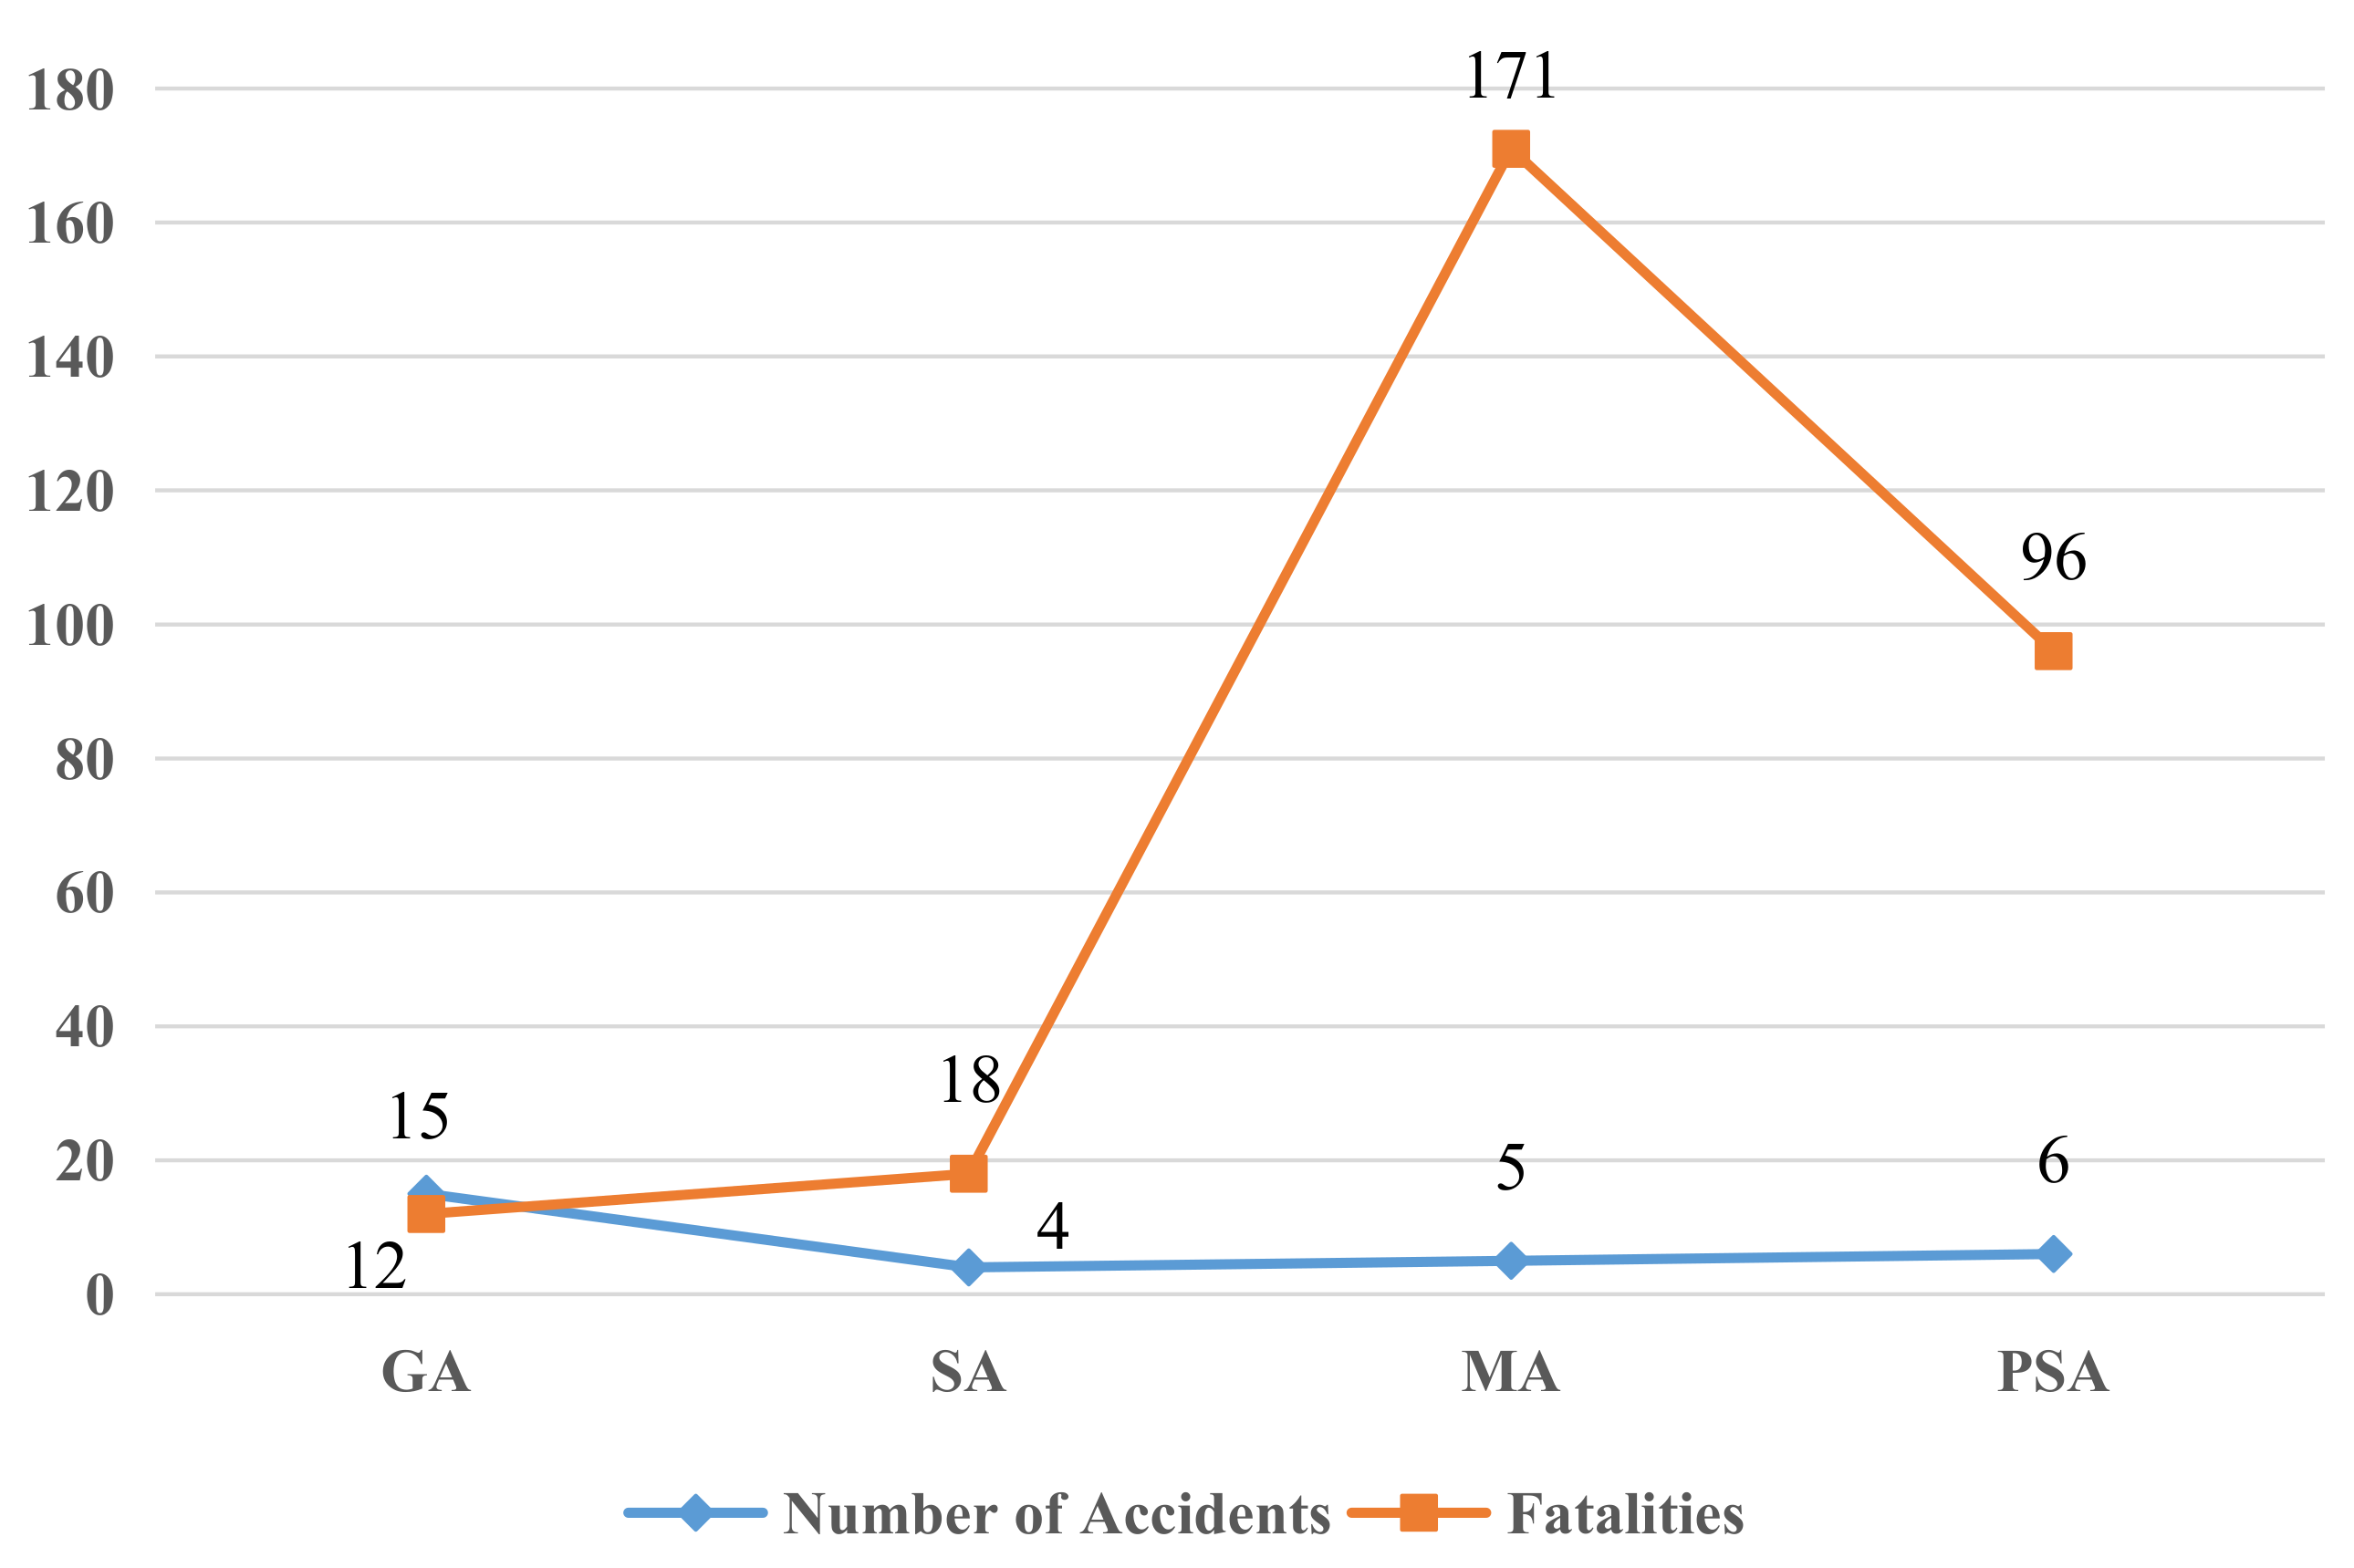
In 30 accidents, 297 people died in total. Among them, there were 6 particularly serious accidents with 96 deaths, 5 major accidents with 171 deaths, 4 serious accidents with 18 deaths, and 15 general accidents with 12 deaths.
Figure 3 shows the number of accidents and fatalities, and
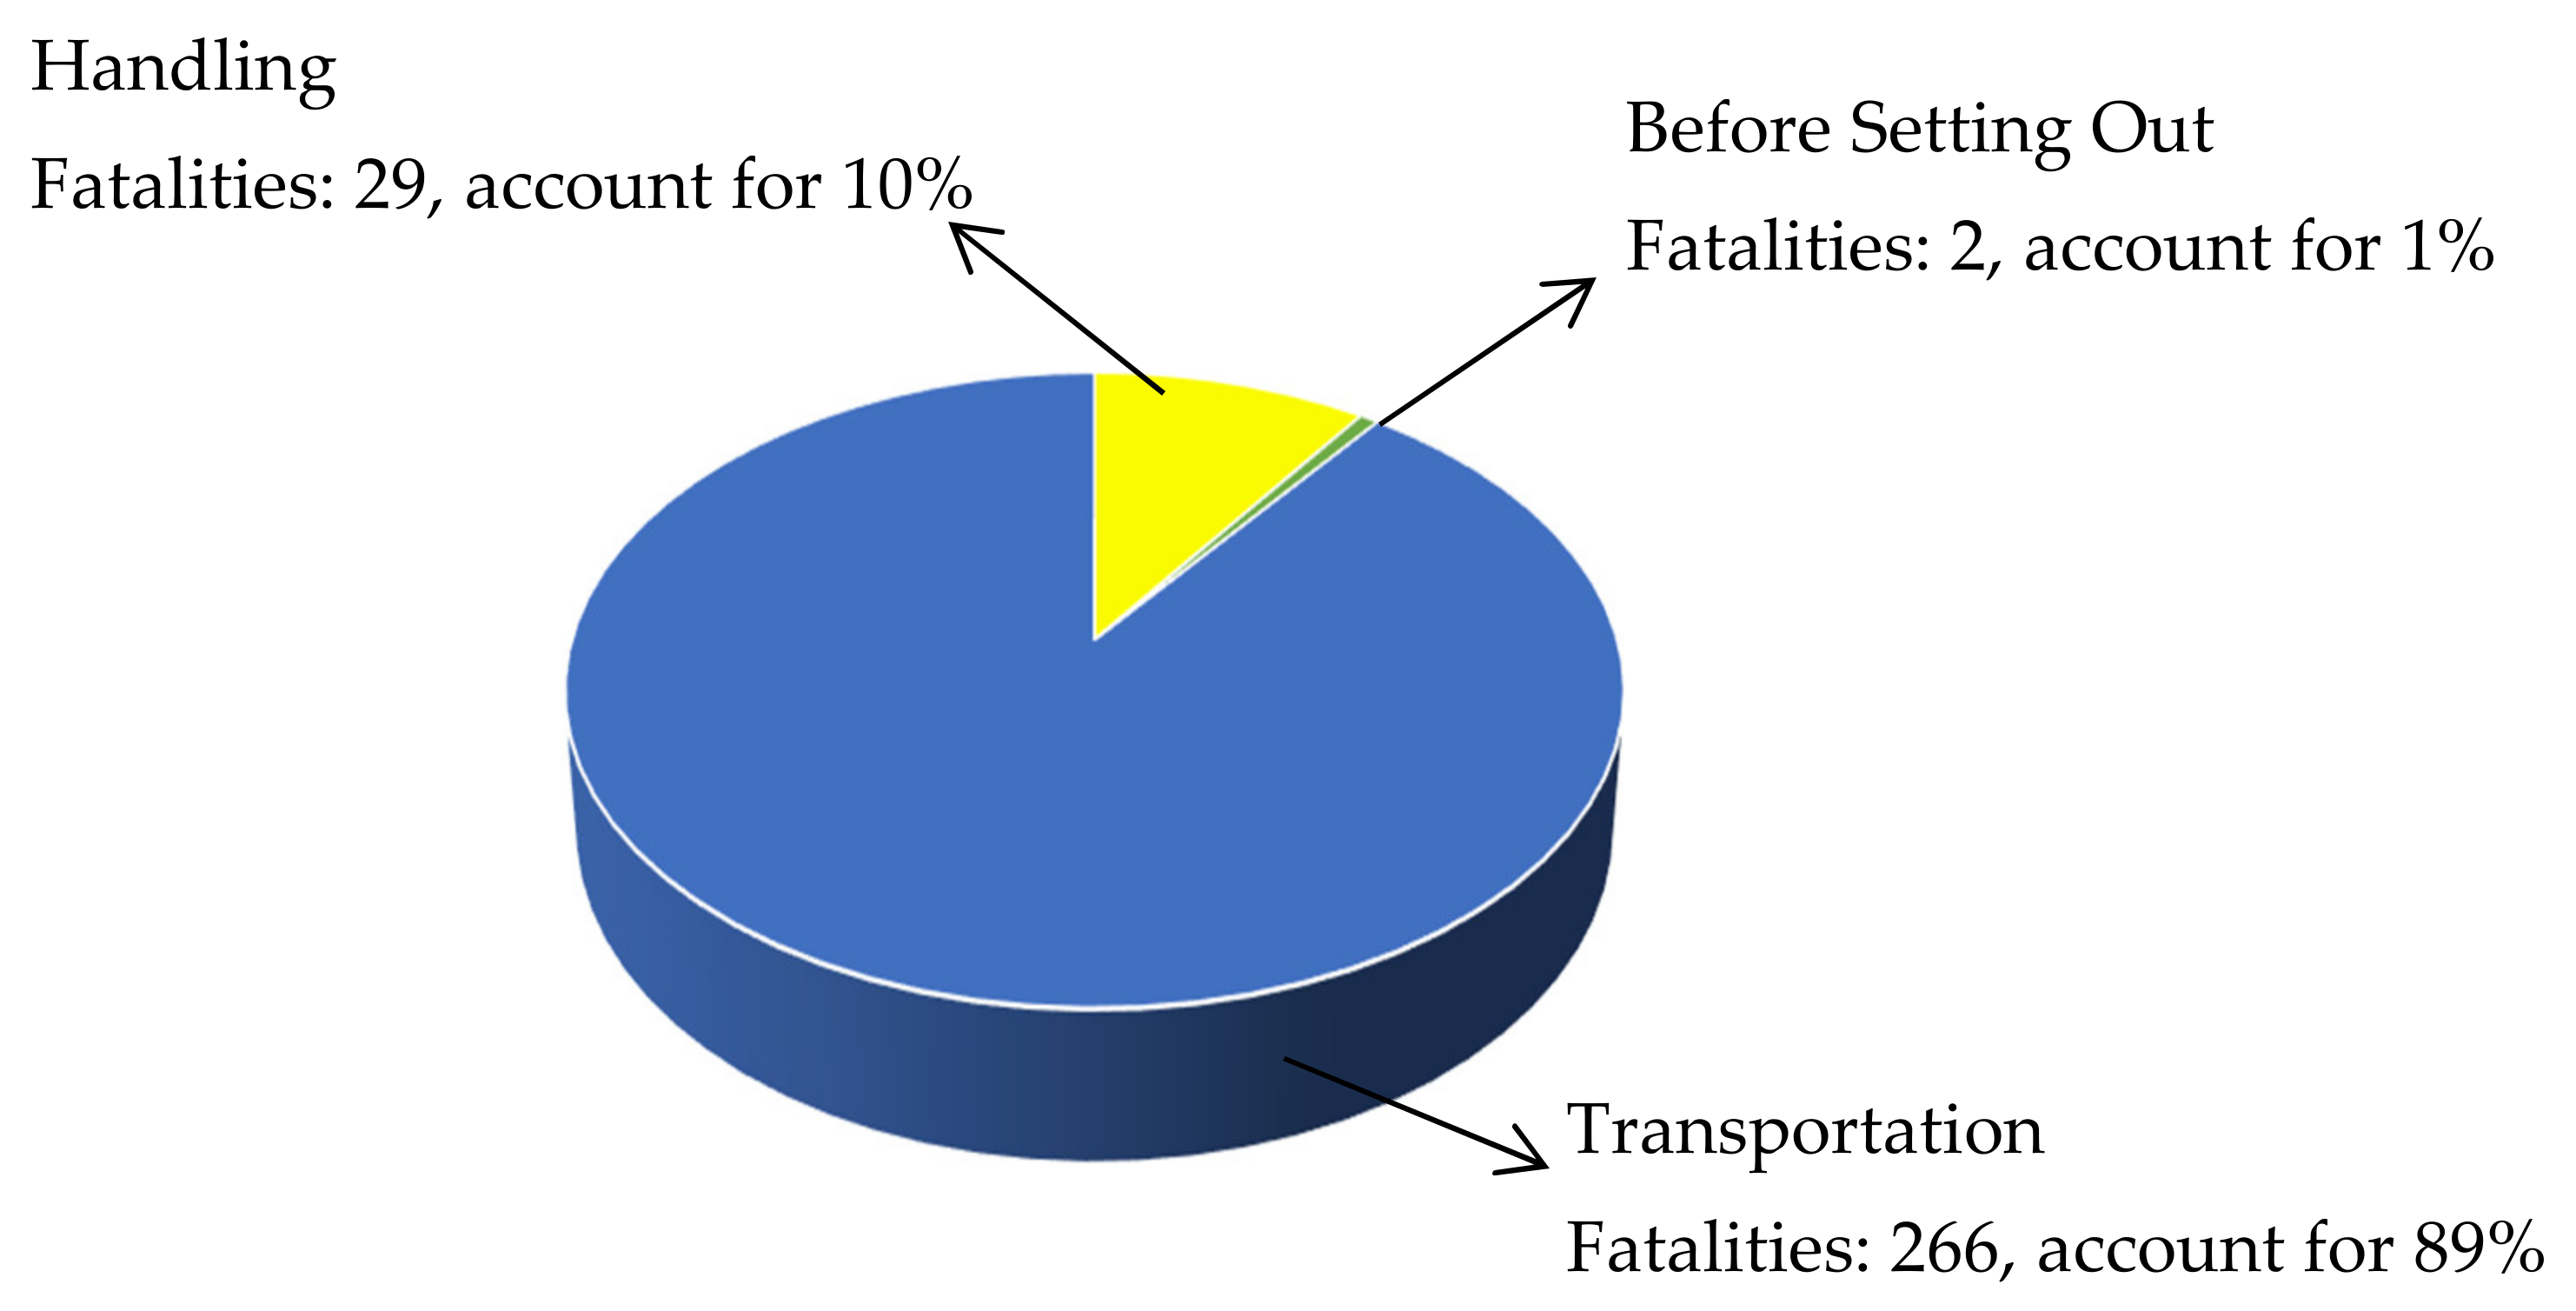
Figure 4 shows the proportion of deaths caused by accidents at various links in transportation. In
Figure 3, GA, SA, MA, and PSA mean four accident levels. GA means general accident, SA means serious accident, MA means major accident, and PSA means particularly serious accident. In
Figure 4, “handling” represents the loading and unloading process of hazardous chemicals, “before setting out” represents the process of preparing for departure after loading and unloading of hazardous chemicals, and “transportation” represents the transportation process of hazardous chemicals; and they all belong to hazardous chemical transportation accidents. And in particular, “unloading” represents unloading goods in the following text.
It should be noted that there is only one type of accident analyzed in this paper: hazardous chemical transportation accidents. Additionally, the accident is divided into three segments according to the different transportation processes: handling, before setting out, and transportation, as shown in
Figure 4.
3. Accident Process
This article collected 30 investigation reports of hazardous chemical transportation accidents with complete information and large impact in China from 2000 to 2018, and some hazardous chemical transportation accidents with incomplete information and less impacts were not counted.
In the case study, 30 accidents were collected and analyzed by the CREAM and 24Model separately to testify the method. Among them, one accident is shown in detail as follows for illustration purposes. Additionally, fictitious names are used in order to illustrate the accident analysis processes.
At 00:58, Tang, the driver of Linyi Jinyu Logistics Co., Ltd., after driving a liquefied gas transport vehicle for a long distance, entered the company, ready to unload. After Tang got off the vehicle, he connected the gas–liquid quick-connect interface of the No. 10 loading and unloading arm to the vehicle unloading port, and the gas phase valve was opened to pressurize the tank. Then, the pressure of the vehicle tank increased from 0.6 MPa to more than 0.8 MPa.
At 00:59, when Tang opened the liquid-phase valve of the tank, the liquid-phase connection nozzle was suddenly disconnected, and a large amount of liquefied gas was sprayed out and rapidly vaporized and diffused. Operators on duty failed to effectively handle the situation, which resulted in the leakage of liquefied gas for up to 2 min and 10 s. The leaked liquefied gas mixed with air to form an explosive mixture. Then, the mixture contacted the ignition source, an explosion occurred, and the tanks of accident vehicles and other vehicles were ignited, which caused continuous explosion.
The accident investigation report is issued by the Department of Emergency Management of Shandong Province, China. Some causes of the accident included in the case study can be obtained from the accident investigation report. For example, the accident investigation report states that the accident causes include the company’s imperfect operating procedures, the lack of strict unloading procedures, the company’s chaotic daily management, the lack of attention to the safety management of the loading and unloading process, driver fatigue, and so forth. In addition, some information can be inferred from the investigation report. For example, the investigation report mentions that the driver has dangerous goods driver qualification and dangerous goods escort qualification; we can infer that the driver has strong driving ability and driving experience.
It should be noted that the details of the accident are based on the facts in the accident investigation report issued by the investigation team of the major “6·5” tanker leakage explosion and fire accident of the Department of Emergency Management of Shandong Province. All analysis is also based on reasonable extrapolations from this.
3.1. Analysis of the CREAM Model
3.1.1. Identify the Human Event
Considering the above accident process, we analyzed that there was a key human error event in the accident: the driver did not reliably connect the quick-connect interface to the liquid discharge tube of the vehicle, which caused liquefied natural gas leakage.
3.1.2. Retrospective Analysis Process of the Human Event
Analysis and Determination of the Error Mode
The most immediate cause of the human error is that the driver in the preparatory stage of the unloading operation missed the step of checking the quick-connect interface and liquid-phase discharge pipe of the vehicle or deliberately skipped it to complete the unloading task in advance. The accident investigation report issued by the Department of Emergency Management of Shandong Province stated that “the driver was running long distances and working continuously, and during the midnight liquefied gas unloading operation did not strictly implement the unloading procedures and made serious operational errors, resulting in the failure to reliably connect the quick-connect interface to the tanker’s liquid-phase discharge pipe”. Therefore the disconnection is attributed to human error.
Therefore, the error mode of the event is determined as a sequence (missing, jumping forward).
Identify Possible General Causes
According to the “antecedent category name table” [
25] provided by the CREAM model, combined with the content of the accident investigation report, “The driver of the vehicle in the accident was travelling long distance and working continuously (work for a long time). When discharging Liquefied Natural Gas, he did not strictly follow the unloading rules and made serious operation mistakes”. The error mode sequence (missing, jumping forward) in this accident corresponds to the following four possible antecedents:
False observation: the driver who caused the accident checked the connection of the fast interface and found no abnormality;
Memory failure: the driver forgot to pick up the connection before unloading the truck;
Inattention: the driver who caused the accident was unloading by himself and did not carefully confirm the connection of the quick-connect interface;
Inadequate procedure: Jinyu Petrochemical Co., Ltd. (hereinafter referred to as Jinyu), has not formulated complete operation procedures for unloading vehicles and the handling site without the unloading management personnel.
Consequence–Antecedent Analysis
We take the four types of general antecedents summarized above (A–D) as the consequences, determine their general antecedents and specific antecedents in the consequence–antecedent chain, select the general antecedents as the consequences, and look for general antecedents and specific antecedents, which form a cyclic analysis. Finally, the last antecedent of each branch is the root cause of the human error of the driver who caused the accident.
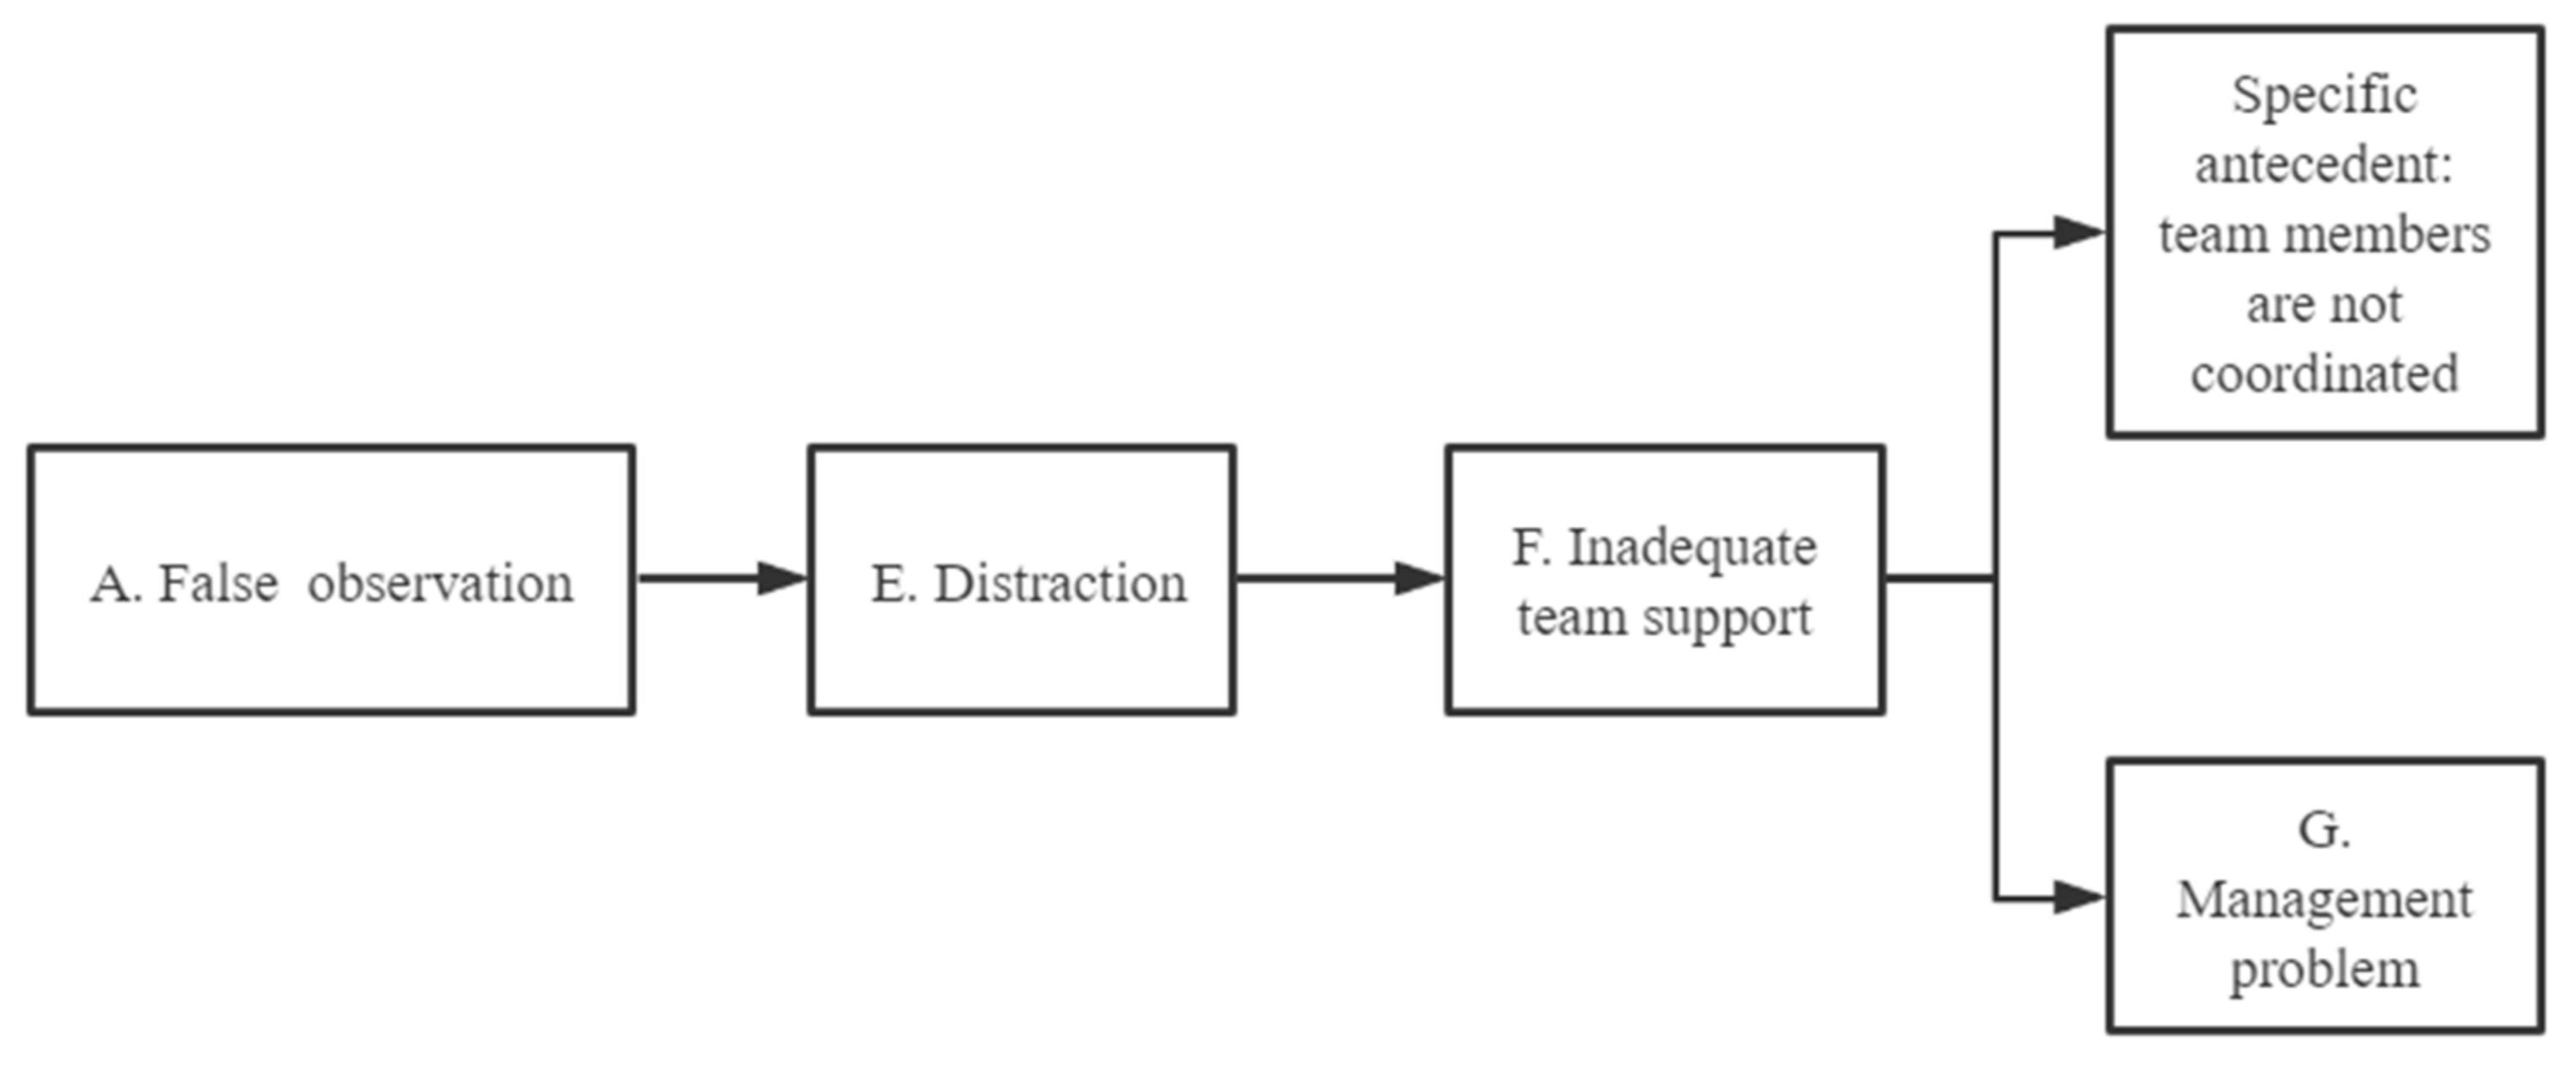
Take A: False observation as an example to illustrate below. Since the analysis process of antecedents B, C, and D are the same as A, only the analysis process of antecedent A is elaborated.
A: False observation is analyzed as a consequence. In the accident case, the safety consciousness of the driver is weak, and illegal driving behaviors such as speeding and fatigue often occur. The driver who caused the accident failed to concentrate during the journey. Therefore, E: Distraction is chosen as the general antecedent. Additionally, there are no suitable specific antecedents.
Continue to use E: Distraction as a consequence to analysis. According to the description of the accident case, “The company has not carried out dynamic monitoring on the actual management of the accident vehicles, and failed to discover and correct the driver’s fatigue driving behavior in time”. “The company has not been equipped with road dangerous goods transportation handling management personnel according to law”. It is known that the company and supercargo failed to form good team cooperation, so it has a general antecedent F: Inadequate team support.
Continue to use F: Inadequate team support as a consequence to analysis. In the description of the accident case, “The daily safety management is chaotic. The company’s safety inspection and hidden trouble investigation and management are not thorough and in-depth, safety education and training are a mere formality, and the employees’ safety consciousness is poor”; and “the company’s emergency management is flawed, failure to formulate targeted emergency response plans, fail to regularly organize practitioners to carry out emergency rescue drills, and inadequate emergency response education and training for drivers”. Thus, Jinyu Logistics Co., Ltd., has chaotic management, so we select the general antecedent G: Management problem. Additionally, the team members are not coordinated and can be identified as a specific antecedent.
The analysis process of A: False observation as show in
Figure 5.
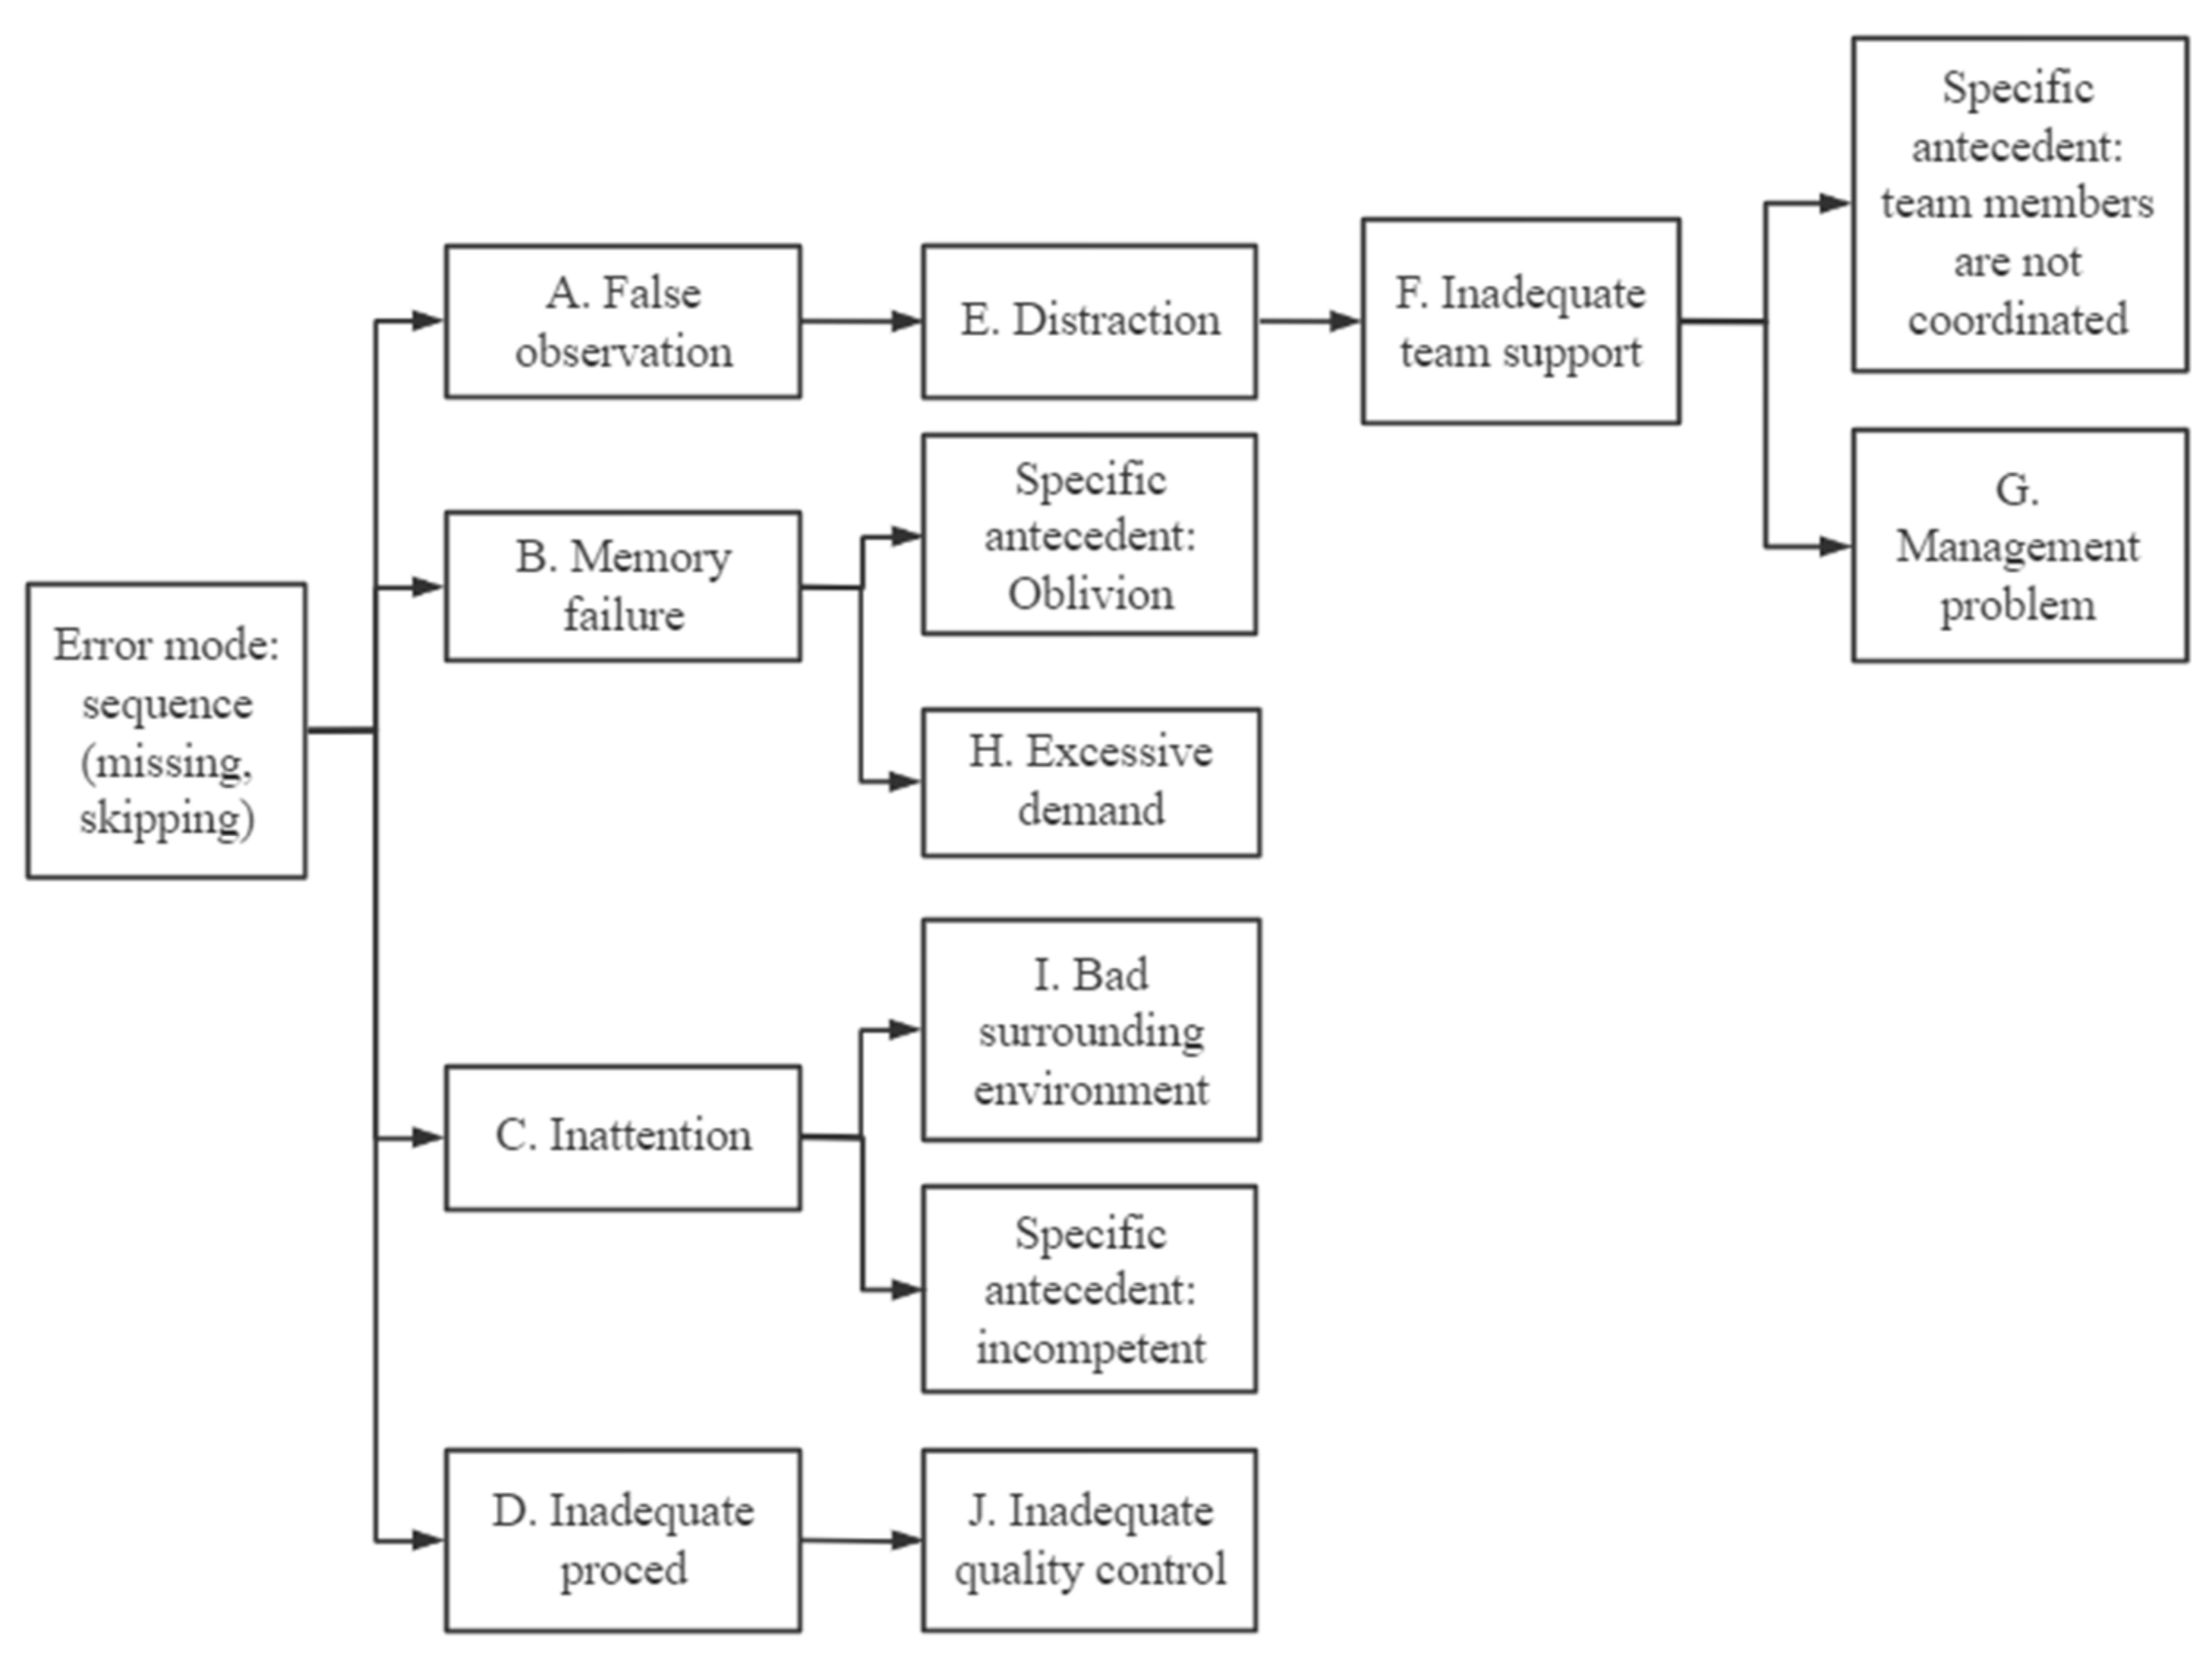
Through the above analysis, the results of the “sequence (missing, jumping forward)” retrospective analysis process and the two error modes are displayed in
Figure 6.
3.1.3. Statistics of 30 Accident Results
The CREAM model was used to analyze 30 hazardous chemical transportation accidents, and the statistical results are shown in
Table 2. The first horizontal row in
Table 2 means the accident level. The classification and explanation of the accident level are given in
Table 1. The first vertical column represents the classification of accident causes as human error, human-related antecedents, technology-related antecedents, and organization-related antecedents, according to the CREAM. The meaning of the numbers in
Table 2 is the frequency quantity of 30 accidents, that is, the frequency quantity of each cause in general accidents, serious accidents, major accidents, and particularly serious accidents. For example, 19 represents 30 accidents in which human error related to general accidents appeared 19 times, and the other figures in
Table 2 have the same meaning.
3.2. Analysis of the 24Model
To compare the differences between the two models in analyzing accidents, this part adopts the 24Model to analyze the same accident. The analysis process and results are as follows:
3.2.1. Immediate Causes
Unsafe acts are actions that cause an accident or significantly affect the accident [
26]. By analyzing this accident, the following unsafe acts are found, as shown in
Table 3.
An unsafe state may be caused by unsafe behavior or habitual behavior, and it may also be inherent in the accident [
26]. The following unsafe conditions were found through the accident investigation report and related data, as shown in
Table 4.
3.2.2. Indirect Causes
According to the 24Model, indirect causes include the knowledge, consciousness, habits, mental state, and physical condition related to the immediate causes [
26]. The indirect causes of this accident are shown in
Table 5.
3.2.3. Radical Causes and Root Causes
The radical causes are the deficiencies in the safety management system in the organization where the accident initiator is located [
26]. The specific results of this accident are shown in
Table 6.
The root causes of the accident are the deficiencies in safety culture at the organizational level [
26]. The safety culture is the guiding ideology of the organization’s safety work. The safety culture affects the safety management system of the organization, which affects the habitual behavior of the members of the organization and ultimately affects the behavior and conditions.
The literature [
5,
27] proposed 32 types of safety culture elements, and the literature [
28] designed a comprehensive evaluation index system to evaluate the level of enterprise safety culture construction based on the elements. The 32-element safety culture table also has specific applications in the quantitative measurement of safety culture [
27]. According to the table of safety culture elements, specific deficiencies in safety culture elements (i.e., the root causes) are provided in
Table 6. The numbers in
Table 6 correspond to the numbers of safety cultural elements in [
5,
27].
According to
Table 6, in this case, the safety culture has the following deficiencies: 1–12, 16, 19, 22, 29, 30, 32.
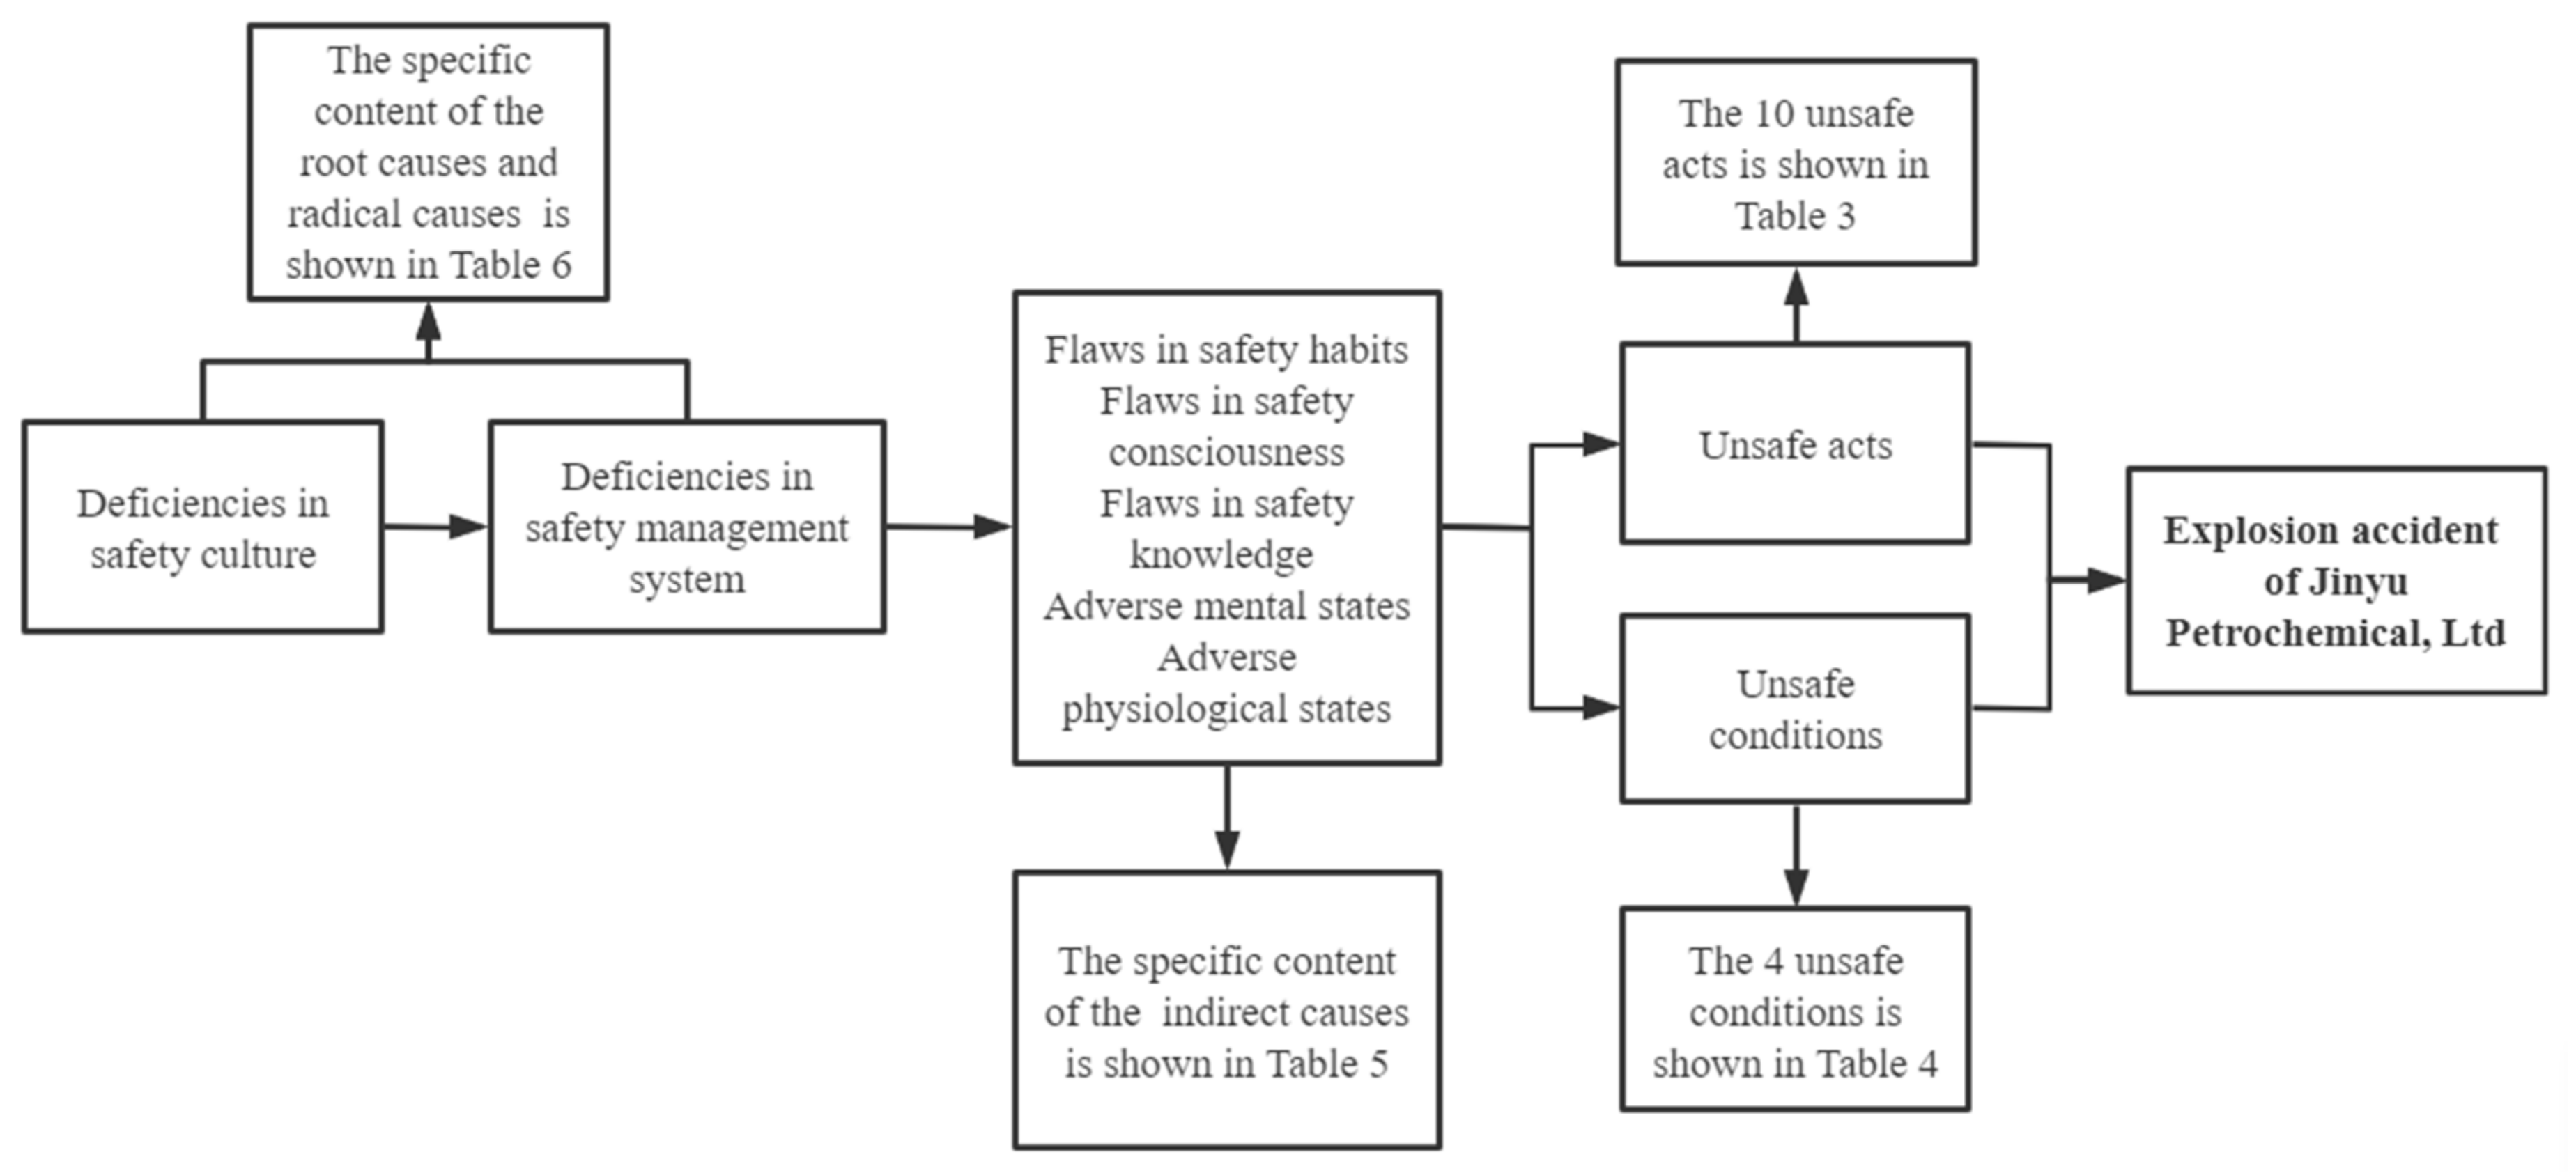
Through the analysis of the Jinyu hazardous chemical transportation explosion accident cases, the causes of accidents at the organizational and personal levels were identified from on aspects: immediate causes, indirect causes, radical causes, and root causes.
Figure 7 depicts the complete chain of accident causes.
3.2.4. Statistics of 30 Accident Results
Using the above analysis steps to analyze the 30 hazardous chemical transportation accidents, the statistical results are shown in
Table 7. The first horizontal row in
Table 7 means the accident level. The classification and explanation of the accident level are given in
Table 1. The first vertical column represents the classification of accident causes into unsafe acts, unsafe conditions, habitual unsafe behavior, deficiencies in safety management system, and deficiencies in safety culture according to the 24Model. Based on the analysis of 30 accidents, the frequency of each cause in general accidents, serious accidents, major accidents, and particularly serious accidents was obtained. For example, 82 represents 30 accidents in which unsafe acts related to general accidents occurred 82 times, and the other figures in
Table 7 have the same meaning.
4. Results and Discussion
4.1. Preliminary Comparison of Analysis Results
For the Jinyu explosion accident case, the impact objects and accident analysis modules of hazardous chemical transportation accidents analyzed by the two model methods are compared. The results of the preliminary comparison of the two models are shown in
Table 8.
The comparison shows that the CREAM and 24Model specify the objects of accident impact, including personnel, equipment, social wealth, environment, and other influences. The CREAM is similar to the 24Model in this respect.
However, in terms of the analysis module of the model, the two models have their own focus. The CREAM model includes human, technical, and organizational factors in the analysis of human error events, but does not include external factors. The 24Model takes into account external factors, such as material factors, in its analysis.
To further analyze the focus of the two models in the analysis of accident causes, the gray relational analysis and regression analysis are used to conduct an in-depth discussion on the correlation of each analysis cause in the qualitative analysis.
4.2. Quantitative Comparison of Analysis Results
4.2.1. Grey Relational Analysis and Results Comparison
In this part, the gray relational analysis is used to conduct in-depth research on the statistical results of the 24Model and CREAM model analysis. The gray relational analysis method is based on the similarity or difference of the development trend among factors, which is the “gray relational degree”, to measure the relational degree among factors. To correctly understand and effectively control the information of the system operation, the relational degree is the degree of geometric difference between the curves [
29].
Establishment of the Index System of Influencing Factors
In the accident cause chain of the 24Model, unsafe acts are affected by unsafe conditions, habitual unsafe behavior, deficiencies in safety management system, and deficiencies in safety culture, so unsafe acts are selected as reference sequence X
1; unsafe conditions, habitual unsafe behavior, deficiencies in safety management system, and deficiencies in safety culture are comparison sequences X
2, X
3, X
4, and X
5, respectively. The statistical results of the 24Model analysis of 30 accidents were taken as sample data, as shown in
Table 9.
Similarly, in the CREAM model, human error is selected as the reference sequence X
1; the human-related antecedent, technology-related antecedent, and organization-related antecedent are selected as comparison sequences X
2, X
3, and X
4, respectively; and the statistical results of the CREAM model analysis of 30 accidents are taken as sample data, as shown in
Table 10.
Relational Degree Analysis and Research
To make the calculation results accurate and effective, the subsequent steps are implemented using the DPS (Data Processing System) software [
30]. The DPS software was used to process the data in
Table 9 and
Table 10.
Table 11 and
Table 12 are the corresponding results.
The analysis results in
Table 11 show that the relational degree between safety culture X
5 and unsafe act X
1 is the largest, which is 0.90965. The relational degree between X
2 and unsafe act X
1 is the smallest, which is 0.47513.
The analysis results in
Table 12 show that the correlation between technology-related antecedent X
3 and human error X
1 is at most 0.83190, followed by organization-related antecedent X
4 at 0.57207, and finally, human-related antecedent X
2 is 0.55386.
4.2.2. Comparison of Regression Analysis
Regression analysis is a statistical analysis method that can determine the quantitative relationship between two or more variables [
31].
Establishment of the Regression Analysis Data Table
In the analysis results of the 24Model of 30 accidents (
Table 9), set the unsafe acts as the dependent variable and record it as X
1; the unsafe conditions, habitual unsafe behavior, deficiencies in the safety management system, and deficiencies in safety culture are independent variables denoted as X
2, X
3, X
4, and X
5, respectively, and a regression analysis data table is constructed.
Similarly, in the analysis results of the CREAM model of 30 accidents (
Table 10), human error is set as the dependent variable and denoted as X
1. The human-related antecedent, technology-related antecedent, and organization-related antecedent are independent variables denoted as X
2, X
3, and X
4, respectively, and a regression analysis data table is constructed.
The format of the two data tables in this section is similar to that of
Table 9 and
Table 10. Therefore, these two tables are no longer listed.
Regression Analysis Results
The DPS data processing software was used to conduct a regression analysis of the dependent variables and independent variables in the analysis results of the two models. The results are shown in
Table 13 and
Table 14.
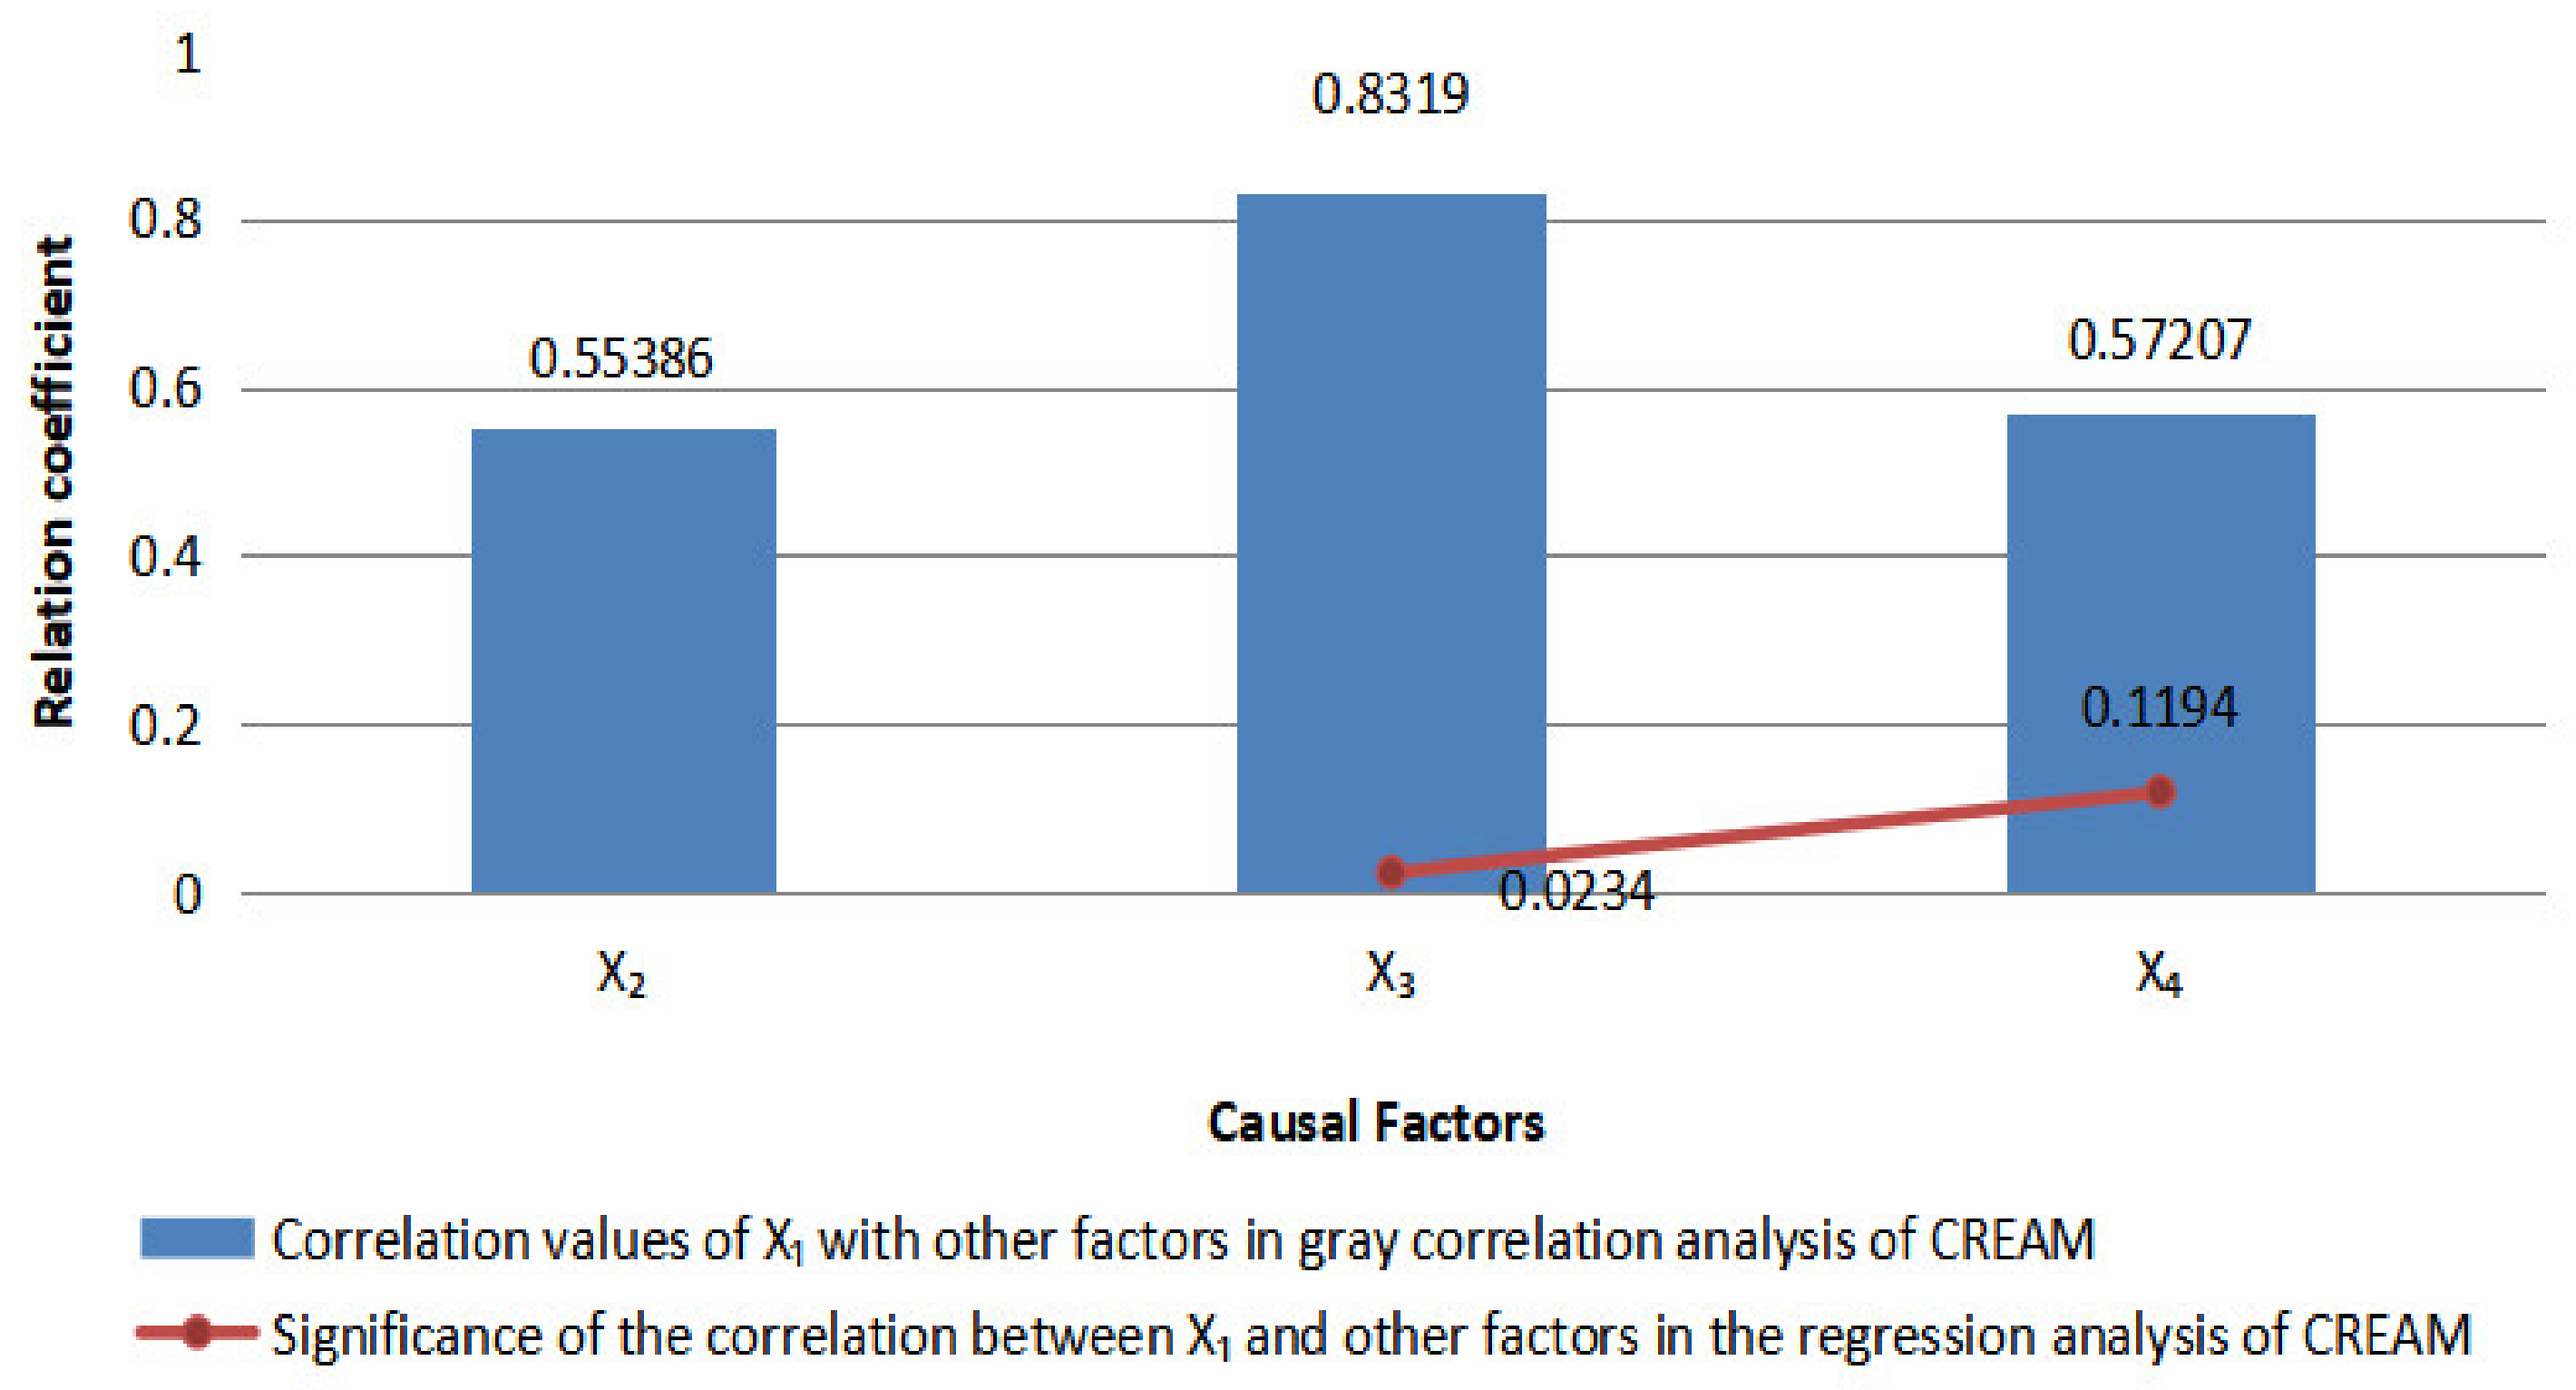
Based on the results of the gray correlation analysis and regression analysis, the correlations between the unsafe behaviors/human error and the respective causal factors in the two models are depicted in the Pareto chart below.
In
Figure 8 and
Figure 9, the column represents the gray correlation analysis, with higher values indicating a higher correlation between X
1 and the other factors. Additionally, the line represents the regression coefficient, with lower values indicating a significant linear relationship between X
1 and the other factors. Thus, in both figures it can be seen that the degree of association is consistent with significance. This mutually corroborates the validity of the analysis results. In the 24Model and CREAM, X
1, X
2, X
3, X
4, and X
5 represent different meanings, respectively; see
Table 9 and
Table 10. Additionally, there is no X
5 in the CREAM. X
2 is removed due to errors in the regression analysis.
The gray relational analysis shows that in the analysis results of the 24Model, safety culture has the highest relational degree with unsafe acts and the lowest relational degree with unsafe conditions. Among the analysis results of the CREAM model, human errors have the highest relational degree with the technology-related antecedent and the lowest relational degree with the human-related antecedent. The regression analysis results are consistent with the gray relational analysis results, which verifies the correctness of the analysis.
4.3. Discussion
According to the analysis results in
Figure 6, a total of 13 petrochemical accident causes in four categories were identified by the CREAM. Additionally, 61 accident causes were derived from four major categories by the 24Model in
Figure 7. It can be seen that when two models are used to analyze the same accident, the number of the accident causes analyzed by the 24Model is higher than that by the CREAM. This is probably because the 24Model does not classify the causes of accidents in detail, leaving more freedom for analysts, whereas the CREAM provides a detailed classification of accident causes, limiting the depth and breadth of the analysis.
Gray correlation analysis was used to further study the focus of the two models. According to the results in
Table 11 and
Table 12, the maximum correlation between technology-related precondition X
3 and human error was 0.83190 in the CREAM analysis results; meanwhile, the maximum correlation between safety culture and unsafe acts was 0.90965 in the 24Model analysis results. The closer the correlation is to 1, the higher is the correlation. That means that the CREAM focuses more on the technical aspects of production, and the 24Model focuses more on the safety culture of the company when it comes to analyzing the human causes of accidents. People are influenced by the prevailing equipment, technology, and so forth, before they finally make a decision, so the CREAM focuses more on the analysis of the technical aspects of the reasons. Similarly, safety culture is the root cause of accidents in the 24Model. The two models have different analytical focuses, affecting the perspective of the analysis, thus making the results of the cause analysis appear different.
According to the results of regression analysis in
Table 13 and
Table 14, through regression analysis of human error and other influencing factors in 30 accidents by the CREAM, it is concluded that the maximum correlation coefficient between technology-related antecedent X
3 and human error is 0.9978; the 24Model conducted a regression analysis of unsafe actions and other influencing factors, which shows a maximum correlation coefficient of 1.0000 between safety culture and unsafe acts. The results shown are highly correlated. Additionally, the regression analysis results are consistent with the results of the gray correlation analysis, further validating the results of the gray correlation analysis.
This study contributes to the research on the CREAM and 24Model. The focus of the two models in accident analysis is given through accident analysis and quantitative calculations. The focus of the models obtained from the study is similar to the results of the study of Fu et al. (2013). The results of the study are supported by the results of the study of Fu et al. (2013). Furthermore, according to the limited literature available to us, no literature has been found that quantifies a comparison of the correlation analysis of accident causes and the concerns in different models.
5. Conclusions
A statistical analysis of the causal factors of 30 hazardous chemical transportation accidents using the 24Model and CREAM revealed that both models include the impacts of accidents on personnel, equipment, social wealth, and the environment and other impacts. However, the CREAM does not include factors external to the organization. Using the 24Model for accident analysis, the cause numbers were more than those for the CREAM model, which shows the difference in the perspective of accident analysis between the two models.
The gray correlation analysis results inferred that the results obtained from accident analysis using the 24Model showed the highest correlation between safety culture and unsafe acts and the lowest correlation between unsafe conditions, whereas in the CREAM, human error and technology-related antecedents had the highest correlation and human-related antecedents had the lowest correlation. The results of the regression analysis validated the results of the gray correlation analysis.
This study will provide a reference for subsequent analysts using the CREAM and 24Model to focus on their accident analysis, and will help analysts to target their analysis according to the model characteristics, or to make reasonable improvements to enhance the analysis results. For an accident, the 24Model should be chosen if the researcher wants to obtain more information about the causes of the accident in terms of safety culture, and the CREAM model if the researcher wants to obtain more information about the causes of the accident in terms of technology.
For future research, applications between different models could be explored from other perspectives, and other scenarios could be explored to test the hypothesis. In addition, as a limitation, there are only 30 case reports of hazardous chemical transportation accidents in this study, and more data samples could be collected to obtain the more common accident causes of hazardous chemical transportation accidents. Additionally, further combine with the on-site investigation of hazardous chemical transportation accidents, carry out quantitative prediction research on hazardous chemical transportation accidents, and better achieve the goal of sustainable development.


