Article

Evaluating Green Technology Strategies for the Sustainable Development of Solar Power Projects: Evidence from Pakistan

1
School of Economics and Management, North China Electric Power University, Beijing 102206, China
2
Beijing Key Laboratory of New Energy and Low-Carbon Development, North China Electric Power University, Beijing 102206, China
3
School of Business Management, Superior University, Lahore 54600, Pakistan
4
School of Management and Economics, Beijing Institute of Technology, Beijing 100081, China
5
Centre for Energy and Environmental Policy Research, Beijing Institute of Technology, Beijing 100081, China
6
Department of Business Administration, ILMA University, Karachi 75190, Pakistan
7
School of Economics, Zhejiang University, Hangzhou 310058, China
8
School of Management and Economics, Dalian University of Technology, Dalian 116024, China
9
Amity School of Economics, Amity University Uttar Pradesh, Noida 201301, India
10
Faculty of Tourism, Anadolu University, Tepebaşı-Eskişehir 26470, Turkey
*
Author to whom correspondence should be addressed.
Sustainability 2021, 13(23), 12997; https://0-doi-org.brum.beds.ac.uk/10.3390/su132312997
Submission received: 25 September 2021 / Revised: 14 November 2021 / Accepted: 16 November 2021 / Published: 24 November 2021

Abstract

:
Energy is the main element for a modern lifestyle that must be considered in economically reliable and sustainable development dialogues. The financial performance of solar power projects has become the main issue, especially in developing countries such as Pakistan, where it has gained the special attention of government and regulatory authorities. The present study evaluates green technology strategies for the sustainable development of solar power projects in Pakistan. We examine the moderating role of cost and riskiness of the methods between the nexus of capital budgeting techniques and the financial performance of solar power projects. The analysis is performed on data collected from 44 respondents (chief financial officers and chief executive officers) by accompanying an inclusive questionnaire survey. Partial least squares structural equation modeling (PLS-SEM) is used to assess the formulated suppositions. The results reveal that green technology strategies positively impact the sustainable development of solar power projects. The profitability index is a good source of higher financial performance of the solar power projects. The results further demonstrate that the cost and riskiness of the methods significantly moderate the nexus of capital budgeting techniques and the financial performance of solar power projects. These findings provide a valuable manual for policymakers, government institutions, and regulators to select the appropriate green technology strategy to increase cleaner production and sustainable development of solar power projects.

1. Introduction

Energy has secured its place as one of the core needs in modern life [1]. It plays a fundamental role in improving the standard of living and economic development of a country [2,3]. Modern life depends on reliable energy resources [4,5]. Proper energy supply plays a vital role in developing the economy [6]. One of the prime benefits of reliable energy sources is eliminating the need and usage of fossil fuel, i.e., coal, oil, and natural gas for electricity generation [7]. Besides, it is helpful for countries that do not have electricity access [8,9].
Recently, the energy demand has tremendously increased, and it is considered one of the world’s crucial problems [10]. Energy shortage seriously affects people’s lives, professional and non-professional activities [11]. The governments of developing countries are facilitating renewable energy expansion with policy strategies [12]. Similar to other developing countries, Pakistan requires massive energy to support its industry and large population [13]. The electricity gap between demand and supply has been uncontrolled in the past few years. The country faces the worst load shedding during the summer season, i.e., 10–12 h per day in urban areas and 16–18 h per day in rural areas [14]. Pakistan is considered an energy-deficient country [13]. In Pakistan, the available energy production sources are not enough to satisfy the country’s increasing energy demands. In the preceding years, the country’s power sector focused on generating energy from hydropower sources. Later, until 1994, the only electricity producer in the country was Water and Power Development Authority (WAPDA) [15]. Independent Power Producers (IPPs) joined the system later. The focus of IPPs was to produce energy from thermal power plants operated on conventional fossil fuels. After 1994, the energy policy of Pakistan was introduced. The Private Power and Infrastructure Board (PPIB) was established to support the IPPs to satisfy energy needs.
Presently, 67% of the energy demand in Pakistan is met with non-renewable resources, which are increasing at more than 10% annually, and the annual average growth rate of energy demand will be 8.35% by 2050 [16,17]. Pakistan is facing an energy crisis due to two main reasons: first, energy policy and energy structure are mainly dependent on conventional energy sources, which are expensive and always under pressure due to shortages [18,19]. Second, Pakistan’s renewable energy sector only participates in 0.3% of overall energy needs, which is negligible [20]. The country’s power production sources include natural gas (44%), oil (35.5%), hydropower (11%), coal (7%), nuclear (2%), and renewable energy (0.3%).
Severe energy crises have destructive impacts on the national economy of Pakistan [21]. Solar energy resources are considered powerful, effective, and accessible on the Earth compared to other alternative energy sources [22,23]. The international energy agency explored that worldwide solar capacity was 402 gigawatts (GW) at the end of 2020 [24]. Pakistan has a total estimated potential for solar energy of about 1600 GW, which can support the country’s energy needs if used effectively [25]. The sustainable development of solar energy projects requires analyzing renewable energy policy and policy instruments to attract foreign direct investment and implement green technology strategies. There is a lack of green technology strategy for the sustainable development of solar power projects with financial analysis. Financial planning for assessing financial performance and improvement in solar power generation is needed by green technology to develop solar power projects.
As a result, the PPIB attracts the investors who installed the thermal power plants. Different phases of energy policy were introduced at subsequent periods in the country, but unfortunately, they cannot achieve the proposed targets. The energy policy of 2000 failed because it could not satisfy the country’s energy needs at the desired prices. As a result, the Alternate Energy Development Board (AEDB) was formed in 2003 to formalize alternate and renewable energy (ARE). The AEDB aims to support the private energy producers in the country. The country’s first energy policy regarding renewable energy was introduced in 2006 [26]. The main objective of this policy was to convince IPPs to invest in renewable energy projects. In Pakistan, the first solar power project was introduced by the Pakistan Engineering Council (PEC) in 2010 with a capacity of 178 Kilowatt (kW) [27]. After that, the Punjab Government initiated Quaid-e-Azam Solar Power Project to meet the country’s increasing energy demand. This project generated 1000 Megawatt (MW) in the initial phase. Similarly, the government of Pakistanis is also planning to establish more solar power projects in other parts of the country [28]. Some solar power projects of Pakistan, along with project capacity, are presented in Table 1.
Numerous investigations have been conducted on the energy crisis [30,31,32,33,34,35,36,37,38,39], solar power project installation, and site selections [40]. Still, there is a lack of literature regarding energy project failures and sustainable development for solar energy projects with green technology strategy. There is also a lack of literature related to the impact of capital budgeting techniques on the performance of solar power projects by using green technology for sustainable development. Capital budgeting is a set of techniques used to analyze and decide a proposed investment in the new solar project or production line. Capital budgeting techniques are also known as analyzing and planning processes to determine the long-term investment of the industry and deciding strategies for new project investment, matching with expenditure and profit by considering critical factors such as capital return, the economic value of the project, availability of funds, accounting methods, and taxation. Solar firms also adopt traditional capital budgeting approaches, including internal rate of return, net present value, payback period, and profitability index. The financial performance of the energy projects can be assessed by applying these techniques. Financial performance is a subjective measure in which a solar firm can maintain the standards to use assets and generate revenue. The investor and analysts use the specific term to compare the same solar projects or firms as a general measure for the financial backbone of the firm at a particular time. Financial performance shows a snapshot of a solar project’s economic health and general well-being for investors and shareholders. A primary document is required to publish annually and reports the financial performance of the solar firm. A solar firm or project’s financial performance can be evaluated through financial statements, including cash flows, the income statement, and the balance sheet. The indicators of financial performance specify the economic position of the solar project.
Previous investigations regarding the energy sector in Pakistan have mainly pinpointed (i) energy gap between demand and supply, (ii) energy mix, (iii) evaluation of the country’s energy sector, (iv) the pros and cons of the introduction of renewable energy in the system, (v) future of energy sector, and (vi) renewable energy generation sources. Despite the long-standing interest of earlier researchers, specific gaps exist among all these studies, i.e., (i) there is a need to apply green technology strategy for the sustainable development of solar power projects through financial analysis using capital budgeting techniques, (ii) the lack of financial analysis of solar power projects discourage the investors and all type of investment, (iii) financial planning for assessment of the financial performance of solar power projects need to attract foreign direct investment, and (iv) enhancing and improving solar energy generation using green technology strategies for the sustainable development in Pakistan. The present study contributes to the existing research gaps by addressing the following questions: (i) examine the importance of green technology strategy for the sustainable development of solar power projects in Pakistan, (ii) highlight the importance of financial planning for the financial performance of solar power projects using capital budgeting techniques, and (iii) empirically investigate the moderating role of cost and riskiness of the methods on the sustainable development of solar power projects.
The remaining study is organized as follows: Section 2 provides a brief literature review. Section 3 deliberates research methodology. Section 4 discusses the data analysis and results of the study. Section 5 indicates the discussion and implication. Finally, Section 6 concludes the research and provides study limitations.

2. Literature Review

The corporate financial policy includes various pillars, and investment decision tends to be one of them. The vast body of investment decisions is evident from multiple aspects, which in financial policies. These policies usually address the capital budgeting techniques and their usage among investment decisions [14]. The establishment of capital budgeting indicates numerous factors influencing the specific areas of projects. Although different studies in developed economies are categorized, investment decisions are dominant over capital budgeting techniques. At the same time, interpreting solar energy technology in some other countries, various analyses were performed through statistical and financial means [41]. Hence, a green technology strategy for the sustainable development of solar power projects is a possible solution to assess the financial performance of solar power projects through capital budgeting techniques. These analyses have dominantly stated the assessments through proper objectives of financial planning and improvements depicted in Pakistan. Usually, financial planning is more dominant in the projects initiated for a better profitability index [42]. Therefore, the elements of financial planning have mainly improved in developing and developed countries [43]. Capital budgeting techniques can closely assess the sustainable development of solar power projects. The improvement adapted to specific conditions of capital budgeting is closely associated with projected investment decisions. While enumerating the dominance of investment decisions, particular structures of capital budgeting techniques were described. These structures include debt–equity and the cost of capital, linking its association with investment decisions. Reasonable, sustainable efforts are depicted in the projects while emphasizing financial crisis with appropriate management decision making, assessments, and strategic planning [44].
Solar power projects are the most highlighted innovation globally for energy production through different electrons and elements [45]. The creation of technology will widely link with the structures of capital budgeting. Additional parameters were especially more emphasized to enumerate the association of financial planning. The association is a clear indication of financial planning assessment over various projects. The presentation clarifies the association of financial risks connected with the numerous infrastructure projects. Therefore, applying net present value (NPV) with other capital budgeting techniques helps establish uncertain situations prevailing in mitigation strategies. Financial planning usually depends on cash flows primarily used for budgeting and forecasting [45]. Therefore, the assessments are more likely to be dominated by the factors of capital budgeting. The evaluation would not only help to capture the weak areas of performance but would also be beneficial for supporting the decision making process. Financial planning contains the complete process of assessment performed by many large companies and assessment agents. Usually, companies feel reluctant to have expert services essential in managing the financial planning for solar projects and others. This financial planning involves many factors that importantly assert a beneficial role for the capital budgeting techniques [46]. Although companies cannot grow without adequate financial planning and management of their cash flows and company profits, in this context, the roles for assessing financial planning are described with the fair election of elements that could control the economic efficacy of companies. It is a complete process of planning, forecasting, and reporting with comprehensive analysis. Therefore, financial planning of solar power projects for sustainable development is important with a green technology strategy.
Corporate financial planning inserts their overall aspects to assert their objectives and financial performance. These objectives are more related to financial planning as well as operational decision making. Therefore, the company’s progress is the view with the limelight aspects of plans and goals designed under the capital budgeting context [47]. Many obstacles were also grounded with the help of financial planning assessments that grow the company’s profits. Some critical issues were also eliminated with the economic evaluation and forecasting and considered an eye toward the company’s future. Financial planning includes income, investment, financial statements, expenses, taxes, and other financial affairs reviewed to strengthen capital budgeting [48]. Thus, the elements of financial planning declare some factors that significantly influence the financial performance of various projects and businesses. Economic performance and the sustainable development of solar power project is only possible with financial planning. The importance of corporate or solar project-related companies is only with capital budgeting and financial planning elements. These elements comprise NPV, internal rate of return (IRR), payback period (PBP), and profitability index (PI), with significant consideration of risk and cost toward financial performance. The initial investment in the project is required to be analyzed to place the effectiveness of financial planning. This comparative assessment helps to maintain the expenses and knock the doors of profits through net present value. The potential of investment is prevalent in the internal rate of return that assesses the profitability among businesses of various companies [49]. The investment could be a complete and extended channel for the assessment in capital budgeting for financial performance. Many projects are essential for the companies as well as the countries. Therefore, the companies primarily focused more upon the payback period for the sustainable development of the solar power projects.
The literature shows numerous studies conducted on the energy sector of Pakistan. For instance, [50] focused on the energy mix of the Pakistani power sector. The energy sector was proposed that the transition from dominant hydro energy to thermal dominant energy mix was not financially suitable for the country and resulted in debt enhancement [51]. The authors of [52] discussed those factors associated with the gap between energy supply and demand and found the best renewable energy sources in Pakistan. They concluded that the government must prioritize the energy sector and formulate multidimensional policies to control the energy crisis. The authors of [53] examined the present status and future of solar energy from the developing economies’ perspective. The study focused on the ongoing and upcoming renewable energy projects such as solar, wind, biogas, and hydropower. Research findings proposed changing the energy mix by giving more shares to solar energy in the system and by keeping in view the ongoing renewable energy projects, which will minimize the energy demand and supply gap with a green technology strategy. These outcomes support the sustainable development of renewable energy projects in Pakistan, and solar power projects were top rated.
Consequently, it is necessary to induce the appropriate measure of payback while executing proper financial assessment. The profitability index of the projects is more precisely crucial for the countries due to more investment towards other projects. Therefore, the formulated profitability index approach helps assert the business project’s significant performance [54]. All of the factors are related to the assessment of green technology for the sustainable development of solar power projects with financial planning while considering the capital budgeting eminence. There is a broad association of risk factors with financial planning. These risk factors are uncertain due to some strange events and other safety environments and issues.

3. Research Methodology

3.1. Formulation of Hypotheses

3.1.1. NPV Techniques and Financial Performance

To evaluate certain blamed conditions of inefficiencies, the establishment of NPV asserts dominance over investment decisions. The supremacy is necessary to analyze the durables prevailing in energy efficiencies and NPV techniques implications with durable investments. Investment decision making of solar energy projects faced several consequences because the NPV techniques dominate with the critical role. Among solar power projects in Pakistan, capital budgeting techniques have induced a favorable position with numerous methods. These methods indicate financial planning and state the NPV analysis with methodological clashes [55]. The present study examines NPV technique for assessing financial planning and attaining the higher financial performance of solar power projects in Pakistan. We have applied the NPV technique on selected solar power projects mentioned in Table 1 to mandate investment decisions and capital budgeting. This technique will help assess the time value of money concept and investment decision making for selected solar power projects. The sustainability of NPV techniques is to amalgamate the sustainability of large-scale energy supply. NPV occurs at the trade-off by maximizing sustainability between environmental burdening, economic profitability, and considering the time value of money concept, creating new jobs [56]. If the investors practice an NPV model, subsidies are close to zero due to corresponding implied. Investors expect subsidies, as shown in their opinions [57]. The sensitivity analysis was used to verify the main economic variables effect, such as levelized costs of electricity and NPV, which are highly sensitive to collector cost [10]. Investment decisions are elaborate with plenty of characteristics. These elements include lumpiness, flexible timings, uncertainty, and irreversibility. There is a broad association of investment decisions with NPV stating the implications of capital budgeting. Some facilities are the processes of decision making that develop with strategic decision making over energy resources. Therefore, implementing NPV over facilities maintenance has provided valid measures with explicit optimizations of the NPV life cycle [58]. In the renewable energy sector, solar power projects are important investment decisions taken by the innovative world. The conditions of boundaries for establishing solar power projects are inducing NPV with a multiannual growth over the capital rate of return [59]. These values enumerate the development of net present values through proper decisive capital budgeting techniques. Based on these arguments, we proposed the first hypothesis as follows:
Hypothesis 1 (H1).
There is a positive association between NPV and the financial performance of solar projects in Pakistan.

3.1.2. Internal Rate of Return and Financial Performance

Particular cash flow efficiencies were typically linked with every project. These cash flows explicitly assess the values of investments placed after proper implementations of capital budgeting techniques. In the development sites, the internal rate of return is analyzed with residual valuations to interpret profits and costs [60]. The study has applied the internal rate of return method for assessing a positive link of financial planning with the financial performance of the selected and currently working solar power project in Pakistan. We have used IRR technique to determine levelized cost and to assess higher profitability on investment, future profitability, and financial performance of the selected solar energy projects mentioned in Table 1. The IRR technique will help to determine the future profitability and energy performance of the chosen projects. The relationship between allowances of interests and profits is specific due to the proportionate schemes established in solar projects of Pakistan. Therefore, the internal rate of return tends to be an essential element in the project which states the importance among various other projects. Some rail projects were established in developing countries, and implementing internal rate of return with meta-analysis significantly evaluated positive results [61]. Future profitability (internal rate of return) depends on the evolution of installation costs, but it provides positive profitability in average condition [62]. Wave energy performance with IRR can calculate through methodology at different locations. Investors can determine the levelized cost of energy (LCOE) and IRR if economic terms are possible for floating wave energy farms [63]. In the case of solar energy, discounted cash flow with investment analysis over 25 years showed a payback period of over five years and an IRR of 23% [64]. These results are consistent with the development of solar projects initiated in Pakistan. This importance elaborates the significance of the project for individual investment and its association with economic conditions. The proper appraisal of capital budgeting techniques established various values which are beyond the limits of investment decisions. Therefore, in solar power projects, the establishment of capital budgeting techniques stated the favorable implication of the return’s internal rate. While distributing the rates of return with external and internal perspectives, the partial problems were more analyzed in the variances of economic issues [65]. These issues are more frequent with the issues of solar projects initiated in Pakistan for profitable concerns. Its parallel situation positively depicts the assessment of sites and its projections that could develop positive financial performance. We formulated the second hypothesis in light of these findings as follows:
Hypothesis 2 (H2).
There is a positive association between the internal rate of return and the financial performance of solar projects in Pakistan.

3.1.3. Payback Period and Financial Performance

Innovation in the project states the positive and negative consequences for a specific period. The time frame for every project displays the determination of the payback period, which is mandatory for investment decisions. The responsiveness of some methods was precisely linked with the features of climatic, payback period, reduction of heat, and construction of projects [66]. The study implies the payback period method to assess the financial performance, planning, investment decisions, and capital cost of selected and currently working solar power projects in Pakistan. PBP technique will help to evaluate the selected solar power projects with proper financial planning. It is among the principles of selection due to the induction of financial planning with capital budgeting techniques. Careful financial planning is required in every investment, which indicates the time value of money within a specific period for selected solar projects in this study. The inducement of technology has overcome various issues prevalent in the networks of irrigation projects for the recovery of energy [17]. The solar power system has an average payback period within the range of 2–20 years.
Still, the payback period, with an extensive range for photovoltaic systems, has been heavily influenced by incentives [63]. The cost–benefit analysis using a payback period can provide positive financial performance and financial superiority with low capital investment and increase the energy production of solar panels daily with fixed flat indicators [67]. Calculations of the discounted payback periods and the net present value of renewable energy projects include borrowed loans provided by the American and Ukrainian banks for developing renewable energy projects such as solar and wind energy [68]. This situation predicts the values of cash flows in a specific time frame with an association of investment paybacks. The investment decisions are placed in various projects, and the payback period is also estimated. The estimation requires particular years for the recovery of the amount invested in the project. Solar power is one of the highest projects that requires an economical amount and a better payback period within no time. The performance of tasks was based on technological inducements and reduction in the payback period in energy projects [69]. Therefore, the calculated payback time usually depicts the negative performance of systems that develop the assessments associated with solar projects. Thus, the exact implication of financial planning assessment establishes better improvement in the solar power project. The position indicates the simplicity of the payback period, which is favorable for investment decisions with optimistic capital budgeting. These arguments lead us to the formulation of the third hypothesis as follows:
Hypothesis 3 (H3).
There is a positive association between the payback period and the financial performance of solar projects in Pakistan.

3.1.4. Profitability Index and Financial Performance

Some solar power projects are usually established in developing countries to reduce the expenditures on energy production. Many countries with economic feasibility have admired the implication of the solar power project. In determining the profitability index, the initiatives of public and private partnerships are more focused on the duration of projects [70]. The study used the profitability index to assess the relationship with the financial performance of the selected and currently working solar power projects in the country. The time also states the profitability index for further assessment of the selected solar power projects. The profitability index technique will help determine the feasibility and performance of anew solar power project. The evaluations of financial planning over these projects have also noted positive results for reducing expenses and the profitability index. Storage of energy displays the power projects and their combined battery energy with the profitability of residential people [71]. Energy and economic analysis using financial techniques (NPV, DPP, and Profitability Index) emphasize the feasibility of installing solar water heaters and their performance. Hence, these economic techniques seem capable of estimating solar data using an adaptive neuro-fuzzy inference system (ANFIS), where costly equipment cannot install to measure solar energy data [72]. It helps in upbringing the livelihood of people but could also denote negative impacts on people’s lives. The induction of profitability index over the solar power projects has stated positive cash flows. The present values of the initial investment in the selected solar power projects have enumerated significant coverage of the amount invested. Although the positive implications of investment decisions list profitability index, this is also an indication of capital budgeting technique.
Solar power and onshore wind projects have gained much importance in China due to their positive profitability in renewable energy [73]. The economic evaluation of different solar rooftop system sizes using economic indicators of DPP, NPV, IRR, and PI with the monocrystalline module was investigated and identified that Thailand is suitable for installing solar rooftops. All solar rooftop sizes give the same PI of 2.57, DPP of 6.1 years, and IRR of 15% with a feed-in tariff scheme, but an extensive solar rooftop system is required to attain better economic satisfaction [74]. The PI has derived to use data from present solar photovoltaic power plants of possible different sites. The range of transmission line losses between 0.7% and 12.2% depend on its load and length to establish utility-scale power plants as an economic perspective [75]. It contributes potentially to the economic conditions of many countries and is beneficial for the solar projects of Pakistan. It is considered a financial tool in the solar power project that elaborates on whether to be rejected or accepted. We proposed the fourth hypothesis by keeping in view these findings as follows:
Hypothesis 4 (H4).
There is a positive association between profitability index and financial performance of solar projects in Pakistan.

3.1.5. Moderating Role of Cost and Riskiness of the Solar Project between NPV and Financial Performance

The elements of capital budgeting techniques depict the financial visibility of solar power projects. These techniques state the projection values and their evaluation linkage with positive and negative feedback toward the economy. The financial performance and growth of renewable energy are significantly related to an increment of solar power projects [76]. There is a clear picture depicted in developing countries such as Pakistan, where financial performance has gained improvement. Debt service coverage, payback period, internal rate of return, and net present values are eminent capital budgeting elements. The developing countries are geographically more critical for establishing solar energy performance [77]. The current position states the evaluation based on cost and dominance of the project, which describes the broader geographical region view. The moderating role of cost and riskiness will help identify cost and risk assessment of selected and currently working solar power projects in this study. These elements are linked significantly with investment decisions. Any investment could estimate these factors, stating its implications for the actual amount and its influence on the economy. Many projects were initiated after proper financial planning, and solar power is a positive indication of these factors. The organic acceptor plays a vital role in achieving the higher performance of solar cells by building blocks [78]. It is closely related to the solar energy and power projects that focus on electronic implications and capital budgeting associations. Renewable energy plans are dominantly playing a positive role toward the countries, but in Pakistan, the solar power project is commercially and financially viable. Cost and risk factors have connected with the selected and currently working solar Projects in the country. The association of cost and risk also depicts the benefits linked with the solar projects mentioned in Table 1.
Some factors played a role in delaying specific solar projects, but developing countries positively associate services with solar power projects. Reducing cost is a compulsory requirement to attain sustainability in energy projects to avoid risks [79]. The cost of equity and other capital budgeting methods overcomes the weaknesses prevailing in developing countries such as Pakistan [80]. It is upon the strategic views adopted with the implications of capital budgeting techniques. NPV and profitability index are jointly connected to establish a solar power project [81]. An evaluation is asserting to select some methods linked with capital budgeting and the environment. In Pakistan, the solar power project has benefited greatly from the economic conditions. These conditions are potential impacts with green technology of some elements of financial planning and close associations of improvement towards sustainable development for selected and currently working solar power projects mentioned in Table 1. In light of these arguments, we proposed the following hypotheses as follows:
Hypothesis 5 (H5).
The project’s cost and risk positively moderate the association between NPV and financial performance of solar projects in Pakistan.

3.1.6. Moderating Role of Cost and Riskiness of the Solar Project between IRR and Financial Performance

Capital budgeting techniques can describe the financial visibility through its components such as uncertainty of the cash flows, the quantification of risk, and characteristics for decision making in high-risk investments in selected and currently working solar power projects in Pakistan. The IRR and NPV are used as fundamental approaches to measuring financial feasibility for solar power projects mentioned in Table 1. The decoupled NPV is a method used in the renewable energy field to quantify and identify the source of risk that can affect the anticipated cash flows of energy-producing projects [82]. The purpose of quantifying financial risk associated with selected solar energy projects is to secure financing in this study. Quantitative risk assessment is required to calculate economic viability measures, including the levelized cost of electricity (LCOE), IRR, and varieties of values of ambiguous input parameters that can control the operating cost, capital cost, and energy revenue. The level of the parameters indicates equal values for LCOE and IRR despite all being different measures of economic viability [83]. The financial analysis expressed that IRR, PBP, and cost of solar plant capital of the polycrystalline silicon were more than amorphous silicon thin film. However, amorphous silicon thin film provides a low income besides 25 years than polycrystalline silicon [84]. The higher financial leverages can be selected for project finance of solar resources by choosing a rational threshold amount for conditional value-at-risk (CVaR). The debt service coverage ratio is used to facilitate decision making in determining the weight of project finance [85]. IRR is engaged in estimating the profitability of renewable energy projects. However, the IRR with profit-sharing ranges from 1.67% to 7.64%, and without profit-sharing, it ranges are from 4.49% to 9.50% [86]. These arguments lead us to the formulation of the six hypotheses as follows:
Hypothesis 6 (H6).
The project’s cost and risk positively moderate the association between the internal rate of return and the financial performance of solar projects in Pakistan.

3.1.7. Moderating Role of Cost and Riskiness of the Solar Project between PBP and Financial Performance

The investment in renewable energy is an essential part of the economic growth and development of the country through the PBP technique for selected and currently working solar power projects in Pakistan. Photovoltaics can cover the annual electricity demand with a PBP of less than seven years for residential buildings. The PBP ranges of the solar combi system are between 5.5 and 6.5 years at the time of conventional fuel oil heating boiler and, in the case of natural gas boiler, nine years [87]. The study assesses the influence of four factors, the NPV technique, MIRR, PBP technique, and PI, to enhance the performance of selected and currently working solar power projects in the country. Financial analyses indicated that all costs were incurred during the lifetime of the solar project [61]. The solar system has an average payback period within a range of 2–20 years, but incentives have heavily influenced the solar system through the extensive range of the payback period [88]. The best renewable energy option for Pakistan is solar energy in terms of operation and maintenance cost, life span, and energy price [14]. The instability of electricity, CO2 prices, and the high investment cost are not favorable to attract renewable energy investment. Conversely, promoting technological progress, maintaining the market’s stability, and increasing the level of subsidy are helping to inspire investment [89]. The risk-averse strategy can reduce the obtained profit of the risk-neutral strategy by increasing robustness value that increases the solar radiation’s ambiguity. The concentrating solar power operating profit in the risk-taker strategy will be 7% greater due to the increase in solar radiation than the risk-neutral case [90]. The lower percentiles are associated with the great uncertainties in the annual solar irradiation series that can assess risk for securing solar power projects with competitive financing. The direct normal solar irradiation is ~1.6%, with first percentile uncertainty and global horizontal solar irradiation being ~4% [91]. The solar power plant developers must assess site risk for advanced performance in arid locations and places with high annual irradiance levels. The airborne sand and dust with substantial quantities increase the risk of optical energy losses due to erosion damages, soiling, and extinction [92]. The arguments are associated and guide us to the formulation of the seven hypotheses as follows:
Hypothesis 7 (H7).
The project’s cost and riskiness positively moderate the association between the payback period and financial performance of the solar project in Pakistan.

3.1.8. Moderating Role of Cost and Riskiness of the Solar Project between PI and Financial Performance

Pakistan requires an economic analysis methodology to simplify renewable energy’s cost and profitability assessment, especially in this study’s photovoltaic systems. The study assessing the cost and riskiness of the method is a considerable moderator between the internal rate of return method and the financial performance of the selected and currently working solar power projects in the country. This system helps preserve the environment, reduce global warming, lower the production of greenhouse gases [93,94], and is economically suitable for investors. Renewable energies have the leading role in expressing alternative energy policies based on sustainability, independence, and security [95,96,97]. The economic parameters, including PBP, IRR, NPV, and PI, are calculated under 0–50% subsidy rates and support the financial viability of the solar plant [98]. The relationship of these parameters with financial performance of solar power projects is presenting in Figure 1. The range of the transmission line losses depends on the length and load between 0.7% and 12.2% of these lines. Based on numerous economic factors, the PI of potential utility-scale transmission line losses of solar photovoltaic is between −9.11% and 69.65% [75]. Profitability analysis of the solar photovoltaic project is required three financial instruments such as PI, IRR, and NPV [99]. In South Asia, economic and trade liberalization policies have been expected to perform an attractive role in the transition phenomenon of renewable energy [100]. The investor’s opinion with a profitability index of 1.36 is economically feasible for solar energy communities [101]. Financial, technical, political, and environmental risks are the explicit risk factors associated with installing solar projects [102]. In light of these arguments, we proposed eight hypotheses as follows:
Hypothesis 8 (H8).
The project’s cost and riskiness positively moderate the association between profitability index and financial performance of social tasks in Pakistan.
This research has used non-probability (purposive) sampling with a green technology strategy for sustainable development and for improving selected solar power projects using capital budgeting techniques (CBT) mentioned in Table 1. Current working solar power projects were selected as research with a green technology strategy for sustainable development to improve their service and quality financial performance using CBTs. Specific solar projects were adopted when the purposive sampling technique was employed to present our sample from Pakistan’s top management of solar power projects. To fulfill this purpose, the researchers surveyed from March to August (2021); when the fourth wave (Delta variant), a type of coronavirus (COVID-19), was at its peak in Pakistan [103,104,105,106], it was a high risk to approach relevant respondents. Questionnaires were sent using mobile applications.
Purposive sampling is suitable for theoretical generalization, especially when accessing the whole population [107]. The ongoing research goal is to examine the impact of capital budgeting techniques on financial performance and examine the moderating role of cost and riskiness of the methods among the nexus of capital budgeting techniques and financial performance of solar power projects in Pakistan. The following criteria were considered for the selection of respondents: (i) top-level professionals, i.e., (i.e., chief financial officers and chief executive officers; (ii) respondents should have professional experience in the relevant fields; (iii) qualification of the respondents should not be less than the bachelor’s level. The recruitment criteria show that the respondents have a heterogeneous background with diverse behaviors and cultures. In this context, the sample is rich enough, and the findings generated based on such a sample provide a fair representation of the respondents with heterogeneous features. The demographic profiles of respondents are listed in Table A1, Appendix A.

3.2. Sample and Procedure

We managed to contact 87 top management officers, such as CFOs and CEOs of solar power projects. Among these, 63 agreed to participate in the survey. After obtaining the consent of top management officers, the researchers provided opened and closed hand questionnaires to each officer via LinkedIn and WhatsApp. Lastly, 51 filled questionnaires were returned from the total sample size of the questionnaire survey. However, the researchers discarded 7 questionnaires due to unmatched and inadequate responses; the response rate was 69.84%. Finally, the sample resulted in 44 valid responses from top management officers for study analysis. The respondents collected personal data from the stock exchange of Pakistan’s official website and companies’ respective websites. The finding is generated based on a fair representation of the sample. The respondents’ demographic features include age and experience, education, and gender, which also indicate heterogeneous backgrounds of the respondents that provided the proper response in this study (see Table 1). The first section of the questionnaire covers the personal detail of the respondents, while the second section of the questionnaire is related to the features of solar power projects, such as quality, financial performance, project cost, and energy supply.

3.3. Instrument and Variables for Measurement

In this study, we have taken scale items from previous literature. Six items measured the construct NPV technique (NPVT). These items have been selected and modified from the study of [108]. Four items measured the internal rate of return (IRR), and these items have been adopted and modified from the study of [109]. Five items measured the payback period technique (PBPT). These items were adopted and modified from [110]. Six items measured the profitability index (PI), and the items have been taken and modified from the research [111]. Cost and riskiness of method (CRM) were selected as a moderating variable, measured by four items. These items were adopted and modified from the work of [14]. Finally, the financial performance of solar power projects (FPSPP) was taken as a dependent variable and measured by five items. These items have been adopted and modified from the study of [112]. A five-point Likert scale was employed to assess each item, as 1 specifies “strongly disagree” and 5 specifies “strongly agree”.

4. Data Analysis and Results

Our research employed the structural equation modeling (SEM) method for data analysis objectives [113]. The study adopted this method to analyze the relational dimensions because it is a component-focused method [114]. PLS-SEM has frequent usage and appropriateness, which is why the author adopted it in this study; the subsequent studies are evidence [115,116]. Structural equation modeling (SEM) is more advantageous than other methods of traditional statistical analysis. It is helpful for statistical analysis regarding efficiency, convenience, and accuracy [117,118]. SEM covers the problems of first-generation analysis, but it is a second-generation technique. SEM can assist in analyzing abundant variables at the same time because it is a multivariate analysis process. SEM is continuously popular in business research because it can simultaneously deal with complex and multiple relationships [119].
The inappropriate adoption of analytical methods can cause inaccurate conclusions; however, an appropriate statistical technique is most important for management and social science research [120]. Measurement and structural models are two-stage analysis approaches of PLS-SEM that include measurement results in two steps [
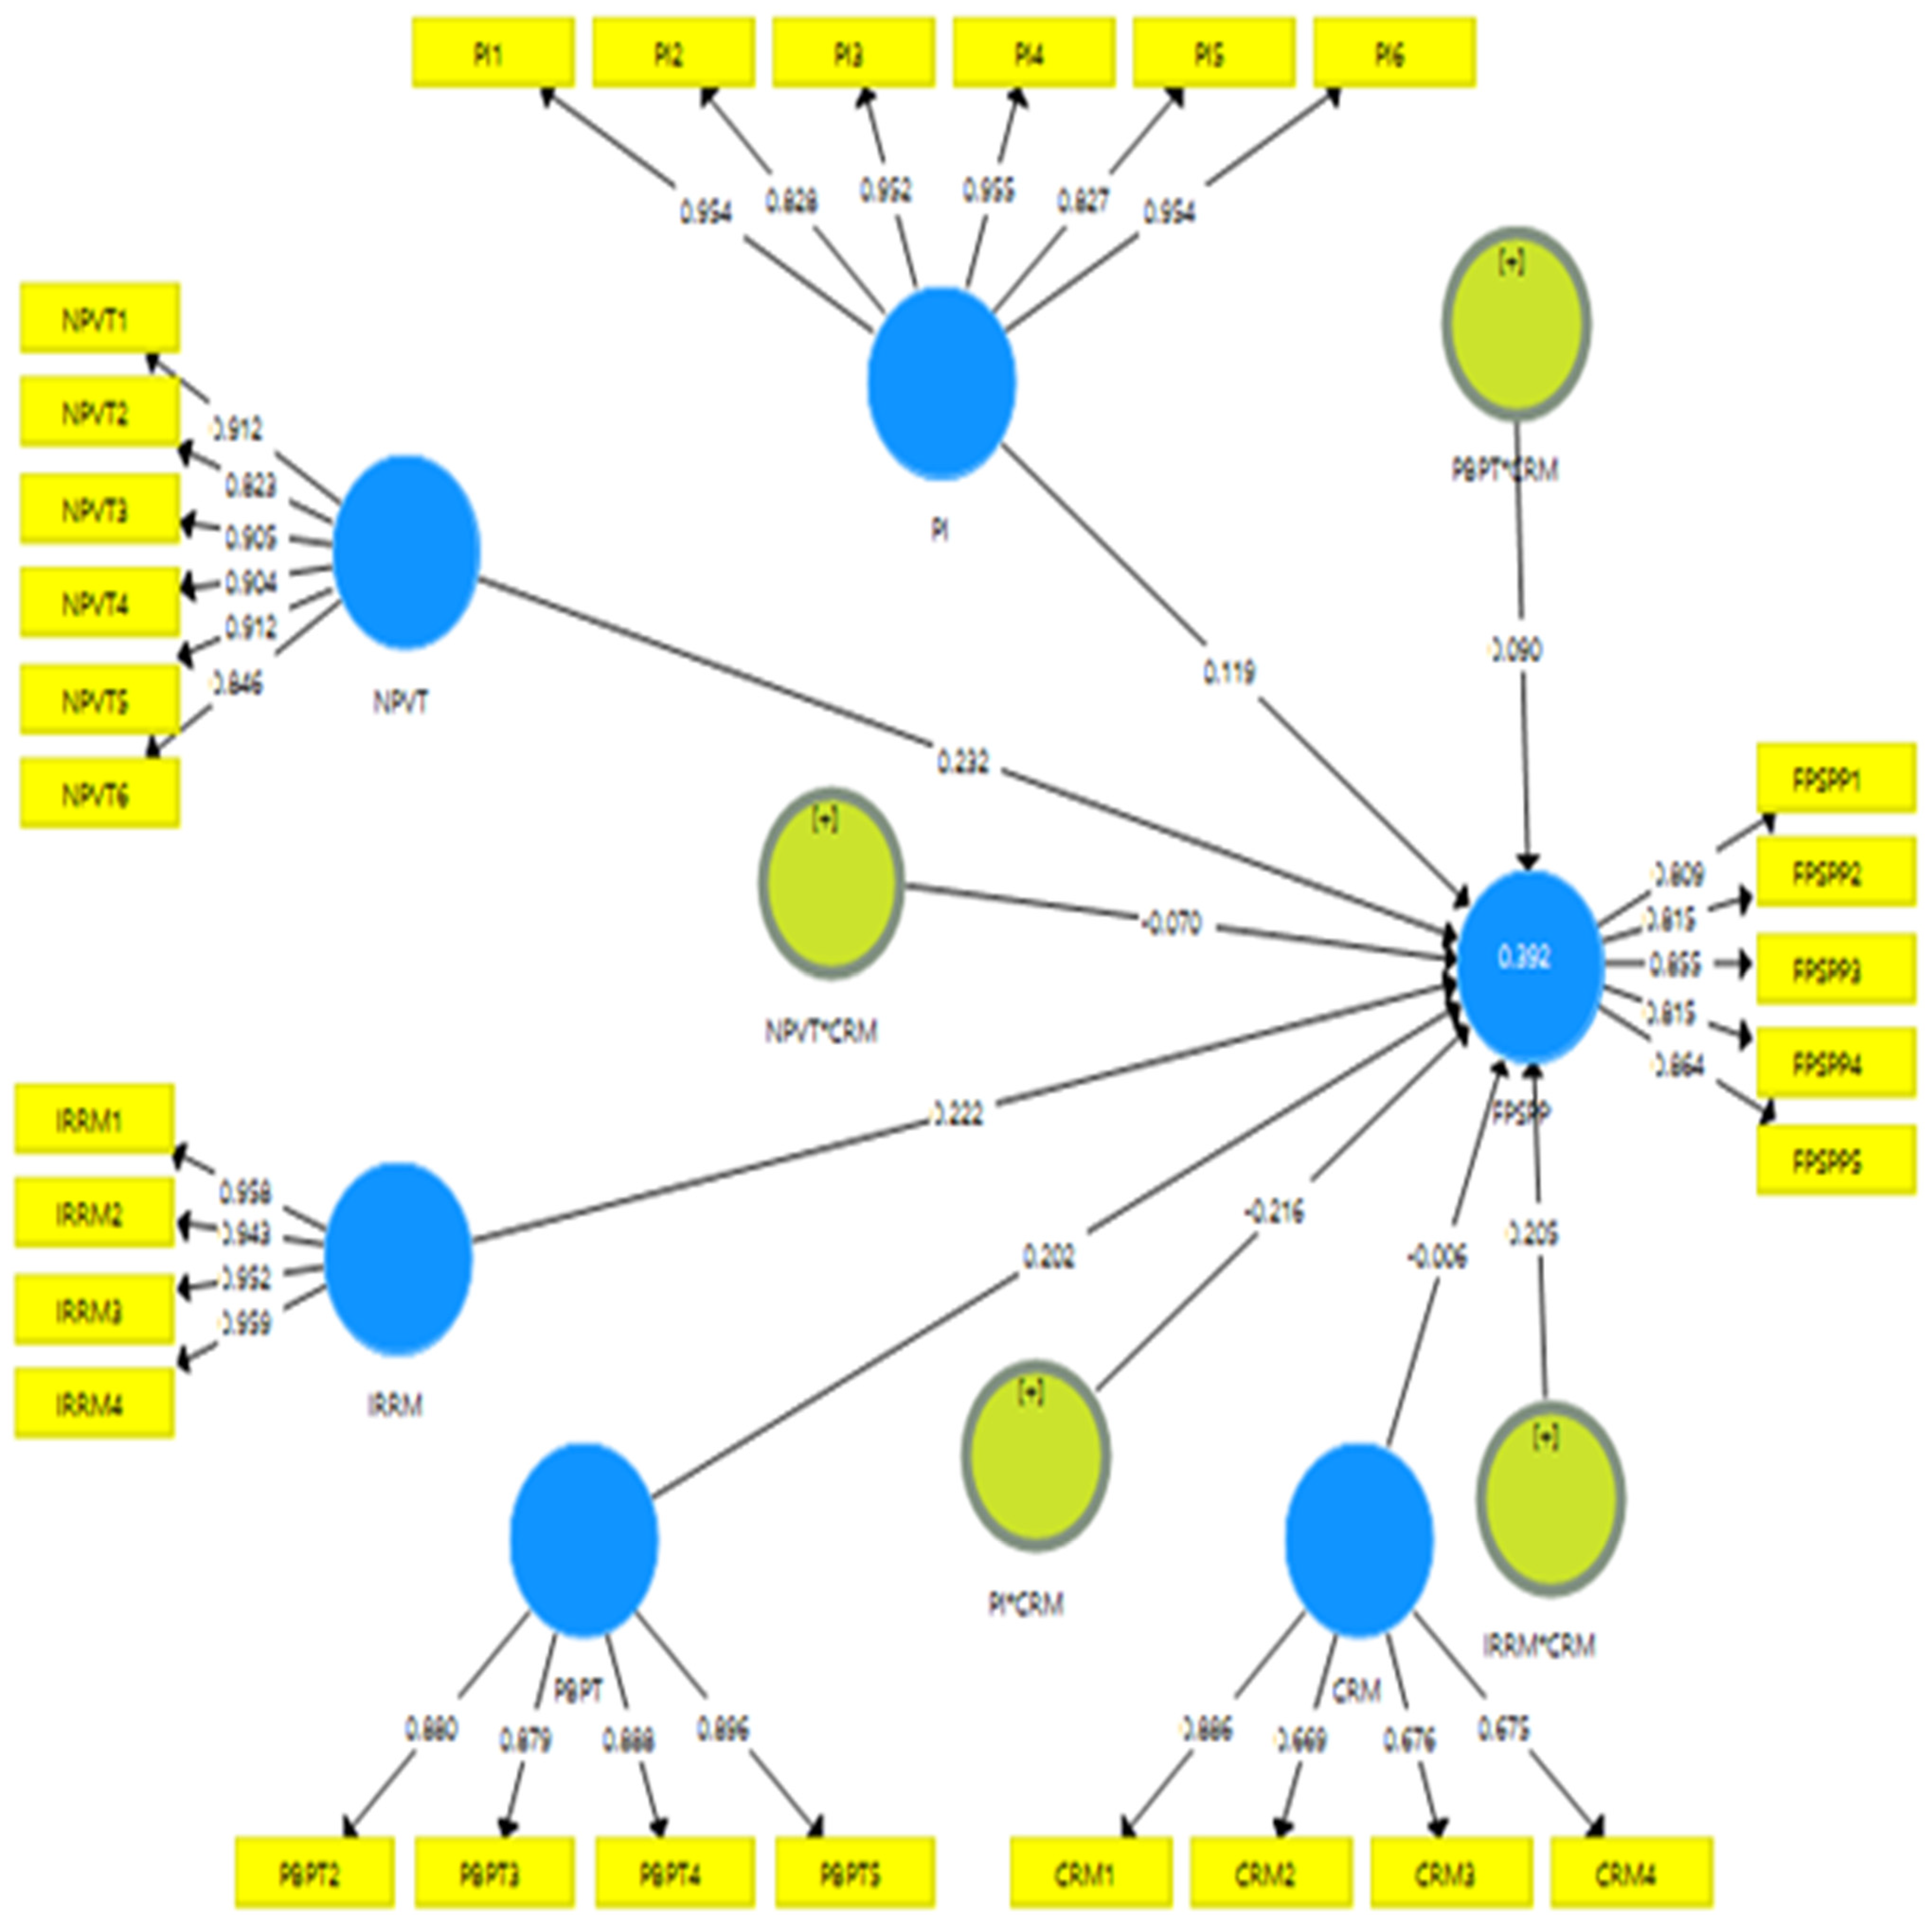
121]. Reliability and validity tests or the assessment of the inner model was included in the measurement assessment model for selected and currently working solar power projects in this study. Hypotheses and relationships testing, or the evaluation of the outer model, formed a structural assessment model for selected solar projects. The present research used PLS 3.0 software for primary data analysis and examined the links among the understudy variables. Additionally, partial least square path modeling has higher statistical power than covariance-based structural equation modeling. PLS-SEM is more advantageous to intercept relationships among the variables.
In addition, the smart-PLS for variance-based structural equation modeling (SEM) uses the partial least squares (PLS) path modeling method to examine the nexus among the variables [122]. The purpose of smart-PLS is to hypothesize testing in the research, and the complex model research has adapted to it. The smart-PLS has two approaches: a measurement assessment model and a structural model for the analysis used in this study. The assessment measurement model includes the reliability and validity of the constructs checked with convergent and discriminant validity. The convergent validity related to the correlation among the items examined using the Chronbach Alpha, composite reliability (CR), and items loading. However, the discriminant validity is associated with the correlation among variables examined using Fornell Larcker, cross-loading, and Heterotrait–Monotrait ratio. In addition, the assessment of the measurement model includes the testing of hypotheses that were reviewed using path analysis—the analysis of the study discussed in the findings section.
The path analysis has shown the links among the variables in this study. The results revealed that capital budgeting techniques such as net present value, internal rate of return, payback period, and profitability index positively impact the selected and currently working solar power projects’ financial performance, and they accept H1, H2, H3, and H4. In addition, the findings also indicated that cost and riskiness of techniques significantly moderated among the nexus of internal rate of return, profitability index, and financial performance of the selected and working solar power projects mentioned in Table 1, and they accept H6 and H8. Finally, the findings section of the measurement model has first shown the nexus’s convergent validity among the selected solar power project items in this study. The figures show that the loadings and average variance extracted (AVE) values are higher than 0.50, while Alpha and CR values are more significant than 0.70. These values have indicated that convergent validity is the valid and high connection among the items. The results of the research also include the assessment of correlation among items named convergent validity. The figures highlighted that the factor loadings are more significant than 0.50, Alpha values are more than 0.70, AVE values are also higher than 0.50, and CR values are also greater than 0.70. These values have indicated a high correlation among items and valid convergent validity. The results are reported in Table 2.

4.1. Measurement Assessment Model

In the present research, measurement model evaluation was required to conduct reliability and validity tests for all the given constructs. The measurement model confirms the reliability and validity of the constructs and the factor loadings of all items approved by the model [123]. The measurement evaluation model is consistent on reliability tests (item reliability and internal consistency reliability) and validity tests (convergent validity and discriminant validity) [124]. Convergent validity has been measured over the AVE, internal consistency reliability has been measured over composite reliability (CR), and item reliability has been measured over outer loading in this study. All item loadings are well upstairs with the threshold value of 0.5 [125]; see Table 2. The analysis of the study verified that all of the averaged factor loadings were greater than 0.50, and each observation contributed to the constructed variable [126]. AVE exceeds the suggested value of 0.5. The composite reliability value for each standard exceeds the cut-off point of 0.7, which displays that the measurements are reliable [127]. The results of the current selected solar power projects designate that all the values of AVE are between 0.536 (cost and riskiness of methods) and 0.908 (internal rate of return method). CR values are between 0.820 (cost and riskiness of methods) and 0.975 (internal rate of return method). The values of all additional loadings are between 0.5 and 0.959.
All verified validity and reliability values in this measurement model are given below in Table 3, Table 4 and Table 5. All the factor loading values are more significant than 0.50; thus, the convergent validity of all items is valid in the measurement assessment model.
The findings of this research also include the assessment of correlation among variables named as discriminant validity. First, a conventional method of Fornell–Larcker and cross-loading were used to test the discriminant validity (see Table 3). These values indicated a low correlation among variables and verified the discriminant validity of the selected solar power projects. The bold values in Table 4 show that all factors have a strong relationship but weak relationships with other factors. The bold values of the cross-loadings table were compared with other factors row-wise to check discriminant validity. The cost and riskiness method (CRM) values are greater than row-wise other factors and show strong discriminant validity in this study and so on. The other left and right values are smaller compared to bold values in Table 4. The measurement assessment model is shown in Figure 2, which indicates the factor loading of the variables.
The Heterotrait–Monotrait ratio of correlations (HTMT) for discriminant validity measure is considered more suitable due to different researchers’ criticism on the criteria of Fornell-Larcker [128]. The value of discriminant validity confirms if it is less than 0.85 [129] or 0.90 [113]. All values are less than 0.90 in Table 5. The findings section has also shown the discriminant validity that is about the nexus among the variables. First, cross-loadings and Fornell Larcker are used to test the discriminant validity. The figures have shown that the values that indicated the nexus with the variable itself are higher than those with other variables. These values explored that discriminant validity is the valid and low connection among the variables. All values are highlighted in Table 5. Second, the latest method, such as the HTMT ratio, has been used to test the discriminant validity. The figures highlight that the figures of HTMT ratio are lower than 0.85. These values have indicated a low correlation among variables and valid discriminant validity (see Table 5).

4.2. Structural Assessment Model

The smart-PLS have two steps. First, the measurement model, and second, the structural assessment model. The second step was applied here, which checked the relationship between exogenous and endogenous variables. The different types of statistical values are presented by the structural assessment model including effect size (f2), t values, predictive relevance (Q2), coefficient of determination (R2), and path coefficient (β values). The PLS-SEM literature has provided the criteria to evaluate hypotheses and estimate the significance of path coefficients. The 5000 sub-samples were applied for bootstrapping process with a 5% significance level (one-tailed) to test the significance of the hypotheses [124]. Results indicate that H4 and H7 are not accepted. NPV (β = 0.222, t = 2.331 > 1.64, p < 0.05), NPV relationship (moderator), (β = 0.202, t = 3.441 > 1.64, p < 0.05), internal rate of return (β = −0.205, t = 2.552 > 1.64, p < 0.05), internal rate of return relationship (moderator), (β = 0.090, t = 1.660 > 1.64, p < 0.05), payback period, (β = 0.232, t = 2.303 > 1.64, p < 0.05), payback period relationship (moderator) (β = 0.119, t = 1.408 > 1.64, p < 0.05), profitability index, (β = −0.070, t = 0.639 > 1.64, p < 0.05), profitability index relationship (moderator) (β = 0.179, t = 2.681 > 1.64, p < 0.05) have a positive and significant impact on the performance of selected and currently working solar power projects mentioned in Table 1.
The R2 value for NPVT → FPSPP is 0.458, indicating that the model has substantial explanatory power for increasing the financial performance of solar power projects. However, the R2 value is not enough to be considered a suitable and effective method to assist a model [130]. Consequently, the predictive relevance measurement Q2 of the model is a suitable method. The value of Q2 is more sophisticated than zero, which was indicated by the latent exogenous standards with excessive predictive relevance [128]. The value of Q2 is 0.245, which shows the model has significant predictive relevance and suggests the financial performance of solar power projects is increasing through CBTs. The f2 has a typical value, including 0.02, 0.15, and 0.35, which indicate effects in three categories, small, medium, and large, respectively [129]. Thus, the value of f2 assumed that effect size differs from medium to large (see Table 6). Several kinds of statistical techniques are mentioned in Table 6. The structural assessment model is shown in Figure 3. The variables show a significant relationship in the model, the t values are more critical than 1.64, and the profitability index not positively impacts financial performance. The values of moderated variables have positive signs and show an entirely substantial relationship in the structural assessment model for solar projects in Pakistan.
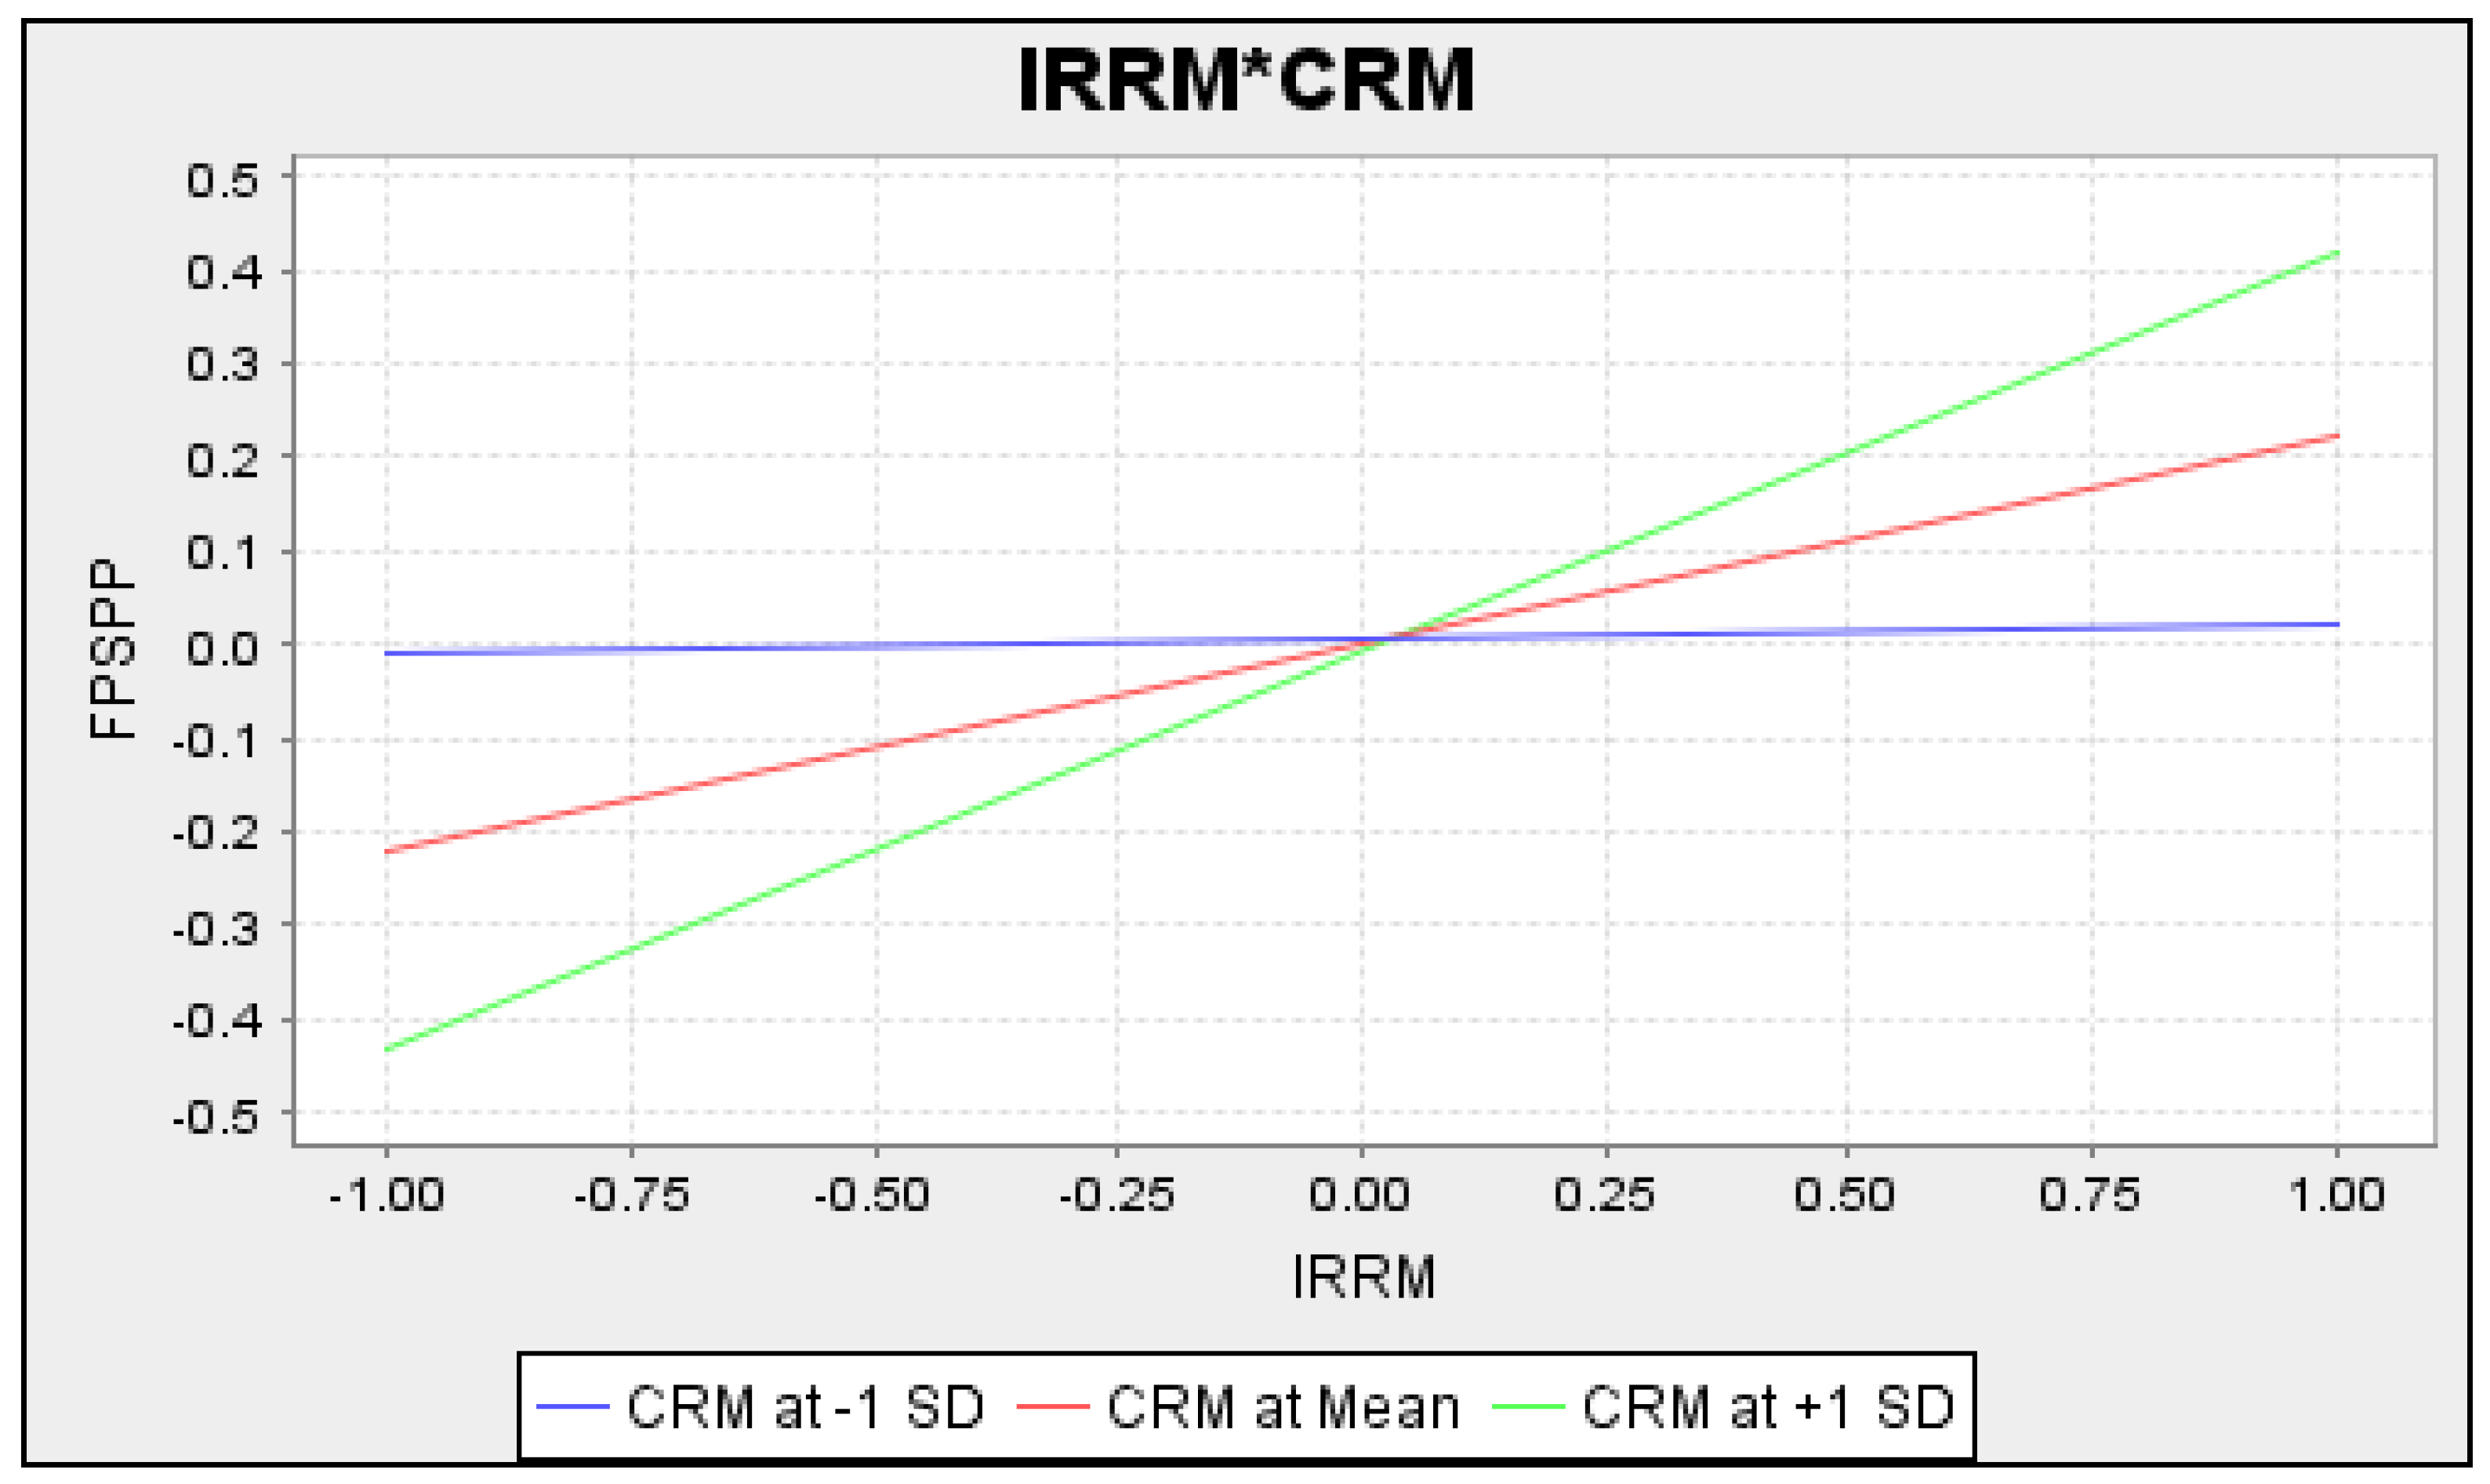
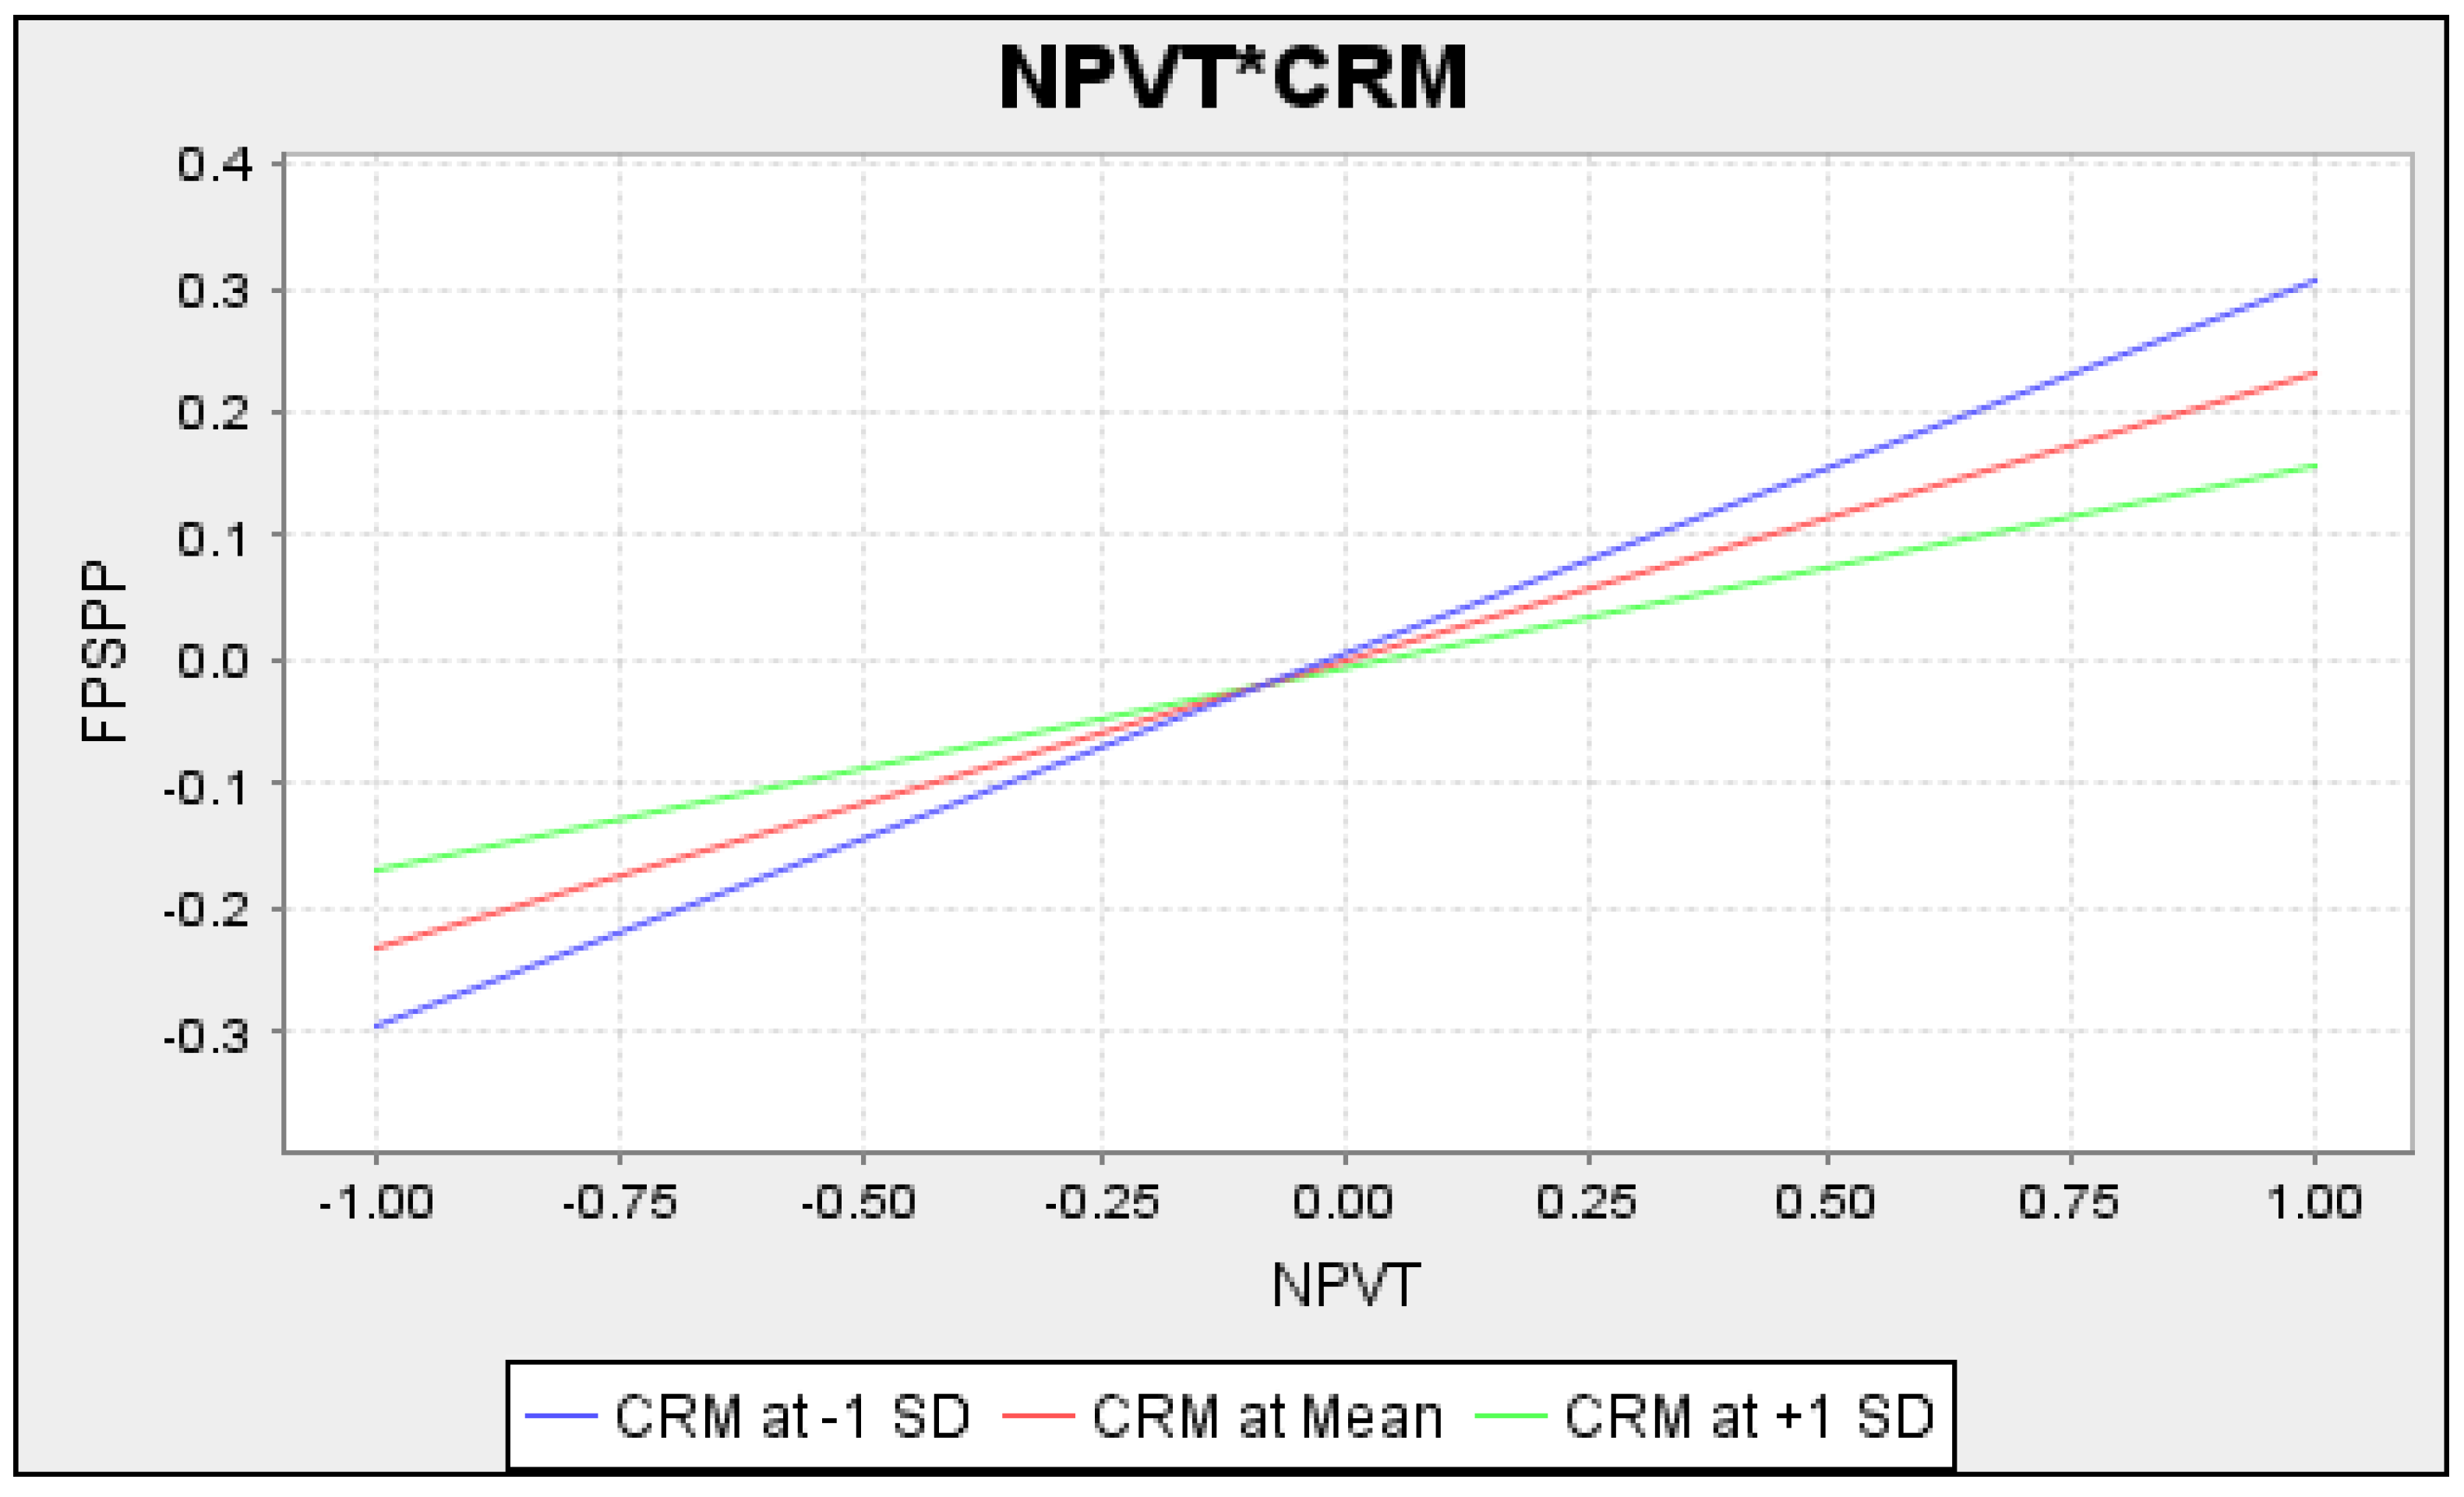
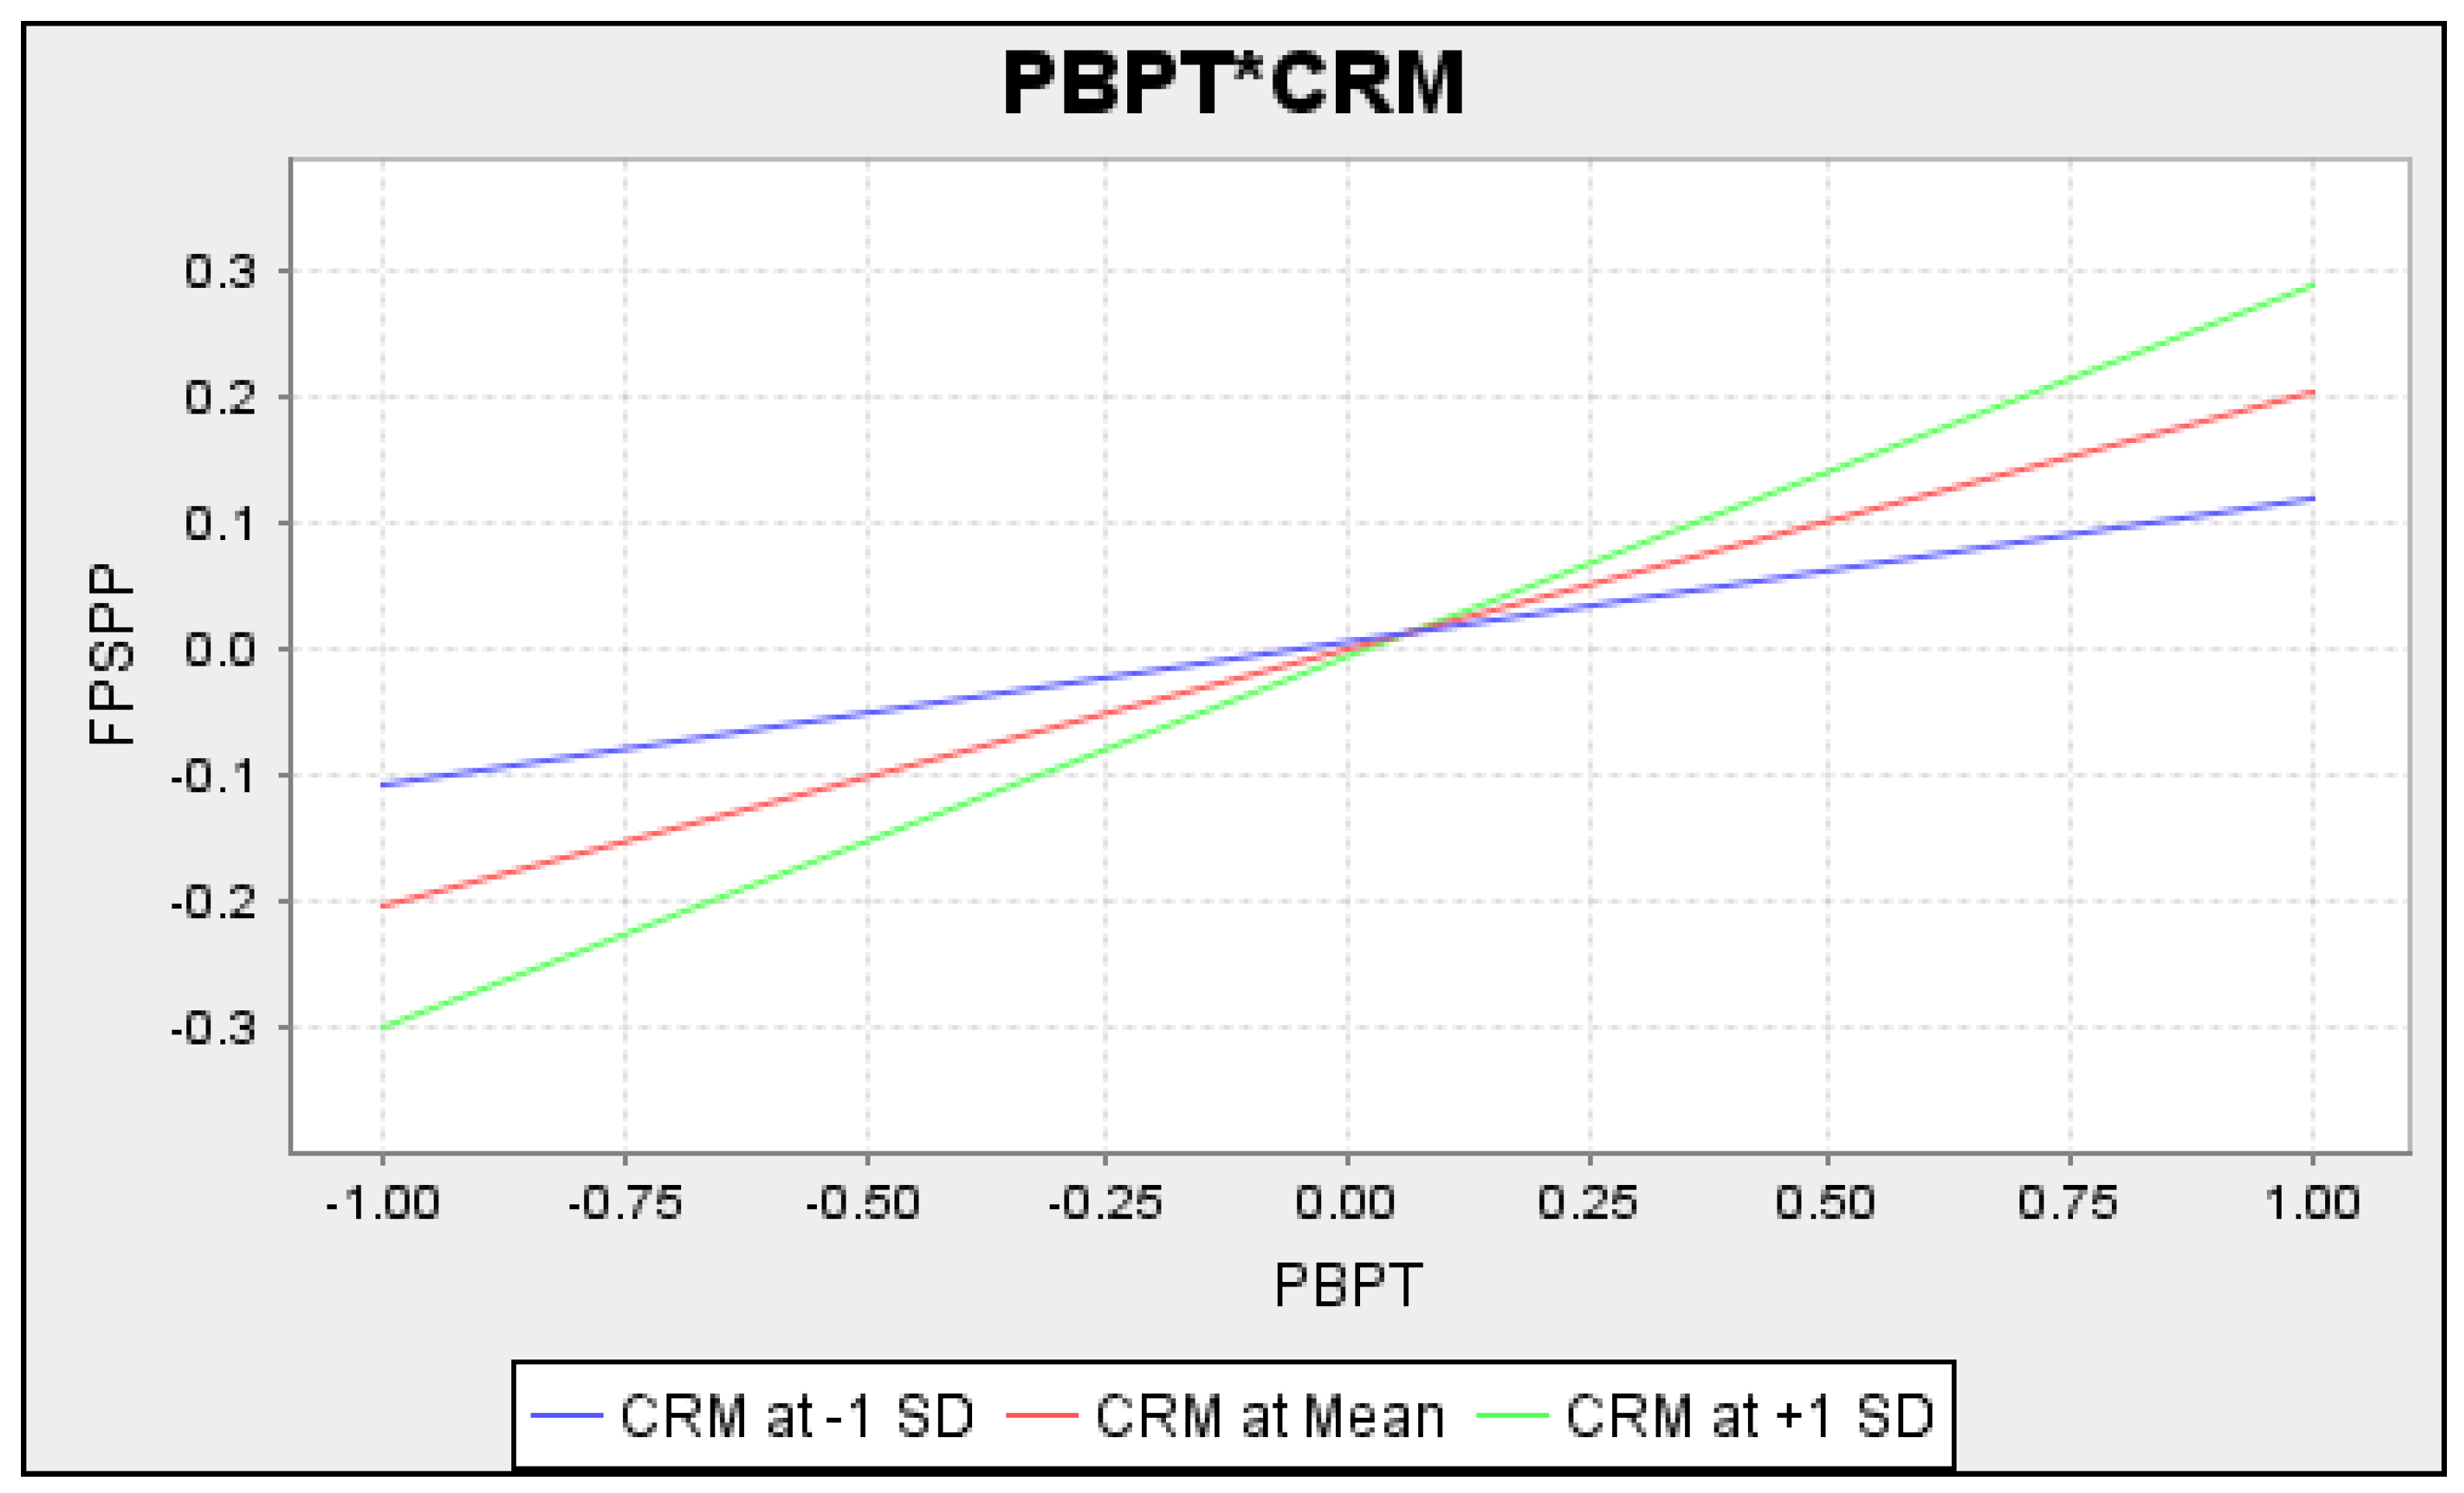
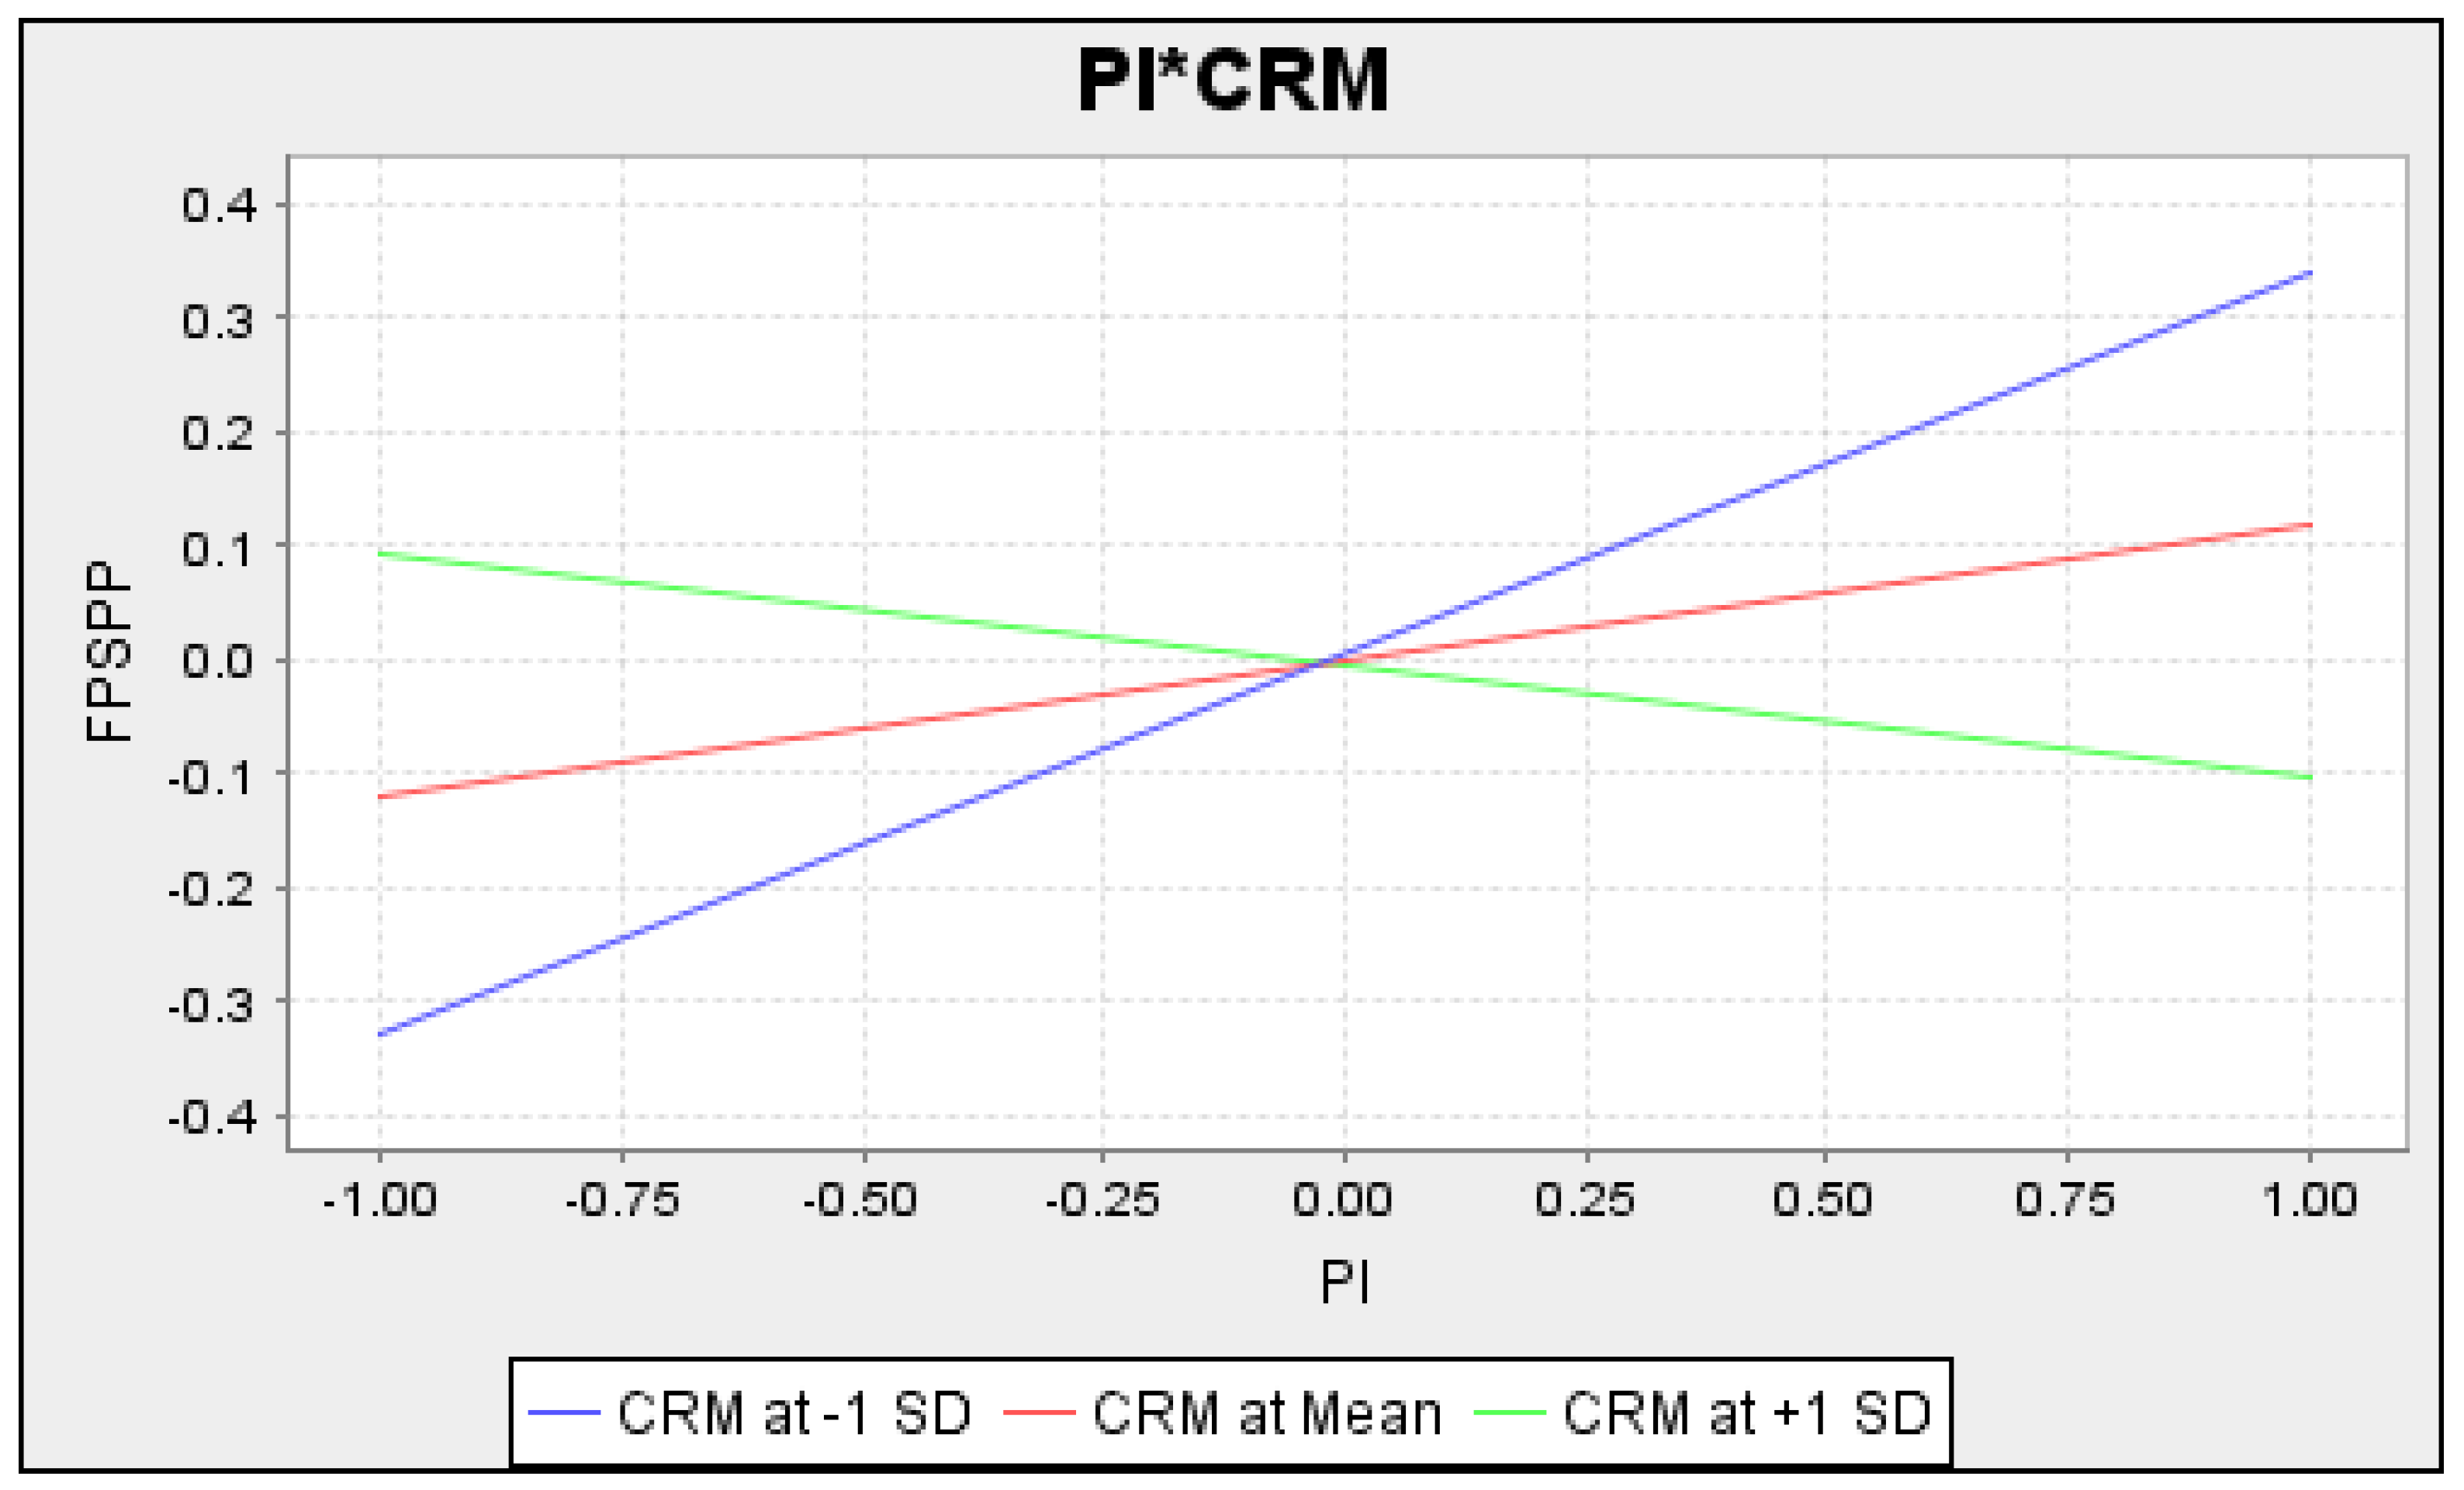
Figure 4 shows the results of moderations. The green line defines the positive or negative relationship among moderated variables of selected solar power projects in this study. After intersecting, if the green line is higher than red and blue, it shows a positive relationship. However, Figure 4 shows the positive relationships among the moderate variables because the green line is upper than blue and red. In contrast, Figure 5 shows the negative relationships among the moderate variables because the green line is lower than blue and red. Figure 6 also shows the positive relationships among the moderate variables because the green line is upper to the blue and red line. Finally, Figure 7 shows the negative relationships among the moderate variables because the green line is lower than the blue and red line.

5. Discussion and Implications

The study examines how financial planning can be assessed through capital budgeting techniques such as net present value. The results reveal that the NPV technique has a significant and favorable influence on the financial performance of solar power projects. The projects have a high performance when the capital invested is under the NPV technique. These results are in line with the past study of [131]. In this regard, the research suggests that the NPV technique proves to be beneficial for the currently working solar power projects to attain higher financial performance.
Additionally, the study results have also indicated that the internal rate of return method for assessing financial planning has a positive link with the financial performance of the selected currently working solar power project in Pakistan. These results verify the results of a past study, highlighting the influences of the internal rate of return method on investment in different power projects [132]. The present study implies that the internal rate of return method helps the management attain higher profitability on investment in different selected and currently working solar power projects. Furthermore, the study results indicate that the payback period method (one of the capital budgeting techniques) positively affects the financial performance of selected and currently working solar power projects. The study also indicates that the payback period technique significantly impacts solar power projects and shows better financial performance if it adopts the selected and currently working solar power projects. These results agree with the study results of [133], which implies that applying the payback period technique for assessing financial planning while making investment decisions improves the financial performance of solar power projects. This study also aligns with past research that the investment based on periods can recover the investment cost and give a higher financial performance. Therefore, solar power projects have more investment and enjoy better financial performance; thus, there is a minor complication in the acquisition of solar projects in this case [134]. Consequently, investment is increasing, and the financial performance of the solar power projects is growing.
The study makes both theoretical and empirical implications. This literary work is significant as it contributes to economic literature. The study deals with the influence of four factors: the NPV technique, MIRR, PBP technique, and PI to enhance the performance of selected and currently working solar power projects in the country. This study adds in literature to introduce capital budgeting techniques to minimize the cost and risk in solar power projects. The present study has provided the guidelines to the top management of the private and government sector in renewable energy to adopt capital budgeting techniques for better financial planning to enhance the performance of solar power projects. The study carries great importance to the economists of an emerging economy such as Pakistan because the guidance of this study improves the performance of selected and currently working solar power projects. The best financial planning can reduce the cost and risk of solar projects and enhance the financial performance of solar power projects. Hence, capital budgeting techniques can improve the financial position of the solar power projects if appropriate financial planning is adopted in the projects.
The results indicate that the profitability index has a positive relationship with the financial performance of the selected and currently working solar power projects. The improvement in the profitability index of the investment in particular solar power projects brings higher investment in such projects and drives higher financial performance. The previous study has approved these results [135]. The capital budgeting technique, such as the profitability index, helps to make an investment considering the attainment of higher profitability on the investment in the future. The paper concludes that investment under the profitability index raises the performance level of solar power projects. The study results further reveal that the cost and riskiness of the capital budgeting method is not a perfect moderator between the NPV technique and the financial performance of the selected and currently working solar power project. The study suggests that the cost and riskiness of the NPV technique affect the financial performance of the selected and currently working solar power projects. These results comply with the study of [132], indicating that the cost and riskiness of the method affect both the NPV technique and the financial performance of the solar power projects and their mutual association. The study results have also indicated that the cost and riskiness of the method is a considerable moderator between the internal rate of return method and the financial performance of the selected and currently working solar power projects in the country. These results align with the past study of [76], which indicates that the cost and riskiness of the capital budgeting method, such as the internal rate of return method, affect the effectiveness of this method and the performance of solar power projects.
The study suggested that the NPV technique proves to be beneficial for selected and currently working solar power projects to attain higher financial performance. The internal rate of return method attains higher profitability, and assessing financial planning has positively linked the financial performance in selected and currently working solar power projects in Pakistan. The study results have indicated that the payback period method positively correlates with the financial performance of selected and currently working solar power projects. The profitability index is an effective technique that helps assess the investment’s profitability over different periods and allows the investors to make increased profits on the investment. The study analysis proves that the profitability index is a good source of the higher financial performance and payout of the selected and currently working solar power projects in Pakistan. The findings provide appreciated guidelines for the ministry of water and power, policymakers, government institutions, regulators, and top management of the alternative energy development board (AEDB) to adopt these capital budgeting techniques for selected and currently working solar power projects in the country. The competent authorities should consider NPV, PBP, IRR, and PI to reduce the cost and risk and enhance the performance of selected and currently working solar power projects in Pakistan.
These results also align with the past study, highlighting the cost occurrence and the riskiness involved in the internal rate of return. Still, this budgeting method improves the capital budgeting technique’s contribution to attaining the higher performance of solar power projects [78]. Our results have shown that the cost and riskiness of the method have not played a moderating role between the payback period technique and the performance of the solar power projects. These results are in line with the previous study of [131]. The study analyzes the influences of cost and riskiness on the effectiveness of the payback period method in power projects. It shows that the cost and riskiness of the technique prove to be a perfect moderator between the payback period method and the performance of the selected and currently working solar power projects in Pakistan. Furthermore, the results have revealed that the cost and riskiness of the process play a moderating role between the capital budgeting technique such as profitability index and the performance of selected and currently working solar power projects in the country. These results agree with the results of [136], which show that the cost and riskiness of the method affect both the profitability index and the performance of solar power projects. Thus, the financial performance is also affected by selected and currently working solar power projects in Pakistan.

6. Conclusions and Limitations

The present study examined capital budgeting techniques for assessing financial planning and attaining the higher financial performance of selected and currently working solar power projects in Pakistan. In this regard, we scrutinized four capital budgeting techniques, such as the NPV technique, MIRR, PBP technique, and PI, concerning the financial performance of the selected and currently working solar power projects in this study. The NVP of the capital budgeting technique analyzed the cash inflows and outflows; it helps make profitable investments in different projects. Under this capital budgeting method, the level of investment in solar power projects is rising, raising their performance level.
The assessment of the period that an entity takes to cover the investment cost is a simple capital budgeting technique because the lack of complications obtains popularity among the investors and raises the financial sources and financial performance of solar power projects. Similarly, the profitability index is one of the effective capital budgeting techniques that help to assess the investment’s profitability over different periods. It allows the investors to make a good choice, resulting in increased profits on the investment. The study analyzed that the profitability index is a good source of the higher financial performance of the selected and currently working solar power projects in Pakistan. Besides, the study examined the cost and risks by adopting particular capital budgeting techniques, including the NPV technique, MIRR, PBP technique, and PI, concerning the selected and currently working solar power projects. As a result, the influence and effectiveness of the NPV technique attained the higher financial performance of the selected and currently working solar power projects in Pakistan.
Thus, the study shows that these capital budgeting techniques positively correlate with capital investment, return on capital, and cost and risk for sustainable development of the selected and currently working solar energy projects in Pakistan. The study also examined that these techniques are the best way to assess capital investment, return on investment, and capital investment before investing in a solar energy project in Pakistan. The present study has proved that capital budgeting techniques are more significant and better for green technology, return on capital, financial management, to assess cost and riskiness, and capital cost investing in selected and currently working solar energy projects in Pakistan. The R2 value shown in Table 6 for NPV is 0.458, which indicates that the model has substantial explanatory power for increasing the financial performance of selected and currently working solar power projects in Pakistan. The value of Q2 is 0.245, which shows that the model has significant predictive relevance and suggests that the financial performance of selected and currently working solar power projects is increasing through CBTs. The variables show a meaningful relationship of a PBP of l in the model; the t values are more critical than (1.64), and the profitability index positively impacts financial performance. The importance of moderated variables has positive signs and shows an entirely substantial relationship in the structural assessment model for selected and currently working solar projects in Pakistan. The study has also disclosed that these techniques and their moderation adopted in this research have a positive and significant impact on the performance of selected solar energy projects in Pakistan.
Similarly, the study prompts introducing the cost and riskiness of the method as a moderator between the capital as mentioned-above budgeting techniques and the financial performance of the selected and currently working solar power projects. The study also proves which techniques are more profitable in different circumstances and improves the financial performance for sustainable development of selected and currently working solar power projects. Despite its theoretical and empirical implication, the current study has several limitations that future authors should recover. First, the study has analyzed the influences of four capital budgeting techniques such as the NPV technique, MIRR, PBP technique, and PI on the financial performance of selected and currently working solar power projects in Pakistan. At the same time, the other capital budgeting techniques, such as discounted payback period, modified internal rate of return, etc., and other economic factors affecting the financial performance of solar power projects have been completely neglected. Therefore, the authors in the future must also analyze the rest of the capital budgeting techniques and economic factors while replicating these study results.
Similarly, the study has kept the financial performance of selected and currently working solar power projects launched in Pakistan, a developing economy. Thus, the research is not equally valid in both developing and developed countries. Therefore, future authors must analyze the influences of capital budgeting techniques on the financial performance of solar power projects in developed economies.

Author Contributions

Conceptualization, S.A.; Data curation, M.I.; Formal analysis, S.A.; Funding acquisition, Q.Y.; Methodology, S.A.; Project administration, M.I.; Software, M.I.; Supervision, Q.Y. and M.I.; Writing—original draft, S.A.; Writing—review and editing, M.S.H., M.I., M.A., A.R., V.D., and C.I. All authors have read and agreed to the published version of the manuscript.

Funding

This research received no external funding.

Institutional Review Board Statement

The study was conducted according to the guidelines of the Declaration of Helsinki, and approved by the Institutional Review Board of Superior University, Pakistan (protocol code 634-2 on 12-07-2021).

Informed Consent Statement

Informed consent was obtained from all subjects involved in the study.

Data Availability Statement

The data that support the findings of this study are available from the corresponding author upon reasonable request.

Conflicts of Interest

The authors declared no potential conflicts of interest concerning this article’s research, authorship, and publication.

Appendix A

Table A1. List of questions and how respondents countered in the semi-structured interview.
Part A: Demographic Characteristics of the Respondents
CharacteristicsOptionsFrequencyPercentage
GenderMale4193.18
Female36.81
Age26–30 years36.81
31–401125
41–551329.54
56–651227.27
65 and above511.36
Education of respondentsBachelor 20.45
Master 52.27
MS/MPhil 27.27
Selected industrySurgical sector920.45
Cotton weaving1329.54
Cosmetic industry1227.27
Sports goods industry1022.72
Solar panel brand name adopted by the ownersJinko Eagle 72 H.M. G21329.54
Trina solar TSM1022.72
Sun power x22920.45
Ja solar MR series715.9
Hanwha Q cell Speak Duo511.36
Job experience1–5 years715.9
6–10 years1125
11–15 years920.45
More than 15 years1738.63
Part B: Influencing Factors of Sustainable Development of Solar Power Projects
VariablesItemsQuestionsPercentage
Net present value techniqueNPVT1Solar energy projects are demanding capital budgeting planning26.3
NPVT2The net present value approach can assess the profitable project of solar energy 24.4
NPVT3Capital budgeting techniques can support the development of solar energy13.2
NPVT4The net present value technique can determine the long-term investment and differences in cash flows for solar energy projects11.5
NPVT5Long-term business and financial planning are necessary for solar energy projects by using net present value12.9
NPVT6There is a need to use net present value technique to attract investors and foreign direct investment in a solar energy project11.7
Internal rate of return methodIRRM1The internal rate of return approach can assess the profitable project of solar energy29.1
IRRM2A firm can decide investment in a solar energy project with an internal rate of return32.2
IRRM3There is a need to adopt an internal rate of return to assess return on capital for a solar energy project 24.4
IRRM4Solar energy projects require innovative and rational financial decisions by using an internal rate of return14.3
Payback period techniquePBPT1The payback period approach can assess the profitable project of solar energy23.7
PBPT2There is a need to assess the duration of capital return for solar energy systems25.9
PBPT3The payback period technique can assess the initial investment cost.24.3
PBPT4There is a need to boost up the solar energy project by using the payback period technique13.3
PBPT5The payback period approach is suitable for analyzing the solar energy project performance12.8
Profitability indexPI1The profitability index technique shows the relationship between payout and investment of the solar energy project22.6
PI2The profitability index provides the best estimation of the financial performance of the solar power projects14.3
PI3Solar energy projects need to calculate their performance using the profitability index16.3
PI4There is a need to indicate the relationship between investment of the project and payout of the project using the profitability index.17.7
PI5The profitability index is a suitable technique to assess solar energy projects17.2
PI6There is a need to know the suitable solar power project for investment using the profitability index11.7
Cost and riskiness methodCRM1The cost of capital budgeting technique influences the performance of solar energy projects29.7
CRM2The cost of the techniques influences its selection and rejection.26.3
CRM3There is a need to assess the risk and cost of the capital budgeting technique to minimize it22.6
CRM4The riskiness of the techniques influences its selection and rejection.21.4
Financial performance of solar power projectFPSPP1Financial performance is a subjective measure in which a solar firm can maintain the standards to use assets and generate revenue29.1
FPSPP2Financial planning for solar energy projects is necessary to assess financial performance27.2
FPSPP3There is a need to compare the same solar projects for their financial health through capital budgeting techniques13.1
FPSPP4The financial performance of the solar power project can be assessed through capital budgeting techniques19.4
FPSPP5There is a need to analyze the financial performance of the solar power project 11.2

References

  1. Ahmad, F.; Draz, M.U.; Chandio, A.A.; Su, L.; Ahmad, M.; Irfan, M. Investigating the myth of smokeless industry: Environmental sustainability in the ASEAN countries and the role of service sector and renewable energy. Environ. Sci. Pollut. Res. 2021, 28, 55344–55361. [Google Scholar] [CrossRef]
  2. Tanveer, A.; Zeng, S.; Irfan, M. Do Perceived Risk, Perception of Self-Efficacy, and Openness to Technology Matter for Solar PV Adoption? An Application of the Extended Theory of Planned Behavior. Energies 2021, 14, 5008. [Google Scholar] [CrossRef]
  3. Jan, A.; Xin-gang, Z.; Ahmad, M.; Irfan, M.; Ali, S. Do economic openness and electricity consumption matter for environmental deterioration: Silver bullet or a stake? Environ. Sci. Pollut. Res. 2021, 28, 54069–54084. [Google Scholar] [CrossRef] [PubMed]
  4. Akram, R.; Chen, F.; Khalid, F.; Huang, G.; Irfan, M. Heterogeneous effects of energy efficiency and renewable energy on economic growth of BRICS countries: A fixed effect panel Quantile Regression Analysis. Energy 2020, 215, 119019. [Google Scholar] [CrossRef]
  5. Hussain, A.; Oad, A.; Ahmad, M.; Irfan, M. Do financial development and economic openness matter for economic progress in an emerging country ? Seeking a sustainable development path. J. Risk Financ. Manag. 2021, 14, 237. [Google Scholar] [CrossRef]
  6. Mukeshimana, M.C.; Zhao, Z.Y.; Ahmad, M.; Irfan, M. Analysis on barriers to biogas dissemination in Rwanda: AHP approach. Renew. Energy 2020, 163, 1127–1137. [Google Scholar] [CrossRef]
  7. Irfan, M.; Ahmad, M. Relating consumers’ information and willingness to buy electric vehicles: Does personality matter? Transp. Res. Part D Transp. Environ. 2021, 100, 103049. [Google Scholar] [CrossRef]
  8. Panji Galih Kusumo Adie Capital Budgeting Analysis to Assess the Karaoke Business Feasibility Panji. Pinisi Discret. Rev. 2019, 3, 47–52. [CrossRef]
  9. Dagar, V.; Khan, M.K.; Alvarado, R.; Rehman, A.; Irfan, M.; Adekoya, O.B.; Fahad, S. Impact of renewable energy consumption, financial development and natural resources on environmental degradation in OECD countries with dynamic panel data. Environ. Sci. Pollut. Res. 2021, 1–11. [Google Scholar] [CrossRef]
  10. Abdelhady, S. Performance and cost evaluation of solar dish power plant: Sensitivity analysis of levelized cost of electricity (LCOE) and net present value (NPV). Renew. Energy 2021, 168, 332–342. [Google Scholar] [CrossRef]
  11. Wu, H.; Ba, N.; Ren, S.; Xu, L.; Chai, J.; Irfan, M. The impact of internet development on the health of Chinese residents: Transmission mechanisms and empirical tests. Socioecon. Plann. Sci. 2021, 101178. [Google Scholar] [CrossRef]
  12. Elavarasan, R.M.; Leoponraj, S.; Dheeraj, A.; Irfan, M.; Gangaram Sundar, G.; Mahesh, G.K. PV-Diesel-Hydrogen fuel cell based grid connected configurations for an institutional building using BWM framework and cost optimization algorithm. Sustain. Energy Technol. Assess. 2021, 43, 100934. [Google Scholar] [CrossRef]
  13. Irfan, M.; Hao, Y.; Ikram, M.; Wu, H.; Akram, R.; Rauf, A. Assessment of the public acceptance and utilization of renewable energy in Pakistan. Sustain. Prod. Consum. 2021, 27, 312–324. [Google Scholar] [CrossRef]
  14. Irfan, M.; Zhao, Z.-Y.; Ahmad, M.; Mukeshimana, M. Solar energy development in Pakistan: Barriers and policy recommendations. Sustainability 2019, 11, 1206. [Google Scholar] [CrossRef] [Green Version]
  15. Fahd Amjad, L.A.S. Identification and assessment of sites for solar farms development using GIS and density based clustering technique—A case of Pakistan. Renew. Energy 2020, 155, 761–769. [Google Scholar] [CrossRef]
  16. Awan, U.; Knight, I. Domestic sector energy demand and prediction models for Punjab Pakistan. J. Build. Eng. 2020, 32, 101790. [Google Scholar] [CrossRef]
  17. Rafique, M.M.; Rehman, S. National energy scenario of Pakistan—Current status, future alternatives, and institutional infrastructure: An overview. Renew. Sustain. Energy Rev. 2017, 69, 156–167. [Google Scholar] [CrossRef]
  18. Irfan, M.; Zhao, Z.Y.; Rehman, A.; Ozturk, I.; Li, H. Consumers’ intention-based influence factors of renewable energy adoption in Pakistan: A structural equation modeling approach. Environ. Sci. Pollut. Res. 2021, 28, 432–445. [Google Scholar] [CrossRef] [PubMed]
  19. Irfan, M.; Zhao, Z.Y.; Li, H.; Rehman, A. The influence of consumers’ intention factors on willingness to pay for renewable energy: A structural equation modeling approach. Environ. Sci. Pollut. Res. 2020, 27, 21747–21761. [Google Scholar] [CrossRef] [PubMed]
  20. Irfan, M.; Zhao, Z.Y.; Mukeshimana, M.C.; Ahmad, M. Wind energy development in South Asia: Status, potential and policies. In Proceedings of the 2019 2nd International Conference on Computing, Mathematics and Engineering Technologies, iCoMET, Sindh, Pakistan, 30–31 January 2019; pp. 1–6. [Google Scholar]
  21. Irfan, M.; Zhao, Z.Y.; Panjwani, M.K.; Mangi, F.H.; Li, H.; Jan, A.; Ahmad, M.; Rehman, A. Assessing the energy dynamics of Pakistan: Prospects of biomass energy. Energy Rep. 2020, 6, 80–93. [Google Scholar] [CrossRef]
  22. Irfan, M.; Zhao, Z.Y.; Ahmad, M.; Rehman, A. A techno-economic analysis of off-grid solar PV system: A case study for Punjab Province in Pakistan. Processes 2019, 7, 708. [Google Scholar] [CrossRef] [Green Version]
  23. Irfan, M.; Zhao, Z.Y.; Ikram, M.; Gilal, N.G.; Li, H.; Rehman, A. Assessment of India’s energy dynamics: Prospects of solar energy. J. Renew. Sustain. Energy 2020, 12, 053701. [Google Scholar] [CrossRef]
  24. IEA International Energy Agency (IEA). World Energy Statistics Report 2020. Available online: https://www.iea.org/ (accessed on 11 June 2021).
  25. Rafique, M.M.; Rehman, S.; Alhems, L.M. Assessment of solar energy potential and its deployment for cleaner production in Pakistan. J. Mech. Sci. Technol. 2020, 34, 3437–3443. [Google Scholar] [CrossRef]
  26. Azam, M.; Khan, A.Q.; Ozturk, I. The effects of energy on investment, human health, environment and economic growth: Empirical evidence from China. Environ. Sci. Pollut. Res. 2019, 26, 10816–10825. [Google Scholar] [CrossRef]
  27. Batra, R.; Verma, S. Capital budgeting practices in Indian companies. IIMB Manag. Rev. 2017, 29, 29–44. [Google Scholar] [CrossRef]
  28. Battisti, F.; Campo, O. A Methodology for Determining the Profitability Index of Real Estate Initiatives Involving Public—Private Partnerships. A Case Study: The Integrated Intervention Programs in Rome. Sustainability 2019, 11, 1371. [Google Scholar] [CrossRef] [Green Version]
  29. Alternative Energy Development Board (AEDB). Current Status of Solar PV Power Projects. Available online: https://www.aedb.org/ae-technologies/solar-power/solar-current-status (accessed on 18 July 2021).
  30. Chandio, A.A.; Jiang, Y.; Akram, W.; Adeel, S.; Irfan, M.; Jan, I. Addressing the effect of climate change in the framework of financial and technological development on cereal production in Pakistan. J. Clean. Prod. 2021, 288, 125637. [Google Scholar] [CrossRef]
  31. Khan, I.; Hou, F.; Irfan, M.; Zakari, A.; Phong, H. Does energy trilemma a driver of economic growth ? The roles of energy use, population growth, and financial development. Renew. Sustain. Energy Rev. 2021, 146, 111157. [Google Scholar] [CrossRef]
  32. Li, Y.; Yang, X.; Ran, Q.; Wu, H.; Irfan, M.; Ahmad, M. Energy structure, digital economy, and carbon emissions: Evidence from China. Environ. Sci. Pollut. Res. 2021, 1–24. [Google Scholar] [CrossRef]
  33. Razzaq, A.; Ajaz, T.; Li, J.C.; Irfan, M.; Suksatan, W. Investigating the asymmetric linkages between infrastructure development, green innovation, and consumption-based material footprint: Novel empirical estimations from highly resource-consuming economies. Resour. Policy 2021, 74, 102302. [Google Scholar] [CrossRef]
  34. Rehman, A.; Ma, H.; Chishti, M.Z.; Ozturk, I.; Irfan, M.; Ahmad, M. Asymmetric investigation to track the effect of urbanization, energy utilization, fossil fuel energy and CO2 emission on economic efficiency in China: Another outlook. Environ. Sci. Pollut. Res. 2021, 28, 17319–17330. [Google Scholar] [CrossRef] [PubMed]
  35. Rehman, A.; Ma, H.; Ozturk, I.; Ahmad, M.; Rauf, A.; Irfan, M. Another outlook to sector-level energy consumption in Pakistan from dominant energy sources and correlation with economic growth. Environ. Sci. Pollut. Res. 2021, 28, 33735–33750. [Google Scholar] [CrossRef]
  36. Wang, J.; Wang, W.; Ran, Q.; Irfan, M.; Ren, S.; Yang, X.; Wu, H.; Ahmad, M. Analysis of the mechanism of the impact of internet development on green economic growth: Evidence from 269 prefecture cities in China. Environ. Sci. Pollut. Res. 2021, 1–15. [Google Scholar] [CrossRef] [PubMed]
  37. Yang, C.; Hao, Y.; Muhammad, I. Energy consumption structural adjustment and carbon neutrality in the post-COVID-19 era. Struct. Chang. Econ. Dyn. 2021, 59, 442–453. [Google Scholar] [CrossRef]
  38. Qiu, W.; Zhang, J.; Wu, H.; Irfan, M.; Ahmad, M. The role of innovation investment and institutional quality on green total factor productivity: Evidence from 46 countries along the “Belt and Road”. Environ. Sci. Pollut. Res. 2021. ahead of print. [Google Scholar] [CrossRef] [PubMed]
  39. Işık, C.; Ongan, S.; Bulut, U.; Karakaya, S.; Irfan, M.; Alvarado, R.; Ahmad, M.; Rehman, A. Reinvestigating the Environmental Kuznets Curve (EKC) hypothesis by a composite model constructed on the Armey curve hypothesis with government spending for the US States. Environ. Sci. Pollut. Res. 2021. ahead of print. [Google Scholar] [CrossRef]
  40. Perpiña, C.; Batista, F.; Lavalle, C. An assessment of the regional potential for solar power generation in EU-28. Energy Policy 2020, 88, 86–99. [Google Scholar] [CrossRef]
  41. Kamran, M. Current status and future success of renewable energy in Pakistan. Renew. Sustain. Energy Rev. 2018, 82, 609–617. [Google Scholar] [CrossRef]
  42. Kamran, M.; Mudassar, M.; Abid, I.; Fazal, M.R.; Rukh, S. Reconsidering the Power Structure of Pakistan. Int. J. Renew. Energy Res. 2019, 9, 480–492. [Google Scholar]
  43. Karenlampi, P.P. Net present value of multiannual growth in the absence of periodic boundary conditions. Agric. Financ. Rev. 2020, 81, 39–50. [Google Scholar] [CrossRef]
  44. Kassem, Y.; Çamur, H.; Alhuoti, S.M.A. Solar energy technology for northern cyprus: Assessment, statistical analysis, and feasibility study. Energies 2020, 13, 940. [Google Scholar] [CrossRef] [Green Version]
  45. Kawabataa, Y.; Kato, E.; Yokota, H.; Lwanami, M. Net present value as an effective indicator leading to preventive maintenance of port mooring facilities. Struct. Infrastruct. Eng. 2019, 16, 714–725. [Google Scholar] [CrossRef]
  46. Khalil, H.B.; Zaidi, S.J.H. Energy crisis and potential of solar energy in Pakistan. Renew. Sustain. Energy Rev. 2014, 31, 194–201. [Google Scholar] [CrossRef]
  47. Kozlovskyi, A.; Bilenko, D.; Kozlovskyi, S.; Lavrov, R.; Skydan, O.; Ivanyuta, N. Determination of the risk-free rate of return on an investment efficiency based on the fractal markets hypothesis. Pap. Present. Forum Sci. Oecon. 2020, 8, 61–72. [Google Scholar] [CrossRef]
  48. Shakhovska, N.; Medykovskyy, M.O. Advances in Intelligent Systems and Computing IV; Springer: New Delhi, India, 2019; ISBN 9783030336943. [Google Scholar]
  49. Mahapatra, M.S.; Raveendran, J.; De, A. Building a model on influence of behavioural and cognitive factors on personal financial planning: A study among indian households. Glob. Bus. Rev. 2019, 20, 996–1009. [Google Scholar] [CrossRef]
  50. Saurabh Chadha, S.K.S. Capital budgeting practices: A survey in the selected Indian manufacturing firms. Int. J. Ind. Cult. Bus Manag. 2019, 18, 381–390. [Google Scholar] [CrossRef]
  51. Christensen, P.H. A post-global financial crisis (GFC) framework for strategic planning, assessment and management decision making for U.S. sustainable commercial real estate. J. Prop. Investig. Financ. 2017, 35, 589–618. [Google Scholar] [CrossRef]
  52. Chacon, M.C.; Diaz, J.A.R.; Morillo, J.G.; McNabola, A. Pump-as-turbine selection methodology for energy recovery in irrigation networks: Minimising the payback period. Water 2019, 11, 149. [Google Scholar] [CrossRef] [Green Version]
  53. Crosby, N.; Devaney, S.; Wyatt, P. The implied internal rate of return in conventional residual valuations of development sites valuations of development sites. J. Prop. Res. 2018, 35, 234–251. [Google Scholar] [CrossRef] [Green Version]
  54. Martinek, J.; Jorgenson, J.; Mehos, M.; Denholm, P. A comparison of price-taker and production cost models for determining system value, revenue, and scheduling of concentrating solar power plants. Appl. Energy 2018, 231, 854–865. [Google Scholar] [CrossRef]
  55. Mirjat, N.H.; Uqaili, M.A.; Harijan, K.; Valasai, G.D.; Shaikh, F.; Waris, M. A review of energy and power planning and policies of Pakistan. Renew. Sustain. Energy Rev. 2017, 79, 110–127. [Google Scholar] [CrossRef] [Green Version]
  56. Zore, Ž.; Čuček, L.; Širovnik, D.; Kravanja, Z. Maximizing the sustainability net present value of renewable energy supply networks. Chem. Eng. Res. Des. 2018, 131, 245–265. [Google Scholar] [CrossRef] [Green Version]
  57. Fleten, S.; Linnerud, K.; Molnár, P.; Nygaard, M.T. Green electricity investment timing in practice: Real options or net present value? Energy 2016, 116, 498–506. [Google Scholar] [CrossRef]
  58. Mubashar, A.; Tariq, B.T. Capital budgeting decision-making practices: Evidence from Pakistan. J. Adv. Manag. Res. 2018, 12, 55–82. [Google Scholar] [CrossRef]
  59. Nekhaychuk, D.V.; Nogas, I.L.; Vernadsky, V.I.; Nekhaychuk, E.V.; Vernadsky, V.I. The Financial Planning and Its Tasks in Modern Models of Enterprise Management; Atlantis Press: Amsterdam, The Netherlands, 2019; Volume 83, pp. 38–41. [Google Scholar]
  60. Kameni, M.; Christophe, J.; Noelson, V.; Saadi, I.; Kenfack, H.; Andrianaharinjaka, A.F.R.; Foumouo, D.; Barahimo, J.; Reiter, S. Application of phase change materials, thermal insulation, and external shading for thermal comfort improvement and cooling energy demand reduction in an o ffi ce building under di ff erent coastal tropical climates. Sol. Energy 2020, 207, 458–470. [Google Scholar] [CrossRef]
  61. Ozcan, O.; Ersoz, F. Engineering Science and Technology, an International Journal Project and cost-based evaluation of solar energy performance in three different geographical regions of Turkey: Investment analysis application. Eng. Sci. Technol. Int. J. 2019, 22, 1098–1106. [Google Scholar] [CrossRef]
  62. López Prol, J.; Steininger, K.W. Photovoltaic self-consumption is now profitable in Spain: Effects of the new regulation on prosumers’ internal rate of return. Energy Policy 2020, 146, 11793. [Google Scholar] [CrossRef]
  63. Castro-Santos, L.; Filgueira-Vizoso, A.; Piegari, L. Calculation of the Levelized Cost of Energy and the Internal Rate of Return using GIS: The case study of a floating wave energy farm. In Proceedings of the 2019 International Conference on Clean Electrical Power (ICCEP), Otranto, Italy, 2–4 July 2019; pp. 674–679. [Google Scholar]
  64. Powell, J.W.; Welsh, J.M.; Farquharson, R. Investment analysis of solar energy in a hybrid diesel irrigation pumping system in New South Wales, Australia. J. Cleaner Prod. 2019, 224, 444–454. [Google Scholar] [CrossRef]
  65. Park, K.; Lee, G.; Lee, B. Study on theoretical research to reduce fire risk of solar power system. J. Korean Soc. Ind. Converg. 2020, 23, 219–224. [Google Scholar] [CrossRef]
  66. Pellerin, R.; Perrier, N. A review of methods, techniques and tools for project planning and control. Int. J. Prod. Res. 2019, 57, 2160–2178. [Google Scholar] [CrossRef]
  67. Wijesuriya, D.T.P.; Wickramathilaka, K.D.S.H.; Wijesinghe, L.S.; Vithana, D.M.; Perera, H.Y.R. Reduction of solar PV payback period using optimally placed reflectors. Energy Procedia 2017, 134, 480–489. [Google Scholar] [CrossRef]
  68. Sotnyk, I.; Sotnyk, I.; Momotiuk, L. Yulija Chortok Management of renewable energy innovative development in Ukrainian households: Problems of financial support. Mark. Manag. Innov. 2018, 6718, 150–160. [Google Scholar] [CrossRef]
  69. Rai, K.; Tyagi, A.; Sahni, S. Modelling the factors of financial planning for retirement among individuals using ISM. J. Crit. Rev. 2020, 7, 1547–1558. [Google Scholar]
  70. Raj, A.N. Identifying appropriate Project Required Return. Psychol. Educ. J. 2020, 57, 4027–4036. [Google Scholar]
  71. Rich, S.P.; Rose, J.T.; Delaney, C.J. Net present value analysis in finance and real estate: A clash of methodologies. J. Real Estate Portf. Manag. 2018, 24, 83–94. [Google Scholar] [CrossRef]
  72. Mohanty, S.; Rout, A.; Patra, P.K.; Sahoo, S.S. ANFIS based solar radiation data forecasting for energy & economic study of solar water heaters in Eastern India. Int. J. Control Theory Appl. 2017, 10, 179–190. [Google Scholar]
  73. Ruggiero, S.; Lehkonen, H. Renewable energy growth and the fi nancial performance of electric utilities: A panel data study. J. Clean. Prod. 2017, 142, 3676–3688. [Google Scholar] [CrossRef] [Green Version]
  74. Yoomak, S.; Patcharoen, T.; Ngaopitakkul, A. Performance and economic evaluation of solar rooftop systems in different regions of Thailand. Sustainability 2019, 11, 6647. [Google Scholar] [CrossRef] [Green Version]
  75. Ullah, H.; Kamal, I.; Ali, A.; Arshad, N. Investor Focused Placement and Sizing of Photovoltaic Grid-Connected Systems in Pakistan; Elsevier Ltd.: Amsterdam, The Netherlands, 2018; Volume 121, ISBN 9242358983. [Google Scholar]
  76. Salvi, A.; Petruzzella, F.; Giakoumelou, A. Does sustainability foster the cost of equity reduction? The relationship between corporate social responsibility (CSR) and riskiness worldwide. Afr. J. Bus. Manag. 2018, 12, 381–397. [Google Scholar] [CrossRef] [Green Version]
  77. Sarper, H.; Chacon, P.; Demirtaş, M.; Melnykov, I.; Palak, G.; Fraser, J.M. Distribution of the Internal and External Rates of Return in a Partially Stochastic.Oil Pump Problem. Eng. Econ. 2018, 2701, 343–362. [Google Scholar] [CrossRef]
  78. Sarwary, Z. Strategy and capital budgeting techniques: The moderating role of entrepreneurial structure. Int. J. Manag. Financ. Account. 2020, 12, 48–70. [Google Scholar] [CrossRef]
  79. Schlegel, D.; Frank, F.; Britzelmaier, B. Investment decisions and capital budgeting practices in German manufacturing companies. Int. J. Bus. Glob. 2016, 16, 66–78. [Google Scholar] [CrossRef]
  80. Shin, H.; Kim, E. Meta-analysis of rate of return on road projects. Transp. Lett. 2017, 11, 190–199. [Google Scholar] [CrossRef]
  81. Siziba, S.; Hall, J.H. The evolution of the application of capital budgeting techniques in enterprises. Glob. Financ. J. 2019, 47, 100504. [Google Scholar] [CrossRef]
  82. Martínez-Ruiz, Y.; Manotas-Duque, D.F.; Ramírez-Malule, H. Evaluation of investment projects in photovoltaic solar energy using the dnpv methodology. Int. J. Energy Econ. Policy 2020, 11, 180–185. [Google Scholar] [CrossRef]
  83. Guindon, A.; Wright, D.J. Analytical approach to quantitative risk assessment for solar power projects. Renew. Sustain. Energy Rev. 2020, 133, 110262. [Google Scholar] [CrossRef]
  84. Suphahitanukool, C.; Hunsacharoonroj, I.; Usapein, P.; Khedari, J. An evaluation of economic potentialsolar photovoltaic farm in Thailand: Case study of polycrystalline silicon and amorphous silicon thin film. Int. J. Energy Econ. Policy 2018, 8, 33–41. [Google Scholar] [CrossRef]
  85. Jadidi, H.; Firouzi, A.; Rastegar, M.A.; Zandi, M. Bayesian updating of solar resource data for risk mitigation in project finance. Sol. Energy 2020, 207, 1390–1403. [Google Scholar] [CrossRef]
  86. Jae, K.; Lee, H.; Koo, Y. Research on local acceptance cost of renewable energy in South Korea: A case study of photovoltaic and wind power projects. Energy Policy 2020, 144, 111684. [Google Scholar] [CrossRef]
  87. Tsalikis, G.; Martinopoulos, G. ScienceDirect Solar energy systems potential for nearly net zero energy residential buildings. Sol. Energy 2015, 115, 743–756. [Google Scholar] [CrossRef]
  88. Chang, B.; Starcher, K. Evaluation of wind and solar energy investments in Texas. Renew. Energy 2019, 132, 1348–1359. [Google Scholar] [CrossRef]
  89. Zhang, M.M.; Zhou, P.; Zhou, D.Q. A real options model for renewable energy investment with application to solar photovoltaic power generation in China. Energy Econ. 2016, 26, 17–21. [Google Scholar] [CrossRef]
  90. Nojavan, S.; Pashaei-Didani, H.; Saberi, K.; Zare, K. Risk assessment in a central concentrating solar power plant. Sol. Energy 2019, 180, 293–300. [Google Scholar] [CrossRef]
  91. Fernández Peruchena, C.M.; Ramírez, L.; Silva-Pérez, M.A.; Lara, V.; Bermejo, D.; Gastón, M.; Moreno-Tejera, S.; Pulgar, J.; Liria, J.; Macías, S.; et al. A statistical characterization of the long-term solar resource: Towards risk assessment for solar power projects. Sol. Energy 2016, 123, 29–39. [Google Scholar] [CrossRef]
  92. Wiesinger, F.; Sutter, F.; Wolfertstetter, F.; Hanrieder, N.; Fernández-García, A.; Pitz-Paal, R.; Schmücker, M. Assessment of the erosion risk of sandstorms on solar energy technology at two sites in Morocco. Sol. Energy 2018, 162, 217–228. [Google Scholar] [CrossRef]
  93. Ahmad, M.; Jabeen, G.; Irfan, M.; Işık, C.; Rehman, A. Do inward foreign direct investment and economic development improve local environmental quality: Aggregation bias puzzle. Environ. Sci. Pollut. Res. 2021, 34676–34696. [Google Scholar] [CrossRef]
  94. Işık, C.; Ahmad, M.; Ongan, S.; Ozdemir, D.; Irfan, M.; Alvarado, R. Convergence analysis of the ecological footprint: Theory and empirical evidence from the USMCA countries. Environ. Sci. Pollut. Res. 2021, 28, 32648–32659. [Google Scholar] [CrossRef] [PubMed]
  95. Isik, C.; Ongan, S.; Ozdemir, D.; Ahmad, M.; Irfan, M.; Alvarado, R.; Ongan, A. The increases and decreases of the environment Kuznets curve (EKC) for 8 OECD countries. Environ. Sci. Pollut. Res. 2021, 28, 28535–28543. [Google Scholar] [CrossRef]
  96. Irfan, M.; Zhao, Z.Y.; Ahmad, M.; Batool, K.; Jan, A.; Mukeshimana, M.C. Competitive assessment of Indian wind power industry: A five forces model. J. Renew. Sustain. Energy 2019, 11, 063301. [Google Scholar] [CrossRef]
  97. Irfan, M.; Hao, Y.; Panjwani, M.K.; Khan, D.; Chandio, A.A.; Li, H. Competitive assessment of South Asia’s wind power industry: SWOT analysis and value chain combined model. Energy Strateg. Rev. 2020, 32, 100540. [Google Scholar] [CrossRef]
  98. Mukherji, R.; Mathur, V.; Bhati, A.; Mukherji, M. Assessment of 50 kWp rooftop solar photovoltaic plant at The ICFAI University, Jaipur: A case study. Environ. Prog. Sustain. Energy 2020, 39, 1–14. [Google Scholar] [CrossRef]
  99. Zeraatpisheh, M.; Arababadi, R.; Pour, M.S. Economic analysis for residential solar PV systems based on different demand charge tariffs. Energies 2018, 11, 3271. [Google Scholar] [CrossRef] [Green Version]
  100. Murshed, M.; Abbass, K.; Rashid, S. Modelling renewable energy adoption across south Asian economies: Empirical evidence from Bangladesh, India, Pakistan and Sri Lanka. Int. J. Financ. Econ. 2020, 26, 5425–5450. [Google Scholar] [CrossRef]
  101. Moncecchi, M.; Meneghello, S.; Merlo, M. A Game Theoretic Approach for Energy Sharing in the Italian Renewable Energy Communities. Appl. Sci. 2020, 10, 8166. [Google Scholar] [CrossRef]
  102. Shahid, M.; Firoz, N.M.S.; Dadu, M. Risk analysis in implementation of solar energy projects in kerala risk analysis in implementation of solar energy projects in Kerala. In Proceedings of the International Conference on Aerospace and Mechanical Engineering, ICAME’18, Kollam, India, 17–19 December 2019. [Google Scholar]
  103. Irfan, M.; Shahid, A.L.; Ahmad, M.; Iqbal, W.; Elavarasan, R.M.; Ren, S.; Hussain, A. Assessment of public intention to get vaccination against COVID-19: Evidence from a developing country. J. Eval. Clin. Pract. 2021, 1–11. [Google Scholar] [CrossRef] [PubMed]
  104. Irfan, M.; Akhtar, N.; Ahmad, M.; Shahzad, F.; Elavarasan, R.M.; Wu, H.; Yang, C. Assessing public willingness to wear face masks during the COVID-19 pandemic: Fresh insights from the theory of planned behavior. Int. J. Environ. Res. Public Health 2021, 18, 4577. [Google Scholar] [CrossRef] [PubMed]
  105. Irfan, M.; Ikram, M.; Ahmad, M.; Wu, H.; Hao, Y. Does temperature matter for COVID-19 transmissibility? Evidence across Pakistani provinces. Environ. Sci. Pollut. Res. 2021, 28, 59705–59719. [Google Scholar] [CrossRef]
  106. Ahmad, M.; Akhtar, N.; Jabeen, G.; Irfan, M.; Anser, M.K.; Wu, H.; Isek, C. Intention-based critical factors affecting willingness to adopt Novel Coronavirus prevention in Pakistan: Implications for future pandemics. Int. J. Environ. Res. Public Health 2021, 18, 6167. [Google Scholar] [CrossRef]
  107. Calder, B.J.; Phillips, L.W.; Tybout, A.M. Designing Research for Application. J. Consum. Res. 1981, 8, 197. [Google Scholar] [CrossRef]
  108. Ozawa, A.; Kudoh, Y.; Yoshida, Y. A new method for household energy use modeling: A questionnaire-based approach. Energy Build. 2018, 162, 32–41. [Google Scholar] [CrossRef]
  109. Bennouna, K.; Meredith, G.G.; Marchant, T. Improved capital budgeting decision making: Evidence from Canada. Manag. Decis. 2010, 48, 225–247. [Google Scholar] [CrossRef] [Green Version]
  110. Lu, Y.; Chang, R.; Shabunko, V.; Lay Yee, A.T. The implementation of building-integrated photovoltaics in Singapore: Drivers versus barriers. Energy 2019, 168, 400–408. [Google Scholar] [CrossRef]
  111. Zhang, X.; Shen, L.; Chan, S.Y. The diffusion of solar energy use in HK: What are the barriers? Energy Policy 2012, 41, 241–249. [Google Scholar] [CrossRef]
  112. Braunholtz-Speight, T.; Sharmina, M.; Manderson, E.; McLachlan, C.; Hannon, M.; Hardy, J.; Mander, S. Business models and financial characteristics of community energy in the UK. Nat. Energy 2020, 5, 169–177. [Google Scholar] [CrossRef]
  113. Irfan, M.; Elavarasan, R.M.; Hao, Y.; Feng, M.; Sailan, D. An assessment of consumers’ willingness to utilize solar energy in China: End-users’ perspective. J. Clean. Prod. 2021, 292, 126008. [Google Scholar] [CrossRef]
  114. Urbach, N.; Ahlemann, F. Structural Equation Modeling in Information Systems Research Using Partial Least Squares. J. Inf. Technol. Theory Appl. 2010, 11, 5–40. [Google Scholar]
  115. Hair, J.F.; Sarstedt, M.; Ringle, C.M. Rethinking some of the rethinking of partial least squares. Eur. J. Mark. 2019, 53, 566–584. [Google Scholar] [CrossRef]
  116. Ying, M.; Faraz, N.A.; Ahmed, F.; Raza, A. How does servant leadership foster employees’ voluntary green behavior? A sequential mediation model. Int. J. Environ. Res. Public Health 2020, 17, 1792. [Google Scholar] [CrossRef] [Green Version]
  117. Henseler, J.; Ringle, C.M.; Sarstedt, M. A new criterion for assessing discriminant validity in variance-based structural equation modeling. J. Acad. Mark. Sci. 2015, 43, 115–135. [Google Scholar] [CrossRef] [Green Version]
  118. Franziska, R.N.; Carrion, G.C.; Roldán, J.L.; Ringle, C.M. European management research using partial least squares structural equation modeling (PLS-SEM). Eur. Manag. J. 2016, 34, 589–597. [Google Scholar]
  119. Chin, W.; Newsted, P.R. Structural equation modeling analysis with small samples using partial least squares. Stat. Strateg. Small Sample Res. 1999, 1, 307–341. [Google Scholar]
  120. Ramayah, T.; Ahmad, N.H.; Halim, H.A.; Rohaida, S.; Zainal, M.; Lo, M. Discriminant analysis: An illustrated example. African J. Bus. Manag. 2010, 4, 1654–1667. [Google Scholar] [CrossRef]
  121. Osborne, J.W. Improving your data transformations: Applying the Box-Cox transformation. Pract. Assess. Res. Eval. 2010, 15, 12. [Google Scholar] [CrossRef]
  122. Solangi, Y.A.; Shah, S.A.A.; Zameer, H.; Ikram, M.; Saracoglu, B.O. Assessing the solar PV power project site selection in Pakistan: Based on AHP-fuzzy vikor approach. Environ. Sci. Pollut. Res. 2019, 26, 30286–30302. [Google Scholar] [CrossRef] [PubMed]
  123. Hair, J.F.; Risher, J.J.; Sarstedt, M.; Ringle, C.M. When to use and how to report the results of PLS-SEM. Eur. Bus. Rev. 2019, 31, 2–24. [Google Scholar] [CrossRef]
  124. Hair, J.F.; Ringle, C.M.; Sarstedt, M. PLS-SEM: Indeed a silver bullet. J. Mark. Theory Pract. 2011, 19, 139–152. [Google Scholar] [CrossRef]
  125. Hair, J.F.; Sarstedt, M.; Hopkins, L.; Kuppelwieser, V.G. Partial least squares structural equation modeling (PLS-SEM): An emerging tool in business research. Eur. Bus. Rev. 2014, 26, 106–121. [Google Scholar] [CrossRef]
  126. Arbuckle, J.L. IBM SPSS Amos 20 User’s Guide; Amos Development Corporation, SPSS Inc.: Chicago, IL, USA, 2011. [Google Scholar]
  127. Anderson, J.C.; Gerbing, D.W. Structural Equation Modeling in Practice: A Review and Recommended Two-Step Approach. Psychol. Bull. 1988, 103, 411–423. [Google Scholar] [CrossRef]
  128. Akbar, A.; Ali, S.; Ahmad, M.A.; Akbar, M.; Danish, M. Understanding the antecedents of organic food consumption in pakistan: Moderating role of food neophobia. Int. J. Environ. Res. Public Health 2019, 16, 4043. [Google Scholar] [CrossRef] [Green Version]
  129. Cohen, J. Statistical Power Analysis for the Behavioral Sciences New York; Academic Press: Cambridge, MA, USA, 1988. [Google Scholar]
  130. Hair, J.F., Jr.; Hult, G.T.M.; Ringle, C.M.; Sarstedt, M. A primer on partial least squares structural equation modeling (PLS-SEM). Sage publications. Eur. J. Tour. Res. 2021, 6, 211–213. [Google Scholar]
  131. Tu, Q.; Betz, R.; Mo, J.; Fan, Y. The profitability of onshore wind and solar PV power projects in China—A comparative study. Energy Policy 2020, 132, 404–417. [Google Scholar] [CrossRef]
  132. Urbański, M.; Haque, A.U.; Oino, I. The moderating role of risk management in project planning and project success: Evidence from construction businesses of Pakistan and the UK. Eng. Manag. Prod. Serv. 2019, 11, 23–35. [Google Scholar] [CrossRef] [Green Version]
  133. Wang, M.; Wang, G.; Sun, Z.; Zhang, Y.; Xu, D. Review of renewable energy-based hydrogen production processes for sustainable energy innovation. Glob. Energy Interconnect. 2020, 2, 436–443. [Google Scholar] [CrossRef]
  134. Warren, L.; Jack, L. The capital budgeting process and the energy trilemma—A strategic conduct analysis. Br. Account. Rev. 2018, 50, 481–496. [Google Scholar] [CrossRef]
  135. Yuan, J.; Zhang, Y.; Zhou, L.; Zhang, C.; Lau, T.; Zhang, G.; Lu, X.; Yip, H.; So, S.K.; Beaupré, S.; et al. Fused Benzothiadiazole: A Building Block for n-Type Organic Acceptor to Achieve High-Performance Organic Solar Cells. Adv. Mater. 2019, 1807577, 1–8. [Google Scholar] [CrossRef] [PubMed]
  136. Zafar, U.; Rashid, T.U.; Khosa, A.A.; Khalil, M.S.; Rashid, M. An overview of implemented renewable energy policy of Pakistan. Renew. Sustain. Energy Rev. 2018, 82, 654–665. [Google Scholar] [CrossRef]
Figure 1. Conceptual framework.
Sustainability 13 12997 g001
Figure 2. Measurement assessment model.
Sustainability 13 12997 g002
Figure 3. Structural assessment model.
Sustainability 13 12997 g003
Figure 4. IRRM*CRM. * asterisk shows the moderating relationship among the variables.
Sustainability 13 12997 g004
Figure 5. NPVT*CRM. * asterisk shows the moderating relationship among the variables.
Sustainability 13 12997 g005
Figure 6. PBPT*CRM. * asterisk shows the moderating relationship among the variables.
Sustainability 13 12997 g006
Figure 7. P.I. *CRM. * asterisk shows the moderating relationship among the variables.
Sustainability 13 12997 g007
Table 1. Current capacity-wise solar power projects in Pakistan [29].
Sr. NoCompanyProject Capacity (MW)Location
1IPS Solar Park- IPS 22 Pvt. Ltd.50Nooriabad, Sindh
2IPS Solar Park-JA 23 Pvt. Ltd.50Nooriabad, Sindh
3IPS Solar Park-SB 24 Pvt. Ltd.50Nooriabad, Sindh
4Siddiqsons Solar Ltd.50Kalar Kahar, Chakwal
5ET Solar (Pvt.) Ltd.50Fateh Jang, Attock
6ET Solar (Pvt.) Ltd.50Bahalwalnager, Punjab
7ACT Solar Pvt. Ltd.50Thatta, Sindh
8ET Solar Pvt. Ltd.25Dadu, Sindh
9R.E Solar Pvt. Ltd.20Dadu, Sindh
10R.E Solar Pvt. Ltd.20Dadu, Sindh
11Janpur Energy Ltd.12Sultanabad Rahim Yar Khan
12Lalpir Solar Ltd.12Mehmood Kot, Muzafar garh
Table 2. Convergent validity analysis.
ConstructsItemsLoadingsAlphaCRAVE
Cost and riskiness of methodsCRM10.8860.8450.8200.536
CRM20.669
CRM30.676
CRM40.675
Financial performance of solar power projectFPSPP10.8090.8890.9180.692
FPSPP20.815
FPSPP30.855
FPSPP40.815
FPSPP50.864
Internal rate of return methodIRRM10.9580.9660.9750.908
IRRM20.943
IRRM30.952
IRRM40.959
Net present value
technique
NPVT10.9120.9440.9560.782
NPVT20.823
NPVT30.905
NPVT40.904
NPVT50.912
NPVT60.846
Payback period techniquePBPT10.8800.9090.9360.785
PBPT20.879
PBPT30.888
PBPT40.896
Profitability indexPI10.9540.9590.9680.834
PI20.828
PI30.952
PI40.955
PI50.827
PI60.954
Table 3. Fornell–Larcker analysis.
FactorsCRMFPSPPIRRMNPVTPBPTPI
CRM0.732
FPSPP0.3250.832
IRRM0.3460.4070.953
NPVT0.3940.5060.4700.884
PBPT0.3350.3710.3840.3850.886
PI0.4000.4980.4860.3480.3620.913
Notes: N = 44; NPV, net present value; IRR, internal rate of return; PBP, payback period; PI, profitability index; CRM, cost and riskiness of method; FPSPP, financial performance of solar power projects.
Table 4. Cross-loadings.
ItemsCRMFPSPPIRRMNPVTPBPTPI
CRM10.8860.3780.4280.4580.3720.469
CRM20.6690.0900.2670.1340.1200.105
CRM30.6760.0990.2640.0810.1090.102
CRM40.6750.0710.2430.1130.1180.096
FPSPP10.3340.8090.3780.4730.2950.493
FPSPP20.2880.8150.3500.4550.3060.403
FPSPP30.2420.8550.2960.3690.2850.398
FPSPP40.2140.8150.3300.3920.3350.359
FPSPP50.2610.8640.3300.4020.3210.403
IRRM10.7130.3990.9580.4480.3380.468
IRRM20.7050.3600.9430.4440.4000.450
IRRM30.7180.3910.9520.4480.3860.462
IRRM40.7090.4010.9590.4530.3420.471
NPVT10.3310.4470.3910.9120.3400.736
NPVT20.3620.4650.4340.8230.3280.776
NPVT30.3560.4460.4450.9050.3450.723
NPVT40.3520.4520.4400.9040.3390.731
NPVT50.3270.4340.3810.9120.3360.735
NPVT60.3610.4380.4000.8460.3510.794
PBPT20.3140.3400.3220.3070.8800.292
PBPT30.2760.3390.3500.3510.8790.342
PBPT40.2900.3270.3300.3400.8880.306
PBPT50.3080.3050.3590.3690.8960.345
PI10.3670.4500.4500.7700.3150.954
PI20.3530.4630.4290.7750.3590.828
PI30.3680.4560.4520.7690.3170.952
PI40.3750.4440.4490.7740.3150.955
PI50.3520.4590.4300.7750.3600.827
PI60.3680.4490.4460.7720.3120.954
Table 5. Heterotrait–Monotrait ratio.
VariablesCRMFPSPPIRRMNPVTPBPTPI
CRM
FPSPP0.220
IRRM0.5370.436
NPVT0.2660.5480.492
PBPT0.2490.4110.4110.416
PI0.2590.5350.5040.3890.388
Notes: N = 44; NPV, net present value; IRR, internal rate of return; PBP, payback period; PI, profitability index; CRM, cost and riskiness of method; FPSPP, financial performance of solar power projects.
Table 6. Structural model results (hypotheses testing).
HypothesesRelationshipsβS. DT-Statisticsp-ValueSupportedR2Q2F2
H1NPVT → FPSPP0.2220.2072.3310.011Yes0.4580.2450.096
H2IRRM → FPSPP0.2050.2012.5520.006Yes 0.2410.043
H3PBPT → FPSPP0.2320.2372.3030.012Yes 0.111
H4PI → FPSPP0.0700.0730.6390.062Yes 0.021
H5NPVT * CRM → FPSPP0.2020.1973.4410.000Yes 0.041
H6IRRM * CRM → FPSPP0.0900.0881.6600.074Yes 0.015
H7PBPT * CRM → FPSPP0.1190.1311.4080.081No 0.031
H8PI * CRM → FPSPP0.216−0.2091.9170.029Yes0.481 0.026
Notes: N = 44; NPV, net present value; IRR, internal rate of return; PBP, payback period; PI, profitability index; CRM, cost and riskiness of method; FPSPP, financial performance of solar power projects. *, asterisk shows the moderating relationship among the variables.
Publisher’s Note: MDPI stays neutral with regard to jurisdictional claims in published maps and institutional affiliations.

