
Climate Change Scenarios and Their Implications on the Energy Performance of Hellenic Non-Residential Buildings


 , ,
, ,  , and
, and
Abstract
:1. Introduction
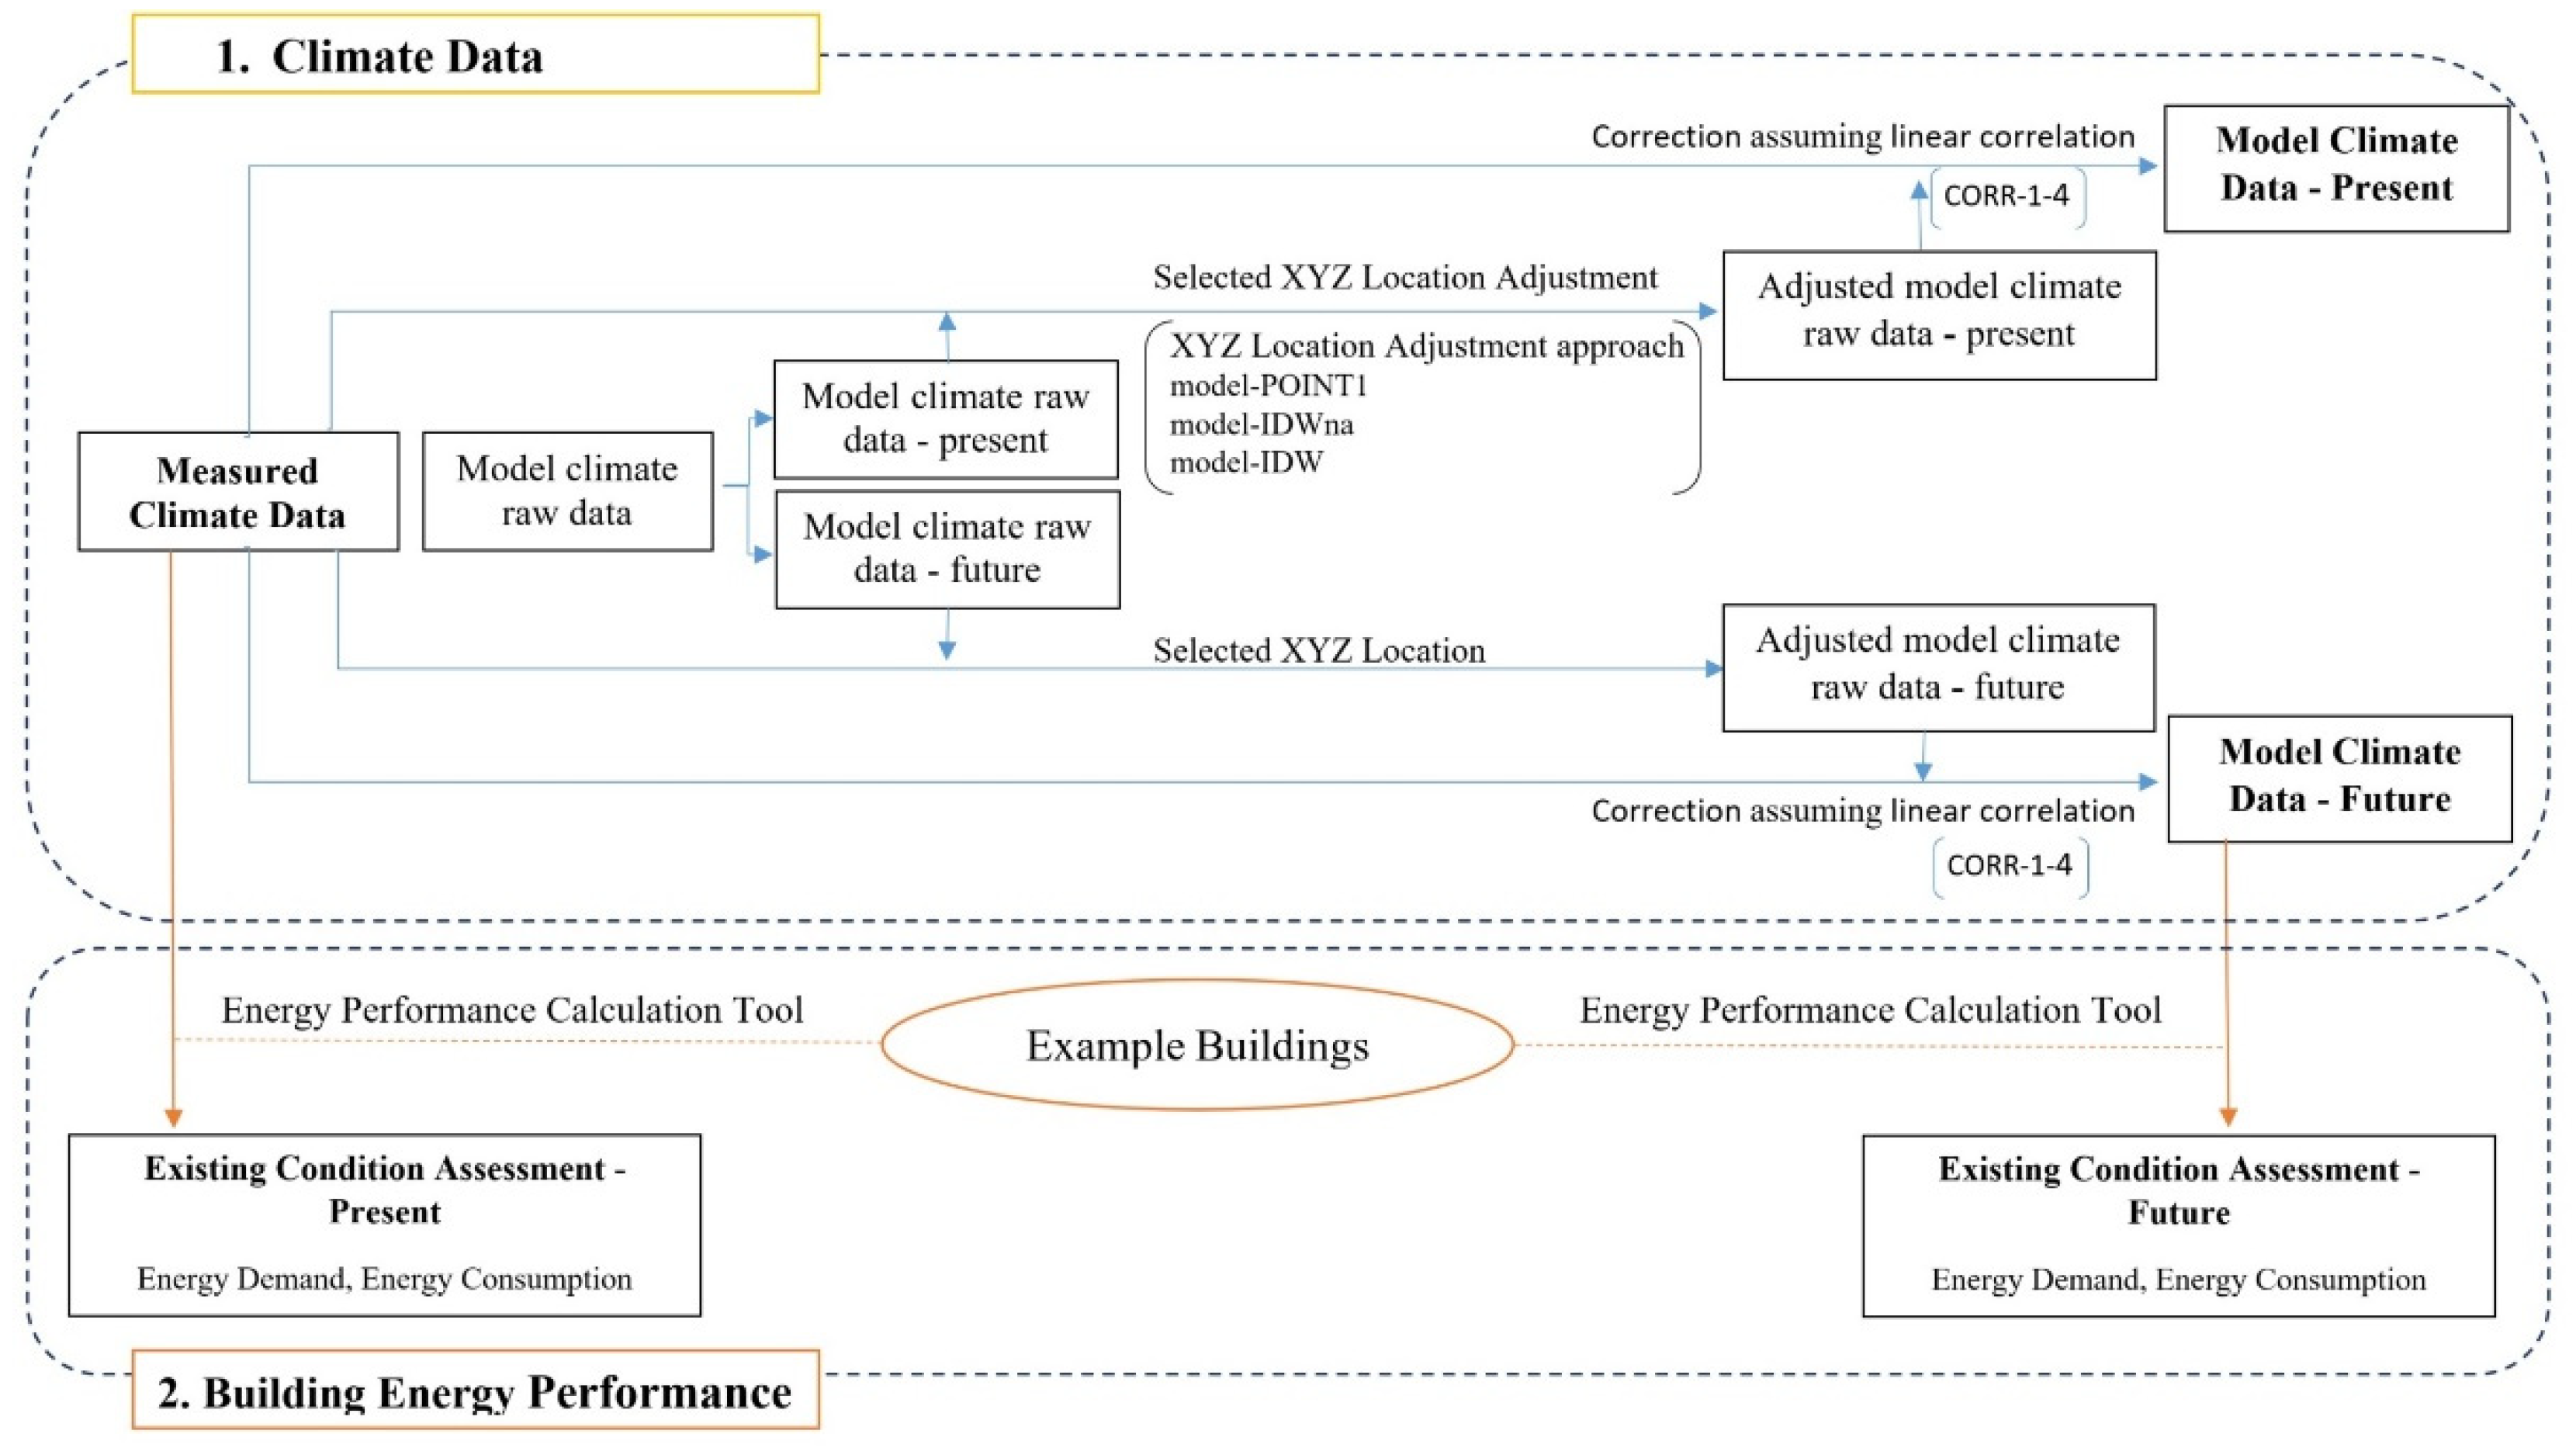
2. Methodology
2.1. Climate Data
- Model climate raw data from the nearest grid point to the specific weather station site compared to the latitude and the longitude of the measured climate data (model-POINT1);
- Weighted average of the model climate raw data for the four nearest grid points using the inverse distance weighting method [43] and taking into account the latitude and the longitude of the climate data locations (model-IDWna);
- Weighted average of the model climate raw data calculated as before, but this time also taking into account the elevation of the climate data locations (model-IDW). The elevation includes the location’s altitude and the height of the measurement’s point for the climate data. For all measured climate data, the height is taken at 2 m above ground, while for the model climate data it is taken at 2 m for the temperature and the humidity, and at 0 m for the solar irradiation.
- All locations of measured climate data (CORR-1), using aggregated data that are averaged over all locations (resulting in one linear regression model);
- Each location of measured climate data (CORR-2), using the data for each location (resulting in one linear regression model per location);
- Each climate zone (CORR-3), using aggregated data that are averaged over all locations in the same climate zone (resulting in one linear regression model per climate zone);
- Each season (CORR-4), using aggregated data that are averaged over all locations for the same season (resulting in one linear regression model per season).
2.2. Building Energy Performance
3. Case Study
3.1. Required Climate Data
3.2. Hellenic Example Buildings
4. Results and Discussion
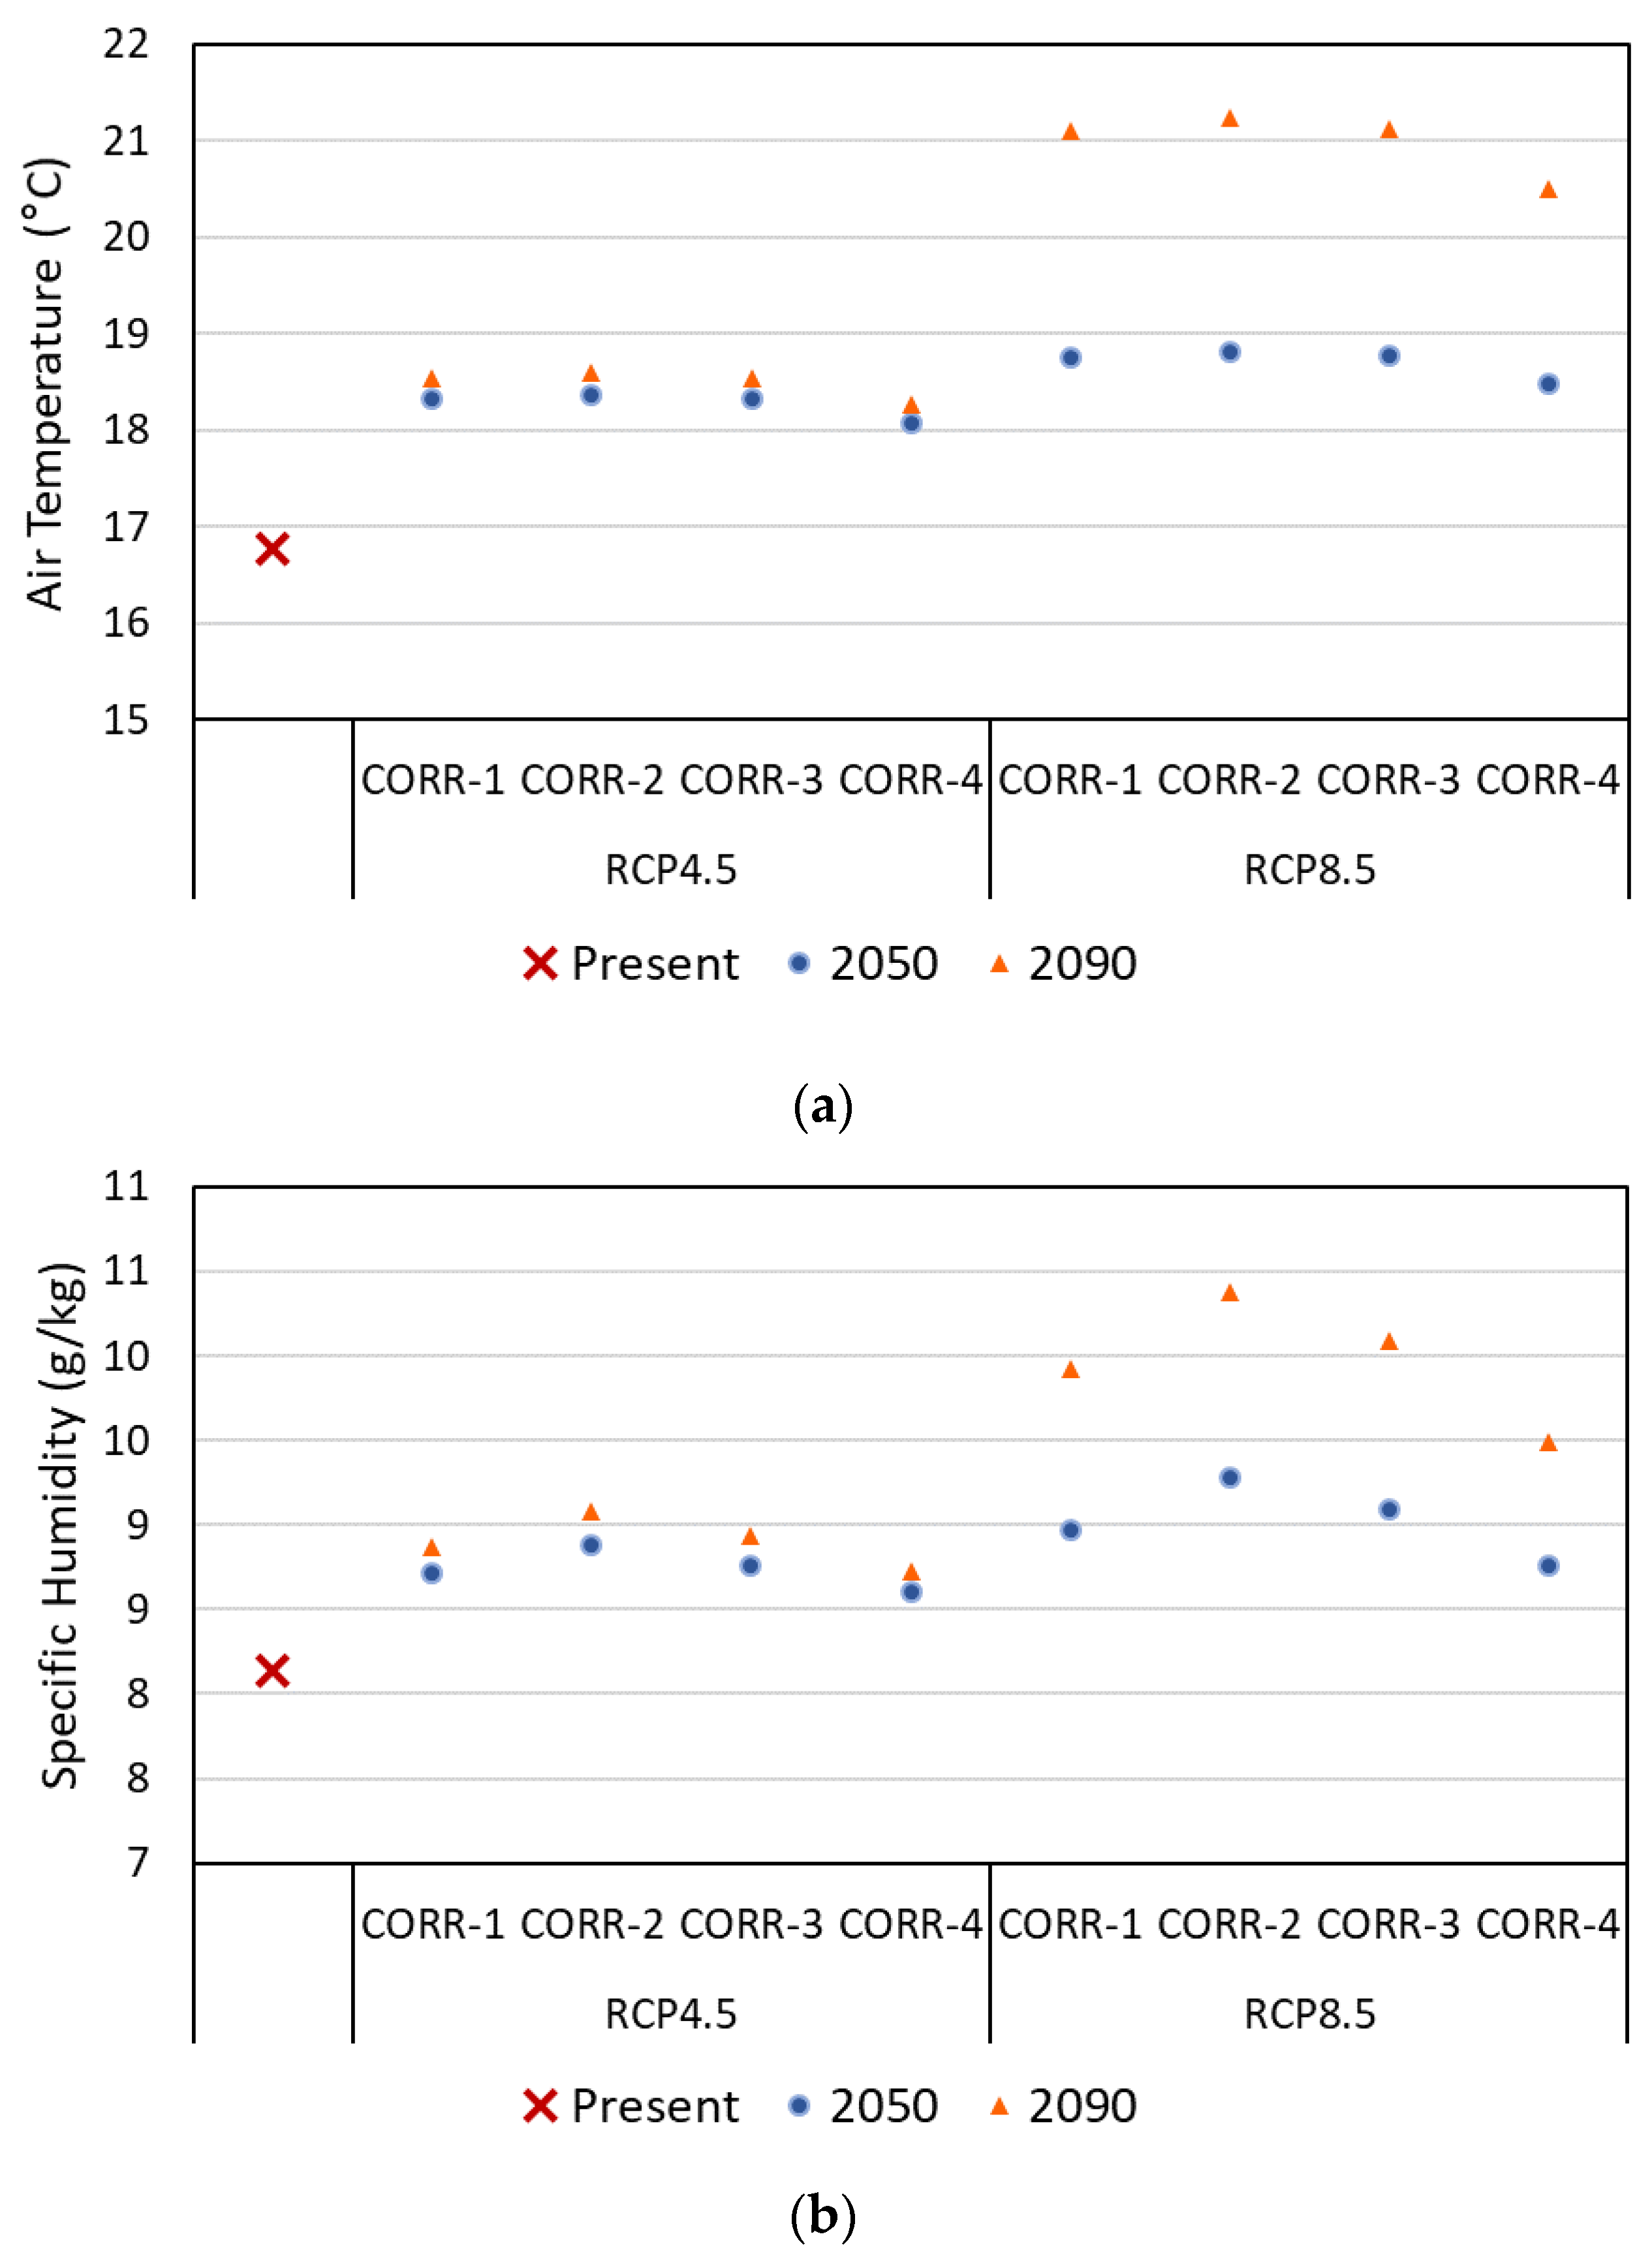
4.1. Future Climate Data
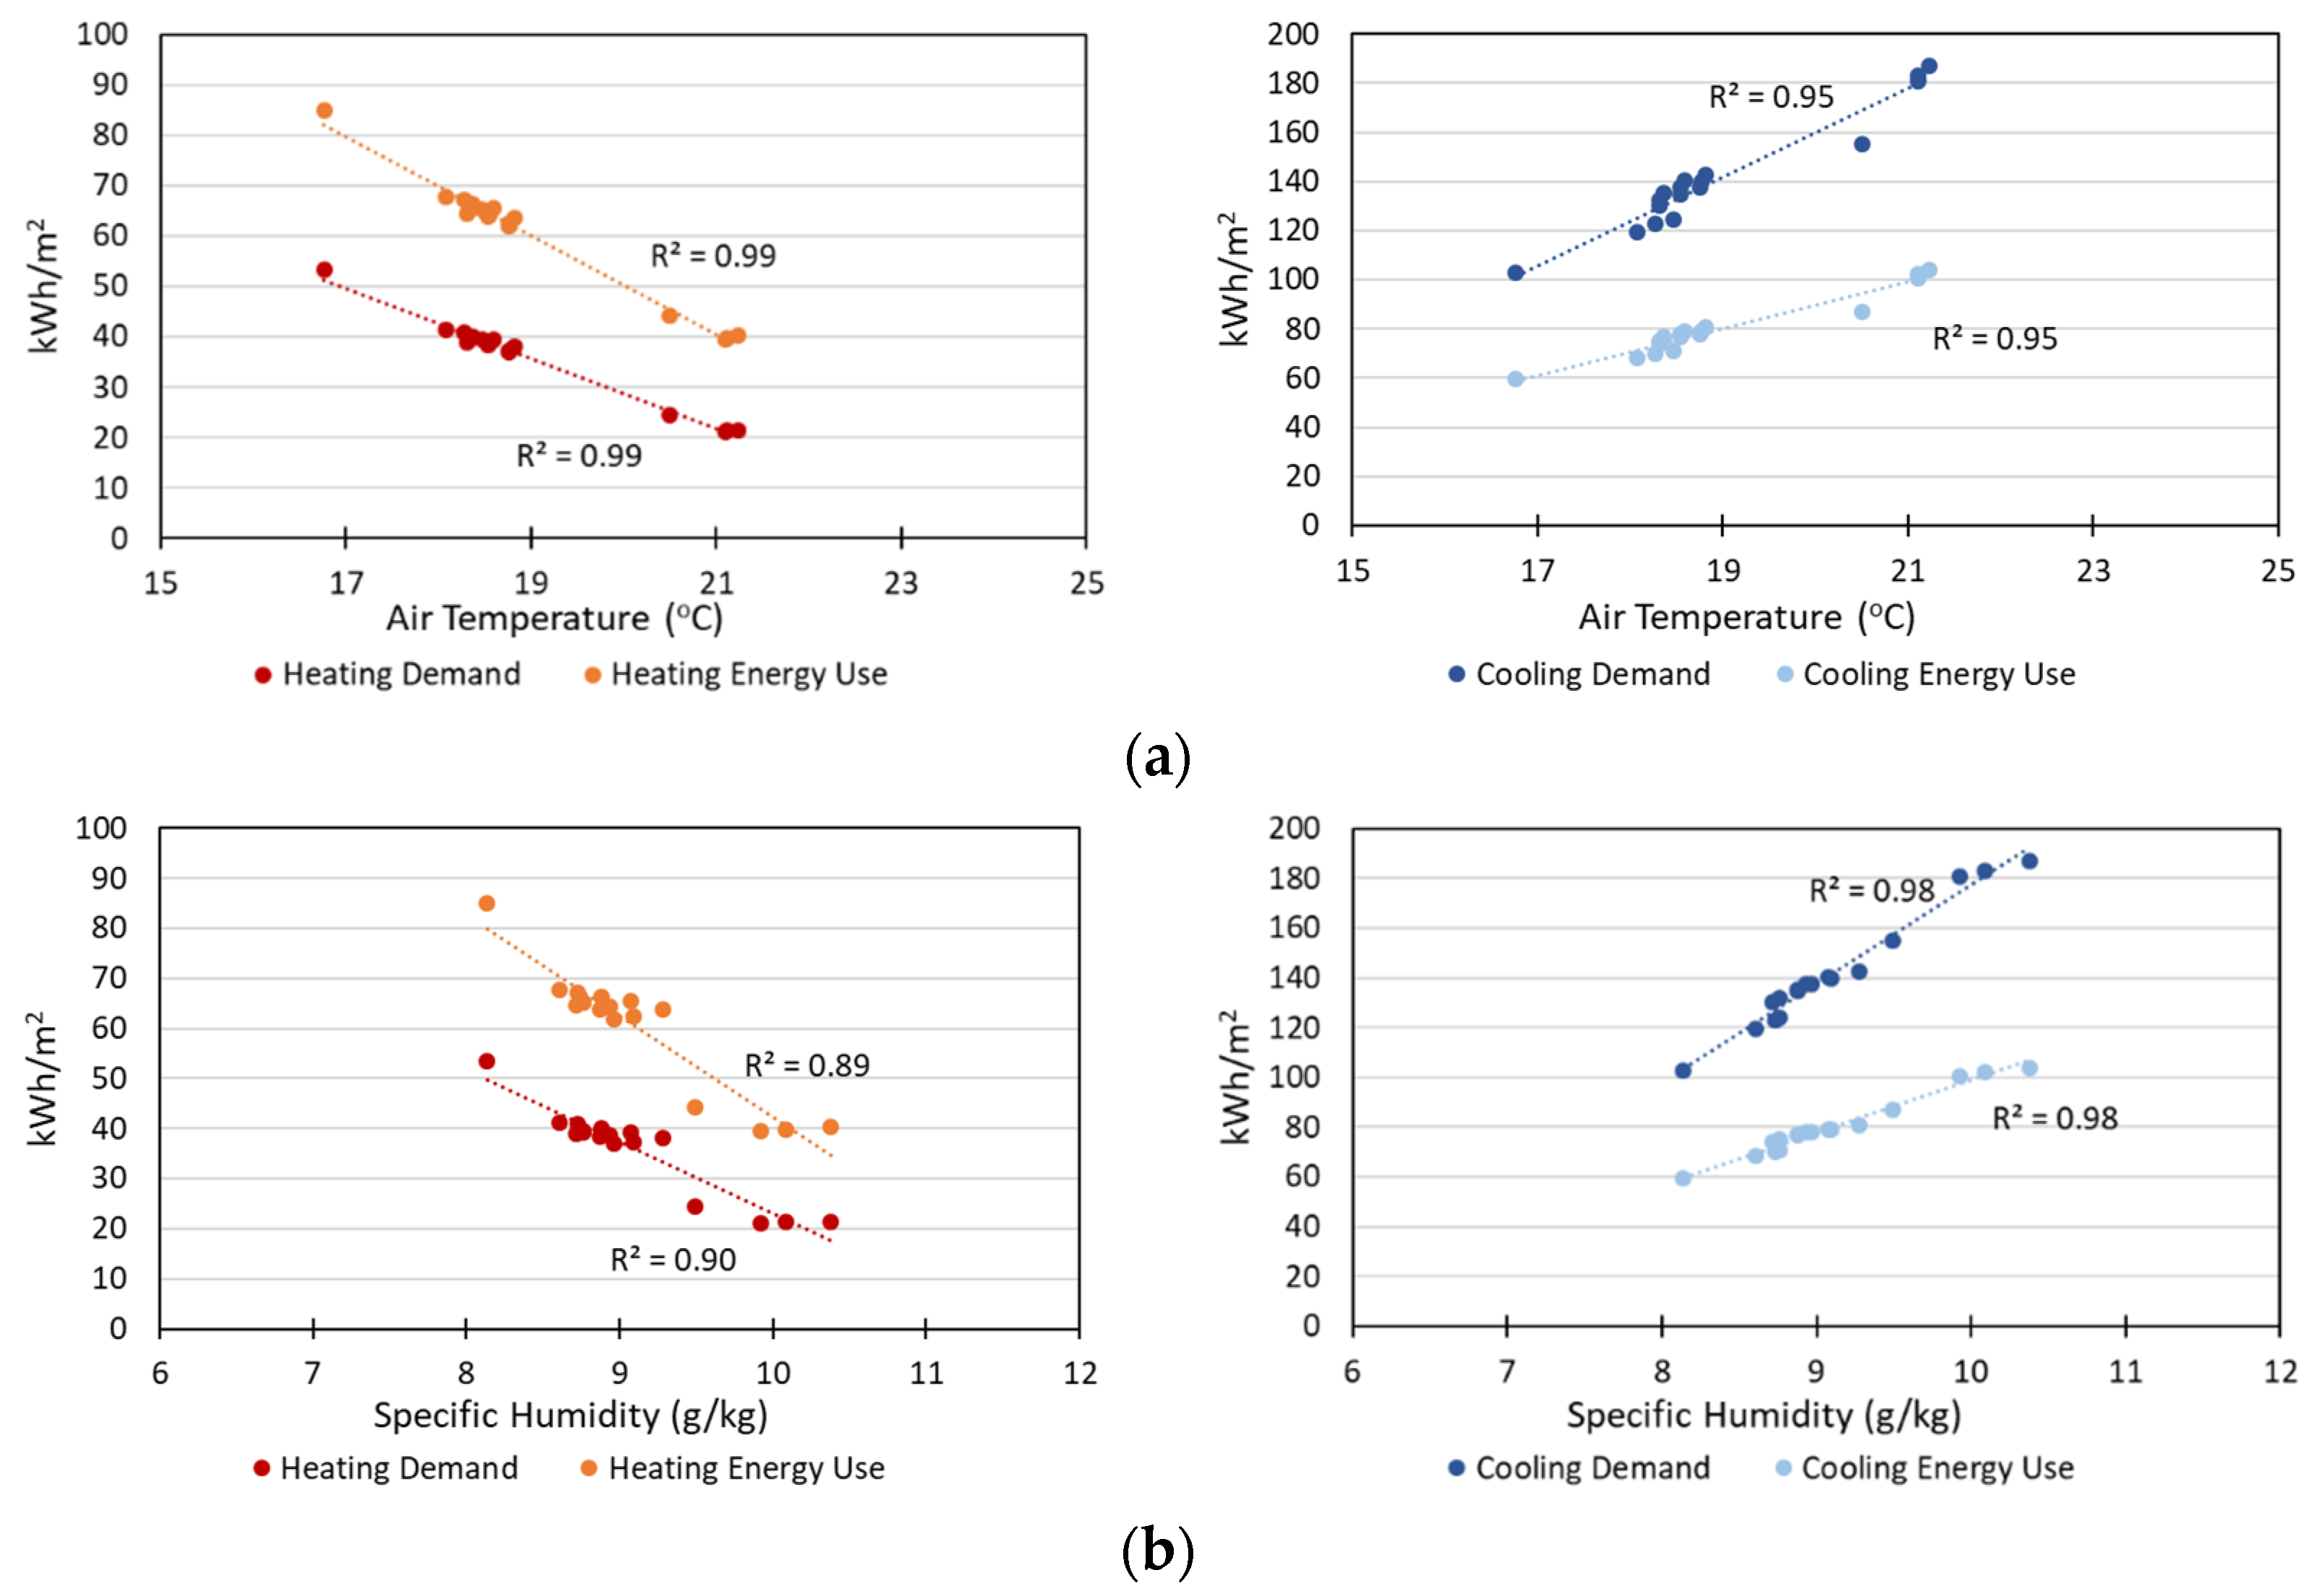
4.2. Building Energy Performance Indicators
5. Conclusions
Author Contributions
Funding
Institutional Review Board Statement
Informed Consent Statement
Data Availability Statement
Acknowledgments
Conflicts of Interest
References
- Climate Change Committee. A Natural Climate Cycle. What Is Causing Climate Change? Available online: https://www.theccc.org.uk/the-science-of-climate-change/climate-variations-natural-and-human-factors/a-natural-climate-cycle/ (accessed on 10 September 2021).
- IPCC. Climate Change 2014: Synthesis Report. Contribution of Working Groups I, II and III to the Fifth Assessment Report of the Intergovernmental Panel on Climate Change; Core Writing Team, Pachauri, R.K., Meyer, L.A., Eds.; IPCC: Geneva, Switzerland, 2014; p. 151. [Google Scholar]
- Gaffney, O.; Steffen, W. The Anthropocene equation. Anthr. Rev. 2017, 4, 53–61. [Google Scholar] [CrossRef]
- The State of the Global Climate 2020, World Meteorological Organization, April 2021. Available online: https://public.wmo.int/en/our-mandate/climate/wmo-statement-state-of-global-climate (accessed on 10 September 2021).
- Anderson, T.R.; Hawkins, E.; Jones, P.D. CO2, the greenhouse effect and global warming: From the pioneering work of Arrhenius and Callendar to today’s Earth System Models. Endeavour 2016, 40, 178–187. [Google Scholar] [CrossRef] [Green Version]
- IEA. Is Cooling the Future of Heating? International Energy Agency, Paris. 2020. Available online: www.iea.org/commentaries/is-cooling-the-future-of-heating (accessed on 10 September 2021).
- EU Energy Statistical Pocketbook and Country Datasheets. Statistical Pocketbook 2021. Available online: https://ec.europa.eu/energy/en/data-analysis/energy-statistical-pocketbook (accessed on 1 October 2021).
- Wang, H.; Chen, Q. Impact of climate change heating and cooling energy use in buildings in the United States. Energy Build. 2014, 82, 428–436. [Google Scholar] [CrossRef] [Green Version]
- Lamberti, G.; Salvadori, G.; Leccese, F.; Fantozzi, F.; Bluyssen, P.M. Advancement on Thermal Comfort in Educational Buildings: Current Issues and Way Forward. Sustainability 2021, 13, 10315. [Google Scholar] [CrossRef]
- Aebischer, B.; Henderson, G.; Jakob, M.; Catenazzi, G. Impact of climate change on thermal comfort, heating and cooling energy demand in Europe. ECEEE Summer Study Proc. 2007, 5, 859–870. [Google Scholar]
- Holmes, M.J.; Hacker, J.N. Climate change, thermal comfort and energy: Meeting the design challenges of the 21st century. Energy Build. 2007, 39, 802–814. [Google Scholar] [CrossRef]
- Shen, P. Impacts of climate change on U.S. building energy use by using downscaled hourly future weather data. Energy Build. 2017, 134, 61–70. [Google Scholar] [CrossRef]
- Wang, L.; Liu, X.; Brown, H. Prediction of the impacts of climate change on energy consumption for a medium-size office building with two climate models. Energy Build. 2017, 157, 218–226. [Google Scholar] [CrossRef]
- Verichev, K.; Zamorano, M.; Carpio, M. Effects of climate change on variations in climatic zones and heating energy consumption of residential buildings in the southern Chile. Energy Build. 2020, 215, 109874. [Google Scholar] [CrossRef]
- Invidiata, A.; Ghisi, E. Impact of climate change on heating and cooling energy demand in houses in Brazil. Energy Build. 2016, 130, 20–32. [Google Scholar] [CrossRef]
- Bezerra, P.; da Silva, F.; Cruz, T.; Mistry, M.; Vasquez-Arroyo, E.; Magalar, L.; De Cian, E.; Lucena, A.F.P.; Schaeffer, R. Impacts of a warmer world on space cooling demand in Brazilian households. Energy Build. 2021, 234, 10696. [Google Scholar] [CrossRef]
- Wan, K.K.W.; Li, D.H.W.; Lam, J.C. Assessment of climate change impact on building energy use and mitigation measures in subtropical climates. Energy 2011, 36, 1404–1414. [Google Scholar] [CrossRef]
- Chan, A.L.S. Developing future hourly weather files for studying the impact of climate change on building energy performance in Hong Kong. Energy Build. 2011, 43, 2860–2868. [Google Scholar] [CrossRef]
- Radhi, H. Evaluating the potential impact of global warming on the UAE residential buildings e a contribution to reduce the CO2 emission. Build. Environ. 2009, 44, 2451–2462. [Google Scholar] [CrossRef]
- Huang, K.-T.; Hwang, R.-L. Future trends of residential building cooling energy and passive adaptation measures to counteract climate change: The case of Taiwan. Appl. Energy 2016, 184, 1230–1240. [Google Scholar] [CrossRef]
- Chai, J.; Huang, P.; Sun, Y. Investigations of climate change impacts on net-zero energy building lifecycle performance in typical Chinese climate regions. Energy 2019, 185, 176–189. [Google Scholar] [CrossRef]
- Karimpour, M.; Belusko, M.; Xing, K.; Boland, J.; Bruno, F. Impact of climate change on the design of energy efficient residential building envelopes. Energy Build. 2015, 87, 142–154. [Google Scholar] [CrossRef]
- Dodoo, A.; Ayarkwa, J. Effects of Climate Change for Thermal Comfort and Energy Performance of Residential Buildings in a Sub-Saharan African Climate. Buildings 2019, 9, 215. [Google Scholar] [CrossRef] [Green Version]
- Giannakopoulos, C.; Hadjinicolaou, P.; Zerefos, C.; Demosthenous, G. Changing Energy Requirements in the Mediterranean under Changing Climatic Conditions. Energies 2009, 2, 805–815. [Google Scholar] [CrossRef] [Green Version]
- Giannakopoulos, C.; Kostopoulou, E.; Varotsos, K.V.; Tziotziou, K.; Plitharas, A. An integrated assessment of climate change impacts for Greece in the near future. Reg. Environ. Chang. 2011, 11, 829–843. [Google Scholar] [CrossRef] [Green Version]
- Pezzutto, S.; Toleikyte, A.; De Felice, M. Assessment of the Space Heating and Cooling Market in the EU28: A Comparison between EU15 and EU13 Member States. Int. J. Contemp. Energy 2015, 1, 35–48. [Google Scholar]
- Larsen, M.A.D.; Petrović, S.; Radoszynski, A.M.; McKenna, R.; Balyk, O. Climate change impacts on trends and extremes in future heating and cooling demands over Europe. Energy Build. 2020, 226, 110397. [Google Scholar] [CrossRef]
- Ciancio, V.; Salata, F.; Falasca, S.; Curci, G.; Golasi, I.; de Wilde, P. Energy demands of buildings in the framework of climate change: An investigation across Europe. Sustain. Cities Soc. 2020, 60, 102213. [Google Scholar] [CrossRef]
- Rodríguez, M.V.; Cordero, A.S.; Melgar, S.G.; Márquez, J.M.A. Impact of Global Warming in Subtropical Climate Buildings: Future Trends and Mitigation Strategies. Energies 2020, 13, 6188. [Google Scholar] [CrossRef]
- Figueiredo, R.; Nunes, P.; Panão, M.J.N.O.; Brito, M.C. Country residential building stock electricity demand in future climate—Portuguese case study. Energy Build. 2020, 209, 109694. [Google Scholar] [CrossRef]
- Yang, Y.; Javanroodi, K.; Nik, V.M. Climate change and energy performance of European residential building stocks–A comprehensive impact assessment using climate big data from the coordinated regional climate downscaling experiment. Appl. Energy 2021, 298, 117246. [Google Scholar] [CrossRef]
- Barros, V. (Ed.) Climate Change 2014: Impacts, Adaptation, and Vulnerability. Part B: Regional Aspects. Contribution of Working Group II to the Fifth Assessment; Cambridge University Press: Cambridge, UK, 2014. [Google Scholar]
- Asimakopoulos, D.A.; Santamouris, M.; Farrou, I.; Laskari, M.; Saliari, M.; Zanis, G.; Giannakidis, G.; Tigas, K.; Kapsomenakis, J.; Douvis, C.; et al. Modelling the energy demand projection of the building sector in Greece in the 21st century. Energy Build. 2012, 49, 488–498. [Google Scholar] [CrossRef]
- Cartalis, C.; Synodinou, A.; Proedrou, M.; Tsangrassoulis, A.; Santamouris, M. Modifications in energy demand in urban areas as a result of climate changes: An assessment for the southeast Mediterranean region. Energy Convers. Manag. 2001, 42, 1647–1656. [Google Scholar] [CrossRef]
- Amato, A.D.; Ruth, M.; Kirshen, P.; Horwitz, J. Regional energy demand responses to climate change: Methodology and application to the commonwealth of Massachusetts. Clim. Chang. 2005, 71, 175–201. [Google Scholar] [CrossRef]
- Wan, K.K.W.; Li, D.H.W.; Liu, D.; Lam, J.C. Future trends of building heating and cooling loads and energy consumption in different climates. Build. Environ. 2011, 46, 223–234. [Google Scholar] [CrossRef]
- Clarke, L.; Eom, J.; Marten, E.H.; Horowitz, R.; Kyle, P.; Link, R.; Mignone, B.K.; Mundra, A.; Zhou, Y. Effects of long-term climate change on global building energy expenditures. Energy Econ. 2018, 72, 667–677. [Google Scholar] [CrossRef]
- Zhou, Y.; Eom, J.; Clarke, L. The effect of global climate change, population distribution, and climate mitigation on building energy use in the U.S. and China. Clim. Chang. 2013, 119, 979–992. [Google Scholar] [CrossRef]
- Raju, K.S.; Kumar, D.N. Review of approaches for selection and ensembling of GCMs. J. Water Clim. Chang. 2020, 11, 577–599. [Google Scholar] [CrossRef]
- Meinshausen, M.; Smith, S.J.; Calvin, K.; Daniel, J.S.; Kainuma, M.L.T.; Lamarque, J.-F.; Matsumoto, K.; Montzka, S.A.; Raper, S.C.B.; Riahi, K.; et al. The RCP greenhouse gas concentrations and their extensions from 1765 to 2300. Clim. Chang. 2011, 109, 213. [Google Scholar] [CrossRef] [Green Version]
- Van Vuuren, D.P.; Edmonds, J.; Kainuma, M.; Riahi, K.; Thomson, A.; Hibbard, K.; Hurtt, G.C.; Kram, T.; Krey, V.; Lamarque, J.-F.; et al. The representative concentration pathways: An overview. Clim. Chang. 2011, 109, 5. [Google Scholar] [CrossRef]
- United Nations Framework Convention on Climate Change (UNFCCC). Available online: https://unfccc.int/files/adaptation/application/pdf/1.26_smhi_doescher.pdf (accessed on 10 September 2021).
- Melo, C.; Melo, O. Spatio-Temporal; Inverse Distance Weighting and Radial Basis Functions with Distance-Based Regression, Package Geosptdb, 2015. Available online: https://cran.r-project.org/web/packages/geosptdb/geosptdb.pdf (accessed on 10 September 2021).
- Panagea, I.S.; Tsanis, I.K.; Koutroulis, A.G.; Grillakis, M.G. Climate change impact on photovoltaic energy output: The case of Greece. Adv. Meteorol. 2014, 2014, 264506. [Google Scholar] [CrossRef]
- Balaras, C.A.; Dascalaki, E.G.; Droutsa, K.G.; Kontoyiannidis, S.; Guruz, R.; Gudnason, G. Energy & Other Key Performance Indicators for Buildings–Examples for Hellenic Buildings. Glob. J. Energy Technol. Res. Updates 2014, 1, 71–89. [Google Scholar]
- Droutsa, K.G.; Balaras, C.A.; Dascalaki, E.G.; Kontoyiannidis, S.; Argiriou, A.A. Energy Use Intensities for Asset Rating of Hellenic Non-Residential Buildings. Glob. J. Energy Technol. Res. Updates 2018, 5, 19–36. [Google Scholar]
- Dascalaki, E.G.; Balaras, C.A.; Gaglia, A.G.; Droutsa, K.G.; Kontoyiannidis, S. Energy performance of buildings–EPBD in Greece. Energy Policy 2012, 45, 469–477. [Google Scholar] [CrossRef]
- Sandberg, N.H.; Sartori, I.; Heidrich, O.; Dawson, R.; Dascalaki, E.; Dimitriou, S.; Vimm-r, T.; Filippidou, F.; Stegnar, G.; Šijanec Zavrl, M.; et al. Dynamic building stock modeling: Application to 11 European countries to support the energy efficiency and retrofit ambitions of the EU. Energy Build. 2016, 132, 26–38. [Google Scholar] [CrossRef] [Green Version]
- Popke, D.; Stevens, B.; Voigt, A. Climate and climate change in a radiative-convective equilibrium version of ECHAM6. J. Adv. Model. Earth Syst. 2013, 5, 1–14. [Google Scholar] [CrossRef]
- Jacob, D.; Teichmann, C.; Sobolowski, S.; Katragkou, E.; Anders, I.; Belda, M.; Benestad, R.; Boberg, F.; Buonomo, E.; Cardoso, R.M.; et al. Regional climate downscaling over Europe: Perspectives from the EURO-CORDEX community. Reg. Environ. Chang. 2020, 20, 51. [Google Scholar] [CrossRef]
- Report on Quality of Statistical Data from EPCs (In Greek). Available online: http://ypeka.gr/Default.aspx?tabid=907&language=el-GR (accessed on 10 September 2021).
- Humidity–The Second Pillar of Climate Change. Available online: www.metoffice.gov.uk/about-us/press-office/news/weather-and-climate/2020/scientists-investigate-humidity---the-second-pillar-of-climate-change (accessed on 10 September 2021).
- Bartók, B. Review of Surface Solar Radiation Projections in Bias-Corrected Euro-Cordex Regional Climate Models, Annals of West University of Timisoara. Physics 2018, 60, 3–13. [Google Scholar]
- Jerez, S.; Thais, F.; Tobin, I.; Wild, M.; Colette, A.; Yiou, P.; Vautard, R. The CLIMIX model: A tool to create and evaluate spatially-resolved scenarios of photovoltaic and wind power development. Renew. Sustain. Energy Rev. 2014, 42, 1–15. [Google Scholar] [CrossRef]
- Wild, M.; Folini, D.; Henschel, F.; Fischer, N.; Müller, B. Projections of long-term changes in solar radiation based on CMIP5 climate models and their influence on energy yields of photovoltaic systems. Sol. Energy 2015, 116, 12–24. [Google Scholar] [CrossRef] [Green Version]
- Bartók, B.; Wild, M.; Folini, D.; Lüthi, D.; Kotlarski, S.; Schär, C.; Vautard, R.; Jerez, S.; Imecs, Z. Projected changes in surface solar radiation in CMIP5 global climate models and in EURO-CORDEX regional climate models for Europe. Clim. Dyn. 2017, 49, 2665–2683. [Google Scholar] [CrossRef]
- IPCC. Climate Change 2013: The Physical Science Basis. Contribution of Working Group I to the Fifth Assessment Report of the Intergovernmental Panel on Climate Change; Stocker, T.F., Qin, D., Plattner, G.-K., Tignor, M., Allen, S.K., Boschung, J., Nauels, A., Xia, Y., Bex, V., Midgley, P.M., Eds.; Cambridge University Press: Cambridge, UK; New York, NY, USA, 2014; 1535p. [Google Scholar]
- Jacob, D.; Petersen, J.; Eggert, B.; Alias, A.; Christensen, O.B.; Bouwer, L.M.; Braun, A.; Colette, A.; Déqué, M.; Georgievski, G.; et al. EURO-CORDEX: New high-resolution climate change projections for European impact research. Reg. Environ. Chang. 2014, 14, 563–578. [Google Scholar] [CrossRef]
- National Plan for Energy and Climate (In Greek). Available online: www.opengov.gr/minenv/?p=10155 (accessed on 10 September 2021).


| ΧYΖ Location Adjustment | Air Temperature (°C) | Specific Humidity (g/kg) | Horizontal Irradiation (MJ/m2) |
|---|---|---|---|
| model-POINT1 | 1.9 | 1.4 | 102.0 |
| model-IDWna | 2.0 | 1.4 | 99.0 |
| model-IDW | 1.8 | 1.3 | 101.4 |
| Time Periods | Representative Concentration Pathways | Measured Climate Data | Model Climate Data | |||
|---|---|---|---|---|---|---|
| Linear Regression Models | ||||||
| CORR-1 | CORR-2 | CORR-3 | CORR-4 | |||
| Air Temperature 1 (°C) | ||||||
| Present | 16.8 | 16.8 | 16.8 | 16.8 | 16.8 | |
| Near Future–2050 | RCP4.5 | 18.3 | 18.4 | 18.3 | 18.1 | |
| RCP8.5 | 18.8 | 18.8 | 18.8 | 18.5 | ||
| Distant Future–2090 | RCP4.5 | 18.5 | 18.6 | 18.5 | 18.3 | |
| RCP8.5 | 21.1 | 21.2 | 21.1 | 20.5 | ||
| Specific Humidity 2 (g/kg) | ||||||
| Present | 8.1 | 8.1 | 8.1 | 8.1 | 8.1 | |
| Near Future–2050 | RCP4.5 | 8.7 | 8.9 | 8.8 | 8.6 | |
| RCP8.5 | 9.0 | 9.3 | 9.1 | 8.8 | ||
| Distant Future–2090 | RCP4.5 | 8.9 | 9.1 | 8.9 | 8.7 | |
| RCP8.5 | 9.9 | 10.4 | 10.1 | 9.5 | ||
| Solar Irradiation 3 (MJ/m2) | ||||||
| Present | 484 | 483 | 483 | 483 | 481 | |
| Near Future–2050 | RCP4.5 | 484 | 484 | 484 | 481 | |
| RCP8.5 | 484 | 484 | 484 | 482 | ||
| Distant Future–2090 | RCP4.5 | 483 | 483 | 483 | 480 | |
| RCP8.5 | 485 | 485 | 485 | 483 | ||
| Near Future–2050 | Distant Future–2090 | |||
|---|---|---|---|---|
| RCP4.5 | RCP8.5 | RCP4.5 | RCP8.5 | |
| Air Temperature (°C) | ||||
| Range | 0.3 | 0.3 | 0.3 | 0.7 |
| Variance | 0.0 | 0.0 | 0.0 | 0.1 |
| Standard deviation | 0.1 | 0.2 | 0.1 | 0.3 |
| Average | 18.3 | 18.7 | 18.5 | 21.0 |
| Coefficient of variation | 0.7 | 0.8 | 0.8 | 1.6 |
| Specific Humidity (g/kg) | ||||
| Range | 0.3 | 0.5 | 0.3 | 0.9 |
| Variance | 0.0 | 0.0 | 0.0 | 0.1 |
| Standard deviation | 0.1 | 0.2 | 0.1 | 0.4 |
| Average | 8.7 | 6.0 | 8.9 | 6.6 |
| Coefficient of variation | 1.3 | 3.6 | 1.6 | 5.6 |
| Solar Horizontal Irradiation (MJ/m2) | ||||
| Range | 2.7 | 2.4 | 2.6 | 2.3 |
| Variance | 1.8 | 1.4 | 1.7 | 1.3 |
| Standard deviation | 1.3 | 1.2 | 1.3 | 1.1 |
| Average | 483.1 | 323.0 | 482.3 | 323.4 |
| Coefficient of variation | 0.3 | 0.4 | 0.3 | 0.3 |
| Measured Climate Data | Model Climate Data | ||||
|---|---|---|---|---|---|
| Near Future–2050 | Distant Future–2090 | ||||
| Present Avg | RCP4.5 Avg [Min–Max] | RCP8.5 Avg [Min–Max] | RCP4.5 Avg [Min–Max] | RCP8.5 Avg [Min–Max] | |
| Heating Demand (kWh/m2) | |||||
| ZA | 31.3 | 21.2 [20.2–23.1] | 20.1 [19.2–22.2] | 20.9 [19.9–22.9] | 10.1 [9.2–12.6] |
| ZB | 50.9 | 39.1 [37.6–41.2] | 37.3 [35.8–39.5] | 38.7 [37.1–40.8] | 21.2 [19.6–24.1] |
| ZC | 93.8 | 70.4 [67.7–75.6] | 66.7 [64.0–71.5] | 69.1 [66.3–74.1] | 42.2 [40.2–44.8] |
| ZD | 152.3 | 120.5 [116.9–124.3] | 116.5 [113.0–120.3] | 118.9 [115.5–122.7] | 78.5 [76.5–80.5] |
| N | 53.4 | 39.8 [38.9–41.3] | 38.0 [37.0–39.5] | 39.3 [38.3–40.8] | 22.1 [21.1–24.5] |
| Heating Energy Use (kWh/m2) | |||||
| ZA | 48.9 | 35.0 [33.6–37.6] | 33.6 [32.2–36.3] | 34.6 [33.2–37.2] | 20.3 [19.1–23.6] |
| ZB | 76.4 | 61.2 [58.9–64.0] | 58.9 [56.6–61.8] | 60.7 [58.4–63.6] | 37.6 [35.3–41.6] |
| ZC | 154.9 | 123.4 [116.6–130.4] | 127.8 [119.7–135.4] | 126.5 [118.7–133.8] | 165.9 [146.0–177.5] |
| ZD | 310.7 | 250.3 [243.3–258.0] | 242.2 [235.4–249.7] | 247.2 [240.5–254.7] | 168.3 [164.3–172.5] |
| N | 85.1 | 66.0 [64.6–67.8] | 63.3 [62.0–65.3] | 65.2 [63.8–67.1] | 41.0 [39.6–44.1] |
| Cooling Demand (kWh/m2) | |||||
| ZA | 101.8 | 120.5 [111.2–130.9] | 127.6 [116.1–139.4] | 125.4 [114.7–136.7] | 167.1 [146.0–184.0] |
| ZB | 114.8 | 144.8 [132.9–150.2] | 152.5 [138.4–159.0] | 149.7 [136.4–155.9] | 196.1 [172.7–205.9] |
| ZC | 86.2 | 123.4 [116.6–130.4] | 127.8 [119.7–135.4] | 126.5 [118.7–133.8] | 165.9 [146.0–177.5] |
| ZD | 68.9 | 111.8 [109.9 – 114.0] | 116.8 [113.1–119.6] | 117.2 [114.0–120.2] | 164.5 [147.4–171.9] |
| N | 105.2 | 132.5 [122.4–138.5] | 139.5 [127.3–146.3] | 137.1 [125.7–43.7] | 181.0 [159.0–191.9] |
| Cooling Energy Use (kWh/m2) | |||||
| ZA | 57.5 | 67.1 [62.3–72.5] | 70.7 [64.8–76.9] | 69.6 [64.1–75.5] | 91.1 [80.2–99.8] |
| ZB | 67.0 | 83.2 [76.8–86.1] | 87.3 [79.8–90.8] | 85.8 [78.6–89.2] | 110.6 [98.1–115.9] |
| ZC | 50.8 | 70.5 [66.8–74.2] | 72.8 [68.5–76.8] | 72.1 [67.9–76.0] | 93.1 [82.4–99.2] |
| ZD | 44.6 | 67.5 [66.4–68.8] | 70.2 [68.1–71.9] | 70.5 [68.6–72.1] | 95.8 [86.5–99.9] |
| N | 60.9 | 75.4 [70.0–78.5] | 79.1 [72.6–82.6] | 77.8 [71.8–81.2] | 101.0 [89.3–106.6] |
| Heating & Cooling Demand (kWh/m2) | |||||
| ZA | 133.2 | 141.7 [134.3–152.0] | 147.7 [138.2–59.3] | 146.2 [137.6–157.4] | 177.2 [158.6–193.1] |
| ZB | 165.7 | 183.9 [174.1–189.4] | 189.9 [177.9–196.4] | 188.4 [177.2–194.7] | 217.3 [196.9–226.6] |
| ZC | 168.0 | 176.6 [170.0–182.7] | 176.6 [169.0–183.1] | 177.9 [170.5–184.3] | 184.9 [168.8–193.3] |
| ZD | 212.9 | 218.7 [213.5–221.8] | 219.1 [212.4–222.5] | 221.9 [215.7–225.1] | 223.1 [207.5–229.2] |
| N | 156.0 | 169.1 [160.7–175.0] | 174.0 [163.7–180.7] | 173.1 [163.5–179.5] | 198.6 [179.6–208.6] |
| Heating & Cooling Energy Use (kWh/m2) | |||||
| ZA | 106.4 | 102.1 [99.3–107.8] | 104.4 [101.1–110.6] | 104.2 [101.3–110.2] | 111.4 [103.7–119.1] |
| ZB | 143.5 | 144.4 [140.8–147.6] | 146.2 [141.6–150.0] | 146.5 [142.2–150.1] | 148.3 [139.7–153.1] |
| ZC | 198.5 | 179.4 [174.3–188.3] | 175.7 [170.9–184.5] | 178.8 [173.9–187.6] | 155.9 [148.2–163.4] |
| ZD | 349.9 | 309.6 [301.6–316.7] | 303.9 [295.2–311.1] | 309.1 [300.8–316.1] | 252.5 [243.0–258.4] |
| N | 144.6 | 139.5 [136.2–143.0] | 140.5 [136.1–144.3] | 141.1 [137.1–144.8] | 139.4 [131.3–144.3] |
Publisher’s Note: MDPI stays neutral with regard to jurisdictional claims in published maps and institutional affiliations. |
© 2021 by the authors. Licensee MDPI, Basel, Switzerland. This article is an open access article distributed under the terms and conditions of the Creative Commons Attribution (CC BY) license (https://creativecommons.org/licenses/by/4.0/).
Share and Cite
Droutsa, K.G.; Kontoyiannidis, S.; Balaras, C.A.; Argiriou, A.A.; Dascalaki, E.G.; Varotsos, K.V.; Giannakopoulos, C. Climate Change Scenarios and Their Implications on the Energy Performance of Hellenic Non-Residential Buildings. Sustainability 2021, 13, 13005. https://0-doi-org.brum.beds.ac.uk/10.3390/su132313005
Droutsa KG, Kontoyiannidis S, Balaras CA, Argiriou AA, Dascalaki EG, Varotsos KV, Giannakopoulos C. Climate Change Scenarios and Their Implications on the Energy Performance of Hellenic Non-Residential Buildings. Sustainability. 2021; 13(23):13005. https://0-doi-org.brum.beds.ac.uk/10.3390/su132313005
Chicago/Turabian StyleDroutsa, Kalliopi G., Simon Kontoyiannidis, Constantinos A. Balaras, Athanassios A. Argiriou, Elena G. Dascalaki, Konstantinos V. Varotsos, and Christos Giannakopoulos. 2021. "Climate Change Scenarios and Their Implications on the Energy Performance of Hellenic Non-Residential Buildings" Sustainability 13, no. 23: 13005. https://0-doi-org.brum.beds.ac.uk/10.3390/su132313005