Article

Investigating the Climate-Related Risk of Forest Fires for Mediterranean Islands’ Blue Economy

1
Fondazione CMCC—Centro Euro-Mediterraneo sui Cambiamenti Climatici, Impacts on Agriculture, Forests and Ecosystem Services (IAFES) Division, 07100 Sassari, Italy
2
National Research Council—Institute of BioEconomy (CNR-IBE), 07100 Sassari, Italy
3
Laboratory of Climatology and Atmospheric Environment, Department of Geology and Geoenvironment, School of Sciences, National and Kapodistrian University of Athens, GR-15772 Athens, Greece
4
Institute for Environmental Research and Sustainable Development, National Observatory of Athens, GR-15236 Athens, Greece
5
Ramboll France SAS, 13290 Aix-en-Provence, France
6
Department of Agriculture Sciences, University of Sassari, 07100 Sassari, Italy
*
Author to whom correspondence should be addressed.
Sustainability 2021, 13(18), 10004; https://0-doi-org.brum.beds.ac.uk/10.3390/su131810004
Submission received: 28 June 2021 / Revised: 23 August 2021 / Accepted: 1 September 2021 / Published: 7 September 2021

Abstract

:
The Mediterranean islands’ blue economy and, more specifically, the tourism sector, largely regulate Europe’s gross product. Climate change threatens the ecological, societal, and economic sustainability of the islands in many ways, with increasing wildfires making up one of the most critical components of the climate change impacts on tourism. Here, we aim to identify and assess forest fire vulnerability and risk due to climate change for seven Mediterranean islands through the application of the “impact chain” conceptual framework. The backbone of this approach requires the integration of quantitative and qualitative data according to the three main risk components sensu the Intergovernmental Panel on Climate Change (IPCC), i.e., hazard, exposure, and vulnerability, with a structured participatory approach involving stakeholders and experts. Our results illustrate the islands with high potential for improvement in terms of adapting capacity and, by indicating the contribution of the different risk components, highlight the main environmental and socio-economic elements that affect the islands’ vulnerability and risk under climate change. The approach’s potentials and constraints are discussed, suggesting that the method can be handily used to point out the priorities that must be addressed by mitigation and adaptation policies and measures at the island level.

1. Introduction

Marine and coastal tourism represent one of the most significant blue economy activities in Europe and one of the fastest-growing segments in the tourism industry [1]. Today, it employs 3.2 million people, with €183 billion in gross value added. By 2030, it is estimated that it will make up nearly a third of the global ocean economy employing more than double the number of people at present [2].
In the Mediterranean, tourism constitutes a major economic sector. In 2014, the Mediterranean earned 217 billion euros in international tourism receipts, 23% of the world total [3]. In particular, Mediterranean islands rely heavily on tourism to expand and develop their economies. Tangible effects emerged when the sector faced a decline of 60% in 2020, at the global level [4], which continued in 2021 due to the COVID-19 pandemic (e.g., [5,6]). Even though the pandemic’s impacts and reverberation on societies and the economy have supplanted or overshadowed the climate crisis [7], the latter is also expected to affect the tourism industry [8] heavily, especially considering that the Mediterranean has been recognized as a climate change “hot spot” [8,9].
There is robust evidence that the Mediterranean region has significantly warmed during the previous century, and warming has been accelerating during the last decades [10]. According to several studies, after the 1980s, regional warming has sped up and increased faster than the global average [11,12,13]. For the decades to come, multi-model ensembles of EURO-CORDEX 0.11° climate simulations indicate that widespread warming will almost certainly occur in the Mediterranean and will range between 0.9–1.5 °C and 3.7–5.6 °C, under two representative concentration pathways, i.e., the RCP2.6 and RCP8.5 scenarios, respectively [14]. As far as precipitation is concerned, most model projections indicate a trend towards drier conditions, especially during the warm season (June, July, and August) and over the southern areas. This decrease, depending on emission scenarios, ranges between 4 and 22% towards the end of the 21st century [14]. In this context, the forest fire risk, which represents one of the main threats for Mediterranean ecosystems and societies, is expected to grow due to climate change [10]. Several studies [15,16,17] indicate a future increase in the burnt area due to warming, ranging from 40% for 1.5 °C warming to 100% for 3 °C warming.
Wildfires have several impacts on natural capital, which are often difficult to quantify or account for [18], by affecting ecosystem services including carbon storage, biodiversity protection, water source safety, reduction of soil erosion and land degradation, and climate regulation. Furthermore, several studies have suggested that fire activity (e.g., fire intensity, burnt area location) also influences tourists’ demand and preferences [19]. A recent study [20] highlighted that literature and research on this topic are fragmented and overlooked, and pointed out a mixed response of tourism toward fires. From a meta-analysis [20], only one paper addressed the impact of climate change and fires on tourism [21], reporting a negative relation between burnt areas and the number of tourist arrivals. Although tourism businesses and tourist behavior seemed to be involved only in the short run [22], more frequent and more extensive forest fires will significantly impact the tourism sector, damaging infrastructures [23] and posing an immediate threat to the unfamiliar tourists themselves [24].
To address this multidisciplinary context, the presence of complementary and integrated expertise is of the utmost importance. In this regard, the “impact chain” (IC) approach represents a suitable framework to identify and assess vulnerability and risk to climate change [25,26,27], mapping sectorial challenges where new strategies for climate change adaptation are needed [28] and, thus, increasing preparedness to extreme events [29]. The IC approach pivots on the Intergovernmental Panel on Climate Change (IPCC) [30], consisting of the interaction between hazard, natural, and socio-economic exposure, and vulnerability (entailing sensitivity and adaptive capacity) with climate shocks.
The aim of the present work, conducted in the context of the H2020 SOCLIMPACT project (DownScaling CLImate ImPACTs, [31]), is to develop and implement a structured approach to assess forest fire vulnerability and risk under climate change conditions. The study, based on the latest scientific advancements and implemented for operational purposes, focuses on seven Mediterranean islands (from west to east: the Balearic Islands, Corse, Sardinia, Sicily, Malta, Crete, and Cyprus; see Figure 1) and contributes towards a common framework for climate governance in the context of the EU blue economy.
To pursue this aim, the IC approach was applied for a reference time period (1986–2005), two different future periods (2046–2065 and 2081–2100), and two selected RCPs (2.6 and 8.5), using climate variables from a set of high-resolution Euro-CORDEX simulations [32]. Moreover, a group of socio-economic and bio-physical indicators was collected, representing the exposed assets, their sensitivity, and the islands’ adaptive capacity. Furthermore, the IC method is a highly participatory approach. To handle this challenge, the SOCLIMPACT project adapted its governance to work at different levels (e.g., sector, island, type of risk). Sector leaders, island focal points (IFPs), and other relevant SOCLIMPACT project stakeholders (coming from the research and academy, NGOs, governance, and community) were involved in developing and weighing the approach, performing an intercomparison of wildfire-related indicators, and achieving a shared perspective on climate risks and vulnerabilities for policymakers and stakeholders.
The paper is structured as follows: Section 2 presents the methodology, including a general introduction on the IC approach, the selection, handling, normalization, weighting, and aggregation of indicators. Section 3 focuses on the results, presenting the comparative analysis of the risk components at the island level and the expert interview concerning indicators’ weights. Finally, Section 4 provides a discussion on the results and concluding remarks.

2. Materials and Methods

The methodology for the vulnerability and risk assessment is based on the concept of the impact chain (IC), which was first published by [28], and then “catalyzed” by the German corporation for International Cooperation (GIZ) in the Vulnerability Sourcebook [33]. Since then, ICs have been increasingly used as a climate risk assessment method in Europe and worldwide, regionally and locally, both for research purposes and decision-making [26,34,35,36,37]. Thus, the methodology can be used both for the high-level identification of key risks and a more in-depth analysis of specific risks and adaptation strategies. Furthermore, it has been updated [25] on the understanding of climate change-related risks as proposed by the IPCC Fifth Assessment Report [38]. Such risk results from the interaction of climate hazards, exposure and vulnerability of the exposed elements, systems and population.
IC, as a conceptual framework, allows integrating quantitative and qualitative data from various disciplines (e.g., geography, climate modelling, stakeholders’ knowledge), methodological approaches, and sources [34], and follows a participatory approach to facilitate a better understanding and cross-cutting dialogue. The GIZ methodology [25] proposes eight main steps that outline IC and risk assessment preparation, identifying first the initial situation in terms of climate impacts and risks to brainstorm adaptation measures based on the outcomes of the methodology. Specifically, the essential steps for preparing risk assessment according to the GIZ methodology [25] are: (1) preparing the risk assessment; (2) developing impact chains; (3) identifying and selecting indicators; (4) data acquisition and management; (5) normalization of indicator data; (6) weighting and aggregating of indicators; (7) aggregating risk components to risk; (8) presenting the outcomes of the risk assessment.
The IC development increases the usability of climate projections and climate impact models by illustrating the results more comprehensively. Implementing an IC can either involve a sophisticated modelling chain, or can support a quick diagnosis. ICs can be cross-sectoral and cross-scale and allow for aggregating or downscaling risks and comparing among sectors.

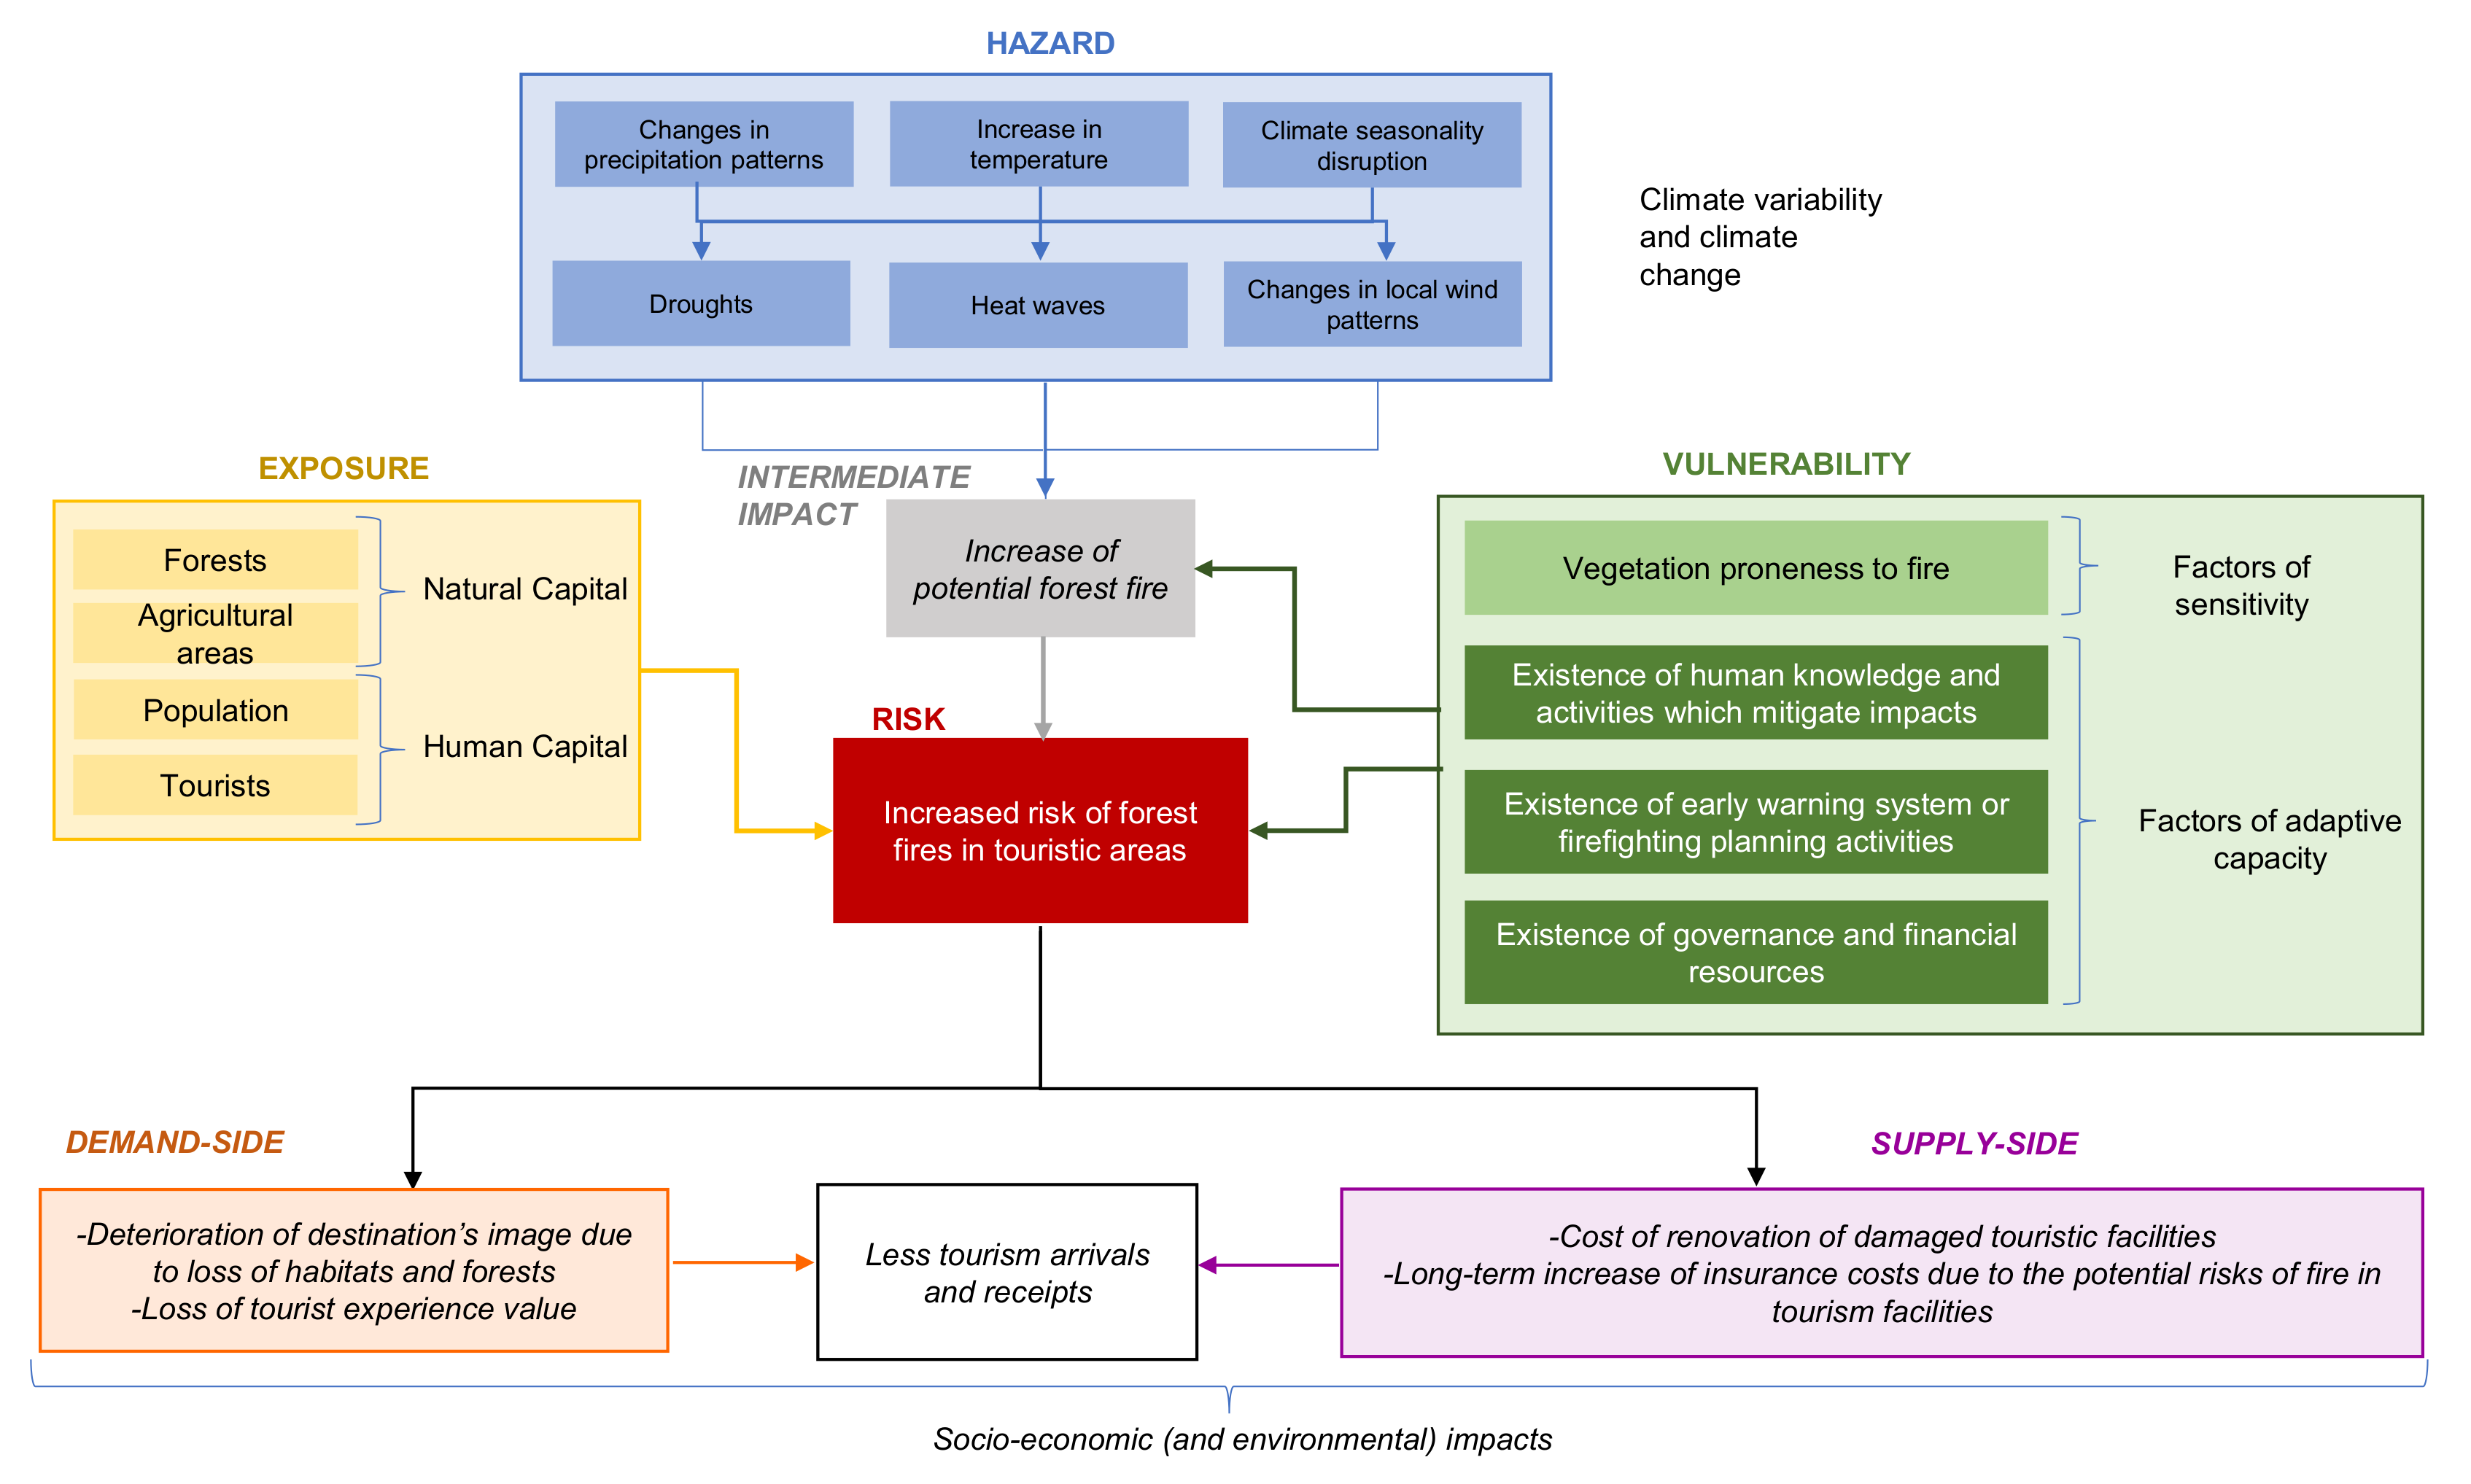
2.1. Risk Assessment and Impact Chain Development

The development of the forest fire IC within the framework of the SOCLIMPACT project includes several steps involving different types of experts and stakeholders. Firstly, sector leaders (i.e., the project partners identified for their sectoral knowledge perspective in the blue economy framework) produced the first inventory of each sector’s priorities and climate change impacts, based on the literature review and stakeholders’ consultation. From this initial list of impacts, theoretical ICs were developed during a first meeting with the blue economy sector teams and island focal points (IFPs, project partners identified to provide links with stakeholders, bridge climate risk assessment and adaptation planning, and thus create local working groups). Figure 2 presents the result of this initial brainstorming as regards the forest fire theoretical impact chain.
First, the main risk components (hazard, exposure, and vulnerability, in Figure 2 light boxes) were analyzed and disentangled into underlying factors (darker boxes). The factors comprise those aspects that characterize the risk components. As a result, the final risk will be composed by the hazard (impact from what, blue boxes in Figure 2), the exposed elements (what or who is at risk, yellow boxes), and the vulnerability (system contribution to the risk, green boxes). In addition, vulnerability factors must represent the two aspects of sensitivity (intrinsic system attributes contributing to the risk) and adaptive capacity (presence or lack of societal system ability to reduce, now and in future, the risk). Finally, the forest fire risk will impact different socio-economic variables (boxes in italics). These impacts can be distinguished depending on whether they directly affect the demand side or the supply side. This last part of the IC is shown in Figure 2 but was not analyzed in this work.
Next, sector leaders and the IFPs identified and selected the indicators for each risk component and factor, according to several characteristics and criteria (see Section 2.2). The theoretical risk components were then replaced with indicators commonly used in climate change studies. The impact chains were finally presented to stakeholders in local working groups (one per island) confronted with a first feasibility analysis regarding modelling resources and data needs and availability. This method of knowledge co-production allowed us to understand and achieve a shared perspective on climate risks and vulnerabilities and then integrate the local and diverse views of policymakers and stakeholders on desirable and equitable climate-resilient futures into the impact modelling. Finally, external experts with different backgrounds and strong experience in fire risks were interviewed to define indicators’ priorities and weights (see Section 2.3).

2.2. Indicator Selection and Data Management

The risk of climate-related impacts results from the interaction of climate-related hazards with the vulnerability and exposure of human and natural systems. The developed climate-related impact chain allowed for the identification and selection of the indicators for each component and factor of risk. Indicators are parameters that provide quantitative information about specific states or conditions used to compare against critical thresholds or previous conditions.
The indicator’s selection is an iterative process whereby a list of ideal choices is slowly thinned out, taking into account relevance, soundness, accessibility, and timeliness [39]. Thus, indicators are rejected if they are unfeasible or, in particular, if there are insufficient data to produce them. In the current study, the selection of the indicators was based mainly on: (i) the evaluation of their relevance and reliability through the extensive literature review, (ii) the possibility of data acquisition in the future, and (iii) their practicality and affordability (meaning that the indicator must be obtained from an accessible data source and in a suitable format, thus maintaining the operational perspective). In this sense, several data sources at the regional or national level (e.g., census databases, land cover and land use maps) were screened, taking into account their temporal and spatial resolution. Finally, a geodatabase allowing for collecting, managing, sharing, and processing geographic data structured in various information levels (i.e., spatial, temporal, short description, and source of information) has been realized.

2.2.1. Climatic Data

The Canadian Fire Weather Index (FWI) is used to assess the climate hazard component of the impact chain. The FWI system provides numerical non-dimensional ratings of the relative fire potential for a generalized fuel type based solely on weather observations. The FWI consists of different components that assess moisture responses to atmospheric variables at different soil depths and then combine these to derive fire behavior indices in terms of ease of spread and intensity.
The FWI is part of the Canadian Forest Fire Danger Rating System established in Canada in 1971 [40]. Furthermore, since 2007, the FWI has been adopted at the EU level and used in a harmonized way throughout Europe by the European Forest Fire Information System (EFFIS [41]) of the Copernicus Emergency Management Service (since 2015). Therefore, it was selected for exploring the mechanisms of fire danger changes for the selected islands, as it has been proven to perform adequately for several locations, including the Mediterranean basin [42,43,44,45,46,47]. The meteorological inputs into the FWI system are daily noon values of air temperature, relative humidity, wind speed, and 24 h accumulated precipitation.
To calculate the FWI, we employed 3-hourly climatic data of air temperature, relative humidity, wind speed, and daily precipitation of three RCM/GCM couples at a horizontal resolution of 0.11 degrees (~12.5 km), developed within the European branch of the Coordinating Regional Climate Downscaling Experiment (CORDEX) initiative. These pairs constitute the Rossby Centre Regional Climate Model (RCM) RCA4 [48] driven by three different global climate models (GCMs): (i) the Hadley Centre Global Environmental Model version 2 Earth System called HadGEM2-ES [49] of the Met Office Hadley Centre (MOHC), (ii) the Max Planck Institute for Meteorology Model MPI-ESM-LR [50], and (iii) the Irish Centre for High-End Computing (ICHEC) EC-EARTH Model [51].
The index was calculated for the fire season (1 May–31 October) over the study islands for all models, scenarios, and periods. Present-day simulations covered the period 1986–2005 and were used to compare future projections for the near (2046–2065) and distant (2081–2100) future periods. Future projections are based on two representative concentration pathways (RCPs), namely, the stringent mitigation RCP2.6 scenario and the very high GHG emissions RCP8.5 scenario.
The calculations were performed for each of the selected GCM/RCM pairs. Their ensemble mean was then calculated and provided for the reference period and the two future periods under the two RCPs for the RCM grid cells that correspond to the Mediterranean islands participating in the SOCLIMPACT project (the Balearic Islands, Corse, Sardinia, Sicily, Malta, Crete, and Cyprus).

2.2.2. Exposure and Vulnerability Indicators

Exposure and vulnerability components included indicators representing the exposed assets, their sensitivity, and adaptive capacity. Overall, the methodology to sort the indicators followed the types of categories or dimensions [52] described in the following paragraph, as also suggested by the Italian National Plan for Adaptation to Climate Change [26] and by the Life Master Adapt Project [37].
The exposure analysis was performed to measure the presence of people, livelihoods, and ecosystems that could be adversely affected by climate change. Exposure was then evaluated by indicators representing two main categories: “natural” and “human capital”. The first category refers to natural factors through the Pcrops, PFrs, and PFrsPA indicators (Table 1). The percentage of cultivated and forest area over the total island area was derived, for all islands, from the Corine Land Cover 2018 of the Copernicus Land Monitoring Service [53], considering the IV thematic level of classification. Forest areas correspond, thus, to the following class codes: 311, 312, 313, 321, 322, 323, 324, while the agricultural areas correspond to 211, 221, 222, 223, 224, 231, 243, 244 classes. The percentage of the island area that is forest but belongs to protected areas was derived from the World Database on Protected Areas (WDPA), the most comprehensive global database on terrestrial (and marine) protected areas [54]. The second category summarizes the population characteristics from a demographic and touristic perspective through the NtotP, N6, N65, and NTouP indicators (Table 1).
Sensitivity is determined by factors that directly affect the consequences of a hazard [25] and, thus, are linked to the predisposition to suffer specific types and magnitudes of losses [65]. Looking at the touristic sector, climate change impacts might vary according to vegetation fire proneness. In the present study, fuel flammability was used to proxy the relative ease at which the vegetation fuel ignites and burns. Different forest types have different intrinsic “basic” flammability, depending on the susceptibility to combustion of the main tree species forming the forest cover. Information on the flammability of vegetation has been processed from the CORINE Land Cover data (CLC 2018) [53] for the wooded and semi-natural areas following the approach of Corona et al. [66]. The procedure involves associating the flammability level proposed by Xanthopoulos et al. [67] to the wooded and semi-natural areas. Their work allows the assigning of a flammability index (FI) reflecting the typical fire hazard for 60 forest typologies in Europe and North Africa. The variability of the FI is therefore classified into five classes. Afterward, we derived the percentage of the area classified as “very high” and “high” flammability over the municipality’s total area.
Finally, adaptive capacity refers to “the ability of societies and communities to prepare for and respond to current and future climate impacts” [25]. Thus, it is dependent on the island response and, especially, on its capacity to mitigate specific impacts. In this sense, the concept includes several dimensions, such as “institution”, “knowledge and technology”, “infrastructure”, and “economic resources” [52], and levels, such as “sector-specific” or “regional-generic” [28]. The indicator selected (Table 2) refers mainly to the category of “institution” (FFV, NFRPla) and “economic resources” (IGDP, GDPC, OCC).
Within the “sector-specific” level, the density of firefighters and volunteers (FFV) involved in the different phases of fire management, as well as the presence or absence of fire risk plans (NrFPLA), were collected to inform on the availability of the government and institutional capacity to respond to a fire emergency [27,65]. Furthermore, the percentage of workers in the primary sector (agriculture and forestry) (OCC) was related to the consideration that the abandonment of the rural areas increases the fuel load available to burn [68,69]. Finally, the indicators PEL and GDPC, at the “regional-generic” level, refer to the level of knowledge and economic resources available in the selected islands that can facilitate access to and interpretation of information concerning risk and climate change and the system’s ability to respond to or manage an event [28,70].

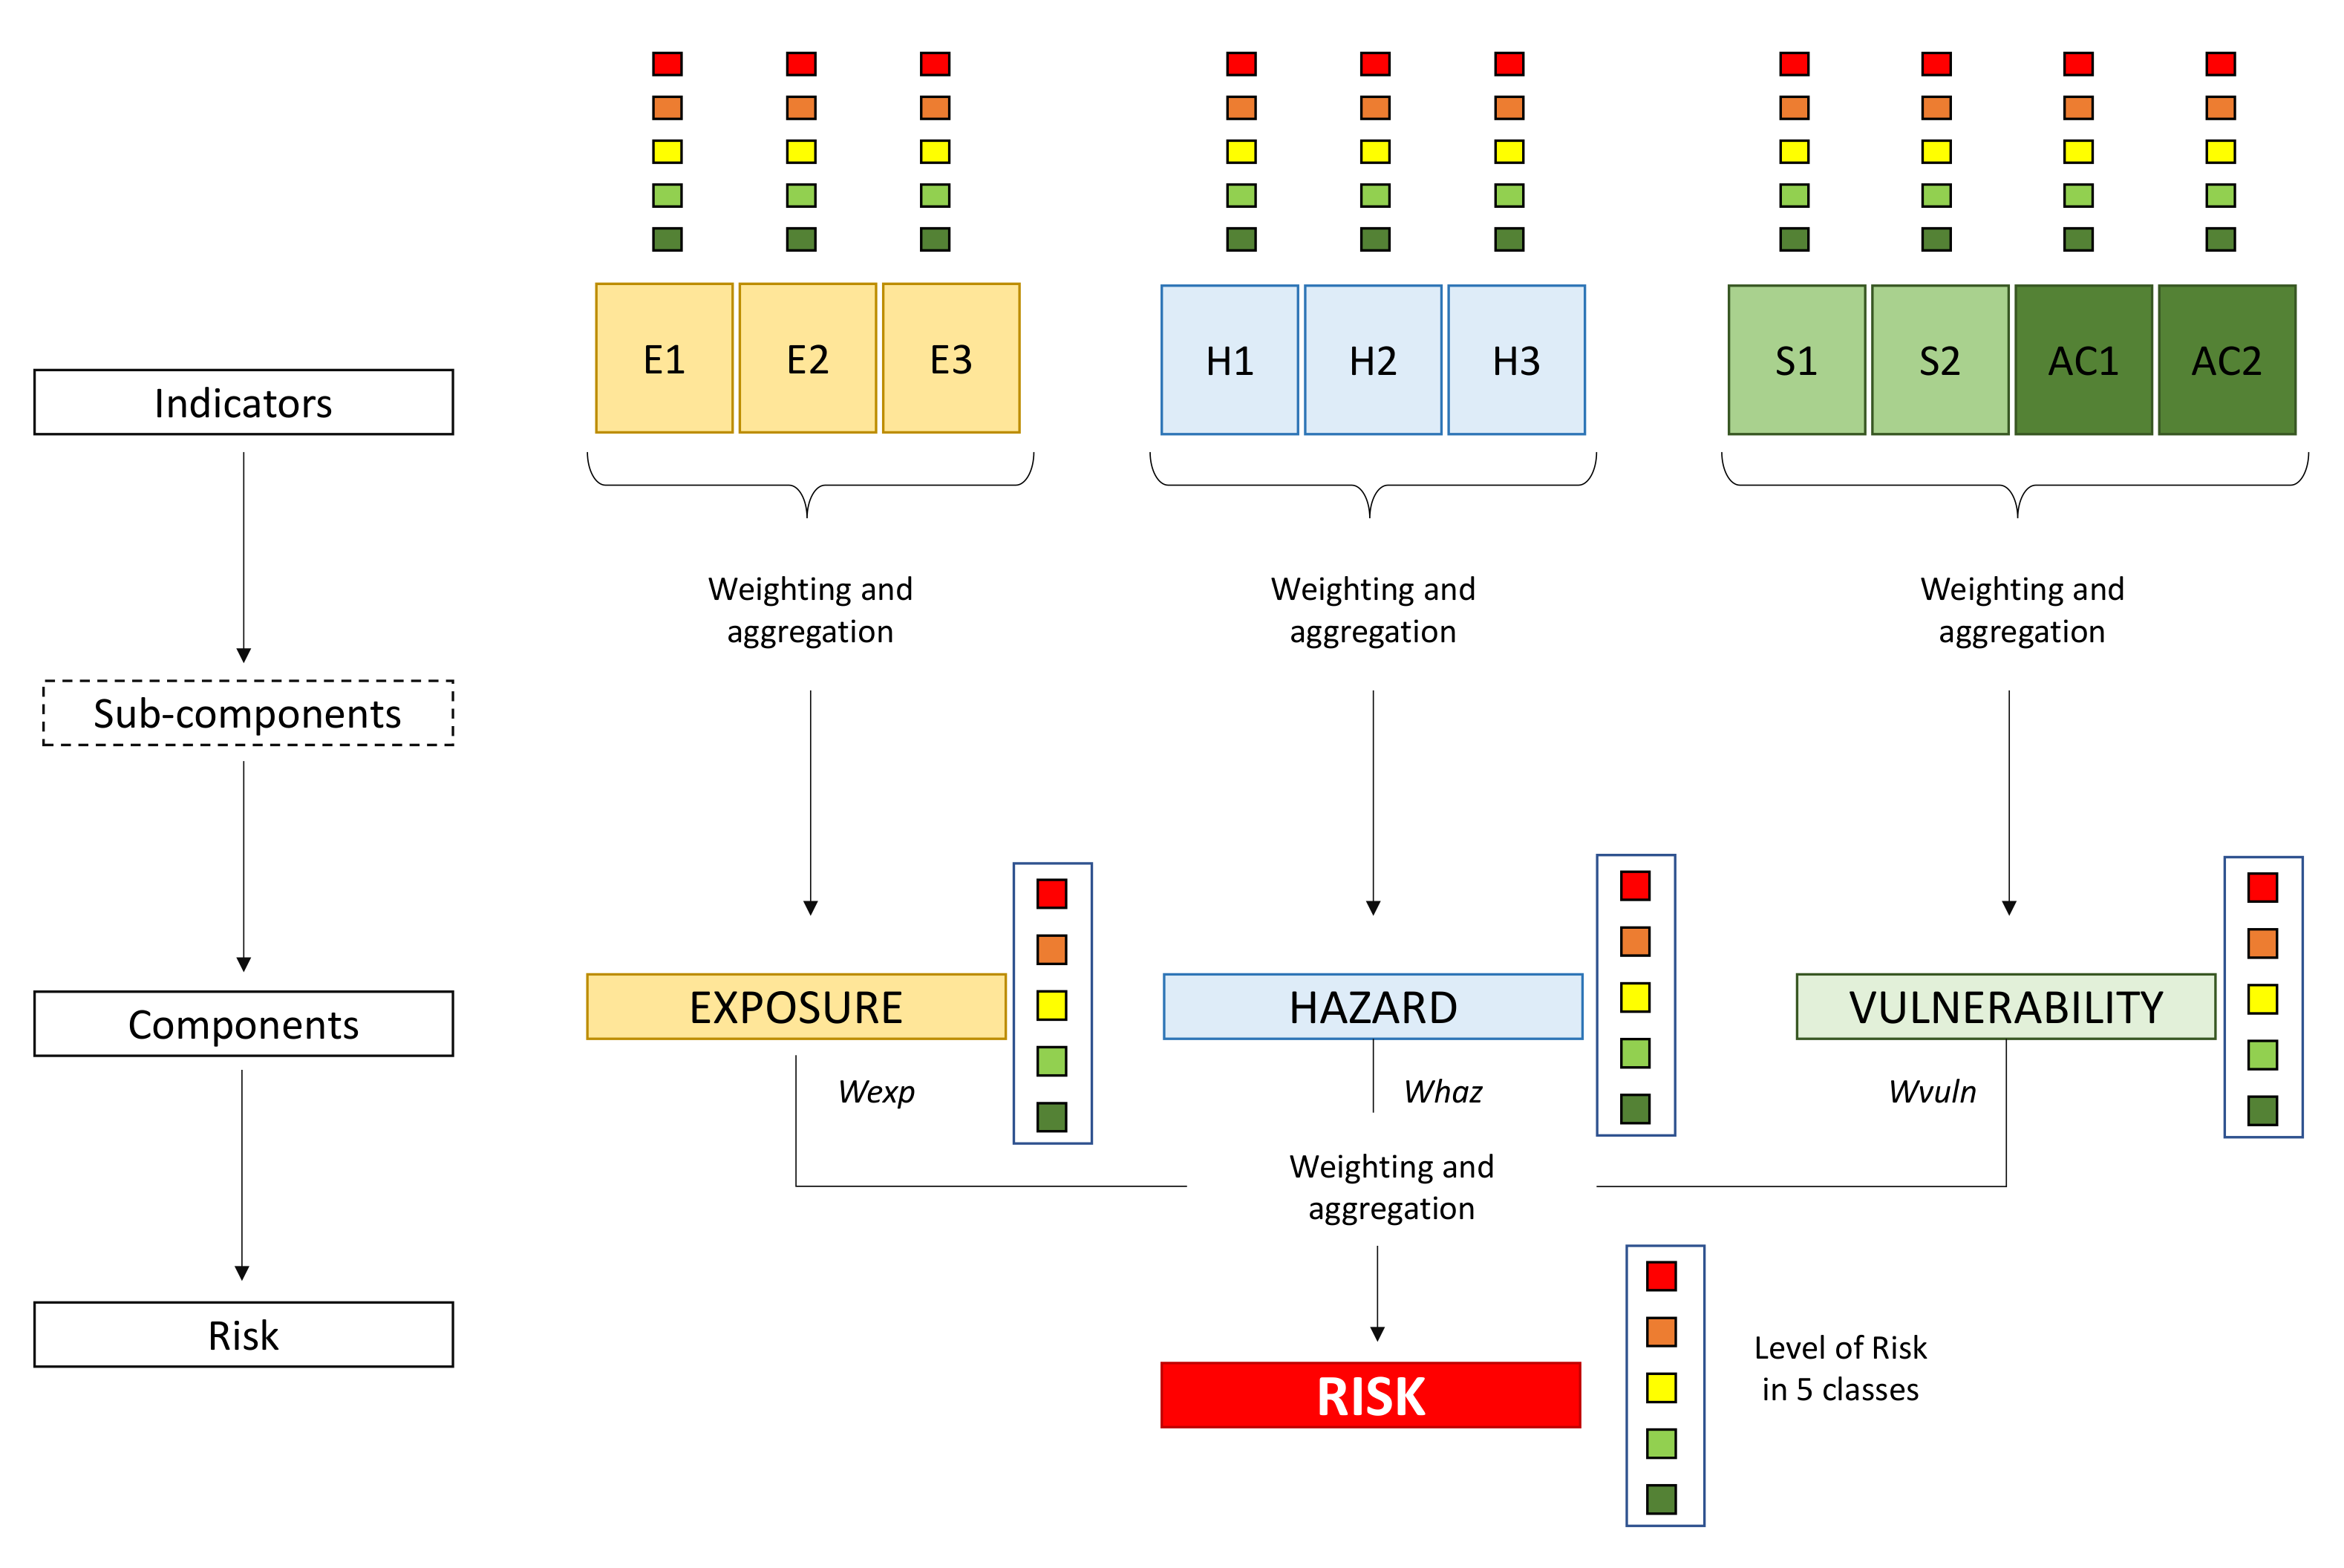
2.3. Indicator Normalization, Weighting, and Aggregation

All collected data sets are not directly intercomparable as the indicators differ (e.g., units). Thus, normalization is necessary to provide scores allowing one to perform a straightforward intercomparison among the Mediterranean islands. Numerous normalization methods are available [39]. In this study, we applied the min–max method that entails converting all the data sets into sets of unitless values with a standard scale from 0 (optimal, no improvement necessary or possible) to 1 (critical, the system no longer functioning), by subtracting the minimum value and dividing it by the range of the measured values.
x i , 1 = x i x m i n x m a x x m i n
In Formula (1), xi represents the individual data to be transformed, xmin and xmax the lowest and the highest values for that indicator, and xi,1 the normalized value within the range from 0 to 1. The value of an indicator must respect the direction of that indicator. If the vulnerability increases as the indicator value decreases, then the direction of the indicator’s value range is negative. In the case of adaptive capacity, the range of values was inverted, subtracting the value from 1. Thus, the lowest value is represented by the standardized value 1 and the highest value by the standardized value 0. This procedure is crucial for adaptive capacity values.
After normalization, weighted arithmetic aggregation was applied to calculate the composite index (I) for each sub-component, component, and final risk according to the following formulas:
I s u b c o m p o n e n t = w n x n , 1
I c o m p o n e n t = w s u b c o m p o n e n t x s u b c o m p o n e n t
R i s k = I h a z w h a z + I e x p w e x p + I v u l n w v u l n
The weight w was assigned to each indicator x according to its importance inside its sub-component. The sum of the weights of all indicators in a sub-component must be equal to 1. Then, the score of the sub-component was calculated by aggregating the scores of the indicators according to their respective weights (Equation (2)). The second step uses the same logic to calculate the score of a component by aggregating the score of all sub-components according to their assigned weights (Equation (3)). Finally, as shown in Figure 3, a weight was given to each component, and the score of risk was calculated using Equation (4). Ihaz, Iexp, and Ivuln represent the composite indexes for the components hazard, exposure, and vulnerability (composed by sensitivity and adaptive capacity). Whaz, wexp, and wvuln represent the relative weights.
A five-class evaluation scheme (Figure 3) was applied dividing the obtained values for the factor, component, and final risk as follows: 0–0.2, optimal (class 1, dark green); 0.2–0.4, rather positive (class 2, light green); 0.4–0.6, neutral (class 3, yellow); 0.6–0.8, rather negative (class 4, orange); 0.8–1, critical (class 5, red).
The weights to the indicators, the sub-components, and the components were assigned based on experts’ opinions (Table 3). Four different experts with different backgrounds (researchers, practitioners, and stakeholders, more specialized in the hazard, the exposure, or the vulnerability component) and a long-standing experience on the studied risk were interviewed and guided across a two-step weighting process.
The first step was to assign a weight to each indicator. The experts were asked to look at each indicator in a sub-component and give a qualitative class to each indicator based on its pertinence for the fire risk, choosing between five choices: very important/important/medium/limited/very limited. Secondly, the experts were asked to rank the indicators within a sub-component.
Then, the different experts’ opinions were combined. Each qualitative class was assigned a number, from 1-very limited role to 5-very important role. Subsequently, the experts’ opinions were averaged per indicator, giving each one an “importance score”. Finally, these “importance scores” were converted into weights to get a weighting value for each indicator of the sub-component, with the total sum of all weights of the indicators of a sub-component being equal to 1 (Equation (5)).
w i = I m p i i n I m p
Once the experts were familiar with the indicators within each sub-component and component, they were asked to assign a weight to each sub-component regarding the component, then to each component composing the risk. The final weight for each component was obtained by averaging the experts’ opinions.

3. Results

3.1. Comparative Analysis of FWI Projections across Islands

The multi-model ensemble projects an increasing trend of the fire danger as we move from west to east and from north to south, except for Malta, which is much smaller, and the selected grid cells are influenced mainly by maritime conditions (Table 4). The uncertainty is larger for Crete, as the meteorological conditions exhibit a distinct inhomogeneity across the island, mainly due to its elongated and mountainous morphology. Under the RCP2.6 scenario, it seems that the fire danger returns to the present conditions towards the end of the century except for Crete and Cyprus. Under RCP8.5, the increase is much more prominent, ranging from 22% to 46%, with the highest values for Corse, Sardinia, and Sicily, which implies that the western and central Mediterranean will be more affected under this scenario.
The fire danger for the Balearic Islands and Corse is among the lowest in the Mediterranean. It seems that under RCP2.6, the index slightly increases at the middle of the century, while it returns to present levels towards the end of the century. On the other hand, under RCP8.5, fire danger increases by more than 30% at the end of the century.
Sardinia exhibits very low and low normalized FWI values in the present climate and under RCP2.6 for the near and the distant future. Under RCP8.5, the index increases by 40% at the end of the century, and the risk crosses over to the medium class values. For RCP2.6, we find the highest uncertainty for the near future period, which decreases substantially at the end of the century, indicating that the projections become more robust.
Similarly, Sicily exhibits a low normalized FWI value in the present climate and under RCP2.6 for the near and the distant future. It seems that under RCP8.5, the island exhibits medium danger at mid-century, while towards the end of the century, the index crosses over to the high fire danger class. The overall increase for the island exceeds 30%.
As Malta has a small extent, the model grid cells are influenced by the sea. Under RCP2.6, the index slightly increases at the middle of the century, while it halts towards the end of the century. On the other hand, under RCP8.5, there is an increased fire danger of about 20% at the end of the century. The FWI normalized values for all areas are classified as low; thus, for all scenarios/periods, all areas belong to the same class, also exhibiting small uncertainty.
The fire danger in Crete is among the highest in the Mediterranean. For the present climate, most areas of the island pertain to the medium FWI classification. It seems that under RCP2.6, the index increases by almost 10% at the middle of the century, while this increase is halted towards the end of the century. On the other hand, under RCP8.5 the fire danger increases substantially, exceeding 30% by the end of the century. Regarding uncertainty, we find that under RCP2.6 the standard deviation slightly decreases towards the end of the century, indicating that model projections for the FWI meet for this scenario. In contrast, the opposite is found for RCP8.5, in which uncertainty is higher at the end of the century.
The fire danger for Cyprus is the highest among the Mediterranean islands. The index slightly increases by 5% under RCP2.6, then exceeds 20% by the end of the century under RCP8.5.
The spatial distribution of fire danger on sub-island level for all islands and emission scenarios are presented in Figures S1–S5 of the Supplementary Materials.

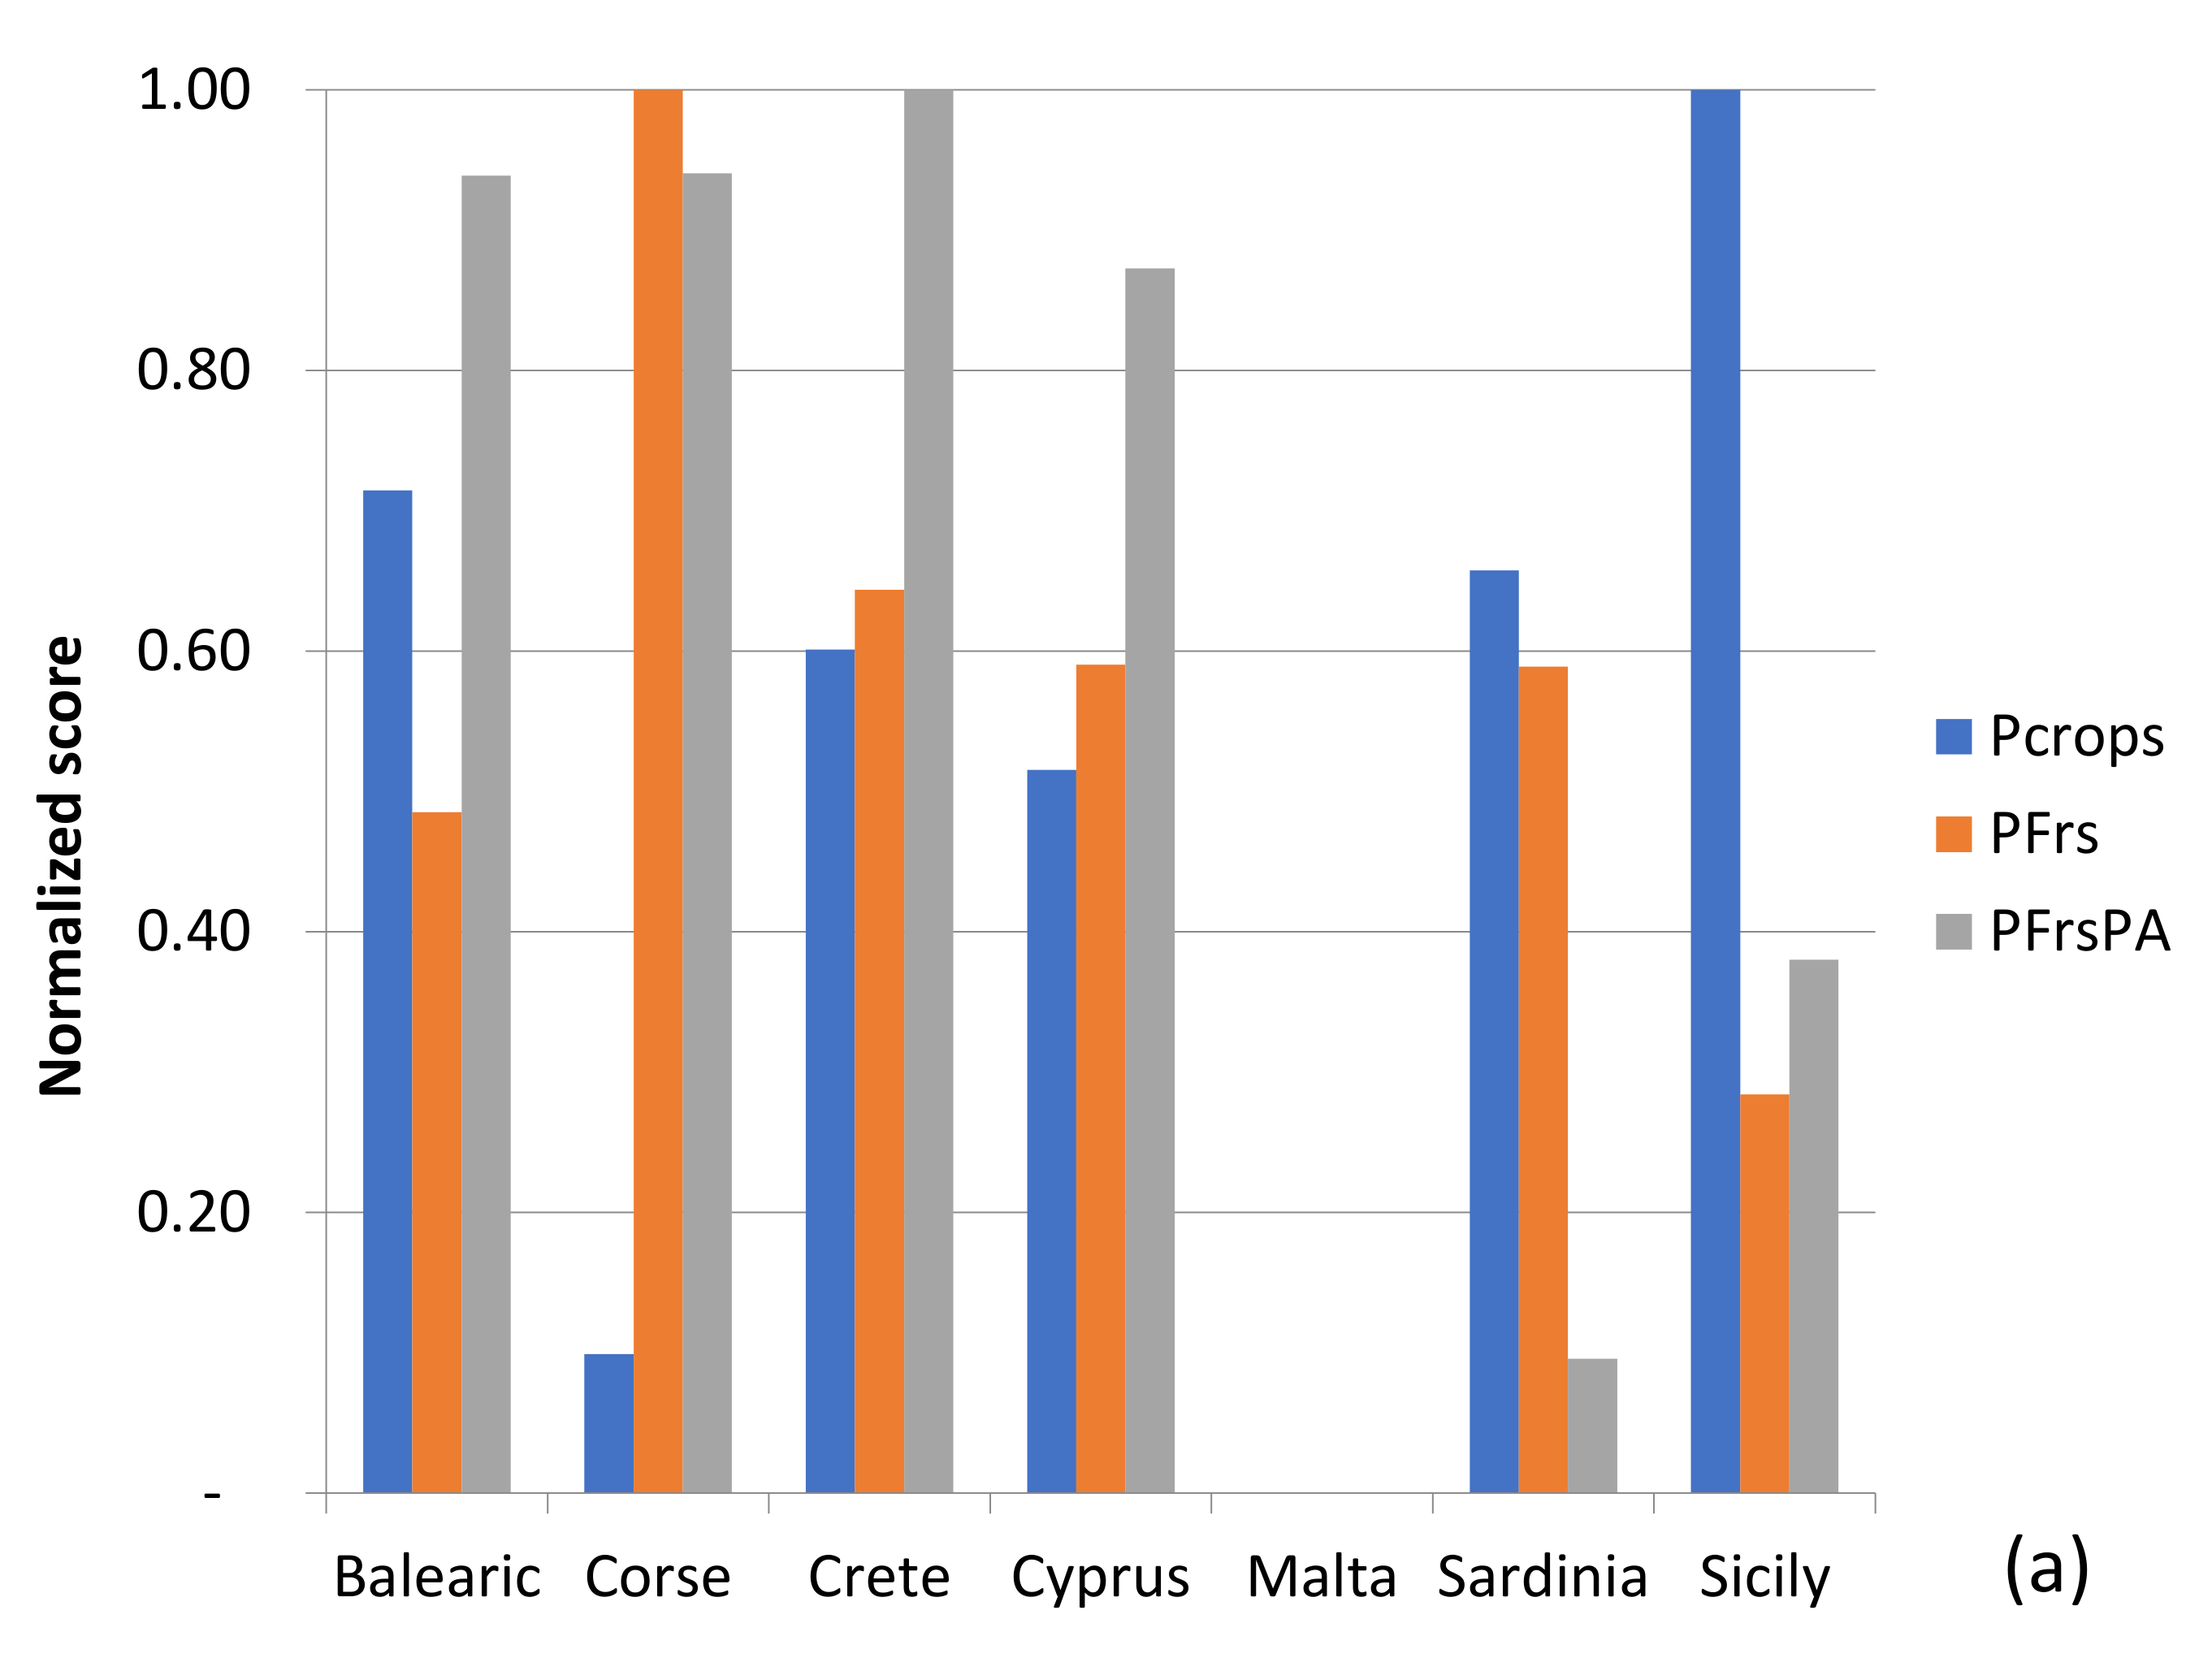
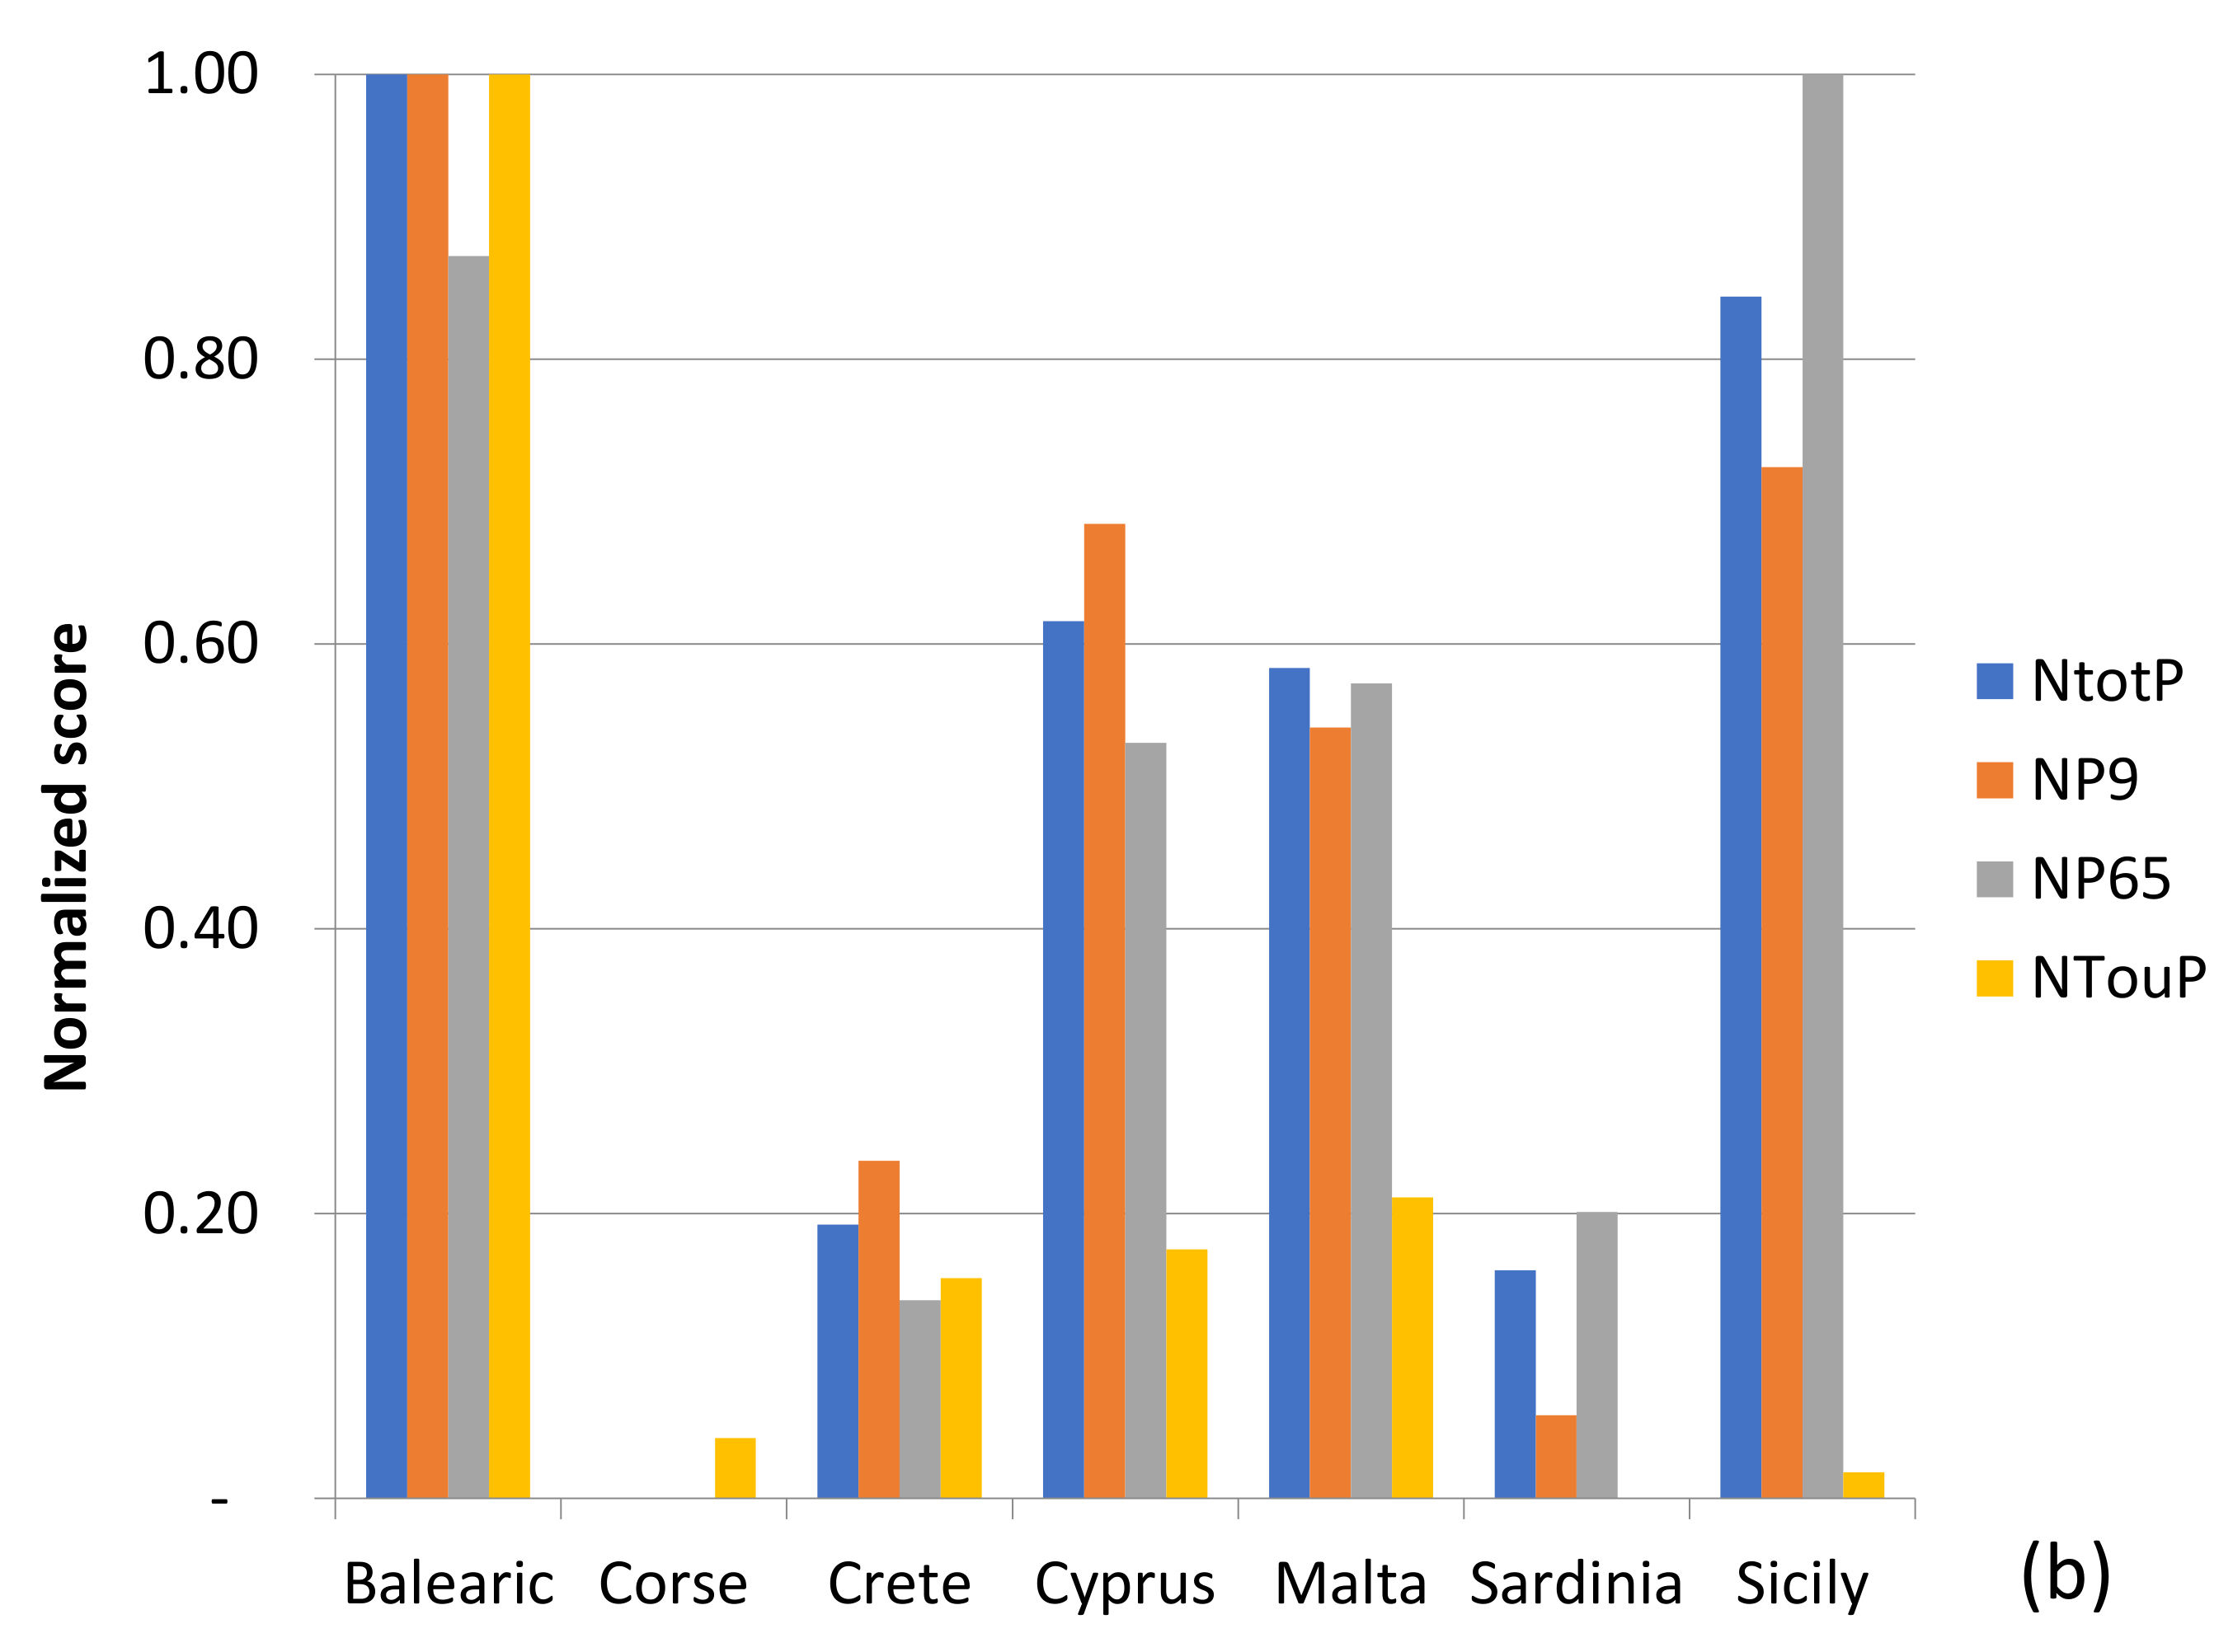
3.2. Comparative Analysis of Exposure Indicators across Islands

The “natural capital” exposed to the fire risk varies across EU Islands (Figure 4). Corse has the highest score for the indicator PFrs due to the highest percentage of forest areas over the total island surface (81%), followed by Crete (respectively classified in class 5, corresponding to critical condition, and in class 4, indicating rather negative condition). On the other hand, Sicily, Sardinia, and the Balearic Islands show a higher proportion of cultivated areas. Concerning indicator PFrsPA, a significant and similar portion of forest area within protected areas is shared by Crete (54%), the Balearic Islands and Corse (51%), and Cyprus (49%), thus classified in class 5. On the opposite side, only 14% of Malta’s forest area is protected.
As far as “human capital” is concerned (Figure 3), the Balearic Islands are characterized by a high population density (224 people per km2), followed by Sicily (195 people per km2), Cyprus (153 people per km2), and Malta (147 people per km2). With 39 people per km2, Corse is the least densely populated island considered in this study (class 1, optimal exposure level). Corse, Sardinia, and Sicily are characterized by having about 20% of their populations be an elderly population, while the other islands show lower percentages. However, after normalization, Sicily and the Balearic Islands exhibit higher scores, followed by Cyprus and Malta in class 3, indicating a neutral condition. Furthermore, all islands, except Sardinia and Sicily, are characterized by a very young population of about 10% over the total population. However, the normalized indicators for the Balearic Islands, Cyprus, and Sicily are in the higher classes, highlighting a critical condition. The number of tourists visiting the islands ranges from 2.3 to 5.2 million, except for the Balearics, where arrivals reached 16.5 million in 2018.

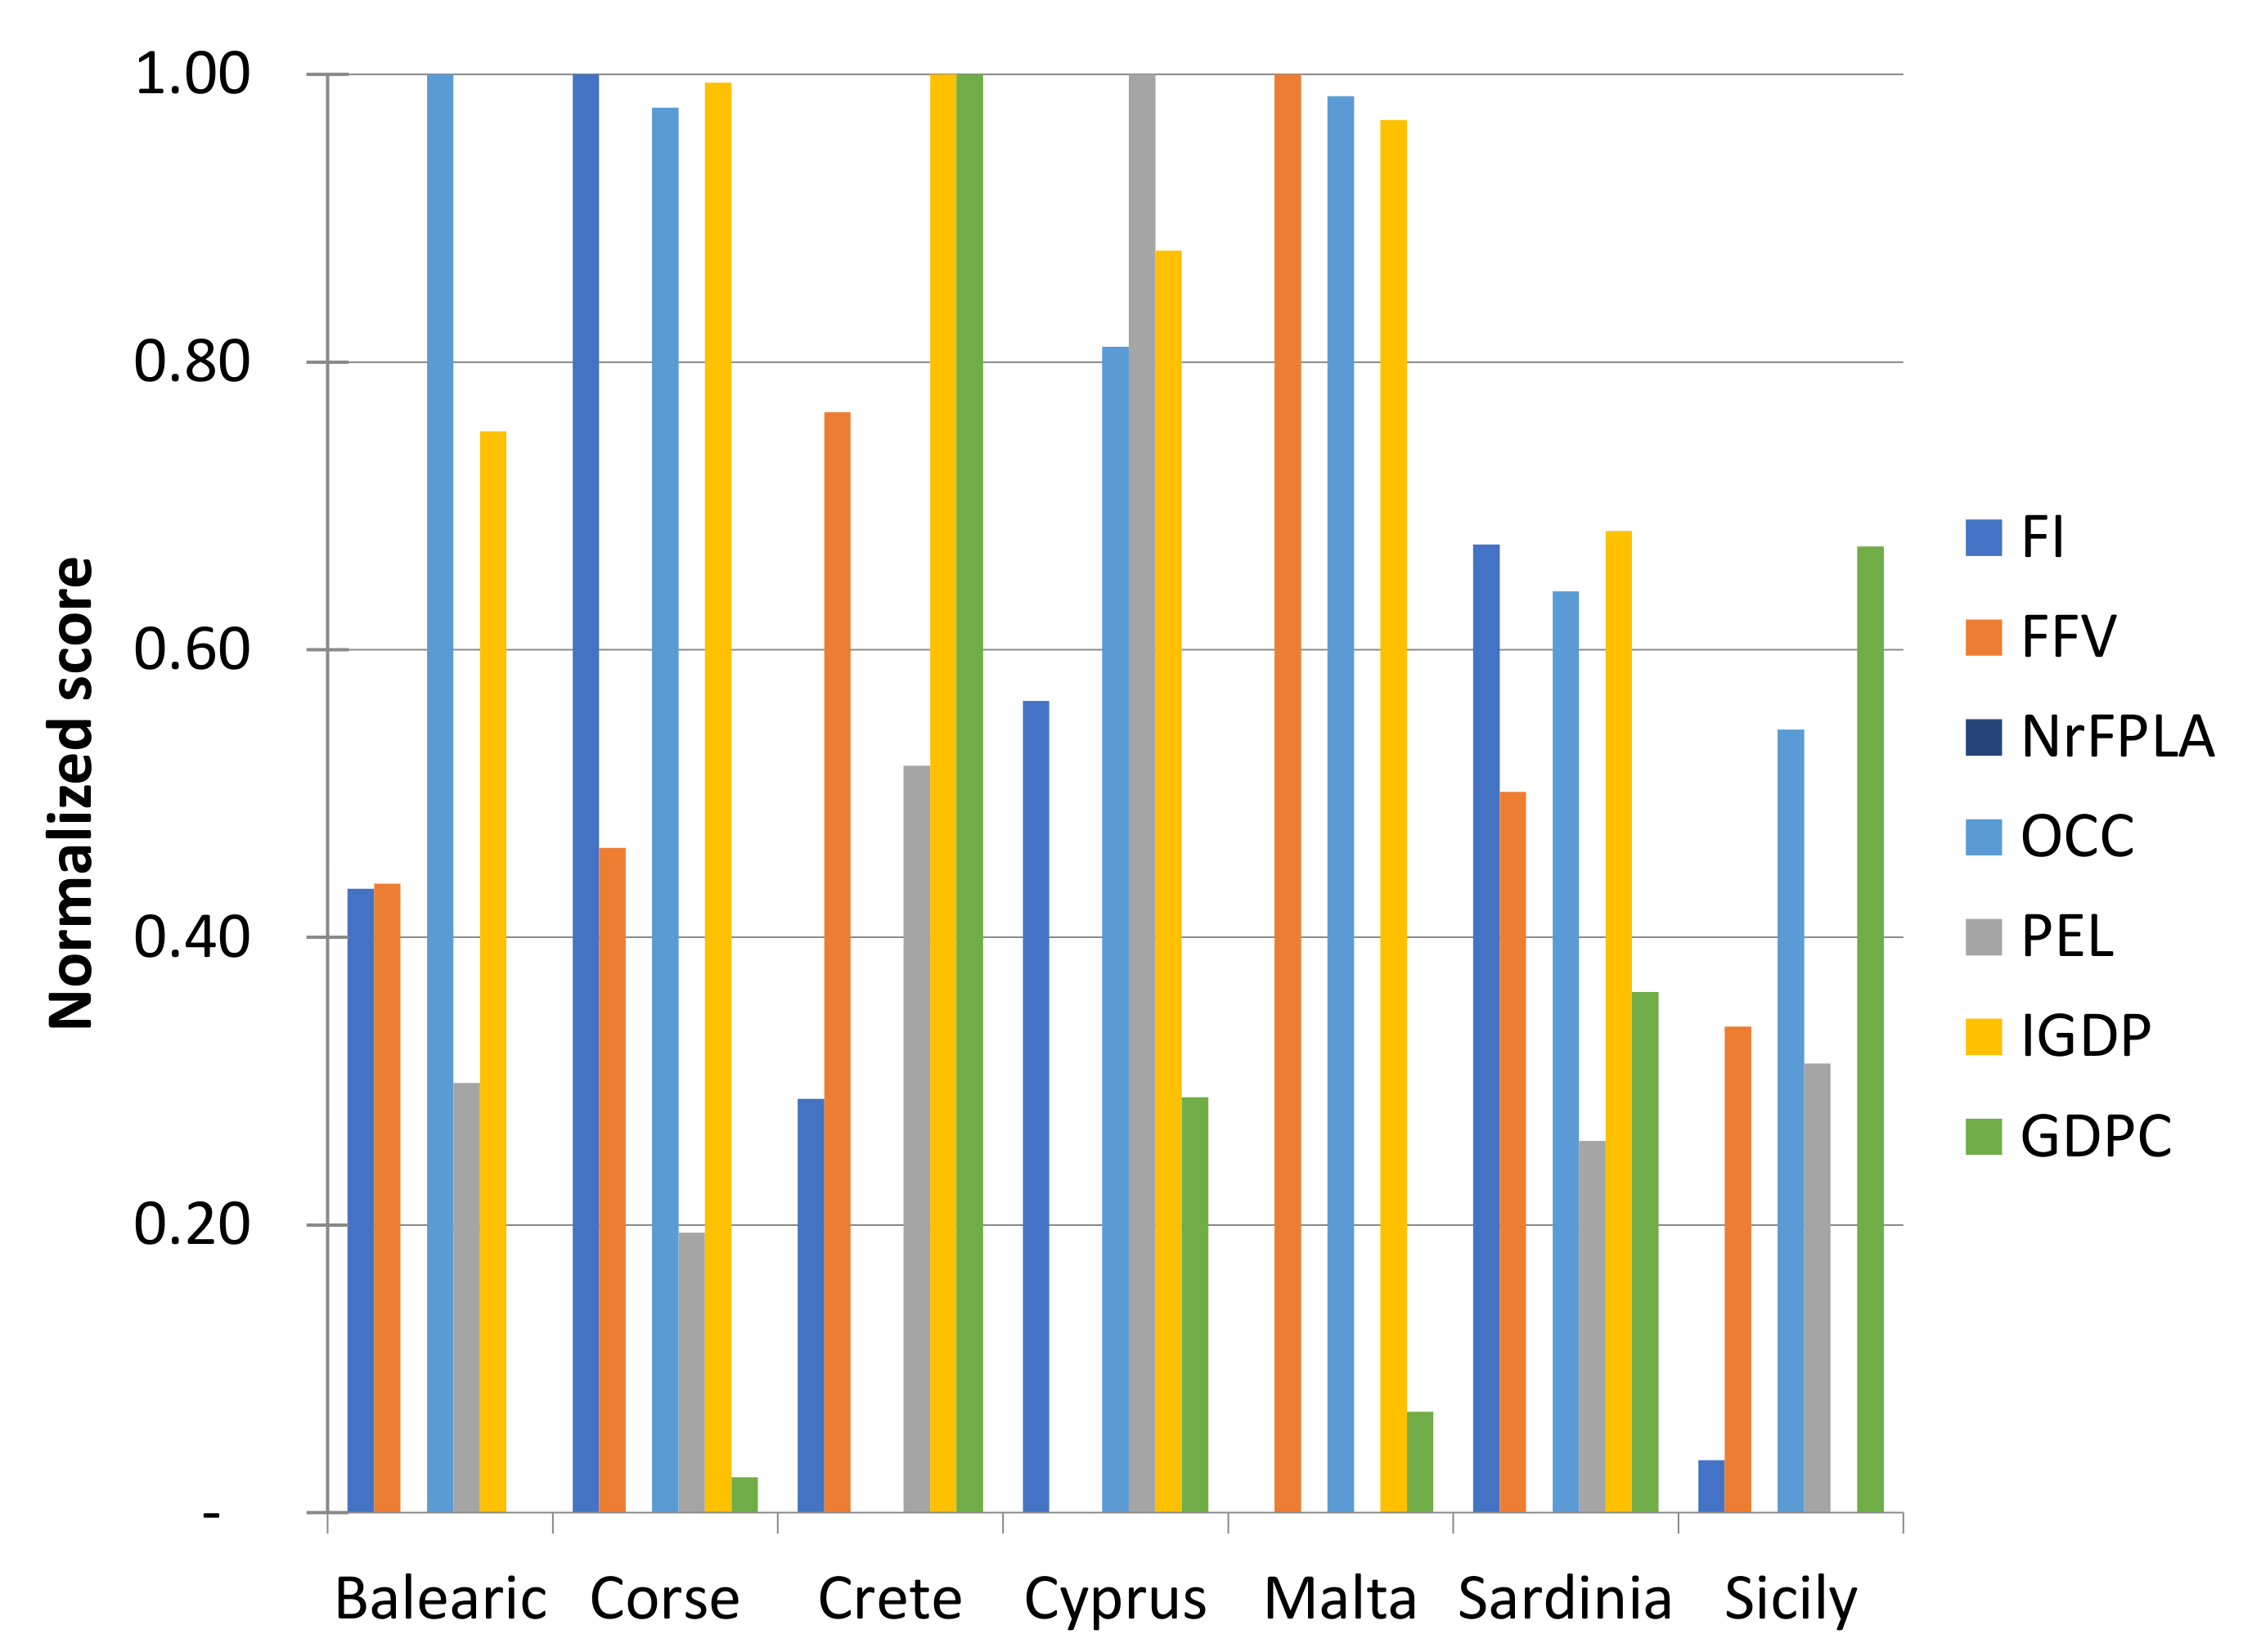
3.3. Comparative Analysis of Vulnerability Indicators across Islands

The results show a significant disparity across the EU islands regarding vulnerability, consisting of sensitivity and adaptive capacity sub-components. Concerning sensitivity, Corse, with an average of 59% of its territory under the “very high” and “high” flammability classes, has the highest sensitivity score (class 5) followed by Sardinia and Cyprus (class 4 and class 3, respectively) (Figure 5).
As noted in Section 2.2.2, the sign of the normalized values of all indicators was reversed so as to express the system’s adaptive capacity. This means that low results in terms of adaptive capacity have higher normalized values. Looking at the adaptive capacity sub-component, the influence factors are quite different among the islands despite the relatively homogeneous scores. Within the “sector-specific” level, two islands, i.e., Crete and Malta, show a rather negative and critical capacity class for the FFV indicator. In contrast, Cyprus shows an optimal adaptive capacity compared to the other islands concerning fire risk management. Overall, employees in the primary sector (OCC) show a generally high score (above 0.6), thus a critical condition, except for Crete and Sicily.
Within the “regional-generic” level, Corse and Malta are characterized by the lowest scores in education level (below 0.2), while Cyprus shows the highest criticalities. The GDPC score is classified as critical for Crete and rather negative for Sicily, while it is optimal for the Balearic Islands and Corse. Considering IGDP, Sicily is classified in class 1, Sardinia and Balearic in class 4, and all the other islands in class 5.

3.4. Expert Interviews
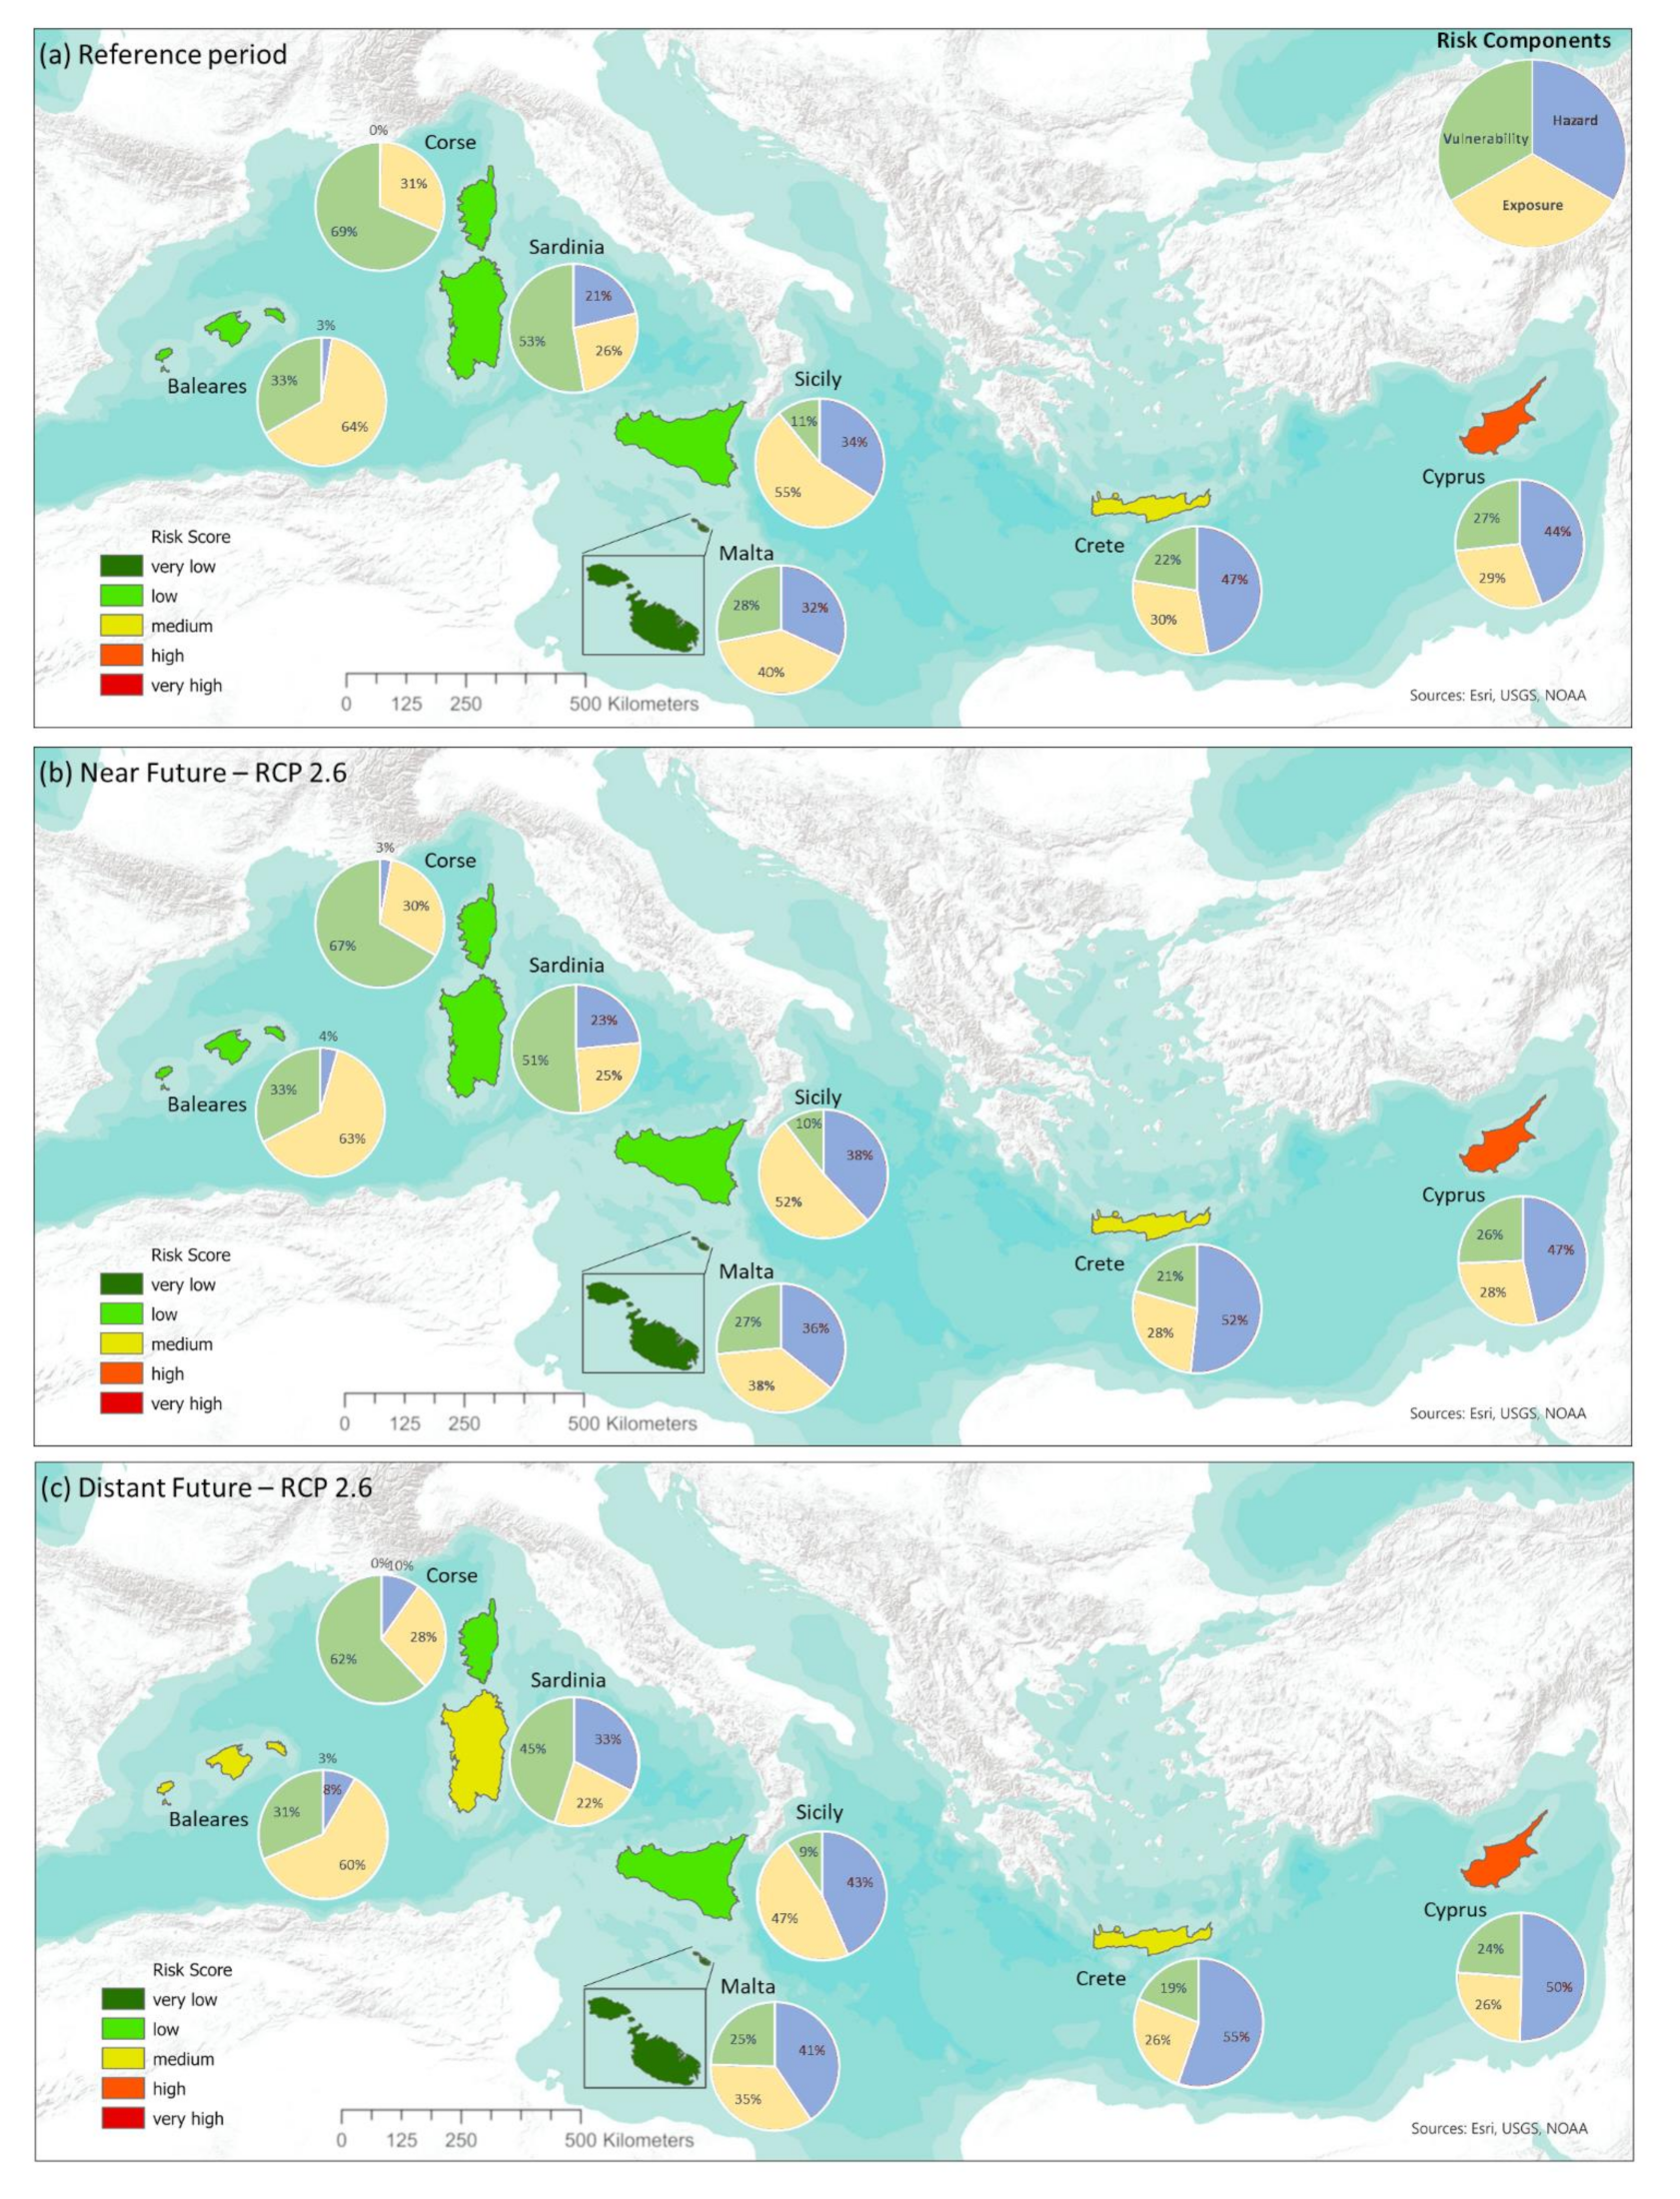
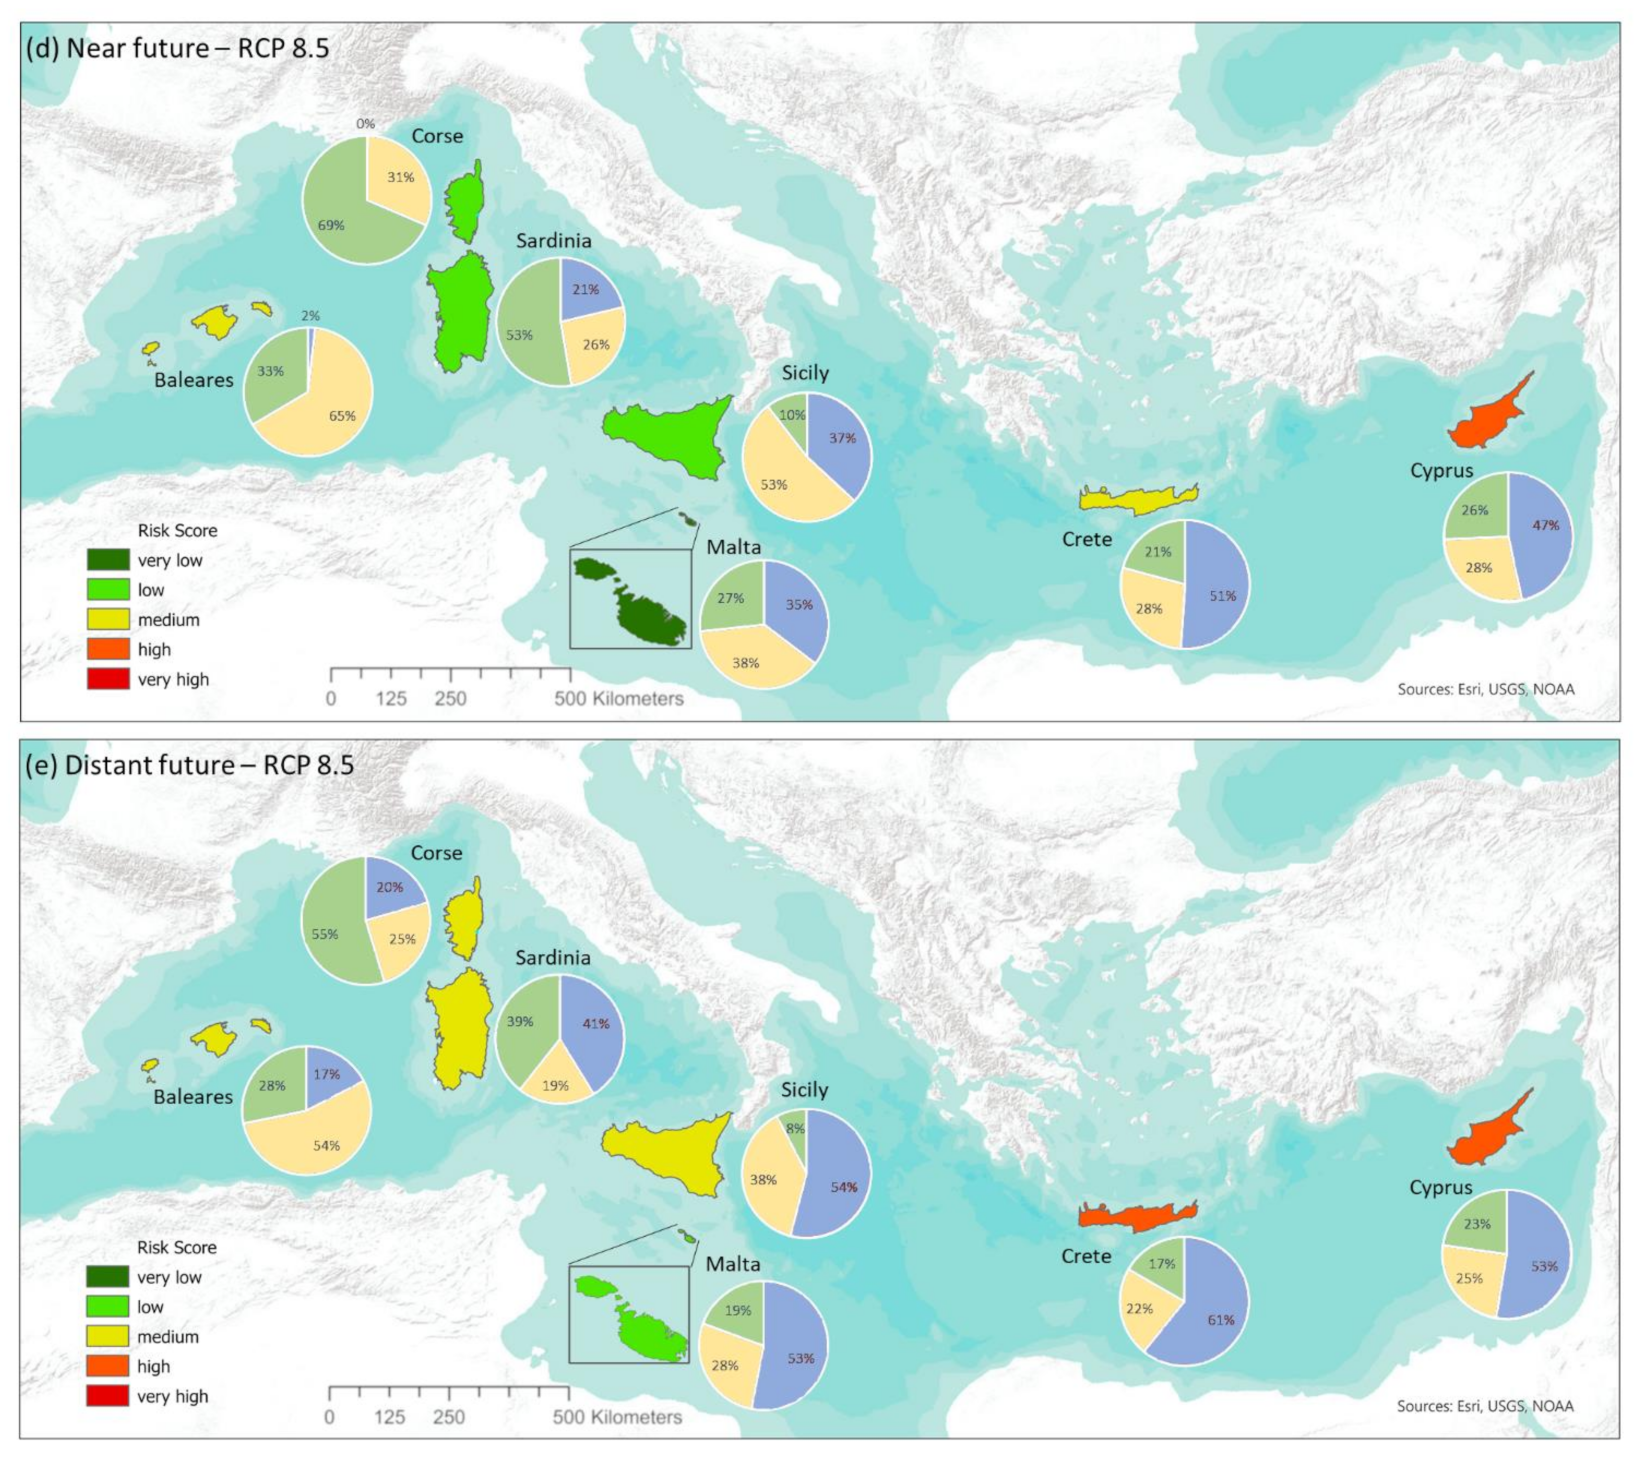
The outcomes of the four expert interviews validated the developed impact chain and the selected indicators and provided indicators’ weights based on expert knowledge. All interviewed experts considered that there was no major factor missing in the assemblage of the selected indicators.
According to the experts, forest areas represent the most crucial exposure indicator, mainly when bush and scrubland covers are not managed, thus becoming the most sensitive coverage types. The experts identified the number of tourists as the most sensitive part of the population because they are often ill-equipped in exposed infrastructures. Furthermore, specific protection measures and awareness campaigns must be conceived to this target. The cultivated area is also an important parameter as it represents surfaces with reduced biomass less likely to burn. The indicators PFrsPA, NtotP, NP9, and NP65, were the most debated. All experts agreed that the losses in case of fire would be higher for the protected forested areas. However, the fire occurrence and impacts depend on landscape management and population risk awareness. The last two indicators represent the most sensitive part of the population: the children under 9 years old and the elderly. These indicators are important because children are more susceptible to smoke inhalation, and the elderly often have mobility issues. However, according to the experts’ knowledge, these indicators should not be as critical as we might think because children are never alone and because the sensitive population is the most targeted by protection programs.
To conclude for the component exposure, most experts agreed that the sub-component “natural capital” is linked to the nature of the vegetation cover and their protection status weights more than the human features contained in the sub-component “human capital”.
As far as vulnerability is concerned, the experts agreed in considering the flammability index, representing the sensitivity sub-component, to be the most important indicator. Among the adaptive capacity sub-components, the PEL was deemed the least relevant since a higher degree is not always linked to a better knowledge of the risks and a more adapted behavior. Concerning the indicators FFV, the experts suggested that local communities often hire volunteers to help during evacuation: therefore, they do not have any specific training. For this reason, they are less adaptable and have a more limited impact on adaptive capacity. All experts rated the indicator NrFPLA as of absolute importance to prevent forest fires, even if the existence of a plan is not adequate to assess its level of implementation. While the GDP-related indicators were considered too general, the OCC indicator seemed more critical because people working in the primary sector could have more risk experience. Their activity is linked to a reduction of the forested surfaces. However, that population is also often responsible for a fire outbreak.
To conclude, for the component vulnerability, most experts agreed that the sub-component sensitivity linked to the nature and the state of the vegetation weights more than the sub-component adaptive capacity. The importance of human actions is limited; however, this is the part upon which society can act on improving.

3.5. Risk Results

Based on the current and future model simulations and the proposed methodology, we generated maps of the overall forest fire risk of the islands for the reference period (1986–2005) and the two projections for the near (2046–2065) and distant (2081–2100) future periods, and for the two RCPs. Each map shows the risk value and the contribution percentage of each risk component, represented by exposure, vulnerability (sensitivity and adaptive capacity), and hazard (Figure 6). The risk is indicated by the color on the island (from green to red), while the contribution of each risk component to the final risk value is designated with the pie diagram located next to each island. It was found that the overall risk score is higher for the eastern Mediterranean islands (Cyprus and Crete) and lower for the other islands for the reference period. This result is strongly influenced by the moderate values of the exposure and vulnerability components. Looking at the percentage breakdown of the risk, we can observe that Crete and Cyprus show a predominance of the hazard component (above 45% of the total score). The Balearic Islands and Sicily, on the other hand, share a predominance of the exposure component (above 55% of the total score). The vulnerability values are lowest in Sicily and Crete, while they are highest in Corse and Sardinia. Only Malta has a pretty balanced distribution across the components.
The risk shifts across time periods and RCP scenarios are not appreciable; therefore, the risk classes do not change substantially, except for the distant future under RCP8.5. The risk remains nearly stable with the RCP2.6 in the distant future for all islands, despite slightly increasing (especially in Sardinia and the Balearic Islands). Under the RCP8.5, Sardinia, Sicily, and Crete move to a higher risk class due to the overall increase of the FWI values. Overall, in the distant future almost all islands will be above medium risk according to RCP8.5, with higher risk for the eastern Mediterranean islands.

4. Discussion and Conclusions

In this study, the outcome of the impact chain (IC) approach conducted for seven Mediterranean islands, aiming at climate change risk and vulnerability assessment, is provided. To our knowledge, this is one of the first attempts to quantify the levels of fire risk and to inform decision-makers on the potential risks and opportunities posed by climate change for several islands across the Mediterranean.
The IC development and the final risk assessment are based on the three risk components, climate hazard, exposure, and vulnerability, and allow for a comparative analysis among the islands. The proposed approach represents a key tool within the framework of an adaptation policy cycle to support and aid decisions for policymakers in the context of the EU blue economy. Indeed, the approach is circular and iterative, and this is particularly important for adaptation, characterized by continuous learning and improvement. The results indicate the main environmental and socio-economic elements affected by vulnerability conditions across the islands, shedding light on the gaps that need to be addressed in mitigation and adaptation policy and measures. Moreover, the results underpin the areas with high potential improvement for enhancing their adaptive capacity towards forging climate-resilient societies under the EU Strategy on Adaptation to Climate Change released at the beginning of 2021.
It must be noted that the IC represents a simplified approach if compared to modelling risk methodologies. Indeed, the modelling approach, considering feedback, synergies, and interactions among risk elements, requires high skills and computational efforts to capture the complexity and dynamics of forest fire phenomena in the environment and society, especially in the climate change context. On the other hand, the IC approach proposed in the current study aims to reduce the complexity, simplify and save time and economic resources necessary for risk assessment. Thus, they could be easily understood and applied by non-modelling experts, such as regional and local administrators, engaged in institutional paths to adapt their territories to climate change. Despite the simplicity of the approach, it anchors and integrates decisions based on the latest scientific advancements and expertise on the cause–effect relationship of the investigated phenomena, thus enhancing the policy- and decision-makers’ understanding of the links between climate hazards and socio-economic vulnerabilities. Finally, the methodology provides a crossed perspective on the islands and the essential operating elements that support risk management, policy development, and planning of the most appropriate adaptation measures at different levels, also bringing together experts from other disciplines and ultimately contributing to the climate-resilient Europe 2050 vision.
However, some issues must be considered when applying the IC approach. The most challenging element is data availability, on which other aspects of the IC process (e.g., spatial and temporal scales) depend. This aspect is especially true for the great range of the island socio-economic factors concurring to regulate both vulnerability and adaptive capacity. The elements are very heterogeneous, related to the level of literacy and education, governance, available economic resources, and infrastructure to respond to and manage the risk. The lack of similar data at the island level, often not available at the desired spatial resolution, implies the need to reach several compromises when defining the indicators. Furthermore, the applied approach pursues the risk evaluation and the risk (and its components) evolution monitoring. Thus, it is indispensable to collect the same data in the same way in the future as well.
The availability of the appropriate data sets to calculate scenarios of future hazard development is often another limiting factor. This is especially true when it comes to exploiting the model projections outputs usually provided as daily values. At the same time, the FWI system requires higher temporal resolution variables (such as the 3-hourly data used in this study) [44]. In addition, a multi-model ensemble approach is essential, as the inter-model variability can mask the FWI sensitivity on the meteorological parameters. Furthermore, future work is required to consider the future biophysical and socio-economic conditions.
The IC approach employs several steps (such as normalization, aggregation, and weighting) that could reduce or lose details. The indicators’ weighting is particularly crucial, and different studies have proposed diverse approaches (e.g., [52,65]). In this study, we proposed a participatory approach involving stakeholders and experts through one-to-one meetings, and we developed an effective, informed, and shared process of recognizing the most relevant indicators and attribution of their individual weights. This approach ensures robustness in analyzing and reducing any conflicts due to full sharing and acceptance of both the methodology and product results.
To conclude, we consider that the proposed approach, although facing certain shortcomings, can be conveniently used to provide a common basis for dialogue between experts and policy- and decision-makers in the context of the EU blue economy. This can be used to compare territories (especially islands that are often poorly known), promote the identification of their priorities, and encourage vertical and horizontal cooperation between institutional actors at the European and national level addressing mitigation and adaptation strategies.

Supplementary Materials

The following are available online at https://0-www-mdpi-com.brum.beds.ac.uk/article/10.3390/su131810004/s1, Figure S1: Spatial distribution of the FWI model ensemble values for the reference period (1986–2005) on the sub-island level (municipality level) for the seven Mediterranean islands. The values are normalized across islands, scenarios, and periods to be intercomparable. Figure S2: As Figure S1, but for the RCP2.6 scenario for the near future (2046–2065). Figure S3: As Figure S1, but for the RCP2.6 scenario for the distant future (2081–2100). Figure S4: As Figure S1, but for the RCP8.5 scenario for the near future (2046–2065). Figure S5: As Figure S1, but for the RCP8.5 scenario for the distant future (2081–2100).

Author Contributions

Conceptualization and methodology, E.B., V.B., M.H., A.K.; data collection, E.B., V.B., A.K., M.H. and A.C.; writing—original draft preparation, V.B., M.H., A.K., E.B.; writing—review and editing, V.B., M.H., A.K., E.B., A.C., D.S., C.G. All authors have read and agreed to the published version of the manuscript.

Funding

This research was funded by the European Union’s Horizon 2020 research and innovation program under Grant Agreement No. 776661 (SOCLIMPACT project).

Institutional Review Board Statement

Not applicable.

Informed Consent Statement

Not applicable.

Data Availability Statement

Several publicly datasets were analysed in this study The EURO-CORDEX RCM models are available through the Earth System Grid Federation infrastructure (ESGF, https://esgf-data.dkrz.de/search/cordex-dkrz/) (accessed on 6 October 2020). Exposure and vulnerability indicator data can be retrieved from global (https://www.protectedplanet.net/en) (accessed on 3 December 2020), European (Regional Innovation Monitor Plus, https://ec.europa.eu/growth/tools-databases/regional-innovation-monitor/) (accessed on 1 October 2020) and national or regional databases (Instituto de Estadística de las Islas Baleares, https://ibestat.caib.es (accessed on 6 November 2020); Istituto Canario de Estadistica, http://www.gobiernodecanarias.org/istac/; Hellenic Statistical Autority, https://www.statistics.gr (accessed on 1 October 2020); Statistical Service of the Republic of Cyprus, http://www.cystat.gov.cy (accessed on 14 January 2021); National Statistics Office, https://nso.gov.mt/ (accessed on 6 October 2020); Istituto Nazionale di Statistica, https://www.istat.it (accessed on 3 December 2020); Hellenic Civil Aviation Authority, http://www.ypa.gr/en/ (accessed on 2 February 2021); Statistical Office of Sardinia Autonomous Region, http://www.sardegnastatistiche.it/ (accessed on 3 October 2020); Tourism Observatory of Sicily Region, https://osservatorioturistico.regione.sicilia.it (accessed on 3 October 2020)). Land cover and land use maps were obtained from the Copernicus Programme (https://land.copernicus.eu/pan-european/corine-land-cover/clc2018) (accessed on 6 May 2021).

Acknowledgments

We are grateful to the SOCLIMPACT Island Focal Points for their proactiveness during the participated approach, and to the experts interviewed for their willingness to share their knowledge on forest fires in the Mediterranean Basin. We would like to acknowledge four anonymous reviewers who provided useful suggestions and comments improving the manuscript. Participation of Elodie Briche to this paper was under the Ramboll premises.

Conflicts of Interest

The authors declare no conflict of interest.

References

  1. Leposa, N. Problematic blue growth: A thematic synthesis of social sustainability problems related to growth in the marine and coastal tourism. Sustain. Sci. 2020, 15, 1233–1244. [Google Scholar] [CrossRef] [Green Version]
  2. Dwyer, L. Emerging ocean industries: Implications for sustainable tourism development. Tour. Mar. Environ. 2018, 13, 25–40. [Google Scholar] [CrossRef]
  3. 2015. Available online: https://www.e-unwto.org/doi/pdf/10.18111/9789284416929 (accessed on 10 June 2021).
  4. OEDC Tourism Policy Responses to the Coronavirus (COVID-19). Available online: https://www.oecd.org/coronavirus/policy-responses/tourism-policy-responses-to-the-coronavirus-covid-19-6466aa20/ (accessed on 6 May 2021).
  5. Fosse, J.; Kosmas, I.; Gonzales, A. The future of Mediterranean tourism in a (post) covid world. Eco-Med Brief. 2021, 1. [Google Scholar] [CrossRef]
  6. Mariolis, T.; Rodousakis, N.; Soklis, G. The COVID-19 multiplier effects of tourism on the Greek economy. Tour. Econ. 2020. [Google Scholar] [CrossRef]
  7. Phillips, C.A.; Caldas, A.; Cleetus, R.; Dahl, K.A.; Declet-Barreto, J.; Licker, R.; Merner, L.D.; Ortiz-Partida, J.P.; Phelan, A.L.; Spanger-Siegfried, E.; et al. Compound climate risks in the COVID-19 pandemic. Nat. Clim. Chang. 2020, 10, 586–588. [Google Scholar] [CrossRef]
  8. Giorgi, F. Climate change hot-spots. Geophys. Res. Lett. 2006, 33, 8707. [Google Scholar] [CrossRef]
  9. Santos, F.D.; Stigter, T.Y.; Faysse, N.; Lourenço, T.C. Impacts and adaptation to climate change in the Mediterranean coastal areas: The CIRCLE-MED initiative. Reg. Environ. Chang. 2014, 14, 1–3. [Google Scholar] [CrossRef] [Green Version]
  10. MedECC. Summary for Policymakers. In Climate and Environmental Change in the Mediterranean Basin–Current Situation and Risks for the Future. First Mediterranean Assessment Report; Cramer, W., Guiot, J., Marini, K., Eds.; Union for the Mediterranean, Plan Bleu, UNEP/MAP: Marseille, France, 2020; ISBN 978-2-9577416-0-1. [Google Scholar]
  11. Lelieveld, J.; Hadjinicolaou, P.; Kostopoulou, E.; Chenoweth, J.; El Maayar, M.; Giannakopoulos, C.; Hannides, C.; Lange, M.A.; Tanarhte, M.; Tyrlis, E.; et al. Climate change and impacts in the Eastern Mediterranean and the Middle East. Clim. Change 2012, 114, 667–687. [Google Scholar] [CrossRef] [Green Version]
  12. Lionello, P.; Scarascia, L. The relation between climate change in the Mediterranean region and global warming. Reg. Environ. Chang. 2018, 18, 1481–1493. [Google Scholar] [CrossRef]
  13. Zittis, G. Observed rainfall trends and precipitation uncertainty in the vicinity of the Mediterranean, Middle East and North Africa. Theor. Appl. Climatol. 2018, 134, 1207–1230. [Google Scholar] [CrossRef]
  14. Cherif, S.; Doblas-Miranda, E.; Lionello, P.; Borrego, C.; Giorgi, F.; Iglesias, A.; Jebari, S.; Mahmoudi, E.; Moriondo, M.; Pringault, O.; et al. Drivers of change. In Climate and Environmental Change in the Mediterranean Basin–Current Situation and Risks for the Future. First Mediterranean Assessment Report; Cramer, W., Guiot, J., Marini, K., Eds.; Union for the Mediterranean, Plan Bleu, UNEP/MAP: Marseille, France, 2020; pp. 59–180. ISBN 978-2-9577416-0-1. [Google Scholar]
  15. Amatulli, G.; Camia, A.; San-Miguel-Ayanz, J. Estimating future burned areas under changing climate in the EU-Mediterranean countries. Sci. Total Environ. 2013, 450–451, 209–222. [Google Scholar] [CrossRef] [PubMed]
  16. Migliavacca, M.; Dosio, A.; Camia, A.; Hobourg, R.; Houston-Durrant, T.; Kaiser, J.W.; Khabarov, N.; Krasovskii, A.A.; Marcolla, B.; San Miguel-Ayanz, J.; et al. Modeling biomass burning and related carbon emissions during the 21st century in Europe. J. Geophys. Res. Biogeosci. 2013, 118, 1732–1747. [Google Scholar] [CrossRef] [Green Version]
  17. Turco, M.; Rosa-Cánovas, J.J.; Bedia, J.; Jerez, S.; Montávez, J.P.; Llasat, M.C.; Provenzale, A. Exacerbated fires in Mediterranean Europe due to anthropogenic warming projected with non-stationary climate-fire models. Nat. Commun. 2018, 9, 3821. [Google Scholar] [CrossRef] [PubMed]
  18. Costanza, R.; D’Arge, R.; De Groot, R.; Farber, S.; Grasso, M.; Hannon, B.; Limburg, K.; Naeem, S.; O’Neill, R.V.; Paruelo, J.; et al. The value of the world’s ecosystem services and natural capital. Nature 1997, 387, 253–260. [Google Scholar] [CrossRef]
  19. Sánchez, J.J.; Baerenklau, K.; González-Cabán, A. Valuing hypothetical wildfire impacts with a Kuhn–Tucker model of recreation demand. For. Policy Econ. 2016, 71, 63–70. [Google Scholar] [CrossRef] [Green Version]
  20. Arabadzhyan, A.; Figini, P.; García, C.; González, M.M.; Lam-González, Y.E.; León, C.J. Climate change, coastal tourism, and impact chains-a literature review. Curr. Issues Tour. 2020, 24, 2233–2268. [Google Scholar] [CrossRef]
  21. Otrachshenko, V.; Nunes, L.C. Fire takes no vacation: Impact of fires on tourism. Environ. Dev. Econ. 2021, 1–16. [Google Scholar] [CrossRef]
  22. Hystad, P.W.; Keller, P.C. Towards a destination tourism disaster management framework: Long-term lessons from a forest fire disaster. Tour. Manag. 2008, 29, 151–162. [Google Scholar] [CrossRef]
  23. Sfetsos, A.; Giroud, F.; Clemencau, A.; Varela, V.; Freissinet, C.; Lecroart, J.; Vlachogiannis, D.; Politi, N.; Karozis, S.; Gkotsis, I.; et al. Assessing the effects of forest fires on interconnected critical infrastructures under climate change. Evidence from South France. Infrastructures 2021, 6, 16. [Google Scholar] [CrossRef]
  24. Boustras, G.; Boukas, N. Forest fires’ impact on tourism development: A comparative study of Greece and Cyprus. Manag. Environ. Qual. An Int. J. 2013, 24, 498–511. [Google Scholar] [CrossRef]
  25. GIZ; EURAC. Risk Supplement to the Vulnerability Sourcebook. In Guidance on How to Apply the Vulnerability Sourcebook’s Approach with the New IPCC AR5 Concept of Climate Risk; GIZ: Bonn, Germany, 2017. [Google Scholar]
  26. MITE Piano Nazionale di Adattamento ai Cambiamenti Climatici. Available online: https://www.minambiente.it/pagina/piano-nazionale-di-adattamento-ai-cambiamenti-climatici (accessed on 5 May 2020).
  27. SRACC Metodi e Strumenti per la Strategia Regionale di Adattamento ai Cambiamenti Climatici-Allegato 1. Available online: https://delibere.regione.sardegna.it/protected/45525/0/def/ref/DBR45368/ (accessed on 2 November 2020).
  28. Schneiderbauer, S.; Pedoth, L.; Zhang, D.; Zebisch, M. Assessing adaptive capacity within regional climate change vulnerability studies-an Alpine example. Nat. Hazards 2013, 67, 1059–1073. [Google Scholar] [CrossRef]
  29. EC. Forging a Climate-Resilient Europe—The New EU Strategy on Adaptation to Climate Change; European Commission: Brussels, Belgium, 2021. [Google Scholar]
  30. IPCC. Climate Change 2014 Impacts, Adaptation, and Vulnerability Part A: Global and Sectoral Aspects Working Group II Contribution to the Fifth Assessment Report of the Intergovernmental Panel on Climate Change; Field, C.B., Barros, V.R., Dokken, D.J., Mach, K.J., Mastrandrea, M.D., Bilir, T.E., Chatterjee, M., Yuka, K.L.E., Estrada, O., Genova, R.C., et al., Eds.; Cambridge University Press: Cambridge, UK; New York, NY, USA, 2014. [Google Scholar]
  31. SOCLIMPACT Project, DownScaling CLImate Impacts and Decarbonisation Pathways in EU Islands, and Enhancing Socioeconomic and Non-Market Evaluation of Climate Change for Europe, for 2050 and Beyond. Available online: https://soclimpact.net/ (accessed on 25 May 2021).
  32. EURO-CORDEX—Coordinated Downscaling Experiment—European Domain. Available online: https://www.euro-cordex.net/ (accessed on 3 September 2021).
  33. Fritzsche, K.; Schneiderbauer, S.; Bublek, P.; Kienberger, S.; Buth, M.; Zebisch, M.; Kahòenborn, W. The Vulnerability Sourcebook: Concept and Guidelines for Standardised Vulnerability Assessments. Available online: https://www.researchgate.net/publication/281430219_The_Vulnerability_Sourcebook_Concept_and_guidelines_for_standardised_vulnerability_assessments/citation/download (accessed on 21 April 2021).
  34. Schneiderbauer, S.; Baunach, D.; Pedoth, L.; Renner, K.; Fritzsche, K.; Bollin, C.; Pregnolato, M.; Zebisch, M.; Liersch, S.; Rivas López del R., M.; et al. Spatial-Explicit Climate Change Vulnerability Assessments Based on Impact Chains. Findings from a Case Study in Burundi. Sustainability 2020, 12, 6354. [Google Scholar] [CrossRef]
  35. Kienberger, S.; Borderon, M.; Bollin, C.; Jell, B. Climate change vulnerability assessment in Mauritania: Reflections on data quality, spatial scales, aggregation and visualizations. GI_Forum 2016, 4, 167–175. [Google Scholar] [CrossRef] [Green Version]
  36. Viezzer, J.; Egler, M.; Fluminhan Filho, M.; Vieira, M.W.; Becher, M.; Betti, P.; Campos, L.B.; Deitenbach, A.; Hach, L.; Stumbo Filho, L.M. Climate Change Vulnerability Analysis at the Local Level: Lessons Learnt from Brazil on How to Conduct Participative Processes. In Climate Change Management; Springer: Cham, Switzerland, 2018; pp. 283–298. [Google Scholar] [CrossRef]
  37. LIFE MASTER ADAPT MAinSTreaming Experiences at Regional and Local Level for ADAPtation to Climate Change. Available online: https://masteradapt.eu/?lang=en (accessed on 2 October 2020).
  38. IPCC Summary for Policymakers. In Climate Change 2014: Impacts, Adaptation, and Vulnerability. Part A: Global and Sectoral Aspects; Cambridge University Press: Cambridge, MA, USA, 2014; pp. 1–32.
  39. OECD Handbook on Constructing Composite Indicators; OECD Publishing: Paris, France, 2008.
  40. Van Wagner, C.E. Development and Structure of the Canadian Forest Fire Weather Index System; Canadian Forestry Service: Ottawa, AB, Canada, 1987; Volume 35, ISBN 0-662-15198-4. [Google Scholar]
  41. EFFIS European Forest Fire Information System. Available online: https://effis.jrc.ec.europa.eu (accessed on 1 June 2021).
  42. Viegas, D.X.; Bovio, G.; Ferreira, A.; Nosenzo, A.; Sol, B. Comparative Study of Various Methods of Fire Danger Evaluation in Southern Europe. Int. J. Wildl. Fire 2000, 9, 235–246. [Google Scholar] [CrossRef]
  43. Giannakopoulos, C.; LeSager, P.; Moriondo, M.; Bindi, M.; Karali, A.; Hatzaki, M.; Kostopoulou, E. Comparison of fire danger indices in the Mediterranean for present day conditions. IForest 2012, 5, 197–203. [Google Scholar] [CrossRef] [Green Version]
  44. Bedia, J.; Herrera, S.; Camia, A.; Moreno, J.M.; Gutiérrez, J.M. Forest fire danger projections in the Mediterranean using ENSEMBLES regional climate change scenarios. Clim. Chang. 2014, 122, 185–199. [Google Scholar] [CrossRef] [Green Version]
  45. Karali, A.; Hatzaki, M.; Giannakopoulos, C.; Roussos, A.; Xanthopoulos, G.; Tenentes, V. Sensitivity and evaluation of current fire risk and future projections due to climate change: The case study of Greece. Nat. Hazards Earth Syst. Sci. 2014, 14, 143–153. [Google Scholar] [CrossRef] [Green Version]
  46. Ager, A.A.; Preisler, H.K.; Arca, B.; Spano, D.; Salis, M. Wildfire risk estimation in the Mediterranean area. Environmetrics 2014, 25, 384–396. [Google Scholar] [CrossRef]
  47. Varela, V.; Vlachogiannis, D.; Sfetsos, A.; Karozis, S.; Politi, N.; Giroud, F. Projection of Forest Fire Danger due to Climate Change in the French Mediterranean Region. Sustainability 2019, 11, 4284. [Google Scholar] [CrossRef] [Green Version]
  48. Strandberg, G.; Bärring, L.; Hansson, U.; Jansson, C.; Jones, C.; Kjellström, E.; Kolax, M.; Kupiainen, M.; Nikulin, G.; Samuelsson, P.; et al. CORDEX Scenarios for Europe from the Rossby Centre Regional Climate Model RCA4; Swedish Meteorological and Hydrological Institute: Norrköping, Sweden, 2014. [Google Scholar]
  49. Collins, W.J.; Bellouin, N.; Doutriaux-Boucher, M.; Gedney, N.; Halloran, P.; Hinton, T.; Hughes, J.; Jones, C.D.; Joshi, M.; Liddicoat, S.; et al. Development and evaluation of an Earth-System model-HadGEM2. Geosci. Model Dev. 2011, 4, 1051–1075. [Google Scholar] [CrossRef] [Green Version]
  50. Giorgetta, M.A.; Jungclaus, J.; Reick, C.H.; Legutke, S.; Bader, J.; Böttinger, M.; Brovkin, V.; Crueger, T.; Esch, M.; Fieg, K.; et al. Climate and carbon cycle changes from 1850 to 2100 in MPI-ESM simulations for the Coupled Model Intercomparison Project phase 5. J. Adv. Model. Earth Syst. 2013, 5, 572–597. [Google Scholar] [CrossRef]
  51. Prodhomme, C.; Doblas-Reyes, F.; Bellprat, O.; Dutra, E. Impact of land-surface initialization on sub-seasonal to seasonal forecasts over Europe. Clim. Dyn. 2016, 47, 919–935. [Google Scholar] [CrossRef]
  52. LIFE MASTER ADAPT Report on Climate Analysis and Vulnerability Assessment Results in the Pilot Region (Sardinia Region) and in the Areas Targeted in Action C3. Available online: https://masteradapt.eu/wordpress/wp-content/uploads/2017/09/MA-report-A1.pdf (accessed on 2 November 2020).
  53. Copernicus Programme CORINE Land Cover. Available online: https://land.copernicus.eu/pan-european/corine-land-cover/clc2018 (accessed on 2 October 2020).
  54. Protected Planet. Available online: https://www.protectedplanet.net/en (accessed on 1 June 2021).
  55. IBESTAT Instituto de Estadística de las Islas Baleares. Available online: https://ibestat.caib.es (accessed on 25 May 2021).
  56. ISTAC Istituto Canario de Estadistica. Available online: http://www.gobiernodecanarias.org/istac/ (accessed on 26 May 2021).
  57. HSA Hellenic Statistical Autority. Available online: https://www.statistics.gr (accessed on 20 May 2021).
  58. INSEE Institut National de la Statistique et des Etudes Economiques. Available online: https://www.insee.fr (accessed on 5 April 2021).
  59. CYSTAT Statistical Service of the Republic of Cyprus. Available online: http://www.cystat.gov.cy/ (accessed on 5 April 2021).
  60. NSO National Statistics Office. Available online: https://nso.gov.mt/ (accessed on 6 April 2021).
  61. ISTAT Istituto Nazionale di Statistica. Available online: https://www.istat.it (accessed on 7 May 2021).
  62. HCCA Hellenic Civil Aviation Authority. Available online: http://www.ypa.gr/en/ (accessed on 8 May 2021).
  63. Sardegnastatistiche Statistical Office of Sardinia Autonomous Region. Available online: http://www.sardegnastatistiche.it/ (accessed on 8 May 2021).
  64. Osservatorio Turistico Tourism Observatory of Sicily Region. Available online: https://osservatorioturistico.regione.sicilia.it (accessed on 8 May 2021).
  65. Oliveira, S.; Félix, F.; Nunes, A.; Lourenço, L.; Laneve, G.; Sebastián-López, A. Mapping wildfire vulnerability in Mediterranean Europe. Testing a stepwise approach for operational purposes. J. Environ. Manag. 2018, 206, 158–169. [Google Scholar] [CrossRef] [PubMed]
  66. Corona, P.; Ferrari, B.; Cartisano, R.; Barbati, A. Calibration assessment of forest flammability potential in Italy. IForest 2014, 7, 300–305. [Google Scholar] [CrossRef] [Green Version]
  67. Xanthopoulos, G.; Calfapietra, C.; Fernandes, P. Fire Hazard and Flammability of European Forest Types; Springer: Dordrecht, The Netherlands, 2012; pp. 79–92. [Google Scholar]
  68. Martínez, J.; Vega-Garcia, C.; Chuvieco, E. Human-caused wildfire risk rating for prevention planning in Spain. J. Environ. Manag. 2009, 90, 1241–1252. [Google Scholar] [CrossRef]
  69. Vilar, L.; Gómez, I.; Martínez-Vega, J.; Echavarría, P.; Riaño, D.; Martín, M.P. Multitemporal modelling of socio-economic wildfire drivers in central Spain between the 1980s and the 2000s: Comparing generalized linear models to machine learning algorithms. PLoS ONE 2016, 11, e0161344. [Google Scholar] [CrossRef] [Green Version]
  70. Francini, M.; Chieffallo, L.; Palermo, A.; Viapiana, M.F. A Method for the Definition of Local Vulnerability Domains to Climate Change and Relate Mapping. Two Case Studies in Southern Italy. Sustainability 2020, 12, 9454. [Google Scholar] [CrossRef]
  71. Services départementaux d’incendie et de secours (SDIS) Haute-Corse. Available online: https://www.pompiercenter.com/annuaire-sdis/sdis-201.htm (accessed on 3 September 2020).
  72. Piano Antincendio Boschivo (AIB), Regione Siciliana. Available online: https://pti.regione.sicilia.it/portal/page/portal/PIR_PORTALE/PIR_LaStrutturaRegionale/PIR_Assessoratoregionaledelterritorioedellambiente/PIR_Comandocorpoforestale/PIR_Areetematiche/PIR_Tutelamicologica (accessed on 3 September 2020).
  73. Piano Antincendio Boschivo (AIB), Regione Siciliana. Available online: http://www.sardegnaambiente.it/index.php?xsl=612&s=367446&v=2&c=5352&idsito=19 (accessed on 3 September 2020).
  74. DREAL Corse Les Plans de Prévention des Risques Incendie de Forêt (PPRIF). Available online: http://www.corse.developpement-durable.gouv.fr/les-plans-de-prevention-des-risques-incendie-de-a281.html (accessed on 1 October 2020).
  75. EU Regional Innovation Monitor Plus. Available online: https://ec.europa.eu/growth/tools-databases/regional-innovation-monitor/ (accessed on 1 February 2021).
Figure 1. The seven Mediterranean islands investigated in the study are highlighted by a thick black coastline.
Sustainability 13 10004 g001
Figure 2. Theoretical impact chain for the potential risk of forest fires in touristic areas. Light boxes represent risk components (hazard, exposure, vulnerability), while dark boxes represent components’ factors. The factors in italics were meant as an auxiliary tool (not translated in indicators) to understand better the cause–effect chain leading to the risk and the potential impacts of future forest fire risks on tourism demand and supply. Our processing follows the GIZ approach [25].
Sustainability 13 10004 g002
Figure 3. The diagram presents the weighting and aggregation steps adopted in this work. First, exposure, hazard, and vulnerability indicators were classified in a five-class evaluation scheme after normalization. Then, weighted arithmetic aggregation was applied to calculate the composite index for each sub-component and component according to their assigned weights. The final risk score was computed, weighting the final composite indexes (exposure, hazard, and vulnerability) with the relative weights derived from expert interviews. Our processing follows the GIZ approach [25].
Sustainability 13 10004 g003
Figure 4. Comparison of exposure normalized scores across the Mediterranean islands. Plot (a) represents the “natural capital” indicators, while (b) shows the “human capital” indicators, where Pcrops: agricultural areas; PFrs: forest areas; PFrsPA: forest areas under environmental protection; NtotP: total population; NP9: young population; NP65: elderly population; and NTouP: tourists, as in Table 1.
Sustainability 13 10004 g004aSustainability 13 10004 g004b
Figure 5. Comparison of vulnerability (sensitivity and adaptive capacity) normalized scores across Mediterranean islands, where FI: flammability index; FFV: firefighters and volunteers; NrFPLA: fire risk plans; OCC: occupation in the primary sector; PEL: level of education; IGDP: island gross domestic product; GDPC: gross domestic product per capita, as in Table 2.
Sustainability 13 10004 g005
Figure 6. Risk maps at island level for the potential fire impact and risk component contribution at present (a), near and distant future for RCP2.6 (b,c), near and distant future for RCP8.5 (d,e).
Sustainability 13 10004 g006aSustainability 13 10004 g006b
Table 1. Exposure indicators.
CodeNameDefinitionData Source
Natural capitalPcropsAgricultural areasPercentage of agricultural areas over island total surfaceCORINE Land Cover (2018) [53]
PFrsForest areasPercentage of forest, shrubland, and/or herbaceous vegetation associations areas over island total surfaceCORINE Land Cover (2018)
PFrsPAForest areas under environmental protectionForest areas under environmental protection over island total surfaceWorld Database on Protected Areas (WDPA) [54]
Human capitalNtotPTotal populationDensity (number per km2) of the total populationIBESTAT [55], ISTAC [56], HSA [57], INSEE [58], CYSTAT [59], NSO [60], ISTAT [61]
NP9Young populationDensity (number per km2) of the population under 9 years of ageIBESTAT, ISTAC, HSA, INSEE, CYSTAT, NSO, ISTAT
NP65Elderly populationDensity (number per km2) of the population over 65 years of ageIBESTAT, ISTAC, HSA, INSEE, CYSTAT, NSO, ISTAT
NTouPTouristsDensity (number per km2) of the tourist arrivalsIBESTAT, ISTAC, INSEE, HCAA [62], SSRC, NSO, Sardegnastatistiche [63], Osservatorio turistico [64]
Table 2. Adaptive capacity indicators.
AC LevelAC DimensionCodeNameDefinitionData Source
Sector-specificInstitutionFFVFirefighters and volunteersRatio of firefighters and volunteers in
relation to the island area (number per km2)
Personal communication Servicio de Bomberos de Mallorca, SDIS [71], Piano AIB 2018 Regione Siciliana [72] and Regione Sardegna [73]
Sector-specificInstitutionNrFPLAFire risk plansPresence or absence of fire risk planGovern de les Illes Balears, DREAL Corse [74], Civil Protection Department, Piano AIB 2018 Regione Siciliana and Regione Sardegna
Sector-specificEconomicOCCOccupation in the primary sectorPercentage (%) of people working in the primary sector (excluding mining) over total populationIBESTAT, ISTAC, HSA, INSEE, CYSTAT, NSO, ISTAT
Regional-genericKnowledgePELLevel of educationPercentage (%) of people with a high degree over total populationIBESTAT, ISTAC, HSA, INSEE, CYSTAT, NSO, ISTAT
Regional-genericEconomicIGDPIsland gross domestic productIGDP (mln €) and GDPC (€ per capita) analyze the prosperity of a country based on its and its population‘s economic growthRegional Innovation Monitor Plus (RIM Plus) [75]
Regional-genericEconomicGDPCGross domestic product per capita
Table 3. Example of the weight assigned to a sub-component with three indicators through experts’ opinions combination based on indicators’ pertinence and rank.
Sub-Component IndicatorsExpert 1Expert 2Expert 3Expert 4Average ClassWeight
ClassRankClassRankClassRankClassRank
Indicator x13243524340.32 = 4/(4 + 5 + 3.25)
Indicator x25151515150.41
Indicator x3333233423.250.27
Table 4. FWI multi-model ensembles mean values for all Mediterranean islands, along with the uncertainly and the respective normalized value used for the impact chain.
Balearic IslandsCorseCreteCyprusMaltaSardiniaSicily
referencemean 116.015.332.435.519.020.623.5
s.d. 24.06.49.08.51.15.97.0
normalized score0.020.000.570.680.120.180.28
RCP2.6 nearmean16.516.035.837.319.821.325.0
s.d.4.16.49.48.61.05.97.0
normalized score0.040.020.690.740.150.200.33
RCP2.6 distantmean15.715.235.337.419.720.424.5
s.d.4.16.49.48.71.16.07.1
normalized score0.010.000.670.740.150.170.31
RCP 8.5 nearmean17.818.239.041.020.824.327.5
s.d.4.46.710.08.31.26.27.3
normalized score0.080.100.800.860.180.300.41
RCP8.5 distantmean21.122.245.143.424.529.134.1
s.d.5.07.110.18.41.46.47.9
normalized score0.190.231.000.940.310.460.63
1 mean: The mean FWI was calculated from the grid cells corresponding to each island, according to model land fraction (l.f. > 15%). 2 s.d.: pooled standard deviation of the model ensemble mean.
Publisher’s Note: MDPI stays neutral with regard to jurisdictional claims in published maps and institutional affiliations.

