
Different Shades of Nudges: Moderating Effects of Individual Characteristics and States on the Effectiveness of Nudges during a Fast-Food Order


Abstract
:1. Introduction
2. Materials and Methods
2.1. Participants
2.2. Design
2.3. Treatments
2.4. Measures
2.4.1. BMI
2.4.2. Hunger
2.4.3. Affective States
2.5. Statistical Analysis
3. Results
4. Discussion
Author Contributions
Funding
Institutional Review Board Statement
Informed Consent Statement
Data Availability Statement
Conflicts of Interest
References
- Arno, A.; Thomas, S. The efficacy of nudge theory strategies in influencing adult dietary behaviour: A systematic review and meta-analysis. BMC Public Health 2016, 16, 676. [Google Scholar] [CrossRef] [Green Version]
- Bucher, T.; Collins, C.; Rollo, M.E.; McCaffrey, T.; De Vlieger, N.; Van Der Bend, D.; Truby, H.; Perez-Cueto, F.J.A. Nudging consumers towards healthier choices: A systematic review of positional influences on food choice. Br. J. Nutr. 2016, 115, 2252–2263. [Google Scholar] [CrossRef]
- Wilson, A.L.; Buckley, E.; Buckley, J.; Bogomolova, S. Nudging healthier food and beverage choices through salience and priming. Evidence from a systematic review. Food Qual. Prefer. 2016, 51, 47–64. [Google Scholar] [CrossRef]
- Thaler, R.H.; Sunstein, C.R. Nudge: Improving Decisions About Health, Wealth and Happiness; Yale University Press: New Haven, CT, USA, 2008. [Google Scholar]
- Weinmann, M.; Schneider, C.; Brocke, J.V. Digital Nudging. Bus. Inf. Syst. Eng. 2016, 58, 433–436. [Google Scholar] [CrossRef] [Green Version]
- Cohen, D.A.; Babey, S.H. Contextual Influences on Eating Behaviors: Heuristic Processing and Dietary Choices. Obes. Rev. 2012, 13, 766–779. [Google Scholar] [CrossRef] [Green Version]
- Mela, D.J. Determinants of Food Choice: Relationships with Obesity and Weight Control. Obes. Res. 2001, 9, 249S–255S. [Google Scholar] [CrossRef] [PubMed]
- Maimaiti, M.; Zhao, X.; Jia, M.; Ru, Y.; Zhu, S. How we eat determines what we become: Opportunities and challenges brought by food delivery industry in a changing world in China. Eur. J. Clin. Nutr. 2018, 72, 1282–1286. [Google Scholar] [CrossRef]
- Zhao, X.; Lin, W.; Cen, S.; Zhu, H.; Duan, M.; Li, W.; Zhu, S. The online-to-offline (O2O) food delivery industry and its recent development in China. Eur. J. Clin. Nutr. 2021, 75, 232–237. [Google Scholar] [CrossRef] [PubMed]
- Vecchio, R.; Cavallo, C. Increasing healthy food choices through nudges: A systematic review. Food Qual. Prefer. 2019, 78, 103714. [Google Scholar] [CrossRef]
- Cadario, R.; Chandon, P. Which Healthy Eating Nudges Work Best? A Meta-Analysis of Field Experiments. Mark. Sci. 2020, 39, 465–486. [Google Scholar] [CrossRef]
- Cioffi, C.E.; Levitsky, D.A.; Pacanowski, C.R.; Bertz, F. A nudge in a healthy direction. The effect of nutrition labels on food purchasing behaviors in university dining facilities. Appetite 2015, 92, 7–14. [Google Scholar] [CrossRef]
- A Crockett, R.; E King, S.; Marteau, T.M.; Prevost, T.; Bignardi, G.; Roberts, N.W.; Stubbs, B.; Hollands, G.; A Jebb, S. Nutritional labelling for healthier food or non-alcoholic drink purchasing and consumption. Cochrane Database Syst. Rev. 2018, 2021, CD009315. [Google Scholar] [CrossRef] [Green Version]
- Long, M.W.; Tobias, D.K.; Cradock, A.L.; Batchelder, H.; Gortmaker, S.L. Systematic Review and Meta-analysis of the Impact of Restaurant Menu Calorie Labeling. Am. J. Public Health 2015, 105, e11–e24. [Google Scholar] [CrossRef] [PubMed]
- Friis, R.; Skov, L.R.; Olsen, A.; Appleton, K.M.; Saulais, L.; Dinnella, C.; Hartwell, H.; Depezay, L.; Monteleone, E.; Giboreau, A.; et al. Comparison of three nudge interventions (priming, default option, and perceived variety) to promote vegetable consumption in a self-service buffet setting. PLoS ONE 2017, 12, e0176028. [Google Scholar] [CrossRef] [PubMed]
- Reisch, L.A.; Sunstein, C.R. Do Europeans like nudges? Judgm. Decis. Mak. 2017, 11, 310–325. [Google Scholar] [CrossRef] [Green Version]
- Sinclair, S.E.; Cooper, M.; Mansfield, E.D. The Influence of Menu Labeling on Calories Selected or Consumed: A Systematic Review and Meta-Analysis. J. Acad. Nutr. Diet. 2014, 114, 1375–1388.e15. [Google Scholar] [CrossRef]
- Levi, A.; Chan, K.K.; Pence, D. Real Men Do Not Read Labels: The Effects of Masculinity and Involvement on College Students’ Food Decisions. J. Am. Coll. Health 2006, 55, 91–98. [Google Scholar] [CrossRef]
- Bonanno, A.; Bimbo, F.; Cleary, R.; Castellari, E. Food labels and adult BMI in Italy—An unconditional quantile regression approach. Food Policy 2018, 74, 199–211. [Google Scholar] [CrossRef]
- Rimpeekool, W.; Yiengprugsawan, V.; Kirk, M.; Banwell, C.; Seubsman, S.-A.; Sleigh, A. Nutrition label experience, obesity, high blood pressure, and high blood lipids in a cohort of 42,750 Thai adults. PLoS ONE 2017, 12, e0189574. [Google Scholar] [CrossRef] [PubMed] [Green Version]
- Meyers, A.W.; Stunkard, A.J.; Coll, M. Food accessibility and food choice. A test of Schachter’s externality hypothesis. Arch. Gen. Psychiatry 1980, 37, 1133–1135. [Google Scholar] [CrossRef]
- Forwood, S.E.; Ahern, A.; Hollands, G.; Ng, Y.-L.; Marteau, T.M. Priming healthy eating. You can’t prime all the people all of the time. Appetite 2015, 89, 93–102. [Google Scholar] [CrossRef] [Green Version]
- Campos, S.; Doxey, J.; Hammond, D. Nutrition labels on pre-packaged foods: A systematic review. Public Health Nutr. 2011, 14, 1496–1506. [Google Scholar] [CrossRef] [PubMed] [Green Version]
- Köster, E.P.; Mojet, J. From mood to food and from food to mood: A psychological perspective on the measurement of food-related emotions in consumer research. Food Res. Int. 2015, 76, 180–191. [Google Scholar] [CrossRef]
- Lyman, B. The Nutritional Values and Food Group Characteristics of Foods Preferred During Various Emotions. J. Psychol. 1982, 112, 121–127. [Google Scholar] [CrossRef]
- Patel, K.; Schlundt, D. Impact of moods and social context on eating behavior. Appetite 2001, 36, 111–118. [Google Scholar] [CrossRef]
- Macht, M.; Simons, G. Emotions and eating in everyday life. Appetite 2000, 35, 65–71. [Google Scholar] [CrossRef] [PubMed]
- Evers, C.; Adriaanse, M.; De Ridder, D.T.; Huberts, J.C.D.W. Good mood food. Positive emotion as a neglected trigger for food intake. Appetite 2013, 68, 1–7. [Google Scholar] [CrossRef]
- Bongers, P.; Jansen, A.; Havermans, R.; Roefs, A.; Nederkoorn, C. Happy eating. The underestimated role of overeating in a positive mood. Appetite 2013, 67, 74–80. [Google Scholar] [CrossRef]
- Canetti, L.; Bachar, E.; Berry, E.M. Food and emotion. Behav. Process. 2002, 60, 157–164. [Google Scholar] [CrossRef]
- Nederkoorn, C.; Guerrieri, R.; Havermans, R.; Roefs, A.; Jansen, A. The interactive effect of hunger and impulsivity on food intake and purchase in a virtual supermarket. Int. J. Obes. 2009, 33, 905–912. [Google Scholar] [CrossRef] [Green Version]
- Rosenheck, R. Fast food consumption and increased caloric intake: A systematic review of a trajectory towards weight gain and obesity risk. Obes. Rev. 2008, 9, 535–547. [Google Scholar] [CrossRef] [PubMed]
- Bowman, S.; Vinyard, B.T. Fast food consumption of U.S. adults: Impact on energy and nutrient intakes and overweight status. J. Am. Coll. Nutr. 2004, 23, 163–168. [Google Scholar] [CrossRef] [PubMed]
- Munt, A.E.; Partridge, S.R.; Allman-Farinelli, M. The barriers and enablers of healthy eating among young adults: A missing piece of the obesity puzzle: A scoping review. Obes. Rev. 2017, 18, 1–17. [Google Scholar] [CrossRef]
- Larson, N.; Neumark-Sztainer, D.; Laska, M.N.; Story, M. Young Adults and Eating Away from Home: Associations with Dietary Intake Patterns and Weight Status Differ by Choice of Restaurant. J. Am. Diet. Assoc. 2011, 111, 1696–1703. [Google Scholar] [CrossRef] [Green Version]
- Anderson, B.; Lyon-Callo, S.; Fussman, C.; Imes, G.; Rafferty, A.P. Fast-Food Consumption and Obesity Among Michigan Adults. Prev. Chronic Dis. 2011, 8, A71. [Google Scholar]
- Hoddy, K.K.; Gibbons, C.; Kroeger, C.M.; Trepanowski, J.F.; Barnosky, A.; Bhutani, S.; Gabel, K.; Finlayson, G.; Varady, K.A. Changes in hunger and fullness in relation to gut peptides before and after 8 weeks of alternate day fasting. Clin. Nutr. 2016, 35, 1380–1385. [Google Scholar] [CrossRef] [PubMed]
- Breyer, B.; Bluemke, M. Deutsche Version der Positive and Negative Affect Schedule PANAS (GESIS Panel). Zusammenstellung Sozialwissenschaflicher Items Skalen 2016. [Google Scholar] [CrossRef]
- Watson, D.; Clark, L.A.; Tellegen, A. Development and validation of brief measures of positive and negative affect: The PANAS scales. J. Pers. Soc. Psychol. 1988, 54, 1063–1070. [Google Scholar] [CrossRef] [PubMed]
- Arganini, C.; Saba, A.; Comitato, R.; Virgili, F.; Turrini, A. Gender Differences in Food Choice and Dietary Intake in Modern Western Societies. In Public Health—Social and Behavioral Health; Maddock, J., Ed.; InTech: Pittsburgh, PA, USA, 2012. [Google Scholar] [CrossRef] [Green Version]
- Heidal, K.B.; Colby, S.E.; Mirabella, G.T.; Al-Numair, K.S.; Bertrand, B.; Gross, K.H. Cost and Calorie Analysis of Fast Food Consumption in College Students. Food Nutr. Sci. 2012, 03, 942–946. [Google Scholar] [CrossRef] [Green Version]
- Gerend, M.A. Does Calorie Information Promote Lower Calorie Fast Food Choices Among College Students? J. Adolesc. Health 2009, 44, 84–86. [Google Scholar] [CrossRef] [PubMed]


| Variable | Description | Mean (Std. Dev.) | Min | Max |
|---|---|---|---|---|
| Age | Age in years | 21.96 (2.23) | 18 | 25 |
| Fast food consumption frequency | 5-point Likert scale (from “every day” to “once a month”) | 3.27 (1.10) | 1 | 5 |
| Sex | 1–female, 2–male | 1.50 (0.50) | 1 | 2 |
| Education | 1–no degree; 2–secondary general school; 3–intermediate secondary school; 4–(specialized) grammar school | 3.64 (0.62) | 1 | 4 |
| Pre-Experiment Questionnaire | Fast Food Order Simulation | Post-Experiment Questionnaire |
|---|---|---|
| Age Fast food frequency Sex Height and weight (BMI) Education Emotions (PANAS) Hunger, time from last meal and its type | Cheap talk Calorie goal setting Order simulation according to treatment | Diet Calorie counting habit Self-control scale Food addiction Fast food type habit Social Norms Espousal Emotional eating scale Order satisfaction Treatment satisfaction Housing situation Income |
| No Treatment | CCS | OA | OA&CCS |
|---|---|---|---|
 |  |  |  |
| Amount of Calories Ordered | 0 | 1–700 b | 701–1050 c | 1051–1400 d | >1400 e |
|---|---|---|---|---|---|
| Facial expression | Neutral | Happy | Surprised | Critical | Shocked |
 |  |  |  |  | |
| Verbal message | Please touch on a product to choose it! | Great choice! | Oh! You are above your calorie goal. | Is today your cheat day? | Are you sure? |
| Amount of Calories Ordered | 0 | 1–700 | 701–1050 a | >1051 |
|---|---|---|---|---|
| CCS colors |  |  |  |  |
| Variable | Mean (Std. Dev.) | Min | Max |
|---|---|---|---|
| BMI | 23.53 (4.82) | 10.89 | 70.10 |
| Positive affect | 29.39 (7.08) | 10 | 49 |
| Negative affect | 18.17 (7.75) | 10 | 43 |
| Hunger | 2.17 (1.06) | 1 | 5 |
| Variable | Coefficients (Std. Err.) | |||||
|---|---|---|---|---|---|---|
| Hypothesis 1 Sex | Hypothesis 2 BMI | Hypothesis 3 Education | Hypothesis 4 Positive Affect | Hypothesis 5 Negative Affect | Hypothesis 6 Hunger | |
| OA | −225.17 (39.06) *** | −231.25 (39.89) *** | −228.99 (39.62) *** | −225.43 (39.97) *** | −226.72 (39.32) *** | −232.95 (39.01) *** |
| CCS | −206.22 (39.25) *** | −213.43 (40.07) *** | −206.82 (39.79) *** | −207.32 (40.31) *** | −203.94 (39.45) *** | −212.47 (39.19) *** |
| CCS&OA | −247.77 (39.54) *** | −255.20 (40.38) *** | −247.74 (40.13) *** | −252.28 (40.75) *** | −252.50 (39.90) *** | −249.51 (39.49) *** |
| Sex | 71.10 (27.77) ** | |||||
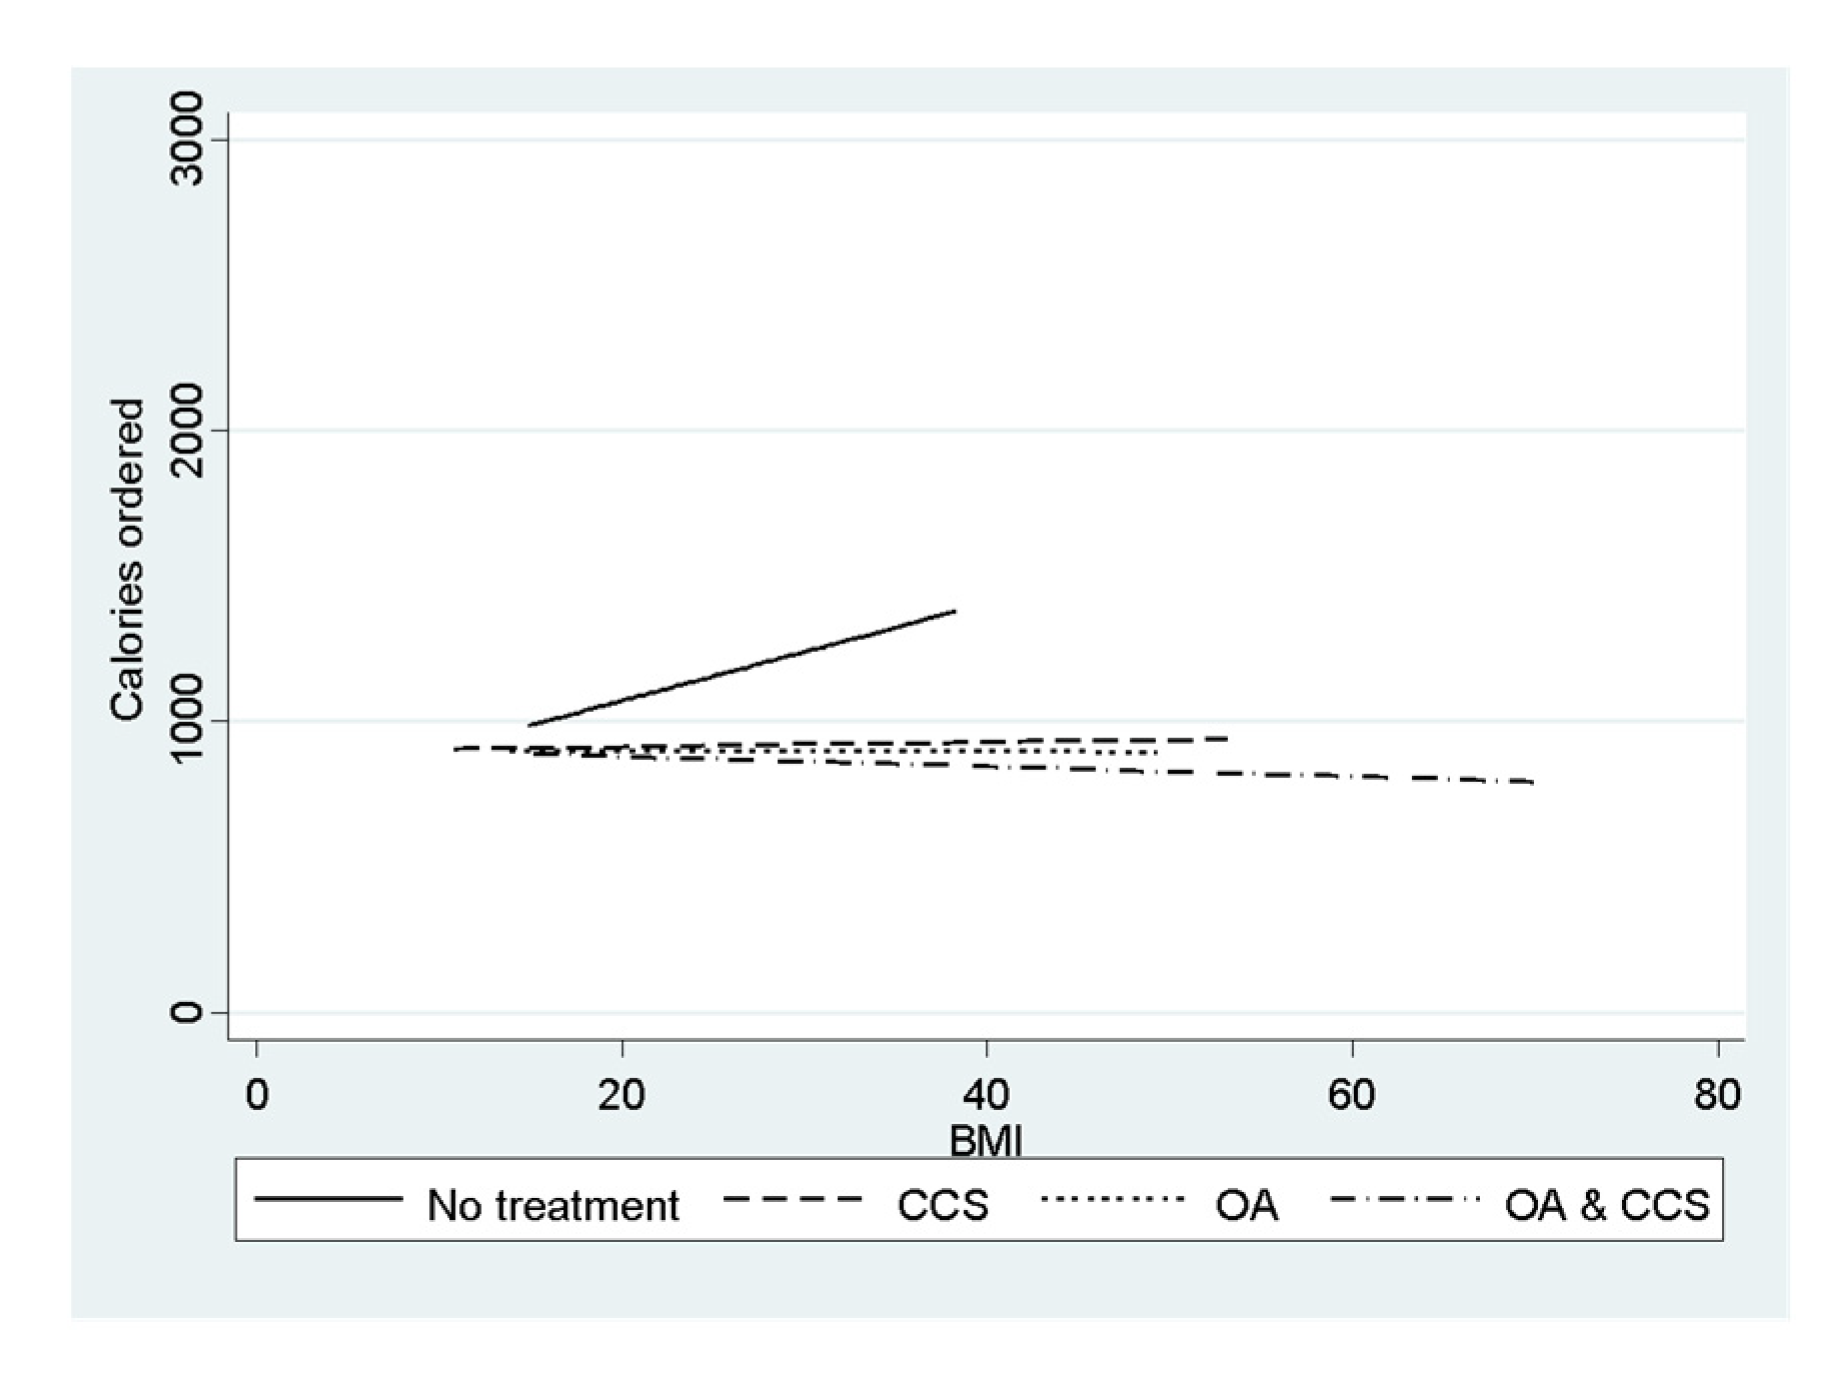
| BMI | 81.18 (32.37) ** | |||||
| Education | −49.68 (27.41) * | |||||
| Positive | −17.32 (30.21) | |||||
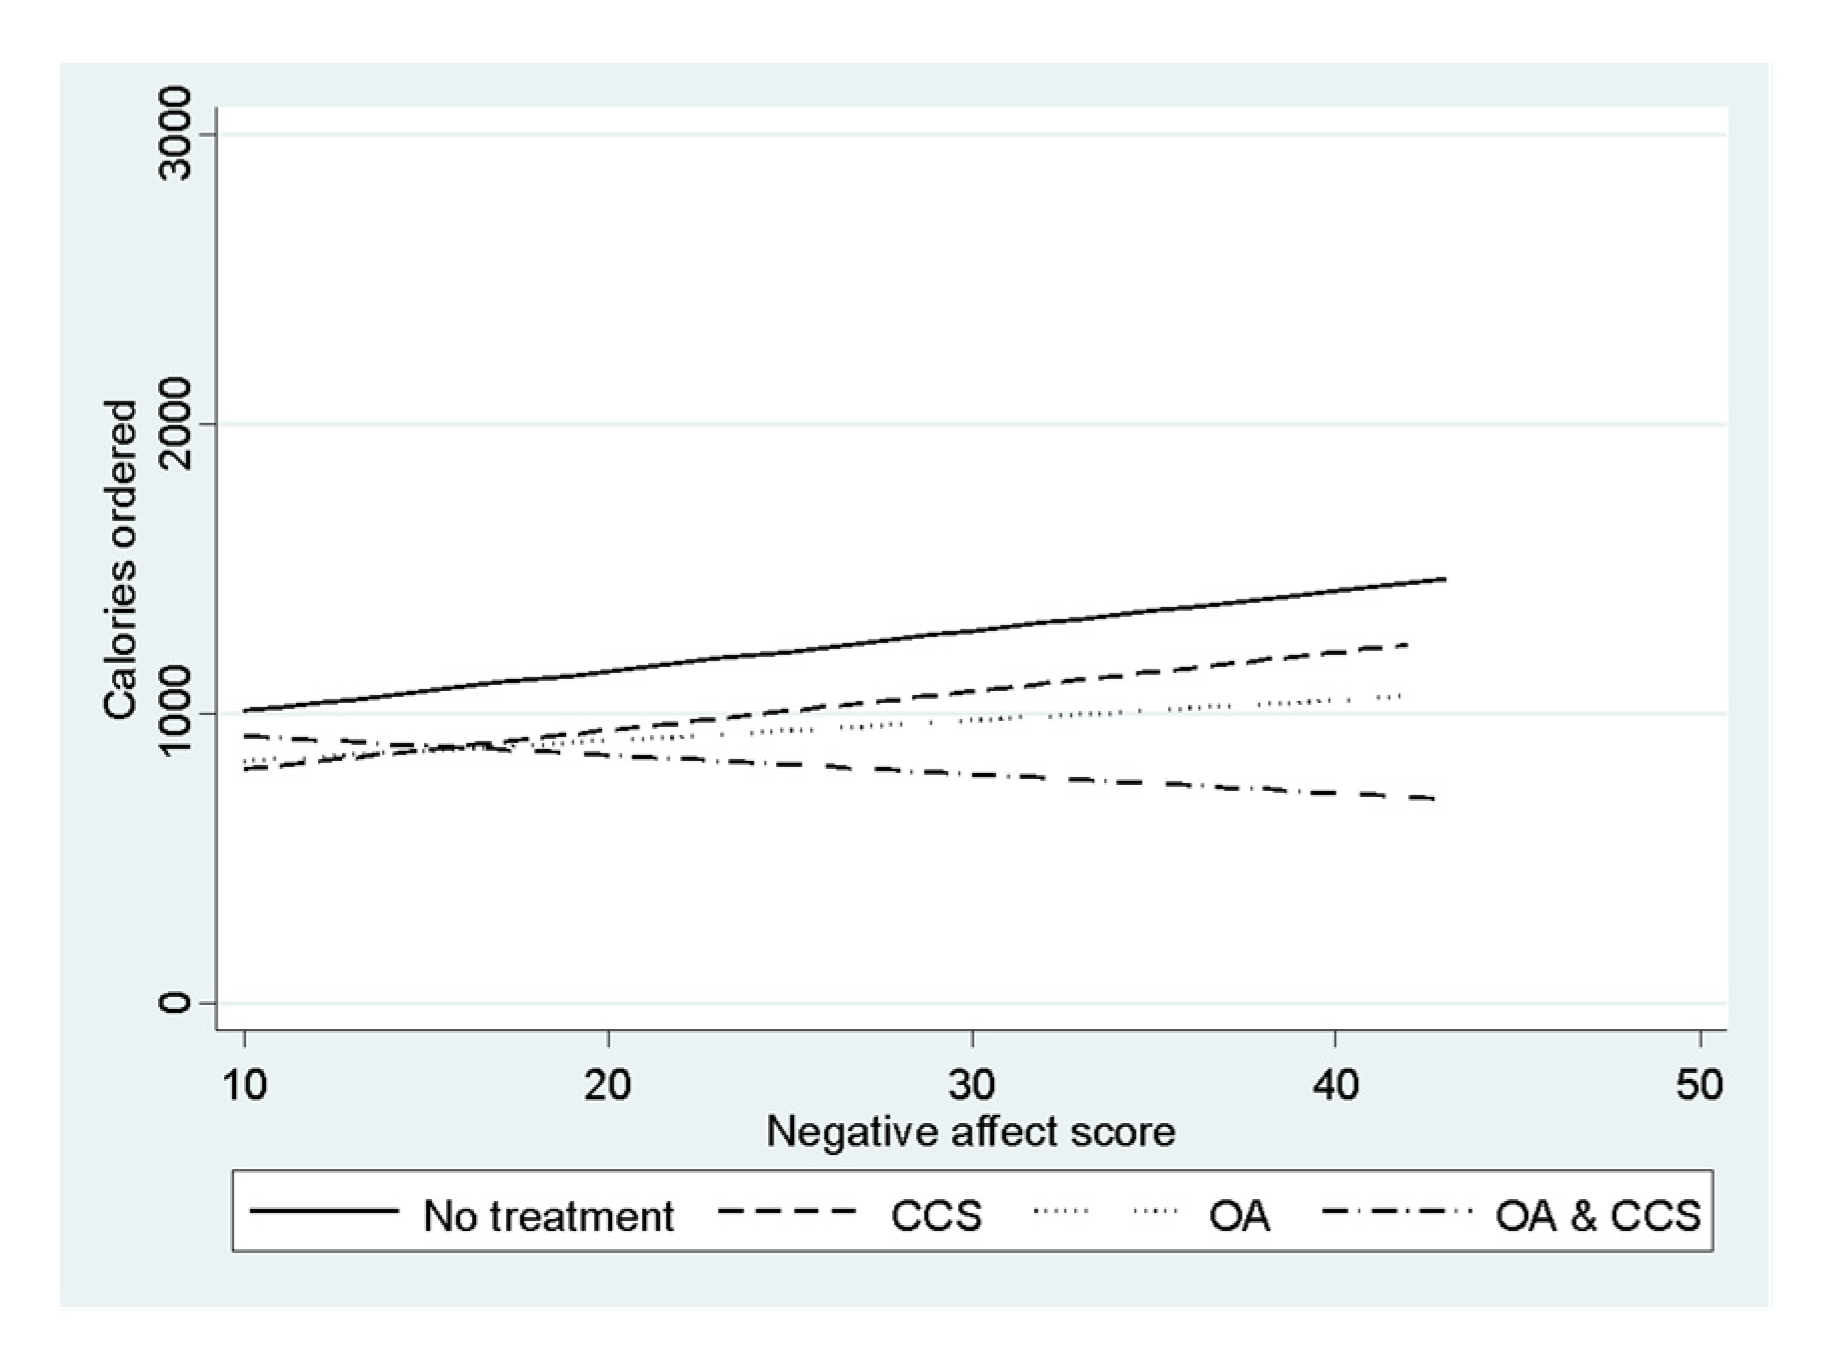
| Negative | 107.57 (29.32) *** | |||||
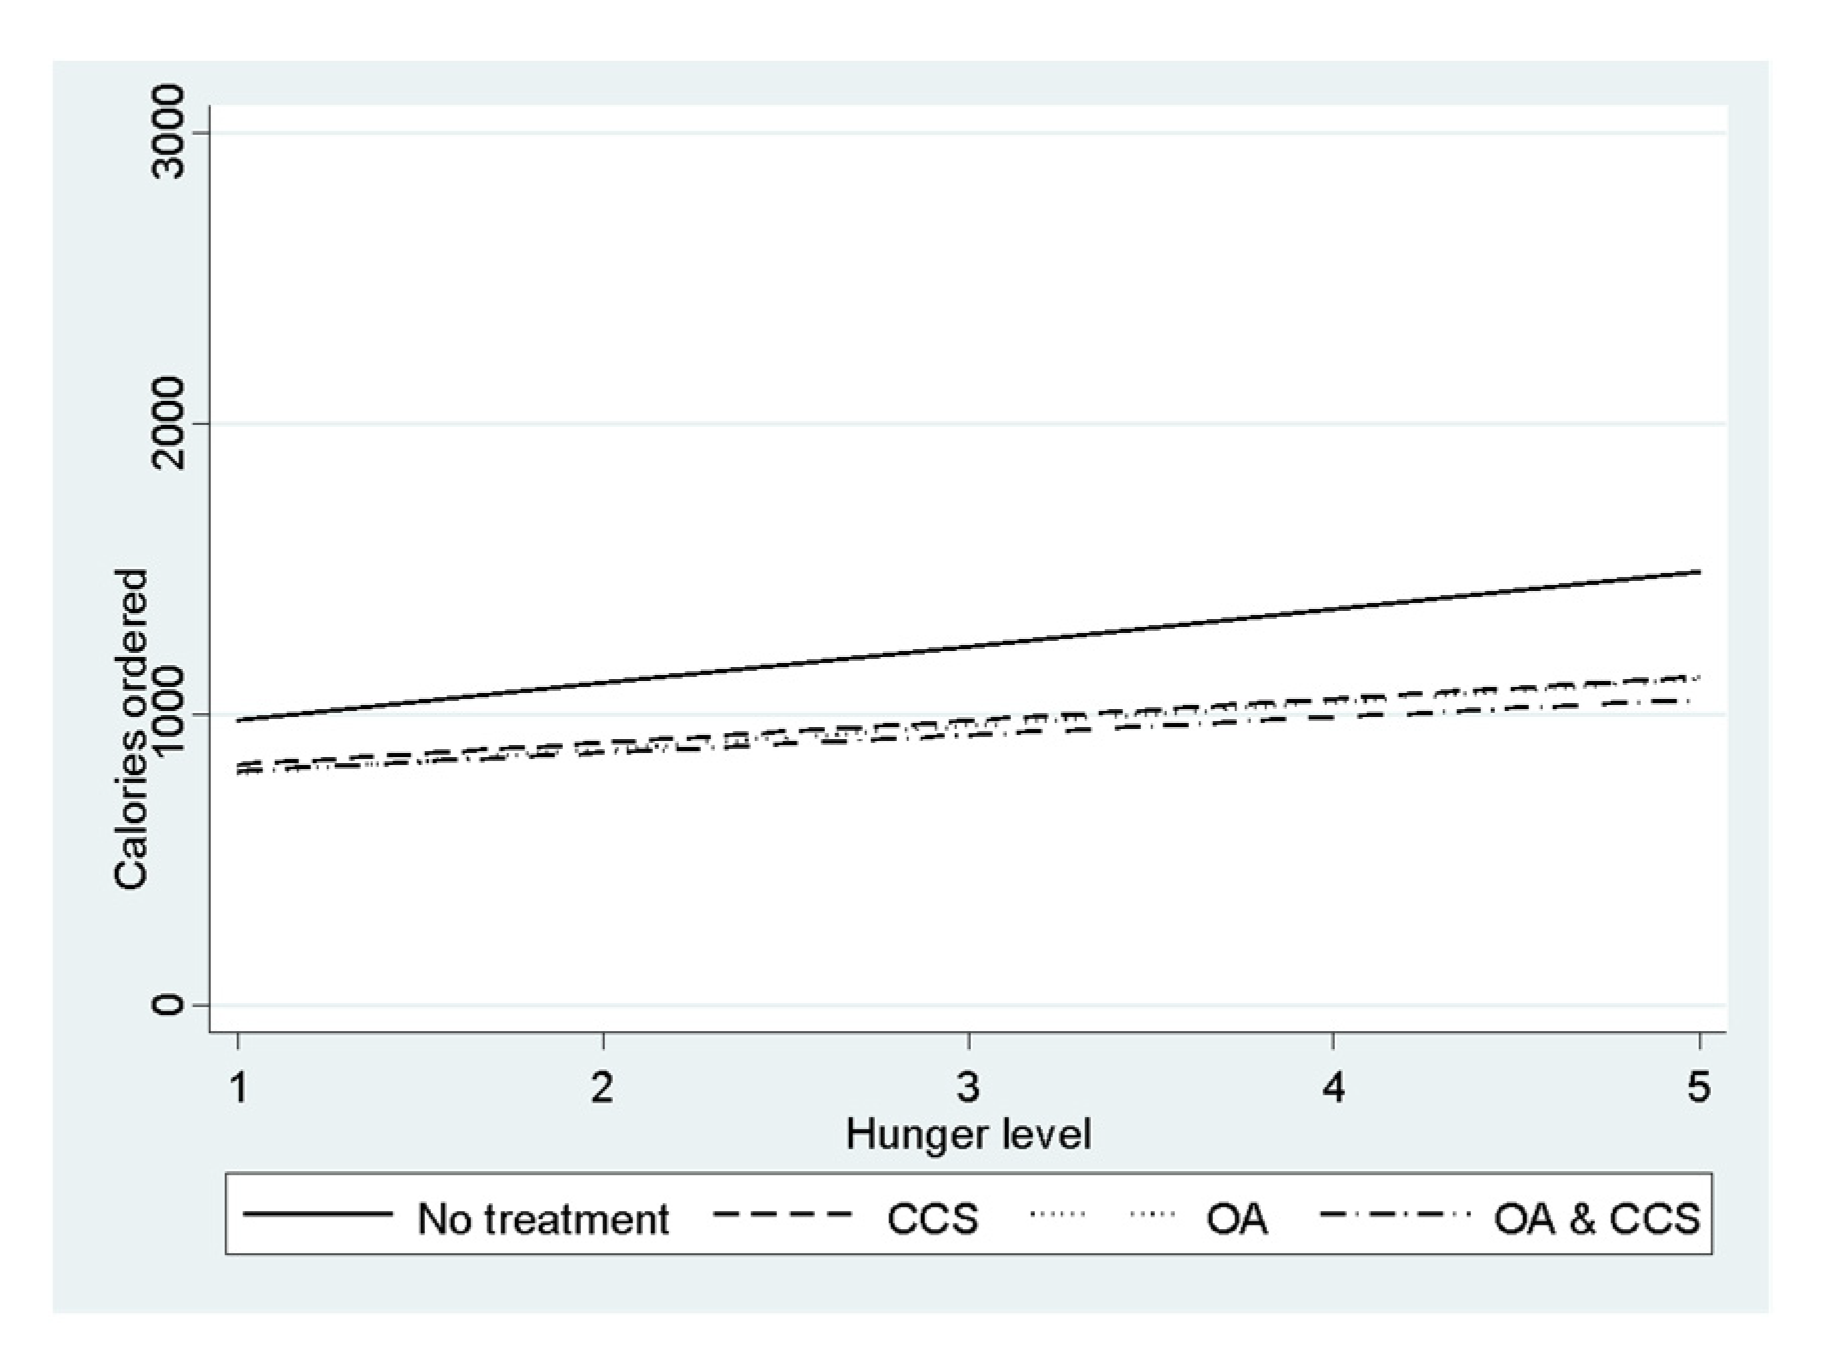
| Hunger | 135.97 (27.18) *** | |||||
| OA×Sex | 25.93 (39.08) | |||||
| OA×BMI | −81.79 (43.33) * | |||||
| OA×Education | −26.69 (37.51) | |||||
| OA×Positive | 20.74 (42.24) | |||||
| OA×Negative | −53.42 (39.28) | |||||
| OA×Hunger | −49.97 (38.33) | |||||
| CCS×Sex | 22.56 (39.27) | |||||
| CCS×BMI | −77.32 (43.24) * | |||||
| CCS×Education | −8.65 (39.87) | |||||
| CCS×Positive | 16.65 (41.84) | |||||
| CCS×Negative | −3.17 (40.26) | |||||
| CCS×Hunger | −55.54 (38.78) | |||||
| CCS&OA×Sex | 35.16 (39.56) | |||||
| CCS&OA×BMI | −89.59 (40.92) ** | |||||
| CCS&OA×Education | 25.94 (42.10) | |||||
| CCS&OA×Positive | 3.52 (40.08) | |||||
| CCS&OA×Negative | −158.25 (41.51) *** | |||||
| CCS&OA×Hunger | −70.53 (40.02) * | |||||
| Intercept | 1122.08 (27.76) *** | 1128.77 (28.39) *** | 1122.37 (28.14) *** | 1122.70 (28.37) *** | 1119.40 (27.90) *** | 1126.05 (27.71) *** |
| R2 | 0.09 | 0.05 | 0.06 | 0.05 | 0.08 | 0.09 |
Publisher’s Note: MDPI stays neutral with regard to jurisdictional claims in published maps and institutional affiliations. |
© 2021 by the authors. Licensee MDPI, Basel, Switzerland. This article is an open access article distributed under the terms and conditions of the Creative Commons Attribution (CC BY) license (https://creativecommons.org/licenses/by/4.0/).
Share and Cite
Dolgopolova, I.; Toscano, A.; Roosen, J. Different Shades of Nudges: Moderating Effects of Individual Characteristics and States on the Effectiveness of Nudges during a Fast-Food Order. Sustainability 2021, 13, 13347. https://0-doi-org.brum.beds.ac.uk/10.3390/su132313347
Dolgopolova I, Toscano A, Roosen J. Different Shades of Nudges: Moderating Effects of Individual Characteristics and States on the Effectiveness of Nudges during a Fast-Food Order. Sustainability. 2021; 13(23):13347. https://0-doi-org.brum.beds.ac.uk/10.3390/su132313347
Chicago/Turabian StyleDolgopolova, Irina, Alessia Toscano, and Jutta Roosen. 2021. "Different Shades of Nudges: Moderating Effects of Individual Characteristics and States on the Effectiveness of Nudges during a Fast-Food Order" Sustainability 13, no. 23: 13347. https://0-doi-org.brum.beds.ac.uk/10.3390/su132313347