
Measurement of Composites Index on Low Carbon Development Supporting Food Security


1
Agency for Food Security, Ministry of Agriculture, Jakarta 12550, Indonesia
2
Regional and Rural Development Planning, Faculty of Economics and Management, IPB University, Bogor 16880, Indonesia
3
International Centre for Applied Finance and Economics, Department of Economics, IPB University, Bogor 16680, Indonesia
*
Author to whom correspondence should be addressed.
Sustainability 2021, 13(23), 13352; https://0-doi-org.brum.beds.ac.uk/10.3390/su132313352
Submission received: 2 November 2021
/
Revised: 25 November 2021
/
Accepted: 26 November 2021
/
Published: 2 December 2021
Abstract
:Since the concept of low carbon development (LCD) was adopted at the 1992 Rio de Janeiro Earth Summit, Indonesia has been committed to implementing the reduction of greenhouse gas emissions. In 2020, the country issued Presidential Regulation No. 18, which made LCD one of the national priority programs to maintain economic and social through low emission activities and reduce the overexploitation of natural resources. The LCD is a way for the country to overcome the tradeoff between economic growth and environmental degradation. Nevertheless, LCD is a new initiative for Indonesia, so it needs strategic indicators that influence the achievement of development. This paper attempts to integrate macro-regional development indicators that combine each region’s gross domestic product, human development index, and unemployment rate with LCD indicators, including the environmental quality index and g reenhouse gas emissions. The combined indicators were constructed by composite index through the Shannon entropy method, geometric and arithmetic means using the technique for order preference by similarity to ideal solution (TOPSIS) method. The results show significant differences among provinces concerning to macro-regional indicators once the LCD indicators were incorporated. The results of this analysis could be used by policymakers to evaluate the green development of regions.
1. Introduction
Economic development has so far been based on the pursuit of high economic growth and the exploitation of natural resources. This approach can no longer be maintained because it will threaten sustainability, decrease the carrying capacity of resources, and cause environmental degradation. Fauzi [1] emphasized that one of the important problems faced in economic development is determining how to deal with the tradeoff between meeting development needs on the one hand and maintaining environmental sustainability on the other. Development becomes unsustainable if the focus is only on achieving high economic growth. In the process of encouraging a high growth rate, the neglect of the environmental dimension causes a decrease in environmental quality.
The impact of this approach is climate change caused by human activities. Climate change causes an increase in greenhouse gas concentrations resulting in rising global temperatures, which can threaten food production and increase the potential for hunger and poverty. One of the indicators used to measure the success of development is the amount of CO2 emissions. This means that the Government must implement sustainable development to ensure environmental sustainability in the present and the future, especially in controlling the amount of CO2 emissions [2]. The Government of Indonesia has demonstrated its commitment by ratifying the Paris Agreement on climate change in 2015. The Paris Agreement is a successful global negotiation in addressing climate change and implementing low-carbon development, and all countries have agreed to strengthen their commitments to reduce carbon emissions.
The concept of LCD originated from the United Nations Framework Convention on Climate Change (UNFCCC), which was adopted at the Rio de Janeiro Earth Summit in 1992. During the negotiations, it was agreed that the Low Emission Development Strategy (LEDS), which adopted appropriate policy measures for LCD, is indispensable to achieve sustainable development. The LEDS was even adopted at the 15th COP (Conferences of Parties) in Copenhagen, Denmark, in 2009. Su et al. [3] found that the concept of LCD puts forward a new sustainable development pattern with low energy consumption, low pollution, and high energy efficiency to reduce carbon emission and cope with global climate challenges. The LCD Indonesia policy carried out by the Ministry of National Development Planning/BAPPENAS is integrated into the RPJMN by considering aspects of the availability of natural resources as well as the carrying capacity of the environment. Several parameters that can be used include economic growth, water availability, fisheries, land, energy availability, emission levels, and emission intensity. Based on the 2021 Global Food Security Index report [4], Indonesia ranks 69th. Rising temperatures and extreme weather patterns continue to threaten food systems, and climate risk. The Intergovernmental Panel on Climate Change (IPCC) forecasts a temperature rise of 2.5–10 degrees Fahrenheit over the next century, which would have a powerful negative effect on biodiversity and food production.
Indonesia has demonstrated international leadership in reducing emissions. The National Action Plan for Reducing Greenhouse Gas Emissions (RAN-GRK) set out a commitment to reduce emissions by 2020 by 26 percent below those generated from business-as-usual (BAU) with domestic funding and by 41 percent with available international assistance. RAN-GRK is a framework to support mitigation activities, including those in the agricultural sector. Although agriculture contributes by increasing carbon emissions into the atmosphere, these changes affect agricultural production by affecting the productivity and nutritional quality of crops. Carbon emissions from human activities are the main reason for global warming. Wang et al. [5] revealed that secondary and tertiary industries are the main sectors for generating carbon emissions. However, the rapid development of agriculture is accelerating global climate change. Smith et al. [6] concluded that agriculture directly contributes 10–12% of global anthropogenic carbon emissions.
Several studies related to low-carbon development were carried out by Songlina and Ruihong [7]. They evaluated sustainable food security in the low-carbon economy using the principles of minimization and recycling. Shenggen and Ramirez [8] concluded that the right innovation, investment, and policy incentives along with low greenhouse gas emission agricultural practices can help mitigate climate change impacts, reducing emissions while contributing to food security. The research of Xiaowei and Xing [9] explains the concept of low-carbon food and carbon emissions in food. China is exploring the importance of systematically developing low-carbon foods. According to Bai et al. [10], agriculture contributes to climate change by increasing GHG emissions, and climate change, in turn, affects agricultural production.
The LCD is challenging to study because it is still rarely measured, especially in terms of determining influential indicators. Therefore, so far, many studies have only discussed sustainable development. Thus, some studies were developed by Mapar et al. [11] Lemke and Karola [12], Pineda and Jose [13], Salvati and Carlucci [14]. The index measurement method is more directed at sustainable development: The authors did not find any studies on LCD indexes that support food security. The LCD at the national level is very newly implemented in Indonesia, so it can be used as input for implementation at the regional level. Given this gap, there is an urgent need to develop a simple composite index method that can be easily implemented to assess the state of low-carbon development levels in the region. This paper attempts to fill this gap by developing a simple low-carbon development composite index that accommodates not only the economic, social, and environmental dimensions, but also adds a low-carbon dimension.
This paper is different from the measurement of previous sustainable development indicators in Indonesia, such as Rahma et al. [15], the indicators used are six performance indicators of regional development, such as economic growth rate (EGR), open unemployment rate (UNP), poverty rate (POV), human development index (HDI), Gini index (GI), and environmental quality index (EQI). The measurement method is used with eight indicators. Furthermore, the TOPSIS approach is added, and an integrated index is developed. In addition, it discusses the distribution based on the large islands in Indonesia.
2. Materials and Methods
This study uses secondary data from the five-year period of 2014–2018. The study was conducted in 34 provinces in Indonesia. The data were obtained from the Central Bureau of Statistics/BPS, Ministry of Agriculture, BAPPENAS, the Ministry of Finance, the Ministry of Environment and Forestry, and the Ministry of Energy and Mineral Resources. The LCD index (LCDI) is built using four dimensions with eight indicators: (1) the economic dimension with the indicators of gross domestic product growth (GDPG), unemployment rate (UNR), and wetland area (WLA), (2) the social dimension with the indicators of human development index (HDI) and Gini index (GI), (3) the environmental dimension with the indicators of environmental quality index (EQI) and unpolluted village (UPV), and (4) the low carbon dimension with the indicator of greenhouse gas emissions (GGE). The indicators formed by the index are HDI, GI, and EQI, and other indicators are normalized first.
Each indicator is normalized according to the following equations [16]. Indicators of positive influence such as and are normalized using Equations (1) and (2).
Indicators of negative influence such as , , and are normalized using Equations (3)–(5):
where and is a normalized indicator of a positive influence on the . is a normalized indicator of a negative influence on . In this study, the data normalization method used is the min–max method, and then it is multiplied by 100 to facilitate interpretation.
Calculation of the using the composite method is carried out with five types of measurements:
- (1)
- Arithmetic using the arithmetic linear average of the eight indicators;
- (2)
- Geometric , which is the geometric mean of the eight indicators using Equation (6):
- (3)
- Entropy using factor weighting using Shannon entropy, which is the best method for weighting specific criteria and is one of the methods of multiple criteria decision making . Shannon entropy is a well-known uncertainty measurement theory, which can use probability distribution effectively to measure uncertainty. It has been widely used in many fields, such as the contrast between trade-offs in social conflict analysis. The Shannon entropy method is objective because it is based on mathematical calculations [17].
Some researchers, such as Naidu et al. [18], Wu et al. [19], and Karagiannis and Karagiannis [20], used Shannon entropy in their research. The weighting procedure is carried out by determining the value of first and then determining the value of . with Equation (7):
where m = number of samples to calculate the entropy value with Equation (8):
- (4)
- TOPSIS LCDI (LCDI-T). This research is a multi-criteria decision making (MCDM). Problems with various criteria can be solved using the technique for order preference by similarity to ideal solution (TOPSIS) method, which involves choosing the alternative that is closest to the ideal solution. It is a ranking method that attempts to choose alternatives that simultaneously have the shortest distance from the positive ideal solution and the farthest distance from the negative ideal solution. Calculations for the TOPSIS method of decision making are carried out using Sanna software in the analysis process. Compared with other multi-criteria decision analysis methods, TOPSIS has some advantages, such as the most adequate use of raw data information and no strict restrictions on the number of indicators. Due to its practicability and scientific nature, TOPSIS has been verified and applied by experts in many fields. Unfortunately, only a handful of experts have applied TOPSIS to assess emergency plans and generate decision support options.
TSIS makes full use of the attribute information and provides a cardinal ranking of the alternatives. Therefore, we tried to apply TOPSIS to calculate the relative closeness of the ideal solution as conducted in Long et al. [21].
TOPSIS can be summarized in the following steps by Conejero et al. [22]:
- Normalize and weight the columns of , obtaining the normalized matrix , whose element is defined by (10):
- Find the ideal, , and anti-ideal solutions using Equation (11):
- Find the distances between each alternative and the ideal and anti-ideal solutions using Equation (12):
- Compute the score ranking for each alternative using Equation (13):
- Sort the alternatives according to the scores .
- (5)
- The integrated is a method that takes into account the integrated index or a combination of the total score calculation TOPSIS method with Shannon entropy developed by Yang et al. [23]. This method has been carried out by several researchers such as Chen [24], Choi [25], and Xu et al. [26]. is defined as follows:
The advantages of this method are more prominent when there are more indicators of the evaluation object, and the nature of each indicator is quite different. In summary, this integrated assessment method can provide a targeted reference or guidance for emergency control decision-makers.
The calculation results of each . method produce a score of 0–100 so that to make it easier to compare each , the value of each . is divided by 100 first and produces a score of 0–1. Based on the comparison results of , , , , and , the best value of . for each province is obtained. Figure 1 depicts the stages of preparing the using the five measurement methods.
3. Results and Discussion
3.1. Indicators on the LCDI
Figure 2 presents the average scores on the eight indicators that contribute to the LCDI of each province. All indicators are calibrated in a positive index. The provinces with the lowest average GDPG values for the 2014–2018 period are East Kalimantan Province (21.53), Riau Province (24.74), and Aceh Province (26.85). The GDPG value of East Kalimantan Province in 2015 experienced a very sharp decline from the previous year of 11.10 points, which is the impact of the decline in the GDPG rate of −1.20 percent. In 2016, growth was still negative at −0.38 percent. This is because, in East Kalimantan Province, the main economic activity is still extractive (utilizing natural resources directly), and it is still dominated by the mining sector, while the contribution of the agricultural sector is only around 8 percent. The province with the highest GDPG, Central Sulawesi Province (50.49) with an average GDPG rate of 6.28 percent, experienced a sharp increase of 15.5 percent in 2015. This is supported by the use of abundant natural resources in Central Sulawesi Province, which is a center for processing agricultural products and for plantations and fisheries.
The lowest UNR scores are held by the Province of Bali (3.64), West Sulawesi Province (17.52), and East Nusa Tenggara Province (20.77). The unemployment rate in the province of Bali is inseparable from the factor of low job opportunities in the community. The low population aged 15 years and over working is due to reduced employment opportunities and the low quality of human resources so that the residents are unable to work and are unable to create jobs or enter professions. The highest UNR score is held by Banten Province (84.06). This is due to uneven development in all districts/cities in Banten Province. Development is still concentrated in industrial areas, while other areas are far behind. The group of workers from outside Banten Province is higher, so job opportunities for local residents are competitive. Manpower for industry in Banten does not absorb much of the existing human resources.
One of the sources of emission from the agricultural sector is cultivation activities, specifically rice cultivation activities, which contribute to the increase in GHG emissions in the form of CH4 and N2O gases. The area of rice fields is one indicator that affects low-carbon development. The area of the fields has a direct impact on rice production, while the impact that occurs if low-carbon development is not implemented is that the emissions generated also have an impact on decreasing agricultural production. Emission reduction also considers the development sector, especially the agricultural sector. The main target is food production and maintaining food security. In food production and maintaining food security, the most important thing is the availability of agricultural land. The area of paddy fields plays a role in GGE, a source of methane gas from cultivation. Lowland rice is produced because anaerobic conditions occur in paddy fields due to waterlogging that is too high and long. The area of rice fields in Indonesia for the 2014–2018 period averaged 7.93 million hectares, which is thought to have contributed about 14% of the global total methane by IPCC [27]. If total methane is assumed to be directly proportional to total rice production, every effort to increase rice production must be paid for by environmental damage in the form of increased methane emissions. Based on Figure 2, East Java Province has the lowest GGE value of 12.23 percent and the highest rice field area, so the province’s impact on low-carbon development is also quite large. This requires government attention, especially with regard to increasing food security as well as reducing low-carbon emissions. The highest GGE value is in the Riau Islands Province.
Low carbon agriculture by using innovations such as the use of low-emission rice varieties is expected to be used in mitigation and adaptation efforts in the agricultural sector while producing high rice production. Several high yielding rice varieties have low GGE capacity, which is influenced by plant morphology and physiology, plant root system, and GGE oxidizing capacity, among others, as found by Setyanto et al. [28]. These varieties are the Maros varieties 73.9 kg CH4/Ha/season, Way Rarem 91.6 kg CH4/Ha/season, Limboto 99.2 kg CH4/Ha/season, Ciherang 114.8 kg CH4/Ha/season, and IR 64 of 202.3 kg CH4/Ha/season. Farmers in Indonesia mostly use the Ciherang variety, because it is more resistant to pests and diseases. The Ciherang variety also emits less CH4 gas, but the use of existing varieties has no significant effect on reducing GGE.
The lowest HDI value is still dominated by the eastern region, namely Papua Province (58.24), West Papua Province (62.39), and East Nusa Tenggara Province (63.24). The development of the HDI value of Papua Province shows an increase of 1.43 percent every year. Although it is still low, the quality of the population can also be seen from the average school enrolment rate (APS), which is 81.41 percent for the ages 7–12 years for the 2014–2018 period, 78.83 percent for the ages of 13–15 years, and 23.34 percent for the ages of 16–18 years. Thus, the APS is still far from the Government’s target of 100 percent compulsory education. The average life expectancy (AHH) for Papua is 65.11, the average length of schooling (HLS) is 10.29, the average length of schooling (RLS) is 6.14, and the per capita expenditure is Rp. 6.74 million per year. While the highest HDI value is DKI Jakarta Province for the 2014–2018 period, with an average of 79, an average AHH of 72.4, an HLS of 12.8, a RLS of 11, and an average per capita expenditure of Rp. 17.46 million per year.
In contrast to economic and social dimensions, environmental dimensions are often shown in a different direction. Based on the calculation of Figure 2, the lowest EQI values for the 2014–2018 period were held by Java, such as DKI Jakarta Province (40.07), DIY Province (52.93), and Banten Province (53.52). This is inversely proportional to the HDI value where DKI Jakarta Province occupies the highest position: the GRDP value is also high. This is due to the low land coverage area (IKTL) in DKI Jakarta Province for the period 2014–2018, which is on average 31.81. The province has an air quality index (IKU) of 60.31 and a water quality index (IKA) of 30.85. While the highest EQI value is outside Java in West Papua Province (85.41) with a high land coverage area of 86.02, a water quality of 93.39, and a water quality of 77.41. Papua Province, West Papua Province and eastern Indonesia have the highest UPV Index (IUPV). This is because they are influenced by geographical conditions, population density, economic activity, and better conservation management, so that the pollution of water, air, and soil is not too bad. Meanwhile, the lowest IUPV value was in DI Yogyakarta (7.73) and Riau (15.47). In the DI Yogyakarta area, the most pollution that occurred in 2018 was water pollution, as this pollution occurred in 99 villages. The exploitation of nature and the waste that is produced also increased. Most of Java Island water quality is polluted due to high human activities, so it is expected that the highest EQI and IUPV values are in Papua.
Based on the calculation of GGE Index (IGGE) in the agricultural sector comes from carbon dioxide (CO2), methane (CH4), nitrous oxide (N2O) from the rice cultivation process, N2O from managed soils, Urea, liming, biomass burning, and livestock. The lowest IGGE values in the agricultural sector were Banten Province (44.42), East Java Province (67.79), and Central Java Province (80.01) (Figure 2). Meanwhile, the highest score was in DKI Jakarta Province. The problem is caused by the management of paddy fields, livestock, and the excessive use of urea fertilizer. GGE is caused by fertilization activities and irrigation. Fertilizing activities are included in the group of rice production activities that cause emissions due to the use of chemical fertilizers in maintenance activities. Irrigation activities are included in the group of rice production activities that cause emissions due to the use of water pumping machines, so that the exhaust gas comes from burning fossil fuels and the inundation process itself. Under flooded conditions, CH4 gas emissions were higher than in dry conditions. Continuous flooding of rice fields is usually undertaken by farmers but rice plants do not always need water in stagnant conditions during the growth process. Thus, efforts to reduce the amount of CH4 gas emissions from irrigation systems in addition to reducing CH4 gas emissions can prevent excessive water use.
Efforts to reduce GHG emissions in the agricultural sector through increasing the application of organic fertilizers have several potential problems, such as the ability to reduce GHG emissions and decrease production capacity. Organic farming methods can indeed produce much lower nitrous oxide and carbon dioxide emissions per unit of planted area, as shown by Norse [29]. China’s policy for low-carbon agricultural development is to reduce the use of excessive N fertilizers by about 30–50 percent in rice plants, because N fertilizers can be harmful from a food safety perspective, increasing pests and diseases that attack crops, then replace it with organic fertilizer and green manure. Farmers are generally very familiar with the use of inorganic fertilizers. The use of organic fertilizers in Indonesia is still very low at 7.88 percent. Organic farming also has a higher soil carbon sequestration ability than non-organic agriculture. However, crop productivity per unit area of organic farming is lower than conventional farming. In other words, the consequences of LCD on reducing emissions that occur are not sufficient to compensate for the increase in rice production, so new breakthroughs are needed in increasing rice productivity, good nutrition in terms of food safety, because production is abundant, but the rice does not have quality in terms of nutrition. In addition, it is not good for consumption and dangerous in terms of health, so that there needs to be the best policies and actions to accommodate all dimensions that support low-carbon development and food security.
3.2. LCDI from a Provincial Perspective
Based on Table 1, calculations using indicators in each dimension obtained LCDI values for 34 provinces in Indonesia using four different methods: arithmetic mean (average value of indicators), geometric mean, the Shannon entropy method, and the TOPSIS method. Then, the integrated LCDI value is calculated. Provinces with higher LCDI rankings and that tend to be stable in using different methods are Papua Province, Bali Province, and West Sulawesi Province. Meanwhile, the provinces with the lowest LCDI rankings are West Java Province, Banten Province, and Riau Province.
The results of calculations using arithmetic and geometric methods are quite significant differences in ranking compared to other methods that use weighting such as entropy and TOPSIS (Table 1). Figure 3 illustrates that the difference between LCDI-G and LCDI-A for several provinces is wider than for other provinces, such as Maluku, Banten, Yogyakarta, and Riau Provinces. The average LCDI-G score in 34 provinces is lower than the LCDI-A score. The arithmetic mean has some disadvantages to summarize a set of data. For example, it can be biased by one or more extremely small or large values, it is not suitable for time series data, and it works only when all values are equally important. Moreover, taking the arithmetic of a set of data that involves percentages often fails. In conclusion, the arithmetic mean is a helpful measure, but we also need to consider situations that are not helpful. The main advantages of the geometric mean that the calculation is based on all the terms of the sequence, it is suitable for further mathematical analysis, and fluctuation in sampling will not affect the geometric mean. One of the main drawbacks of the geometric mean is that if any one of the observations is negative, then the geometric mean value will be imaginary despite the quantity of the other observations.
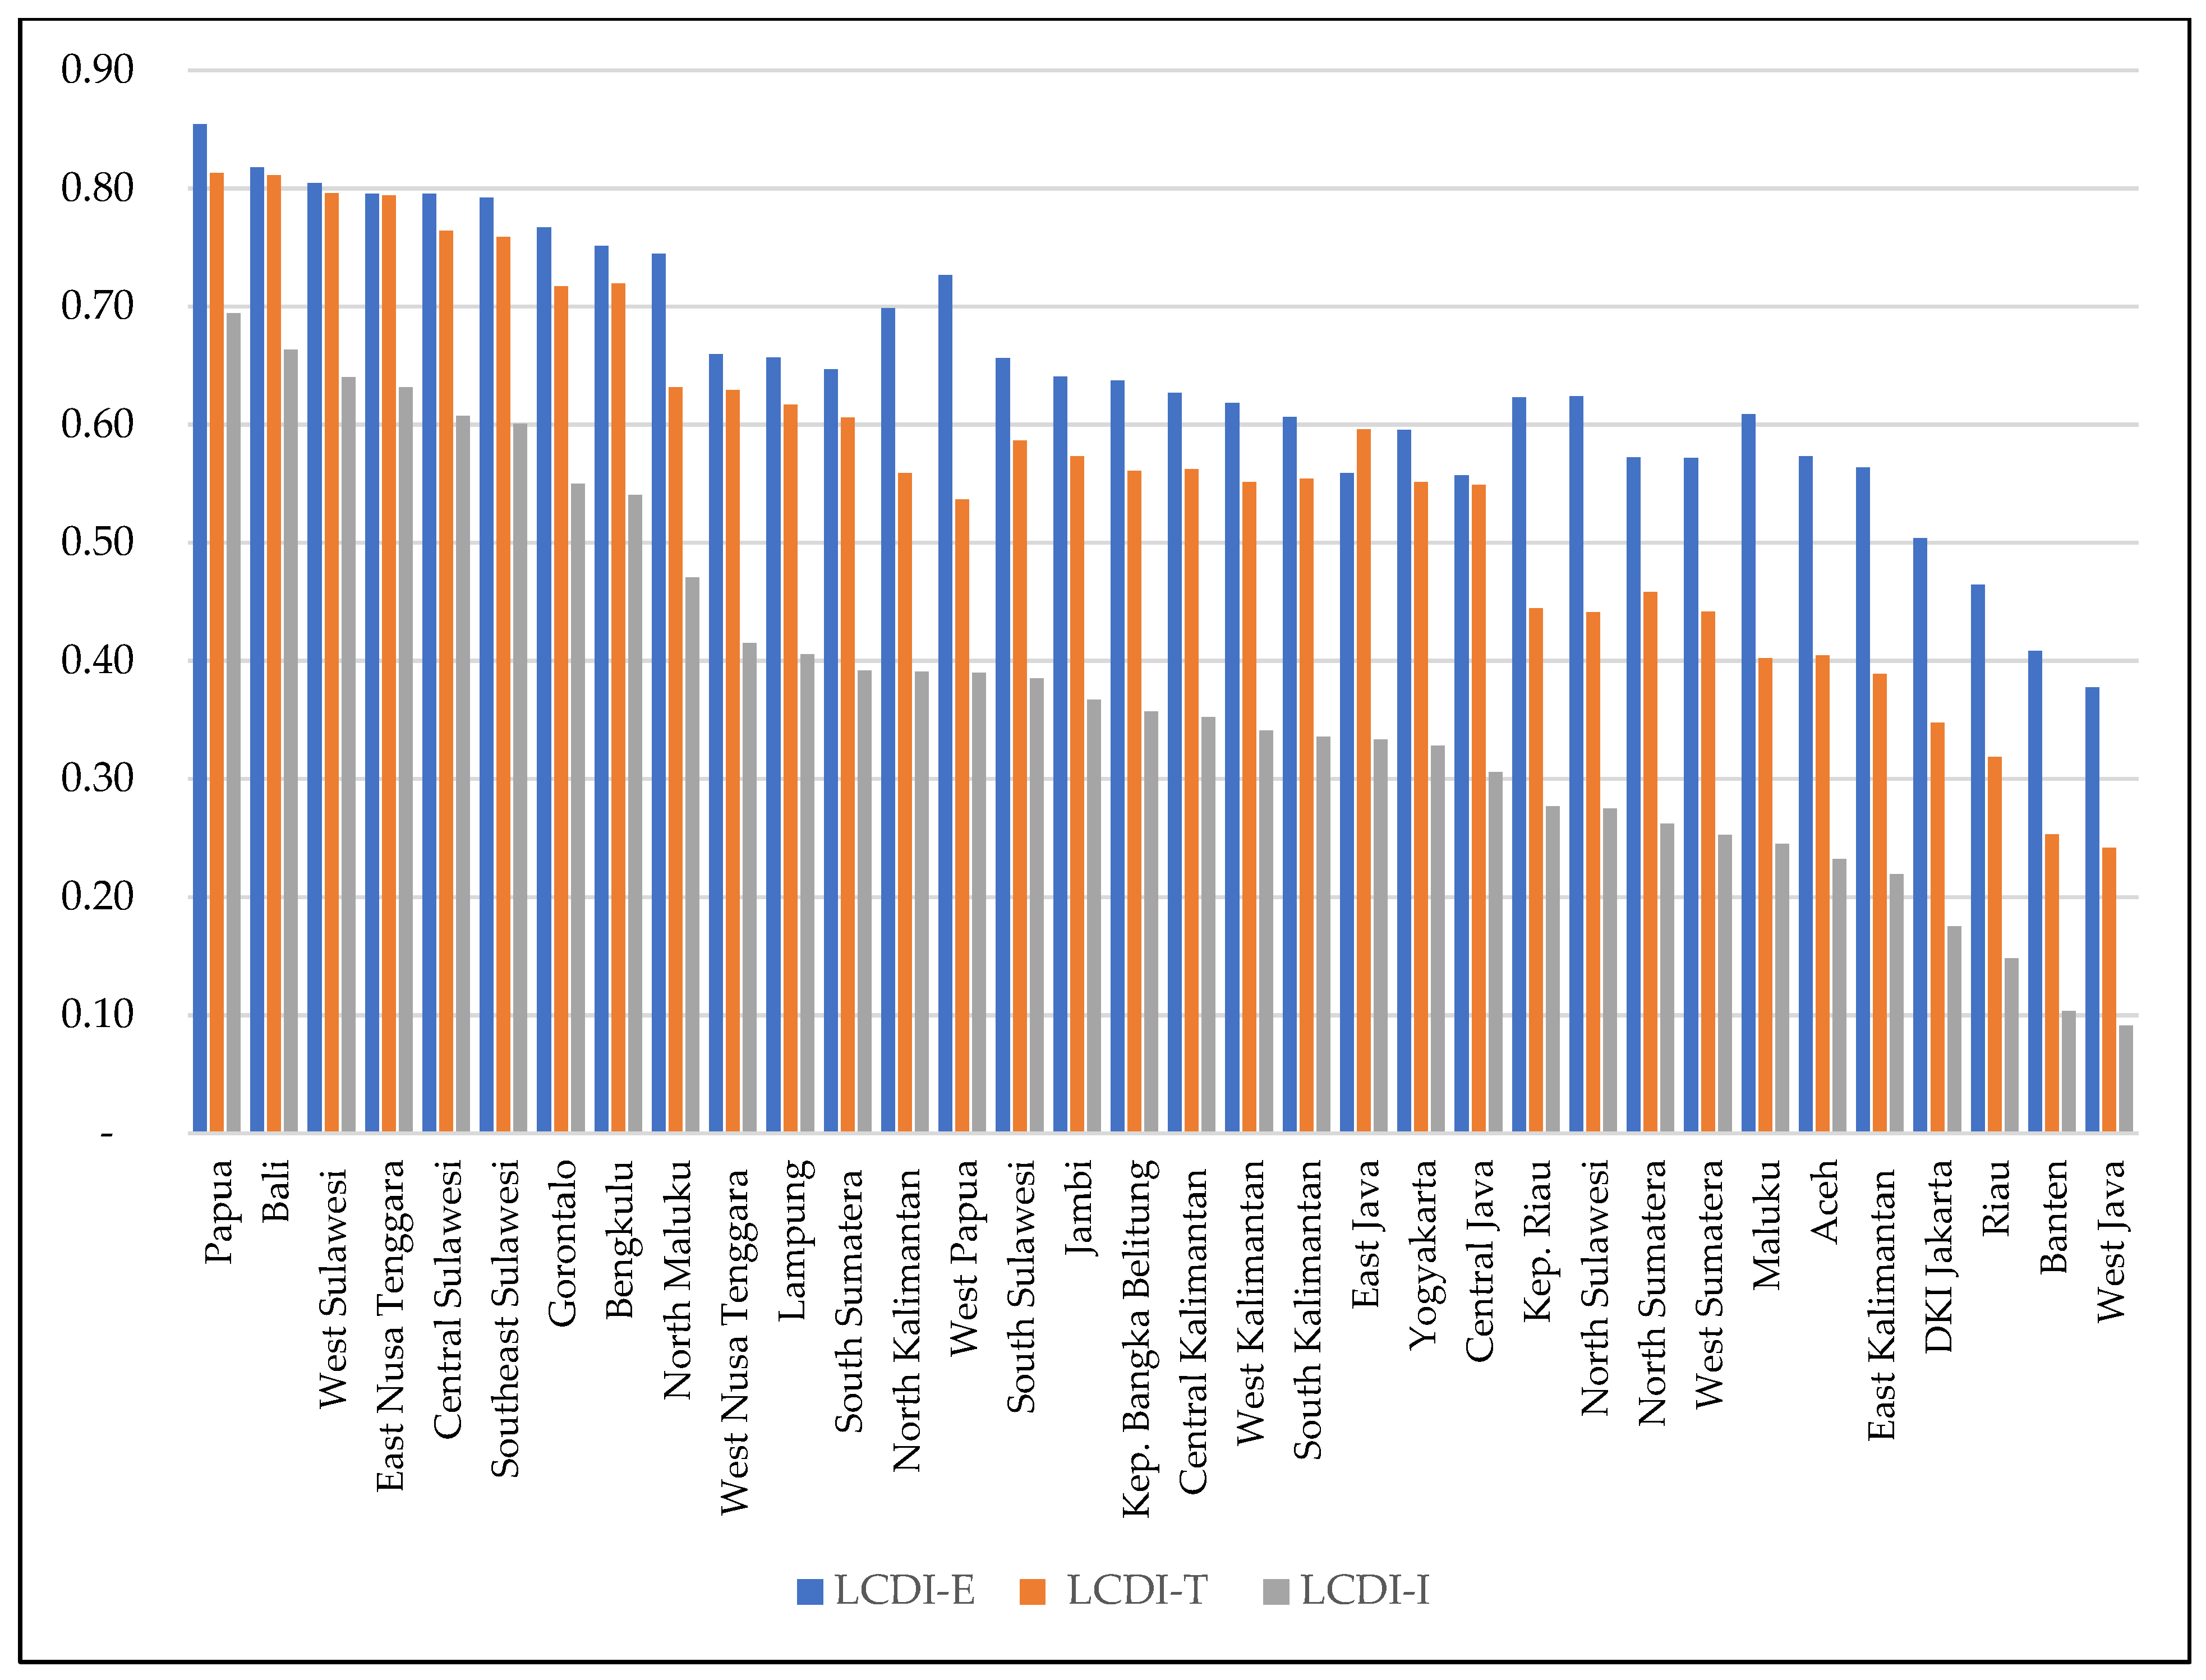
Figure 4 shows how close the various LCDI calculation methods are. In general, all calculation methods show the consistency and accuracy of LCDI measures in most provinces in Indonesia. The LCDI-I of the four methods has a smaller index value than those of the other methods, but it does not change the ranking position of the 34 provinces. Some food surplus provinces, such as West Java, Banten, and Riau, in the calculation with entropy weighting, are below the LCDI-G and LCDI-A and other provinces linearly are higher than other methods. For Papua Province, Bali Province, and most of Sulawesi Island, the LCDI-E and LCDI-T values are higher than the LCDI-I values and other methods. This shows that the effect of weighting on each indicator is very important to the assessment that is determined through the opinion of the decision maker. Moreover, the LCDI-T includes the entropy approach with the aim of providing an alternative to the scoring process. The value of LCDI-I is on the radar. This shows that the implementation of LCDI-I is very important to be carried out in every province, especially in the provinces of West Java, Riau, and Central Java. The pattern of each method is almost similar to each other where the highest score is in Papua Province, while the lowest is in West Java Province.
The calculation results show that the provincial ranking on the LCDI-T is almost the same as the LCDI-I, although with different index values. This shows that the LCDI-T plays an important role in determining the ranking of the LCDI-I. Each indicator plays a very similar role, and decision makers should focus on the magnitude and change in the indicator. The advantages of the integrated assessment method become more pronounced when the evaluation objects have more internal indicators and when the internal inequality among the total indicators is high. The integrated assessment method can also provide decision makers with more targeted decision-making references according to the identified major driving factors.
Figure 5 present the LCDI- I value in 34 provinces is in the range of 0.0911 to 0.6942. Fifteen provinces are above the national average of 0.3757. The rest are still below the average LCDI calculation. The highest scores were in Papua Province (0.6942), Bali Province (0.6632), and West Sulawesi Province (0.6400), while the lowest scores were in West Java Province (0.0911), Banten Province (0.1033), and Riau Province (0.1478). In general, it can be said that the use of ranking with the calculation method of the Shannon entropy method and the TOPSIS method is closer to integrated ranking. This shows the importance of using weights in the calculation of the composite index compared to without using weights. The use of weights can overcome the gap between indicators that contribute to low-carbon development.
The highest LCDI value is almost a third of the number of provinces in Indonesia located outside Java. This is because the highest indicator scores outside Java are mostly on the environmental dimensions (EQI and IUPV) and low carbon dimensions (IEEG) compared to Java. The influencing factor is the area of land cover. The green area outside Java is still high, while in the economic dimension, economic growth outside Java, especially in Sulawesi, is higher than Java even though economic activity is more advanced in Java. Judging from agricultural development and land area, rice as a contributor to carbon emissions is dominated in Java by 50.28 percent and the rest is outside Java. The big difference is seen from the side of rice production where the island of Java contributes 54.99 percent of the rice production in Indonesia. This is in stark contrast to the area of Java which is only 6.75 percent of the total area in Indonesia, while outside Java, it is 93.26 percent. The population in Java is very large (56.25 percent of the total population of Indonesia). The average population density of Java is 3.518 people/km2, while outside Java Island it averages 119.22 inhabitants/km2 compared to Papua with a population density of only 10.25 inhabitants/km2. Thus, it is not surprising that the LCDI value in Java is almost in the lowest position. This is in line with the results of the calculations that show that the GGE contributor to the rice agricultural sector is influenced by the area of the harvest.
3.3. LCDI from an Island Perspective
Figure 6 shows that the highest IGDP is on the island of Sulawesi with an average value of 72.42 compared to other islands. This can be seen in the value of GDP growth in 2014–2018 for Sulawesi Island, which is an average of 7.07 percent, but the contribution of Sulawesi Island to Indonesia is only around 6.28 percent. Compared to Java-Bali Island, which almost dominates the contribution of Indonesia’s economic growth at around 58.29 percent, the GDPG is 59.62 with an average GDPG of 5.62 percent in 2014–2018. Inequality of development in Indonesia can be seen where the development of infrastructure, education, and facilities is more advanced and health is given higher priority on the island of Java. The HDI is a very important indicator to see the quality of development outcomes in Indonesia. The island of Java-Bali has the highest average HDI value in 2014–2018 of 73.14. A high HDI value indicates the success of economic development in Java-Bali. Papua Island has the lowest HDI of 60.32 even though natural resources in the eastern region are very large, so they should be able to compete to increase HDI with other provinces.
The highest EQI value is on the island of Papua, on average 83.54 in 2014–2018, while the lowest is on the island of Java-Bali on average 55.78. This is inversely proportional to the HDI value where the western region dominates. The EQI is influenced by population density, land availability, and environmental damage such as pollution, sanitation, and land cover. The higher the population density and the area of land used, the lower the environmental quality. The increasing demand for land along with human activities causes shrinkage and environmental quality is threatened. Another environment dimension that is extremely influential is IUPV, seen in the fact that the islands of Borneo and Java-Bali have the lowest values, respectively, by 44.74 and 47.81. This is due to the contamination of rivers in Kalimantan due to mining activities, large-scale land clearing, and lifestyle habits that tend to dump domestic waste into rivers. On the island of Java-Bali, the increasing population causes human activities that cause pollution to increase, such as the disposal of household and industrial waste. On the other hand, the highest IUPV value is in Papua Island at 99.70. This is clearly seen by the green environmental conditions and lower level of human activities so that environmental pollution is minimal. In addition, judging from the highest IGGE on Papua Island, it is 98.68. Thus, it can be seen that the almost 80 percent of the land cover area that still dominates the area has a crucial role in mitigating the impact of greenhouse gas emissions. In addition, biodiversity is still high.
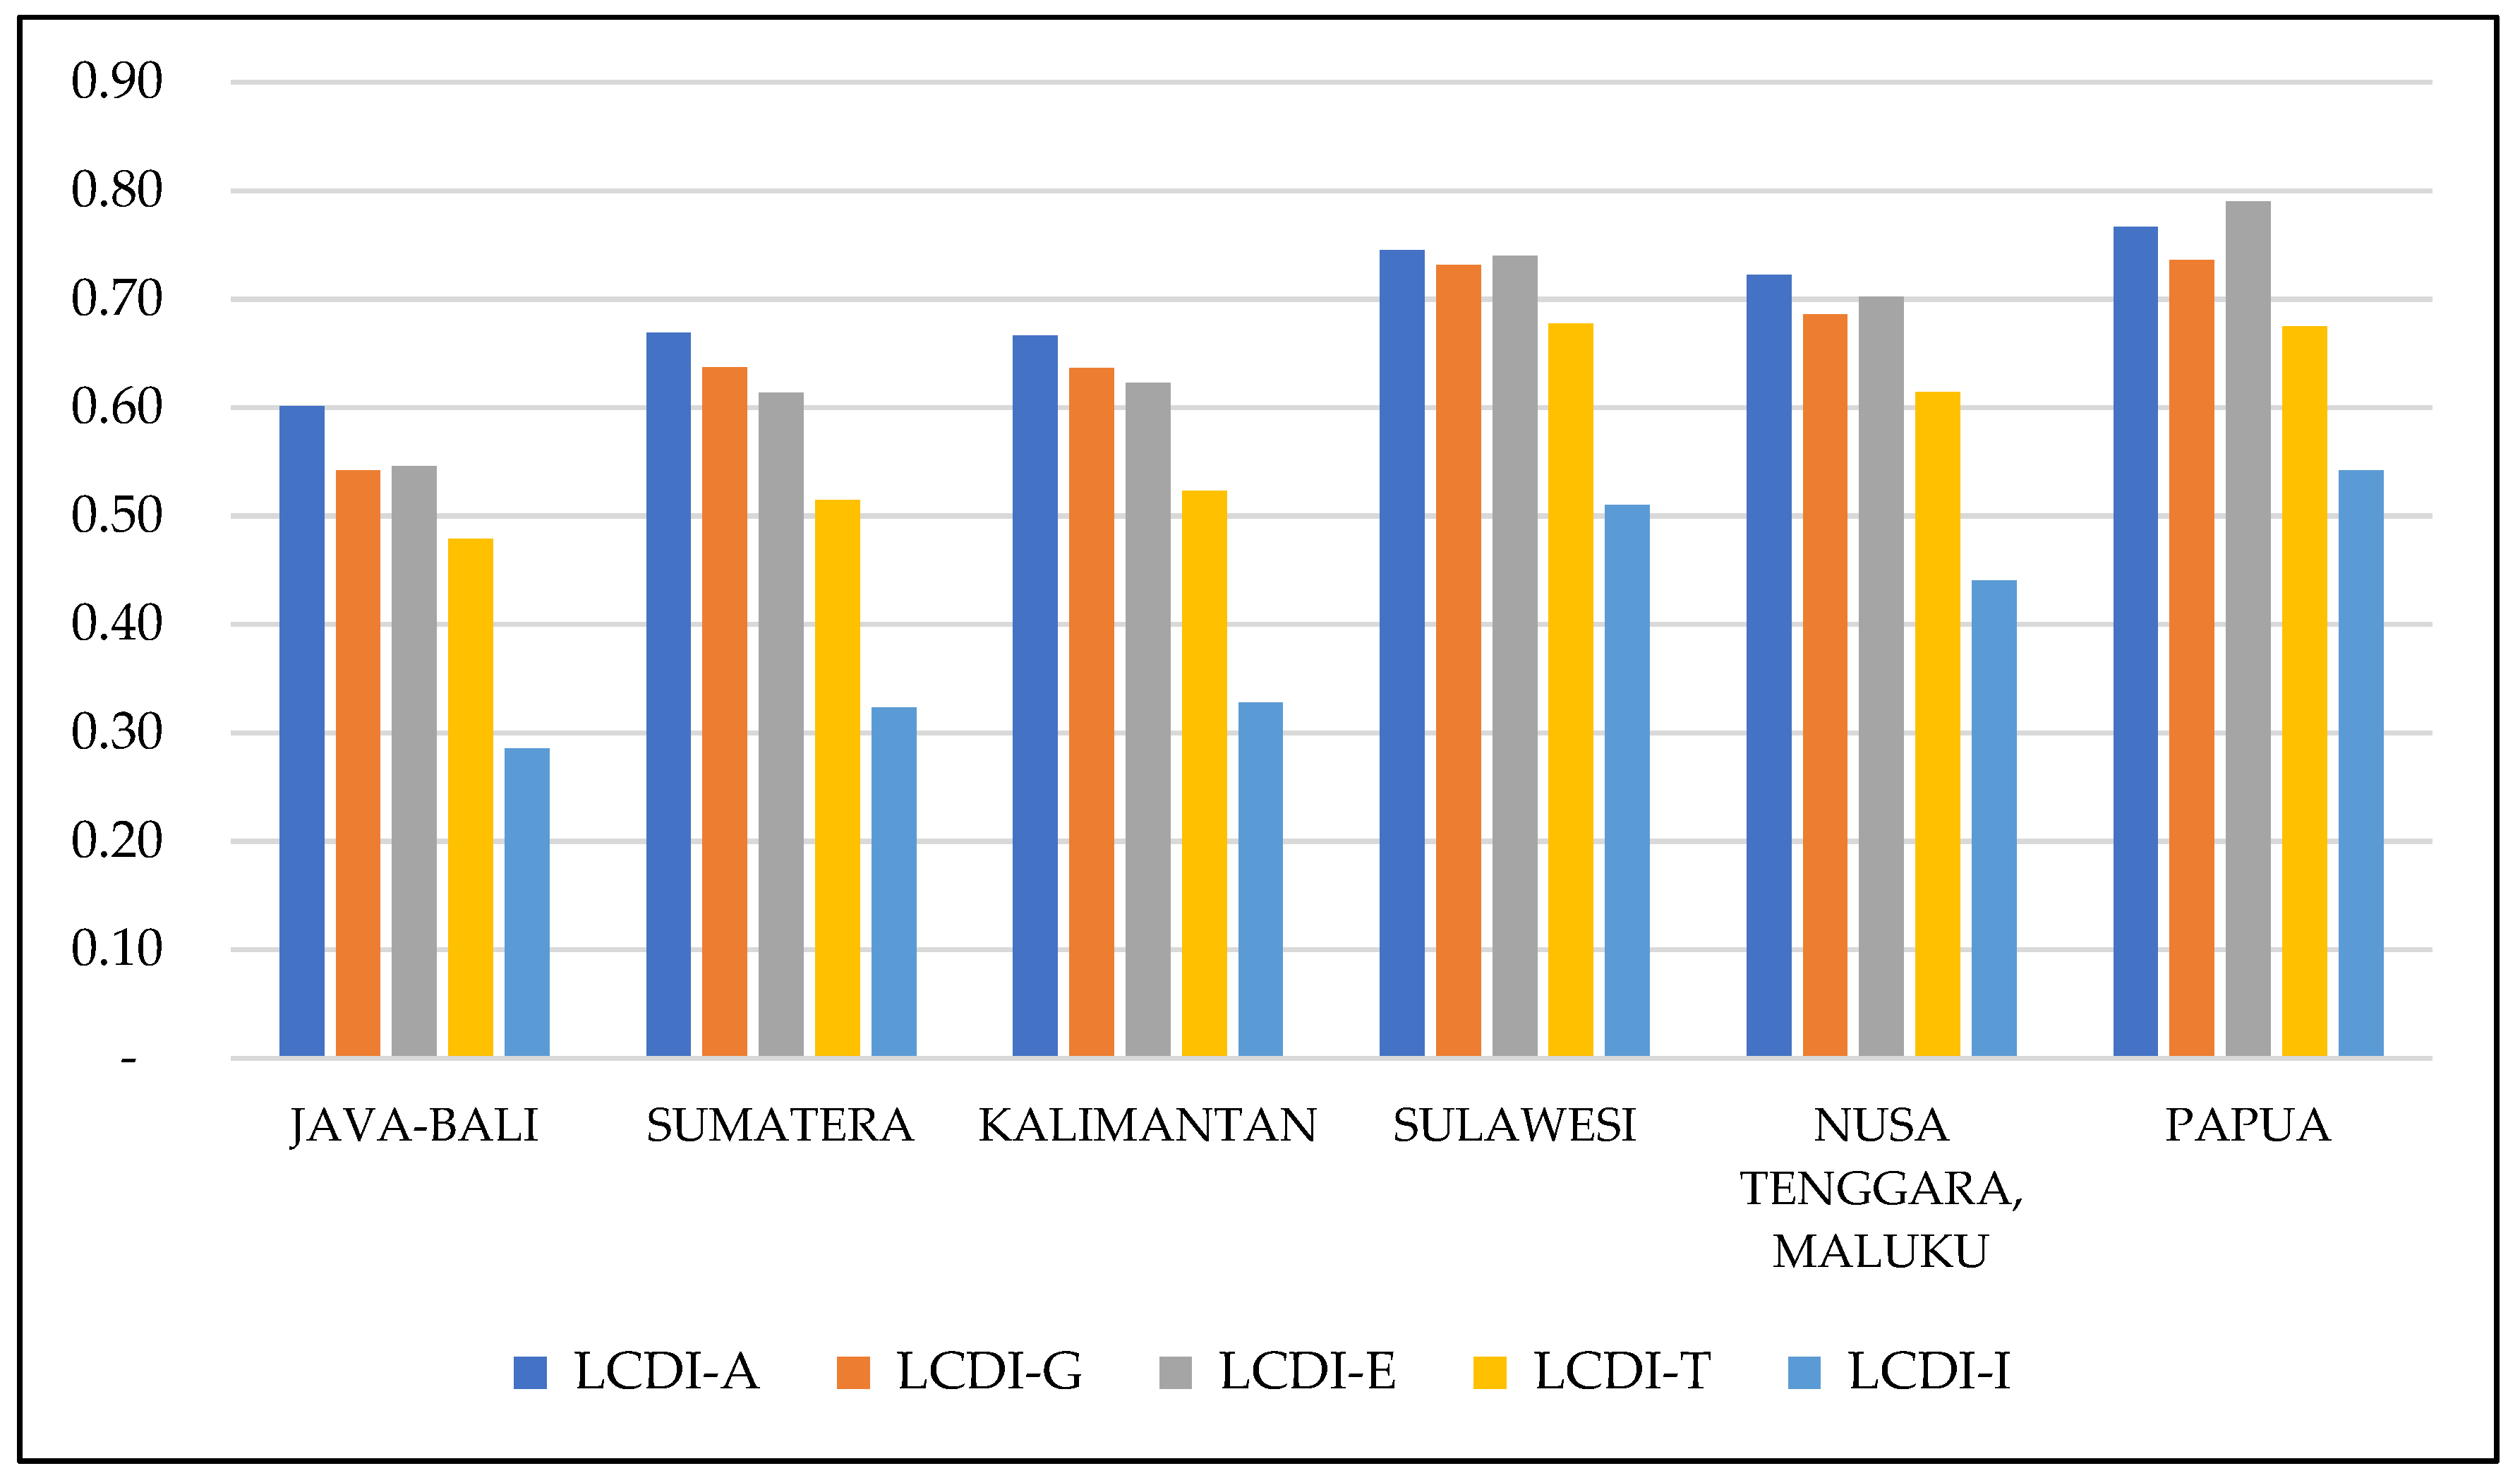
Figure 7 shows that Papua Island dominates the top ranking of the LCDI with various measurement methods compared to other islands in Indonesia with an average of 0.74, while the LCDI-E is the highest at 0.79. In contrast, the smallest island of Java-Bali averaged 0.54. On the calculation of the lowest LCD-I on the island of Java-Bali of 0.28, it is clear that Java Island with a high population density, limited land area, and food barns other than suppliers of agricultural production, also indirectly contributes to carbon emissions. While the highest is Papua Island at 0.54. Papua Island with a high land cover of about 33 million ha is very helpful in reducing carbon emissions in Indonesia and must have a strong commitment from the local government along with policies that support LCD. Sulawesi Island has an average LCDI-E value of 0.74. This is clearly because Sulawesi is still the pillar of development in the eastern region. It is not only advanced in terms of economic development, but the province also pays attention to environmental conservation and reduces the impact of greenhouse gas emissions. The participation of local governments is crucial in achieving emission reduction targets.
For LCDI-E, LCDI-G, and LCDI-I, Java-Bali Island has values that are almost close and the lowest conical compared to other values, in contrast to Papua Island which has the highest upward conical value for the LCDI-A, the LCDI-G method, and LCDI-E. The pattern of the five methods is almost the same: the only difference is the number. It is clear that this method is accurate and consistent when used and it is in accordance with the conditions in Indonesia.
The results of this analysis have profound implications for LCD in Indonesia. First, low-carbon development must take into account all dimensions, not only environmental and low-carbon dimensions, but also economic and social ones. The assessment only of each dimension without considering other dimensions means the results will be biased. The typology between islands is also different. Thus, so far, for the economic dimension seen from GDP, which is dominated by the islands of Java and Sumatera, the indicator for the area of paddy fields is also mostly dominated in Java, Sumatera, and Sulawesi, but for Papua Island, the area is smaller when compared to Java, only around 1.05 percent with a production of 0.76 percent. Rice productivity in Papua Island is also below the national average of 37.36 Ku/Ha. The commodity with the highest production in Papua is sweet potato at around 318,399 tons/year, which is also the staple food of Papua Island. Rice plants are in second place, so the Government must also be concerned about the topography on Papua Island, which varies from sloping land to dry land and to hills/mountains. For sweet potato plants, there is no specific method for calculating carbon emissions. This should also be considered for further research. On the social dimension, the HDI value in Papua Island is the lowest compared to the national level. It is inversely proportional to EQI, IUPV, and IEEG, where Papua Island is the highest and Java Island is the lowest. Based on research, there are no provinces that meet all the best criteria. The closest is Sulawesi Island where rice production is high, and carbon emissions are also low but still on the national average. This clearly requires a LCD strategy and action that focuses and strengthens all dimensions, namely high economic growth, low carbon emissions, high agricultural productivity, low unemployment, quality human resources, and good environmental quality.
Second, the LCDI value in agricultural development describes the actual conditions so that indicators such as WLA Index (IWLA), EQI, and IEEG become one of the important indicators in low-carbon development, and of course, will have big consequences, especially for big provinces such as West Java, Central Java, and Java. East Java is the barometer of measuring the success of a national development. The island of Java, which is a food barn in Indonesia, is measured by measuring carbon emissions, which are the largest contributor to the agricultural sector. Commitment from the local government is crucial because the measurement of development is not only from the economic and social dimensions, but also needs to include environmental and low-carbon dimensions, so that the low-carbon development goals are achieved. The long-term impact that occurs if you ignore the environmental and low-carbon dimensions will ultimately affect the economy of a region. Therefore, a higher LCDI value is likely to achieve better low-carbon development and agricultural development than a lower LCDI. In addition, according to Law No. 16 of 2016, concerning the Ratification of the Paris Agreement to the United Nations Framework Convention on Climate Change as a commitment of Indonesia to undertake a strategy to reduce GGE, LCDI will provide policy alternatives for achieving low-carbon development in the agricultural sector on a regional scale.
4. Conclusions
Research using this composite index measurement has developed a LCDI that is very useful to be implemented at the provincial level. The measurement method is very simple using data available in the region, compared to the previous method which is more oriented towards sustainable development. This research is more focused on low-carbon development, which is a new paradigm and is the current policy direction of the Indonesian Government. The LCD minimizes the trade-off between economic development and environmental conservation. Influential indicators such as the environmental quality index, wetland areas, unpolluted villages, and low carbon emissions contribute to LCD. These indicators can be used as the basis for the success of a policy and the basis for the effectiveness of the achievement of reducing greenhouse gas emissions in Indonesia. The results of this study can be used as a reference for the central and local governments in planning low-carbon development interventions, evaluating target achievement, and monitoring the implementation of low-carbon development in the province. This is in line with Presidential Regulation No. 61 of 2011 concerning the National Action Plan for Reducing Greenhouse Gas Emissions (RAN-GRK), which emphasizes the importance of comparing indicators between provinces to see targets and achievements in implementing low-carbon development policies and assessing them through rankings between provinces.
The indexes in this study are related to food security, whenever the LCDI increases it will threaten food security. Highly volatile agriculture production in Indonesia demonstrates the risks that climate change poses to agriculture and food production. Productivity and environmental sustainability are no longer distinct objectives of the global food system. Several nations face food security challenges due to environmental and climatic fragility or constraints to natural resources. The results showed that provinces with low carbon emissions and a high environmental quality index, but low economic growth did not always occupy a high LCDI. The reverse was also true: provinces with high economic growth, high environmental quality, and high low carbon emissions were not always associated. Therefore, the low-carbon development index is always low. This research provides one piece of empirical evidence that balances between dimensions (economic, social, environmental, and low carbon), which is needed in LCD. Development that only focuses on one dimension will eventually be corrected by another dimension. This approach can be used as a systematic basis for LCD policy makers not only at the central level, but also as a comparison at the regional level with a method that is easy for all parties to implement. The advantage of calculating the composite index method that we developed is that it includes important indicators related to low-carbon development, especially those that support agricultural development. This is a novelty because no one has highlighted this problem yet. Low-carbon development is something that has just been implemented and budgeted for in Indonesia, although commitments related to low carbon reduction have been around for a long time. The calculations are based on the available data, so they do not capture the characteristics and topography between provinces, the main commodities of each province, natural conditions, commitments of the local government, and the role of the private sector. Thus, further research is needed.
The Government should find new superior varieties, because each region has different characteristics, both in terms of ecosystem conditions, resistance to pests, and the size of the harvest. The varieties produced not only contribute to low CH4 gas, but also increase rice production at least the same as the varieties grown by farmers, so that the expected food self-sufficiency is achieved.
Author Contributions
Conceptualization, D.S.A. and A.F.; Methodology, D.S.A. and A.F.; Data Analysis, D.S.A. and A.F.; Writing–review and editing, D.S.A. and A.F.; Supervision, A.F., B.J. and D.B.H.; Validation, A.F., B.J. and D.B.H.; Visualization, D.S.A., A.F., B.J. and D.B.H. All authors have read and agreed to the published version of the manuscript.
Funding
This research received no external funding.
Institutional Review Board Statement
Not applicable.
Informed Consent Statement
Not applicable.
Data Availability Statement
The source of all the data used in this study is provided in the manuscript.
Conflicts of Interest
The authors declare no conflict of interest.
References
- Fauzi, A. Ekonomi Sumber Daya Alam dan Lingkungan; PT Gramedia Pustaka Utama: Jakarta, Indonesia, 2004. [Google Scholar]
- OECD. Survey Ekonomi OECD Indonesia; OECD Publishing: Paris, France, 2015. [Google Scholar]
- Su, M.R.; Liang, C.; Chen, B.; Chen, S.Q.; Yang, Z.F. Low-carbon development patterns: Observations of typical Chinese cities. Energies 2012, 5, 291–304. [Google Scholar] [CrossRef] [Green Version]
- Economist Impact. Global Food Security Index 2021: Tenth Anniversary. Corteva Agriscience 2021. Available online: https://impact.economist.com/sustainability/project/food-security-index/Resources (accessed on 26 November 2021).
- Wang, Y.; Zeng, Y.; Zhou, J.; Zhang, W.; Liao, X.; Shi, B. An integrated cleaner beamhouse process for minimization of nitrogen pollution in leather manufacture. J. Clean. Prod. 2016, 112, 2–8. [Google Scholar] [CrossRef]
- Smith, P.; Martino, D.; Cai, Z.; Gwary, D.; Janzen, H.; Kumar, P.; McCarl, B.; Ogle, S.; O’Mara, F.; Rice, C.; et al. Agriculture in Climate Change 2007: Mitigation; Cambridge University Press: Cambridge, UK, 2007; pp. 498–540. [Google Scholar]
- Songling, M.; Ruihong, L. Evaluation on sustainable food security in Henan against the background of low-carbon. J. Agric. Agric. Sci. 2010, 1, 412–416. [Google Scholar]
- Shenggen, A.R. Achieving food security while switching to low carbon agriculture. J. Renew. Sustain. Energy 2014, 4, 041405. [Google Scholar]
- Xiaowei, Y.; Xing, J. Low-carbon economy and low-carbon food. Energy Procedia 2011, 5, 1099–1103. [Google Scholar] [CrossRef] [Green Version]
- Bai, Y.; Deng, X.; Jiang, S.; Zhao, Z.; Miao, Y. Relationship between climate change and low-carbon agricultural production: A case study in Hebei Province, China. Ecol. Indic. 2018, 105, 438–447. [Google Scholar] [CrossRef]
- Mahsa, M.; Javad, M.; Mansouri, N.; Arjmandi, R.; Azizinezhad, R.; Ramoss, T.B. A composite index for sustainability assessment of health, safety and environmental performance in municipalities of megacities. Sustain. Cities Soc. 2020, 60, 102164. [Google Scholar]
- Claudia, L.; Bastini, K. Embracing multiple perspectives of sustainable development in a composite measure: The Multilevel Sustainable Development Index. J. Clean. Prod. 2020, 246, 118884. [Google Scholar]
- Abraham, P.; Jose, A.C. Assessment of air quality in the Aburrá Valley (Colombia) using composite indices: Towards comprehensive sustainable development planning. Urban Clim. 2021, 39, 100942. [Google Scholar]
- Salvati, L.; Carlucci, M. A composite index of sustainable development at the local scale: Italy as a case study. Ecol. Indic. 2014, 43, 162–171. [Google Scholar] [CrossRef]
- Rahma, H.; Fauzi, A.; Juanda, B.; Widjojanto, B. Development of a composite measure of regional sustainable development in Indonesia. Sustainability 2019, 11, 5861. [Google Scholar] [CrossRef] [Green Version]
- OECD. Handbook on Constructing Composite Indicators, Methodology and User Guide; OECD: Paris, France, 2008. [Google Scholar]
- Shannon, C.E. A mathematical theory of communication. Bell Syst. Tech. J. 1948, 27, 379–423. [Google Scholar] [CrossRef] [Green Version]
- Naidu, M.S.; Kumar, R.; Chiranjeevi, K. Shannon and fuzzy entropy based evolutionary image thresholding for image segmentation. Alex. Eng. J. 2018, 57, 1643–1655. [Google Scholar] [CrossRef]
- Wu, S.; Fu, Y.; Shen, H.; Liu, F. Using ranked weights and Shannon entropy to modify regional sustainable society index. J. Sustain. Cities Soc. 2018, 41, 443–448. [Google Scholar] [CrossRef]
- Karagiannis, R.; Karagiannis, G. Constructing composite indicators with Shannon entropy: The case of human development index. J. Soc.-Econ. Plan. Sci. 2020, 70, 100701. [Google Scholar] [CrossRef]
- Long, Y.; Yang, Y.; Lei, X.; Tian, Y.; Li, Y. Integrated assessment method of emergency plan for sudden water pollution accidents based on improved TOPSIS, Shannon entropy and a coordinated development degree model. J. Sustain. 2019, 11, 510. [Google Scholar] [CrossRef] [Green Version]
- Conejero, J.M.; Preciado, J.C.; Prieto, A.E.; Bas, M.C.; Bolós, V.J. Applying data driven decision making to rank vocational and educational training programs with TOPSIS. Decis. Support Syst. 2021, 142, 113470. [Google Scholar] [CrossRef]
- Yang, W.C.; Xu, K.; Lian, J.J.; Ma, C.; Bin, L.L. Integrated flood vulnerability assessment approach based on TOPSIS and Shannon entropy methods. Ecol. Indic. 2018, 89, 269–280. [Google Scholar] [CrossRef]
- Chen, P. On the diversity-based weighting method for risk assessment and decision-making about natural hazards. Entropy 2019, 21, 269. [Google Scholar] [CrossRef] [Green Version]
- Choi, H. Assessment of aggregation frameworks for composite indicators in measuring flood vulnerability to climate change. Sci. Rep. 2019, 9, 19371. [Google Scholar] [CrossRef] [Green Version]
- Xu, H.; Ma, C.; Lian, J.; Xu, K.; Chaima, E. Urban flooding risk assessment based on an integrated k-means cluster algorithm and improved entropy weight method in the region of Haikou, China. J. Hydrol. 2018, 563, 22909. [Google Scholar] [CrossRef]
- IPCC. Climate Change 1992: The Supplementary Report to the Intergovernmental Panel on Climate Change (IPCC) Scientific Assessment; Houghton, J.T., Calendar, B.A., Varney, S.K., Eds.; Cambridge University Press: Cambridge, UK, 1992; p. 200. [Google Scholar]
- Setyanto, P.; Rosenani, A.B.; Boer, R.; Fauziah, C.I.; Khanif, M.J. The effect of rice cultivars on methane emission from irrigated rice field. Indones. J. Agric. Sci. 2016, 5, 20–31. [Google Scholar] [CrossRef] [Green Version]
- Norse, D. Low carbon agriculture: Objectives and policy pathways. J. Environ. Dev. 2012, 1, 25–39. [Google Scholar] [CrossRef]
Figure 1.
Flow chart of the LCDI.

Figure 2.
Indicators influencing the LCDI.

Figure 3.
Distribution of calculations for LCDI-A and LCDI-G.

Figure 4.
Comparison of LCDI-E, LCDI-T, and LCDI-I patterns.

Figure 5.
Map of the distribution of integrated LCDI values.

Figure 6.
Radar diagram of indicators affecting each island.

Figure 7.
LCDI grouping by island in Indonesia.


Table 1.
LCDI calculation results and ranking in 34 provinces.
| Province | Arithmetic Mean | Geometric Mean | Entropy | TOPSIS | Integrated | |||||
|---|---|---|---|---|---|---|---|---|---|---|
| LCDI-A | Rank | LCDI-G | Rank | LCDI-E | Rank | LCDI-T | Rank | LCDI-I | Rank | |
| Papua | 0.7931 | 1 | 0.7750 | 2 | 0.8542 | 1 | 0.8127 | 1 | 0.6942 | 1 |
| Bali | 0.7799 | 4 | 0.7656 | 4 | 0.8176 | 2 | 0.8111 | 2 | 0.6632 | 2 |
| West Sulawesi | 0.7810 | 3 | 0.7715 | 3 | 0.8042 | 3 | 0.7958 | 3 | 0.6400 | 3 |
| East Nusa Tenggara | 0.7565 | 8 | 0.7407 | 8 | 0.7954 | 4 | 0.7937 | 4 | 0.6313 | 4 |
| Central Sulawes | 0.7862 | 2 | 0.7803 | 1 | 0.7951 | 5 | 0.7638 | 5 | 0.6073 | 5 |
| Southeast Sulawesi | 0.7661 | 6 | 0.7592 | 5 | 0.7918 | 6 | 0.7588 | 6 | 0.6008 | 6 |
| Gorontalo | 0.7597 | 7 | 0.7487 | 7 | 0.7669 | 7 | 0.7170 | 8 | 0.5499 | 7 |
| Bengkulu | 0.7459 | 9 | 0.7344 | 9 | 0.7512 | 8 | 0.7195 | 7 | 0.5405 | 8 |
| North Maluku | 0.7669 | 5 | 0.7543 | 6 | 0.7446 | 9 | 0.6317 | 9 | 0.4704 | 9 |
| West Nusa Tenggara | 0.6578 | 20 | 0.6467 | 19 | 0.6596 | 12 | 0.6289 | 10 | 0.4148 | 10 |
| Lampung | 0.6821 | 17 | 0.6743 | 12 | 0.6568 | 13 | 0.6170 | 11 | 0.4052 | 11 |
| South Sumatera | 0.6651 | 19 | 0.6577 | 16 | 0.6467 | 15 | 0.6056 | 12 | 0.3917 | 12 |
| North Kalimantan | 0.7321 | 11 | 0.7177 | 10 | 0.6985 | 11 | 0.5590 | 18 | 0.3905 | 13 |
| West Papua | 0.7394 | 10 | 0.6971 | 11 | 0.7263 | 10 | 0.5367 | 23 | 0.3898 | 14 |
| South Sulawesi | 0.6745 | 18 | 0.6651 | 13 | 0.6564 | 14 | 0.5862 | 14 | 0.3848 | 15 |
| Jambi | 0.6868 | 16 | 0.6595 | 15 | 0.6404 | 16 | 0.5732 | 15 | 0.3670 | 16 |
| Kep. Bangka Belitung | 0.6906 | 15 | 0.6503 | 18 | 0.6371 | 17 | 0.5605 | 17 | 0.3571 | 17 |
| Central Kalimantan | 0.6536 | 24 | 0.6282 | 23 | 0.6266 | 18 | 0.5620 | 16 | 0.3521 | 18 |
| West Kalimantan | 0.6559 | 21 | 0.6319 | 21 | 0.6184 | 21 | 0.5512 | 20 | 0.3409 | 19 |
| South Kalimantan | 0.6493 | 25 | 0.6380 | 20 | 0.6061 | 23 | 0.5538 | 19 | 0.3357 | 20 |
| East Java | 0.5412 | 32 | 0.4870 | 32 | 0.5589 | 29 | 0.5961 | 13 | 0.3331 | 21 |
| Yogyakarta | 0.6556 | 22 | 0.5436 | 30 | 0.5954 | 24 | 0.5511 | 21 | 0.3281 | 22 |
| Central Java | 0.5732 | 31 | 0.5520 | 29 | 0.5569 | 30 | 0.5488 | 22 | 0.3057 | 23 |
| Kep. Riau | 0.7001 | 14 | 0.6570 | 17 | 0.6232 | 20 | 0.4443 | 25 | 0.2769 | 24 |
| North Sulawesi | 0.7034 | 13 | 0.6644 | 14 | 0.6238 | 19 | 0.4409 | 27 | 0.2750 | 25 |
| North Sumatera | 0.6396 | 29 | 0.6276 | 24 | 0.5721 | 26 | 0.4582 | 24 | 0.2621 | 26 |
| West Sumatera | 0.6543 | 23 | 0.6314 | 22 | 0.5715 | 27 | 0.4416 | 26 | 0.2524 | 27 |
| Maluku | 0.7075 | 12 | 0.6024 | 25 | 0.6087 | 22 | 0.4020 | 29 | 0.2447 | 28 |
| Aceh | 0.6445 | 26 | 0.5838 | 27 | 0.5729 | 25 | 0.4047 | 28 | 0.2318 | 29 |
| East Kalimantan | 0.6418 | 28 | 0.5662 | 28 | 0.5634 | 28 | 0.3888 | 30 | 0.2191 | 30 |
| DKI Jakarta | 0.6423 | 27 | 0.5915 | 26 | 0.5035 | 31 | 0.3475 | 31 | 0.1750 | 31 |
| Riau | 0.5777 | 30 | 0.4936 | 31 | 0.4642 | 32 | 0.3184 | 32 | 0.1478 | 32 |
| Banten | 0.5214 | 33 | 0.4144 | 34 | 0.4083 | 33 | 0.2529 | 33 | 0.1033 | 33 |
| West Java | 0.4937 | 34 | 0.4375 | 33 | 0.3776 | 34 | 0.2414 | 34 | 0.0911 | 34 |
Publisher’s Note: MDPI stays neutral with regard to jurisdictional claims in published maps and institutional affiliations. |
© 2021 by the authors. Licensee MDPI, Basel, Switzerland. This article is an open access article distributed under the terms and conditions of the Creative Commons Attribution (CC BY) license (https://creativecommons.org/licenses/by/4.0/).
Share and Cite
MDPI and ACS Style
Adetama, D.S.; Fauzi, A.; Juanda, B.; Hakim, D.B. Measurement of Composites Index on Low Carbon Development Supporting Food Security. Sustainability 2021, 13, 13352. https://0-doi-org.brum.beds.ac.uk/10.3390/su132313352
AMA Style
Adetama DS, Fauzi A, Juanda B, Hakim DB. Measurement of Composites Index on Low Carbon Development Supporting Food Security. Sustainability. 2021; 13(23):13352. https://0-doi-org.brum.beds.ac.uk/10.3390/su132313352
Chicago/Turabian StyleAdetama, Dwi Sartika, Akhmad Fauzi, Bambang Juanda, and Dedi Budiman Hakim. 2021. "Measurement of Composites Index on Low Carbon Development Supporting Food Security" Sustainability 13, no. 23: 13352. https://0-doi-org.brum.beds.ac.uk/10.3390/su132313352
Note that from the first issue of 2016, this journal uses article numbers instead of page numbers. See further details here.