
Could Government Data Openness Enhance Urban Innovation Capability? An Evaluation Based on Multistage DID Method


1
School of Management and Economics, University of Electronic Science and Technology of China, Chengdu 611731, China
2
School of Public Affairs and Administration, University of Electronic Science and Technology of China, Chengdu 611731, China
*
Author to whom correspondence should be addressed.
Sustainability 2021, 13(23), 13495; https://0-doi-org.brum.beds.ac.uk/10.3390/su132313495
Submission received: 6 November 2021
/
Revised: 3 December 2021
/
Accepted: 3 December 2021
/
Published: 6 December 2021
(This article belongs to the Topic Big Data and Artificial Intelligence)
Abstract
:The wave of government data opening has gradually swept the world since it rose from the United States in 2009. The purpose is not to open government data, but to release data value and drive economic and social development through data accessibility. At present, the impact of academic circles on government open data mostly stays in theoretical discussion, especially due to the lack of empirical tests. Using the multistage difference-in-difference (DID) model, this paper analyzes the panel data from 2009 to 2016 by taking two batches of Chinese cities with open data released in 2014 and 2105 as samples to test the impact of government data opening on urban innovation ability. The results show that the opening of government data significantly improves urban innovation abilities. After considering the heterogeneity and fixed effects of urban characteristics, the opening of government data still significantly improves urban innovation ability and shows a greater innovation driving role in cities with high levels of economic development, human capital, and infrastructure. Based on this, this paper believes that we should continue to promote the opening of government data, release the value of data, and pay attention to the Matthew effect between cities that may appear in the era of big data.
1. Introduction
In the process of managing national affairs and social public affairs, a government will accumulate and produce a large amount of data. These data contain great value and can become the driving force to promote economic development and social innovation. For a long time, a large amount of data was controlled within government and not disclosed to the public. Government data openness has been a consensus for a long time, which can be traced back to the rise and development of the open government movement in the 1950s and 1960s. The open-source software movement rising at the end of the 20th century made people realize that “open data” is an efficient organization model with huge potential. Until the era of big data, people’s ability to acquire, manage, and use data has been improved, and they have a deeper understanding of the value of data. The openness of government data has gradually become the consensus of all countries and put it into practice.
The global practice of data openness can be traced back to 2009 when the United States opened the prelude to government data openness which has since gradually affected countries all over the world. By 2020, 153 countries in the world have open data portals [1]. By April 2021, the number of Chinese government data open platforms has reached 174, including 18 provincial-level urban platforms and 156 sub-provincial and prefecture-level urban platforms. In addition to local independent exploration, the central government is also actively promoting data opening from top to bottom, trying to build a unified and open platform for national government data.
Government data openness should ultimately end with the release and utilization of data value because data openness is not the purpose. The fundamental purpose is to release data dividends and create value through data openness. Attard comprehensively summarized the main values of government data openness, including political transparency, releasing social and commercial values, and improving the participation of government activities [2]. In recent years, scholars began to evaluate the impact of government data opening. The main attempts include constructing the value evaluation framework and its index system [3], investigating the practical cases of government data opening, and exploring its effectiveness [4]. Unfortunately, research on this aspect is relatively rare and flawed. On the one hand, the perspective of discussion at the theoretical level is scattered and has not yet formed a consensus and system; on the other hand, the research considering the government data opening practice project mostly adopts a single sample or small sample, fails to give a general conclusion, and rarely considers complex factors such as control variables, which weakens the robustness of the research conclusion.
Governments have devoted a lot of political attention to the promotion of government data openness. However, openness means the pursuit of transparency in a bureaucratic system with many obstacles, resulting in constraints from systems and mechanisms in the process of data openness in practice [5]. To continue government data opening, countries need to make greater efforts in system and mechanism reform and resource restructuring; however, there is no clear answer regarding the impact of government data opening over the long term. Does government data openness really drive economic and social innovation? Both theoretical exploration and practical promotion call for a reflection and response.
Based on the above theoretical and practical background, this paper attempts to test the impact of government data opening on urban innovation ability with a multi-stage double difference model. Compared with the existing research, this paper has the following innovations: (1) in the research field of the impact of government data opening, this paper gives an empirical test conclusion based on the China situation, which enriches the relevant research in the field. (2) Using the multistage double difference method, we pay attention to the opening time of government data and other control variables in different cities and obtain a more accurate conclusion. (3) It provides new enlightenment for the theoretical discussion on the impact of government data opening and the practice of government data opening.
2. Policy Background and Literature Review
2.1. Government Data Opening and China’s Policy Action
According to The Open Data Charter [6], open data is digital data that is made available with the technical and legal characteristics necessary for it to be freely used, reused, and redistributed by anyone, anytime, anywhere. The Open Data Charter puts forward six principles that government data openness should follow, including open by default, timely and comprehensive, accessible, usable, comparable, and interoperable, for improved governance and citizen engagement and inclusive development and innovation.
In September 2011, eight countries including Brazil, Mexico, Norway, South Africa, the United Kingdom, and the United States jointly signed the “open data statement”, giving birth to the “open government partnership” (OGP). As of October 2021, OGP has 79 national and regional members [7]. In 2014, the EU issued the “data driven economic strategy”, and its activities in big data mainly involve two aspects: (1) research on the strategic plan of data value chain; (2) fund research and innovation activities in the fields of “big data” and “open data”. In November 2017, the U.S. House of Representatives passed the “open government data act”, which pointed out that the federal government should open government data in a standardized and machine-readable way, and local governments responded one after another [8]. In 2017, the U.K. Department for Digital, Culture, Media and Sport issued the “UK digital strategy”, which pointed out that the U.K. should cultivate citizens’ digital literacy and release data value through world-class digital infrastructure to promote U.K. economic development [9]. In 2017–2018, to promote the release of government data value, the Australian government launched the Australian public sector cooperative investment project to maximize the utilization and value of government data assets. With the promulgation of data openness policies by governments and the efforts of international data openness organizations, data openness has been further developed.
In order to promote the opening of government data, Qingdao, China, promulgated the “Notice of the general office of Qingdao Municipal People’s Government on further strengthening government information disclosure” in 2014, which puts forward clear requirements on the carrier form of government data opening [10]. In the same year, a total of 12 cities in China explicitly mentioned the work related to promoting government data opening for the first time in the policy text. In 2015, the number of cities explicitly mentioned in the policy text to promote the opening of government data reached 44. The outline of China’s government data opening policy has basically taken shape, covering data opening infrastructure construction, talent and technology investment, measures and specifications, implementation plan, data security, and other aspects. The Shanghai Public Data Open Platform [11] is one of the earliest government data open platforms built in China, and the construction level has always been in the forefront of the country. The data fields opened by Shanghai Public Data Open Platform include economic construction, citizen service, urban construction, resources and environment, education and science, and technology, and provide two types of data resources: data interface and data products. Since its completion, the Shanghai Public Data Open Platform has directly generated 54 innovative application projects and encouraged society to carry out innovative application of open data in the form of competition, stimulated the enthusiasm of the whole population for the development and utilization of open data, and created a benchmark demonstration for the realization of the value of open data [12].
In general, the government’s data opening policy covers basically all aspects, including infrastructure paving and the construction of an institutional environment. However, the construction of the policy system related to the data opening of the Chinese government is still in the exploratory stage, which is specifically reflected in the single preference for policy tools, weak policy pertinence, and imperfect systems.
2.2. Literature Review
Relevant research on government data openness has been carried out for many years, and the research contents show a diversified trend, including concept discrimination [13], data opening practices [14,15], policies and regulations [16], institutional mechanisms [17], standards and norms [18], privacy protection [19], collaborative research between data openness and e-government [20], and smart cities, etc. There are few studies focusing on the impact of data openness.
The opening of government data is not the original intention, but the ultimate goal is to release the value contained in massive data and let government data opening inject power into economic and social development. This has been the consensus of academic circles and has always been the core issue in the research field of government data opening. At present, the most common approach in relevant research is to classify and discuss the impact of government data opening. Many scholars agree that government data opening can bring value in different dimensions. For example, Harrison described the impact of government data opening from multiple dimensions such as economy and politics, society and management, quality of life, and spiritual culture [21]. At the same time, scholars have paid considerable attention to the driving effect of government data opening on economy and society. Jztzek pointed out from the perspective of participation and economy that government data opening can improve social efficiency and effect, and enable business innovation [22]. However, most studies infer the value of government data opening from the perspective of theoretical analysis, and there are few empirical tests. Some scholars also try to explore the impact of government data openness by constructing the value evaluation framework and its index system or investigating practical cases. A. A. García proposed the “meloda” model to evaluate the use and value of open government data around the four dimensions of technical standards, access, legal considerations, and data model [3]. Zuiderwijk used interviews to understand the phased achievements of government data opening in 156 countries and regions and found the role of government data opening in improving decision-making efficiency [4]. C. Alexopoulos proposed a multi value model based on two stakeholder groups of data users and data providers, as well as three value dimensions of efficiency, effect, and future behavior of users [23]. In addition, some international organizations have also assessed the impact of data openness. For example, the EU’s evaluation of open data which focuses more on E-government, implants the indicators of open data into digital public services, and regards data openness as a means to improve digital public services [16]. It is worth noting that the data does not bring all positive value. As a new and powerful business model, the platform operates with huge data from users as raw materials, binds stakeholders such as manufacturers, suppliers, and consumers together, and expands rapidly relying on low marginal costs [24], resulting in negative externalities, monopoly, and infringement of labor rights and interests [25]. Zuboff explained that under the temptation of interests, some large companies use big data to predict and monitor citizen behavior, which damages democracy and public interests, and further summarized this phenomenon as surveillance capital marked by extreme concentration of knowledge and free from democratic oversight [26]. In general, the existing empirical research is not only scarce, but also has some limitations, such as single sample or too small sample size, and insufficient attention to complex conditions such as control variables, urban feature heterogeneity, and so on.
3. Data and Empirical Strategy
3.1. Econometric Strategy
Considering that each city in the sample implemented government data opening at a different time period to, this paper will use the multistage difference-in-difference (DID) model to test the impact of government data opening on urban innovation ability. Specifically, referring to Heckman [27] and Beck [28], the following multistage difference-in-difference (DID) model is constructed.
In Equation (1), i represents the city, t represents the year, and Yit represents the city’s innovation ability. Treat represents the dummy variable between groups, indicating whether the city has opened government data. If yes, treat = 1 represents the experimental group; if not, treat = 0 represents the control group. Postt is a policy dummy variable, and its value depends on the year in which the sample city implements the government data opening. The value of the year in which the government data opening is implemented, and subsequent years, is assigned as 1, and the value of other years is taken as 0. The value of openit depends on the values of postt and treati. If the sample city I implements government data opening in year t, the value of openit is 1, otherwise the value is equal to 0. It can be seen from the model in this paper that the core coefficient of this paper is α 1. It is the key result after double difference and represents the net effect of government data opening on urban innovation ability. If the performance of cities in the experimental group is better than that in the control group, that is, government data opening can promote the improvement of urban innovation ability, then α 1 the coefficient should be significantly positive.
In order to avoid the endogenous problem caused by the omission of important variables in the estimation process, according to the research of Zeleti [29] and Magalhaes [30], this paper adds a series of control variables to the Model (1) and uses CIT to represent the factors that may affect the urban innovation ability, including economic environment (EE), scientific research environment (RE), infrastructure environment (IE), human resource environment (HE), open environment (OE), and population environment (PE). See Table 1 for specific meanings.
μi is the individual fixed effect, which can control the individual characteristics that do not change with time. In this paper, it refers to the differences between different cities, such as the differences between urban geographical characteristics; ρt is the time fixed effect, which is used to control the time characteristics that do not change with individual differences, and εit is a random error term.
3.2. Variable and Data
In this paper, two groups of cities that began the political mobilization of government data opening in 2014 and 2015 are defined as the experimental group, and the other cities are defined as the control group. The author conducted policy retrieval in Peking University Law and policy database [31] and regarded the cities that explicitly mentioned “data openness” or “government data openness” in the policy text for the first time as the cities that began to deploy government data openness. According to the academic definition of government data openness [32], some policies that refer to government data openness but do not conform to its academic meaning were eliminated. In addition, the following operations were carried out in the setting of the experimental group and the control group: (1) samples were selected from cities at prefecture level and above (excluding municipalities directly under the central government). (2) Based on the availability of data and the feasibility of empirical analysis, the time range is 2009–2016. At the same time, in order to ensure the accuracy of the estimation results, a number of cities that began the political mobilization of data opening in 2016 and cities with serious lack of data were excluded. After the above operations, 171 cities were finally included in the sample, of which the experimental group included 32 cities in 2014 and 82 cities in 2015, and the rest were the control group.
In terms of data sources, this paper selects the panel data of 171 prefecture level and above cities in China (excluding municipalities directly under the central government) from 2009 to 2016. The data of each control variable comes from the China City Statistical Yearbook [33], and the missing value is supplemented by the average growth rate method. The variable type, name, description, and data source are shown in Table 1.
The data of the dependent variable comes from Appendix A, the urban innovation capability index in the Report on City and Industrial Innovation in China released by the research team of the Industrial Development Research Center of Fudan University, published annually from 2002 to 2017. The Report on City and Industrial Innovation in China aims to measure the innovation capability of cities and industries, calculate the innovation capacity index through the number and value of patents, and express the innovation capability of cities. The report innovates the method of measuring urban innovation capability, and points out that it has its advantages to measure innovation by innovation input-end indicators such as (R&D) expenditure and R&D personnel, however, it will lead to the problem of double calculation, and it is difficult to explain how the input is transformed into innovation, while using innovation output indicators such as patents to measure innovation is very direct and concise [34]. Compared with the China City Statistical Yearbook, it is more micro, considers the patent renewal behavior and quality differences, and can more accurately grasp the urban innovation capability. Specifically, the report points out that it is more reasonable to measure innovation capability with innovation output rather than innovation input, so it uses the patent data to measure innovation output rather than the traditional data of innovation input such as R&D expenditure and the number of R&D personnel. At the same time, considering the value differences of different patents, the report points out that there will be a large error in using the number of patents to represent the innovation power of cities or industries. Pakes’s [35] patent renewal model is used to estimate the average value of each type of patent, and the innovation index is calculated on this basis. Therefore, this paper adopts the data of the Report on City and Industrial Innovation in China and adds the construction method of the innovation index to Appendix A. The descriptive analysis results are reported in Table 2.
4. Empirical Results
4.1. Preliminary Analysis
The empirical analysis results are reported in Table 3. The columns in Table 3 gradually add control variables from left to right and report the basic regression results in detail. Column (1) is the basic result without adding control variables and fixed effects. The estimated coefficient of Treat × Post is positive at the significance level of 1%, indicating that the opening of government data can significantly improve the urban innovation capability. In order to reduce the interference caused by endogeneity, Column (2) takes into account the control variables designed in this paper and finds that the estimated coefficient of treat × post is still positive at the significance level of 1%, but it can be seen that the coefficient value decreases significantly, which indicates that if the control of some conditions is not considered, the conclusion will overestimate the impact of government data opening on urban innovation capability. Based on the results of Column (2), Column (3) and Column (4) gradually add time fixed effect and urban fixed effect. The results show that the estimated coefficients of treat × post are significant at the level of 1% and 5%, respectively. After adding time fixed effect and urban fixed effect, there is no significant difference in coefficient size and significance level. This shows that the addition of control variables and city and time fixed effects can more accurately estimate the impact of government data opening on urban innovation capability and shows that the estimation results are robust.
Among all regression results in Table 3, the regression coefficients of treat × post are positive and significant, which shows that the opening of government data can indeed improve the innovation capability of cities. The regression results in Column (4) show that the impact of government data opening on urban innovation capability is about 13.62. Compared with the control city, the innovation capability of the experimental city has increased by 13.62. In addition, the results in Column (4) show that the estimated coefficient of EE is positive at the significance level of 1%, which indicates that cities with higher economic development level have strong innovation capability. In cities with more developed economy, there is a greater probability of having strong data users and better open data platforms, as well as greater demand for open data, which maximize the value of government open data. The estimated coefficient of IE is positive at the significance level of 10%, which indicates that the more popular the Internet infrastructure is, the stronger the innovation capability is. This is because the information infrastructure, as the basis of the operation of the information society, can enable innovation activities.
4.2. Parallel Trend Test
There are a series of preconditions for the application of the multistage difference-in-difference (DID) model. Next, this paper will test it to ensure the accuracy of the conclusion.
In the application of the double difference method, in order to ensure the estimation results are not affected by the difference between the processing group and the control group, the parallel trend test should be paid attention to. If the parallel trend hypothesis holds, there should be no significant difference between the treatment group and the control group before the policy time point. The parallel trend test can generally use two methods: drawing time trend chart and event research method. This paper uses the event research method for testing because compared with the former, which needs to manually observe the judgment results of the time trend chart, the event research method can accurately judge whether there is significant difference between the treatment group and the control group before the policy impact in a statistical sense. Based on the practices of Ashenfelter [36] and Jacobson [37], this paper constructs the following test model:
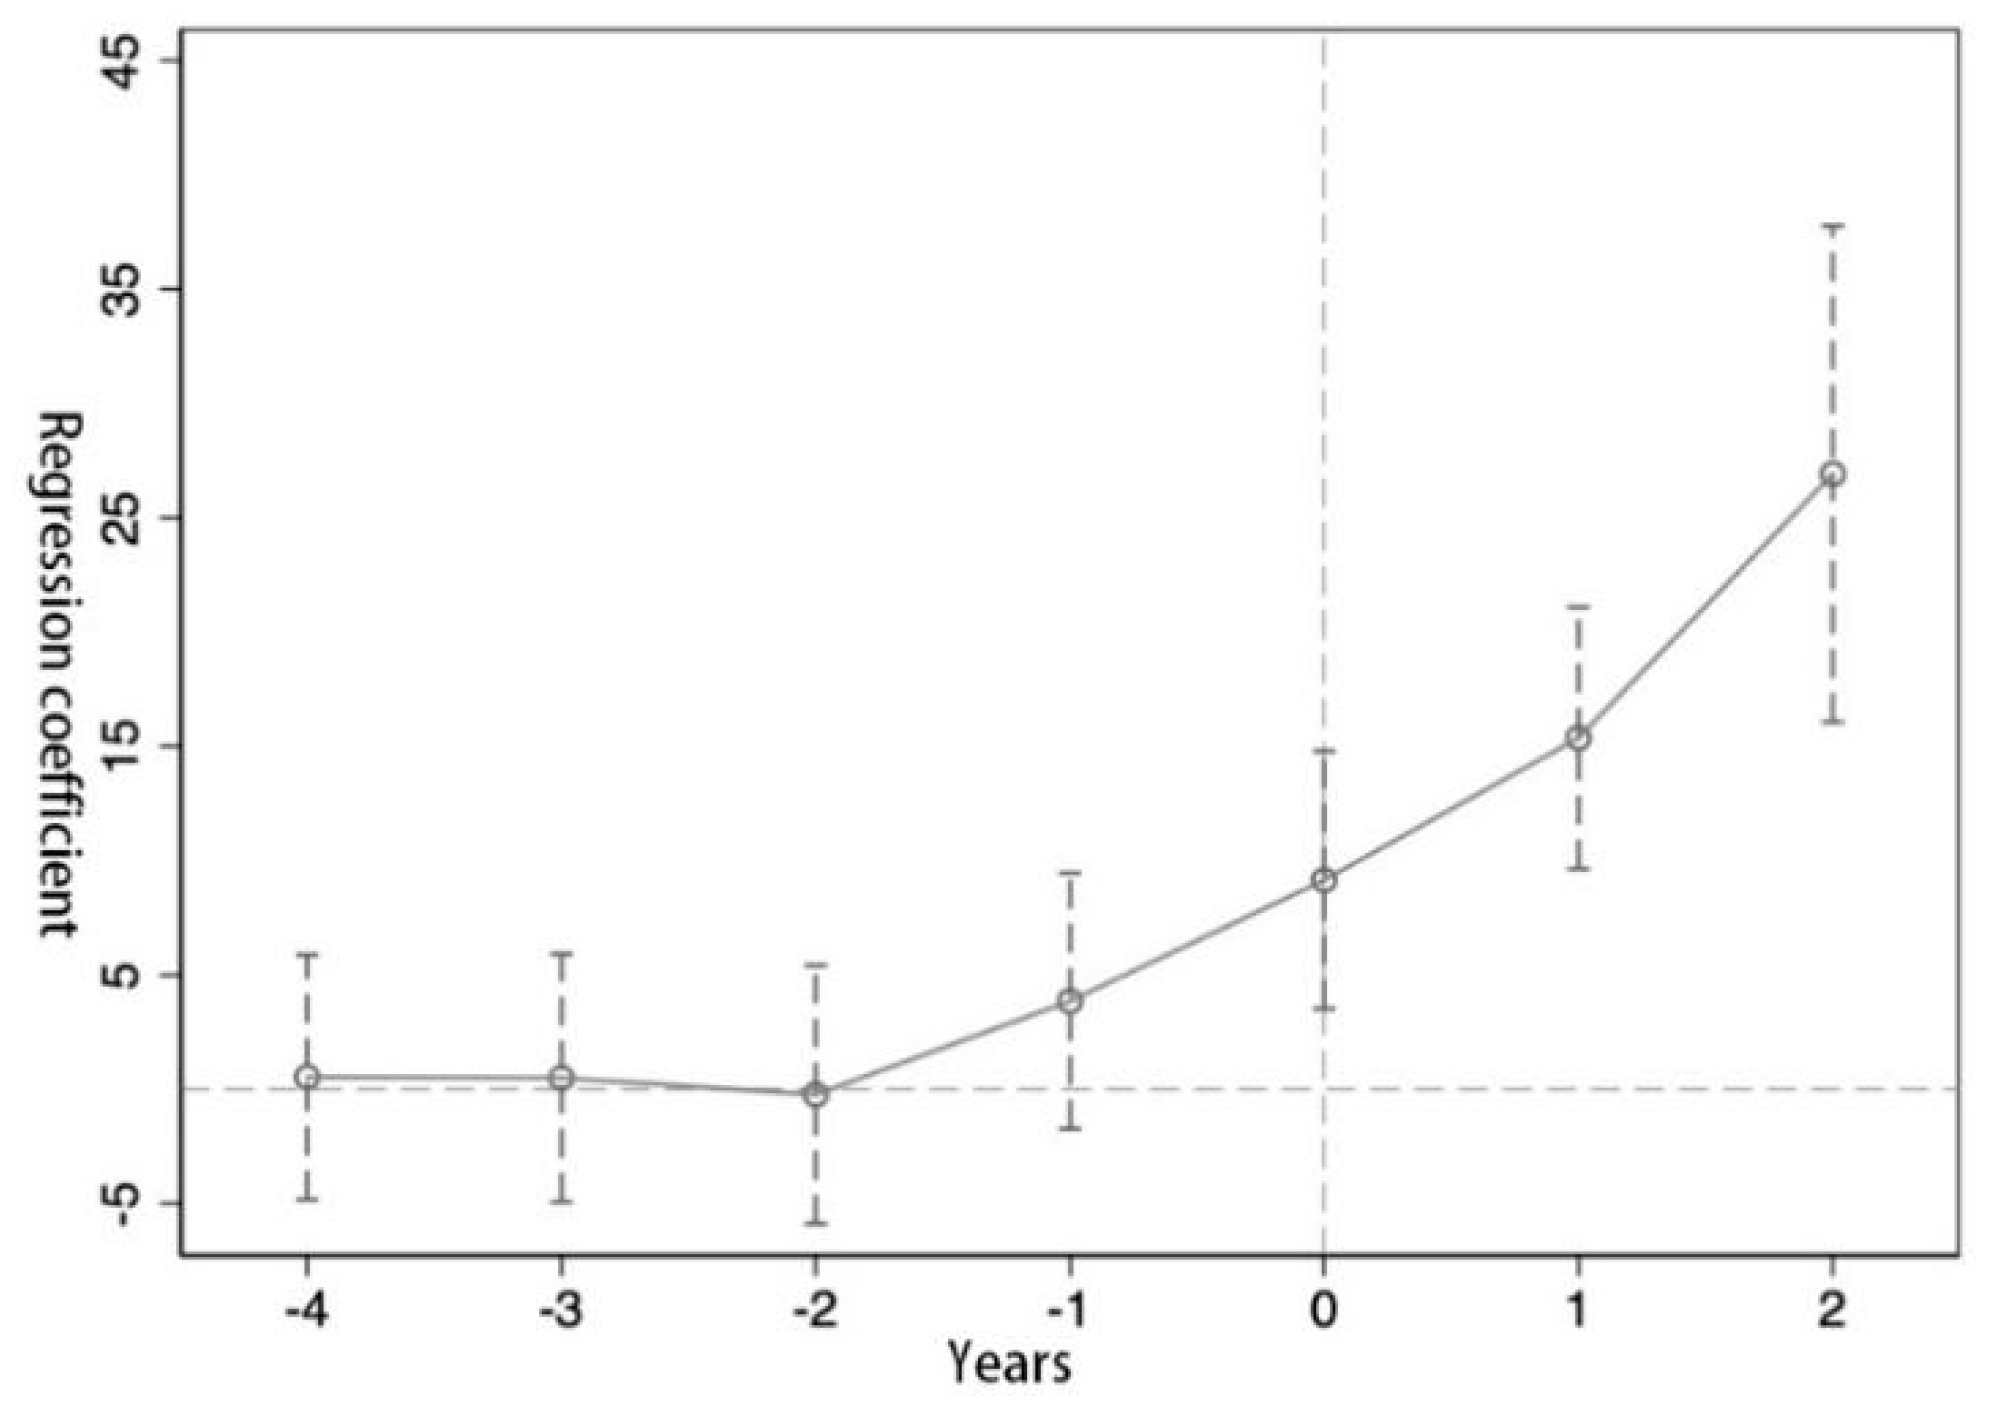
In Equation (2), Di,t + k is a dummy variable before and after the opening of government data and political mobilization. k represents time. The year before the impact year is negative and the year after the impact year is positive. In this paper, the range is—4 to 2, representing each year before and after the impact year. In order to identify the difference between the experimental group and the control group before the impact year, this paper will pay attention to βk. As shown in Figure 1, between—4 and—1, the estimated coefficient of β is not significantly different from 0 on the 95% confidence interval, indicating that there is no significant difference between the experimental group and the control group before the government data is opened and political mobilization, that is, the parallel trend hypothesis, is established [38].
4.3. PSM-DID Analysis
In this paper, the PSM-DID method is used to further optimize the estimation results, reduce the estimation deviation of the double difference method, and further prove the robustness of the results. In this paper, the k-nearest neighbor matching method (k = 5) is adopted, and the virtual variable of treat is used to express whether it has experienced policy impact, and logit regression is carried out with the control variable to obtain the tendency score value. The city with the closest score is taken as the paired city of the experimental group, to reduce the systematic difference between the experimental group and the control group. After 38 failed samples were deleted by propensity score matching, 409 and 921 samples in the experimental group and control group were successfully matched, respectively. Table 4 reports the balance test results of PSM matching. After propensity score matching, the absolute value of standard deviation of all matching variables is less than 5%, indicating that the matching variables and matching methods selected in this paper are reasonable. At the same time, the t-test results are not significant, indicating that the original hypothesis of the test “there is no significant difference between the matched experimental group and the control group” is valid.
After reanalyzing the samples following propensity score matching, there is no significant difference in symbol, significance level, and coefficient value between the results in Table 3 and Table 5, which shows that the estimation results in this paper are robust. At the same time, the estimated coefficient of the treat × post of each column in Table 5 has decreased compared with Table 3, indicating that the analysis results after propensity score matching avoid overestimating the policy effect and present more accurate estimation results.
4.4. Heterogeneity Analysis
To further explore the heterogeneity of the impact of government data opening on urban innovation capability in different urban characteristics, this paper tested the heterogeneity from the perspective of urban characteristic heterogeneity and discusses the impact of government data opening on urban innovation capability in cities with different levels of economic development, human capital, and infrastructure. After the opening of government data, data users interact based on the value attribute of open data, follow the value to form a link, release the open value of government data, and finally promote economic and social development. This shows that a large amount of data does not produce value once it is opened, but needs corresponding environmental conditions to work, that is, the utilization of data depends on certain basic resource conditions, and the effect of government data opening to promote urban innovation depends on the initial resource endowment of the city to a certain extent. Therefore, this paper takes into account the level of economic development [39], human capital [40], and infrastructure [41]. The level of economic development, human capital, and infrastructure are expressed in per capita GDP (yuan), the number of college students per 10,000, and the number of Internet broadband access users (10,000). In this paper, each index value is sorted from large to small and then divided into three equal parts. The two groups of samples with high value are identified as high-level samples, and the group of samples with low value are identified as low-level samples.
After regression of cities with different levels of economic development, human capital and infrastructure, the results are shown in Table 6. Columns (1) and (2) in Table 6 show the driving effect of government data opening on urban innovation capability under different economic development levels. It can be seen that in cities with high economic development level, government data opening can play a greater role in promoting urban innovation capability. This is because economically developed regions often have a larger data utilization group and strong data utilization demand, such as the demand from scientific research, big data industry, and government governance, which can promote the utilization of open data on the demand side and play its innovation driving role. Columns (3) and (4) report the impact of government data opening on urban innovation capability under different human capital levels. It can be seen that in areas with high human capital level, government data opening can play a greater role in promoting urban innovation capability. This is because human resources can bring intellectual support to the utilization of open data and make use of open data utilization achievements with more output and higher quality to realize the innovative utilization of data [42]. In cities with low overall human capital level, the role of government data openness in promoting urban innovation is very limited, and it is even difficult to measure the positive effect of government data openness on urban innovation. Columns (5) and (6) report the impact of government data openness on urban innovation capacity under different infrastructure levels. The results show that a higher level of Internet infrastructure can make government data opening play a greater role in promoting urban innovation. As the technical support for the development of digital society, Internet infrastructure is the basic threshold for enterprises, governments, and individuals to obtain and utilize open data. A good level of Internet infrastructure can undoubtedly provide basic material conditions for the acquisition, exchange, and sharing of open data and the release of value [43].
5. Discussion
The results of this paper show that under the strict hypothesis test and robustness test, government data opening does promote the improvement of urban innovation capability. Empirical evaluation of the impact of government data opening has always been the focus of the core issues in the field of government data opening, however, existing research is rare. Compared with the existing relevant research [3,4,21,22,23], the results of this paper affirm the academic theoretical judgment on the innovation value brought by government data opening and point out that government data opening plays a significant role in promoting urban innovation. It is a response and reflection on the theoretical discussion in the field and enriches the research on the value of government data opening. At the same time, it is rare to empirically test the value brought by government data opening. This paper selects a more comprehensive sample for the empirical test, and uses the multi-stage DID model to pay attention to the opening time of government data and other control variables in different cities in order to make the conclusion more accurate.
In addition, this paper provides the results of heterogeneity analysis, which shows that the innovation effect produced by government data opening is different in cities with different resource endowments, which pays attention to the parts that have been neglected in the existing studies. Some literature has shown that government data openness does not always produce positive value [24,25,26]. In the social sciences there is a wide debate that points out that government data openness could produce relevant results in terms of market values but could at the same time reduce workers’ rights, basing the production of value on processes of information extraction, surveillance policies [26], and limitation of individual freedoms. As argued by many scholars, technologies can be used to expropriate the knowledge and information of citizens with the aim of creating value solely for large corporations [25,44,45], reducing both the role of democratic representation within public authorities and the common good [24,46]. Government data openness means that data can easily enter the hands of some large private companies, and the situation of using public data to serve private interests may appear, thus damaging democracy and public interests, which is contrary to the original intention of government data openness in pursuit of public value. The heterogeneity analysis results of this paper further point out that the positive value release of government data openness can be better under some conditions, which provides a new exploration idea for existing research. Future research can start with the heterogeneity analysis results of this paper to study why different levels of economic development, human capital, and infrastructure lead to different data value release results. For example, from the perspective of digital democracy, a high level of human capital may mean a better level of digital democracy, which makes big data play a positive role [45]. In addition, the role of the relationship between the digital divide and the level of human capital in the process of releasing data value is also worthy of attention [47]. Finally, subject to the differences in the level of digital democracy, the value released by data in cities is not necessarily public value, but also private value that only benefits some digital enterprises and interest groups. Therefore, future research can explore the differences between urban development models driven by government data openness.
Due to some subjective and objective conditions, there is still room for improvement in this paper. The opening of government data in China has not been promoted for a long time, coupled with the limitations of statistical data, which limits further access to the data in this paper. Changes in conclusions should be observed again in rich data. In addition, future research can enrich the existing conclusions of this paper after further improvement of theoretical research in the field. For example, future research can further consider how the intercity proximity effect [48] and political pressure transmission mechanism affect the government data opening behavior and its results in each administrative division.
6. Conclusions and Implications
This paper finds that the opening of government data promotes the improvement of urban innovation capability. After passing the strict hypothesis test and robustness test, this conclusion is still valid. Heterogeneity analysis shows that the innovation effect of government data opening is different in cities with different resource endowments. In cities with high levels of economic development, human capital, and infrastructure, government data opening can play a greater innovation driving role.
Combined with the actual situation of government data opening and the conclusion of this paper, the author puts forward the following suggestions. Firstly, the basic regression results of this paper affirm the driving role of government data opening in urban innovation, which shows that China’s government data opening is turning the theoretical expected value into reality. However, the current government data opening work is facing various obstacles, such as some data are still hidden under the cloak of confidentiality, poor synergy within the government makes the opening process slow, poor data quality leads to limited data value release, etc. [49,50]. At present, the world is exploring new urban forms under the background of the digital age. As a means to release the value of data elements, government data opening should be further valued and promoted to help the transformation of urban forms towards a more intelligent and democratic direction [51,52,53]. Secondly, government data openness is playing a significant role in cities with better resource conditions, which reminds us that the gap between cities in the era of big data is widening in an unobtrusive way. Cities with better resource conditions will generate better innovation performance under the enabling of open data, and further improve the overall level and quality of the city. On the contrary, they will not get the dividend of data opening, that is to say, it will produce the Matthew effect between cities. If this phenomenon does not attract enough attention, it may make the decline of small- and medium-sized cities more rapid and further increase the gap with big cities.
Author Contributions
Conceptualization, Y.L. and Z.T.; formal analysis, Y.L.; investigation, Y.L.; resources, Z.T.; data curation, P.F.; writing—original draft preparation, Y.L.; writing—review and editing, P.F.; supervision, Z.T.; project administration, Z.T.; funding acquisition, Z.T. All authors have read and agreed to the published version of the manuscript.
Funding
Research on top-level design and implementation path of building a smart society: 18VSJ057; Research on the “seven haves” of Shenzhen People’s livelihood: SZ2021A007.
Institutional Review Board Statement
Not applicable.
Informed Consent Statement
Informed consent was obtained from all subjects involved in the study.
Data Availability Statement
All data needed to evaluate the conclusions in the paper may be requested from the authors.
Conflicts of Interest
The authors declare no conflict of interest.
Appendix A
This appendix will introduce the calculation method of innovation index in detail. The innovation index is mainly calculated in two steps:
- (1)
- Drawing on the patent renewal model of Pakes & Schankerman (1984), using all expired invention patents filed in 1987–1997 to estimate the value, and then simulating the distribution of patent value based on the estimated parameters, and further calculating the average value of different age patents, which is used as the value weighting coefficient of the corresponding patent (because as of the end of 2016, it can be seen that all the legal status of all invention patents applied for in 1987 and 1997 have been updated during the life cycle, and the patent applications are still being updated dynamically, so the updated data of this part of the patent is censored) to ensure the robustness of the estimation results, this report only uses the invention patents filed in 1987–1997 for estimation. However, the invention patents applied for in 1985 and 1986 only have a maximum protection period of 15 years, therefore, the data of these two years are not used. In the results of the patent update model in this report, we found that there is no significant difference in the distribution of patents filed in each year, so we can use this estimation result as the value weighting coefficient of all patents.
- (2)
- Take the end of the year (31 December) as the observation point of each year and select the invention patents still valid at the observation point (which have been authorized and are still in the period of duration), and finally the patent value of different cities (or industries) is summed up to obtain the patent value stock. Then, the total value of national patents in 2001 was standardized to 100, and the urban innovation index and industrial innovation index from 2001 to 2016 were calculated.
Next, the patent renewal model will be introduced in detail. The patent value calculated in this report refers to the private value of the patent to the holder, which is defined as the present value of the income generated by the patent during its lifetime. We use the patent update model of Pakes & Schankerman (1984) to estimate the value of Chinese invention patents. Its core idea is assuming that the patentee’s update decision-making method is forward looking, that is, when they first apply for a patent, they clearly know the revenue stream that the patent will bring in each year in the future. The right holder’s decision-making problem is to maximize the discount value of the patent’s net income and select the optimal lifespan based on this principle, that is, when to stop paying the annual fee and terminate the patent right. The maximization problem of the patentee can be expressed as:
Among them, T is the patent age when the patentee stops paying the annual fee, is the maximum period of patent protection stipulated by law, and i is the discount rate. j represents the year of patent application, and we group the patents applied for in the same year into a cohort. t is the age of the patent from the date of application. Rtj and Ctj respectively represent the benefits of the patent to the patentee and the annual fee paid by the patentee when the patent is at the age of t, and (Rtj − Ctj) represents the net income. As the patent age t increases, the income Rtj is non-increasing, while the Ctj annual fee is non-decreasing, so it can be assumed that the net income (Rtj − Ctj) does not increase with t. When the net income is greater than zero, the patentee will choose to continue to pay the annual fee to update the patent to maximize V(T). The optimal update rule is:
When Rtj − Ctj < 0, the patent reaches the optimal lifespan T *, if when T = , Rtj ≥ Ctj, then T * = T.
Due to differences in the initial revenue R0j of different patents in the same group and considering issues such as obsolescence and increased market competition, the initial revenue of patents will decay year by year. Therefore, we make the following assumptions: (i) assuming that the initial patent income R0j obeys a certain distribution F (R0j; θj), the probability density function of the distribution is f (R0j; θj), and θj is the characteristic parameter of the distribution; (ii) the decay rate δj of the initial patent income is a constant that does not change with time. Therefore, according to assumption (ii):
Combining (A2) and (A3) two formulas can be obtained:
According to hypothesis (i), the update rate of patent group j at age t is:
Once the specific functional form of the patent initial income distribution F (R0j; θj) is given, then Equation (A5) gives the relationship between the theoretical prediction value of the update rate and the unknown distribution parameters, and the estimation problem then becomes to make the theoretical prediction update rate as close as possible to the real observation update rate by selecting reasonable parameter values. With reference to the existing literature, the distributions most likely to conform to the actual observation data include Weibull, Pareto–Levy, and lognormal. This report uses the lognormal distribution generally accepted in the existing literature (Schankerman and Pakes, 1985; Lanjouw, 1998; Huang, 2012). Lowercase letters are used to represent the logarithm, that is, r0j = InR0j, then r0j obeys a normal distribution, that is, r0j~N (μj, σj). Then, (A4) can be written as:
The left side of Equation (A6) obeys the standard normal distribution, and the two Equations (A5) and (A6) can be combined together to obtain:
Furthermore, by taking the inverse function of the standard normal cumulative distribution function, a generalized patent update model can be obtained:
Next, we divide the patent groups according to the “application year group-age” dimension, use Model (A8) to estimate the patent value, and to solve the heteroscedasticity problem, use the generalized nonlinear least squares method (FNLS) to estimate.
After estimating the distribution parameters μj and σj and the attenuation rate δj through the Model (A8), the total value of each patent is calculated based on the following equation:
Specifically, the Monte Carlo simulation method is used to extract 50.000 (pseudo-random variables) from the estimated lognormal distribution to obtain 50.000 realized values of the random variable R0j, and then bring in Equation (A9) to calculate the corresponding total patent value V. These 50.000 Vs represent the value distribution of patents in a certain group. By calculating the average value of patents of different ages in this group, the value weighting coefficient of patents of different ages can be obtained, that is, the average value of patents at different ages.
Table A1 shows the simulation results of the patent renewal model. It can be seen from the table that the longer the renewal time is, the more average value it brings to the patentee. It is worth mentioning that when constructing the innovation index in this report, since most of the patents are still in duration, we do not know their future update status when observing at the end of each year, so we take the conditional average value of patent distribution as the value weighting factor of each patent, that is, in our simulation results, the average value of all surviving patents in the i year (I = 1,…,20) is used as the value weighting coefficient of patents whose age is equal to i. The result is the last column in Table A1.

Table A1.
Average value of patents at different ages. (Constant price in 2015, unit: Yuan, CNY).
| Age | Average Value (CNY) | Value Weighting Coefficient |
|---|---|---|
| 1 | 95 | 450.793 |
| 2 | 407 | 452.679 |
| 3 | 1850 | 455.238 |
| 4 | 3966 | 468.616 |
| 5 | 6274 | 477.967 |
| 6 | 15.589 | 490.603 |
| 7 | 27.534 | 563.326 |
| 8 | 34.399 | 589.103 |
| 9 | 61.208 | 616.682 |
| 10 | 98.896 | 790.207 |
| 11 | 119.245 | 850.168 |
| 12 | 182.929 | 917.842 |
| 13 | 270.778 | 1.245.859 |
| 14 | 321.917 | 1.369.379 |
| 15 | 439.699 | 1.505.161 |
| 16 | 596.466 | 1.993.970 |
| 17 | 698.724 | 2.210.248 |
| 18 | 826.101 | 2.451.988 |
| 19 | 986.346 | 2.774.235 |
| 20 | 3.155.261 | 3.155.261 |
Finally, the value of the invention patents (which have been authorized and are still in duration) that are still valid at the end of each year (31 December) are added up according to different cities or industries to obtain the annual patent value stock of each city or industry (because after the invention patent is applied for and published, a substantive examination is required, and it may not necessarily be authorized in the end, so we choose those invention patents that have been authorized at the end of the year). Finally, the total value of national patents in 2001 is normalized to 100, and the urban innovation index and industrial innovation index from 2001 to 2016 are calculated.
References
- Nations, U. United Nations E-Government Survey 2020. Available online: https://publicadministration.un.org/egovkb/Portals/egovkb/Documents/un/2020-Survey/2020%20UN%20E-Government%20Survey%20(Full%20Report).pdf (accessed on 26 November 2021).
- Attard, J.; Orlandi, F.; Auer, S. Value Creation on Open Government Data. In Proceedings of the 49th Hawaii International Conference on System Sciences (HICSS), Koloa, HI, USA, 5–8 January 2016; pp. 2605–2614. [Google Scholar]
- Abella, A.; Ortiz-De-Urbina-Criado, M.; De-Pablos Heredero, C. Meloda, métrica para evaluar la reutilización de datos abiertos. Prof. Inf. 2014, 23, 582–588. [Google Scholar] [CrossRef] [Green Version]
- Zuiderwijk, A.; Shinde, R.; Janssen, M. Investigating the attainment of open government data objectives: Is there a mismatch between objectives and results? Int. Rev. Adm. Sci. Int. J. Comp. Public Adm. 2018, 85, 002085231773911. [Google Scholar] [CrossRef] [Green Version]
- Attard, J.; Orlandi, F.; Scerri, S.; Auer, S. A systematic review of open government data initiatives. Gov. Inf. Q. 2015, 32, 399–418. [Google Scholar] [CrossRef]
- Opendatacharter. International Open Data Charter. Available online: https://opendatacharter.net/principles/ (accessed on 26 November 2021).
- OGP. About Our Process. Available online: https://www.opengovpartnership.org/process/ (accessed on 26 November 2021).
- Coalition, D. Open Government Data Act. Available online: https://www.datacoalition.org/open-government-data-act/ (accessed on 26 November 2021).
- Department for Digital, Culture, Media & Sport UK Digital Strategy. Available online: https://www.gov.uk/government/publications/uk-digital-strategy/uk-digital-strategy (accessed on 26 November 2021).
- General Office of Qingdao Municipal People’s Government. Notice of the General Office of Qingdao Municipal People’s Government on Further Strengthening Government Information Disclosure. Available online: http://www.qingdao.gov.cn/n172/n68422/n68424/n30259215/n30259219/140520113920312205.html (accessed on 26 November 2021).
- Shanghai Public Data Open Platform. Available online: https://data.sh.gov.cn/index.html (accessed on 26 November 2021).
- Shanghai Public Data Open Platform. SODA Competition. Available online: http://soda.data.sh.gov.cn/ (accessed on 26 November 2021).
- United Nations E-Government Survey Report. Available online: https://publicadministration.un.org/zh/Research/UN-e-Government-Surveys (accessed on 26 November 2021).
- Dawes, S.S.; Pardo, T.A.; Cresswell, A.M. Designing Government Information Access Programs: A Holistic Approach. Gov. Inf. Q. 2003, 21. [Google Scholar] [CrossRef] [Green Version]
- Bannister, F. The curse of the benchmark: An assessment of the validity and value of e-government comparisons. Int. Rev. Adm. Sci. 2007, 73, 171–188. [Google Scholar] [CrossRef]
- Zuiderwijk, A.; Janssen, M. Open data policies, their implementation and impact: A framework for comparison. Gov. Inf. Q. 2014, 31, 17–29. [Google Scholar] [CrossRef] [Green Version]
- Harrison, T.M.; Pardo, T.A.; Meghan, C. Creating Open Government Ecosystems: A Research and Development Agenda. Future Internet 2012, 4, 900–928. [Google Scholar] [CrossRef]
- Dawes, S.S. Stewardship and usefulness: Policy principles for information-based transparency. Gov. Inf. Q. 2010, 27, 377–383. [Google Scholar] [CrossRef]
- Hofeditz, L.; Ross, B.; Wilms, K.L.; Rother, M.; Rudolph, D. How to Design a Research Data Management Platform? Technical, Organizational and Individual Perspectives and Their Relations. In Human Interface and the Management of Information: Interacting with Information, Proceedings of the International Conference on Human-Computer Interaction, Copenhagen, Denmark 19–24 July 2020; Springer: Cham, Switzerland, 2020; pp. 324–337. [Google Scholar]
- Gottschalk, P. Maturity levels for interoperability in digital government. Gov. Inf. Q. 2009, 26, 75–81. [Google Scholar] [CrossRef]
- Harrison, T.M.; Guerrero, S.; Burke, G.B. Open government and e-government: Democratic challenges from a public value perspective. Inf. Polity 2012, 17, 83–97. [Google Scholar] [CrossRef]
- Jetzek, T. The Value of Open Government Data: A Strategic Analysis Framework. In Proceedings of the SIG eGovernment pre-ICIS Workshop, Orlando, FL, USA, 15 December 2012. [Google Scholar]
- Alexopoulos, C.; Loukis, E.; Charalabidis, Y.; Tagkopoulos, I. A Methodology for Evaluating PSI E-infrastructures Based on Multiple Value Models. In Proceedings of the Informatics, Piraeus, Greece, 5–7 October 2012. [Google Scholar]
- Srnicek, N. The challenges of platform capitalism: Understanding the logic of a new business model. Juncture 2017, 23, 254–257. [Google Scholar] [CrossRef]
- Dieuaide, P.; Azas, C. Platforms of Work, Labour, and Employment Relationship: The Grey Zones of a Digital Governance. Front. Sociol. 2020, 5. [Google Scholar] [CrossRef] [Green Version]
- Zuboff, S. The Age of Surveillance Capitalism: The Fight for a Human Future at the New Frontier of Power; Profile Books: London, UK, 2019. [Google Scholar]
- Heckman, J.J.; Todd, I.P. Matching as an Econometric Evaluation Estimator. Rev. Econ. Stud. 1998, 65, 261–294. [Google Scholar] [CrossRef]
- Beck, T.; Levine, R.; Levkov, A. Big Bad Banks? The Winners and Losers from Bank Deregulation in the United States. Soc. Sci. Electron. Publ. 2010, 65, 1637–1667. [Google Scholar]
- Zeleti, F.A.; Ojo, A.; Curry, E. Exploring the economic value of open government data. Gov. Inf. Q. 2016, 33, 535–551. [Google Scholar] [CrossRef]
- Magalhaes, G.; Roseira, C. Open government data and the private sector: An empirical view on business models and value creation. Gov. Inf. Q. 2017, 37, S0740624X17302629. [Google Scholar] [CrossRef]
- Peking University Law and Policy Database. Available online: http://www.pkulaw.cn/ (accessed on 26 November 2021).
- The Open Definition. Available online: https://opendefinition.org (accessed on 26 November 2021).
- National Bureau of Statistics. National Data-Publications. Available online: https://data.stats.gov.cn/publish.htm?sort=1 (accessed on 26 November 2021).
- Kou, Z.; Liu, X. China Urban and Industrial Innovation; Report 2017; Industrial Development Research Center of Fudan University: Shanghai, China, 2017. [Google Scholar]
- Pakes, A.; Schankerman, M.A. The Rate of Obsolescence of Knowledge, Research Gestation Lags, and the Private Rate of Return to Research Resources. Nber Work. Pap. 1979. [Google Scholar] [CrossRef]
- Ashenfelter, O. Estimating the Effect of Training Programs on Earnings with Longitudinal Data; Working Papers; Princeton University, Industrial Relations Section: Princeton, NJ, USA, 1976. [Google Scholar]
- Jacobson, L.S.; Lalonde, R.J.; Sullivan, D. Earnings Losses of Displaced Workers. Upjohn Work. Pap. J. Artic. 1992, 83, 685–709. [Google Scholar]
- Li, P.; Lu, Y.; Wang, J. Does flattening government improve economic performance? Evidence from China. J. Dev. Econ. 2016, 123, 18–37. [Google Scholar] [CrossRef]
- Das, A.; Singh, H.; Joseph, D. A longitudinal study of e-government maturity. Inf. Manag. 2016, 54, 415–426. [Google Scholar] [CrossRef] [Green Version]
- Kogan, N.; Lee, K.J. Exploratory Research on the Success Factors and Challenges of Smart City Projects. Asia Pac. J. Inf. Syst. 2014, 24, 141–189. [Google Scholar] [CrossRef]
- Lee, S.; Kim, D.H.; Nam, I. The Impact of Mobile Broadband Infrastructure on Technological Innovation: An Empirical Analysis. International 2015, 22, 93–108. [Google Scholar]
- Nelson, R.R.; Phelps, E.S. Investment in Humans, Technological Diffusion, and Economic Growth. Cowles Found. Discuss. Pap. 1966, 56, 69–75. [Google Scholar]
- Ward, M.R.; Zheng, S.L. Mobile and fixed substitution for telephone service in China. Telecommun. Policy 2012, 36, 301–310. [Google Scholar] [CrossRef]
- Andrea, F.; Stefano, L.; Elena, M.; Giulia, R. Digital Labour in the Platform Economy: The Case of Facebook. Sustainability 2018, 10, 1757. [Google Scholar]
- Lucarelli, S.; Vercellone, C. The thesis of cognitive capitalism. New research perspectives. An introduction. Knowl. Cult. 2013, 1, 2–14. [Google Scholar]
- Morozov, E.; Bria, F. Rethinking the Smart City: Democratizing Urban Technology; Rosa Luxemburg Foundation: New York, NY, USA, 2018; Volume 2. [Google Scholar]
- Mossberger, K.; Tolbert, C.J.; Stansbury, M. Virtual Inequality: Beyond the Digital Divide. Online Inf. Rev. 2003, 28, 4–7. [Google Scholar]
- Veiga, L.G.; Pinho, M.M. The political economy of intergovernmental grants: Evidence from a maturing democracy. Public Choice 2007, 133, 457–477. [Google Scholar] [CrossRef]
- Wirtz, B.W.; Piehler, R.; Thomas, M.J.; Daiser, P. Resistance of Public Personnel to Open Government: A cognitive theory view of implementation barriers towards open government data. Public Manag. Rev. 2016, 18, 1–30. [Google Scholar] [CrossRef]
- Huang, R.; Lai, T.; Zhou, L. Proposing a Framework of Barriers to Opening Government Data in China: A Critical Literature Review. Library Hi Tech. 2017, 35, 421–438. [Google Scholar] [CrossRef]
- Li, Z.; Yang, C.; Hu, F.; Huang, Q.; Liu, K. Big Data and cloud computing: Innovation opportunities and challenges. Int. J. Digit. Earth 2017, 10, 13–53. [Google Scholar]
- Lee, J.; Kao, H.A.; Yang, S. Service Innovation and Smart Analytics for Industry 4.0 and Big Data Environment. Procedia CIRP 2014, 16, 3–8. [Google Scholar] [CrossRef] [Green Version]
- Erdman, A.G.; Keefe, D.F.; Schiestl, R. Grand Challenge: Applying Regulatory Science and Big Data to Improve Medical Device Innovation. IEEE Trans. Bio-Med. Eng. 2013, 60, 700–706. [Google Scholar] [CrossRef] [PubMed]
Figure 1.
Parallel trend test. Note: the circle in the figure indicates the estimated value of β, indicated by the dotted line on the circle β 95% confidence interval.
Figure 1.
Parallel trend test. Note: the circle in the figure indicates the estimated value of β, indicated by the dotted line on the circle β 95% confidence interval.

Table 1.
Variables and data source.
| Variable Type | Variable Name | Description | Data Sources |
|---|---|---|---|
| Control variable | EE | Per capita GDP (yuan) | China City Statistical Yearbook 2009–2016 |
| RE | Proportion of science and technology academic expenditure in public financial expenditure (%) | ||
| IE | Number of Internet broadband access users (10,000 people) | ||
| HE | Number of college students per 10,000 people (person) | ||
| OE | Proportion of foreign direct investment in GDP (%) | ||
| PE | Population density (person/km2) | ||
| Dependent variable | Innovation ability (Y) | China urban innovation index | Report on China’s urban and industrial innovation 2009–2016 |
Table 2.
Descriptive statistical result of innovation.
| Variable | Mean | Std. Dev. | Min | Max | Observations | |
|---|---|---|---|---|---|---|
| Innovation capability (Y) | Overall | 9.42 | 36.99 | 0.01 | 694.05 | N = 1368 |
| Between | 32.40 | 0.05 | 368.77 | N = 171 | ||
| Within | 18.01 | −252.98 | 334.70 | T = 8 |
Table 3.
Basic regression results.
| Variable | (1) | (2) | (3) | (4) |
|---|---|---|---|---|
| Innovation Capability (Y) | Innovation Capability (Y) | Innovation Capability (Y) | Innovation Capability (Y) | |
| Treat × Post | 24.68 *** | 12.40 *** | 13.08 *** | 13.62 ** |
| (7.3057) | (3.6458) | (3.5998) | (4.2164) | |
| EE | 0.000192 *** | 0.000174 *** | 0.000218 *** | |
| (0.0000) | (0.0000) | (0.0001) | ||
| RE | 1.069 | 0.966 | 1.032 | |
| (1.0119) | (1.0181) | (1.0424) | ||
| IE | 0.139 * | 0.133 * | 0.140 * | |
| (0.0682) | (0.0710) | (0.0780) | ||
| HE | 0.0016 | 0.00194 | 0.00169 | |
| (0.0014) | (0.0019) | (0.0020) | ||
| OE | −0.275 | −0.121 | −0.0792 | |
| (0.3464) | (0.5191) | (0.5299) | ||
| PE | 0.0396 | 0.0605 | 0.0614 | |
| (0.0287) | (0.0490) | (0.0492) | ||
| Time-fixed effect | No | No | No | Yes |
| City-fixed effect | No | No | Yes | Yes |
| cons | 7.350 *** | −27.82 | −35.68 | −35.29 |
| (1.8592) | (14.7094) | (25.0065) | (24.5122) | |
| Number of observations | 1368 | 1368 | 1368 | 1368 |
| Adjusted R² | 0.3143 | 0.3153 |
Note: Cluster standard errors in parentheses; *, **, and *** represent 10%, 5%, and 1% significant levels, respectively.
Table 4.
PSM balance test results.
| Variable | Mean | %Bias | %Reduction of Bias | t-Test | |||
|---|---|---|---|---|---|---|---|
| Experimental Group | Control Group | T | p > |T| | ||||
| EE | Pre-match | 60.159 | 36741 | 74.2 | 13.93 | 0.000 | |
| Post-match | 58.381 | 59144 | −2.4 | 96.7 | −0.32 | 0.750 | |
| RE | Pre-match | 2.1652 | 1.1893 | 73.2 | 13.33 | 0.000 | |
| Post-match | 2.1231 | 2.1854 | −4.7 | 93.6 | −0.51 | 0.607 | |
| IE | Pre-match | 116.66 | 49.701 | 70.9 | 14.26 | 0.000 | |
| Post-match | 110.93 | 106.54 | 4.6 | 93.4 | 0.58 | 0.563 | |
| HE | Pre-match | 375.5 | 146.52 | 29.9 | 6.32 | 0.000 | |
| Post-match | 335.1 | 321.33 | 1.8 | 94.0 | 0.28 | 0.781 | |
| OE | Pre-match | 2.8069 | 1.4587 | 43.4 | 8.81 | 0.000 | |
| Post-match | 2.5665 | 2.5073 | 1.9 | 95.6 | 0.41 | 0.683 | |
| PE | Pre-match | 540.06 | 367.93 | 62.0 | 11.08 | 0.000 | |
| Post-match | 529.86 | 523.89 | 2.2 | 96.5 | 0.31 | 0.760 | |
Table 5.
PSM-DID analysis results.
| Variable | (1) | (2) | (3) | (4) |
|---|---|---|---|---|
| Innovation Capability (Y) | Innovation Capability (Y) | Innovation Capability (Y) | Innovation Capability (Y) | |
| Treat × post | 17.78 *** | 8.500 *** | 7.294 *** | 9.503 *** |
| (1.4591) | (1.4276) | (1.7644) | (1.5935) | |
| Time-fixed effect | No | No | No | Yes |
| City-fixed effect | No | No | Yes | Yes |
| cons | 7.343 *** | −18.50 *** | −17.02 *** | −17.25 *** |
| (1.9223) | (2.2696) | (1.8805) | (2.8586) | |
| Number of observations | 1330 | 1330 | 1330 | 1330 |
| Adjusted R² | 0.1612 |
Note: Cluster standard errors in parentheses; *** represents 1% significant levels.
Table 6.
Results of heterogeneity analysis.
| Variable | (1) | (2) | (3) | (4) | (5) | (6) |
|---|---|---|---|---|---|---|
| High Level of Economic Development | Low Level of Economic Development | High Level of Human Capital | Low Level of Human Capital | High Infrastructure Level | Low Infrastructure Level | |
| Treat × Post | 13.14 ** | 0.0147 | 15.41 ** | −0.145 | 14.12 ** | 3.812 |
| (4.9905) | (0.3189) | (5.1340) | (0.2511) | (4.9098) | (2.9426) | |
| Cons | −51.06 | −0.333 | −51.48 | −4.364 | −45.6 | −4.364 |
| (32.5519) | (0.3694) | (34.3587) | (4.9287) | (31.2676) | (4.9287) | |
| City-fixed effect | Yes | Yes | Yes | Yes | Yes | Yes |
| Time-fixed effect | Yes | Yes | Yes | Yes | Yes | Yes |
| Number of observations | 912 | 456 | 912 | 456 | 912 | 456 |
| Adjusted R² | 0.3444 | 0.5557 | 0.3498 | 0.5649 | 0.3256 | 0.5649 |
Note: Cluster standard errors in parentheses; ** represent 5% significant levels.
Publisher’s Note: MDPI stays neutral with regard to jurisdictional claims in published maps and institutional affiliations. |
© 2021 by the authors. Licensee MDPI, Basel, Switzerland. This article is an open access article distributed under the terms and conditions of the Creative Commons Attribution (CC BY) license (https://creativecommons.org/licenses/by/4.0/).
Share and Cite
MDPI and ACS Style
Luo, Y.; Tang, Z.; Fan, P. Could Government Data Openness Enhance Urban Innovation Capability? An Evaluation Based on Multistage DID Method. Sustainability 2021, 13, 13495. https://0-doi-org.brum.beds.ac.uk/10.3390/su132313495
AMA Style
Luo Y, Tang Z, Fan P. Could Government Data Openness Enhance Urban Innovation Capability? An Evaluation Based on Multistage DID Method. Sustainability. 2021; 13(23):13495. https://0-doi-org.brum.beds.ac.uk/10.3390/su132313495
Chicago/Turabian StyleLuo, Yi, Zhiwei Tang, and Peiqi Fan. 2021. "Could Government Data Openness Enhance Urban Innovation Capability? An Evaluation Based on Multistage DID Method" Sustainability 13, no. 23: 13495. https://0-doi-org.brum.beds.ac.uk/10.3390/su132313495
Note that from the first issue of 2016, this journal uses article numbers instead of page numbers. See further details here.