Article

Research on Substation Project Cost Prediction Based on Sparrow Search Algorithm Optimized BP Neural Network

1
School of Economics and Management, North China Electric Power University, Beijing 102206, China
2
Beijing Key Laboratory of New Energy and Low-Carbon Development, North China Electric Power University, Beijing 102206, China
*
Authors to whom correspondence should be addressed.
Sustainability 2021, 13(24), 13746; https://0-doi-org.brum.beds.ac.uk/10.3390/su132413746
Submission received: 24 November 2021 / Revised: 9 December 2021 / Accepted: 10 December 2021 / Published: 13 December 2021

Abstract

:
The prediction of power grid engineering cost is the basis of fine management of power grid engineering, and accurate prediction of substation engineering cost can effectively ensure the fine operation of engineering funds. With the continuous expansion of the engineering system, the influencing factors and data dimensions of substation project investment are gradually diversified and complex, which further increases the uncertainty and complexity of substation project cost. Based on the concept of substation engineering data space, this paper investigates the influencing factors and constructs the static total investment intelligent prediction model of substation engineering. The emerging swarm intelligence algorithm, sparrow search algorithm (SSA), is used to optimize the parameters of the BP neural network to improve the prediction accuracy and convergence speed of neural network. In order to test the validity of the model, an example analysis is carried out based on the data of a provincial substation project. It was found that the SSA-BP can effectively improve the prediction accuracy and provide new methods and approaches for practical application and research.

1. Introduction

At present, a new round of power system reform is deepening, and the major changes in the supervision mode and profit mode of power grid enterprises are constantly exerting pressure on power grid enterprises. In the context of the impact of enterprise income accounting methods on their profits [1], how to further optimize the efficiency of capital utilization and the level of capital control in the operation mode of “reducing costs and improving benefits” has become one of the research priorities of power grid enterprises. With the development of economic construction, power grid construction projects, as important national power supply carriers, need a lot of money from power grid enterprises due to their capital-intensive and technology-intensive characteristics. Under the background of a new round of power system reform, the operating pressure of power grid enterprises makes it necessary to further improve the lean level of engineering investment and improve the accuracy of engineering cost analysis. Therefore, more accurate project cost prediction should be carried out to reduce investment costs and provide investment decision-making basis for enterprises [2].
As an important part of the power system, substation engineering has obvious characteristics of integration and uncertainty [3]. Substation project cost refers to the total cost of a series of investment management activities required for substation investment and construction projects. Different engineering types, influencing factors, and construction time will have a direct impact on substation project cost. With the increasing planning and construction scale of power transmission and transformation projects, most enterprises have accumulated a great deal of engineering construction cost records and data when participating in engineering construction. If massive data are only stored in the database, they cannot be well used and applied to the construction of power grid projects, which will cause the waste of enterprise data resources.
Therefore, the accurate prediction of substation project investment is conducive to improving the economic efficiency of substation construction projects, optimizing the level of substation project cost control, realizing the full and effective analysis and utilization of cost data, and providing scientific decisions and help for the investment management of power grid enterprises [4].
Most scholars found in their research on substation engineering that an important reason why it is difficult to implement cost control of substation engineering is the high-dimensional and dynamic nature of its influencing factors [5]; therefore, a lot of the literature has made the influencing factors the focus of cost control of substation construction projects. To meet the requirements of refined management of cost of transmission and substation projects, Chen et al. [6] used a multiple regression method to find the scale factors that have greater influence on the cost of transmission and substation projects, and through the analysis of the factors affecting the cost, he distinguished the scale factors, market factors, factors of external environment of the project, design technology, and construction standards, and clarified the key factors of cost reasonableness assessment. Lu et al. [7] focused on the external influences of transmission and substation projects, but the article did not validate the proposed theory with examples. Starting from the assembly type system, Sun et al. [8] innovatively analyzed the influencing factors of assembly-type substation cost. Wang and Ding [9] analyzed the key influencing factors of the principal cost of power transmission projects, classified the key factors into linear and nonlinear, and then established a cost prediction regression model. In the study of previous articles, it is found that the independent prediction of substation engineering investment in the past is less. Additionally, the process of establishing the influence factors on the cost of substation projects is relatively rough, and a more systematic approach to the determination of the influence factors is not adopted. Therefore, this paper will adopt reasonable index selection method, starting from the technical factors based on cost composition which have great influence on substation project cost, and further analyze its influence on total cost.
Due to many influencing factors of substation engineering, scholars also try to improve the prediction accuracy through different prediction methods, thus, achieving the prediction effect. The fuzzy mathematics principle [10], regression analysis method [11], and other mathematical prediction methods are widely used in early prediction because of their simple calculation and ease of understanding. However, due to the complexity and uncertainty of the influencing factors of substation engineering, this type of prediction method is less capable of handling complex nonlinear problems. With the continuous improvement and development of forecasting methods, some modern forecasting methods, such as the grey forecasting method [12,13,14], time series method [15], system dynamics method [16], combined prediction method [17], etc., have also been gradually applied. Along with the development of increasingly sophisticated computer technology, the integration of mathematical principles with computer skills can make the forecasting method embody the characteristics of intelligence. As time goes by, the advantages of intelligent algorithms are gradually reflected. Intelligent algorithms are a form of “soft computing” that simulate the habits, the behavior, and the bodily functions of animals to obtain algorithmic models. SVM [18,19], neural networks [20,21], and other intelligent algorithms, and their optimization algorithms [22] have achieved better research results in recent years. In the literature [23,24], the authors propose different perspectives to optimize the parameters of the SVM prediction model. Among them, Peng et al. [23] uses the adaptive particle swarm algorithm to optimize the parameter setting and optimization of support vector machine so that the parameters and the engineering data achieve a good combination, and the proposed APSO-SVM prediction model is verified by an example. After optimizing the model using the firefly algorithm, Song et al. [24] performed a validation of the prediction model based on 220 kV substation engineering data. Lin et al. [25] introduced PCA to reduce the dimensionality of substation project cost data, and then used the particle swarm optimization algorithm to optimize the model parameters, to provide a reliable basis for investment decision of substation projects. Guo et al. [26] used a genetic algorithm to adjust the weights and thresholds of a BP neural network, according to the principle of error backward conduction, and proved the value of this method in the application of cost prediction through the example of engineering cost index. The literature [27] proposed a combined model based on particle swarm optimization SVR to predict the transmission project in a region, and the results showed that the use of the combined model is scientifically effective for estimating and reviewing the cost of transmission projects. Based on past data, Duan et al. [28] used a BP neural network to achieve accurate project investment prediction from a non-linear perspective. Although the current research on intelligent algorithms is relatively extensive, the use of prediction methods is more demanding due to the wide range of influencing factors of power grid projects. Among many intelligent algorithms, the BP neural network has better organization and self-adaptability. The optimization of BP neural networks can further grasp the nonlinear relationship between influencing factors and project cost, thus, providing a new idea for substation project cost prediction.
At present, scholars have studied the prediction of substation project cost. However, due to the influence of internal and external, dynamic, and static factors, the complexity of influencing factors also increases the difficulty of its prediction [29]. Existing research on index mining of engineering cost technology is relatively rough; at the same time, although some intelligent prediction methods have improved the prediction technology, some algorithms are still not suitable for dealing with nonlinear problems and easily fall into local optimum, which is not highly applicable to substation projects that need to deal with a large amount of input data, and there is an urgent need to find an intelligent optimization algorithm to improve the prediction accuracy. Therefore, this paper proposes a swarm intelligence optimization algorithm with strong adaptability and good stability, which is derived from the imitation of biological group behavior in nature, and comprehensively investigates the technical factors that have great influence on project cost, and proposes a new way to solve the optimal problem.
Compared with the classical swarm intelligence optimization algorithm, the newly proposed sparrow search algorithm in 2020 simulates the process of sparrow flock foraging and has the advantages of fast convergence and strong search ability. Compared with other swarm intelligence optimization algorithms, SSA takes all possible factors of group behavior into account so that it can quickly converge near the optimal value. Although the improved classical algorithms such as APSO can improve the performance of the algorithm, it needs to be improved in large-scale problems due to the increase of computation and time consumption. In order to overcome the drawback that the SSA is easy to fall into local optimum, Shi et al. [30] proposed an evaluation model based on an FASSA-BP algorithm and studied the maturity evaluation of intelligent manufacturing capability based on the maturity theory and the firefly disturbance strategy. Li et al. [31] proposed an SSA-BP model to predict the stress of reinforced concrete beams. The empirical analysis shows that the proposed model is superior to the traditional BP neural network in accuracy and robustness. Aiming at the shortcomings of an unstable model caused by random input weights and thresholds of extreme learning machine (ELM), Liu et al. [32] proposed the use of a sparrow search algorithm to optimize the combined prediction model of ELM to achieve accurate prediction of wind power. Hu et al. [33] used tournament algorithm to improve the SSA and proposed an ISSA-LSSVM prediction model for short-term power load forecasting. Through the verification of test functions, it was found that the improved SSA optimization performance is improved and more stable. Some scholars have applied the sparrow search algorithm to model construction and optimization in many fields. Different from other similar studies, this paper applies the emerging intelligent algorithm to the field of substation project cost prediction, carries out a more comprehensive technical index mining of substation engineering, and proposes an intelligent prediction model of substation project cost based on BP neural network optimized by sparrow search, which provides new ideas for substation project cost prediction research. The innovations of this paper are as follows:
(1)
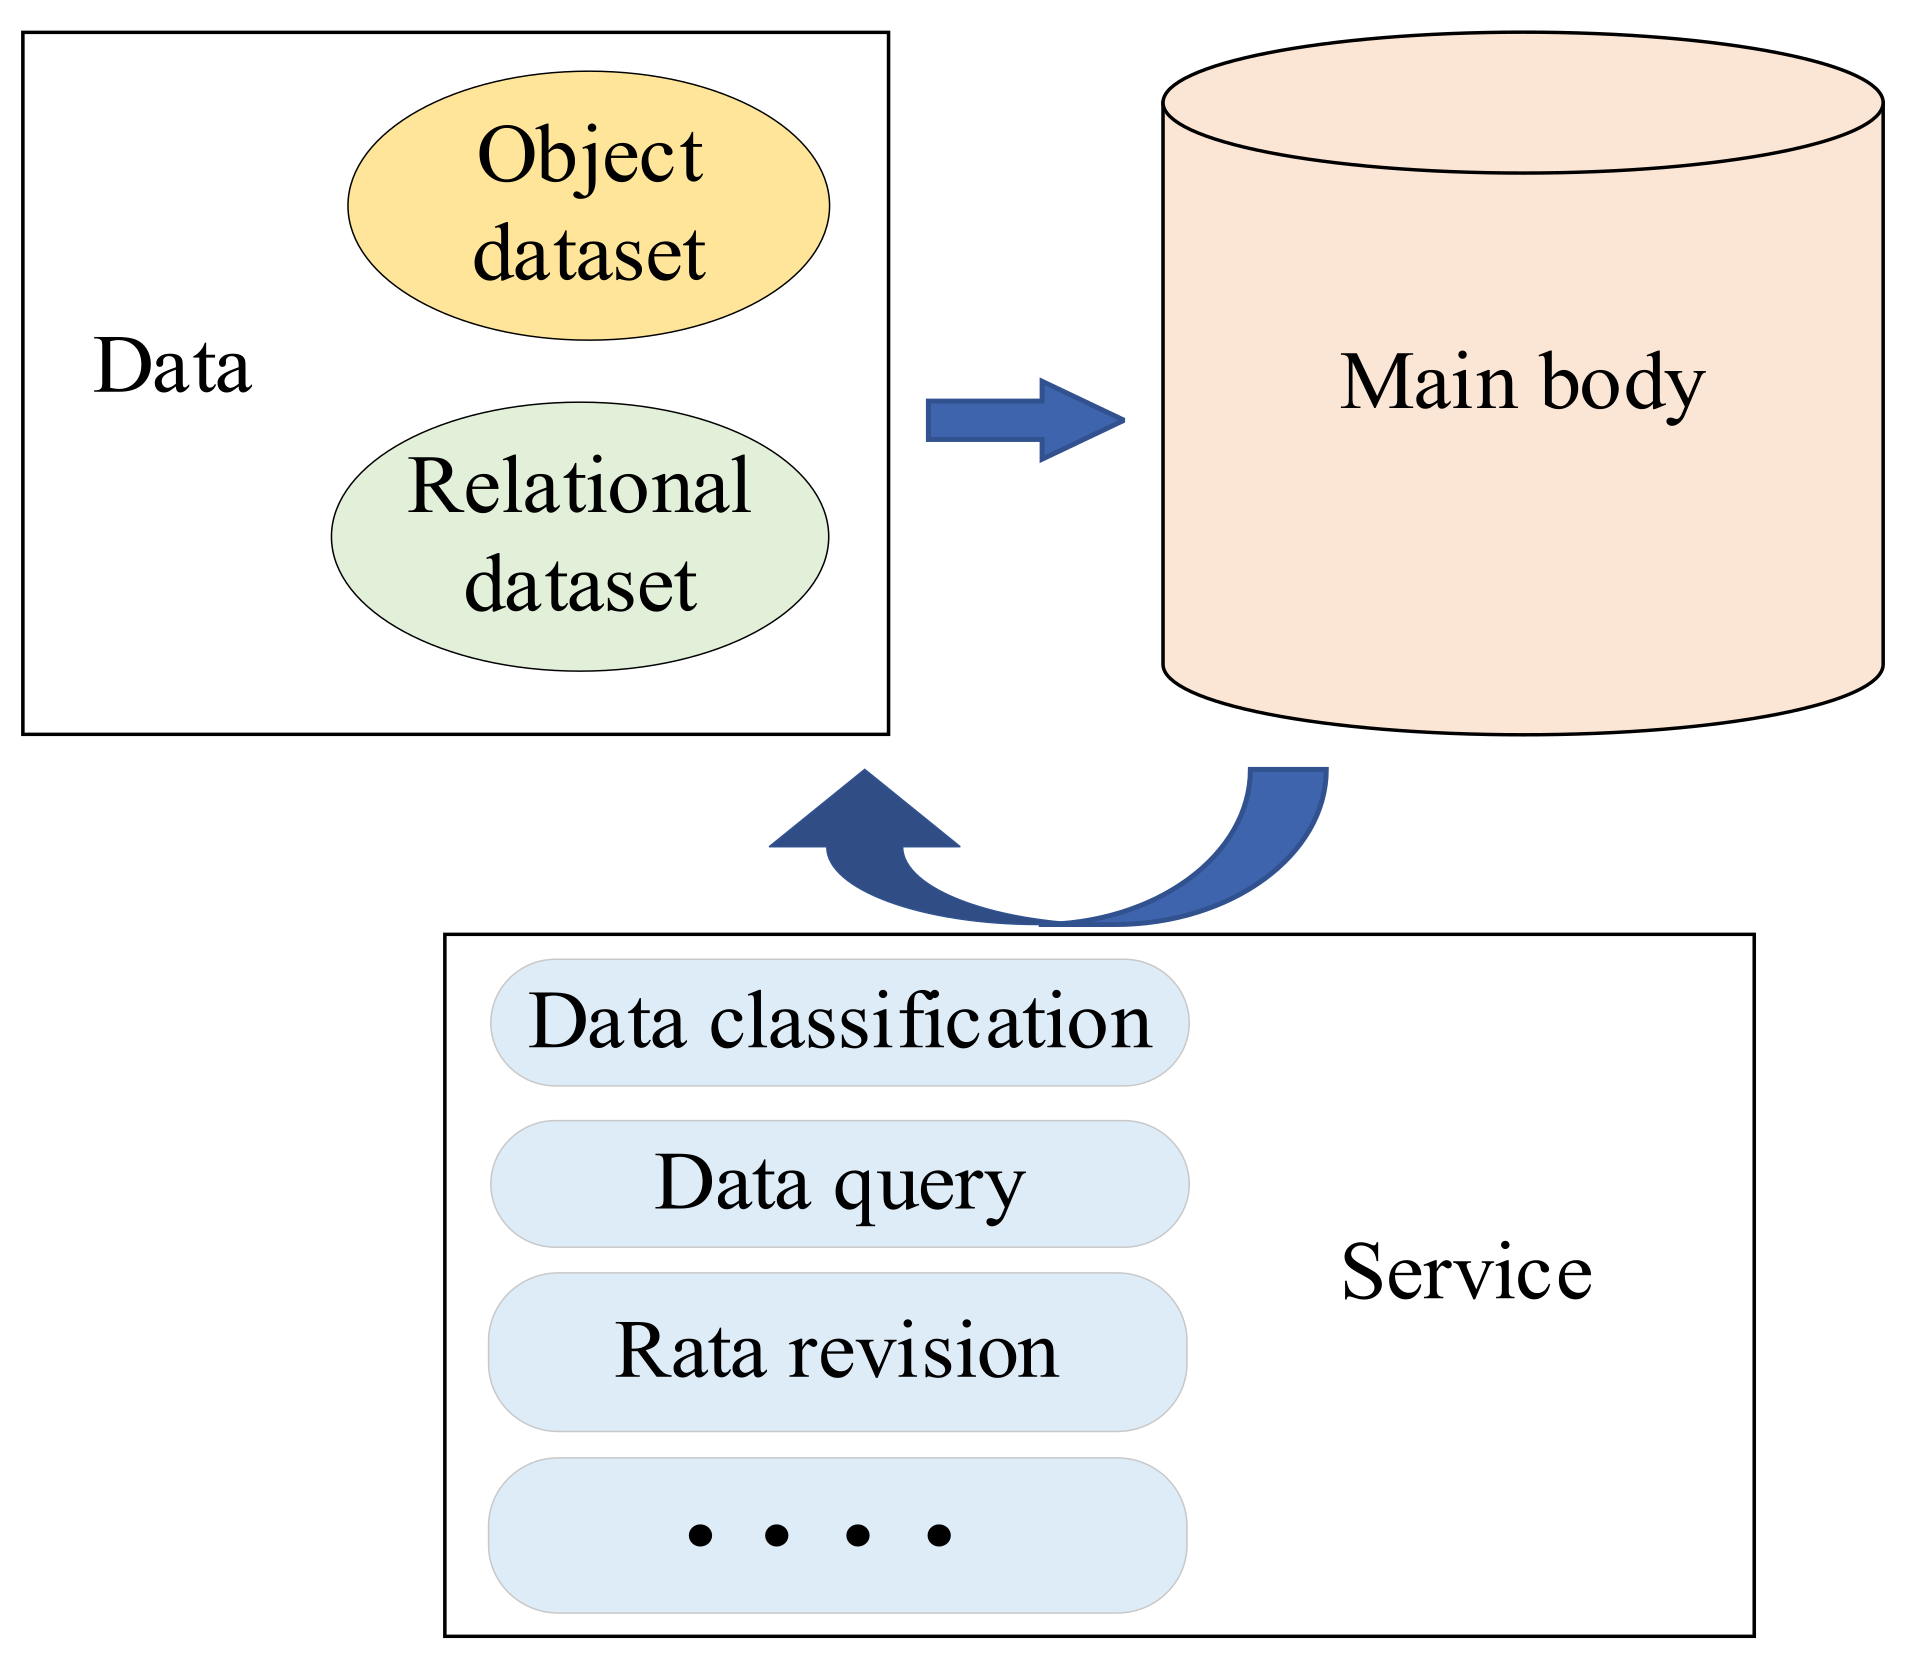
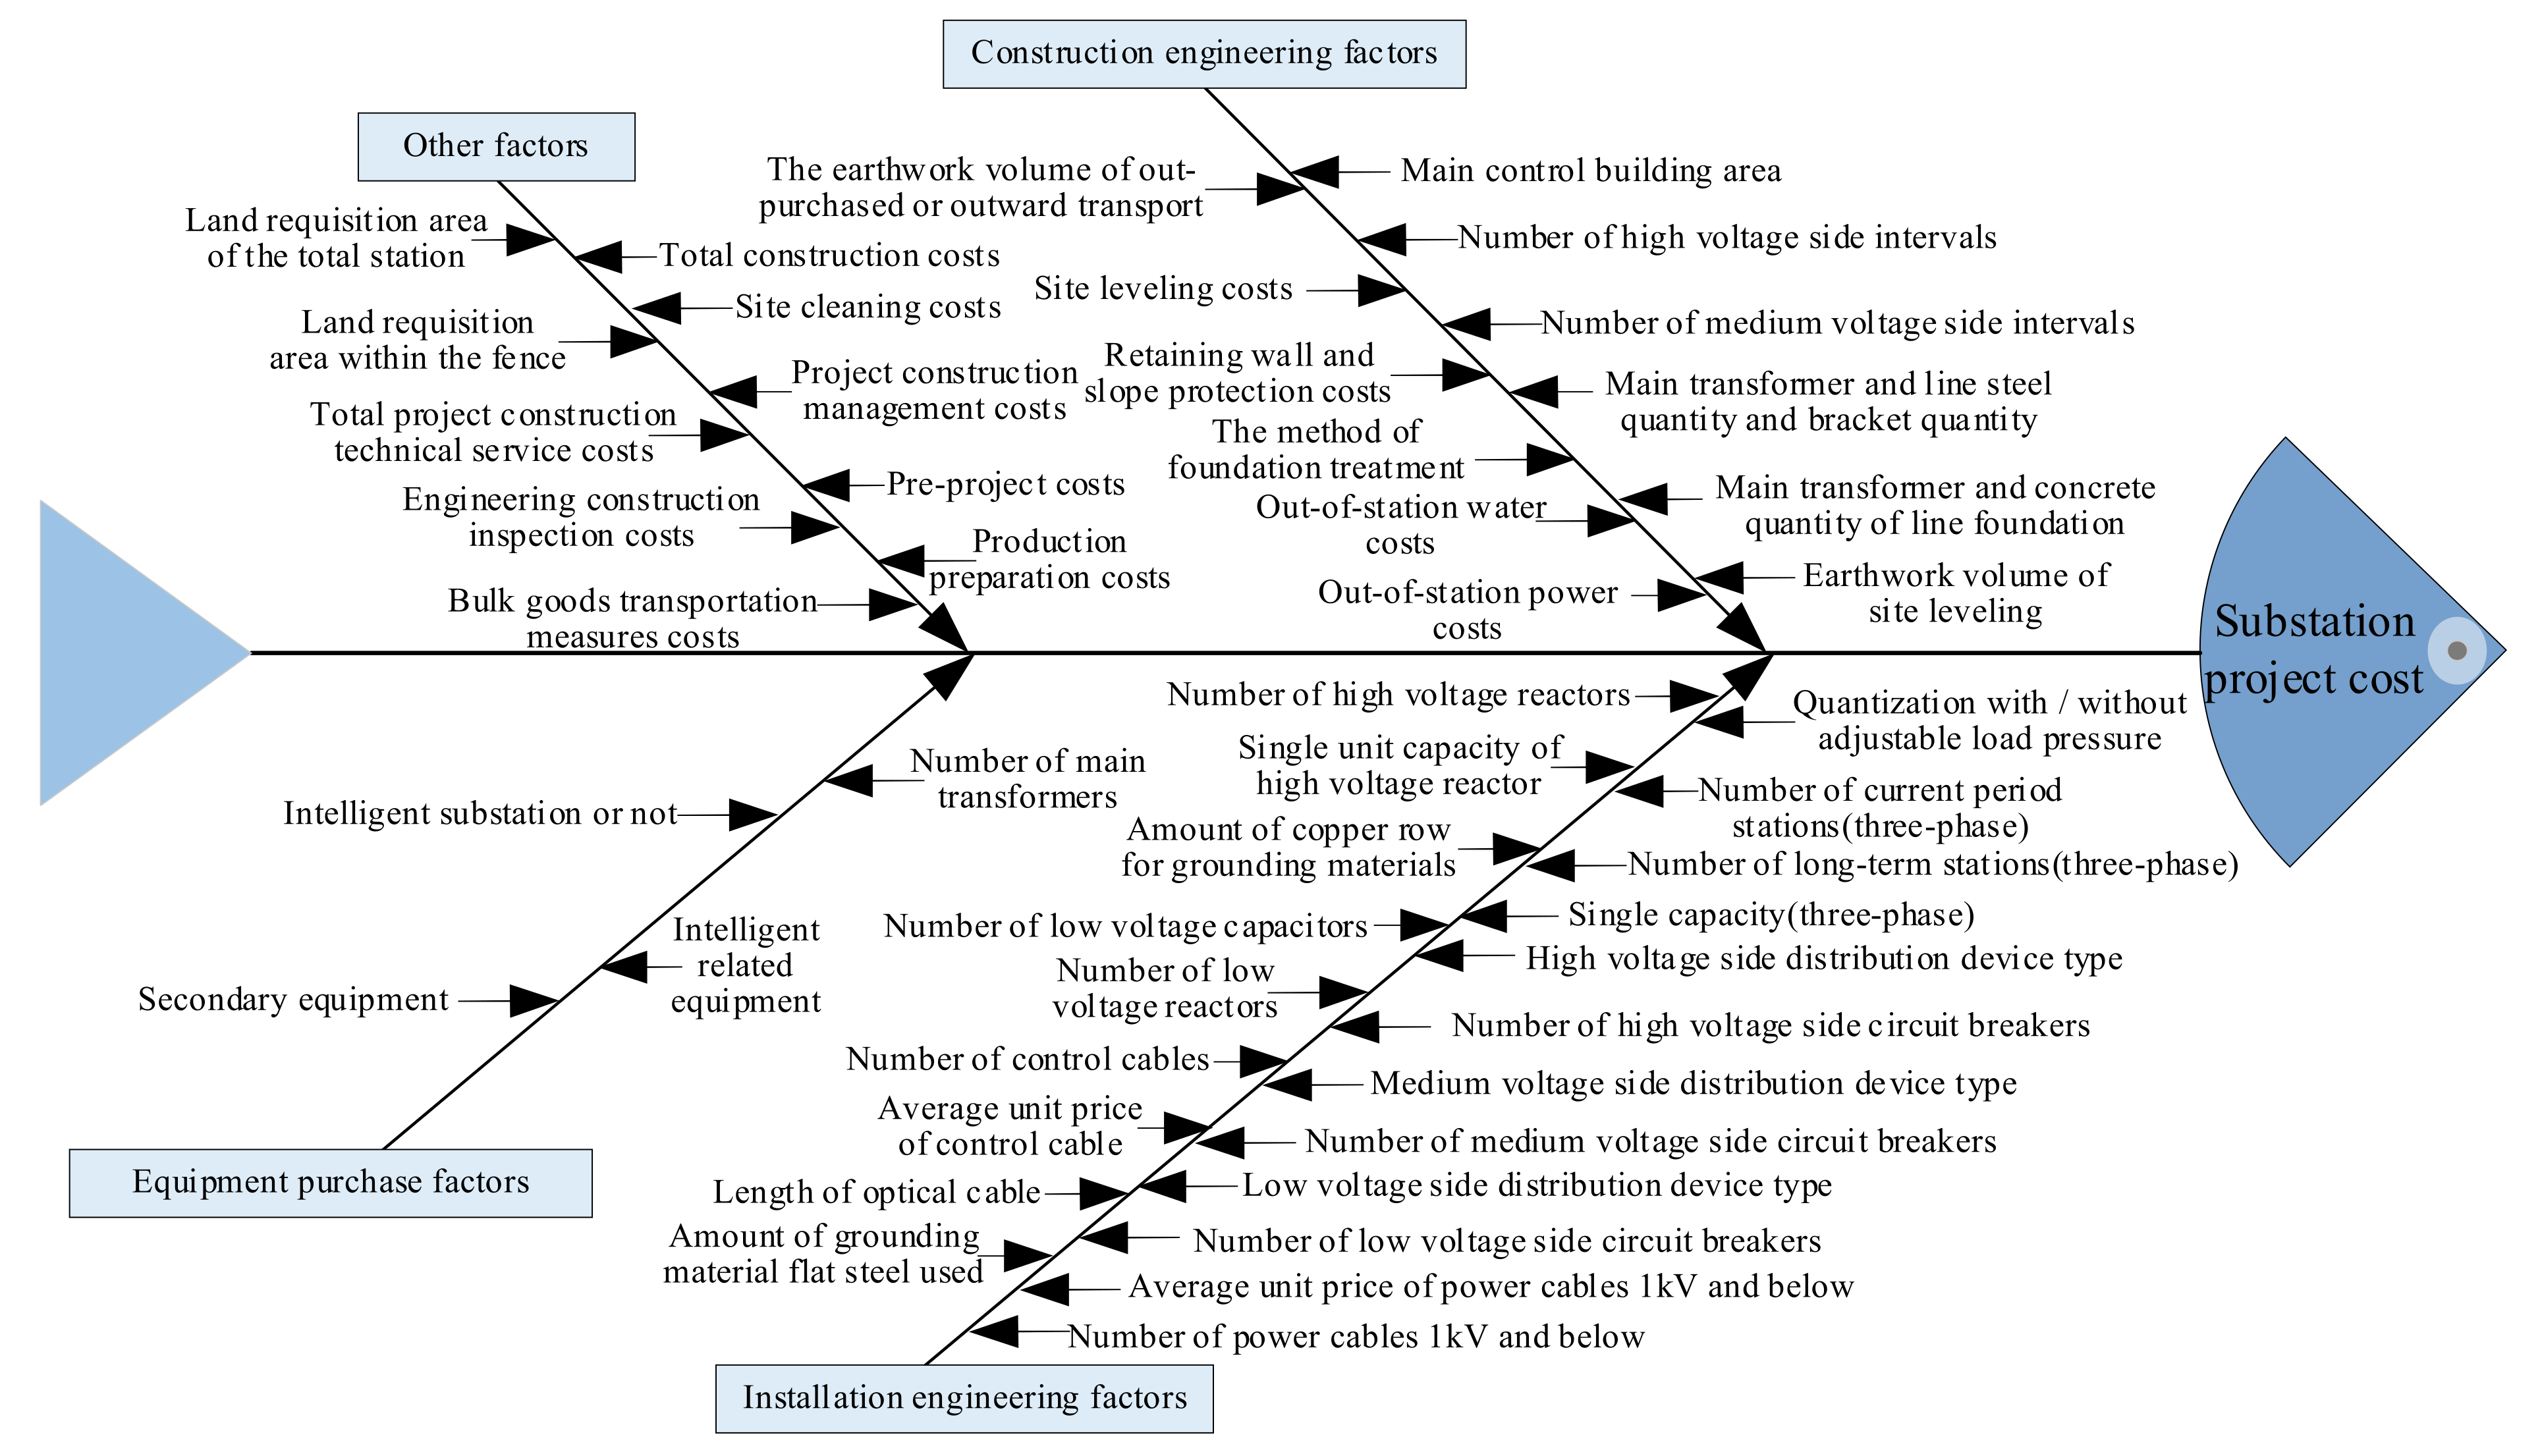
Starting from the concept of data space, this paper uses the data of the whole life cycle of substation engineering to comprehensively investigate the factors of substation engineering cost and the index library of substation project cost factors based on technical factors is constructed after secondary screening.
(2)
For the first time, the sparrow search algorithm is used to optimize a BP neural network for the prediction of substation project cost. Based on model input indexes, the SSA is used to optimize the weights and thresholds of a BP neural network, so as to construct an SSA-BP prediction model to predict the substation project cost.

2. Research on Influencing Factors Identification of Substation Project Cost Based on Data Space

2.1. Data Space

With the development of digital technology and the internet, the huge sharing of information has led to new characteristics of data management [34]; one is the massive amount of data and the other is the sharing of data. The new data characteristics have made the original data management technology unable to cope with the new challenges, thus, giving rise to the concept of data space.
Data space is a concept for the subject and contains all the data related to the subject and its relationships [35]. This is a new data management concept different from traditional data management, and it is also a subject-oriented data management technology. It mainly has the following characteristics:
(1)
Object-oriented as the main body. In the past, the object-oriented data management was business-oriented, but nowadays the data space is organized and integrated for the data needed by the subject and necessary.
(2)
Consider the whole life cycle. Big data and database technologies often cannot consider the whole life cycle of data, and the data space can be described as a data store with multiple labels for the whole life cycle of objects.
(3)
Effectively break the data barriers. One of the main reasons for the complexity and low efficiency of enterprise work is that the data barrier is not broken. The emergence of the concept of data space can be used as a powerful weapon to break the “isolated data island”, so that all levels of departments can use relevant data uniformly, thus, improving work efficiency and decision-making level.
Subject, data set, and service are three elements of data space, as shown in Figure 1. The subject is the description object of data space. The power transmission and transformation project is regarded as a network system with multiple subjects, which includes both the subject of network node substation and the subject of network connection line transmission line. Data set refers to the set of controllable data, including the object data set and the relational data set between objects. In turn, the subject manages the data through service behaviors, such as data classification and data query.
The data space of each subject contains all the relevant data that can be used and interacted with in the whole life cycle. Among them, the data space of substation engineering includes all the data of the whole life cycle, such as researchable estimation, preliminary design budget, and construction drawing budget. It includes not only its own financial data and construction data, but also the daily maintenance, equipment operation, and other related data involved in the life cycle. Based on this, this paper will conduct factor mining on the substation project cost and lay the analysis foundation for further research.

2.2. Construction of Primary Selection Library for Influencing Factors of Substation Project Cost Prediction

Under the development situation of power grid engineering, the engineering construction projects have the characteristics of a long construction period, high investment cost, and close internal correlation, which means there are many uncertainties affecting the project cost. If improvement of the grid substation project cost specialization, refinement, and standardization degree, is wanted, the study of substation project cost impact factors is essential.
Fishbone diagram analysis is one of the methods often used in causal analysis. It is essentially a tool for discovering the underlying causes of things; thus, it can be called a “causal diagram”. However, it is also called “fishbone diagram” because of its resemblance to a fishbone. This is an analysis method of progressive decomposition of the causes of the results and the factors that form things from the outside to the inside and from the top to the bottom in the form of a brainstorm after determining the research object. The specific analysis process is shown in Figure 2. In the whole fishbone, the factors between adjacent levels are subordinate and related. According to different purposes, fishbone diagrams can be divided into three categories, namely, problem fishbone diagram, reason fishbone diagram, and countermeasure fishbone diagram.
Through investigation and research, establishing the substation engineering cost impact factors can be roughly divided into policy factors, management factors, and technical factors. Construction engineering factors, installation engineering factors, equipment purchase factors, and other factors are all technical factors. In this paper, the fishbone diagram analysis method is used to conduct data mining based on substation engineering information, and feature extraction and screening of the construction-related data of the whole life cycle in its data space are carried out as the basis for the prediction of substation engineering cost. Considering that policy factors and management factors have little variability and are difficult to quantify, the fishbone diagram method here only analyzes the technical factors based on cost compositions that have the greatest impact on substation engineering investment, as shown in Figure 3 below.

2.3. Grey Relation Analysis

Grey relation analysis (GRA) is a multi-factor statistical analysis methodology that describes the strength, magnitude, and order of the relationship between factors by using the grey relation degree based on the sample data of each factor [36]. A certain index is related to some other factors affecting the project cost; by applying the grey correlation analysis methodology, relevant conclusions are drawn from a holistic view of things and phenomena that are influenced by multiple factors and are evaluated in a comprehensive manner. The basic idea is to determine whether the association is strong or not based on the similarity of the changes between the series variables. The greater the degree of similarity, the greater the degree of association between the corresponding series, and vice versa.
In this paper, the grey relation method is used to further screen the factors influencing the cost of substation projects and determine the appropriate input indexes of substation project cost prediction. The analysis steps are as follows:
(1)
Determination of the evaluation index system according to evaluation purpose. Collecting evaluation data and determining the parent series and subseries; the parent series being the target series and the subseries being the series consisting of the relevant influencing factors.
(2)
Dimensionless processing of sequences. Since the physical significance of each factor is not the same, the data are dimensionless when screening the indicators in order to facilitate comparison and, thus, draw correct conclusions.
The most used processing method is averaging, as follows Equations (1) and (2):
Y i 0 = X i 0 X ¯ i 0
Y i j = X i j X ¯ i j
Y i 0 and Y i j represent the normalized values of parent sequences and subsequences, respectively. X ¯ i 0 and X ¯ i j represent the average values of parent sequences and subsequences.
(0,1) Standardization, as shown in Equation (3):
X = X M i n M a x M i n
where X represents the normalized value, X represents the value before normalization, M i n represents the minimum value in the sequence, and M a x represents the maximum value in the sequence.
z-score standardization, as shown in Equation (4):
X = X X ¯ σ
where X represents the normalized value, X represents the value before normalization, X ¯ is the mean of the original data, and σ is the standard deviation of the original data.
(3)
Find the absolute difference. Firstly, the absolute difference of the sequence needs to be calculated, as shown in Equation (5). Let be the absolute difference Y i 0 between and Y i j :
i j = Y i 0 Y i j
Then calculate the grey relation coefficient, as follows Equations (6)–(8):
r i j = min + ρ max i j + ρ max
max = i j max
min = i j min
where min and max denote the minimum and maximum values of all absolute difference i j , respectively; ρ is the distinguishing coefficient, the range is [0,1], and the value is usually 0.5.
(4)
Find the grey relation degree. Using an arithmetic average method to calculate grey relation degree, as shown in Equation (9):
r j = 1 n i = 1 n r i j
where r j is the grey correlation degree between the parent sequence and the subsequence, which is also called sequence correlation degree, average correlation degree and linear correlation degree. The closer this value is to 1, the higher the correlation is.
(5)
Ranking the correlation degree. The calculated correlation r j is sorted from large to small or from small to large, and the analysis results are obtained.

3. Intelligent Prediction Model of Substation Project Cost Based on Sparrow Search Algorithm Optimized BP Neural Network

3.1. BP Neural Network

Back Propagation neural network (BPNN) is a multi-layer feed-forward neural network trained according to the back propagation algorithm, which is a more traditional neural network. The basic idea is the gradient descent methodology, which continuously tweaks the thresholds and weights of the network by back propagation to minimize the error, and it is one of the most popular neural network models.
BPNN has good organization and adaptability. Through sample learning, nonlinear problems can be solved [
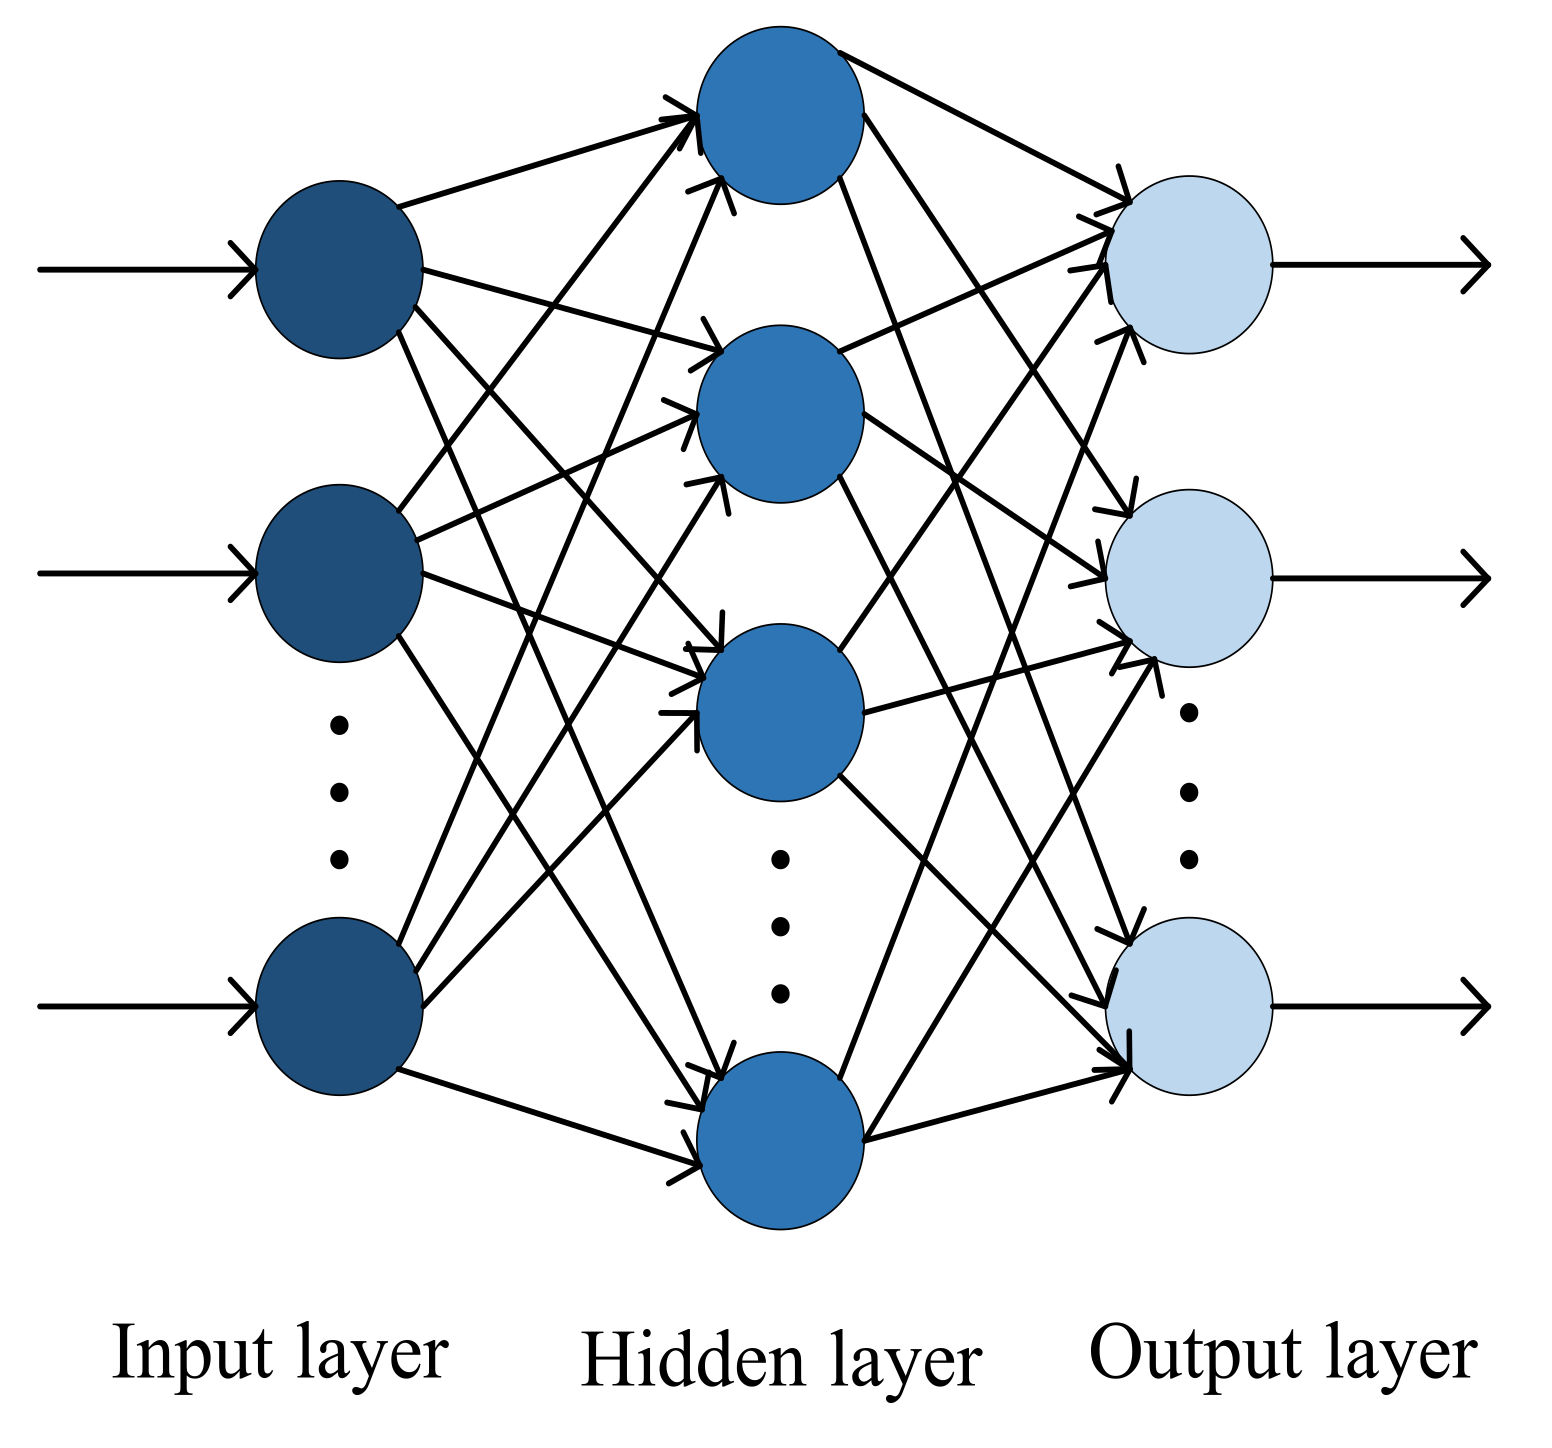
37]. The standard BPNN architecture is composed of three layers: the input layer, the hidden layer, and the output layer. The hidden layer can be multi-layer, and the neurons in each layer form a full connection. The basic structure of BP neural network is shown in Figure 4. In the network structure constructed in this paper, the input layer dimension is consistent with the number of screening factors, and the output layer dimension is the cost of substation project.
The learning process of BPNN consists of two parts: forward propagation of information and backward propagation of errors. Forward propagation of information from the input layer through the hidden layer to the output layer. If the output result of the output layer does not match the desired layer, the process of back propagation of the error is entered. The application of the above process continuously reduces the error until it meets the expectation. Since the three-layer neural network has been able to solve simple nonlinear problems, it is most widely used.

3.2. Basic Principle of Sparrow Search Algorithm

The sparrow search algorithm (SSA) is an optimization algorithm proposed in 2020 based on the feeding behavior and anti-predator action of sparrows [38]. In the SSA, each sparrow has three possible behaviors:
(1)
As discoverers, searching for food.
(2)
As joiners, using the finders to obtain food.
(3)
As scouts, finding danger to decide whether the group continues to forage.
In the sparrow search algorithm, discoverers with better fitness values prioritize access to food during the search. The discoverer usually has high reserves of energy. As the role of guiding the population to find the foraging direction and region, there will be a wider range of food search than the joiners. In order to get a higher fitness value, some joiners choose to monitor the discoverer at any time during the foraging process, thereby increasing their chances of getting food. The number of scouts generally only accounts for a small part of the whole population. They are responsible for monitoring and early warning. Scouts alert the entire population to anti-predatory behavior when danger is detected during foraging. The basic process of SSA is to: initialize the sparrow population; calculate the individual fitness values and determine the best and worst fitness individuals; update the discoverer, joiner, and scout positions in turn; and update them through continuous iterations until the termination conditions are met.
The discoverer updates the location according to the foraging rules, described as follow Equation (10):
X i , j t + 1 = X i , j t exp ( i α i t e r max ) , R 2 < S T X i , j t + Q L , R 2 S T
where t indicates the number of current iterations, i t e r max denotes the maximum number of iterations, and X i j represents the location information of the i sparrow in j the dimension. α ( 0 ,   1 ] is a random number, R 2 represents alarm value, and S T represent security value. Q is a random number obeying normal distribution, L represents a matrix of 1 × d , and the factors in the matrix are all 1. When R 2 < S T , this means there are no predators around the food environment and it is within a safe range, the discoverer can search for food. When R 2 S T , indicating that some sparrows in the population have found predators and issued a warning, all sparrows will fly to a safe place to feed.
The joiner updates its position by following the finder or by competing for food, this is described by the following Equation (11):
X i , j t + 1 = Q exp ( X w o r s t t X i , j t i 2 ) , i > n / 2 X P t + 1 + X i , j t X P t + 1 A + L , i n / 2
where X P is the current optimal location that the discoverer occupies, and X w o r s t is the worst position. A represents a matrix of 1 × d , and each factor in the matrix is assigned a random value of 1 or −1. When i > n / 2 ,the joiner does not obtain food and needs to fly elsewhere to forage at this point to obtain a higher fitness value.
When scouts perceive the population danger, they will conduct anti-predator behavior and update the corresponding location, as shown in Equation (12):
X i , j t + 1 = X b e s t t + β X i , j t X b e s t t , f i > f g X i , j t + K ( X i , j t X w o r s t t ( f i f w ) + ε ) , f i = f g
Among them, X b e s t is the current globally optimal location. β is the control parameter of the step size and obeys a random number with a normal distribution with mean 0 and variance 1, K is a random number in interval [−1, 1], f i is the current fitness value of the individual sparrow, f g denotes the present globally optimal fitness value, f w denotes the present worst fitness value, and ε is the minimum constant that exists to prevent the denominator from being 0. When f i > f g , indicating that the sparrow at the margins of the population, vulnerable to predator attacks.

3.3. SSA-BP Prediction Model

The BP neural network has solved many application problems, but with the expansion of application scope, some shortcomings have also been exposed, such as slow convergence of the algorithm and the ease of falling into a local extreme value. The SSA can speed up the convergence speed and improve the solution accuracy. Optimizing BP neural networks using the SSA allows them to be applied to a broader range of applications.
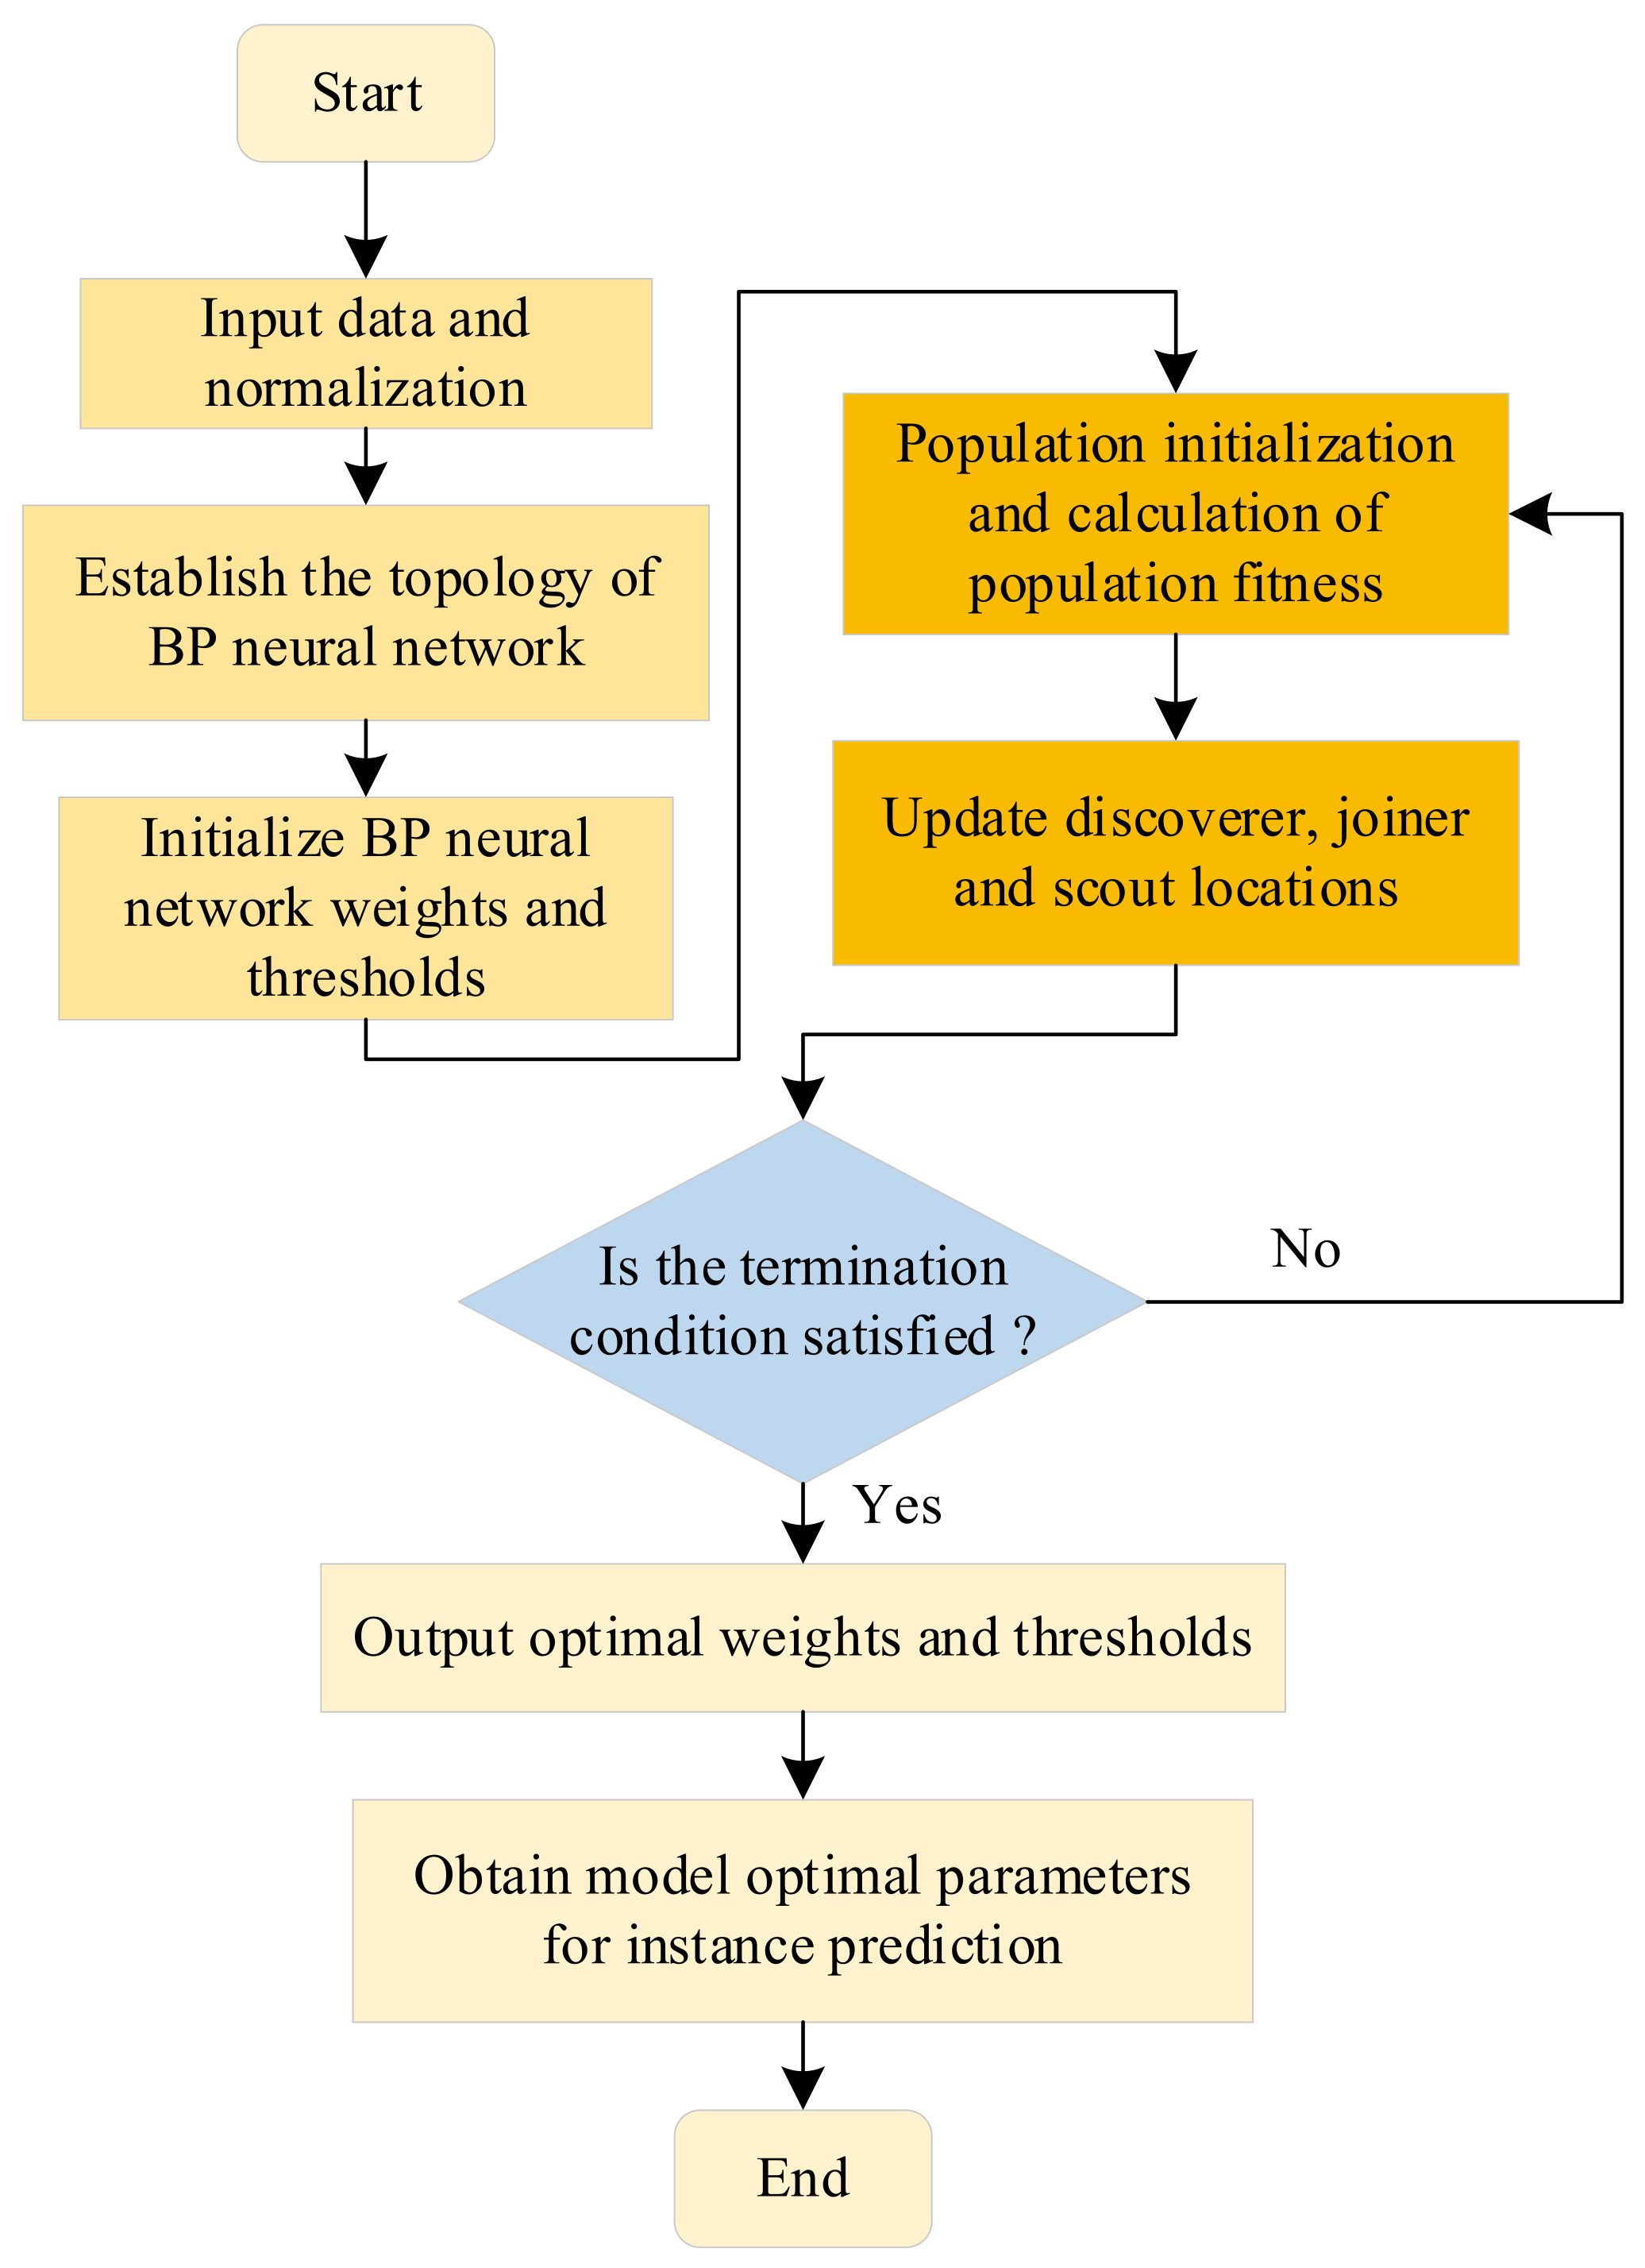
This article uses the sparrow search algorithm to optimize the weights and thresholds of the BP neural network to obtain more accurate results. The specific realization process is shown in the following steps.
(1)
Data preprocessing. Including dividing the training and test sets and normalizing the data.
(2)
Determine the BPNN topology. The nodes of input layer and output layer are obtained by size function, and the determination of hidden nodes uses the cycle process, the minimum error in the cycle process corresponds to the optimal hidden layer node.
(3)
Initialize BPNN weights and thresholds.
(4)
The SSA is used to seek the optimal value and threshold. It includes calculating population fitness, foraging behavior, and anti-predator behavior.
(5)
Output BP neural network optimal parameters.
(6)
Get the optimal parameters of the model for instance prediction.
The specific model framework is shown in Figure 5:

4. Case Analysis

4.1. Select Samples

To verify the intelligent prediction model of substation engineering cost, based on the concept of data space, this paper selects the substation engineering data of a province in recent five years as samples for data processing and screening from the whole life cycle data of substation engineering. Finally, 30 sample data are selected as test sets to verify the accuracy of the model, and other data sets are used as training sets for network training.

4.2. Determine Model Input Indexes

It can be known from the above primary election library of sensitive factors of substation engineering cost that the technical factors of substation project cost are composed of construction engineering cost, installation engineering cost, equipment purchase cost, and other costs. Taking the installation engineering cost as an example, according to fishbone diagram analysis, there are 21 primary libraries of installation engineering cost factors, as shown in Table 1 below.
Equations (4)–(9) is used to further screen the relevant factors of the primary library to obtain the model input index. To maintain a high correlation between input and output metrics, therefore, combined with the correlation degree of the influencing factors and expert experience, 0.8 is used as the threshold to screen the installation engineering cost. As shown in Figure 6 below, X4, X10, X15, X16, and X18 are finally selected as the input indexes of installation engineering cost.
Similarly, the grey correlation analysis method was used to establish input indicators by analyzing the differences in grey correlations among factors and conducting secondary screening of factors related to construction engineering cost, equipment acquisition costs and other costs. Identifying the impact indicators of the substation project cost has certain guiding significance for effectively controlling the cost and making reasonable investment plans. The technical factors of the substation project cost run through the whole project life cycle. By using the grey relation analysis method, the input indexes of substation project cost model are analyzed. The advantages are that it requires a lower sample size and is simple to calculate, and the results are more compatible with qualitative analysis. This article analyzed the input indicators of substation project cost related factors by GRA, and finally obtains 20 indexes of model input. The results of the analysis are shown in Table 2.

4.3. Prediction Results and Comparative Analysis

Through the analysis of substation engineering data samples in the last 5 years, the SSA-BP prediction model is trained and tested. The process is as follows:
The specific realization process is shown in the following steps.
(1)
Process Data. There are four methods of data dimensionless: normalization, regularization, standardization, and centralization. Since the normalized data has the advantage of improving the rate of convergence and accuracy of the model, this article selects the normalization method to conduct dimensionless processing of the data. The normalization method is also called deviation standardization, which maps the data to a specific interval [0,1] after the linear conversion of the original data. The conversion function is shown in formula (3).
(2)
Determine the structure and initialize the parameters. According to the above analysis, the selected 20 impact factors are used as input indexes, and the static total investment of substation is used as output indicators to build the model. BP and SSA parameter settings are shown in Table 3 below.
(3)
Network training and result analysis. Through learning and training of historical engineering data, 30 of them are used as test sets to validate the effectiveness of the SSA-BP prediction model. The results of real value and predicted value and the relative error between them are shown in Table 4. For a more visual observation of the results, a variety of error evaluation indexes are used to compare the results, as follows Equations (13)–(16):
Relative error, as shown in Equation (13):
e r r o r = ( y i y ^ i ) / y i × 100 %
Root mean square error (RMSE), as shown in Equation (14):
R M S E = 1 m i = 1 m ( y i y ^ i ) 2
Mean absolute error (MAE), as shown in Equation (15):
M A E = 1 n i = 1 n y i y ^ i
Mean absolute percentage error (MAPE), as shown in Equation (16):
M A P E = 100 % m i = 1 n y i y ^ i y i
where y represents the actual value and y ^ represents the predicted value.
From the above table analysis results and combined with Equation (13), it can be seen that the maximum relative error between the predicted value and the actual value of the substation project cost is 14.12%, the minimum error is 0.11%, and the average relative error is 4.85%. It can be shown that the prediction accuracy of the SSA-BP substation intelligent prediction model is high, and it has strong practicality to be used to predict static investment in substations.
To better visualize the effectiveness of the SSA-BP intelligent prediction model, the prediction results of this model are compared with those of BP neural networks, WOA-BP, and PSO-BP. To enhance the persuasiveness, the same 30 data were taken for each method as a test set to verify the prediction results, and the network parameters configured for each algorithm are shown in Table 5 below:
Through the prediction results of the test set in Figure 7, it can be seen that the SSA-BP prediction method is closer to the actual value than other prediction methods under the premise of consistent main verification conditions, and the prediction effect is better.
Meanwhile, in order to accurately reflect the difference of prediction methods, the error evaluation indexes of formulas (14)–(16) are used to compare the accuracy of the prediction results of the above prediction methods. The calculation results are shown in Table 6.
According to Table 6, the results of three error indexes of the SSA-BP model are far lower than the BPNN model, the PSO-BP model, and the WOA-BP model. The error index MAPE of the SSA-BP prediction model is less than 5%. According to historical experience, it can meet the actual requirements of power grid project cost, that is, to meet the needs of practical work. In order to enhance the visualization and compare the prediction accuracy of the four models more intuitively, the error evaluation results are drawn in Figure 8 below.
The difference between the four prediction methods can be seen more intuitively from Figure 8 above. The error index results of RMSE, MAE, and MAPE show that the prediction results of the SSA-BP model are more accurate, closer to reality, and have higher prediction accuracy. Consequently, the model proposed in this paper has a certain degree of scientific support and feasibility in the application of substation project cost prediction, and has certain guiding significance for future power grid project cost work.

5. Conclusions

Accurate project cost prediction plays an essential role in the level of investment, operation scheduling, and fine management of the power grid. This study starts from the concept of data space, combines the data related to the whole life cycle of substation construction, and determines the input indexes of the model after considering the factors influencing the cost of substation construction combined with grey correlation analysis and other methods. At the same time, the SSA is innovatively proposed to optimize the BP neural network, and an intelligent prediction model is constructed to predict the substation project cost. The two main points of conclusion obtained are the following:
(1)
Based on the concept of data space, this paper takes the substation project as the main body of space and uses the whole life cycle data, such as researchable estimation, preliminary design budget, and construction drawing budget, to mine the input factors of the prediction model. It establishes 20 technical factors including construction cost, installation cost, equipment purchase cost, and other costs, which covers a wide range and reduces the redundancy index.
(2)
In this paper, the SSA is used to optimize the weights and thresholds of a BP neural network, thus predicting the cost of substation engineering. The prediction results show that compared with the unoptimized BP neural network model and the WOA-BP and PSO-BP prediction models, the SSA-BP intelligent prediction model proposed in this paper has better prediction accuracy and can be used for actual prediction.
This paper reasonably predicts the substation project cost based on fully mining the data. However, due to the limitation of data collection, this paper only studies the quantifiable technical indicators, without considering the qualitative indicators of model input. Based on this study, the influence of qualitative indicators on the power grid project cost will be considered in the future, so as to make the research on the power grid project cost more in-depth.

Author Contributions

L.P. analyzed the data and completed the English version of the paper. X.X. gave guidance on framework construction and model building. Z.J. and S.Z. contributed to data collection. Z.T. and S.G. made many practical suggestions in revising and editing the paper. All authors have read and agreed to the published version of the manuscript.

Funding

The authors gratefully acknowledge the financial support from the National Natural Science Foundation of China (Grant No.71804045). This paper is also supported by the Fundamental Research Funds for the Central Universities (2018ZD14 and 2020MS045).

Institutional Review Board Statement

Not applicable.

Informed Consent Statement

Not applicable.

Data Availability Statement

The data presented in this study are available on request from the corresponding author. The data are not publicly available due to interest.

Conflicts of Interest

The authors declare no conflict of interest.

Nomenclature

BPNNBack Propagation Neural Network
SSASparrow Search Algorithm
SVMSupport Vector Machine
PCAPrincipal Component Analysis
PSOParticle Swarm Optimization
APSOAdaptive Particle Swarm Optimization
ELMExtreme Learning Machine
LSSVMLeast Squares Support Vector Machine
GRAGrey Relation Analysis
SVRSupport Vector Regression
WOAWhale Optimization Algorithm

References

  1. Long, Y.; Hu, W.; Ma, Q.; Tan, J.J.; Li, Y. Whole-cycle Dynamic Investment and Development Mechanism of Power Grid Enterprises at Transmission and Distribution Price. Proce. CSU EPSA 2019, 31, 143–150. [Google Scholar]
  2. Qiao, H.T.; Wen, S.Y.; Huang, Y. Data Interpolation and Cost Prediction Fusion Model for Power Grid Transmission Project. J. Shenyang Univ. Technol. 2021, 43, 481–486. [Google Scholar]
  3. Ding, Z.Z.; Peng, L.W. Prediction Method for Cost Data of Power Transmission and Transformation Project Based on MK-TESM Method. J. Shenyang Univ. Technol. 2021, 43, 126–131. [Google Scholar]
  4. Xiang, C.; Wu, H.X.; Yu, J.B. Research on Fast and Accurate Estimation of Project Cost Based on Historical Data of Power Grid Engineering. Enterp. Manag. 2017, 2017, 89–91. [Google Scholar]
  5. Ling, Y.; Yan, P.; Han, C.; Yang, C. Prediction Model of Transmission Line Engineering Cost Based on BP Neural Network. China Power 2012, 45, 95–99. [Google Scholar]
  6. Chen, J.; Hou, K.; Gao, X.B. Research on Cost Reasonability Evaluation Method of Power Transmission and Transformation Projects. South. Power Syst. Technol. 2016, 10, 95–101. [Google Scholar]
  7. Lu, Y.C.; Zheng, Y.; Zhao, B. The External Environment Influence Analysis of Power Transmission Project Based on PEST Model. Electr. Power 2012, 45, 100–103. [Google Scholar]
  8. Sun, Y.Y.; Bai, Y.L.; Zhang, X.M.; Duan, J.T. Influence Factors and Control Measures of Construction Cost in Prefabricated Substation. Constr. Econ. 2020, 41, 58–63. [Google Scholar]
  9. Wang, J.; Ding, L.Q. Comprehensive Prediction Models for Transmission Engineering Project Cost Based on its Key Influencing Factors. East China Electr. Power 2008, 36, 111–113. [Google Scholar]
  10. Liang, L.L.; Li, J. Research on Fuzzy Forecasting Technology Reasonable of Project Cost. TYUT China 2011, 42, 88–91. [Google Scholar]
  11. Peng, P.; Peng, J.H. Research on the Prediction of Power Load Based on Multiple Linear Regression Mode. Saf. Sci. Technol. 2011, 7, 158–161. [Google Scholar]
  12. Qian, W.; Sui, A. A Novel Structural Adaptive Discrete Grey Prediction Model and its Application in Forecasting Renewable Energy Generation. Expert Syst. App. 2021, 186, 115761. [Google Scholar] [CrossRef]
  13. Duan, H.M.; Pang, X.Y. A Multivariate Grey Prediction Model Based on Energy Logistic Equation and Its Application in Energy Prediction in China. Energy 2021, 229, 120716. [Google Scholar] [CrossRef]
  14. Liu, C.; Wu, W.Z.; Xie, W.; Zhang, J. Application of a Novel Fractional Grey Prediction Model with Time Power Term to Predict the Electricity Consumption of India and China. Chaos Solitons Fractals 2020, 141, 110429. [Google Scholar] [CrossRef]
  15. Hu, L.X. Research on Prediction of Architectural Engineering Cost based on the Time Series Method. TYUT China 2012, 43, 706–709+714. [Google Scholar]
  16. Xu, X.M.; Niu, D.X.; Xiao, B.W.; Guo, X.D.; Zhang, L.H.; Wang, K.K. Policy Analysis for Grid Parity of Wind Power Generation in China. Energy Policy 2020, 138, 111225. [Google Scholar] [CrossRef]
  17. Yu, M.; Wang, Y.X.; Yan, Y.; Yang, X.Y.; Xia, X.H.; Wen, F.S. A Combinational Forecasting Method for Predicting the Cost of an Overhead Line Reconstruction Project. Electr. Power Syst. Res. 2020, 35, 24–30. [Google Scholar]
  18. Dong, N.; Lu, S.H.; Xiong, F. Cost Prediction in Construction Project Based on ABC-SVM under the Background of Big Data. Technol. Econ. 2021, 40, 25–32. [Google Scholar]
  19. Wang, Z.Y.; Zhou, X.J.; Tian, J.T.; Huang, T.W. Hierarchical Parameter Optimization Based Support Vector Regression for Power Load Forecasting. Sustain. Cities Soc. 2021, 71, 102937. [Google Scholar] [CrossRef]
  20. Jnr, E.O.N.; Ziggah, Y.Y.; Relvas, S. Hybrid Ensemble Intelligent Model Based on Wavelet Transform, Swarm Intelligence and Artificial Neural Network for Electricity Demand Forecasting. Sustain. Cities Soc. 2021, 66, 102679. [Google Scholar]
  21. Ling, Y.P.; Yan, P.F.; Han, C.Z.; Yang, C.G. BP Neural Network Based Cost Prediction Model for Transmission Projects. Electr. Power 2012, 45, 95–99. [Google Scholar]
  22. Feng, H.; Liu, B.Y.; Zhang, Y.H.; Qiu, J.P.; Yang, H.Y.; Zhou, P. Predicting Model of Power Engineering Cost Based on the FCM and PSO-SVM. East China Electr. Power 2014, 42, 2713–2716. [Google Scholar]
  23. Peng, G.J.; Si, H.T.; Yu, J.H.; Yang, Y.H.; Li, S.M.; Tan, K. Modification and Application of SVM Algorithm. Comput. Appl. Eng. Educ. 2011, 47, 218–221. [Google Scholar]
  24. Song, Z.Y.; Niu, D.X.; Xiao, X.L.; Zhu, L. Substation Engineering Cost Forecasting Method Based on Modified Firefly Algorithm and Support Vector Machine. Electr. Power 2017, 50, 168–173. [Google Scholar]
  25. Lin, T.Y.; Yi, T.; Zhang, C.; Liu, J.P. Intelligent Prediction of the Construction Cost of Substation Projects Using Support Vector Machine Optimized by Particle Swarm Optimization. Math. Probl. Eng. 2019, 2019, 7631362. [Google Scholar] [CrossRef]
  26. Guo, Q.; Deng, W.; Jiang, Z.W. Prediction of Hydroelectric Engineering Cost Index Based on GA-BP Neural Network. Water Resour. Ind. 2018, 36, 162–164. [Google Scholar]
  27. Wang, J.; Liu, Y.C. Prediction Model for Construction Cost Based on Grey Relational Analysis PSO-SVR. J. Huaqiao Univ. Nat. Sci. 2016, 37, 708–713. [Google Scholar]
  28. Duan, X.C.; Yu, J.X.; Zhang, J.L. A Method of Estimating WLC of Railway Projects Based on CS, WLC and BPNN Theorems. J. China Railw. Soc. 2006, 2006, 117–122. [Google Scholar]
  29. Niu, D.X.; Zhao, W.B.; Li, S.; Chen, R.J. Cost Forecasting of Substation Projects Based on Cuckoo Search Algorithm and Support Vector Machines. Sustainability 2018, 10, 118. [Google Scholar] [CrossRef] [Green Version]
  30. Shi, L.; Ding, X.H.; Li, M.; Liu, Y. Research on the Capability Maturity Evaluation of Intelligent Manufacturing Based on Firefly Algorithm, Sparrow Search Algorithm, and BP Neural Network. Complexity 2021, 2021, 5554215. [Google Scholar] [CrossRef]
  31. Li, G.B.; Hu, T.Y.; Bai, D.W.; Huang, F.M. BP Neural Network Improved by Sparrow Search Algorithm in Predicting Debonding Strain of FRP-Strengthened RC Beams. Adv. Civ. Eng. 2021, 2021, 9979028. [Google Scholar] [CrossRef]
  32. Liu, D.; Wei, X.; Wang, W.Q.; Ye, J.H.; Ren, J. Short-term Wind Power Prediction Based on SSA-ELM. Smart Power 2021, 49, 53–59+123. [Google Scholar]
  33. Hu, L.J.; Guo, Z.Z.; Wang, J.S. Short-term Power Load Forecasting Based on ISSA-LSSVM Model. Eng. Sci. Technol. Int. 2021, 21, 9916–9922. [Google Scholar]
  34. Li, Y.K.; Meng, X.F.; Zhang, X.Y. Research on Dataspace. J. Softw. 2008, 19, 2018–2031. [Google Scholar] [CrossRef]
  35. Borjigin, C.; Zhang, Y.; Xing, C.X.; Lan, C.; Zhang, J. Dataspace and its Application in Digital Libraries. Electron. Libr. 2013, 31, 688–702. [Google Scholar] [CrossRef]
  36. Guo, B.; Zhou, W.W.; Li, Z.W. Identification of Key Factors in the Cost of Power Grid Technological Transformation Projects Based on Grey Correlation Method. Commun. Finance Account. 2019, 29, 92–95. [Google Scholar]
  37. Sun, A.L.; Xiang, C.; Wu, H.X. Study on BP Neural Network Based Prediction Model for Power Transmission Line Project Cost. Mod. Electron. Tech. 2018, 41, 79–82. [Google Scholar]
  38. Xue, J.K.; Shen, B. A Novel Swarm Intelligence Optimization Approach, Sparrow Search Algorithm. Syst. Sci. Control Eng. 2020, 8, 22–34. [Google Scholar] [CrossRef]
Figure 1. Data space elements.
Sustainability 13 13746 g001
Figure 2. Fishbone diagram analysis process.
Sustainability 13 13746 g002
Figure 3. Construction of technical factors primary election library.
Sustainability 13 13746 g003
Figure 4. BP neural network structure diagram.
Sustainability 13 13746 g004
Figure 5. SSA-BP prediction model framework.
Sustainability 13 13746 g005
Figure 6. Input index of installation cost model.
Sustainability 13 13746 g006
Figure 7. Analysis of prediction results.
Sustainability 13 13746 g007
Figure 8. Analysis of model errors.
Sustainability 13 13746 g008
Table 1. Installation engineering cost factor primary library.
IndexVariable AttributesIndexVariable Attributes
X1Quantization with/without adjustable load pressureX12Single unit capacity of high voltage reactor
X2Number of current period stations(three-phase)X13Number of low voltage capacitors
X3Number of long-term stations(three-phase)X14Number of low voltage reactors
X4Single capacity(three-phase)X15Number of control cables
X5High voltage side distribution device typeX16Average unit price of control cable
X6Number of high voltage side circuit breakersX17Number of power cables 1 kV and below
X7Medium voltage side distribution device typeX18Average unit price of power cables 1 kV and below
X8Number of medium voltage side circuit breakersX19Length of optical cable
X9Low voltage side distribution device typeX20Amount of grounding material flat steel used
X10Number of low voltage side circuit breakersX21Amount of copper row for grounding materials
X11Number of high voltage reactors
Table 2. Model input indexes.
Input CategoryInput IndexesInput CategoryInput Indexes
Construction engineering factorsMain control building areaInstallation engineering factorsSingle capacity(three-phase)
Number of high voltage side intervalsNumber of low voltage side circuit breakers
Number of medium voltage side intervalsNumber of control cables
Main transformer and line steel quantity and bracket quantityAverage unit price of control cable
Main transformer and concrete quantity of line foundationAverage unit price of power cables 1 kV and below
Site leveling costsEquipment purchase factorsNumber of main transformers
Retaining wall and slope protection costsSecondary equipment
The method of foundation treatmentOther factorsTotal construction costs
Out-of-station water costsProject construction management costs
Out-of-station power costsTotal project construction technical service costs
Table 3. Model parameters.
ModelParameterValueModelParameterValue
BPNNTraining frequency1000SSA-BPInitial population scale30
Learning rate0.01Evolutional times50
Number of input layer nodes20Proportion of discoverers0.7
Optimal hidden layer node14Proportion of scouts0.2
Number of output layer nodes1Safety values0.6
Table 4. Prediction results and relative error analysis of substation project cost.
Project Number12345678910
Actual value2638359226094936450735703815164711,37112,708
Predicted value2829378028684820427932493276176210,40211,892
Error (%)7.245.229.942.355.068.9914.126.958.536.42
Project number11121314151617181920
Actual value9139996110,4849727411933053538266810,64711,662
Predicted value8585977210,27710,703413930343215268010,76611,808
Error (%)6.071.901.9710.040.498.199.130.461.111.26
Project number21222324252627282930
Actual value11,31614,36230473310314235353275324834053155
Predicted value11,42714,30333043282319635313524312232303180
Error (%)0.980.418.450.861.710.117.613.875.150.79
Table 5. Network parameters configuration.
Parameter Setting
Epoch1000
Learning rate0.01
Minimum error of training target0.0001
Momentum factor0.01
Gradient1 × 10−6
Initial population size30
Table 6. Error analysis results.
BPNNPSO-BPWOA-BPSSA-BP
RMSE1168.29603.10545.78363.52
MAE760.48469.28367.18254.94
MAPE (%)12.639.516.564.85
Publisher’s Note: MDPI stays neutral with regard to jurisdictional claims in published maps and institutional affiliations.

