Article

Estimation of Spatial and Seasonal Variability of Soil Erosion in a Cold Arid River Basin in Hindu Kush Mountainous Region Using Remote Sensing

1
School of Civil Engineering, Faculty of Engineering, Universiti Teknologi Malaysia, Johor Bahru 81310, Malaysia
2
Department of Water Resource Management, Lasbela University of Agriculture, Water and Marine Sciences, Uthal, Lasbela, Balochistan 90150, Pakistan
3
Department of Civil Engineering, Science and Research Branch, Islamic Azad University, Tehran, Iran
4
Civil, Environmental and Natural Resources Engineering, Lulea University of Technology, 97187 Lulea, Sweden
5
Department of Civil Engineering, Seoul National University of Science and Technology, Seoul, Korea
6
State Key Laboratory of Hydrology-Water Resources and Hydraulic Engineering, Nanjing Hydraulic Research Institute, Nanjing 210029, China
7
Research Center for Climate Change, Ministry of Water Resources, Nanjing 210029, China
*
Authors to whom correspondence should be addressed.
Sustainability 2021, 13(3), 1549; https://0-doi-org.brum.beds.ac.uk/10.3390/su13031549
Submission received: 17 December 2020 / Revised: 20 January 2021 / Accepted: 20 January 2021 / Published: 2 February 2021
(This article belongs to the Special Issue Remote Sensing Applied to the Environment and Sustainability)

Abstract

:
An approach is proposed in the present study to estimate the soil erosion in data-scarce Kokcha subbasin in Afghanistan. The Revised Universal Soil Loss Equation (RUSLE) model is used to estimate soil erosion. The satellite-based data are used to obtain the RUSLE factors. The results show that the slight (71.34%) and moderate (25.46%) erosion are dominated in the basin. In contrast, the high erosion (0.01%) is insignificant in the study area. The highest amount of erosion is observed in Rangeland (52.2%) followed by rainfed agriculture (15.1%) and barren land (9.8%) while a little or no erosion is found in areas with fruit trees, forest and shrubs, and irrigated agriculture land. The highest soil erosion was observed in summer (June–August) due to snow melting from high mountains. The spatial distribution of soil erosion revealed higher risk in foothills and degraded lands. It is expected that the methodology presented in this study for estimation of spatial and seasonal variability soil erosion in a remote mountainous river basin can be replicated in other similar regions for management of soil, agriculture, and water resources.

1. Introduction

Soil erosion harms agriculture productivity due to the reduction of soil fertility [1,2,3,4] Besides, it affects water quality by reducing the level of dissolved oxygen [5,6,7,8]. Soil erosion is caused by different drivers including water and air [9]. A large portion of global land (1094 Mha) is altered by soil erosion due to hydrological processes, of which a significant portion (224 Mha) cannot be restored [10]. The global average of soil erosion by either precipitation or floods is 20–30 Gtyr-1 [11].
Soil erosion rates are higher in arid and semi-arid regions due to high sensitivity of such region to climate and land-use changes [12,13,14,15,16,17]. The soil erosion rates are also reported to be higher in Asian countries like China, India, and Afghanistan [18,19,20]. Therefore, the arid region of Asia is considered as highly susceptible to soil erosion. Soil erosion is a slow natural geologic phenomenon, but it costs billions of dollars for agricultural losses [21,22,23]. Hence, soil erosion study is a vital concern for the regions with agricultural-based economies.
Afghanistan located between the south and central Asia has a predominantly arid and semi-arid climate. Soil erosion is a challenging issue for agricultural productivity in Afghanistan [20,24]. Shrestha [25] reported that it is complicated to figure out the exact amount of soil erosion in Afghanistan due to a lack of data. The findings from the Global Assessment of Human-induced Soil Degradation (GLASOD) project indicated that a large portion (75%) of the topsoil of Afghanistan is removed due to water and wind. Furthermore, excessive erosions on riverbanks lead to notable social and economic losses. Despite the high importance of the soil erosion problem in Afghanistan, a few studies have been conducted to address the issue over the different regions in Afghanistan [20,26,27].
Sahaar [27] integrated the Revised Universal Soil Loss Equation (RUSLE) with Geographic Information System (GIS) to estimate the annual soil loss of Kabul Rivers. They found that the river was significantly eroded in the rate of 19 ton∙acre−1∙year−1. [26] evaluated the annual soil loss of the Lower Harirud watershed in Heart province using RUSLE. The research findings indicated that soil erosion was varied in the range of 0.025 to 778 Mg ha−1∙y−1. [20] assessed the volume of eroded soil from Gardez basin in Paktya province, Afghanistan using the Universal Soil Loss Equation (USLE) integrated with GIS. Results showed that annual soil loss was found to be in the range of 0 to more than 100 ton∙ha−1∙y−1. The findings reported in the literature indicated that soil erosion rates are estimated to be significantly high. Thus, further studies should be conducted over the vulnerable basins to provide sustainability in agriculture and environment in the country.
Kokcha subbasin, which is located in Amu Darya River basin in Northeast of Afghanistan, is a data-scarce region with high soil erosion rate. People with agricultural income are dominated in the Kokcha subbasin. Hence, their properties are significantly dependent on the farming industry [28,29,30]. Rapid deforestation and highly frequent rainfall depth, which change the river flow pattern, provide an increasing trend in soil erosion over the Kokcha subbasin [20,31,32,33]. Hence, it is essential to estimate the potential amount of soil erosion in the basin and provide the measures required for protecting the vulnerable lands.
A number of approaches have been developed to estimate the soil erosion such as USLE, RUSLE, Agricultural Non-Point Source (AGNPS) model, and Watershed Erosion Prediction Project (WEPP) [34]. Several factors, including precipitation intensity, soil type, physiography, land use, and anthropogenic activities, have significant impacts on soil erosion [35,36,37,38,39,40]. Hence, soil erosion modelling needs a large number of in situ measurements including hourly rainfall, land use, and digital elevation model data which are not available for the basin [25,31,33]. Satellite-based remote sensing data are widely used to assess the susceptible zones of soil erosion in data-scare regions [34,41,42]. To estimate soil erosion with remote sensing data, the RUSLE method provided better performance [43,44,45]. The parameters of the RUSLE method can be estimated using the remote sensing data collected from several sources and augmented in geographical information system (GIS). Bahrawi et al. [46] reported that remote sensing data and GIS provided a flexible and powerful tool for assessing soil erosions in data-scarce regions.
This study aims to estimate the soil erosion using the satellite-based remote sensing data in the Kokcha subbasin. In this way, the RUSLE method is employed for estimating soil erosion. The satellite-based products are used to obtain the data required for computing the RUSLE factors due to scarcity of in-situ data in Afghanistan. Cold agricultural regions share a significant portion of global food production [47]. Soil erosion poses a major threat to soil degradation and crop productivity in cold regions. Wu et al. [48] found soil erosion in cold climate is often much higher than that in other climatic regions. Snow melting at the end of winter or early spring causes high overland flow which often exceed the runoff in rainy season of other climatic zones. Reduction of soil infiltration capacity due to freezing enhance surface runoff and thus erosion [49,50]. However, studies related to soil erosion in cold climate, particularly cold mountainous climate region is very limited. Analysis of seasonal variability and spatial distribution of soil erosion in Kokcha subbasin can contribute valuable knowledge to soil erosion in cold climatic region. The soil erosion maps generated in this study would help to understand the spatial patterns of soil erosion within the Kokcha subbasin to assist stakeholders in taking suitable mitigation measures.

2. Study Area and Data Sources

2.1. Study Area

Kokcha subbasin, which is located in the north-eastern of Afghanistan, covers an area of 21,811 km2 (Figure 1). The basin is situated from 35.40° to 37.40° N and 68.90° to 71.60° E. Additionally, the altitude of the basin is varied from 370 m above sea level in the northwestern part to 6721 m in the southern mountains. The percentage of the basin area above 2000, 3000, and 4000 m are respectively, 75%, 50%, 30%. The area receives an annual average rainfall of 470 mm [30]. The snow covers in the basin are approximately found above 4000 m. The mountainous areas in the basin are furnished with low-density trees. The basin is characterized by cold semi-arid and warm continental climate. Rainfall events mainly occur in spring (March–May) and autumn (October–April) seasons while winter (December–February) is usually cold with heavy snowfalls. Several small glaciers are observed in the Kokcha Basin. The glaciers and snow are the primary water resources to recharge the river in the summer (June–August) [51]. Soil in most parts of the basin can be categorized as Fluvisol based on Food and Agriculture Organization (FAO) classification.

2.2. Data Sources

Most of the hydrological and climatological stations in Afghanistan are destroyed due to four decades of internal war [30,31]. Hence, adequate observation data are rarely found for a national scale study. Thus, the satellite-based data, which are freely available for large areas, are preferred. The digital elevation model (DEM) of the basin with 30 m resolution is obtained from Advanced Space Thermal Emission Radiometer (ASTER). The Global Precipitation Measurement (GPM) product (GPM_3IMERGHH, half-hourly, 0.1° × 0.1°) obtained by National Aeronautics and Space Administration (NASA) is used to provide the rainfall erosivity factor (R) data. The Normalized Difference Vegetation Index (NDVI) provided by Moderate Resolution Imaging Spectroradiometer (MODIS) is employed to extract the cover and management factor (C). Slope length and steepness (LS) factors are derived from DEM of Afghanistan, while soil erodibility factor (K) is obtained from the Soil Types Map from ISRIC World Soil Information. All the data are obtained at a spatial resolution of 0.1° × 0.1°.

3. Methodology

The RUSLE method has been widely used for predicting the rate of inter-rill and rill erosions[52]. The RUSLE integrated with GIS is used in the present study to predict soil erosion in the Kokcha subbasin. The RUSLE factors are calculated and mapped using remote sensing data and GIS techniques. The RUSLE method is defined as follows:
A = R × K × L S × C × P
where A is the potential annual soil erosion (t ha−1 year−1), R is rainfall/runoff erosivity factor, K is soil erodibility factor, LS is the slope length/steep factor, C is vegetation cover factor, and P is support practice factor.

3.1. Rainfall Erosivity Factor

The rainfall erosivity factor (R) reflects the effect of rainfall intensity on soil erosion [38,53]. A long period rainfall time series is required to compute the accurate R factor; however, that is not possible for many regions like Kokcha subbasin. To solve this limitation, the half-hourly GPM product is used to provide the rainfall data required in the present study.
The formula proposed by Wischmeier and Smith [53] is used to compute the R factor as the following equation:
R = i = 1 m 916 + 331   log I i I 30 i N
where R denotes the mean annual rainfall erosivity (100 foot-ton in acre−1 h−1 year−1), m indicates the number of storms in the N-year period, Ii is the mean intensity of the i-th storm (in h−1), I 30 i is maximum 30-min intensity of the i-th storm (in h−1).

3.2. Soil Erodibility Factor

The soil erodibility factor (K) quantifies the soil erosion caused by runoff [54]. Several parameters, namely soil texture, organic content, permeability and soil type, have significant impact on K factor [55]. Herein, the Erosion Productivity Impact Calculator (EPIC) is used to compute the K factor (100 acre)−1 ft−1 Mg−1 in−1 as follows [56]:
K = 0.2 + 0.3 exp 0.0256 S a ( 1 s i 100 ) s i c l + s i 0.3 1 0.25   C C + exp 3.72 2.95   C 1 0.7   S N S N + exp 5.51 + 22.9 S N 0.1317
where Cl, Sa and Si are the fraction (%) of clay, sand and silt respectively; and C is the soil organic carbon content (%).

3.3. Slope Length and Steepness Factor

The impacts of the slope length and slope gradient on soil erosion is quantified using the slope LS factor [54]. The accuracy of the LS value depends on the spatial resolution of the DEM, availability of computing resources, and the scale of the study area. DEMs with spatial resolution coarser than 100 m do not accurately capture the flow network of a catchment [44]. Hence, the LS factor is computed based on a DEM with a resolution of 30 m using the following formula:
L S = Q a M 22.13 y × 0.065 + 0.045 S + 0.0065 S 2
where Q a is flow accumulation grid; S is grid slope in percentage; M is grid size (x × y), and y is a dimensionless exponent in the range of 0.2 to 0.5.

3.4. Land Cover Management Factor

The Land Cover Management Factor (C) is used to express the effect of cropping and management practices on soil erosion [52]. The factor is most sensitive to human activities [57]. The Normalized Difference Vegetation Index (NDVI) is used to calculate the C factor in intraseasonal and interannual timescales [58]. The C factor can be computed as the following expression [59,60]:
C = exp α N D V I β N D V I
where α and β are the dimensionless parameters. van der Knijff et al. [60] proposed the best values of α and β were 2 and 1, respectively.

3.5. Support Practice Factor

Conservation or Support Practice (P) factor is quantified the practices that affect the runoff rate and thus, the soil erosion rate [52]. It denotes the ratio of soil erosion provided after a practice (i.e., contour farming, cross-slope cultivation, and strip cropping) to the regular farming slope [52]. The P-factor is considered 1 due to a lack of proper data of conservation and support activities in the basin.

3.6. Validation of Soil Erosion Model

The suspended sediment loads estimated by Hydrology Department of Ministry of Energy and Water of Afghanistan at Khawajaghar station, which is located at the basin outlet, are used as an observed dataset for the validation of RUSLE estimated soil erosion. The monthly erosion pattern of observed and modelled soil erosion is compared to show the ability of RULSE model to estimate the seasonal variability of observed soil erosion.

4. Result and Discussion

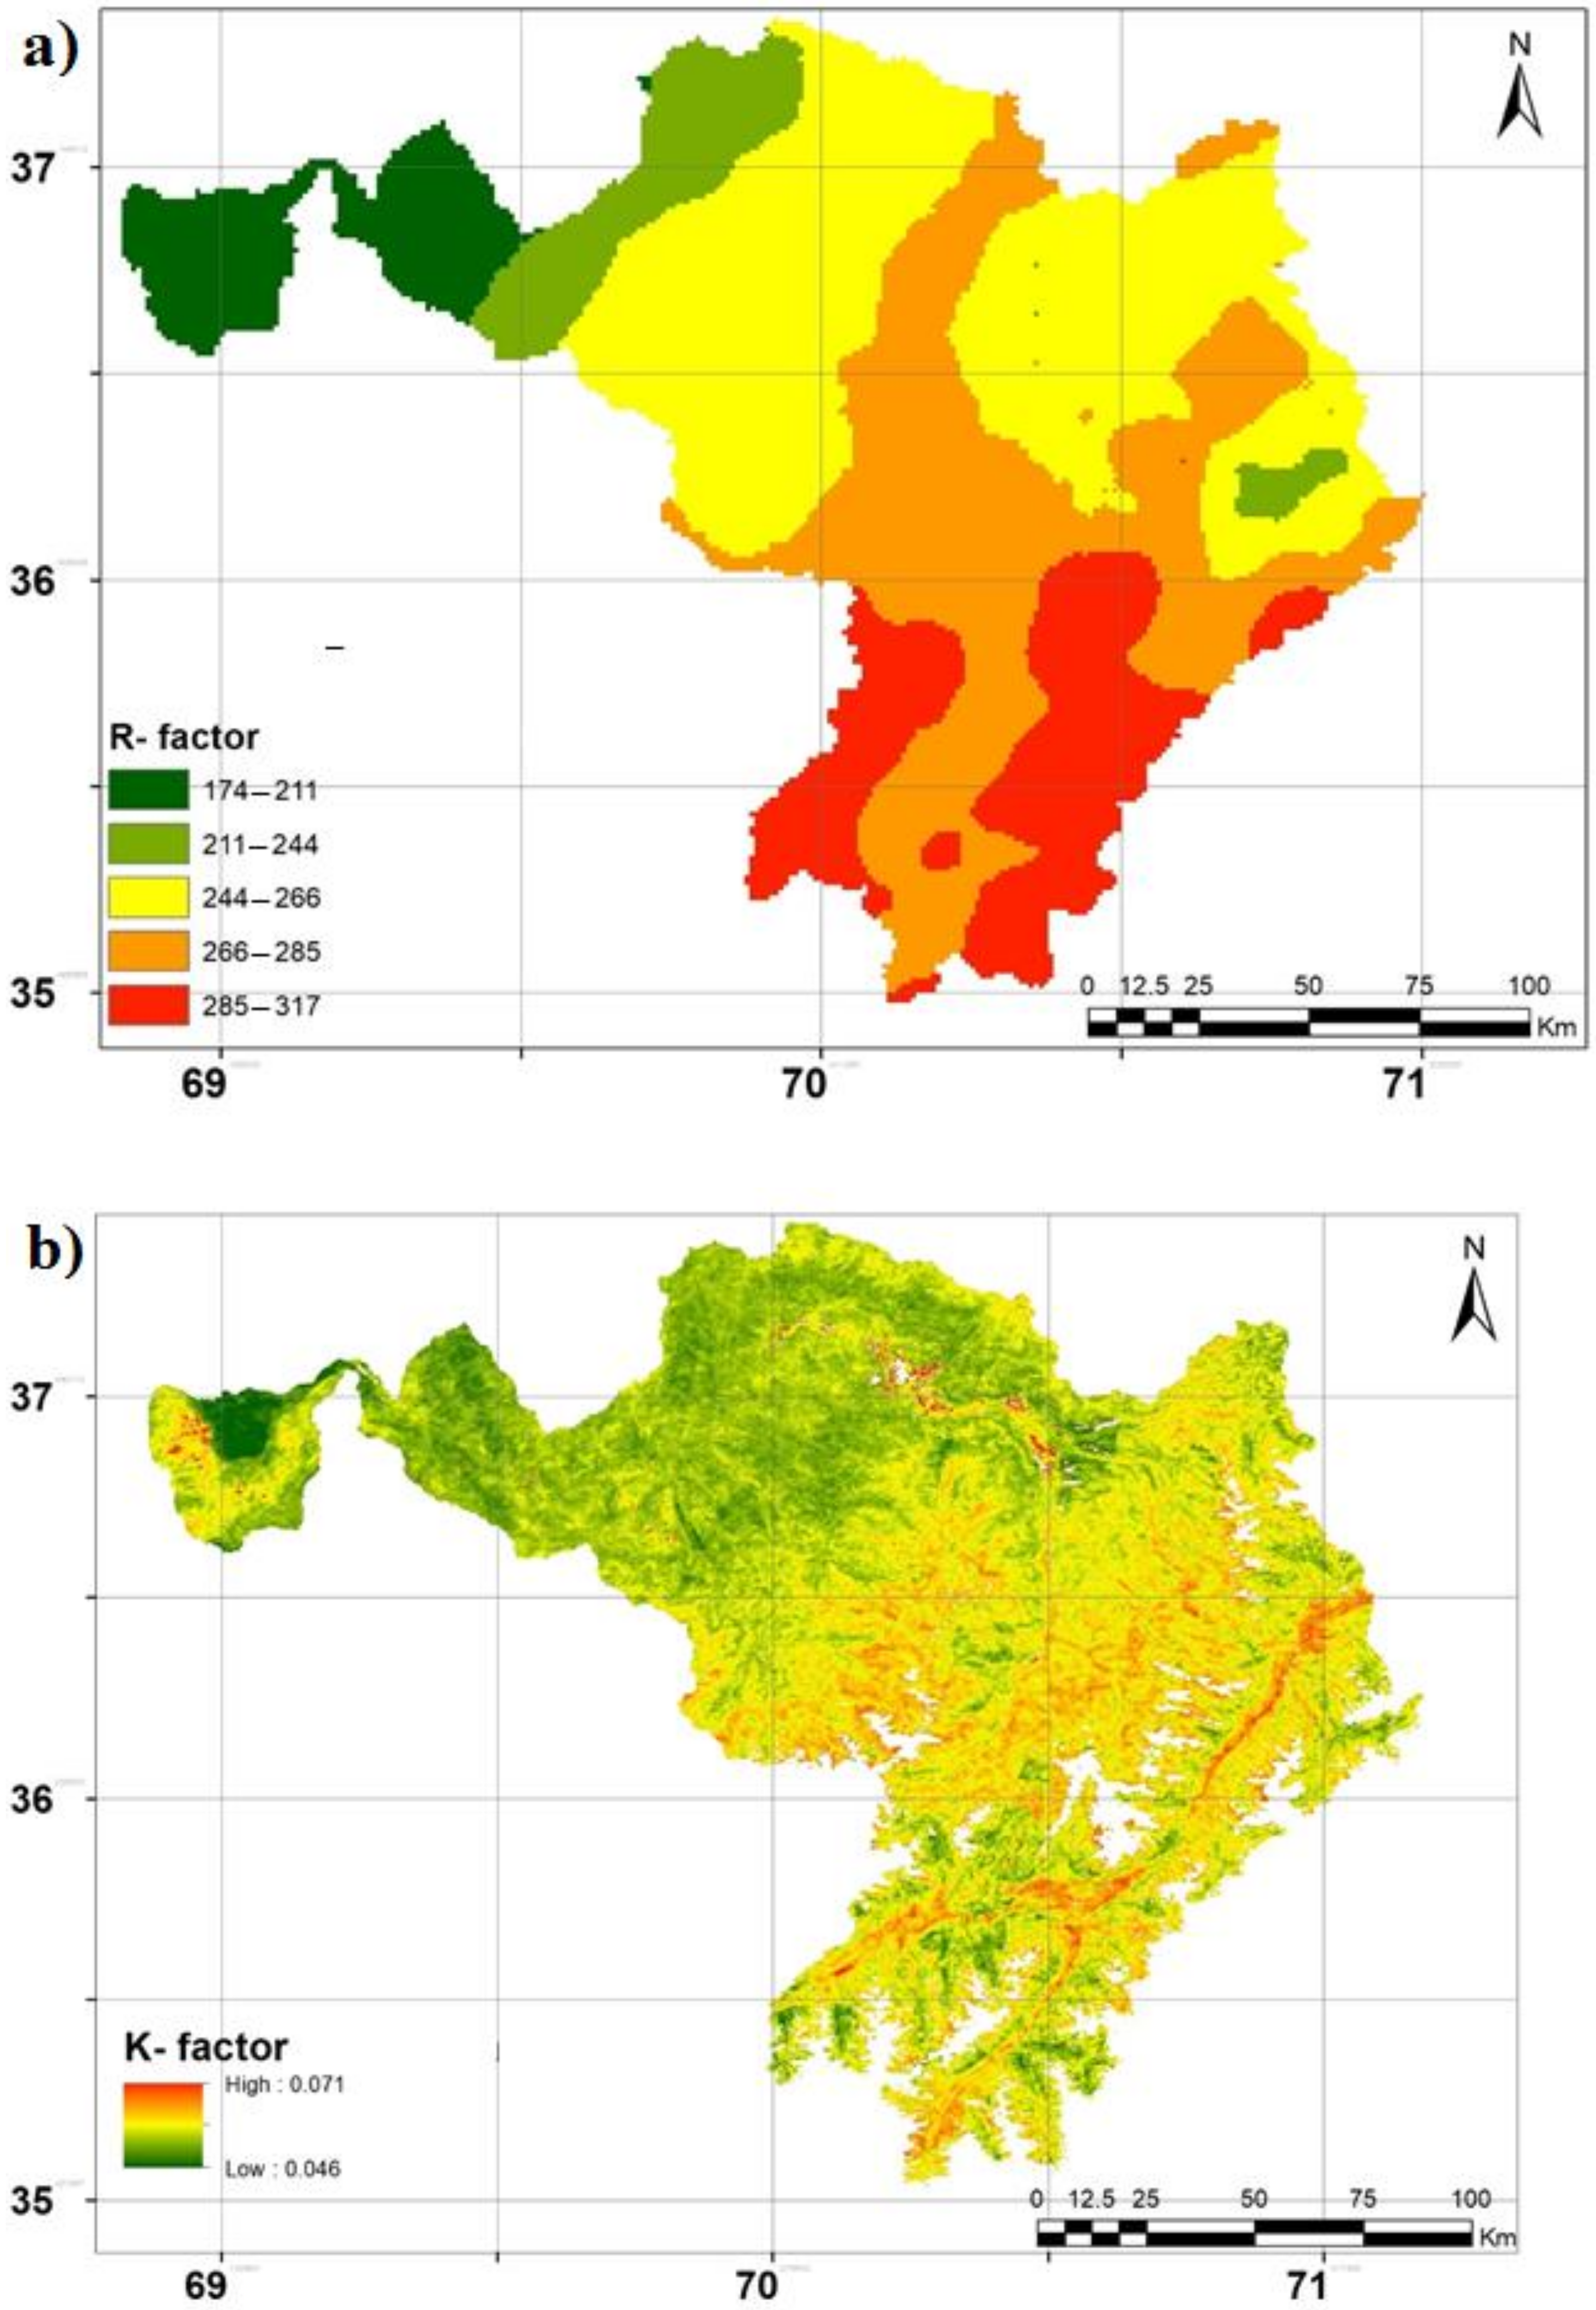
4.1. Spatial Pattern of the RUSLE Factors

To estimate the soil erosion in the Kokcha subbasin, the maps of RUSLE factors (e.g., R, K, LS, and C) are prepared using the ArcMap software (Figure 2). The map of R factor is provided based on the mean annual rainfall data (Figure 2a). It is characterized based on the five classes in the range of 174 to 317 (MJ mm ha−1∙h−1∙y−1). The highest erosivity is observed in the southern of the basin while the northwestern region exposes the lowest values. The central parts of the basin represent the rainfall erosivity from 244 to 266 MJ mm ha−1∙h−1∙y−1. A large area of the basin from north to south attains the erosivity in the range of 266 to 285 MJ mm ha−1∙h−1∙y−1.
Figure 2b represents that the K values are in the range of 0.046 to 0.071 t ha h ha−1 MJ−1∙mm−1, where the highest soil erodibility factor values are found in the southern area of the basin. The LS map of the Kokcha subbasin, which is provided by a 30 m DEM, is shown in Figure 2c. From the figure, it is clear that the LS values varied from 0 to 963. Besides, the highest LS values mostly lie in the eastern and southern parts of the basin.
Figure 2d exposes that the C factor in the Kokcha subbasin are characterized based on the five classes, including (0.01–0.056), (0.056–0.13), (0.13–0.20), (0.20–0.25), and (0.25–0.31). However, the basin can be approximately divided to lower- and upper-half regions based on the two dominated classes (e.g., 0.01–0.056 and 0.25–0.31). The highest and the lowest C values, respectively, are seen in the south and north of the basin.

4.2. Spatial Pattern of Soil Erosion

Having provided the RUSLE factors maps, the annual soil erosion pattern in Kokcha can be obtained using Equation (1) through the raster calculator of spatial analyst tool in ArcMap software (Figure 3). Jenk’s optimum classification algorithm (JOCA) [61] is used for classification of estimated soil erosion values to prepare the map. Based on JOCA, the soil erosion (t ha−1∙y−1) in basin was classified into five classes including slight [0–10), moderate [10–50), high [50–150), severe [150–500), and very severe (>500). From Figure 3, it is evident that slight erosion is significantly observed over the study area, while moderate erosion is mainly found in the center area of the basin. The other erosion classes, including high, severe, and very severe, are rarely observed over the Kokcha subbasin.
Table 1 demonstrates the percentage of soil erosion in the classes defined in the present study. As shown in the table, it is clear that the slight erosion (0–10 t∙ha−1∙y−1) is found in 71.34%. The moderate erosion (10–50 t∙ha−1∙y−1), which has the second rank in vastity, covers 25.46% of the basin. The other erosion classes include 3.2% of the Kokcha subbasin in the mountains/foothills and degraded lands. The high slope steepness, very poor vegetation and no conservation practices are the most prominent causes of soil erosion over the Kokcha subbasin.
There is no universal rule for classification of soil erosion values to prepare erosion map. Therefore, different classification schemes were adopted in different studies. Classification of soil erosion class is subjective which can significantly affect the areas covered by different soil erosion zones. JOCA can be used to avoid subjectivity in classification of soil erosion. JOCA classifies values in such a way that the variability of the values within a class is least but among the class is maximum. This ensures the best arrangement of erosion values in different classes. JOCA has been widely used for classification of environmental data for which any generalized classification scheme is not available [62].

4.3. Validation of the RUSLE Model

The available observed soil erosion data (Table 2) is used to validate the results. Table 2 shows that 26 suspended sediment samples for different months are available for the period of 2014–2017.
Figure 4 represents the monthly pattern of soil erosion over the Kokcha subbasin. Figure shows the highest erosion rate in summer (June, July and August) due to snow melting from high mountains. This finding has good agreement with those obtained from the Khawajaghar station where the maximum sediment loads are observed in June and July months. The total annual soil loss estimated for the study area (22,116,974 t) is slightly higher than the mean annual sediment load observed at Khawajaghar station (17,847,711 t). The RUSLE model provides either the underestimated soil erosions due to ignoring the gully erosion, channel erosion, bank erosion, and mass wasting events such as landslides or the overestimated soil losses due to missing the deposition and sediment routing [44]. Hence, the difference between the measured and estimated erosion is acceptable.

4.4. Assessing the Soil Erosion over the Different Land Use and Land Cover

To assess the soil erosion over different land use classes of the Kokcha subbasin, the land use/land cover map of the study area is intersected with the soil erosion map. Table 3 demonstrates the percentage of soil erosion for different land use types. It is clear from the table that Rangeland (52.2%) followed by rainfed agriculture (15.1%) and barren land (9.8%) provides the highest percentage of erosion. The erosion in snow-covered area was found 3.4%. The erosion of snow-covered area might be due to an increase in temperature over Afghanistan [31]. Additionally, slight erosion is found in regions with fruit trees, forest and shrubs, and irrigated agriculture land.
Table 4 illustrates the soil erosion classes (slight, moderate, high, severe, very severe) of different land use existed in the Kokcha subbasin. As presented in the table, it is obvious that the highest erosion rates with different classes are found in the rangeland which followed by rainfed agriculture land and barren land. Due to the importance of rainfed agriculture land, the government should take urgent actions for soil conservation, sustainable land use practices for controlling soil erosion risks.

5. Conclusions

This study proposes an approach to estimate the mean annual soil erosion over the data-scare Kokcha subbasin in Afghanistan. In this way, the RUSLE model, coupled with GIS, is used to estimate soil erosion using the satellite-based data. The following conclusions are obtained from the present study. First, the main fraction (71.34%) of the basin is characterized based on the slight erosion class, while the small area (0.01%) of the study area is induced by very severe soil erosion risk. Second, the central parts of the Kokcha subbasin provide the highest erosion rate. Third, the soil erosion risk is found to be higher in regions with steep slopes, very poor vegetation, and inadequate conservation practices. Fourth, the severe and very severe soil erosion risks are mainly found in mountains/foothills and degraded lands. Fifth, the results of the study have adequate consistency with those obtained from measured data in Khawajaghar station. Sixth, the rangeland has the highest percentage of soil erosion followed by rainfed agriculture land and barren land. Comparison with observed data showed that RUSLE model is able to simulate the seasonal variability of observed soil erosion in the study area. However, a slight overestimation by RUSLE is noticed which may be due to ignoring the deposition and sediment routing. High erosion from agricultural land can significantly reduce soil quality and agricultural sustainability in the region. Different cost-effective adaptation measures including natural confinements of agricultural land, conservation tillage and plant residue management should be adopted for mitigation of soil erosion from agricultural land. Satellite-based precipitation and NDVI data used in this study have considerable uncertainty in estimation. In future, precipitation and NDVI data from different satellite products can be used to assess uncertainty in simulated soil erosion.

Author Contributions

Conceptualization: S.S. and E.-S.C.; methodology: S.T.R. and K.A.; software: Z.S., K.A., and G.F.Z.; validation: N.A.-A., X.W., and S.S.; formal analysis: T.I.; investigation: Z.S.; resources: X.W.; data curation: S.T.R.; writing—original draft preparation: Z.S. and G.F.Z.; writing—review and editing: A.S., E.-S.C., and S.S.; visualization: A.S.; supervision: S.S., N.A.-A.; project administration: T.I.; funding acquisition: N.A.-A. All authors have read and agreed to the published version of the manuscript.

Funding

This research received no external funding.

Institutional Review Board Statement

Not applicable.

Informed Consent Statement

Not applicable.

Data Availability Statement

The data that support the findings of this study are available from the corresponding author upon justifiable request.

Acknowledgments

Authors are grateful to the Ministry of Education, Government of Afghanistan for providing financial support to complete this study. Authors also acknowledge the support provided by Universiti Teknologi Malaysia.

Conflicts of Interest

The authors declare no conflict of interest.

References

  1. Balasubramani, K.; Veena, M.; Kumaraswamy, K.; Saravanabavan, V. Estimation of soil erosion in a semi-arid watershed of Tamil Nadu (India) using revised universal soil loss equation (rusle) model through GIS. Model. Earth Syst. Environ. 2015. [Google Scholar] [CrossRef]
  2. Bashagaluke, J.B.; Logah, V.; Opoku, A.; Sarkodie-Addo, J.; Quansah, C. Soil nutrient loss through erosion: Impact of different cropping systems and soil amendments in Ghana. PLoS ONE 2018. [Google Scholar] [CrossRef] [Green Version]
  3. Domínguez-Castillo, V.; Bovi, R.C.; Chartier, M.P.; Tomazello Filho, M.; Cooper, M. Using dendrogeomorphology to estimate soil erosion in mixed native species and pine forests on Ultisols in Piracicaba, Brazil. Geoderma Reg. 2020. [Google Scholar] [CrossRef]
  4. Issaka, S.; Ashraf, M.A. Impact of soil erosion and degradation on water quality: A review. Geol. Ecol. Landscapes 2017. [Google Scholar] [CrossRef] [Green Version]
  5. Lal, R. Restoring soil quality to mitigate soil degradation. Sustainability 2015, 7, 5875–5895. [Google Scholar] [CrossRef] [Green Version]
  6. Pimentel, D.; Burgess, M. Soil erosion threatens food production. Agriculture 2013, 3, 443–463. [Google Scholar] [CrossRef] [Green Version]
  7. Sthiannopkao, S.; Takizawa, S.; Wirojanagud, W. Effects of soil erosion on water quality and water uses in the upper Phong watershed. Water Sci. Technol. 2006, 53, 45–52. [Google Scholar] [CrossRef]
  8. Nyawade, S.O.; Gachene, C.K.K.; Karanja, N.N.; Gitari, H.I.; Schulte-Geldermann, E.; Parker, M.L. Controlling soil erosion in smallholder potato farming systems using legume intercrops. Geoderma Reg. 2019, 17, e00225. [Google Scholar] [CrossRef]
  9. Sharafati, A.; Pezeshki, E.; Shahid, S.; Motta, D. Quantification and uncertainty of the impact of climate change on river discharge and sediment yield in the Dehbar river basin in Iran. J. Soils Sediments 2020, 20, 2977–2996. [Google Scholar] [CrossRef]
  10. Lal, R. Soil erosion and the global carbon budget. Environ. Int. 2003, 29, 437–450. [Google Scholar] [CrossRef]
  11. Food and Agriculture Organization (FAO). Status of the World’s Soil Resources (SWSR)—Main Report; Food and Agriculture Organization (FAO) of the United Nations: Rome, Italy, 2015. [Google Scholar]
  12. Canora, F.; D’Angella, A.; Aiello, A. Quantitative assessment of the sensitivity to desertification in the Bradano River basin (Basilicata, southern Italy). J. Maps 2015. [Google Scholar] [CrossRef]
  13. Rodrigo Comino, J.; Iserloh, T.; Lassu, T.; Cerdà, A.; Keesstra, S.D.; Prosdocimi, M.; Brings, C.; Marzen, M.; Ramos, M.C.; Senciales, J.M.; et al. Quantitative comparison of initial soil erosion processes and runoff generation in Spanish and German vineyards. Sci. Total Environ. 2016. [Google Scholar] [CrossRef]
  14. Lal, R. Climate Change and Soil Degradation Mitigation by Sustainable Management of Soils and Other Natural Resources. Agric. Res. 2012, 1, 199–212. [Google Scholar] [CrossRef] [Green Version]
  15. Serpa, D.; Nunes, J.P.; Santos, J.; Sampaio, E.; Jacinto, R.; Veiga, S.; Lima, J.C.; Moreira, M.; Corte-Real, J.; Keizer, J.J.; et al. Impacts of climate and land use changes on the hydrological and erosion processes of two contrasting Mediterranean catchments. Sci. Total Environ. 2015. [Google Scholar] [CrossRef] [Green Version]
  16. Tashayo, B.; Honarbakhsh, A.; Akbari, M.; Ostovari, Y. Digital mapping of Philip model parameters for prediction of water infiltration at the watershed scale in a semi-arid region of Iran. Geoderma Reg. 2020. [Google Scholar] [CrossRef]
  17. Pour, S.H.; Wahab, A.K.A.; Shahid, S. Spatiotemporal changes in aridity and the shift of drylands in Iran. Atmos. Res. 2020. [Google Scholar] [CrossRef]
  18. Thomas, J.; Joseph, S.; Thrivikramji, K.P. Assessment of soil erosion in a tropical mountain river basin of the southern Western Ghats, India using RUSLE and GIS. Geosci. Front. 2018. [Google Scholar] [CrossRef]
  19. Ahmed, K.; Shahid, S.; Wang, X.; Nawaz, N.; Khan, N. Spatiotemporal changes in aridity of Pakistan during 1901–2016. Hydrol. Earth Syst. Sci. 2019, 23, 3081–3096. [Google Scholar] [CrossRef] [Green Version]
  20. Abdul malik Dawlatzi, M.M. Estimation of Soil Erosion Based on USLE and GIS in Gardez Basin of Paktya Province, Afghanistan. Int. J. Environ. Rural Dev. 2017. [Google Scholar] [CrossRef]
  21. Crosson, P. Soil erosion estimates and costs. Science 1995, 80. [Google Scholar] [CrossRef]
  22. Pimentel, D.; Harvey, C.; Resosudarmo, P.; Sinclair, K.; Kurz, D.; McNair, M.; Crist, S.; Shpritz, L.; Fitton, L.; Saffouri, R.; et al. Environmental and economic costs of soil erosion and conservation benefits. Science 1995, 80. [Google Scholar] [CrossRef] [Green Version]
  23. Wantzen, K.M.; Mol, J.H. Soil erosion from agriculture and mining: A threat to tropical stream ecosystems. Agriculture 2013, 3, 660–683. [Google Scholar] [CrossRef] [Green Version]
  24. Saba, D.S. Afghanistan: Environmental degradation in a fragile ecological setting. Int. J. Sustain. Dev. World Ecol. 2001. [Google Scholar] [CrossRef]
  25. Shrestha, R. Land Degradation in Afghanistan A Chapter Prepared for the State of Environment of Afghanistan Asian Institute of Technology; Asian Institute of Technology: Bangkok, Thailand, 2007. [Google Scholar]
  26. Ehsan, M. Estimation of Soil Erosion Potential in Herat Province, Afghanistan. Ph.D. Thesis, Shimane University, Shimane, Japan, 2015. [Google Scholar]
  27. Sahaar, A.S. Erosion Mapping and Sediment Yield of the Kabul River Basin, Afghanistan. Master’s Thesis, Colorado State University, Fort Collins, CO, USA, 2013. [Google Scholar]
  28. Ahmad, M.; Wasiq, M. Water Resource Development in Northern Afghanistan and Its Implications for Amu Darya Basin; World Bank: Washington, DC, USA, 2004. [Google Scholar]
  29. Qureshi, A.S. Water resources management in Afghanistan. Int. Water Manag. Inst. 2002, 49, 1–24. [Google Scholar]
  30. Qutbudin, I.; Shiru, M.S.; Sharafati, A.; Ahmed, K.; Al-Ansari, N.; Yaseen, Z.M.; Shahid, S.; Wang, X. Seasonal Drought Pattern Changes Due to Climate Variability: Case Study in Afghanistan. Water 2019, 11, 1096. [Google Scholar] [CrossRef] [Green Version]
  31. Aich, V.; Akhundzadah, N.A.; Knuerr, A.; Khoshbeen, A.J.; Hattermann, F.; Paeth, H.; Scanlon, A.; Paton, E.N. Climate change in Afghanistan deduced from reanalysis and coordinated regional climate downscaling experiment (CORDEX)-South Asia simulations. Climate 2017, 5, 38. [Google Scholar] [CrossRef] [Green Version]
  32. Sediqi, M.N.; Shiru, M.S.; Nashwan, M.S.; Ali, R.; Abubaker, S.; Wang, X.; Ahmed, K.; Shahid, S.; Asaduzzaman, M.; Manawi, S.M.A. Spatio-temporal pattern in the changes in availability and sustainability ofwater resources in Afghanistan. Sustainability 2019, 11, 5836. [Google Scholar] [CrossRef] [Green Version]
  33. Savage, M.; Dougherty, B.; Hamza, M.; Butterfield, R.; Bharwani, S. Socio-Economic Impacts of Climate Change in Afghanistan: A Report to the Department for International Development; Stockholm Environment Institute: Oxford, UK, 2009. [Google Scholar]
  34. Lucà, F.; Buttafuoco, G.; Terranova, O. GIS and Soil. In Comprehensive Geographic Information Systems; Elsevier: Oxford, UK, 2018; ISBN 9780128046609. [Google Scholar]
  35. Ostovari, Y.; Ghorbani-Dashtaki, S.; Bahrami, H.-A.; Naderi, M.; Dematte, J.A.M. Soil loss estimation using RUSLE model, GIS and remote sensing techniques: A case study from the Dembecha Watershed, Northwestern Ethiopia. Geoderma Reg. 2017. [Google Scholar] [CrossRef]
  36. Obaid, H.A.; Shahid, S. Soil erosion susceptibility of Johor River basin. Water Environ. J. 2017. [Google Scholar] [CrossRef]
  37. Piacentini, T.; Galli, A.; Marsala, V.; Miccadei, E. Analysis of soil erosion induced by heavy rainfall: A case study from the NE Abruzzo Hills Area in Central Italy. Water (Switzerland) 2018, 10, 1314. [Google Scholar] [CrossRef] [Green Version]
  38. Thomas, J.; Joseph, S.; Thrivikramji, K.P. Estixmation of soil erosion in a rain shadow river basin in the southern Western Ghats, India using RUSLE and transport limited sediment delivery function. Int. Soil Water Conserv. Res. 2018. [Google Scholar] [CrossRef]
  39. Wei, W.; Chen, L.; Fu, B.; Chen, J. Water erosion response to rainfall and land use in different drought-level years in a loess hilly area of China. Catena 2010. [Google Scholar] [CrossRef]
  40. Zerihun, M.; Mohammedyasin, M.S.; Sewnet, D.; Adem, A.A.; Lakew, M. Assessment of soil erosion using RUSLE, GIS and remote sensing in NW Ethiopia. Geoderma Reg. 2018. [Google Scholar] [CrossRef]
  41. Vågen, T.G.; Winowiecki, L.A. Predicting the spatial distribution and severity of soil erosion in the global tropics using satellite remote sensing. Remote Sens. 2019, 11, 1800. [Google Scholar] [CrossRef] [Green Version]
  42. Ghozat, A.; Sharafati, A.; Hosseini, S.A. Long-term spatiotemporal evaluation of CHIRPS satellite precipitation product over different climatic regions of Iran. Theor. Appl. Climatol. 2021. [Google Scholar] [CrossRef]
  43. Mondal, A.; Khare, D.; Kundu, S. A comparative study of soil erosion modelling by MMF, USLE and RUSLE. Geocarto Int. 2018, 33, 89–103. [Google Scholar] [CrossRef]
  44. Benavidez, R.; Jackson, B.; Maxwell, D.; Norton, K. A review of the (Revised) Universal Soil Loss Equation ((R)USLE): With a view to increasing its global applicability and improving soil loss estimates. Hydrol. Earth Syst. Sci. 2018. [Google Scholar] [CrossRef] [Green Version]
  45. Koirala, P.; Thakuri, S.; Joshi, S.; Chauhan, R. Estimation of soil erosion in Nepal using a RUSLE modeling and geospatial tool. Geosciences 2019, 9, 147. [Google Scholar] [CrossRef] [Green Version]
  46. Bahrawi, J.A.; Elhag, M.; Aldhebiani, A.Y.; Galal, H.K.; Hegazy, A.K.; Alghailani, E. Soil Erosion Estimation Using Remote Sensing Techniques in Wadi Yalamlam Basin, Saudi Arabia. Adv. Mater. Sci. Eng. 2016. [Google Scholar] [CrossRef] [Green Version]
  47. Liu, J.; Baulch, H.M.; Macrae, M.L.; Wilson, H.F.; Elliott, J.A.; Bergström, L.; Glenn, A.J.; Vadas, P.A. Agricultural Water Quality in Cold Climates: Processes, Drivers, Management Options, and Research Needs. J. Environ. Qual. 2019. [Google Scholar] [CrossRef] [Green Version]
  48. Wu, Y.; Ouyang, W.; Hao, Z.; Yang, B.; Wang, L. Snowmelt water drives higher soil erosion than rainfall water in a mid-high latitude upland watershed. J. Hydrol. 2018. [Google Scholar] [CrossRef]
  49. Kurylyk, B.L.; MacQuarrie, K.T.B.; McKenzie, J.M. Climate change impacts on groundwater and soil temperatures in cold and temperate regions: Implications, mathematical theory, and emerging simulation tools. Earth-Sci. Rev. 2014, 138, 313–334. [Google Scholar] [CrossRef]
  50. Starkloff, T. Winter Hydrology and Soil Erosion Processes in an Agricultural Catchment in Norway. Ph.D. Thesis, Wageningen University, Wageningen, The Netherlands, 2017. [Google Scholar]
  51. Gafurov, A. Water Balance Modeling Using Remote Sensing Information: Focus on Central Asia. Ph.D. Thesis, University of Stuttgart, Stuttgart, Germany, 2010. [Google Scholar]
  52. Renard, K.; Foster, G.; Weesies, G.; McCool, D.; Yoder, D. Predicting Soil Erosion by Water: A Guide to Conservation Planning with the Revised Universal Soil Loss Equation (RUSLE); Agriculture Handbook No. 703; Department of Agriculture: Washington, DC, USA, 1997. [Google Scholar]
  53. Wischmeier, W.; Smith, D. Predicting Rainfall Erosion Losses: A Guide to Conservation Planning; Agriculture Handbook 537; Department of Agriculture, Science and Education Administration: Beltsville, MD, USA, 1978. [Google Scholar]
  54. Yan, R.; Zhang, X.; Yan, S.; Chen, H. Estimating soil erosion response to land use/cover change in a catchment of the Loess Plateau, China. Int. Soil Water Conserv. Res. 2018. [Google Scholar] [CrossRef]
  55. Blanco-Canqui, H.; Lal, R. Principles of Soil Conservation and Management; Springer: Heidelberg, Germany, 2010; ISBN 9789048185290. [Google Scholar]
  56. Williams, J.R.; Renard, K.G.; Dyke, P.T. EPIC: A new method for assessing erosion’s effect on soil productivity. J. Soil Water Conserv. 1983, 38, 381–383. [Google Scholar]
  57. Ashiagbor, G.; Forkuo, E.K.; Laari, P.; Aabeyir, R. Modeling soil erosion using rusle and gis tools. Int. J. Remote Sens. Geosci. 2012, 2, 1–17. [Google Scholar]
  58. Ferreira, V.; Panagopoulos, T. Seasonality of soil erosion under Mediterranean conditions at the Alqueva dam watershed. Environ. Manag. 2014, 54, 67–83. [Google Scholar] [CrossRef]
  59. Van der Knijff, J.M.; Jones, R.R.J.; Montanarella, L. Soil Erosion Risk Assessment in Italy; European Commission: Brussels, Belgium, 1999. [Google Scholar]
  60. Van der Knijff, J.M.; Jones, R.J.A.; Montanarella, L. Soil Erosion Risk Assessment in Europe; European Soil Bureau; European Commission: Brussels, Belgium, 2000. [Google Scholar]
  61. Jenks, G.F. The data model concept in statistical mapping. Int. Yearb. Cartogr. 1967, 7, 186–190. [Google Scholar]
  62. Ahmed, K.; Shahid, S.; bin Harun, S.; Ismail, T.; Nawaz, N.; Shamsudin, S. Assessment of groundwater potential zones in an arid region based on catastrophe theory. Earth Sci. Inform. 2015. [Google Scholar] [CrossRef]
Figure 1. Geographical location and topography of the Kokcha subbasin.
Sustainability 13 01549 g001
Figure 2. The maps of the RUSLE factors over the Kokcha subbasin. (a) Rainfall erosivity (R) factor, (b) soil erodibility (K) factor, (c) slope length and steepness (LS) factor, and (d) land cover management (C) factor.
Sustainability 13 01549 g002aSustainability 13 01549 g002b
Figure 3. Annual soil erosion map of Kokcha subbasin.
Sustainability 13 01549 g003
Figure 4. Monthly soil erosion over of the study area.
Sustainability 13 01549 g004
Table 1. Description of the soil erosion rate classes in Kokcha subbasin.
Soil Loss (t∙ha−1∙y−1)Risk CategoriesArea (ha)Area (%)
0–10Slight1,555,970.2071.34
10–50Moderate555,345.5125.46
50–150High53,096.232.43
150–500Severe16,521.360.76
>500Very Severe227.880.01
Total2,181,161.17100.00
Table 2. Observed data of Khawajaghar sediment gauging station.
DateG .H (m)Mean Discharge m3/sSuspended Sediment
Conc ppmDischarge (t/d)
4 May 20142.72149.17572.2297,547.21
17 August 20143.06223.779.991546.10
24 December 20142.0848.06156.98651.82
27 January 20152.0552.36103.30467.32
28 February 20152.1676.42347.002291.13
13 April 20152.36124.21818.0019,508.74
4 May 20152.42150.43338.0043,375.84
16 June 20153.48451.852016.0078,704.32
5 July 20154.17965008.00344,422.20
13 August 20152.63412.32680.0095,468.89
13 September 20152.63186.2186.903006.79
2 November 20152.23128.386.27956.31
26 January 20162.1591.29115.40910.21
16 March 20162.0279.68270.901864.97
12 April 20162.44180.91158.0018,099.26
18 May 20162.95259.24385.0098,201.55
15 June 20163.8517.86520.00291,691.24
27 July 20163.3326.92058.0058,126.48
5 September 20162.72164.4124.001761.32
9 October 20162.42127659.007231.08
6 December 20162.1495.7302.002497.08
28 February 20172.6877.23679.544534.33
1 June 20172.68166.258020.10115,200.77
30 July 20173.58329.782734.0877,902.12
12 September 20172.99185.311065.8717,065.46
22 October 20172.6108359.453354.05
Daily mean43,611.3
Annual mean17,847,711.6
Table 3. Mean annual soil loss rate in different LULC.
LULCArea (ha)Area (%)Percentage of Erosion (%)
Barren land212,751.59.759.8
Barren land/Rangeland103,046.94.724.7
Built-up7005.240.320.3
Forest and shrubs17,885.570.820.8
Forest and shrubs/Rangeland623.430.030.0
Fruit Trees3451.920.160.2
Fruit Trees/Irrigated agriculture land1053.970.050.0
Irrigated agriculture land60,604.522.782.8
Irrigated agriculture land/ Fruit Trees3887.350.180.2
Rainfed agriculture land329,655.315.1115.1
Rainfed agriculture land/Forest and shrubs949.650.040.0
Rainfed agriculture land/Rangeland16,992.780.780.8
Rangeland1,139,35252.2452.2
Rangeland/Barren land164,5957.557.5
Rangeland/Rainfed agriculture land210,07.040.961.0
Snow-covered 74,825.53.433.4
Water Bodies23,473.471.081.1
Table 4. Soil erosion of Kokcha subbasin area (ha) based on land use/land cover.
LULCArea (ha)Soil Erosion (t ha−1 y−1)
Slight 0–10Moderate 10–50High 50–100Severe 100–500Very Severe >500
Barren land212,751.54151,770.1054,168.685179.031611.5022.23
Barren land/Rangeland103,046.9273,510.3526,236.782508.48780.5410.77
Built-up7005.244997.311783.61170.5353.060.73
Forest and shrubs17,885.5712,758.994553.85435.39135.481.87
Forest and shrubs/Rangeland623.43444.73158.7315.184.720.07
Fruit Trees3451.922462.49878.8984.0326.150.36
Fruit Trees/Irrigated agriculture land1053.97751.87268.3525.667.980.11
Irrigated agriculture land60,604.5243,233.3115,430.521475.30459.056.33
Irrigated agriculture land/Fruit Trees3887.352773.11989.7694.6329.450.41
Rainfed agriculture land329,655.34235,165.5183,933.568024.832497.0034.44
Rainfed agriculture land/Forest and shrubs949.65677.45241.7923.127.190.10
Rainfed agriculture land/Rangeland16,992.7812,122.104326.53413.66128.711.78
Rangeland1,139,351.95812,777.02290,090.427,735.48630.10119.04
Rangeland/Barren land164,594.97117,416.7641,907.534006.751246.7417.20
Rangeland/Rainfed agriculture land21,007.0414,985.755348.60511.38159.122.19
Snow74,825.5053,378.1019,051.321821.48566.777.82
Water Bodies23,473.4716,745.225976.58571.42177.802.45
Total Area (ha)2,181,161.171,555,970555,34653,09616,521228
Percentage 71.3425.462.430.760.01
Publisher’s Note: MDPI stays neutral with regard to jurisdictional claims in published maps and institutional affiliations.

