Article

Vulnerability Comparison between Karst and Non-Karst Nature Reserves—With a Special Reference to Guizhou Province, China

1
School of Karst Science, Guizhou Normal University, Baoshanbei Road 180, Guiyang 550001, China
2
State Engineering Technology Institute for Karst Desertification Control, Baoshanbei Road 180, Guiyang 550001, China
*
Author to whom correspondence should be addressed.
Sustainability 2021, 13(5), 2442; https://0-doi-org.brum.beds.ac.uk/10.3390/su13052442
Submission received: 5 December 2020 / Revised: 18 February 2021 / Accepted: 21 February 2021 / Published: 24 February 2021
(This article belongs to the Collection Risk Assessment and Management)

Abstract

:
Studying vulnerability has become one of the hot issues of ecological research under global change and sustainable development scenarios. However, there are few studies focusing on the vulnerability of karst areas, especially on the comparison between karst and non-karst areas. This study integrated climate factors, soil and vegetation factors, and social factors within a vulnerability evaluation framework that combined the analytical hierarchy process (AHP) technique to evaluate and compare the ecological environments of 10 karst nature reserves and five non-karst nature reserves in Guizhou Province, China. The evaluation results were divided into five categories: potential, light, moderate, severe, and extremely severe vulnerability. The results indicated that the general vulnerability of national nature reserves in Guizhou Province showed moderate vulnerability. The vulnerability index of karst nature reserves was significantly higher than that of non-karst nature reserves. The general vulnerability of karst nature reserves showed moderate vulnerability, while that of non-karst nature reserves showed light vulnerability. Average soil thickness, arable area, and the length of roads may be the factors contributing to the significant difference in the vulnerability between karst and non-karst nature reserves. Overall, this study is conducive to a comprehensive understanding of the ecological environment status of national nature reserves in Guizhou Province, and is of great significance to maintaining ecological security and sustainable development in karst areas.

1. Introduction

Due to the impact of global climate change, economic development, and anthropogenic activities, global and regional ecosystems are undergoing unprecedented pressure and deterioration such as vegetation reduction, soil erosion, and biodiversity loss [1,2,3]. Identifying and evaluating vulnerable zones is an essential step for ecological conservation and environmental management [4,5]. In recent years, the study of vulnerability has become one of the hot issues of ecological research under global change and sustainable development scenarios [6,7,8,9].
Vulnerability is generally defined as the instability of an ecosystem in comparison with its original steady-state after being affected by both natural environments and human activities at a specific spatial-temporal scale [10,11]. Vulnerability evaluation is a useful tool to help decision-makers understand the various impacts of natural and factitious elements on the ecosystem, and it has been widely used in marine and coastal ecosystems [12,13], freshwater ecosystems [14], forest ecosystems [15], grassland ecosystems [16], desert ecosystems [17], and agricultural ecosystems [18]. However, most studies focused on typical ecologically vulnerable regions with poor natural conditions or severe human interference, and research on the evaluation of vulnerability at a provincial scale is still rare [8,19]. Furthermore, although vulnerability evaluation has been widely applied in various vulnerable zones, there are few studies focusing on the vulnerability of karst areas, especially on the comparison of vulnerability between karst and non-karst areas. Guo et al. (2020) studied the spatial-temporal change pattern and driving mechanism of ecological vulnerability in the southwest karst mountain region of China [20], which was useful for planning the conservation strategies or assessments of the conservation priorities in karst areas, but unfortunately, they did not distinguish karst and non-karst areas.
Karst is a type of landscape that is widely distributed around the world, accounting for approximately 15% of the global land area [21]. The karst landscape is formed from interactions between acidic water and minerals (e.g., limestone and gypsum) that generate spectacular yet vulnerable environments over time [22]. Compared with non-karst areas, the vulnerability of karst areas can be reflected in the following four aspects: (1) carbonate rocks are characterized by high resistance to wind erosion, showing a slow soil formation rate [23,24]; (2) the land surface in karst areas is very rugged and fragmented [20]; (3) the karst dual hydrogeological structures could make the surface habitat prone to drought and water shortage due to the downward leakage of water [25]; (4) the plant community in karst areas is characterized by simple structure, slow positive succession rate, and weak self-regulation ability [26]. Despite the above understanding of the driving mechanism of vulnerability in karst areas, to our knowledge, there are no studies that quantitatively compare the vulnerability between karst and non-karst areas.
This study aims to integrate climate factors, soil and vegetation factors, and social factors within a vulnerability evaluation framework that combines the analytical hierarchy process (AHP) technique to compare the ecological environments between 10 karst nature reserves and five non-karst nature reserves in Guizhou Province. The constructed vulnerability evaluation framework will be expected to answer the following two questions: (1) how is the general vulnerability of national nature reserves in Guizhou Province?; and (2) is the vulnerability of karst nature reserves higher than that of non-karst nature reserves? If so, which parameters account for this difference?

2. Materials and Methods
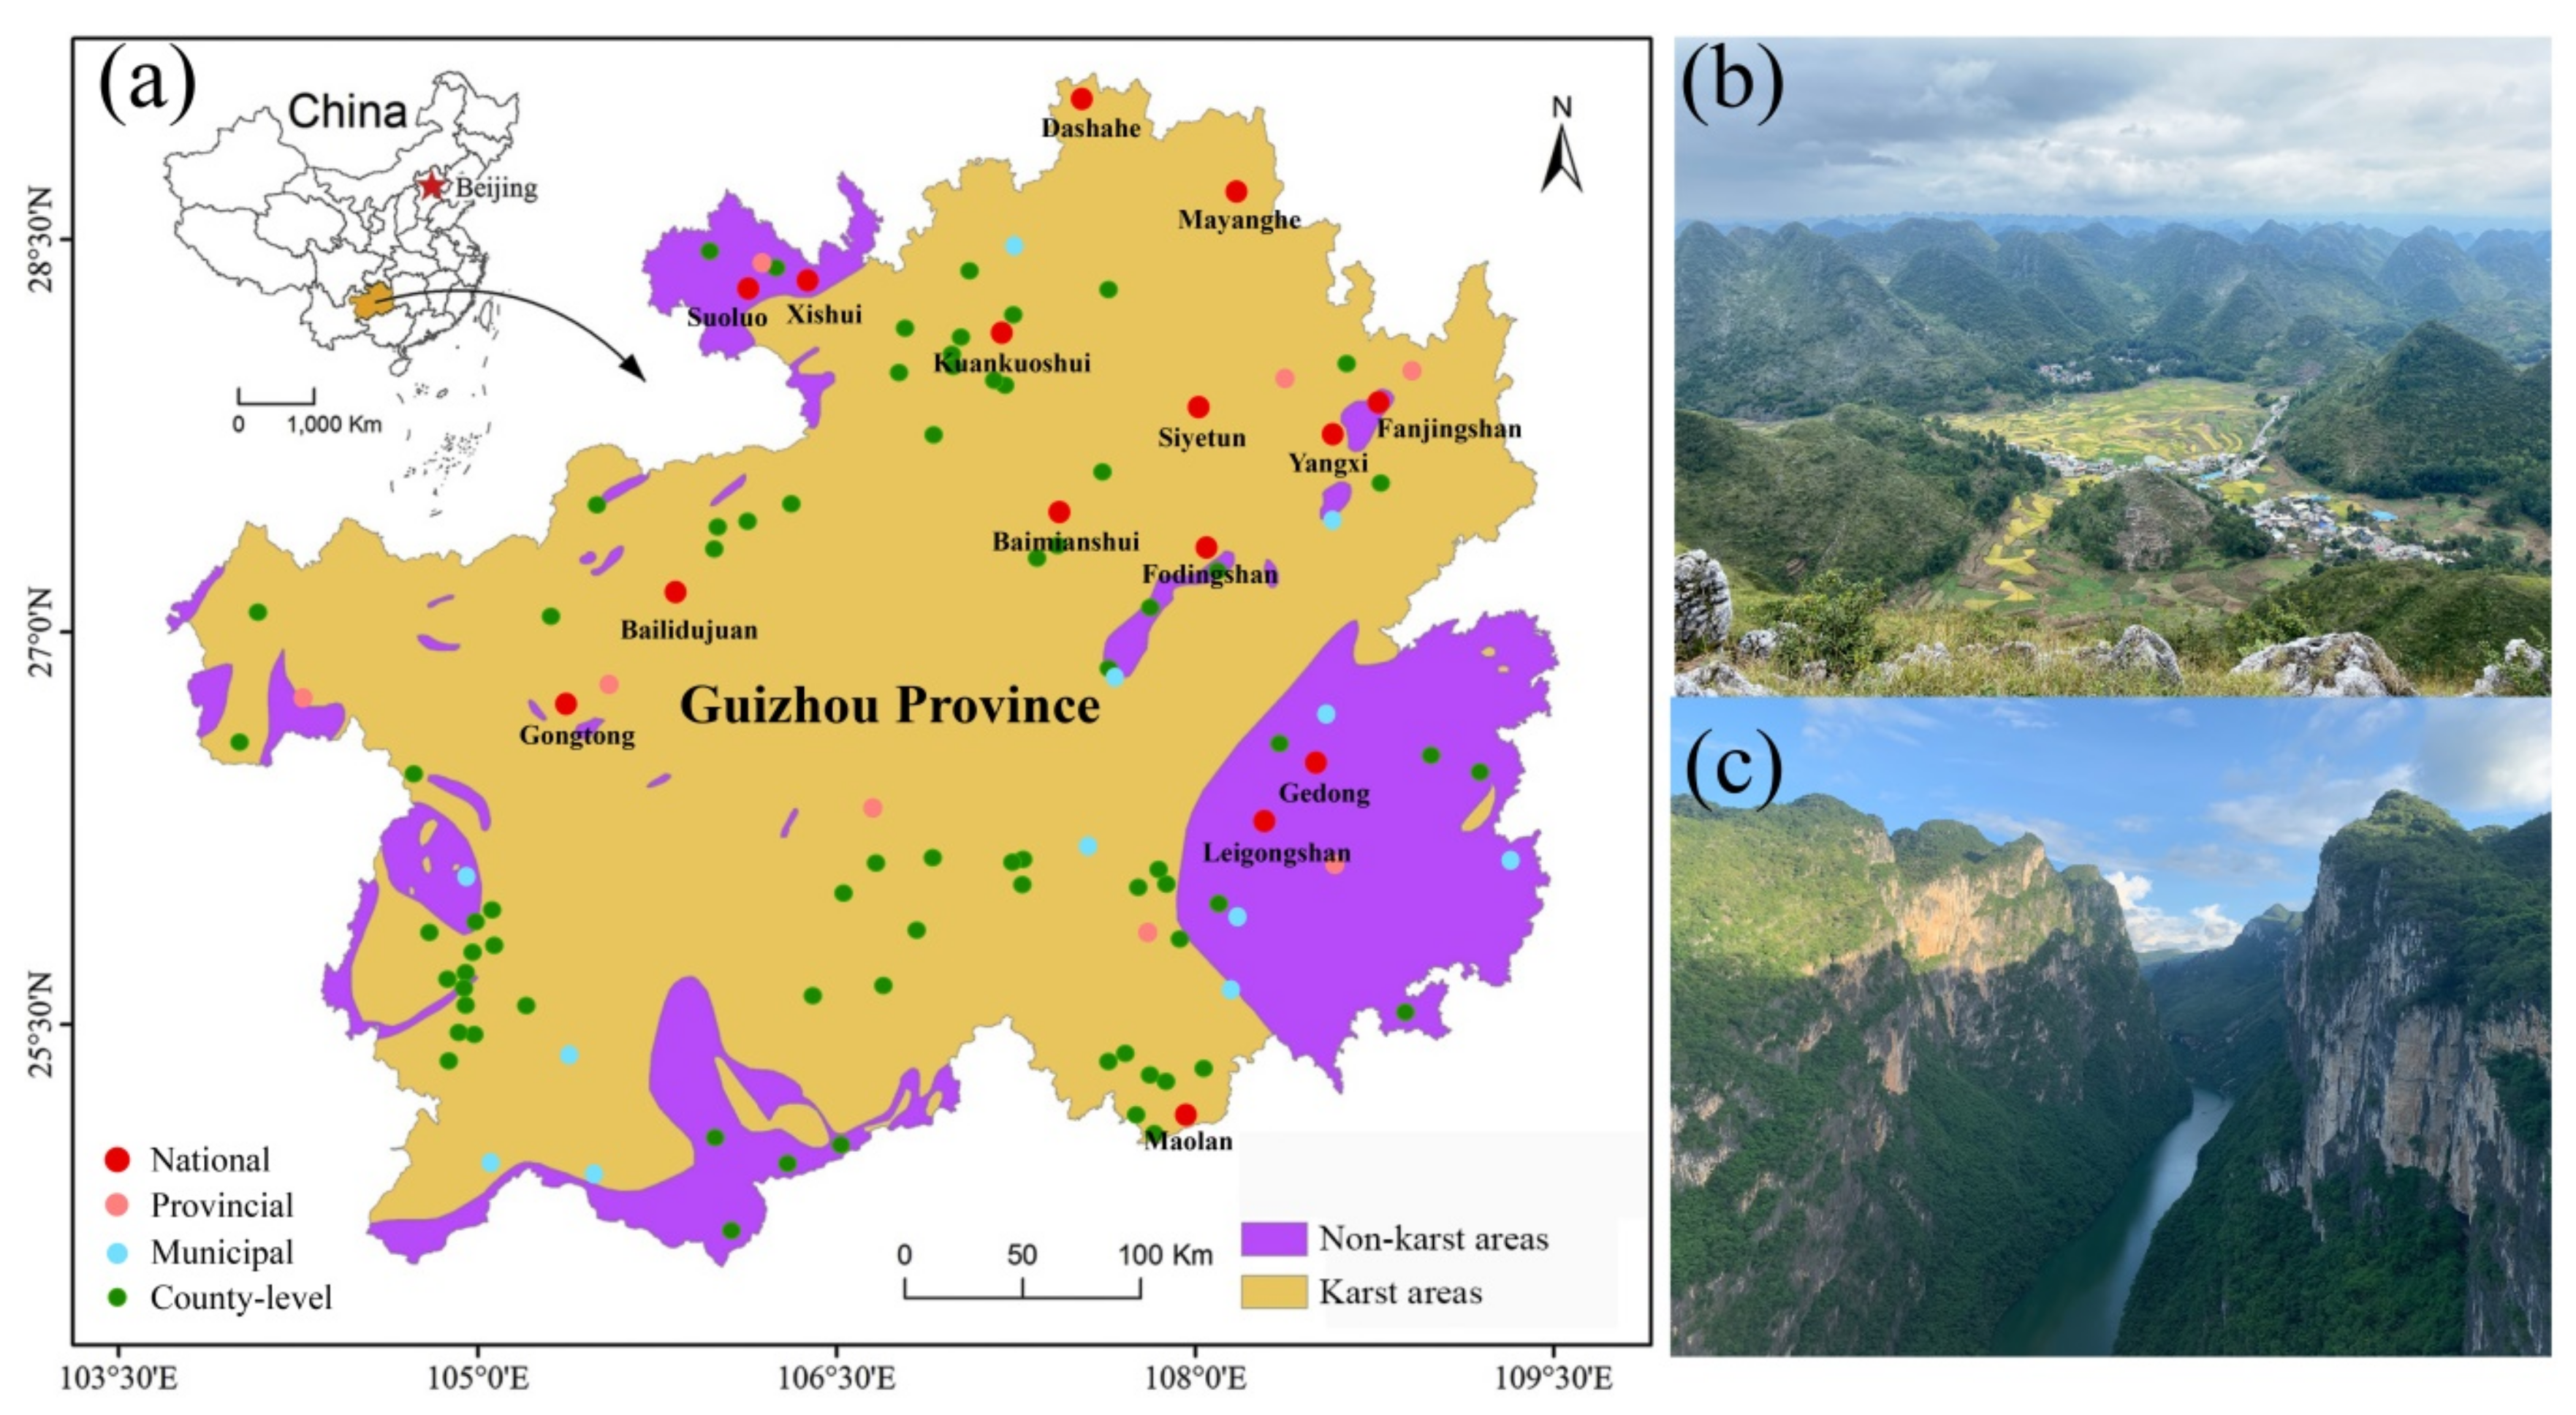
2.1. Study Area

Guizhou Province (24°37’–29°13’ N, 103°36’–109°35’ E) is located in southwest China, under the jurisdiction of six prefecture-level cities and three autonomous prefectures, with a land area of 176,167 km2, a total population of 36,229,500, and a total GDP of CNY 1,676,934 million at the end of 2019, which is about half of the average provincial GDP of CNY 3,178,495 in China. Guizhou Province experiences a subtropical monsoon climate with a mean annual precipitation of 1292 mm and a mean annual temperature of 16.1 °C. The karst landscape in Guizhou Province is very typical, with an exposed karst area of 109,084 km2, accounting for 61.9% of the total land area of the province, which is the largest karst area in China (Figure 1). The sharp contradiction between humans and land (large population, long-term disordered development of resources) leads to increasingly serious soil erosion and vegetation damage, resulting in serious rocky desertification and its continuous deterioration. In order to protect biodiversity and support the ecosystem’s sustainable development, by the end of 2019, Guizhou Province had established 106 nature reserves, including 15 national nature reserves, seven provincial nature reserves, 12 municipal nature reserves, and 72 county-level nature reserves (Figure 1A). The total area of nature reserves accounts for 5.07% of the province’s land area. Ten karst nature reserves (Baimianshui, Kuankuoshui, Dashahe, Maolan, Fodingshan, Siyetun, Yangxi, Mayanghe, Bailidujuan, and Gongtong) and five non-karst nature reserves (Suoluo, Xishui, Fanjingshan, Gedong, and Leigongshan) selected in this study are all terrestrial natural ecosystems. For further details on the peculiarities of each nature reserve, refer to the description in the Supplementary Information.

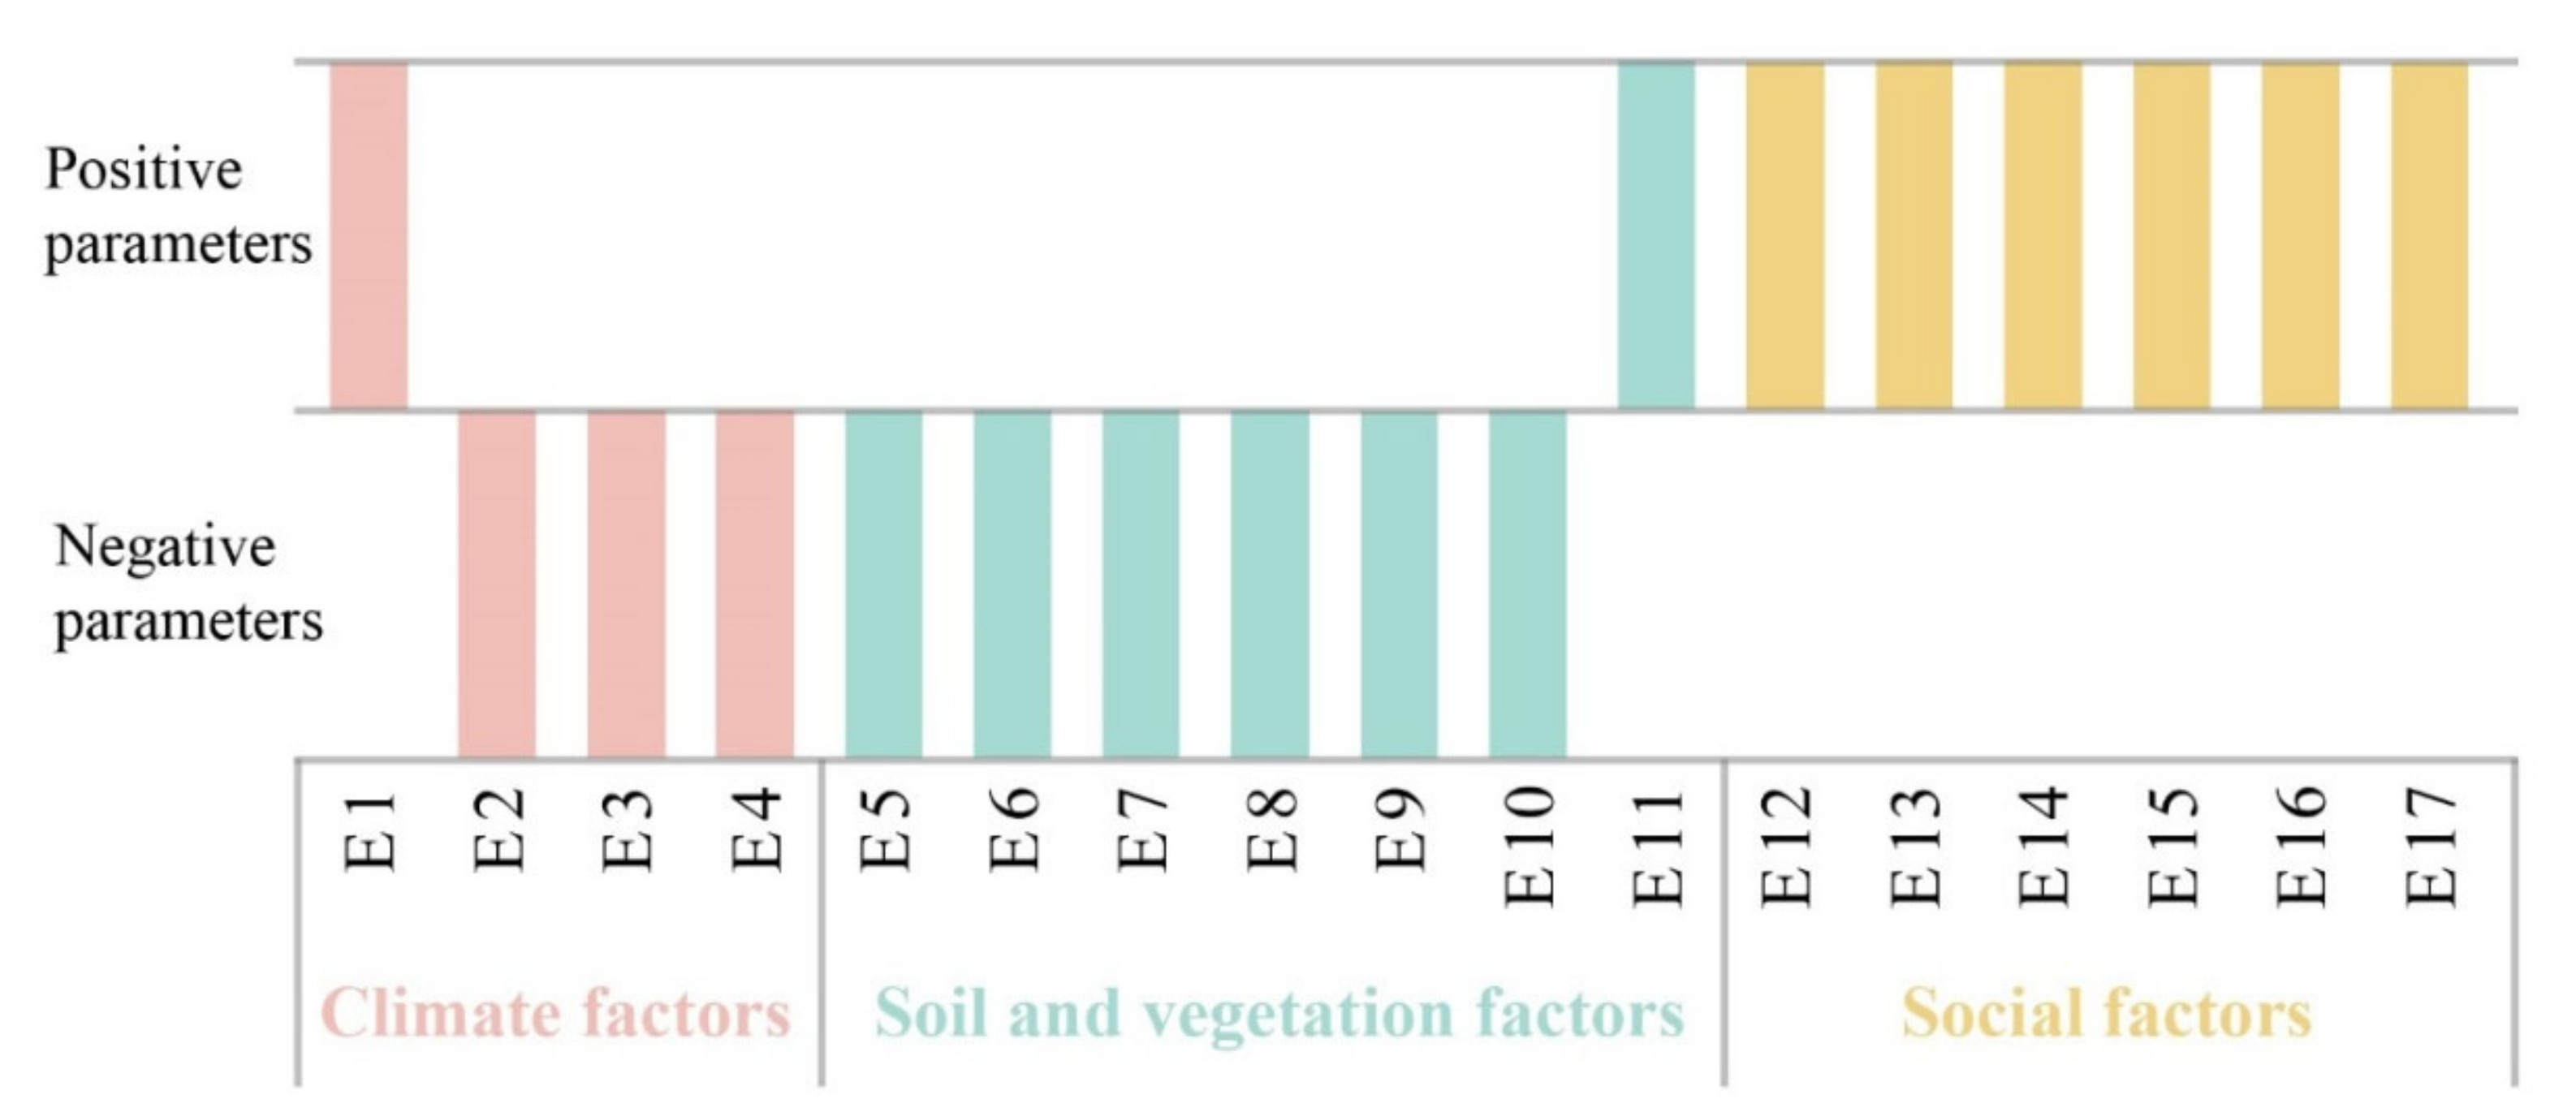
2.2. Parameter Selection and Description

Vulnerability evaluation is a complicated process. For now, there is no internationally recognized standard or rule to stipulate how many and what parameters should be selected to capture vulnerability [27]. Various parameters influencing the vulnerability of nature reserves in Guizhou Province are considered. However, it should be noted that this selection of parameters is not exhaustive, and only those salient parameters for which information is of great significance are selected. Therefore, 17 representative parameters reflecting natural and anthropogenic elements are selected and divided into three groups: climate factors, soil and vegetation factors, and social factors (Table 1 and Figure 2).
As a basic climatic indicator, temperature and precipitation are the driving force of all natural factors and the energy basis of ecosystems [5]. The frost period directly affects agriculture production, ecological environments, the inhabitants, and the development of the social economy [5]. Runoff depth, closely related to precipitation, can objectively reflect the abundance of water resources per unit area. Therefore, average annual temperature, average annual precipitation, annual frost-free period, and runoff depth were selected as climate factors.
As an important indicator in vulnerability evaluation, vegetation condition directly influences and even determines the function of an ecosystem [28,29]. For example, high forest cover can effectively contain water and prevent soil erosion and disasters such as landslides and debris flows [30,31]. The number of plant species is the indicator of plant diversity, which plays an important role in ecosystem functions and services [32]. Besides, invasive species can accelerate the extinction of native species and disrupt the balance of the ecosystem [33], thus generating the vulnerability of the ecosystem. Plant growth is supported by the soil, which indirectly influences the vulnerability of an ecosystem through its effects on vegetation. Thus, average soil thickness, organic matter, total nitrogen, total phosphorus, forest coverage rate, the number of wild plant species, and the number of invasive species were chosen as soil and vegetation factors.
Road development and agricultural activities directly generate vulnerability for an ecosystem [34]. Population density is related to the intensity of human activity in an ecosystem. The land discarded by factories and mines could result in environmental pollution, and geological disasters such as landslides, debris flows, and surface collapses due to human activities or harsh environments could disrupt ecosystem balance. The construction of reservoirs has a direct impact on the vulnerability of an ecosystem. Therefore, the length of roads, arable area, population density, the number of lands discarded by factories and mines, the number of geological disaster sites, and the number of reservoirs were selected as social factors.
Furthermore, the number of wild plant species, the number of invasive species, the length of roads, arable area, and the number of lands discarded by factories and mines were relativized by the area of nature reserves to avoid penalizing large nature reserves.

2.3. Standardization of Evaluation Parameters

Since the data types and scales of the evaluation parameters were different and cannot be evaluated directly, the data need to be standardized to eliminate the influence of the scales before evaluation. The effect of evaluation parameters on vulnerability can be divided into positive and negative impacts. Therefore, evaluation parameters were divided into positive and negative parameters (Figure 2). A positive parameter indicates that the higher the value of the parameter, the higher the degree of vulnerability, while a negative parameter suggests that the higher the value of the parameter, the lower the degree of vulnerability. By using the range standardization method, the original values were standardized with a range of 0–10 [35,36].
The positive parameter was standardized according to the formula shown below:
Z = Z i Z m i n Z m a x Z m i n × 10
The negative parameter was standardized according to the formula shown below:
Z = Z m a x Z i Z m a x Z m i n × 10
In Formulas (1) and (2), Zi is the original value of i. Zmax and Zmin are the maximum and the minimum value of i. Z is the standardized value of i, with a range of 0–10.

2.4. Weight Determination

The analytical hierarchy process (AHP) is a systematic analyzing evaluation method to make the complex and multi-index system quantitatively, which could decompose the complex problem to some layers and some factors, and could compare and calculate as a result of weight [36]. Due to its ability to assign proper weights to various factors of complex systems, the AHP technique is applied to determine weights of the selected parameters in our vulnerability evaluation and other studies [27,29,36,37,38,39]. The main steps of the AHP technique are as follows [27]:
(1)
Deconstruct the decision-making problem into a hierarchical structure. The object is “vulnerability”, which is then deconstructed into the second layer, consisting of climate factors, soil and vegetation factors, and social factors. Finally, the second layer is further deconstructed into the third layer with corresponding parameters.
(2)
Make decision tables for the hierarchical decomposition in each layer with pair-wise comparisons. A preference scaling approach is executed in the pair-wise comparisons with 17 scales: 9, 8, … 2, 1, 1/2, … 1/8, 1/9, where 9 means that one parameter is the most important for the object relative to another parameter, and 1 means that the contributions of two parameters are equal to the object, and so on down to 1/9, the least important.
(3)
Make judgment matrices for the object layer and second layer with the scale numbers from step 2, respectively. In the judgment matrices, 1 is the value of diagonal. If the ith row is more important than the jth column, the value of (i,j) is more than 1, otherwise the jth column is more important than the ith row.
(4)
Determine weight for each parameter by the largest eigenvalue of the judgment matrix, as shown in the following formula:
λ m a x = i = 1 n i j = 1 n a i j w j / w i n
(5)
Estimate the consistency of the judgment matrix by consistency ratio (CR). The CR is related to consistency index (CI) and random index (RI) by the following formula:
CR = CI RI
where the CI is calculated according to the formula:
CI = λ m a x n n 1
and the RI is a random matrix defined as the average value of the resulting consistency index depending on the order of the matrix.
(6)
Aggregate the local weight of each parameter to achieve the general weight of the corresponding group.

2.5. Vulnerability Index (VI)

The vulnerability index (VI) is an important index used to reflect and characterize the degree of vulnerability in the study area. The higher the VI value, the more vulnerable the ecological environment is. The parameters evaluated were combined by applying a weight of each parameter, followed by a summation of the results to yield a VI value. Thus, the VI can be calculated by the following formula [36,40]:
VI = i = 1 n Z i × W i
where VI is the vulnerability index, Zi is the standardized value of parameter i, and Wi is the weight of parameter i.
Furthermore, the non-parametric “Mann–Whitney U” test was used to compare the vulnerability between karst and non-karst nature reserves (SPSS 22.0, Chicago, IL, USA).

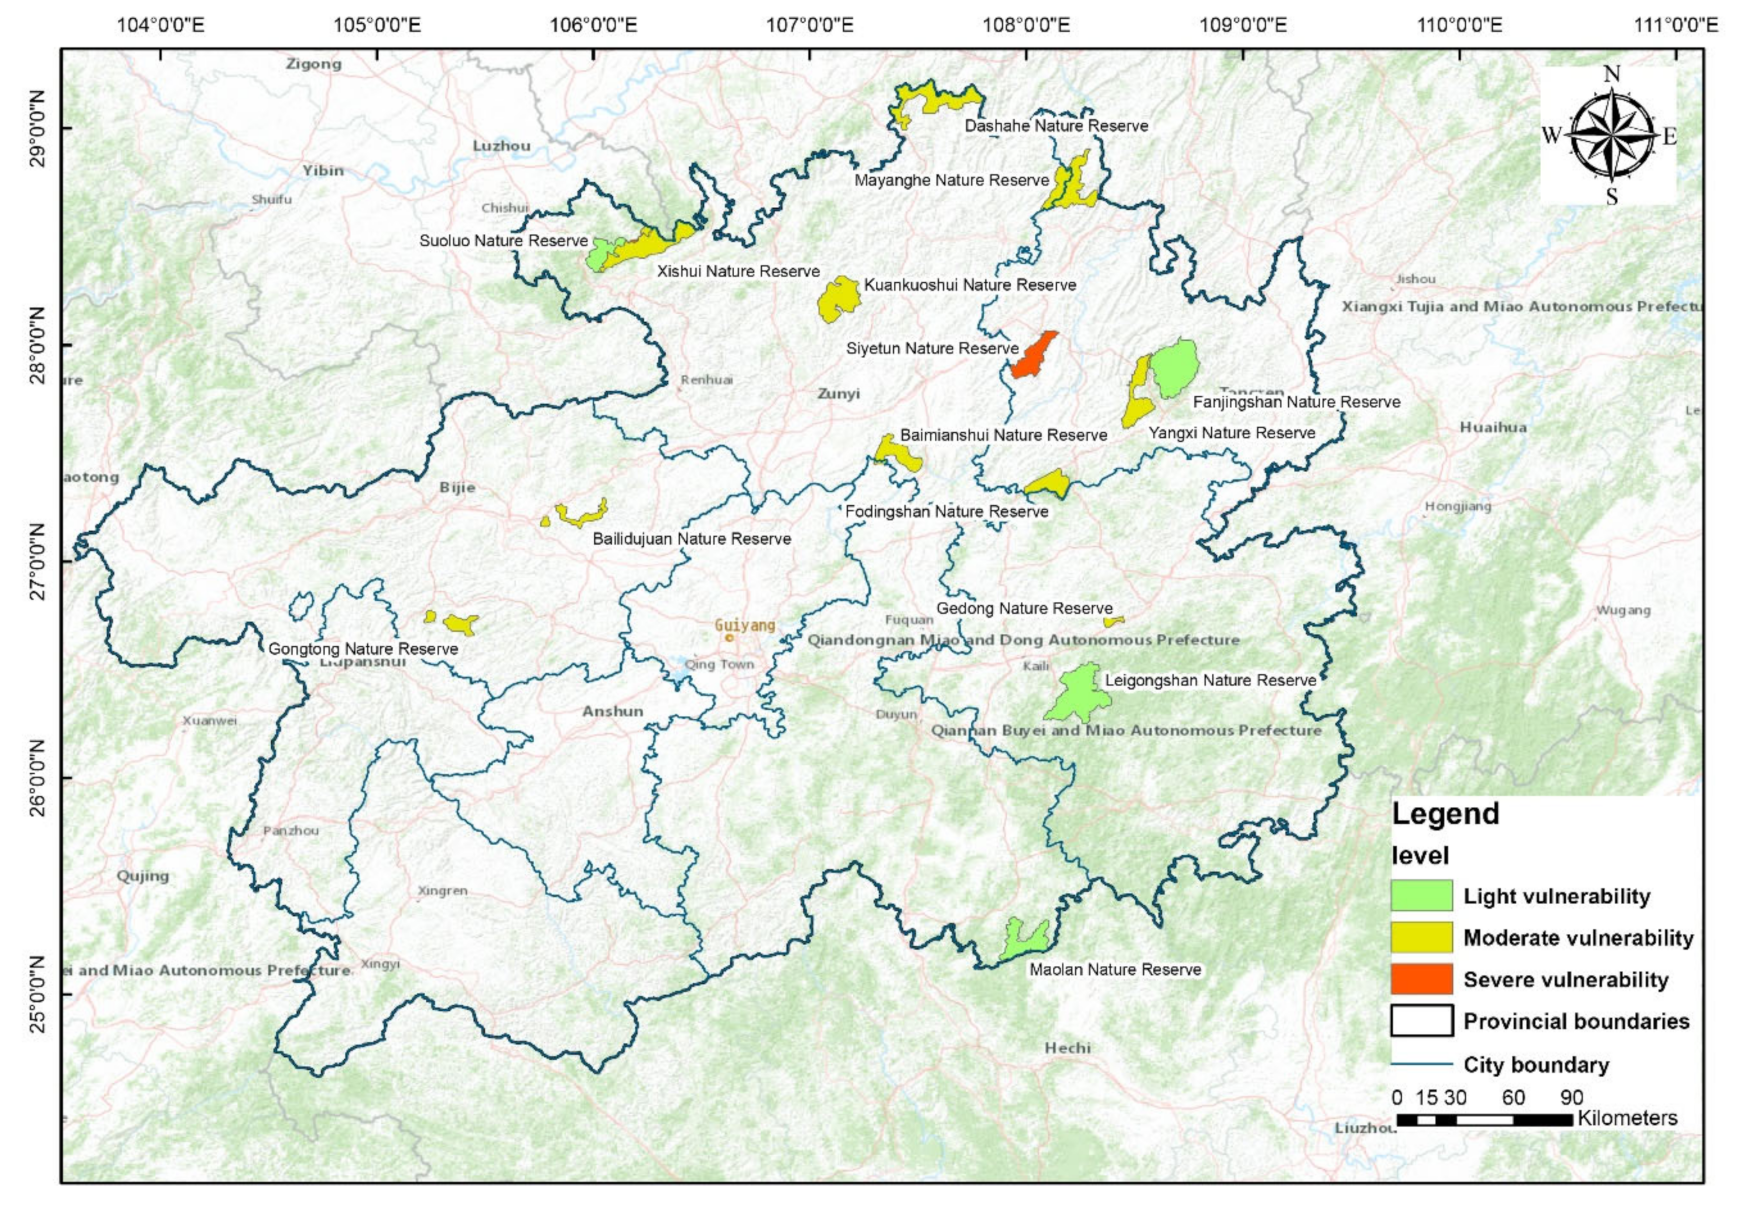
2.6. Classification of Vulnerability Index
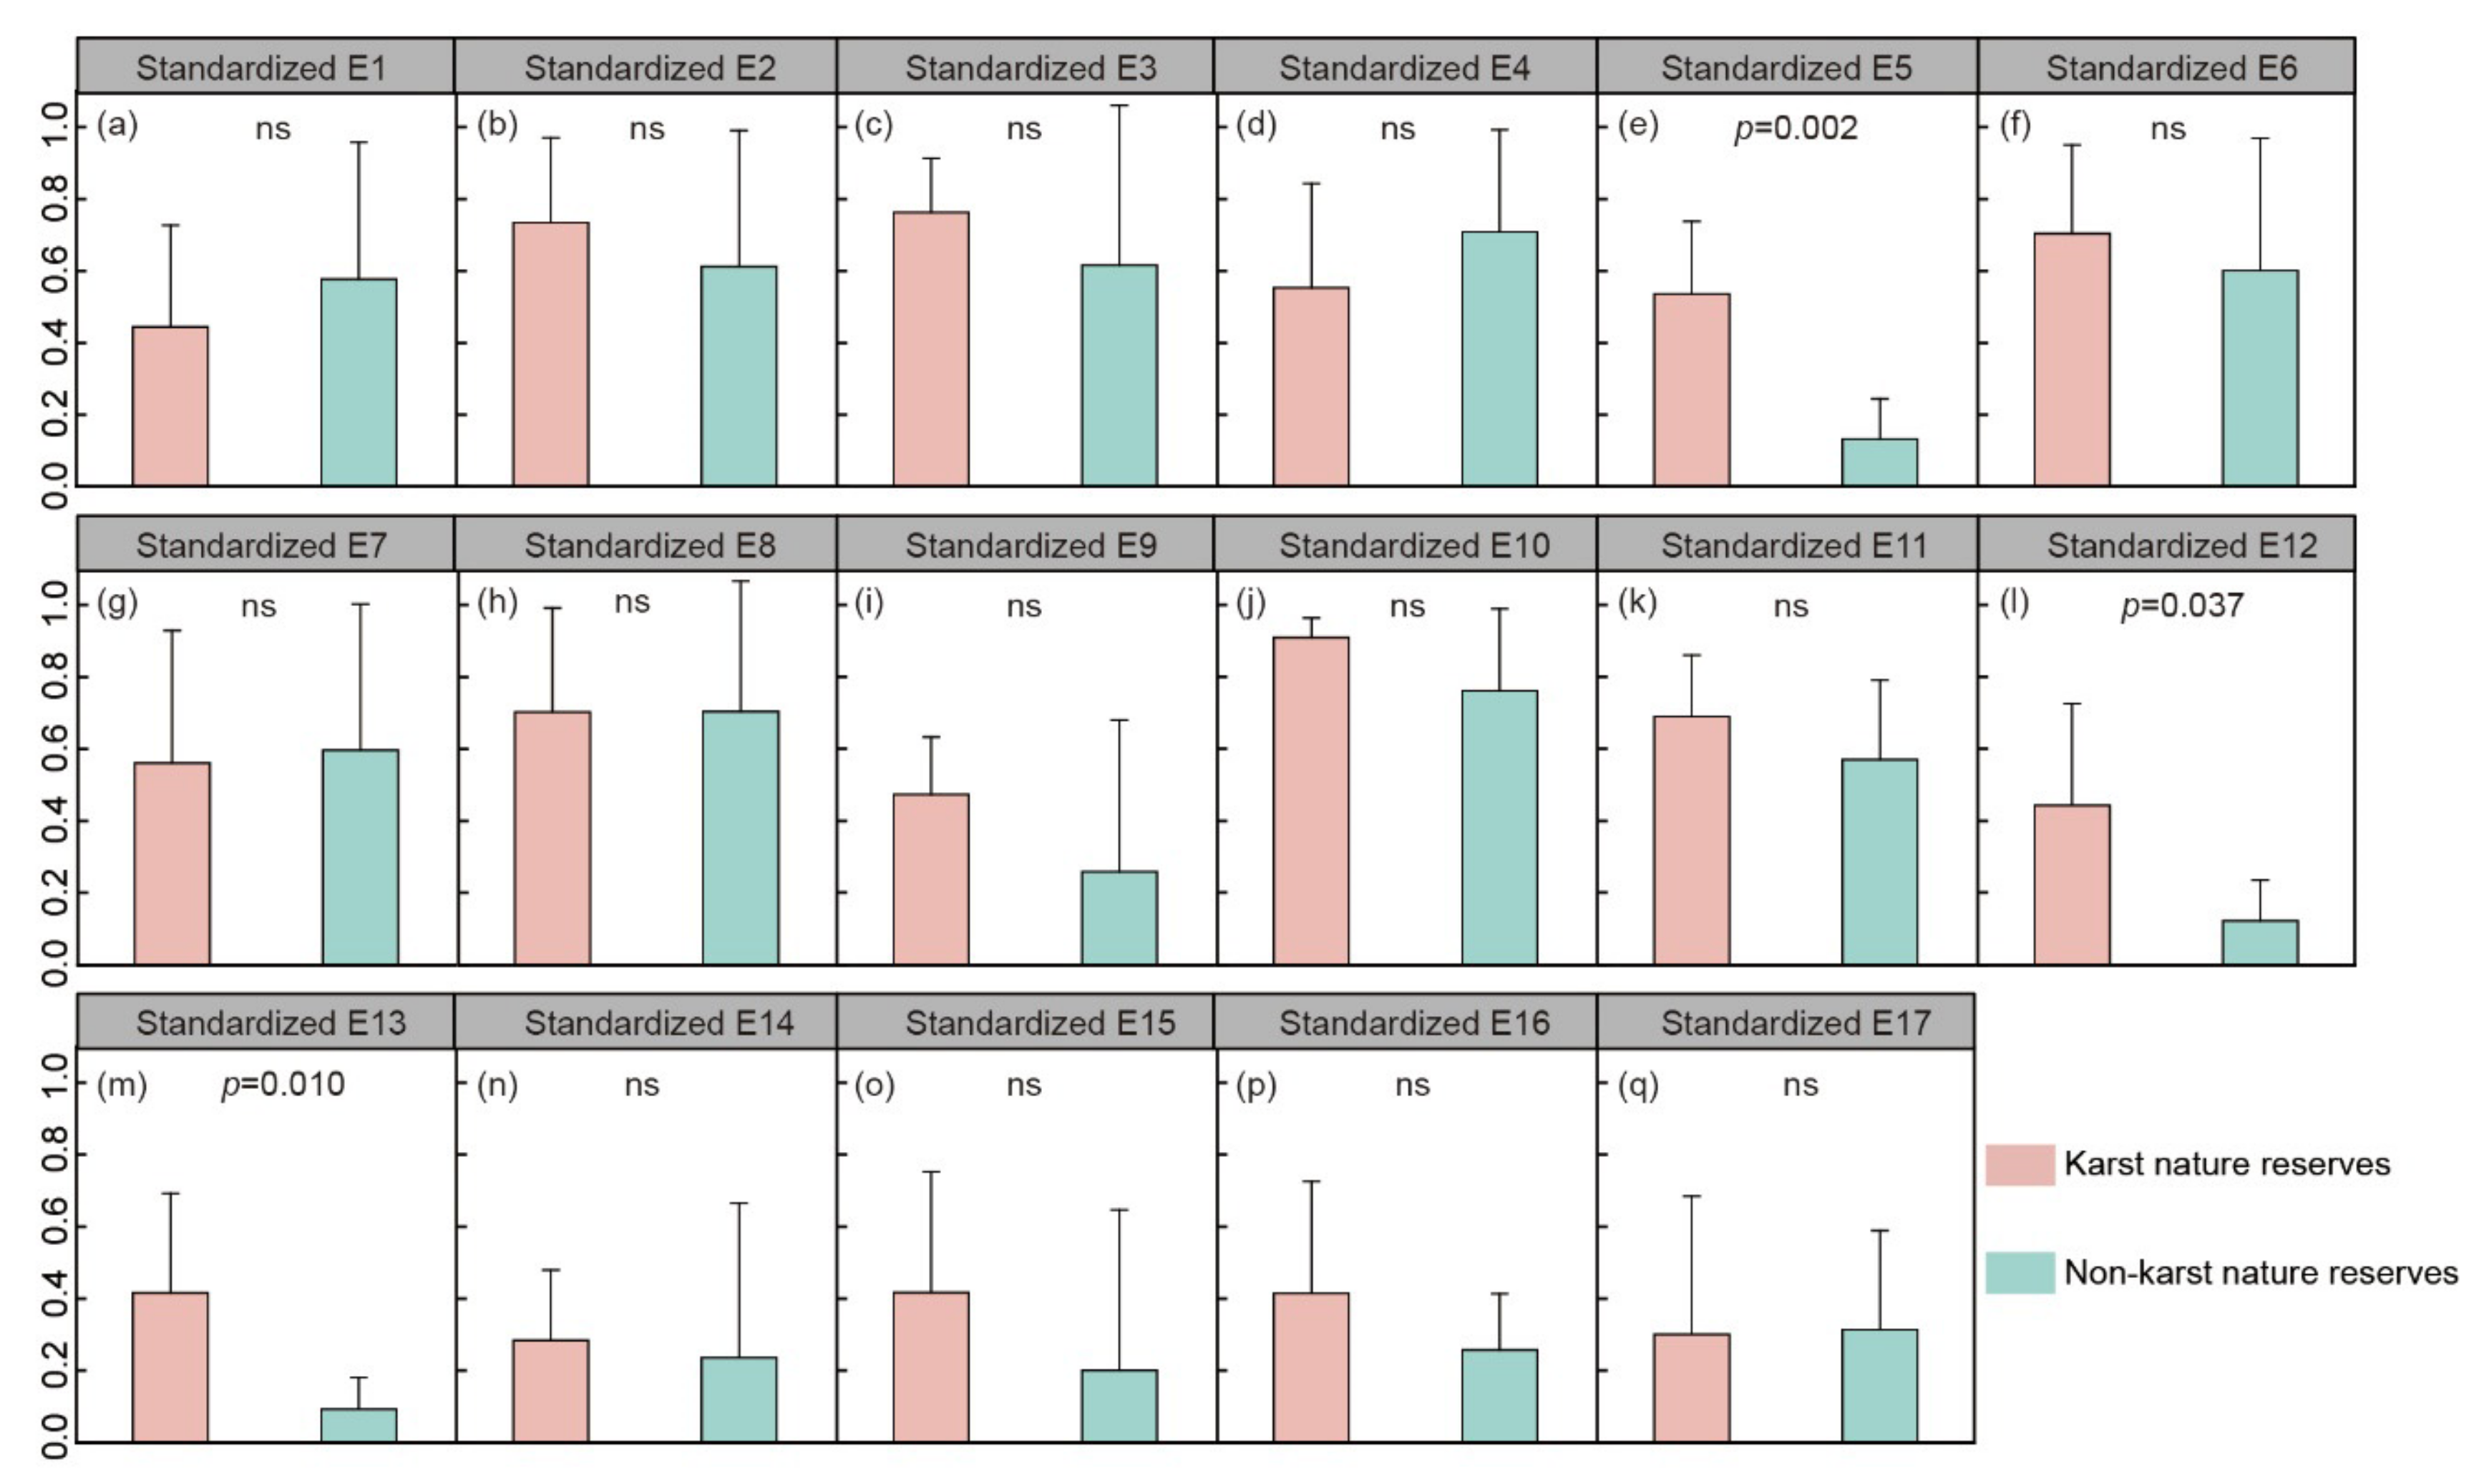
Based on the actual ecological conditions of national nature reserves and the results of previous studies [27,41], the vulnerability index of national nature reserves in Guizhou Province was classified into five categories: potential, light, moderate, severe, and extremely severe (Table 2).

3. Results

According to the classification standard of vulnerability (Table 2), the vulnerability evaluation results are shown in Table 3 and Figure 3. It can be seen that all the evaluation results of the 15 national nature reserves in Guizhou Province ranged from the level of light vulnerability to severe vulnerability (2–8), but none showed potential (0–2) or extremely severe vulnerability (8–10). One, eight, and one nature reserves among 10 karst nature reserves were classified into light, moderate, and severe vulnerability, respectively, while three and two nature reserves among five non-karst nature reserves were classified into light and moderate vulnerability. Generally, the vulnerability degree of karst nature reserves was higher than that of non-karst nature reserves.
The general vulnerability of national nature reserves in Guizhou Province, obtained from the average vulnerability index of 15 national nature reserves, was 4.60, showing moderate vulnerability (4–6). Meanwhile, the general vulnerability of karst nature reserves and non-karst nature reserves, obtained from the average vulnerability index of 10 karst nature reserves and five non-karst nature reserves, was 5.01 and 3.77, showing moderate vulnerability (4–6) and light vulnerability (2–4), respectively (Table 3 and Figure 3). The non-parametric test also confirmed that the vulnerability index of karst nature reserves was significantly higher than that of non-karst nature reserves (p < 0.05).
In order to find which parameters account for the significant difference in the vulnerability index between karst nature reserves and non-karst nature reserves, we also conducted a non-parametric test to compare each parameter between karst and non-karst nature reserves (SPSS 22.0, Chicago, IL, USA). The results showed that the contributions of average soil thickness, road length, and arable area to vulnerability in karst nature reserves were significantly higher than those in non-karst nature reserves (p < 0.05, Figure 4e,l,m).

4. Discussion

Our results indicated that the general vulnerability of national nature reserves in Guizhou Province was 4.60, showing moderate vulnerability (Table 3). This may be related to the ecological environments and socio-economic conditions of Guizhou Province. On the one hand, the exposed carbonate rock area in Guizhou Province is 109,084 km2, accounting for 61.9% of the total land area of the province. The large area of carbonate rocks combined with the warm-humid monsoon climate is conducive to the karst process and the formation of karst dual hydrogeological structures, which lay the foundation for the vulnerability of Guizhou Province [42,43]. Moreover, Guizhou Province is dominated by mountains and plateaus and is featured with rugged and broken land surfaces [44]. Under high-intensity rainfall during the rainy season, broken surfaces are prone to geological disasters such as landslides and debris flows, potentially increasing the vulnerability of Guizhou Province. On the other hand, anthropogenic activities such as mining, quarrying, and road development are directly correlated with the vulnerability of an ecosystem [45,46]. Due to the need for economic development, irrational and intensive anthropogenic activities against the background of vulnerable karst environments could trigger serious ecosystem degradation such as severe soil erosion, the extensive exposure of bedrock, drastic decline in soil productivity, and the appearance of a desert-like landscape (Figure 5) [47]. Overall, the vulnerability of national nature reserves in Guizhou Province may result from the combined effects of anthropogenic activities and the fragile karst environments. Harsh natural environments make the ecosystem potentially vulnerable, while anthropogenic disturbances transform the potential vulnerability into actual vulnerability [8].
We also found that the vulnerability index of karst nature reserves was significantly higher than that of non-karst nature reserves (Table 3). Furthermore, the general vulnerability of karst nature reserves showed moderate vulnerability, while that of non-karst nature reserves showed light vulnerability. The difference in soil thickness may result in a significant difference in the vulnerability between karst and non-karst nature reserves (Figure 2). Furthermore, the weight of soil thickness was highest among 17 parameters in the vulnerability evaluation framework (Table 1), which indicated the great impact of soil thickness on vulnerability. Carbonate rocks are characterized by high resistance to wind erosion, showing a slow soil formation rate [24,25]. The previous study has shown that the weathering rate of limestone was 23.7–110.7 mm/ka, and only 2.47 mm of weathered soil layer would be formed in 1000 years, which was 10–80 times slower than non-karst areas [48]. Considering the coexistence of surface soil erosion and special underground leakage in karst areas [49,50], the slow soil formation rate and the thin soil layer could lead to higher vulnerability of karst areas than that of non-karst areas. In addition to the difference in natural factors between karst and non-karst areas, differences in the intensity of anthropogenic activities may also trigger the higher vulnerability in karst areas. The vulnerability of an ecosystem is closely associated with anthropogenic activities such as cultivation and road development [45,46]. Thus, the greater arable area and the longer length of roads could increase the vulnerability in karst nature reserves.
Although the constructed vulnerability evaluation framework in this study helps us to compare the vulnerability between karst areas and non-karst areas, it is advisable to include more karst-specific variables such as caves and underground water to capture the attributes resulting in the difference in vulnerability between karst and non-karst areas. Therefore, evaluating the vulnerability of karst ecosystems by a karst-specific evaluation framework is our next step. In addition, despite the fact that studying the temporal heterogeneity of vulnerability is not the goal of the present study, evaluating vulnerability over time may be beneficial to deeply compare the vulnerability of karst and non-karst areas.

5. Conclusions

The vulnerability evaluation of ecosystems provides important information for ecological conservation and environmental management. In this study, we integrated climate factors, soil and vegetation factors, and social factors within a vulnerability evaluation framework that combined the analytical hierarchy process (AHP) technique to evaluate and compare the ecological environments of karst nature reserves and non-karst nature reserves in Guizhou Province, China. In general, the vulnerability of national nature reserves in Guizhou Province was 4.60, showing moderate vulnerability. Moreover, the vulnerability index of karst nature reserves was significantly higher than that of non-karst nature reserves (p < 0.05). Average soil thickness, arable area, and the length of roads may be the factors driving the significant difference in the vulnerability between karst and non-karst nature reserves. This study is of great significance for the ecological and environmental protection of the karst ecosystems in southwest China.

Supplementary Materials

The following are available online at https://0-www-mdpi-com.brum.beds.ac.uk/2071-1050/13/5/2442/s1, Supplementary Information: a description of the peculiarities of each nature reserve.

Author Contributions

Conceptualization, Y.C. and K.X.; Methodology, Y.C.; Validation, Y.C., X.R. and C.C.; Data Curation, Y.C. and C.C. All authors have read and agreed to the published version of the manuscript.

Funding

This research was funded by the Key Science and Technology Program of Guizhou Province, Grant No. 5411 2017 Qiankehe Pingtai Rencai; the National Key Research and Development Program of China, Grant No. 2016YFC0502607; and the World Top Discipline Program of Guizhou Province, Grant No.125 2019 Qianjiao Keyan Fa.

Institutional Review Board Statement

Not applicable.

Informed Consent Statement

Not applicable.

Data Availability Statement

The data presented in this study are available on request from the corresponding author.

Conflicts of Interest

The authors declare no conflict of interest.

References

  1. Blanco, V.; Brown, C.; Holzhauer, S.; Vulturius, G.; Rounsevell, M.D.A. The Importance of Socio-ecological System Dynamics in Understanding Adaptation to Global Change in the Forestry Sector. J. Environ. Manag. 2017, 196, 36–47. [Google Scholar] [CrossRef] [Green Version]
  2. Chala, D.; Roos, C.; Svenning, J.C.; Zinner, D. Species-specific Effects of Climate Change on the Distribution of Suitable Baboon Habitats—Ecological Niche Modeling of Current and Last Glacial Maximum Conditions. J. Hum. Evol. 2019, 132, 215–226. [Google Scholar] [CrossRef] [PubMed]
  3. Jin, X.; Jin, Y.; Mao, X. Ecological Risk Assessment of Cities on the Tibetan Plateau Based on Land Use/Land Cover Changes—Case Study of Delingha City. Ecol. Indic. 2019, 101, 185–191. [Google Scholar] [CrossRef]
  4. Sahoo, S.; Dhar, A.; Kar, A. Environmental Vulnerability Assessment Using Grey Analytic Hierarchy Process Based Model. Environ. Impact Assess. Rev. 2016, 56, 145–154. [Google Scholar] [CrossRef]
  5. Zhao, J.; Ji, G.; Tian, Y.; Chen, Y.; Wang, Z. Environmental Vulnerability Assessment for Mainland China Based on Entropy Method. Ecol. Indic. 2018, 91, 410–422. [Google Scholar] [CrossRef]
  6. Xue, L.; Wang, J.; Zhang, L.; Wei, G.; Zhu, B. Spatiotemporal Analysis of Ecological Vulnerability and Management in the Tarim River Basin, China. Sci. Total Environ. 2019, 649, 876–888. [Google Scholar] [CrossRef]
  7. Hong, W.; Jiang, R.; Yang, C.; Zhang, F.; Su, M.; Liao, Q. Establishing an Ecological Vulnerability Assessment Indicator System for Spatial Recognition and Management of Ecologically Vulnerable Areas in Highly Urbanized Regions: A Case Study of Shenzhen, China. Ecol. Indic. 2016, 69, 540–547. [Google Scholar] [CrossRef]
  8. Ding, Q.; Shi, X.; Zhuang, D.; Wang, Y. Temporal and Spatial Distributions of Ecological Vulnerability under the Influence of Natural and Anthropogenic Factors in an Eco-Province under Construction in China. Sustainability 2018, 10, 3087. [Google Scholar] [CrossRef] [Green Version]
  9. Liu, Q.; Yang, Z.; Han, F.; Shi, H.; Wang, Z.; Chen, X. Ecological Environment Assessment in World Natural Heritage Site Based on Remote-Sensing Data. A Case Study from the Bayinbuluke. Sustainability 2019, 11, 6385. [Google Scholar] [CrossRef] [Green Version]
  10. Williams, L.R.R.; Kapustka, L.A. Ecosystem Vulnerability: A Complex Interface with Technical Components. Environ. Technol. Chem. 2000, 19, 1055–1058. [Google Scholar]
  11. Beroya-Eitner, M.A. Ecological Vulnerability Indicators. Ecol. Indic. 2016, 60, 329–334. [Google Scholar] [CrossRef]
  12. Anthony, K.R.N.; Kenneth, R.N.; Marshall, P.A.; Abdulla, A. Operationalizing Resilience for Adaptive Coral Reef Management under Global Environmental Change. Glob. Chang. Biol. 2015, 21, 48–61. [Google Scholar] [CrossRef]
  13. Guizien, K.; Belharet, M.; Moritz, C.; Guarini, J.M. Vulnerability of Marine Benthic Metapopulations: Implications of Spatially Structured Connectivity for Conservation Practice in the Gulf of Lions Kulkarni (NW Mediterranean Sea). Divers. Distrib. 2014, 20, 1392–1402. [Google Scholar] [CrossRef]
  14. Alric, B.; Jenny, J.P.; Berthon, V.; Arnaud, F.; Pignol, C.; Reyss, J.L.; Sabatier, P.; Perga, M.E. Local Forcings Affect Lake Zooplankton Vulnerability and Response to Climate Warming. Ecology 2013, 94, 2767–2780. [Google Scholar] [CrossRef] [Green Version]
  15. Hwang, T.; Band, L.E.; Miniat, C.F.; Song, C.H.; Bolstad, P.V.; Vose, J.M.; Love, J.P. Divergent Phenological Response to Hydroclimate Variability in Forested Mountain Watersheds. Glob. Chang. Biol. 2014, 20, 2580–2595. [Google Scholar] [CrossRef] [PubMed]
  16. Lopez-Poma, R.; Orr, B.J.; Bautista, S. Successional Stage after Land Abandonment Modulates Fire Severity and Post-fire Recovery in a Mediterranean Mountain Landscape. Int. J. Wildland Fire 2014, 23, 1005–1015. [Google Scholar] [CrossRef]
  17. Munson, S.M.; Webb, R.H.; Housman, D.C.; Veblen, K.E.; Nussear, K.E.; Beever, E.A.; Hartney, K.B.; Miriti, M.N.; Phillips, S.L.; Fulton, R.E.; et al. Long-term Plant Responses to Climate Are Moderated by Biophysical Attributes in a North American Desert. J. Ecol. 2015, 103, 657–668. [Google Scholar] [CrossRef]
  18. Couto, R.D.; dos-Santos, M.; Comin, J.J.; Martini, L.C.P.; Gatiboni, L.C.; Martins, S.R.; Belli, P.; Brunetto, G. Environmental Vulnerability and Phosphorus Fractions of Areas with Pig Slurry Applied to the Soil. J. Environ. Qual. 2015, 44, 162–173. [Google Scholar] [CrossRef]
  19. Peng, B.; Huang, Q.; Elahi, E.; Wei, G. Ecological Environment Vulnerability and Driving Force of Yangtze River Urban Agglomeration. Sustainability 2019, 11, 6623. [Google Scholar] [CrossRef] [Green Version]
  20. Guo, B.; Zang, W.; Luo, W. Spatial-temporal Shifts of Ecological Vulnerability of Karst Mountain Ecosystem-impacts of Global Change and Anthropogenic Interference. Sci. Total Environ. 2020, 741, 140256. [Google Scholar] [CrossRef] [PubMed]
  21. Yuan, D.X. Karst of China; Geological Publishing House: Beijing, China, 1991. [Google Scholar]
  22. Gombert, P. Role of Karstic Dissolution in Global Carbon Cycle. Glob. Planet. Chang. 2002, 33, 177–184. [Google Scholar] [CrossRef]
  23. Chen, Y.; Lian, B.; Yin, Z.; Tang, Y. Weathering of Carbonate Rocks by Biological Soil Crusts in Karst Areas. J. Earth Sci. 2014, 25, 662–667. [Google Scholar] [CrossRef]
  24. Moore, O.W.; Buss, H.L.; Green, S.M.; Man, L.; Song, Z. The Importance of Non-carbonate Mineral Weathering as a Soil Formation Mechanism within a Karst Weathering Profile in the SPECTRA Critical Zone Observatory, Guizhou Province, China. Acta Geochim. 2017, 36, 566–571. [Google Scholar] [CrossRef] [Green Version]
  25. Long, D.; Shen, Y.; Sun, A.; Hong, Y.; Longuevergne, L.; Yang, Y.; Li, B.; Chen, L. Drought and Flood Monitoring for a Large Karst Plateau in Southwest China Using Extended GRACE Data. Remote Sens. Environ. 2014, 155, 145–160. [Google Scholar] [CrossRef]
  26. Gan, L.; Chen, G.C.; Wan, G.J. Problems and Exploitation Countermeasures of Water Resources in Agricultural Development in Karst Region of Guizhou. Res. Agric. Mod. 2001, 22, 87–90. [Google Scholar]
  27. Li, H.; Jing, S.; Yang, Z. Ecological Vulnerability Assessment for Ecological Conservation and Environmental Management. J. Environ. Manag. 2018, 206, 1115–1125. [Google Scholar]
  28. Shao, H.; Sun, X.; Tao, S.; Xiang, Z.; Wei, X. Environmental vulnerability assessment in middle-upper reaches of Dadu River Watershed using Projection Pursuit Model and GIS. Carpathian J. Earth Environ. Sci. 2015, 10, 143–146. [Google Scholar]
  29. Nguyen, A.K.; Liou, Y.; Li, M.; Tran, T.N. Zoning Eco-environmental Vulnerability for Environmental Management and Protection. Ecol. Indic. 2016, 69, 100–117. [Google Scholar] [CrossRef]
  30. Chirico, G.B.; Borga, M.; Tarolli, P.; Rigon, R.; Preti, F. Role of Vegetation on Slope Stability under Transient Unsaturated Conditions. Procedia Environ. Sci. 2013, 19, 932–941. [Google Scholar] [CrossRef]
  31. Puigdefábregas, J. The Role of Vegetation Patterns in Structuring Runoff and Sediment Fluxes in Drylands. Earth Surf. Process. Landf. 2010, 30, 133–147. [Google Scholar] [CrossRef]
  32. Huang, Y.; Chen, Y.; Castro-Izaguirre, N.; Barufflo, M.; Brezzi, M. Impacts of Species Richness on Productivity in a Large-scale Subtropical Forest Experiment. Science 2018, 362, 80–83. [Google Scholar] [CrossRef] [Green Version]
  33. Pejchar, L.; Mooney, H.A. Invasive Species, Ecosystem Services and Human Well-being. Trends Ecol. Evol. 2009, 24, 497–504. [Google Scholar] [CrossRef]
  34. Zhao, Y.X.; Liu, X.; Qin, Y.J.; Xu, Q.H. LUCC and Its Impact on Vulnerability of Agro-pastoral Areas in Hebei Province. Res. Soil Water Conserv. 2011, 18, 205–211. [Google Scholar]
  35. Liu, Q.; Yang, Z.; Shi, H.; Wang, Z. Ecological Risk Assessment of Geohazards in Natural World Heritage Sites: An Empirical Analysis of Bogda, Tianshan. Open Geosci. 2019, 11, 327–340. [Google Scholar] [CrossRef] [Green Version]
  36. Hou, K.; Li, X.; Wang, J.; Zhang, J. Evaluating Ecological Vulnerability Using the GIS and Analytic Hierarchy Process (AHP) Method in Yan’an, China. Pol. J. Environ. Stud. 2016, 25, 599–605. [Google Scholar]
  37. Topuz, E.; van Gestel, C.A.M. An Approach for Environmental Risk Assessment of Engineered Nanomaterials Using Analytical Hierarchy Process (AHP) and Fuzzy Inference Rules. Environ. Int. 2016, 92–93, 334–347. [Google Scholar] [CrossRef]
  38. Liou, Y.A.; Nguyen, A.K.; Li, M.H. Assessing Spatiotemporal Eco-environmental Vulnerability by Landsat Data. Ecol. Indic. 2017, 80, 52–65. [Google Scholar] [CrossRef] [Green Version]
  39. Cai, L.; Yan, L.; Ni, J.; Wang, C. Assessment of Ecological Vulnerability under Oil Spill Stress. Sustainability 2015, 7, 13073–13084. [Google Scholar] [CrossRef] [Green Version]
  40. Wang, H.; Song, C.; Song, K. Regional Ecological Risk Assessment of Wetlands in the Sanjiang Plain with Respect to Human Disturbance. Sustainability 2020, 12, 1974. [Google Scholar] [CrossRef] [Green Version]
  41. Liu, G.; Wang, J.L.; Li, S.H.; Li, J.; Duan, P. Dynamic Evaluation of Ecological Vulnerability in A Lake Watershed Based on RS and GIS Technology. Pol. J. Environ. Stud. 2018, 28, 1785–1798. [Google Scholar] [CrossRef]
  42. De Waele, J.; Plan, L.; Audra, P. Recent Developments in Surface and Subsurface Karst Geomorphology: An Introduction. Geomorphology 2009, 106, 1–8. [Google Scholar] [CrossRef]
  43. Peng, X.D.; Dai, Q.H.; Ding, G.J.; Shi, D.M.; Li, C.L. The Role of Soil Water Retention Functions of Near-surface Fissures with Different Vegetation Types in A Rocky Desertification Area. Plant Soil 2019, 441, 587–599. [Google Scholar] [CrossRef]
  44. Wang, S.J.; Li, R.L.; Sun, C.X.; Zhang, D.F.; Li, F.Q.; Zhou, D.Q.; Xiong, K.N.; Zhou, Z.F. How Types of Carbonate Rock Assemblages Constrain the Distribution of Karst Rocky Desertified Land in Guizhou Province, PR China. Land Degrad. Dev. 2004, 15, 123–131. [Google Scholar] [CrossRef]
  45. Hill, A.R. Ecosystem Stability in Relation to Stresses Caused by Human Activities. Can. Geogr. 2010, 19, 206–220. [Google Scholar] [CrossRef]
  46. Lu, D.; Yu, H.L.; Yu, G.M. Assessing the Land Use Change and Ecological Security Based on RS and GIS: A Case Study of Pingdingshan City, China. Adv. Mater. Res. 2014, 905, 329–333. [Google Scholar] [CrossRef]
  47. Wang, S.; Liu, Q.; Zhang, D.F. Karst Rocky Desertification in Southwestern China: Geomorphology, Landuse, Impact and Rehabilitation. Land Degrad. Dev. 2004, 15, 115–121. [Google Scholar] [CrossRef]
  48. Yuan, D.X.; Cai, G.H. Karst Environics; Chongqing Press: Chongqing, China, 1988. [Google Scholar]
  49. Dai, Q.; Peng, X.; Wang, P.; Li, C.; Shao, H. Surface erosion and underground leakage of yellow soil on slopes in karst regions of southwest China. Land Degrad. Dev. 2018, 29, 2438–2448. [Google Scholar] [CrossRef]
  50. Yan, Y.; Dai, Q.; Yuan, Y.; Peng, X.; Zhao, L.; Yang, J. Effects of rainfall intensity on runoff and sediment yields on bare slopes in a karst area, SW China. Geoderma 2018, 330, 30–40. [Google Scholar] [CrossRef]
Figure 1. Distribution of nature reserves in Guizhou Province (a), the landscape of karst peak-cluster depression (b) and karst gorge (c).
Sustainability 13 02442 g001
Figure 2. Schematic diagram of vulnerability evaluation framework.
Sustainability 13 02442 g002
Figure 3. Distribution of vulnerability degree of nature reserves in Guizhou Province.
Sustainability 13 02442 g003
Figure 4. Comparison of the 17 parameters between karst and non-karst nature reserves. E1–E17 represent average annual temperature, average annual precipitation, annual frost-free period, runoff depth, average soil thickness, organic matter, total nitrogen, total phosphorus, forest coverage rate, the number of wild plant species, the number of invasive species, the length of roads, arable area, population density, the number of lands discarded by factories and mines, the number of geological disaster sites, and the number of reservoirs, respectively. p < 0.05 is considered as a statistical difference (Mann–Whitney U test); ns: not significant.
Sustainability 13 02442 g004
Figure 5. Landscapes of karst rocky desertification. Subfigures (ad) show the karst ecosystem degradation in the form of severe soil erosion, the extensive exposure of bedrock, drastic decline in soil productivity, and the appearance of a desert-like landscape.
Sustainability 13 02442 g005
Table 1. Weights of groups and attribute parameters.
ObjectGroups (Gi)Global Weight (Wi)Parameters (Ei)Local Weight (Wi)Data Sources
VulnerabilityG1: climate
factors
0.2019E1: average annual temperature0.0777Guizhou Meteorological Bureau
E2: average annual precipitation0.0411
E3: annual frost-free period0.0357
E4: runoff depth0.0474GIS spatial overlay analysis
G2: soil and vegetation
factors
0.5062E5: average soil thickness0.10352019 Guizhou Nature Reserve Survey and Evaluation Project Team
E6: organic matter0.0730
E7: total nitrogen0.0387
E8: total phosphorus0.0472
E9: forest coverage rate0.0993Management agency of nature reserve
E10: the number of wild plant species0.0687
E11: the number of invasive species0.0758
G3: social
factors
0.2919E12: the length of roads0.0440Overall planning of nature reserve
E13: arable area0.0478
E14: population density0.0344
E15: the number of lands discarded by factories and mines0.0728GIS spatial overlay analysis
E16: the number of geological disaster sites0.0402
E17: the number of reservoirs0.0527
Table 2. Classification standards of vulnerability.
Vulnerability ClassesDescriptionNormalized Score Interval
1Potential vulnerability0.0–2.0
2Light vulnerability2.0–4.0
3Moderate vulnerability4.0–6.0
4Severe vulnerability6.0–8.0
5Extremely severe vulnerability8.0–10.0
Table 3. Vulnerability index between karst and non-karst nature reserves in Guizhou Province.
NameVulnerability IndexVulnerability DegreeNameVulnerability IndexVulnerability Degree
Karst nature reservesNon-karst nature reserves
Maolan3.43LightFanjingshan2.74Light
Kuankuoshui4.15ModerateLeigongshan3.58Light
Fodingshan4.43ModerateSuoluo3.83Light
Gongtong4.62ModerateGedong4.12Moderate
Dashahe4.76ModerateXishui4.57Moderate
Yangxi5.34Moderate
Mayanghe5.44Moderate
Bailidujuan5.69Moderate
Baimianshui5.76Moderate
Siyetun6.51Severe
Publisher’s Note: MDPI stays neutral with regard to jurisdictional claims in published maps and institutional affiliations.

