Article

A Study on the Practical Pressure-Driven Hydraulic Analysis Method Considering Actual Water Supply Characteristics of Water Distribution Network

1
School of Civil, Environmental and Architectural Engineering, Korea University, Seoul 02841, Korea
2
Department of Civil and Environmental Engineering, The University of Suwon, Gyeonggi-do 18323, Korea
*
Author to whom correspondence should be addressed.
Sustainability 2021, 13(5), 2793; https://0-doi-org.brum.beds.ac.uk/10.3390/su13052793
Submission received: 28 January 2021 / Revised: 22 February 2021 / Accepted: 1 March 2021 / Published: 5 March 2021
(This article belongs to the Special Issue Safety in the Operation of Water Supply Systems)

Abstract

:
For reliable pressure-driven analysis (PDA) results, it is necessary to reasonably determine an objective head-outflow relationship (HOR) and the required head for each node. So far, no methodology has been proposed to objectively determine two factors based on data of real block. In this study, the HOR was defined using the water supply method, residential environment, and water consumption data within real blocks. The standard minimum residual pressure criteria were reviewed to quickly and rationally determine the required head for each node. To validate the proposed methodology, the HOR and required head application conditions were configured for different scenarios; the available flow rate of nodes and the water supply capacity of the entire block were evaluated based on PDA results. Through the results for each scenario, the HOR definition method was able to provide a reasonable result reflecting the actual block’s conditions, unlike the conventional orifice-type HOR, and the standard minimum residual pressure criteria as the required head was evaluated to be more efficient than the conventional time-consuming method. The HOR uncertainty and the lack of rationality in the selection of the required heads affected the reliability of PDA results; these problems can be solved using the proposed methodology.

1. Introduction

The hydraulic analysis method of the water distribution network can be largely divided into pressure-driven analysis (PDA) and demand-driven analysis (DDA). The PDA can simulate the available flow rate depending on nodal pressure in the water distribution network, and it can be used to analyze abnormal conditions, such as pipe failure, leakage, and unexpected increases in water usage. On the other hand, DDA has limitations in hydraulic analysis for the abnormal conditions due to the assumption that the base-demand of nodes is always satisfied regardless of the node pressure condition. For implementing PDA, a head-outflow relationship (HOR), which can determine the available supply flow rate, depending on the pressure (head) at the node, needs to be defined first. As the difference in PDA results can be significant depending on the defined HOR, this is a crucial step when implementing PDA; it is necessary to select the HOR that best reflects the characteristics of each node in the target block.
Many previous studies have focused on defining the HOR for water distribution networks [1,2,3,4,5,6,7,8,9,10,11,12,13,14,15,16,17,18,19,20]. In these studies, the HOR of a water distribution network was defined based on conceptual, experimental, and hydraulic perspectives. Generally, the HOR proposed by Wager et al. [2], which can reproduce the hydraulic characteristics of an orifice, is used. The HOR proposed by Wager et al. [2] is adequate for simulating the characteristics of the flow rate supply according to the pressure at individual water supply devices, such as faucets and fire hydrants; however, it cannot be defined as the representative HOR of a specific block. This is because different supply methods (indirect or direct water supply) are adopted in each building. As the area considered in the pressure-driven analysis increases, it becomes more important to define a representative HOR for each block.
Recently, Chang et al. [20] proposed a methodology that could define the representative HOR for a block; this method accounted for the differences in the supply methods for each building. The representative HOR of a block, as defined by Chang et al. [20], was based on the fact that the available flow rate supply may vary, owing to the difference in the supply methods (indirect or direct water supply) of each space wherein consumers reside, even if the pressure remains the same. The HOR is defined according to the water supply method, residential environment (including factors such as the number of floors in residential buildings, topography, and water supply conditions inside buildings), and actual water consumption. The main difference between this method and the methodology proposed by Ciaponi et al. [17] is that the former accounts for the water supply method adopted in each building when defining the representative HOR. A conventional high-rise building with five or more floors generally has an underground water tank installed, which provides water for all the floors with the help of a pressure-controllable pump.
When determining whether water can be supplied to a building through indirect water supply, it is more important to consider the required threshold pressure (head) for supplying water to the water tank than the number of floors in the building. A low-rise building with less than five floors generally uses the direct water supply method, whereby the external water pipe is directly connected to the water distribution network in the building, without requiring a water tank. Thus, the pressure in the external water pipe is the primary factor determining whether water can be supplied to each household. An objective and rational representative HOR that accounts for the characteristics of blocks can only be realized when the abovementioned differences in the water supply methods are reflected in the process of defining the HOR.
When implementing PDA, it is also important to rationally determine the required head for each node. There are two methods for determining the required head: (1) applying the standard minimum residual pressure criteria of a block based on the number of floors in the building and (2) applying the minimum required head condition of the most hydraulically unfavorable consumer for each node by incorporating actual consumer data. When preparing the input data for water distribution network analysis, the number of consumers included in each node is typically 10 households (buildings) or more, in the case of a small block; the number of households increases as the size of the block increases. Hence, from a practical perspective, it is difficult to confirm the required head by checking the residential environments of all consumers at each node. Based on the maximum number of floors in a building adopting direct water supply, the method of applying the standard minimum residual pressure as the representative required head of the block, as proposed by the Korea Ministry of Environment (MOE) [21], is the most realistic strategy available.
In this study, two demonstration blocks in Y city, Korea, were selected as test beds. These two blocks contain similar building types, but the ratio of the water consumption in high-rise buildings with indirect water supply to the total water consumption in each block is different. To verify the validity of the proposed methodology, the conventional orifice-type HOR, proposed by Wagner et al. [2], and the method of considering the minimum required head condition for each node as the required head by virtue of consumer information were set as the control group. Furthermore, the method by which the representative standard minimum residual pressure of the block is determined as the required head in the HOR, as proposed by Wagner et al. [2], and the method of considering the representative HOR of the block and the representative standard minimum residual pressure as the required head were set as the active group. PDA was implemented on the two demonstration blocks to evaluate the flow rate supply characteristics of the node for each head and the entire water supply capacity of the blocks under the condition of low head formation, i.e., less than the required head.
Until now, many studies have been conducted on the uncertainty of the PDA result due to the HOR selection and parameter difference proposed through conceptual or experimentation [9,15,18,19]. However, as in this study, there was no study that applied the HOR that was defined in consideration of the proportion of the water supply method for each block based on the actual block data and applied the required head confirmed through field investigation to PDA. The advantage of this study is that it is possible to determine the most reasonable design factor application conditions through the PDA results of various conditions by quantitatively deriving the defined HOR and the required head based on actual water supply operation data, not the virtual data.
Thus far, significant reliability problems have affected the results of PDA, such as a lack of objectivity in selecting the required head and HOR, and these have also been highlighted in practical works. However, it is believed that the uncertainty in the HOR and the reliability problems associated with the analysis results can be improved through the results of this study.

2. Methodology

2.1. Definition of Representative HOR of a Block

There can be various residential environments in each block within the water supply area. The number of floors varies from detached houses to high-rise buildings, and the water consumption also varies depending on the type of building (such as residential, commercial, or business). In addition, differences exist in the water supply conditions and aging of internal water pipes, depending on the location and deterioration of buildings within the block. Such conditions are ultimately related to differences not only in the required head for each consumer in each building but also in the base demand.
Chang et al. [20] concluded that the water supply methods in most high-rise buildings consist of an indirect supply using a water tank, with the water supply being available only if the head in the external water pipe exceeds the threshold head ( H j t h r e s h o l d ) of the building’s water tank. In contrast, it was concluded that, for low-rise buildings with less than five floors, the direct water supply method is generally used, and that the water supply characteristics differ depending on the required head, which is calculated according to the location of each floor’s water supply system. Figure 1 presents a conceptual diagram from Chang et al. [20] that displays the differences in the water supply method for each building. In a block where various residential conditions coexist, considering the water tank as a node for operating the water tank and internal water supply system, as in the case of high-rise buildings, and considering the individual floors as nodes, as in the case of low-rise buildings (where direct water supply is used), a hydraulic perspective that is geared toward applying a practical method for water supply is obtained. This takes into account the physical differences between buildings with different water supply methods. The HOR of each node can be defined as shown in Table 1.
The parameters for defining the representative HOR of a specific block, such that the water supply method and the type of building are considered, are the number of floors in the building ( n f ), difference in height from the location where the external water distribution network is buried to the ground floor ( Z g ), headloss in proportion to building deterioration ( Δ H i n d ), and base demand for the building. In this study, low-rise and high-rise buildings were differentiated based on the presence of five stories. However, as the design of the water supply method for each building varies according to the minimum pressure required for the supply operation of the water service provider in each region, it is necessary to establish an appropriate standard for the number of floors in the building through prior investigations. Because the base demand for each building varies depending on the space utilization conditions (residential, commercial, and complex) of each building, it is necessary to check the ratio of water consumption for each building with different numbers of floors through the use of actual water consumption data; it would be rational to determine the difference in topographic height ( Z g ) and headloss ( Δ H i n d ) by estimating an appropriate range that considers the site conditions. Detailed conditions for defining the representative HOR proposed by Chang et al. [20] are listed in Table 2.
As shown in Figure 2, Chang et al. [20] defined the representative HOR for two demonstration blocks with almost the same composition of building types but with different water consumption ratios for high-rise buildings throughout the block. These two equations show the difference in the available flow rate supply for the section with low head formation. This difference is attributed to the ratio of water consumption in buildings with different water supply methods to the total water consumption of the block. In this regard, the representative HOR should be defined differently for each block in the actual water supply area considered, accounting for the characteristics of the dominant water supply method and the differences in water consumption.

2.2. Determining Representative Required Head of a Block

To improve the reliability of PDA results, it is important to determine the required head such that the physical conditions of each node are considered, in addition to adopting an HOR definition that best represents the characteristics of the target block. To improve the accuracy in determining the required head, it is necessary to assess each item of consumer information in advance. For example, if one node in the analysis input file actually contains 15 consumers, then the water supply conditions (indirect or direct water supply) of each consumer should be distinguished first. If a mixed water supply method is used, then the head condition of the most hydraulically unfavorable consumer under direct water supply should be selected as the required head. Implementing such tasks for all the nodes during PDA in the field requires considerable time and manpower; the larger the size of the block requiring water distribution network analysis, the more difficult is the practical investigation. To improve the practical application of PDA, it is necessary to quickly and rationally determine the required head. From this perspective, the method of considering the standard minimum residual pressure, determined based on the number of floors in the building ( n f ) and the water supply method, as the required head for each node was examined.
The standard minimum residual pressure is generally determined as the minimum supply pressure that does not cause inconveniences due to a lack of water pressure to the consumer residing at the highest floor of each building with a unit number of floors. In Korea, the standard minimum residual pressure criteria for each building with different numbers of floors have been established according to the water supply facility standard [21], as shown in Table 3. The water service provider determines and controls the supply pressure in accordance with the number of floors in the buildings within the supply area. However, because the frequency and degree of leakages in water distribution networks increase when a high minimum residual pressure is maintained for an aging area, empirical control is typically employed to account for maintenance costs.
The required head, determined using the standard minimum residual pressure, satisfies the head condition of the highest floor in a low-rise building when using direct water supply. The threshold head of a building with indirect water supply is lower than the minimum required head of the highest floor in a building with direct water supply. Therefore, it is rational to consider the standard minimum residual pressure based on the highest floor of a building with direct water supply as the required head of the node.
In this study, unlike the existing method, the highest floor of each building that adopted the direct water supply method was identified through site survey and customer information for each node in order to determine the actual required head of each node. This surveyed data is of great significance, because it enables an objective comparison of the method of determining the required head of each node and the method of applying the standard minimum residual pressure criteria for each node.

2.3. PDA of Each Scenario According to Method for Defining HOR and Criteria for Determining Required Head

To examine the appropriateness of the proposed methodology for the representative HOR and determining the standard minimum residual pressure as the required head, PDA modeling was implemented by setting the control group and active group for each scenario using WaterGEMS [22], as shown in Table 4. Here, the control group (Scenario 1) comprised the method of determining the most hydraulically unfavorable condition as the required head for each node through the application of consumer data for each small block in the HOR, as proposed by Wagner et al. [2]; this is a commonly used method. The active group contained the methodology that considers the standard minimum residual pressure as the required head (Scenario 2) depending on the number of floors in the building with the HOR proposed by Wagner et al. [2] and the methodology of adopting a representative HOR definition and determining the standard minimum residual pressure as the required head (Scenario 3).

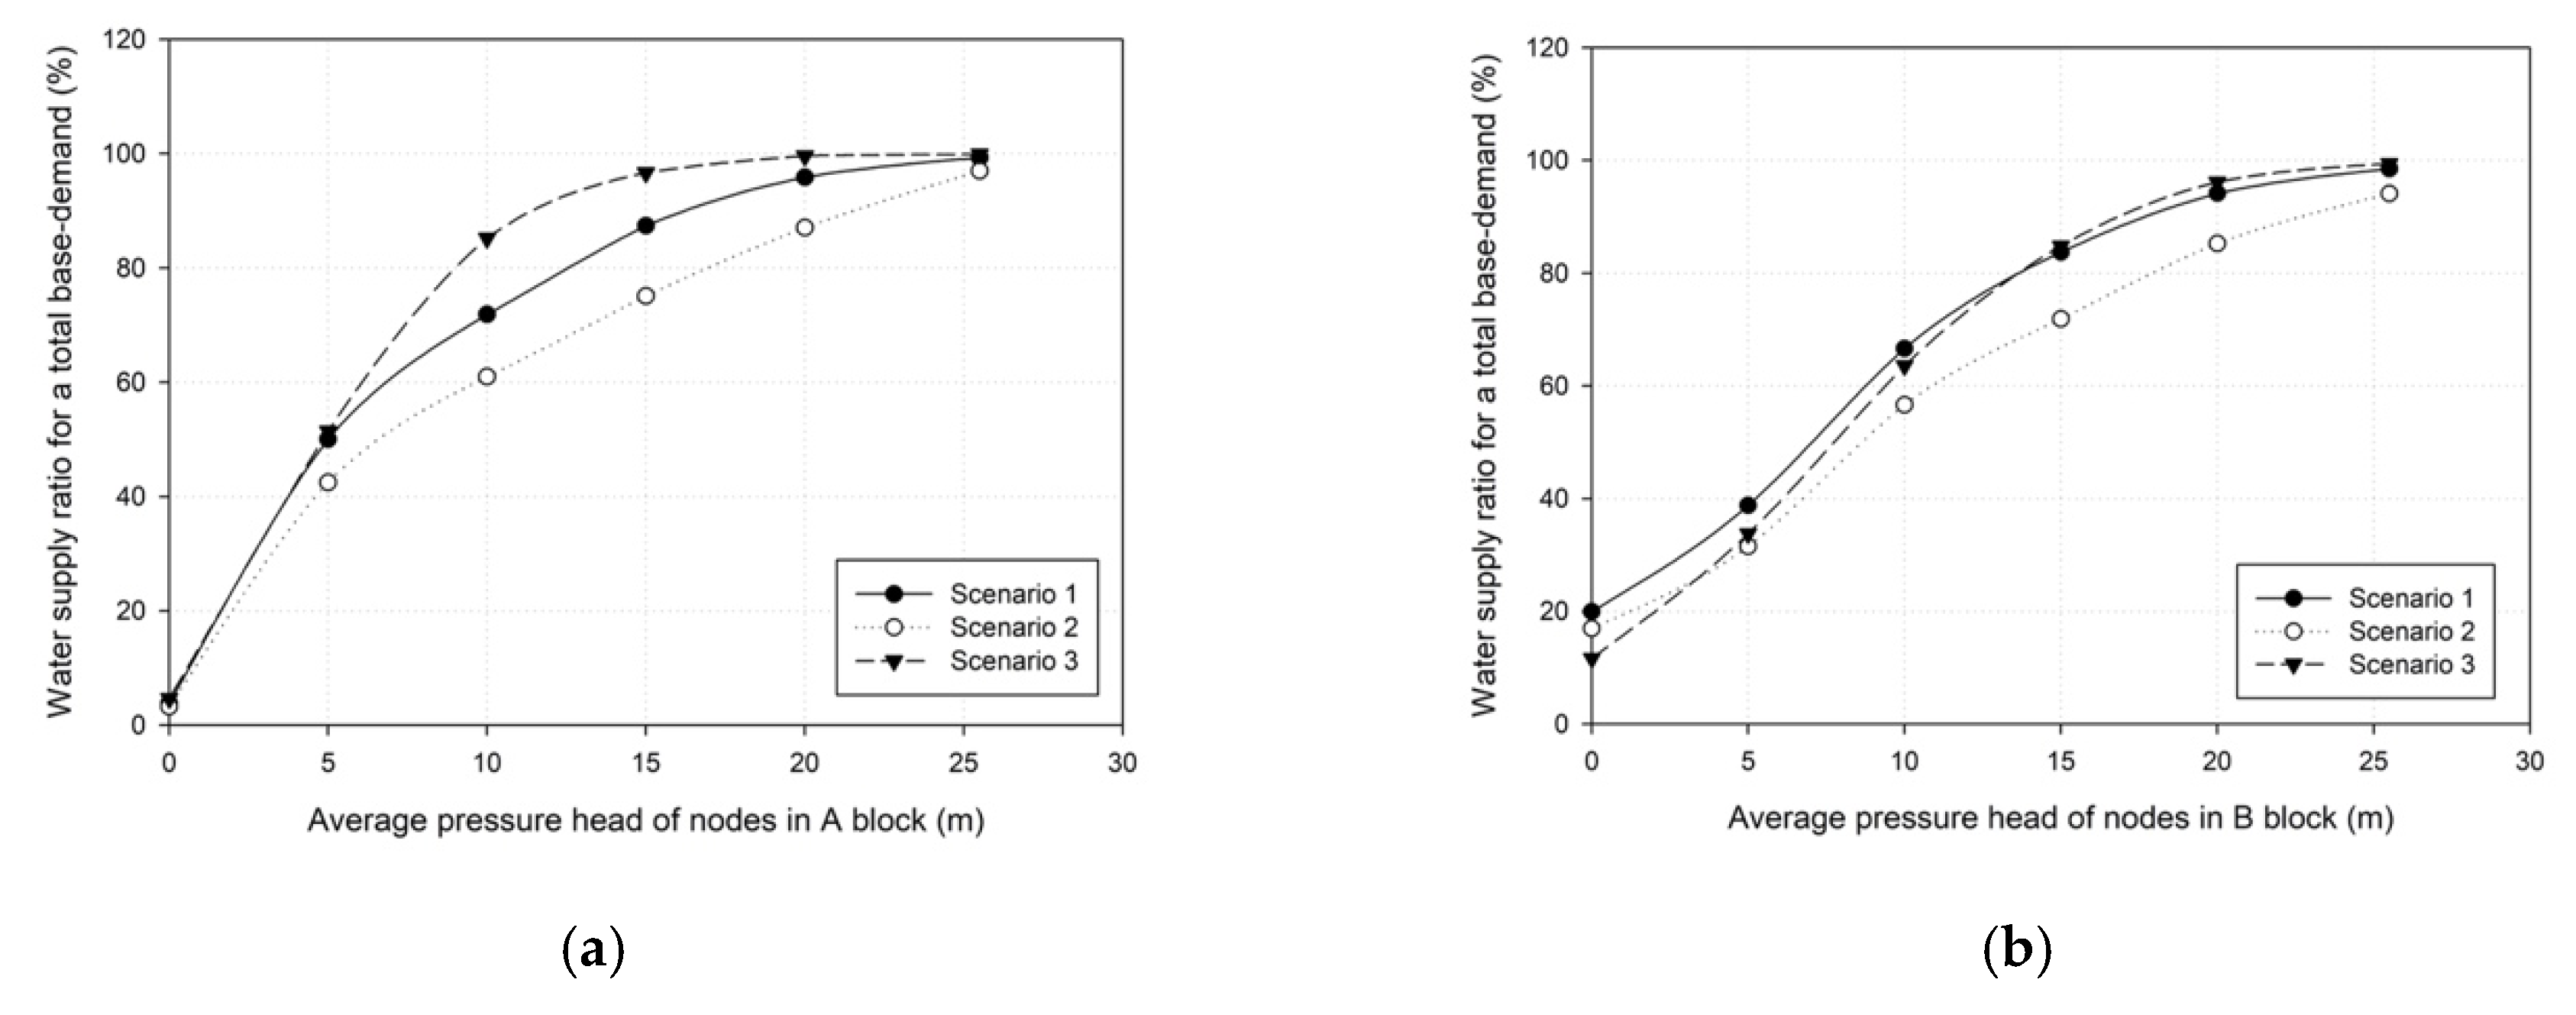
3. Application and Results

In this study, two demonstration blocks, A and B, located in Y city, Korea, were selected to analyze the differences in the PDA analysis results for each scenario. As shown in Table 5, in Block A, low-rise buildings account for 97% of all the buildings in the block, but the ratio of water consumption is only around 50%. Most low-rise buildings were identified as residential buildings with less than five floors; high-rise buildings within the block were government offices and schools. In Block B, the proportion of low-rise buildings is similar to that in Block A, but the water consumption of low-rise buildings accounts for 91% of the total water consumption of the block. Block B has a high proportion of neighborhood commercial facilities with less than five floors and a market at its center, resulting in a relatively high proportion of water consumption by the low-rise buildings.
The required heads for each node in Scenario 1 were estimated based on the addresses of consumers, provided by the water service provider of Y city and using the Street View function of Google Maps [23]. If the head condition of a building with direct water supply was more conservative than that of a building with indirect water supply, the minimum required head of the building with direct water supply was considered as the required head. In contrast, for a node comprising buildings with indirect water supply, alone, the standard minimum residual water pipe pressure of 150 kPa (15.3 m), as suggested in the water supply facility standard [18], was set as the required head; this is because the threshold head of high-rise buildings ( H j t h r e s h o l d ) is assumed to be less than the minimum required head of detached houses with two or less floors, and most of the water tanks are located underground.
For the required heads in Scenario 2 and Scenario 3, the standard minimum residual pressure of 250 kPa (25.5 m), based on the height of the 4th floor, was applied, accounting for the building characteristics of the target block. To reproduce the occurrence of abnormal conditions in the water distribution network by using PDA, the supply head of the reservoir (inflow node) of each block was adjusted such that the average pressure head for each node was 250 kPa (25.5 m), based on the standard minimum residual pressure for less than five floors determined in this study. The first head condition is to satisfy the required head of most buildings, regardless of the water supply method adopted. The second and third conditions are water pressure conditions causing problems in the use of water by residents on the third or higher floors of a building with direct water supply. Under the fourth condition, water supply problems may occur in buildings using direct water supply and containing 1 or 2 floors. The remaining conditions pertain to those for unsafe water supply and the failure of supply in high-rise buildings with indirect water supply. The water supply conditions for buildings under average of head of nodes were shown in Table 6.
The water distribution network in Block A is a small block containing 500 or less waterworks with one reservoir (inflow node), 87 nodes, and 97 pipes with a diameter of 50–150 mm. Block B is a medium block comprising over 1300 waterworks, consisting of 1 reservoir (inflow node), 254 nodes, and 270 pipes with a diameter of 45–300 mm. The Hazen–Williams roughness coefficient for the water pipe in each block was calculated to be 100, with reference to the current standard of approximately 20 years of usage. The water distribution network diagram for each block, indicating the representative indirect water supply nodes and the direct water supply nodes, is shown in Figure 3. The available flow rate supply for each block scenario under abnormal pressure conditions was simulated by PDA implementation, as shown in Table 7.
In the case of Block A, Scenario 3 showed a higher overall water supply capacity than the remaining two scenarios. This is because, even for abnormal conditions of the water distribution network, provided the supply head within the block exceeds the threshold head of the node, the base demand can be satisfied according to the HOR characteristics of the nodes with the indirect water supply method, as shown in Table 1. In contrast, if the supply head falls below the threshold head, the available flow rate supply is determined according to the HOR at all nodes. In the case of Block B, which involves high water consumption ratio at the node with direct water supply, Scenario 3 exhibits higher water supply capacity when the average supply head of the nodes exceeds 15 m, as compared to the other two scenarios where the HOR proposed by Wagner et al. [2] is applied. Overall, Scenario 3 shows a lower water supply capacity than the two scenarios under approximately 12 m in Figure 4. Such water supply capacity characteristics are estimated to be influenced by the difference in the HOR considered and the elevation for each node, because the scenario using the HOR proposed by Wagner et al. [2] can calculate the high flow rate supply, as shown in Figure 5.
Even if the pressure at the node approaches 0, a head of approximately 10 m at a node with a low elevation can be maintained in the case of a block with a large difference in node elevation. As a result, Scenario 3, which accounts for the water supply method of the nodes, is estimated to be able to calculate an objective flow rate supply that, as compared to the other scenarios, best reflects the characteristics of the water supply method used in the actual block in the event of abnormal conditions in the water distribution network.
Determining the required head of nodes when conducting PDA is considerably difficult. Although determining the required head via a field survey and based on consumer information may be the most rational approach, it requires a significant amount of time and manpower. In reality, it is considered to be impossible to determine the required head for each node if the analysis range varies according to the abnormal conditions of the water distribution network. Therefore, in this study, to confirm the appropriateness of the method for determining the required head of nodes based on the representative minimum residual pressure of the block, four nodes with different water supply methods in each block were selected. The available flow rate supply according to the pressure for each scenario was analyzed and is shown in Table 8.
For Blocks A and B, Scenario 3 and Scenario 1 showed similar trends at four nodes with the indirect water supply method (Node 4967, Node 4911, Node 5105, and Node 5013). Scenario 1 indicates that the node with indirect water supply can satisfy 100% of the base demand of the node when the supply head exceeds the threshold head (15.3 m). Scenario 3 exhibits an available flow rate supply of approximately 90% or more of the base demand when the supply head of the node exceeds 50% of the required head of the node (25.5 m). Owing to this phenomenon, a difference between the results of the available flow rate supply of the two scenarios rarely occurs at the node with indirect water supply, as shown in Table 9 and Table 10. However, in the case of Scenario 1 and Scenario 2, which applied the same orifice-type HOR, there was a large difference in the available flow rate at each node due to the difference in the required head. It can be estimated that the uncertainty of the PDA result with the conventional orifice-type HOR is caused by the required head standard. Meanwhile, as shown in Table 9 and Table 10, it was analyzed that the uncertainty on the PDA result due to the required head can be reduced when the representative HOR proposed in this study is applied to the PDA.
On the other hand, for Blocks A and B, at the four nodes with direct water supply (Node 4906, Node 4863, Node 5008, and Node 5991), Scenario 1 was applied to the actual required head of each node, while Scenario 2 was applied to the standard minimum residual pressure of the block as the condition of the required pressure. In these two scenarios, there is no difference in PDA results, because the same required head of 25.5 m and the conventional orifice-type HOR are applied. If the actual required head of the four nodes with the direct water supply method was 15.3 m, the PDA result of Scenario 2, which applied 25.5 m as the standard minimum residual pressure of the block in this study, would be considerably overestimated, compared to the result of Scenario 1. When the conventional orifice-type HOR is applied to the PDA, the uncertainty of the PDA result due to the inaccurate required head naturally increases, and this problem leads to the reliability of the PDA result. However, in the same way as in Scenario 2, the required head is applied at 25.5 m, but if the representative HOR of the block is applied, the uncertainty of the PDA result that occurs when the conventional orifice-type HOR is applied can be significantly resolved.
This is because, even in block with a high ratio of water usage of low-rise buildings that adopt direct water supply, the characteristics of water supply by the threshold head of nodes that adopt indirect water supply within the block are reflected in the representative HOR curve. Therefore, the relative importance of the accuracy of the required head can be decreased when the representative HOR of the block is applied in PDA for the block with a high ratio of water usage at the nodes that adopt the direct water supply method. These effects can be used as the basis for applying the standard minimum residual pressure criteria of each block as the reasonable required head condition in practice.
Based on these results, the proposed methodology for defining a representative HOR, while accounting for the water supply method in the block, and adopting the standard minimum residual pressure as the required head, while accounting for the type of buildings in the block, offers the advantage of improving the reliability of PDA; it also reduces the time required for PDA by applying objectivity to the analysis results and employing a rational assumption.

4. Conclusions

This paper proposes a novel PDA methodology that employs a representative HOR of the block by considering the difference between the water supply methods of actual buildings and assuming rational required heads as a method to improve the reliability of PDA results. So far, no methodology has been proposed to objectively determine two factors based on data of real block. Unlike the uniform application method for the conventionally defined HOR with the subjectively selected required head, the proposed method for defining a representative HOR ensures objectivity and practicality; this because the water supply method is considered when calculating the available flow rate supply for each node, in the case of reductions in the water distribution network pressure. In addition, the method of determining the required head of nodes based on the standard minimum residual pressure of the block can derive PDA results more effectively than the method of determining the required head through the use of field surveys, which require a significant amount of time and manpower. This makes it suitable for PDA modeling situations wherein the analysis needs to be completed within a short period of time.
To determine the suitability of the proposed PDA methodology, two demonstration blocks were selected to compare and evaluate the available flow rate supplies under abnormal conditions in the assumed water distribution networks. The results can be summarized as follows:
With regard to the PDA results of the scenario wherein the representative HOR of the block is applied, blocks featuring higher water usage by high-rise buildings with indirect water supply show a higher flow rate supply capacity than those in the scenario wherein the orifice-type HOR is applied. This is because the ability to satisfy the base demand can be retained, depending on the HOR of the node, provided the supply head within the block exceeds the threshold head of the node. In particular, when PDA implementation is required for blocks with a greater concentration of high-rise residential apartments and office buildings, applying the HOR proposed in this study not only provides the most reliable result reflecting the actual water supply characteristics, but, also, the uncertainty problem for the existing PDA method due to the selection of the required head can be minimized. This result means that the method of determining the required head can be changed from the existing time-consuming method to the standard minimum residual pressure of the block in terms of rapidity and rationality.
In a block featuring higher water usage of low-rise buildings that adopt direct water supply method, it can be seen that the difference in the total water supply capacity of the block occurs according to the required head, rather than the selected HOR. In particular, the greater the difference in elevation of each node, the greater the difference in the available flow rate calculated for each node, according to the required head, when a lower head condition occurs. As with the previous PDA method, if the required head is determined subjectively without surveying the residential environment of the block to be implemented in the PDA, the reliability of the PDA result will inevitably decrease. Nevertheless, if the representative HOR proposed in this study is applied to the PDA, the problem for uncertainty of the PDA method can be significantly improved.
This is because, in the process of defining the representative HOR of the block, the characteristics of water supply by the threshold head of the indirect water supply node were reflected in the representative HOR curve. This is because the HOR proposed in this study is less sensitive to the calculated available flow rate of the nodes due to the difference in the required head compared to the orifice-type HOR. The results of this study not only reduce the burden on the accuracy, time, and cost of the process of selecting the required head for individual nodes when implementing PDA but also can be used as a basis for applying the standard minimum residual pressure criteria for each block as a reasonable required head condition in practice.
Previously, from a practical perspective, a number of problems associated with reliability have affected PDA results, such as a lack of objectivity in selecting the required head and HOR. However, it is believed that the uncertainty in the HOR and the problems associated with reliability can be alleviated through the results of this study.

Author Contributions

Conceptualization, D.E.C. and D.G.Y.; methodology, D.E.C.; software, D.E.C.; validation, D.E.C., D.G.Y. and J.H.K.; formal analysis, D.E.C.; investigation, D.E.C.; resources, D.E.C.; data curation, D.E.C.; writing—original draft preparation, D.E.C.; writing—review and editing, J.H.K.; visualization, D.E.C.; supervision, D.E.C.; project administration, J.H.K.; funding acquisition, D.G.Y. All authors have read and agreed to the published version of the manuscript.

Funding

This research was funded by the Korea Environment Industry and Technology Institute (KEITI) through the Intelligent Management Program for Urban Water Resources Project, funded by the Korea Ministry of Environment (MOE), grant number 2019002950002.

Institutional Review Board Statement

Not applicable.

Informed Consent Statement

Not applicable.

Data Availability Statement

Data is contained within the article.

Conflicts of Interest

The authors declare no conflict of interest.

References

  1. Bhave, P.R. Node flow analysis of water distribution systems. Transp. Eng. J. ASCE 1981, 107, 457–467. [Google Scholar] [CrossRef]
  2. Wagner, J.M.; Shamir, U.; Marks, D.H. Water distribution reliability: Simulation methods. J. Water Resour. Plan. Manag. 1988, 114, 276–294. [Google Scholar] [CrossRef] [Green Version]
  3. Germanopoulos, G. A technical note on the inclusion of pressure dependent demand and leakage terms in water supply network models. Civ. Eng. Syst. 1985, 2, 171–179. [Google Scholar] [CrossRef]
  4. Reddy, L.S.; Elango, K. A new approach to the analysis of water starved networks. J. Indian Water Works Assoc. 1991, 23, 31–38. [Google Scholar]
  5. Chandapillai, J. Realistic simulation of water distribution. J. Transp. Eng. 1991, 117, 258–263. [Google Scholar] [CrossRef]
  6. Fujiwara, O.; Ganesharajah, T. Reliability assessment of water supply systems with storage and distribution networks. Water Resour. Res. 1993, 29, 2917–2924. [Google Scholar] [CrossRef]
  7. Gupta, R.; Brave, P.R. Comparison of methods for predicting deficient network performance. J. Water Resour. Plan. Manag. 1996, 122, 214–217. [Google Scholar] [CrossRef]
  8. Udo, A.; Ozawa, T. Steady-state flow analysis of pinetworks considering reduction of flow in the case of low water pressures. In Water Software Systems: Theory and Applications; Research Studies Press: Taunton, UK, 2001; Volume 1, pp. 73–182. [Google Scholar]
  9. Tanyimboh, T.; Tahar, B.; Templeman, A. Pressure-driven modeling of water distribution system. Water Supply 2003, 3, 255–261. [Google Scholar] [CrossRef] [Green Version]
  10. Wu, Z.Y.; Wang, R.H.; Walski, T.M.; Yang, S.Y.; Bowdler, D. Extended global-gradient algorithm for pressure-dependent water distribution analysis. J. Water Resour. Plan. Manag. 2009, 135, 13–22. [Google Scholar] [CrossRef]
  11. Tanyimboh, T.T.; Templeman, A.B. Seamless pressure deficient water distribution system model. J. Water Manag. ICE 2010, 163, 389–396. [Google Scholar] [CrossRef] [Green Version]
  12. Giustolisi, O.; Walski, T.M. Demand components in water distribution network analysis. J. Water Resour. Plan. Manag. 2012, 138, 356–367. [Google Scholar] [CrossRef]
  13. Shirzad, S.; Tabesh, M. Study of pressure-discharge relations in water distribution networks using field measurements. In Proceedings of the IWA World Water Congress and Exhibition, Busan, Korea, 16–21 September 2012. [Google Scholar]
  14. Shirzad, A.; Tabesh, M.; Farmani, R.; Mohammadi, M. Pressure-discharge relations with application to head-driven simulation of water distribution networks. J. Water Resour. Plan. Manag. 2013, 139, 660–670. [Google Scholar] [CrossRef]
  15. Chang, D.; Lee, H.; Yoo, D.; Kim, J. Quantification of the head-outflow relationship for pressure-driven analysis in water distribution networks. KSCE J. Civ. Eng. 2019, 23, 3353–3363. [Google Scholar] [CrossRef]
  16. Tucciarelli, T.; Criminisi, A.; Termini, D. Leak analysis in pipeline systems by means of optimal valve regulation. J. Hydraul. Eng. 1999, 125, 277–285. [Google Scholar] [CrossRef]
  17. Ciaponi, C.; Franchioli, L.; Murari, E.; Papiri, S. Procedure for defining a pressure-outflow relationship regarding indoor demands in pressure-driven analysis of water distribution networks. Water Resour. Manag. 2015, 29, 817–832. [Google Scholar] [CrossRef]
  18. Ciaponi, C.; Creaco, E. Comparison of pressure-driven formulations for WDN simulation. Water 2018, 10, 523. [Google Scholar] [CrossRef] [Green Version]
  19. Ravi, S.; Renganathan, N.; Perumal, S.; Paez, D. Analysis of water distribution network under pressure-deficient conditions through emitter setting. Drink. Water Eng. Sci. 2019, 12, 1–13. [Google Scholar] [CrossRef] [Green Version]
  20. Chang, D.; Lee, H.; Yoo, D.; Kim, J. Practical head-outflow relationship definition methodology that accounts for varied water-supply methods. Sustainability 2020, 12, 4755. [Google Scholar] [CrossRef]
  21. Ministry of Environment. Water Supply Facility Standard Management and Maintenance; Ministry of Environment: Seoul, Korea, 2010. [Google Scholar]
  22. Bentley Systems Incorporated. WaterGEMS User Manual; Bentley Systems Incorporated: Watertown, MA, USA, 2005. [Google Scholar]
  23. Available online: www.google.co.kr/maps (accessed on 21 December 2020).
Figure 1. Conceptual diagram of building water supply methods. Figure 1 was made by referring to Figure 1 and Figure 2 presented in study of Chang et al. [20]. (a) Water supply method in high-rise buildings. (b) Water supply method in low-rise buildings.
Sustainability 13 02793 g001
Figure 2. Representative HOR of blocks with different percentages of water consumption in high-rise and low-rise buildings. (a) Representative HOR of block with high percentage of water consumption in high-rise buildings. (b) Representative HOR of block with high percentage of water consumption in low-rise buildings.
Sustainability 13 02793 g002
Figure 3. Water distribution network diagrams for each block in the study area. (a) Block A (block with high proportion of water consumption by high-rise buildings). (b) Block B (block with low proportion of water consumption by high-rise buildings).
Sustainability 13 02793 g003
Figure 4. Analysis result of ratio of water supply capacity to average pressure head of nodes by scenario. (a) Block A. (b) Block B.
Sustainability 13 02793 g004
Figure 5. Comparison of available flow rate supply curve according to pressure conditions (Chang et al. vs. Wagner et al.).
Sustainability 13 02793 g005
Table 1. Head-outflow relationship (HOR) at each node according to the water supply method of buildings.
ConditionHead-Outflow Relationships
High-rise building Q j a c t = Q j r e q if H j a v b l H j t h r e s h o l d
Q j a c t = Q j r e q × H j a v b l H j m i n H j t h r e s h o l d H j m i n if H j m i n < H j a v b l < H j t h r e s h o l d
Q j a c t = 0 if H j a v b l H j m i n
Low-rise building q i a c t = q i r e q if H b a v b l h i r e q
q i a c t = q i r e q × H b a v b l h i m i n h j r e q h i m i n if h i m i n < H b a v b l < h i r e q
q i a c t = 0 if H b a v b l h i m i n
Table 2. Conditions for defining the representative HOR of the study area.
ConditionRangeRemark
Number of floors ( n f )1st to 5th FloorLow-rise bldg. with <5 floors
High-rise bldg. with ≥5 floors
Difference in topographic height ( Z g or Z s )−3 to 3 m-
Headloss ( Δ H i n d )3–10 m-
Available head ( H a v b l )0–40 mEach scenario
Base demand ( Q j r e q or Q b r e q )Water consumption for each building in the block-
Table 3. Standard minimum residual water pipe pressure according to number of floors in buildings.
ConditionStandard Minimum Residual Pressure (kPa)Remark
Design Criteria
2nd Floor or Lower150Low-rise building
3rd Floor200
4th Floor250
5th Floor300High-rise building
Table 4. Scenario configuration for each HOR and required head condition.
ConditionHORRequired HeadRemark
Scenario 1Wagner et al.Investigated minimum required headControl group
Scenario 2Wagner et al.Standard minimum pressure headActive group
Scenario 3Chang et al.Standard minimum pressure head
Table 5. Comparison of buildings with different numbers of floors and water consumption percentages by block.
ConditionBuilding Ratio by Number of Floors (%)Water Consumption Ratio (%)
Block ABlock BBlock ABlock B
First floor81542817
Second floor413313
Third floor7221442
Fourth floor47619
Fifth floor and above33499
Total100100100100
Table 6. Water supply conditions for buildings under average pressure head node conditions.
Average Head of NodesConditionsRemark
Over 25 mRequired head of most buildings satisfied
About 20 mRequired head of buildings with 4 or more floors unsatisfiedLimited to buildings with direct water supplies
About 15 mRequired head of buildings with 3 or more floors unsatisfiedLimited to buildings with direct water supplies
About 10 mRequired head of buildings with 2 or fewer floors and high-rise buildings unsatisfied-
About 5 m
About 0 m
Table 7. Available flow rate supply for each block scenario under abnormal pressure conditions.
ConditionsBlock ABlock B
Scenario 1Scenario 2Scenario 3Scenario 1Scenario 2Scenario 3
Avg. Head of NodesTotal Base Demand
(m3/day)
434.41911.8
Over 25 mFlow rate supply431.5421.2434.11883.91799.01900.5
Supply capacity99.397.099.998.594.199.4
About 20 mFlow rate supply416.4378.0432.61799.61629.41837.6
Supply capacity95.987.099.694.185.296.1
About 15 mFlow rate supply379.6326.3419.91600.41374.31621.3
Supply capacity87.475.196.783.771.984.8
About 10 mFlow rate supply312.1264.8370.01274.21083.01214.9
Supply capacity71.861.085.266.656.663.5
About 5 mFlow rate supply217.3184.5223.2741.1601.8645.0
Supply capacity50.042.551.438.831.533.7
About 0 mFlow rate supply16.514.120.1381.0324.1224.1
Supply capacity3.83.24.619.917.011.6
Note: Unit of flow rate supply is m 3 / day , and unit of supply capacity is %.
Table 8. Conditions for each scenario for nodes with different water supply methods in each block.
ConditionWater
Supply
Method
No. of Rep. Bldg. FloorsBase Demand
(m3/day)
Scenario 1Scenario 2Scenario 3
BlockNode IDHORReq.
Head (m)
HORReq.
Head (m)
HORReq.
Head (m)
A4967In-direct658.7Wagner15.3Wagner25.5Chang25.5
4911627.1
4906Direct410.625.525.525.5
4863431.2
B5105In-direct10185.015.325.525.5
501312243.4
5008Direct494.325.525.525.5
4991472.8
Table 9. Water supply capacity by scenario of nodes with different water supply methods in Block A.
ConditionBase Demand
( m 3 / day )
Available   Supply   Flow   ( m 3 / day )
Node IDWater Supply MethodElevation (m)Average Pressure Head of Block (m)Actual Pressure Head at Node (m)Scenario 1Scenario 2Scenario 3
4967Indirect34.825.523.058.758.7 (100%)56.0 (95%)58.6 (100%)
20.017.658.7 (100%)49.3 (84%)58.4 (99%)
15.012.953.9 (92%)42.3 (72%)56.0 (95%)
10.08.343.2 (74%)33.9 (58%)47.2 (80%)
5.03.728.9 (49%)22.7 (39%)25.3 (43%)
0.0−0.80.0 (0%)0.0 (0%)0.0 (0%)
491134.225.523.727.127.1 (100%)26.1 (96%)27.0 (100%)
20.018.227.1 (100%)23.1 (85%)26.9 (99%)
15.013.525.4 (94%)20.0 (74%)26.1 (96%)
10.08.920.6 (76%)16.1 (59%)22.6 (83%)
5.04.314.3 (53%)11.2 (41%)13.2 (49%)
0.0−0.20.0 (0%)0.0 (0%)0.0 (0%)
4906Direct34.625.523.310.610.2 (96%)10.2 (96%)10.5 (99%)
20.017.98.9 (84%)8.9 (84%)10.4 (98%)
15.013.17.6 (72%)7.6 (72%)10.2 (96%)
10.08.56.1 (58%)6.1 (58%)8.7 (82%)
5.03.94.2 (40%)4.2 (40%)4.8 (45%)
0.0−0.60.0 (0%)0.0 (0%)0.0 (0%)
486333.725.524.131.230.3 (97%)30.3 (97%)31.1 (100%)
20.018.726.7 (86%)26.7 (86%)31.0 (99%)
15.013.923.1 (74%)23.1 (74%)30.2 (97%)
10.09.318.9 (61%)18.9 (61%)26.7 (86%)
5.04.713.5 (43%)13.5 (43%)16.6 (53%)
0.00.23.1 (10%)3.1 (10%)5.2 (17%)
Table 10. Water supply capacity by scenario of nodes with different water supply methods in Block B.
ConditionBase Demand
( m 3 / day )
Available   Supply   Flow   ( m 3 / day )
Node IDWater Supply MethodElevation (m)Average Pressure Head of Block (m)Actual Pressure Head at Node (m)Scenario 1Scenario 2Scenario 3
5105Indirect32.625.528.9185.0185.0 (100%)185.0 (100%)185.0 (100%)
20.023.4185.0 (100%)178.0 (96%)184.6 (100%)
15.018.4185.0 (100%)156.8 (85%)182.4 (99%)
10.013.4173.0 (94%)134.7 (73%)170.6 (92%)
5.08.4137.3 (74%)105.4 (57%)121.5 (66%)
0.03.386.3 (47%)67.0 (36%)48.6 (26%)
501342.625.518.3243.4243.4 (100%)207.6 (85%)239.9 (99%)
20.012.9223.7 (92%)175.2 (72%)221.5 (91%)
15.08.0176.7 (73%)136.7 (56%)156.4 (64%)
10.03.2111.0 (46%)88.3 (36%)62.7 (26%)
5.0−1.60.0 (0%)0.0 (0%)0.0 (0%)
0.0−6.70.0 (0%)0.0 (0%)0.0 (0%)
5008Direct43.625.517.394.377.8 (100%)77.8 (100%)94.3 (100%)
20.011.964.5 (68%)64.5 (68%)82.0 (87%)
15.07.149.6 (53%)49.6 (53%)53.0 (56%)
10.02.227.7 (29%)27.7 (29%)18.2 (19%)
5.0−2.60.0 (0%)0.0 (0%)0.0 (0%)
0.0−7.70.0 (0%)0.0 (0%)0.0 (0%)
499133.025.526.672.872.8 (100%)72.8 (100%)72.8 (100%)
20.021.366.6 (91%)66.6 (91%)72.3 (99%)
15.016.759.0 (81%)59.0 (81%)70.7 (97%)
10.012.150.2 (69%)50.2 (69%)63.6 (87%)
5.07.639.8 (55%)39.8 (55%)42.9 (59%)
0.02.824.0 (33%)24.0 (33%)16.5 (23%)
Publisher’s Note: MDPI stays neutral with regard to jurisdictional claims in published maps and institutional affiliations.

