Article

What Will Remain? Predicting the Representation in Protected Areas of Suitable Habitat for Endangered Tropical Avifauna in Borneo under a Combined Climate- and Land-Use Change Scenario

by
Minerva Singh
*,
Jessamine Badcock-Scruton
and
C. Matilda Collins
The Centre for Environmental Policy, Imperial College London, London SW7 1NE, UK
*
Author to whom correspondence should be addressed.
Sustainability 2021, 13(5), 2792; https://0-doi-org.brum.beds.ac.uk/10.3390/su13052792
Submission received: 5 February 2021 / Revised: 22 February 2021 / Accepted: 24 February 2021 / Published: 5 March 2021

Abstract

:
The responses of threatened tropical avian species to projected climate change and land-use change are important for evaluating the ability of the existing protected areas to provide habitat to these species under future scenarios in biodiversity hotspots. This study uses Maxent, a species distribution model that employs a maximum entropy machine learning approach to map the spatial distributions of habitats suitable for the International Union for Conservation of Nature threatened birds under present and future climate and land-use change in Borneo. We find that the existing protected areas provide very low coverage of the threatened bird species’ suitable habitat areas (95%CI = 9.3–15.4%). Analysis of habitat suitability projections for 18 species of threatened birds suggests that in 2050, under Special Report on Emissions Scenarios A1B and B1, avian species with currently little suitable habitat may gain area but lose in the proportion of this that is protected. Large-ranged species are likely to lose habitat area and this will inflate the proportion of this remaining in protected areas. The present availability of suitable habitat was the most important determinant of future habitat availability under both the scenarios. Threat level, as measured by the International Union for Conservation of Nature and the habitat preferences considered here, Lowland or Lowland–Montane, are poor predictors of the amount of habitat contraction or expansion undergone by the species.

1. Introduction

Climate change and anthropogenic forest loss are the greatest threats facing tropical biodiversity [1]. Many biodiversity hotspots, such as the Indo-Malayan region, which is home to many threatened and endemic species, are vulnerable to both these drivers of biodiversity decline [2,3]. The island of Borneo in the heart of this region that has seen high levels of deforestation, from 76% forest-cover (560,000 km2) in 1973 to approximately 53% in 2010 [4,5]. The land-use changes driving forest loss, such as agricultural expansion and poorly-regulated timber extraction, will increasingly interact with climate change, and these interactions are likely to combine to have a substantial negative impact on tropical biodiversity [6]. In the face of rapid landcover and climate changes, it is vital to evaluate the impact of these on biodiversity, including the persistence of biodiversity of tropical regions such as Borneo under future scenarios.
Birds are frequently used as umbrella species and bioindicators in conservation efforts; they are wide-spread and, unusually for tropical taxa, have relatively well-studied ecologies and life-histories [7]. Climate change and land cover change dynamics act synergistically to have a negative impact on avian persistence. Ignoring the interaction between these can undermine the robust identification of future suitable habitats [8]. They are also highly sensitive to changes in their environment, making them excellent bellwethers for global change research [8,9,10] Quantifying the potential impacts of predicted climate and land-use change scenarios on the “suitable habitat” size of threatened montane and lowland avian species will help us to predict patterns of future vulnerability at species-scale. Birds classified by the International Union for the Conservation of Nature (IUCN) as “threatened” are already vulnerable as they face considerable risk of extinction. Estimating the response of these species to potential future scenarios will be important in predicting whether these species are set to undergo further range size declines as a result of climate or land-use change and thus may require additional conservation efforts. Other studies have investigated the response of avian assemblages to these drivers in both temperate [11] and boreal zones [12,13], but Borneo, with its particular vulnerabilities, remains unexplored in this way. Further, a meta-analysis of the literature discovered future biodiversity related projections mostly consider the impact of climate change and leave out land cover. Given Borneo’s rapid land cover change, it is vital to quantify the impact of both climate and landcover change on habitat suitability [14]. In addition to predicting the changes in suitable habitat available to threatened avian species, understanding this in the context of the island’s protected area (PA) network under present and future scenarios will be important for informing conservation strategy both locally and across the Asian tropics.
Protected Areas are the cornerstone of conservation actions designed to ensure the long-term viability of biodiversity [15]. Tropical biodiversity-rich regions are, however, often at risk of failing to enforce the requirements of PAs, with their effectiveness limited by rapid population growth and development and additionally challenged by the triumvirate of weak institutional capacity, poverty, and corruption [16]. Threatened species do not exist exclusively within PAs, and many only find a proportion of their range protected in this way. Gap analyses can be used to quantify representation, the proportion of a species range, or of their potentially suitable habitat that lies within PAs. Biodiversity representation within the Indo-Burma hotspot PA network is already limited [17], and climate change-driven range shifts may cause the suitable habitats of vulnerable species to shift outside these [18].
The main aim of this research is to model the suitable habitat availability for the IUCN-listed threatened Bornean avian species in the island’s PA network under present and future climate and land cover scenarios. To this end, the main objectives of the research are to: (a) estimate whether the suitable habitat area of these species is likely to change substantially under specific scenarios; (b) identify whether habitat availability is differentially affected by characteristics such as their habitat preference or their IUCN threat level; and, (c) evaluate the “representation” of each species’ suitable habitat lying within the protected area network with the view of assessing the effectiveness of Borneo’s PAs for threatened bird species, both currently and under future scenarios. This is expected to provide measure of the conservation value of IUCN PA categories (Ia-VI), to assist in identifying which protected area category is most widely valuable in terms of representation of predicted suitable habitat for the different species and identify the species at the greatest risk of losing habitats.

2. Materials and Methods
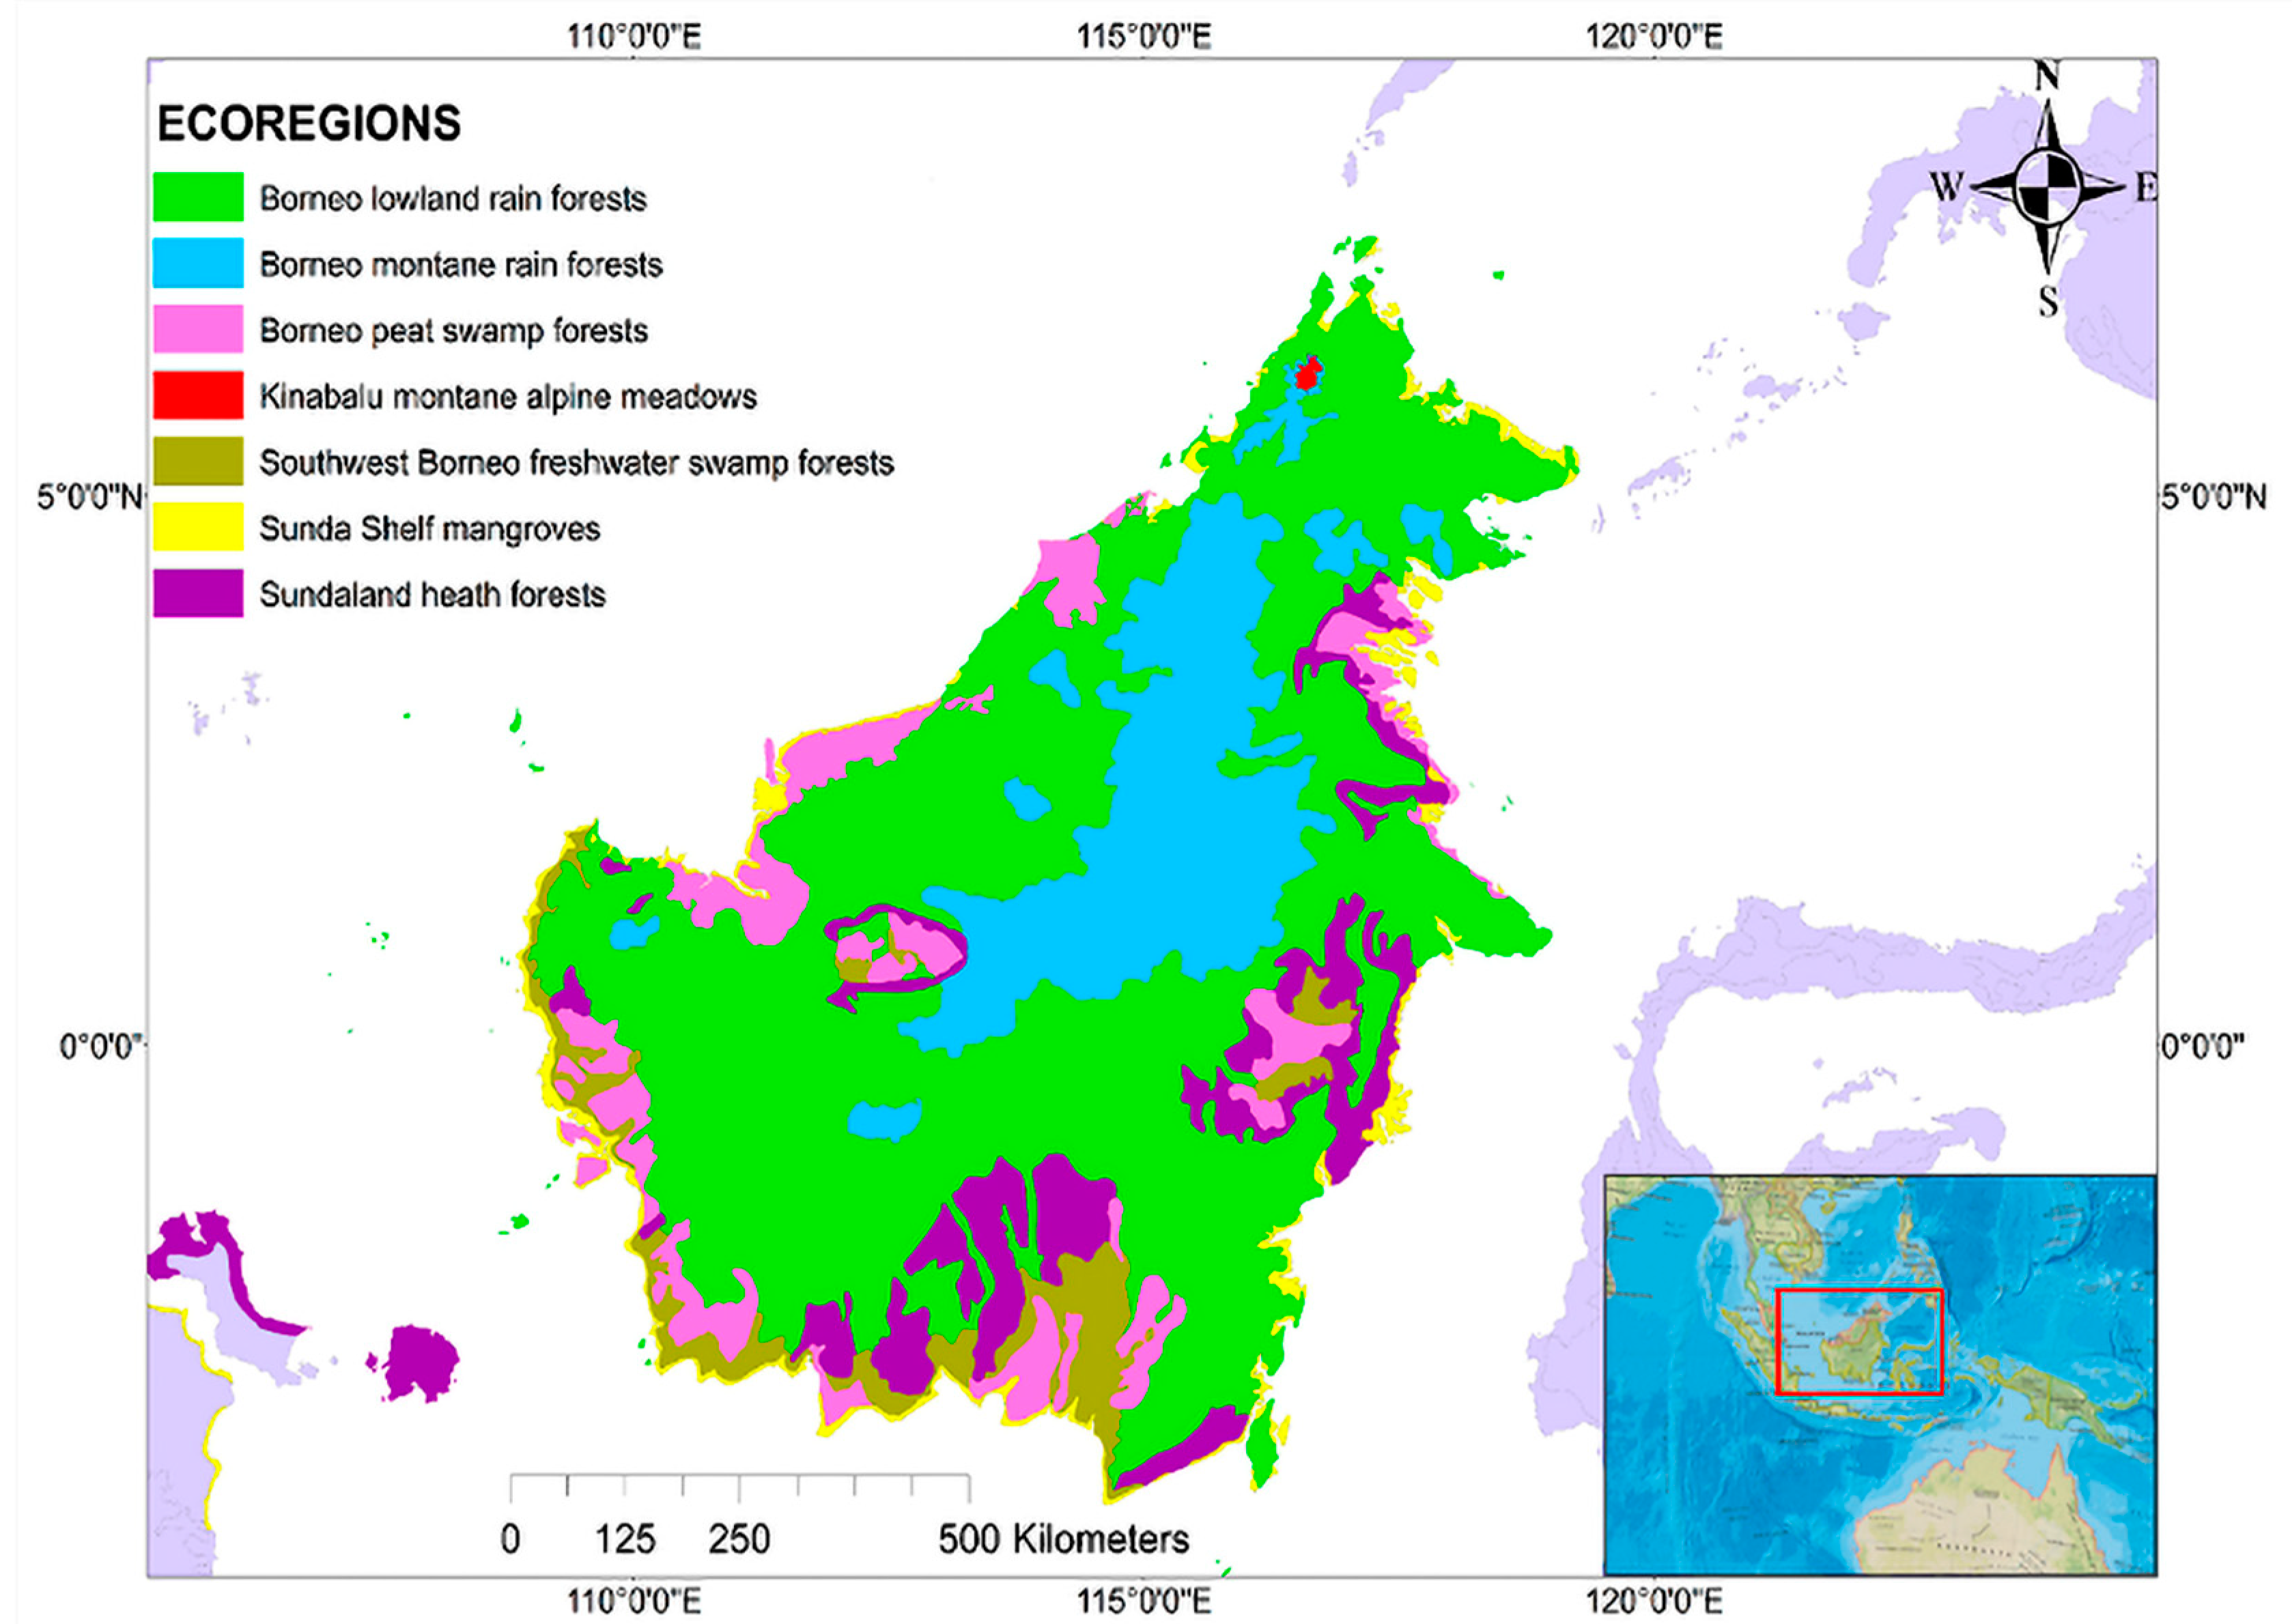
2.1. Study Site

The equatorial island of Borneo in Southeast Asia spans approximately 4° S to 7° N and 108° to 118° E. At 743,330 km2, it is Asia’s largest, and the world’s third-largest, island. This study focusses on the IUCN listed threatened avian species of Borneo’s lowland and montane forests (see Figure 1). Avian species of both lowland and montane rainforests are vulnerable to anthropogenic disturbances [19].

2.2. Focal Species Selection

Bird species were selected from the IUCN Red List (IUCN, 2019), which identifies threatened species through many criteria that include population size, size of geographic range, and rate of decline. Borneo-resident species were identified then filtered to retain those occurring in Subtropical/Tropical Moist Lowland and Subtropical/Tropical Moist Montane Forests [20]. The search results were then further filtered to retain those classified as Critically Endangered, Endangered, or Vulnerable.
Point locality data for the species records were extracted from the Global Biodiversity Information Facility (GBIF) portal (GBIF.org, 2019) and filtered to a dataset of 20 species with 4766 geolocation records (Table 1). Habitat preference data, including details such as the elevational range limits of the species, were assembled from both the Handbook of the Birds of the World and the IUCN RedList species records [21]. The WWF delimits montane forests starting at around 1000 m above sea level [22]. Species with an upper range limit above 1000 m were classified as “lowland/montane”, those with an upper range limit below 1000 m were classified as being “lowland” residents (Table 1).

2.3. Environmental Data

2.3.1. Present Climate Data

Environmental data, consisting of 19 bioclimatic variables at a spatial resolution of 30 arc seconds (approximately 1 km at the equator) and representing aggregated climate data from 1970 to 2000, were downloaded in raster format from WorldClim 2.0 [23]. These variables are obtained through a thin-plate spline smoothing algorithm that interpolates data from a large number of weather stations across the globe. The 19 variables represent climate factors of varying temporal scales, from annual and seasonal trends to extreme monthly and quarterly variables that may prove to be limiting factors to flora and fauna [24]. After a preliminary model assessment, nine of the 19 WorldClim variables were retained (Table 2); the ten variables which consistently contributed little or nothing to the model explanatory power were excluded. The elimination of these redundant variables also reduced multicollinearity between variables and potential model overfitting [21].

2.3.2. Future Climate Data

Tiles of spatially downscaled climate model data for all 19 bioclimatic variables were downloaded from the CCAFS-Climate data portal (http://www.ccafs-climate.org (1 March 2021)) at the same resolution. Future climate change scenarios for the time interval 2046–2065 (mean = 2050) were considered. Future climate projections were derived from CSIRO Mk3.5, a General Circulation Model (GCM) used in the Coupled Model Intercomparison Project 3 (CMIP3). Simulations from the Mk3 family of models have contributed towards the IPCC AR4 Assessment and have been used in modelling bat and bird distributions in Southeast Asia and South America [22,25]. For this period, the climate parameters of two IPCC Special Report on Emissions Scenarios (SRES), A1B, and B1, both representing medium–high and lower emissions scenarios, respectively, were used. Thus, two future climate scenarios were modelled and considered in this study: A1B 2050 and B1 2050.

2.3.3. Topographic Data

Digital elevation data from the Shuttle Radar Topography Mission (STRM) was downloaded in 5 × 5° tiles from the CGIAR Consortium for Spatial Information at a resolution of 90 m. It was assumed that topographic data would remain stable in this time frame. An additional topographic variable raster, slope, was also generated from the SRTM elevation raster.

2.3.4. Land-Use Data

A Future Land-Use Simulation (FLUS) system modelling land-use and land cover change at a fine resolution of 1 km was downloaded for the years 2010, A1B, and B1 2050 from [26]. As with the climate change scenarios, the land-use scenarios arrived-at reflect predicted demographic, economic, climate change, and energy requirement drivers for the years stated, with the land-cover scenarios derived using a combination of “top-down” agro-economic allocation and “bottom-up” spatial modelling [26].

2.3.5. Layer Preparation

The modelling of suitable habitat for all 20 species across all periods and SRES scenarios is implemented with the Maxent model of 12 variables (Table S1: The twelve (12) bioclimatic, topographic and land-use variables used as input variables in the MaxEnt modelling).

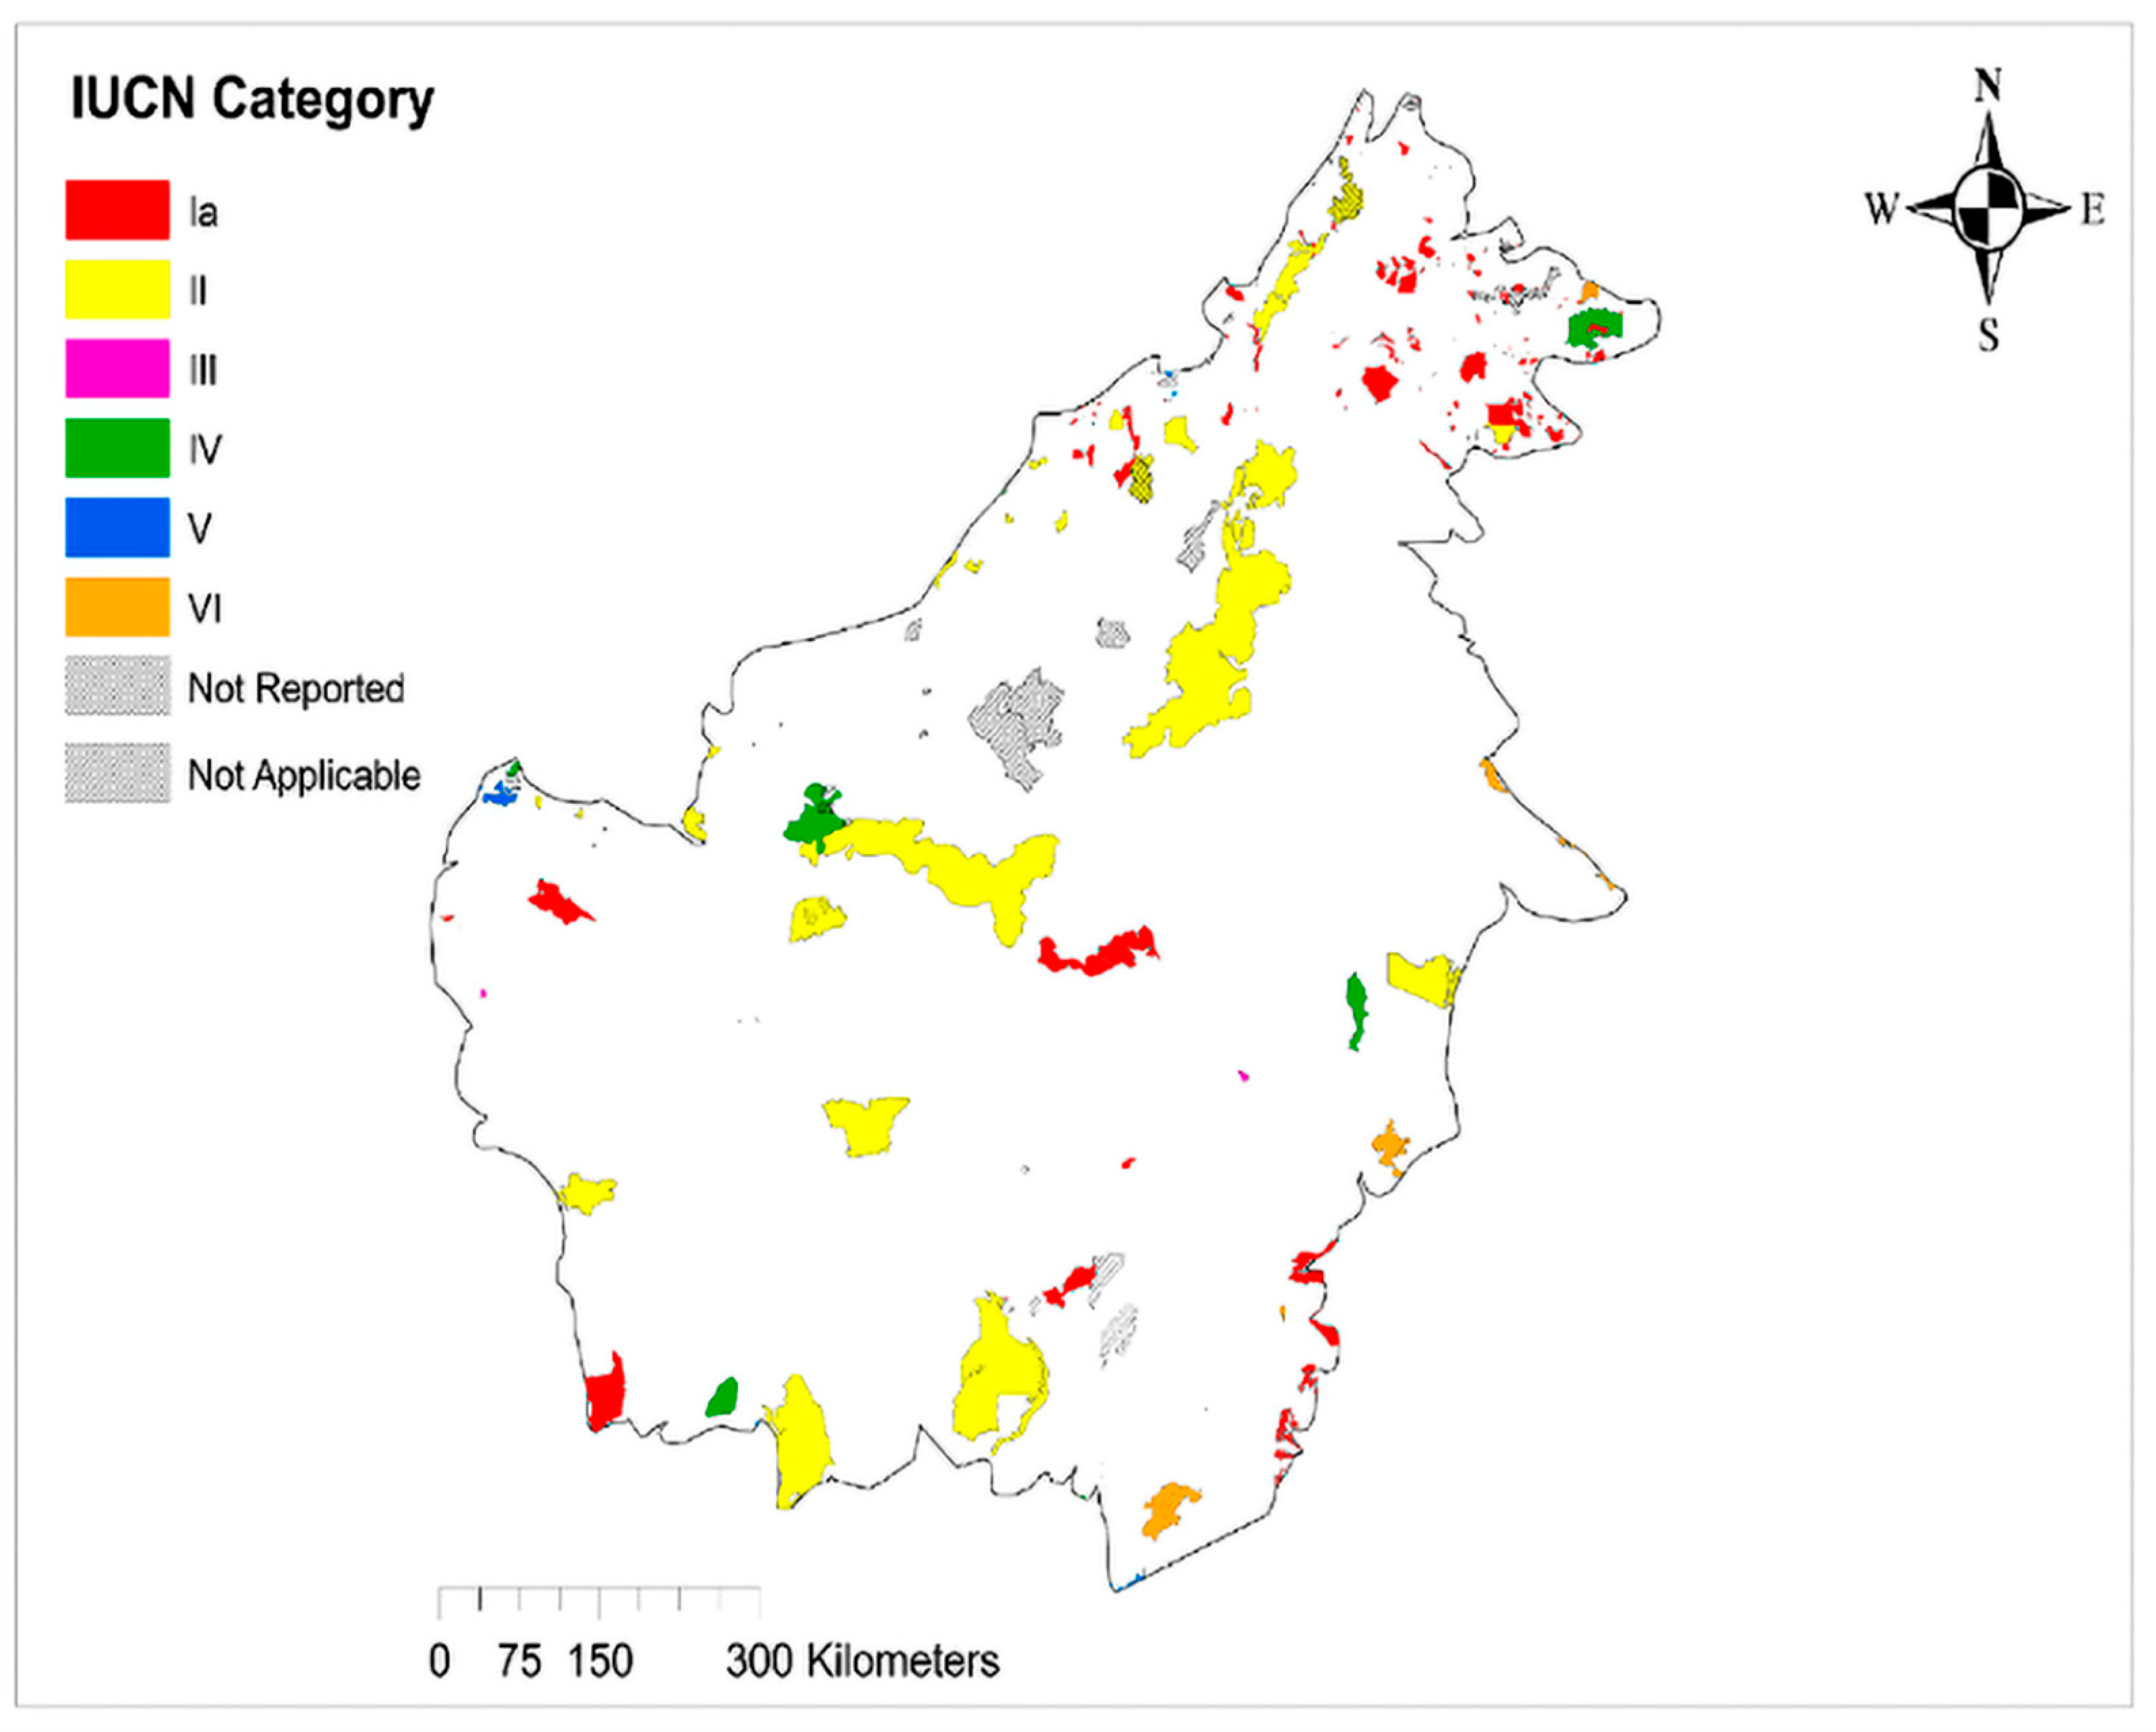
2.3.6. Protected Area Data

The Bornean PA network shapefile data was supplied by the World Database on Protected Areas (WDPA), ProtectedPlanet.net. The WDPA provided a comprehensive and global database of terrestrial and marine protected areas and was set up by the UN Environment Programme and the IUCN [27]. The IUCN categories PAs according to several guidelines and management approaches [28]. Strictly protected areas, in which it is recommended that extractive and mining activities are prohibited, constitute categories I–IV, while categories V–VI permit localized extractive activities [28]. Only categories Ia–VI from the downloaded dataset were considered; any PA listed as “Not Reported” or “Not Applicable” by the IUCN was excluded. A total of 213 protected areas were included in the analysis (Figure 2).

2.3.7. Habitat Suitability Modelling

For each species, one current (2010) distribution and two SRES scenario future distributions were modelled (total = 60) using the maximum entropy modelling software Maxent [29]. The default settings were used; the regularization parameter (used to reduce overfitting) was fixed at 1, and the maximum number of background points was set at 10,000 [28,30]. The replicated run type was set to “cross-validate”, and the number of iterations to 500. These auto-features have been previously validated and tuned [31,32]. Estimates of the independent contribution of each variable to the model outcome were calculated. However, these are heuristically defined and path-dependent. Jackknife tests were additionally used to estimate the importance of each variable [33].
In the absence of independent data for model validation, the dataset was randomly partitioned into test (25%) and training (75%) data (as used in [27,29,34]). Model quality was assessed using the area under the receiver operating characteristic (ROC) curve (AUC), a threshold-independent metric and true skill statistics (TSS) [34]. The ROC value is obtained by plotting sensitivity (proportion of known presence predicted present (=1-false negative rate)) against 1-specificity (proportion of known absences predicted present (=false positive rate)) [35]. The resulting test area under the curve (AUC) value ranges from 0 to 1, with 1 indicating a model with perfect discrimination and an AUC of 0.5, indicating that model performance is equivalent to that of random prediction [36]. TSS scores are classified as moderate performance (≥0.5), fair performance (≥0.3), and poor performance (<0.3) [37]. Two species with test AUC values <0.75 (Chloropsis sonnerati, Setornis criniger) were then excluded as this threshold indicates reasonable discriminatory power [27,32]. All the remaining species had a TSS > 0.6.
The Maxent logistic output format produces continuously scaled distribution maps of habitat suitability on a scale from 0 to 1, where cells assigned a value of 1 to contain theoretically high habitat suitability, and cells with a value of 0 are considered highly unsuitable. These maps were converted into binary presence/absence maps by setting a probability of occurrence threshold of 0.6, as recommended by Nazeri et al. [38]. This conservative approach is often preferred in conservation contexts, where a more liberal interpretation of a probability of habitat suitability could result in the misdirection of resources [39].

2.3.8. Habitat Suitability and Protected Area Coverage Calculation and Analysis

Binary maps were used to calculate the absolute area of the habitat suitability for each of the species in 2010 and in 2050 under the two future scenarios modelled (A1B/B1). The suitable habitat available was classified into three levels, Small (<10,000 km2), Medium (10,000–30,000 km2) and Large (>30,000 km2). The overlap of the habitat suitability maps and the protected areas was calculated using Zonal Statistics [40].
We used an analysis of covariance (ANCOVA) to investigate whether the current IUCN categorization, the 2010 suitable habitat area, and the habitat type preference varied systematically with predicted changes in habitat area and in the portion of suitable habitat predicted to lie within protected areas in 2050. The ICUN categories CR and EN were collapsed to a single level, “EN+”, in the analysis as there was a single species in the CR category. Generalized linear models were fit independently to the species predictions arising from modelling of the two future scenarios and the influence of each factor/variable was assessed by sequential deletion testing until the minimally adequate model was identified. Only main effects and no interactions were fit as the data set was small. All analyses were performed in R version 3.6.3 [41].

3. Results

All the current and future habitat suitability maps retained in this analysis performed well, with mean testing and training AUC values of 0.892 (±0.051) and 0.936 (±0.036), respectively. Isothermality (Bio3) was the most important predictor of species distribution for the present time period and was the highest contributing variable in 52.6% of cases with an average explanatory contribution of 41%. In all four future scenarios, precipitation of the driest quarter (bio17) was the most important predictor, ranking as the highest contributor in the model 31.7% of the time and contributing, on average, 32.9%. A jackknife test of variable importance confirmed bio17 to be the highest contributing variable of 32.3% of the time.
One species, Caprimulgus concretus, was predicted to make such habitat gains (>200%) that it was an outlier in both future models and was excluded from the statistical analyses of habitat area change as it obscured the generality of interpretation. Modelling was, however, performed with, and without, this species to confirm general patterns. These did not vary, but model fit was much improved with the outlier removed.

3.1. Current (2010) Habitat Suitability Modelling and Estimated Portion Protected

The available habitat predicted to be suitable for each species varied substantially. Buceros rhinoceros, a large-bodied hornbill has over 50,000 km2 available whereas Ciconia stormi, the rarest of all storks, has less than 3000 km2 of suitable undisturbed forest remaining on Borneo. The percentage of the available habitat lying within protected areas was low (95%CI = 9.3–15.4 %) but also varied substantially from Spilornis kinabaluensis, the Mountain Serpent Eagle, which prefers high ridges and has >30% within PAs to Treron capellei, a large, green pigeon, with only 3.4% of its range protected (Table 2). The large-ranged, critically-endangered Rhinoplax vigil had only 5.9% of its suitable habitat within the protected areas.

3.2. Future Habitat Suitability Modelling and Estimated Portion Protected

The details of predictions for each species varied slightly between the two modelled scenarios, but their general behavior was largely similar (Table 3). All species with current large areas of habitat available are predicted to lose under both future climate scenarios. The picture is more mixed in the species with less habitat currently available to them. In the medium category (10,000–30,000 km2), five of the nine are predicted to have more habitat available in future with Caprimulgus concretus, Bonaparte’s nightjar, being predicted to gain substantially (Table 3). In the species with small areas of suitable habitat currently available, only one, Spilornis kinabaluensis, the Mountain Serpent Eagle, was predicted by both models to lose over a fifth of its currently suitable area; the others are predicted to make habitat gain.
Protected area coverage (%) of suitable habitat is projected to decline for all bird species with small available ranges by 2050. For the four species with more than 30,000 km2 available currently, the percent coverage is mostly projected to increase, though this is largely an artefact of substantial range loss outside PAs (Table 3).
Although the details of predictions for each species varied slightly between the two modelled emissions scenarios, their general behavior was largely similar (Table 3). Although each scenario was analyzed independently, the statistical summaries reflect this similarity and are largely concordant, though the effects of the higher emissions scenario A1-B are more marked (Table 4).
The predicted change in range was not detected to vary between the IUCN categories nor with whether the species preferred a Lowland or Lowland/Montane habitat. The suitable habitat available in 2010 was an effective predictor and greater habitat loss was observed in larger ranges. The portion of the range that lay within a protected area had a similar pattern with systematic variation identified with the area of habitat available in 2010. For this the pattern was a greater loss of habitat protection in small-ranged species than in large-ranged ones (Figure 3a). The portion of range within PAs in 2010 displays a clear visual pattern, but its importance is not statistically convincing in this small data set and may be obscured by the influence of the 2010 area available (Figure 3b and Table 4). This tentatively suggests that species with higher 2010 levels of habitat coverage within protected areas were also predicted to lose most protection under future scenarios.

4. Discussion

4.1. Changes in the Area of Suitable Habitat

In our research we have used a combination of climate change and land cover variables to predict the changes in bird habitat suitability under different future scenarios. Incorporating land cover change dynamics is important for generating robust habitat suitability forecasts. Ignoring the interaction between these can undermine the robust identification of future suitable habitats [8]. Previous research indicates that land-use change is likely to interact with climate change and that these climates–land-use change interactions are likely to have a significant impact on tropical biodiversity [6]. Climate change and vegetation changes are expected to act in conjunction to cause a decline in the species richness of bats of SE Asia circa 2050–2080 under a high emissions scenario [6]. Previous SE Asia wide research has indicated that future forest loss will decrease suitable habitats for threatened birds within PAs [42]. While incorporating landcover change dynamics is important for habitat suitability modelling, the uncertainties in land cover interpretation need to be accounted for [43]. In case of Borneo, it is important to develop regional scale future land cover scenarios such as these [44] which also account for the spread of infrastructure [45] and oil palm plantations.
Both climate and land cover change have been seen to, and, are expected to have future impact on tropical bird biodiversity and the interaction between these factors is projected to increase the impact on bird species by altering the spatial distribution of threats [46]. Looking beyond the frame of our work, projected climate change for the period 2061–2080 is expected to severely inhibit the ability of Borneo’s protected areas to conserve avian species and biodiversity in general; these are expected to have different climatic conditions relative to today [42,47]. Our research examined a subset of Borneo’s threatened avian species and identified “winners” and “losers” under different future scenarios. Further, we identified some of the attributes that potentially make different avian species more vulnerable to losing suitable habitat.
By showing that restricted-range birds are estimated to lose the greatest proportion of suitable habitat we support existing observational and experimental studies that have reported the looming threat of range contractions for smaller-ranged avian species (e.g., in Peruvian and New Guinean birds [48,49], and in a global dataset [50]. Simple temperature change-based modelling predicts that 53% of lowland species face lowland biotic attrition [51], here we did not detect a habitat association and may have been constrained by the particular avian subset used. Our findings do coincide with studies such as those by Freeman et al. [40] and Ramiles-Villegas et al. [52]; in the first, Peruvian lowland birds were seen to expand their ranges, while in the latter birds in the tropical Andes were predicted to be either unaffected or even favored by the warming climatic conditions in 2050, with 45% of birds estimated to undergo expansions in their climate niche in the range of 100% or more. These suggest that lowland bird species can expand their range size as a consequence of the leading edges of their distribution shifting upslope as climate conditions at higher elevations become more agreeable [48]. Climate change can, therefore, result in the promotion of range expansion under some circumstances, for instance when lowland birds prefer drier/warmer conditions that could be provided under future climate change [53]. We find no discernible difference in the predicted change in size of suitable habitat between EN+ and VU categories. This agrees with previous studies of birds in finding that IUCN threat status is not only associated with range size and predictions of range size alteration under future scenarios [54].

4.2. Representation of Threatened Avifauna in the BORNEAN PA Network

The variation in the portion of suitable habitat represented in PAs is substantial among the species used here. Rodrigues et al. proposed a scale of “appropriate representation” relating the habitat available or potential range of a bird species to the proportion of this range that should be protected [55]. For the suitable habitat extents modelled here, these species should achieve 76.9–100% representation of suitable habitat within the PA network. The highest we identify is just over 30% in S. kinabaluensis and this is also the species predicted to fall to around a 10% representation within PAs over the window modelled. Although more than 16% of Borneo is protected, the representation afforded by the PA network suggested by this study—both now and under future scenarios—remains woefully below the levels of adequacy recommended. Although this study does not identify any species with no suitable habitat within PAs, or “gap species”, all species as modelled here classify as “partial gap” species according to the definition of [55] and none are afforded adequate protection. The small-ranged avian species modelled here are highly likely to undergo a greater decline in suitable protected habitat availability and have been identified elsewhere as vulnerable to suitable habitat decline under future climate scenarios [9] and to loss of habitat for such species are rapidly affected by high levels of land cover change [54]. A similar study of range-restricted species in the Andes also suggested a habitat decline in protected areas under different future climate scenarios [25].

4.3. Conservation Implications and Recommendations

There are already very-low to low levels of representation of threatened birds within Bornean PAs, and with land-use change predicted to increase outside of PAs, efforts must be focused towards preserving what little is still protected. This should include efforts to monitor populations of birds in PAs that have been flagged as being potentially at higher risk of habitat decline (e.g., small-ranged and specialist birds). Protected areas do have a positive effect on maintaining the diversity of range-restricted species [56,57,58] and inclusion of existing nature reserves into the formal PA network system was recommended as a way of conserving the habitats of small-ranged birds [59]. Further, protected areas can mitigate the climate change impacts and are an effective tool for conservation in a changing climatic world [60]. However static reserve networks are likely to struggle to account for future climate change scenarios. This message, that areas under protection will have to shift or expand under climate change scenarios is likely universal. Analyses of the habitat dynamics of all vertebrate classes, including identifying refugia and habitat areas that are suitable for species both under present and future climate change scenarios has been recommended [61]. Future conservation in this region could benefit substantially by expanding the protected areas to ensure that their configuration in terms of size and connectivity account for future scenarios [62].
The climate change related variables we identify as the strongest drivers of change in suitable habitat under the future scenarios, precipitation in the driest quarter and isothermality, have been noted in other studies. A global scale analysis revealed that these aspects of climate change remain drivers of species habitat availability, and, in many tropical ecosystems, surpass the importance of land cover change [63]. Borneo, however, faces rapid forest loss with oil palm plantation cultivation driving deforestation and population expansion driving other agriculture. Future oil palm expansion is projected to have a damaging impact on ecosystems worldwide [64,65]. However, no specific Bornean projections exist of the future temporal-spatial distributions of these agricultural plantations and this makes it difficult to quantify habitat availability in the face of future climate change and oil palm expansion. The climate and land use change scenarios modelled here are thus not necessarily representative of real-life trajectories; scenario B1, for example, represents full mitigation of emissions and a decrease in farmland. In reality, we have passed the point of such complete mitigation. Given the current political and economic climate, a business-as-usual scenario predicts that we will reach much higher emissions scenarios than those used by this study. Similarly, decreasing cropland, as predicted in B1, is a scenario that is improbable, given the current population growth trajectory and land conversion rates [26]. Consequently, the effects of some of the patterns reported in this study (e.g., decrease in range size for small-ranged) would almost certainly be magnified under a more realistic scenario. In addition, the omission of certain species-specific factors such as those pertaining to physiology from our model may have resulted in an overestimate of the suitable habitat size of species under future scenarios.

5. Conclusions

Threatened bird species can act as an indicator group for patterns of predicted biodiversity change. Employing climatic, topographic, and land-use variables in maximum-entropy modelling, we find that overall, the threatened avian species found in the lowland and montane regions of Borneo are not predicted to experience vast range size contractions in the next century in either an A1B or a B1 world. Some assemblages, however, may be “losers” (e.g., large-ranged birds) under future scenarios, while others may be “winners” as they are predicted to expand their suitable habitat (e.g., birds with small areas of habitat currently available to them). The majority of modelled suitable habitat, both now and in the future, was found to lie outside of current PA boundaries, with no species approaching the recommended representation targets. This work reinforces conservation messages from other taxa and biogeographic regions. Suggested conservation actions include both localized (e.g., increasing the area and ensuring the persistence of individual upland PAs) and regional-scale (e.g., managing wider landscapes, for example, through retaining selectively logged forests as a complement to PAs) approaches.
Borneo, although undergoing some of the most extensive changes globally in terms of forest conversion and habitat degradation, is not unique in the situation it faces. Southeast Asia generally is not only a biodiversity hotspot, but also a hotspot of threats, and as such, the conservation recommendations we make apply widely.

Supplementary Materials

The following are available online at https://0-www-mdpi-com.brum.beds.ac.uk/2071-1050/13/5/2792/s1, Table S1: The twelve (12) bioclimatic, topographic and land-use variables used as input variables in the MaxEnt modelling.

Author Contributions

M.S.: Conceptualization, Methodology, Software Support, Writing; J.B.-S.: Data Sourcing, Data Curation, Analysis, Draft Preparation; C.M.C.: Oversight, Analysis, Support and Guidance, Writing, Editing. All authors have read and agreed to the published version of the manuscript.

Funding

This research received no external funding.

Institutional Review Board Statement

Not applicable.

Informed Consent Statement

Not applicable.

Data Availability Statement

Data were obtained from various public sources: http://www.ccafs-climate.org (accessed on 1 March 2020). https://www.gbif.org/dataset-classes/ (accessed on 10 March 2020). https://www.unep-wcmc.org/resources-and-data/ (accessed on 1 March 2021). https://www.iucn.org/resources/conservation-tools (accessed on 1 March 2020). https://www.worldclim.org; https://www.worldwildlife.org/pages/conservation-science-data-and-tools (accessed on 1 March 2021).

Acknowledgments

We would like to thank Maria Vinogradova, Mark Burgman and the CEP of Imperial College London for the supportive atmosphere that they provide.

Conflicts of Interest

The authors declare no conflict of interest.

References

  1. Sala, O.E.; Chapin, F.S.; Armesto, J.J.; Berlow, E.; Bloomfield, J.; Dirzo, R.; Huber-Sanwald, E.; Huenneke, L.F.; Jackson, R.B.; Kinzig, A.; et al. Global biodiversity scenarios for the year 2100. Science 2000, 287, 1770–1774. [Google Scholar] [CrossRef]
  2. Myers, N.; Mittermeier, R.A.; Mittermeier, C.G.; Da Fonseca, G.A.B.; Kent, J. Biodiversity hotspots for conservation priorities. Nature 2000, 403, 853–858. [Google Scholar] [CrossRef] [PubMed]
  3. Foden, W.B.; Butchart, S.H.M.; Stuart, S.N.; Vié, J.-C.; Akçakaya, H.R.; Angulo, A.; DeVantier, L.M.; Gutsche, A.; Turak, E.; Cao, L.; et al. Identifying the World’s Most Climate Change Vulnerable Species: A Systematic Trait-Based Assessment of all Birds, Amphibians and Corals. PLoS ONE 2013, 8, e65427. [Google Scholar] [CrossRef] [Green Version]
  4. Curran, L.M.; Trigg, S.N.; McDonald, A.K.; Astiani, D.; Hardiono, Y.M.; Siregar, P.; Caniago, I.; Kasischke, E. Lowland Forest Loss in Protected Areas of Indonesian Borneo. Science 2004, 303, 1000–1003. [Google Scholar] [CrossRef] [Green Version]
  5. Hughes, A.C. Understanding the drivers of Southeast Asian biodiversity loss. Ecosphere 2017, 8, e01624. [Google Scholar] [CrossRef]
  6. Brodie, J.; Post, E.; Laurance, W.F. Climate change and tropical biodiversity: A new focus. Trends Ecol. Evol. 2012, 27, 145–150. [Google Scholar] [CrossRef]
  7. Padoa-Schioppa, E.; Baietto, M.; Massa, R.; Bottoni, L. Bird communities as bioindicators: The focal species concept in agricultural landscapes. Ecol. Indic. 2006, 6, 83–93. [Google Scholar] [CrossRef]
  8. Srinivasan, U.; Wilcove, D.S. Interactive impacts of climate change and land-use change on the demography of montane birds. Ecology 2021, 102, e03223. [Google Scholar] [CrossRef]
  9. Sekercioglu, C.H.; Schneider, S.H.; Fay, J.P.; Loarie, S.R. Climate Change, Elevational Range Shifts, and Bird Extinctions. Conserv. Biol. 2007, 22, 140–150. [Google Scholar] [CrossRef] [PubMed]
  10. Smeraldo, S.; Bosso, L.; Fraissinet, M.; Bordignon, L.; Brunelli, M.; Ancillotto, L.; Russo, D. Modelling risks posed by wind turbines and power lines to soaring birds: The black stork (Ciconia nigra) in Italy as a case study. Biodivers. Conserv. 2020, 29, 1959–1976. [Google Scholar] [CrossRef]
  11. Machar, I.; Poprach, K.; Harmacek, J.; Fialova, J. Bird Diversity as a Support Decision Tool for Sustainable Management in Temperate Forested Floodplain Landscapes. Sustainability 2019, 11, 1527. [Google Scholar] [CrossRef] [Green Version]
  12. Sohl, T.L. The Relative Impacts of Climate and Land-Use Change on Conterminous United States Bird Species from 2001 to 2075. PLoS ONE 2014, 9, e112251. [Google Scholar] [CrossRef] [PubMed]
  13. Wauchope, H.; Shaw, J.; Varpe, Ø.; Lappo, E.; Boertmann, D.; Lanctot, R.; Fuller, R.A. Rapid climate-driven loss of breeding habitat for Arctic migratory birds. Glob. Chang. Biol. 2017, 23, 1085–1094. [Google Scholar] [CrossRef] [PubMed]
  14. Titeux, N.; Henle, K.; Mihoub, J.-B.; Regos, A.; Geijzendorffer, I.R.; Cramer, W.; Verburg, P.H.; Brotons, L. Biodiversity scenarios neglect future land-use changes. Glob. Chang. Biol. 2016, 22, 2505–2515. [Google Scholar] [CrossRef] [PubMed] [Green Version]
  15. da Silva, M.X.; Paviolo, A.; Tambosi, L.; Pardini, R. Effectiveness of Protected Areas for biodiversity conservation: Mammal occupancy patterns in the Iguaçu National Park, Brazil. J. Nat. Conserv. 2018, 41, 51–62. [Google Scholar] [CrossRef]
  16. Di Minin, E.; Toivonen, T. Global Protected Area Expansion: Creating More than Paper Parks. Bioscience 2015, 65, 637–638. [Google Scholar] [CrossRef] [Green Version]
  17. Tantipisanuh, N.; Savini, T.; Cutter, P.; Gale, G.A. Biodiversity gap analysis of the protected area system of the Indo-Burma Hotspot and priorities for increasing biodiversity representation. Biol. Conserv. 2016, 195, 203–213. [Google Scholar] [CrossRef]
  18. Hannah, L.; Midgley, G.; Andelman, S.; Araújo, M.; Hughes, G.; Martinez-Meyer, E.; Pearson, R.; Williams, P. Protected area needs in a changing climate. Front. Ecol. Environ. 2007, 5, 131–138. [Google Scholar] [CrossRef]
  19. Dinerstein, E.; Olson, D.; Joshi, A.; Vynne, C.; Burgess, N.D.; Wikramanayake, E.; Hahn, N.; Palminteri, S.; Hedao, P.; Noss, R.; et al. An Ecoregion-Based Approach to Protecting Half the Terrestrial Realm. Bioscience 2017, 67, 534–545. [Google Scholar] [CrossRef]
  20. Sodhi, N.S.; Smith, K.G. Conservation of tropical birds: Mission possible? J. Ornithol. 2007, 148, 305–309. [Google Scholar] [CrossRef]
  21. Radosavljevic, A.; Anderson, R.P. Making better Maxent models of species distributions: Complexity, overfitting and evaluation. J. Biogeogr. 2014, 41, 629–643. [Google Scholar] [CrossRef]
  22. Hughes, A.; Satasook, C.; Bates, P.; Bumrungsri, S.; Jones, G. The projected effects of climatic and vegetation changes on the distribution and diversity of Southeast Asian bats. Glob. Chang. Biol. 2012, 18, 1854–1865. [Google Scholar] [CrossRef]
  23. Fick, S.E.; Hijmans, R.J. WorldClim 2: New 1-km spatial resolution climate surfaces for global land areas. Int. J. Climatol. 2017, 37, 4302–4315. [Google Scholar] [CrossRef]
  24. Porfirio, L.; Harris, R.; Lefroy, E.; Hugh, S.; Gould, S.; Lee, G.; Bindoff, N.L.; Mackey, B. Improving the use of species distribution models in con-servation planning and management under climate change. PLoS ONE 2014, 9, e113749. [Google Scholar] [CrossRef] [Green Version]
  25. Avalos, V.d.R.; Hernández, J. Projected distribution shifts and protected area coverage of range-restricted Andean birds under climate change. Glob. Ecol. Conserv. 2015, 4, 459–469. [Google Scholar] [CrossRef]
  26. Li, X.; Chen, G.; Liu, X.; Liang, X.; Wang, S.; Chen, Y.; Pei, F.; Xu, X. A New Global Land-Use and Land-Cover Change Product at a 1-km Resolution for 2010 to 2100 Based on Human–Environment Interactions. Ann. Am. Assoc. Geogr. 2017, 107, 1040–1059. [Google Scholar] [CrossRef]
  27. Singh, M.; Cheyne, S.; Ehlers Smith, D. How conspecific primates use their habitats: Surviving in an anthropogenically-disturbed forest in Central Kalimantan, Indonesia. Ecol. Indic. 2018, 87, 167–177. [Google Scholar] [CrossRef]
  28. Pasquale, G.D.; Saracino, A.; Bosso, L.; Russo, D.; Moroni, A.; Bonanomi, G.; Allevato, E. Coastal pine-oak glacial refugia in the Mediterranean basin: A biogeographic approach based on charcoal analysis and spatial modelling. Forests 2020, 11, 673. [Google Scholar] [CrossRef]
  29. Phillips, S.J.; Anderson, R.P.; Dudík, M.; Schapire, R.E.; Blair, M.E. Opening the black box: An open-source release of Maxent. Ecography 2017, 40, 887–893. [Google Scholar] [CrossRef]
  30. Srivastava, V.; Roe, A.D.; Keena, M.A.; Hamelin, R.C.; Griess, V.C. Oh the places they’ll go: Improving species distribution modelling for invasive forest pests in an uncertain world. Biol. Invasions 2021, 23, 297–349. [Google Scholar] [CrossRef]
  31. Phillips, S.; Dudík, M. Modeling of species distributions with Maxent: New extensions and a comprehensive evaluation. Ecography 2008, 31, 161–175. [Google Scholar] [CrossRef]
  32. Urbina-Cardona, J.; Loyola, R. Applying Niche-Based Models to Predict Endangered-Hylid Potential Distributions: Are Neotropical Protected Areas Effective Enough? Trop. Conserv. Sci. 2008, 1, 417–445. [Google Scholar] [CrossRef]
  33. Cameron, A.; Trivedi, P.K. Microeconometrics: Methods and Applications; Cambridge University Press: Cambridge, NY, USA, 2005. [Google Scholar]
  34. Allouche, O.; Tsoar, A.; Kadmon, R. Assessing the accuracy of species distribution models: Prevalence, kappa and the true skill statistic (TSS). J. Appl. Ecol. 2006, 43, 1223–1232. [Google Scholar] [CrossRef]
  35. Peterson, A.; Papeş, M.; Soberón, J. Rethinking receiver operating characteristic analysis applications in ecological niche modeling. Ecol Model. 2008, 213, 63–72. [Google Scholar] [CrossRef]
  36. Wisz, M.; Hijmans, R.; Li, J.; Peterson, A.; Graham, C.; Guisan, A.; NCEAS Predicting Species Distributions Working Group. Effects of sample size on the performance of species distribution models. Divers. Distrib. 2008, 14, 763–773. [Google Scholar] [CrossRef]
  37. Coxen, C.L.; Frey, J.K.; Carleton, S.A.; Collins, D.P. Species distribution models for a migratory bird based on citizen science and satellite tracking data. Glob. Ecol. Conserv. 2017, 11, 298–311. [Google Scholar] [CrossRef]
  38. Nazeri, M.; Jusoff, K.; Madani, N.; Mahmud, A.; Bahman, A.; Kumar, L. Predictive modeling and mapping of Malayan Sun Bear (Helarctos malayanus) distribution using maximum entropy. PLoS ONE 2012, 7, e48104. [Google Scholar] [CrossRef] [Green Version]
  39. Escalante, T.; Rodríguez-Tapia, G.; Linaje, M.; Illoldi-Rangel, P.; González-López, R. Identification of areas of endemism from species distribution models: Threshold selection and Nearctic mammals. TIP 2013, 16, 5–17. [Google Scholar] [CrossRef]
  40. Freeman, B.; Sunnarborg, J.; Peterson, A.T. Effects of climate change on the distributional potential of three range-restricted West African bird species. Condor 2019, 121. [Google Scholar] [CrossRef]
  41. R Foundation for Statistical Computing VA. R Foundation for Statistical Computing RCT. R: A Language and Environment for Statistical Computing. Austria: R Foundation for Statistical Computing, Vienna, Austria. 2020. Available online: https://www.R-project.org/ (accessed on 1 March 2020).
  42. Singh, M. Evaluating the impact of future climate and forest cover change on the ability of Southeast (SE) Asia’s protected areas to provide coverage to the habitats of threatened avian species. Ecol. Indic. 2020, 114, 106307. [Google Scholar] [CrossRef]
  43. Brus, J.; Pechanec, V.; Machar, I. Depiction of uncertainty in the visually interpreted land cover data. Ecol. Inform. 2018, 47, 10–13. [Google Scholar] [CrossRef]
  44. Struebig, M.J.; Fischer, M.; Gaveau, D.L.; Meijaard, E.; Wich, S.A.; Gonner, C.; Sykes, R.; Wilting, A.; Kramer-Schadt, S. Anticipated climate and land-cover changes reveal refuge areas for Borneo’s orang-utans. Glob. Chang. Biol. 2015, 21, 2891–2904. [Google Scholar] [CrossRef]
  45. Alamgir, M.; Campbell, M.J.; Sloan, S.; Suhardiman, A.; Supriatna, J.; Laurance, W.F. High-risk infrastructure projects pose imminent threats to forests in Indonesian Borneo. Sci. Rep. 2019, 9, 1–10. [Google Scholar] [CrossRef]
  46. Mantyka-Pringle, C.; Visconti, P.; Di Marco, M.; Martin, T.; Rondinini, C.; Rhodes, J. Climate change modifies risk of global bio-diversity loss due to land-cover change. Biol. Conserv. 2015, 187, 103–111. [Google Scholar] [CrossRef] [Green Version]
  47. Scriven, S.; Hodgson, J.; McClean, C.; Hill, J. Protected areas in Borneo may fail to conserve tropical forest biodiversity under climate change. Biol. Conserv. 2015, 184, 414–423. [Google Scholar] [CrossRef] [Green Version]
  48. Freeman, B.; Class Freeman, A. Rapid upslope shifts in New Guinean birds illustrate strong distributional responses of tropical montane species to global warming. Proc. Natl. Acad. Sci. USA 2014, 111, 4490–4494. [Google Scholar] [CrossRef] [Green Version]
  49. Freeman, B.; Scholer, M.; Ruiz-Gutierrez, V.; Fitzpatrick, J. Climate change causes upslope shifts and mountaintop extirpa-tions in a tropical bird community. Proc. Natl. Acad. Sci. USA 2018, 115, 11982–11987. [Google Scholar] [CrossRef]
  50. La Sorte, F.; Jetz, W. Projected range contractions of montane biodiversity under global warming. Proc. Biol. Sci. 2010, 277, 3401–3410. [Google Scholar] [CrossRef] [PubMed] [Green Version]
  51. Colwell, R.; Brehm, G.; Cardelús, C.; Gilman, A.; Longino, J. Global warming, elevational range shifts, and lowland biotic attrition in the wet tropics. Science 2008, 322, 258–261. [Google Scholar] [CrossRef] [PubMed] [Green Version]
  52. Ramirez-Villegas, J.; Cuesta, F.; Devenish, C.; Peralvo, M.; Jarvis, A.; Arnillas, C. Using species distributions models for designing conservation strategies of Tropical Andean biodiversity under climate change. J. Nat. Conserv. 2014, 22, 391–404. [Google Scholar] [CrossRef] [Green Version]
  53. Jose, V.S.; Nameer, P. The expanding distribution of the Indian Peafowl (Pavo cristatus) as an indicator of changing climate in Kerala, southern India: A modelling study using Maxent. Ecol. Indic. 2020, 110, 105930. [Google Scholar] [CrossRef]
  54. Velásquez-Tibatá, J.; Salaman, P.; Graham, C. Effects of climate change on species distribution, community structure, and conservation of birds in protected areas in Colombia. Reg. Environ. Chang. 2013, 13, 235–248. [Google Scholar] [CrossRef]
  55. Rodrigues, A.; Akçakaya, H.; Andelman, S.; Bakarr, M.; Boitani, L.; Brooks, T.; Chanson, J.S.; Fishpool, L.D.C.; Da Fonseca, G.A.B.; Gaston, K.J.; et al. Global Gap Analysis: Priority Regions for Expanding the Global Protected-Area Network. Bioscience 2004, 54, 1092. [Google Scholar] [CrossRef]
  56. Cazalis, V.; Princé, K.; Mihoub, J.B.; Kelly, J.; Butchart, S.; Rodrigues, A. Effectiveness of protected areas in conserving tropical forest birds. Nat. Commun. 2020, 11, 4461. [Google Scholar] [CrossRef] [PubMed]
  57. Bosso, L.; Smeraldo, S.; Rapuzzi, P.; Sama, G.; Garonna, A.P.; Russo, D. Nature protection areas of Europe are insufficient to preserve the threatened beetle Rosalia alpina (Coleoptera: Cerambycidae): Evidence from species distribution models and conservation gap analysis. Ecol. Entomol. 2018, 43, 192–203. [Google Scholar] [CrossRef]
  58. Hickcox, R.P.; Jara, M.; Deacon, L.A.K.; Harvey, L.P.; Pincheira-Donoso, D. Global terrestrial distribution of penguins (Spheniscidae) and their conservation by protected areas. Biodivers. Conserv. 2019, 28, 2861–2876. [Google Scholar] [CrossRef]
  59. De Klerk, H.; Fjeldså, J.; Blyth, S.; Burgess, N. Gaps in the protected area network for threatened Afrotropical birds. Biol. Conserv. 2004, 117, 529–537. [Google Scholar] [CrossRef] [Green Version]
  60. Gaüzère, P.; Jiguet, F.; Devictor, V. Can protected areas mitigate the impacts of climate change on bird’s species and communities? Divers. Distrib. 2016, 22, 625–637. [Google Scholar] [CrossRef] [Green Version]
  61. Garden, J.; O’Donnell, T.; Catterall, C. Changing habitat areas and static reserves: Challenges to species protection under climate change. Landsc. Ecol. 2015, 30, 1959–1973. [Google Scholar] [CrossRef]
  62. Wan, J.; Wang, C.; Han, S.; Yu, J. Planning the priority protected areas of endangered orchid species in northeastern China. Biodivers. Conserv. 2014, 23, 1395–1409. [Google Scholar] [CrossRef]
  63. Newbold, T. Future effects of climate and land-use change on terrestrial vertebrate community diversity under different scenarios. Proc. Biol. Sci. 2018, 285, 1881. [Google Scholar] [CrossRef]
  64. Sharma, S.; Baral, H.; Laumonier, Y.; Okarda, B.; Komarudin, H.; Purnomo, H.; Pacheco, P. Ecosystem services under future oil palm expansion scenarios in West Kalimantan, Indonesia. Ecosyst. Serv. 2019, 39, 100978. [Google Scholar] [CrossRef]
  65. Savolainen, V.; Clottey, V.A.; Doubi, B.T.S.; Konan, J.L.; Quain, M.; Bezeng, B.S.; Logah, V.; Wireko-Kena, A.; Osekre, E.A.; Atuah, L.; et al. Systems thinking creates opportunities for a circular economy and sustainable palm agriculture in Africa. Curr. Res. Environ. Sustain. 2020, 1, 31–34. [Google Scholar] [CrossRef]
Figure 1. The seven terrestrial ecoregions of Borneo (as defined by the World-Wide Fund for Nature (WWF) with data from Dinerstein et al. [19].
Sustainability 13 02792 g001
Figure 2. Protected Area Network Protected areas of Borneo, classified according to their IUCN category. Mapped in ArcMap using data taken from UNEP-WCMC (UN Environment Programme World Conservation Monitoring Centre) and Protected Planet (2019).
Sustainability 13 02792 g002
Figure 3. Change in percentage of suitable habitat lying within a Protected Area (PA) by (a) estimated area of suitable habitat in 2010 and (b) The portion of this that lay within a PA in 2010. Two future scenarios were modelled independently: A1-B (Medium–high emissions) and B1 (Low emissions).
Sustainability 13 02792 g003
Table 1. The bird species included in this dataset along with their International Union for the Conservation of Nature (IUCN) classification and habitat preferences.
Species (Latin)Species (Common)IUCN CategoryHabitat Preference
Aceros corrugatusWrinkledHornbillENLowland evergreen forest extends into the selectively logged forest (Kemp, A.C, Boesman, P and Sharpe, 2019)
Anthracoceros malayanusBlack hornbillVULowland primary forest, mostly <200 m, very occasionally up to 600 m (Kemp, Boesman and Sharpe, 2019)
Berenicornis comatusWhite-crowned hornbillENPrimary lowland and sometimes montane forest up to 1675 m (A. C. Kemp and Boesman, 2019b)
Buceros rhinocerosRhinoceros hornbillVUPrimary lowland forest, extending into the secondary forest up to 1400 m (A. C. Kemp and Boesman, 2019a)
Caprimulgus concretusBonaparte’s NightjarVULowland dipterocarp forest and secondary growth, sea level to <500 m (Cleere and Sharpe, 2019)
Centropus rectunguisCentropus rectunguisVUThe undergrowth of lowland forest (Payne and de Juana, 2019)
Chloropsis sonneratiGreater green leafbirdVULowland evergreen forest, extending up to 1100 m (Wells and Sharpe, 2019)
Ciconia stormiStorm’s storkENUndisturbed lowland forest
Cyornis caerulatusSunda Blue FlycatcherVULowland dipterocarp forest, sea-level to <500 m (Clement, 2019)
Hydrornis baudiiblue-headed pittaVULowland primary forest extends up to 600 m (Erritzoe, 2019)
Leptoptilos javanicusLesser adjutantVUMangroves, coastland wetlands adjacent to lowland forest
Mulleripicus pulverulentusGreat slaty woodpeckerVUSemi-open tropical lowland forests, extending up to 2000 m (Winkler, Christie and Kirwan, 2019)
Nisaetus nanusWallace’s hawk-eagleVULowland forest, rarely up to 1000 m (Clark and Kirwan, 2019)
Psittacula longicaudaLong-tailed parakeetVUExtreme lowland, <300 m (Collar and Sharpe, 2019)
Ptilocichla leucogrammicaBornean wren-babblerVULowland dipterocarp forest extends into the montane forest (Collar and Robson, 2019)
Rhinoplax vigilHelmeted hornbillCRExtends up to 1500 m (Kemp, Sharpe and Boesman, 2019)
Rhyticeros undulatusWreathed hornbillVUOccasionally lowland forest extends up to 2560 m (A. Kemp and Boesman, 2019)
Setornis crinigerhook-billed bulbulVULowland forest, extending up to 1000 m (Myers, 2016b)
Spilornis kinabaluensisMountain serpent eagleVUMontane and sub-montane forests, preferably ridgetops, 750–2900 m (Clark, Kirwan and Christie, 2019)
Treron capelleilarge green pigeonVULowland forest, preferably primary forest (Baptista et al., 2019)
Table 2. The area of suitable habitat available to each bird species under the modelled current (2010) scenario and the percent of this suitable habitat that currently lies within a protected area (PA).
Available Range SizeIUCN StatusSpeciesHabitat TypeSuitable Available Habitat (km2)Habitat within
a PA (%)
LargeVUBuceros rhinocerosLowland/Montane36,40011.1
VUPtilocichla leucogrammicaLowland/Montane44,6166.16
CRRhinoplax vigilLowland50,1665.9
VURhyticeros undulatusLowland/Montane41,20018.2
MediumVUAnthracoceros malayanusLowland25,5549.6
ENBerenicornis comatusLowland/Montane12,72113.4
VUCaprimulgus concretusLowland10,43120.5
VUCentropus rectunguisLowland15,40414.2
VUCyornis caerulatusLowland21,76015.5
VUHydrornis baudiiLowland25,54214.9
VUMulleripicus pulverulentusLowland/Montane22,2928.6
VUPsittacula longicaudaLowland21,3946.7
VUTreron capelleiLowland15,7023.4
SmallVUAceros corrugatusLowland88448.2
ENCiconia stormiLowland395011.5
VULeptoptilos javanicusLowland59576.5
VUNisaetus nanusLowland963916.4
VUSpilornis kinabaluensisLowland/Montane788130.2
Table 3. Predicted changes (%) in suitable habitat availability on the island of Borneo and the change in portion (%) of a species’ range that lies within a protected area between 2010 and 2050. Two future scenarios were modelled independently, A1-B (Medium–high emissions) and B1 (Low emissions).
Available Range SizeIUCN StatusSpeciesPredicted Change in Range Size over the 2010–2050 Window (%)Predicted Change in the Portion of the Range Found within a PA over the 2010–2050 Window (%)
Scenario A1-BScenario B1Scenario A1-BScenario B1
LargeVUBuceros rhinoceros−10.41−7.100.67−2.53
VUPtilocichla leucogrammica−71.22−66.206.164.14
CRRhinoplax vigil−32.15−37.452.010.79
VURhyticeros undulatus−12.12−3.911.10−2.82
MediumVUAnthracoceros malayanus19.2137.74−3.59−4.11
ENBerenicornis comatus22.2651.09−3.80−6.50
VUCaprimulgus concretus292.22207.51−11.90−13.86
VUCentropus rectunguis13.4926.09−7.44−8.44
VUCyornis caerulatus−5.58−25.75−0.270.88
VUHydrornis baudii−31.47−30.462.391.09
VUMulleripicus pulverulentus−6.572.08−2.96−4.41
VUPsittacula longicauda9.3227.34−2.97−3.88
VUTreron capellei−16.57−2.011.900.93
SmallVUAceros corrugatus67.3139.15−2.52−3.99
ENCiconia stormi16.6319.18−4.64−5.14
VULeptoptilos javanicus19.2521.67−2.38−3.63
VUNisaetus nanus79.4984.81−10.12−10.65
VUSpilornis kinabaluensis−20.94−24.49−6.73−5.01
Table 4. Statistical summary of the deletion tests of the variables assessed as potentially associated with the change in range size, and the percentage of range protected for eighteen Bornean bird species between 2010 and 2050. The calculated F-ratio (F), the degrees of freedom (d.f.) associated with the comparison and its probability (p) are presented.
Scenario B1 Predictions
(Low Emissions)
Scenario A1B Predictions
(Medium–High Emissions)
Predicted Change in Suitable Habitat between 2010 and 2050
Fd.f.peffectFd.f.pEffect
IUCN Category0.091,130.77none detected0.001,130.97none detected
Habitat0.281,140.60none detected1.101,140.31none detected
Current (2010) area available9.351,150.008Greater loss for large ranged-species11.241,150.004Greater loss for large ranged- species
Predicted change in the proportion of the suitable habitat within a currently protected area between 2010 and 2050
Fd.f.peffectFd.f.pEffect
IUCN Category0.081,130.78None detected0.081,130.77None detected
Habitat0.111,140.77None detected1.041,140.33None detected
Current (2010) coverage in PAs2.451,150.14None detected4.391,150.05None detected
Current (2010) area available8.931,160.008Most loss at higher initial coverage13.241,160.002Most loss at higher initial coverage
Publisher’s Note: MDPI stays neutral with regard to jurisdictional claims in published maps and institutional affiliations.

