
Deploying Resilience Enablers to Mitigate Risks in Sustainable Fashion Supply Chains


1
Institute of Industrial Engineering, School of Transportation, FuJian University of Technology, Fuzhou 350118, China
2
Institute of Industrial Management, College of Management, National Formosa University, Yunlin 632, Taiwan
3
Faculty of Economics and Business, University of Groningen, 9747 Groningen, The Netherlands
*
Authors to whom correspondence should be addressed.
Sustainability 2021, 13(5), 2943; https://0-doi-org.brum.beds.ac.uk/10.3390/su13052943
Submission received: 2 February 2021
/
Revised: 1 March 2021
/
Accepted: 3 March 2021
/
Published: 8 March 2021
(This article belongs to the Special Issue Sustainable Supply Chain: Operations Management and Technical Research)
Abstract
:The complex structure of supply chains makes them vulnerable to risk, so enhancing their resilience is an important goal. In particular, fashion supply chain research has identified two important issues that need to be addressed: sustainability and risk. However, investigation of these issues is relatively sparse and has primarily been independent with little combinatory research. Therefore, it is crucial to develop a risk mitigation method that can maximize the resilience of sustainable supply chains for fashion companies. The objective of this study is to develop an integrated quality function deployment approach and to mitigate supply chain risk by deploying resilience capabilities and resilience-enhancing features, thus ultimately providing the fashion industry with a useful approach for the development of resilient, sustainable supply chains. Using a fashion company as an example, the practicability of the proposed approach is verified. To strengthen resilience and thus mitigate key risks, it is found that the most urgent tasks are to reallocate the company’s resources, to carry out the real-time monitoring of risk on the spot, to share the risk responsibility, and to establish an incentive system. When these features are strengthened, agility and adaptability can be improved, and finally, the risks of supplier delays, natural disasters, political instability, and problematic supplier materials with the greatest impact can be alleviated. This study provides a new strategy for the fashion industry for the implementation of resilient, sustainable supply chains to mitigate risks.
1. Introduction
Global supply chains are complex, consisting of different organisations at multiple levels and in different geographical locations [1]. Fashion supply chains employ more than 60 million people globally and are worth more than US$2.5 trillion. These supply chains are characterized by mass production and the sale of products in markets with uncertain demand [2]. In this complex environment, fashion supply chain uncertainty and risk have increased due to intense competition, the impact of globalization, the diversity of technical solutions, and the high expectations of customers [3]. As a result, greater attention has been paid to risk management, and uncertainty and contingencies in sustainable supply chains have started to be carefully considered.
The fashion industry is resource intensive and is widely considered wasteful and environmentally destructive [4]. According to the UN Conference on Trade and Development (2019), the fashion industry is the second most polluting industry in the world. It uses approximately 93 billion m3 of water every year, which is enough to meet the needs of 5 million people. It also consumes around 500,000 tons of microfibers, equivalent to 3 million barrels of oil discarded into oceans every year. The industry also emits more carbon than all international flights and sea transport combined. In addition to environmental concerns, the fashion industry is labour-intensive and raises many social and ethical issues [5,6]. The ‘fast fashion’ business model has achieved remarkable success in recent years. Its low prices and rapid product rotation encourage excessive consumption, leading to unsustainable practices in the supply chain, thereby bringing negative ecological and social impact [7]. These data have increased the consumer demand for sustainable fashion and shifted the attention of fashion brands on sustainable development [8,9].
Indeed, the integration of sustainable practices in sustainable fashion supply chains (SFSCs) has become an area of increasing concern due to global competition and tighter regulations [10]. In particular, over the past two decades, companies in global supply chains have been under pressure to achieve three-dimensional sustainability (i.e., social, environmental, and economic). However, it is still difficult to establish sustainable supply chain management to achieve three-dimensional sustainability [11]. In addition, because there is a great deal of uncertainty at many stages of a supply chain, any organisation that focuses only on results and ignores risk that may affect its sustainability will face significant instability [12,13]. To address these sustainable risks and changes, players in the fashion industry should reformulate their strategy by having at their disposal sustainable policies that can foster improved resilience [14].
To ensure sustainability, supply chains need to be resilient [15,16,17]. Sustainability has become a primary focus of supply chains, and resilience is necessary to achieve sustainability targets [18]. Resilience is an effective way to manage risk and recover from supply chain disruption [19,20]. Resilient supply chains have the ability to return to their original state or to advance to an improved state [21,22,23,24]. Hosseini et al. (2019) presented a hierarchal structure for resilient supply chains, with the bottom level occupied by resilience-enhancing features (RFs), which enhance resilience capabilities (RCs) [25]. As RFs constitute RCs, both are critical to the mitigation of supply chain risk. However, more attention has been paid to RCs in the literature, while RFs have seldom been addressed, and the interaction between the two has not been fully explored. Furthermore, to the best of the authors’ knowledge, there has been no analysis of their role in SFSC risk resilience.
Given the importance of SFSC risk resilience, this paper adopts quality function deployment (QFD) to prioritize RFs for the fashion industry from the perspective of the supply chain, taking both risk and RCs into account. QFD originated in Japan in 1972 to evaluate new product designs based on customer input and was first applied to improve the design of new oil tankers [26,27]. QFD is a flexible system that converts customer requirements into design requirements and uses a House of Quality (HoQ) matrix to identify correlations at each stage, including product design, manufacturing, and distribution [28]. QFD has become more popular and has been extended for use in supply chains [17,29,30,31,32].
Though resilience is an important factor in achieving sustainable supply chain performance, the QFD approach has seldom been used to enhance the risk resilience of sustainable supply chains. A previous study employed a Kano-QFD-DEMATEL approach to optimize the risk resilience for sustainable supply chains [17], but it did not follow the hierarchical structure of resilient supply chains proposed by Hosseini et al. (2019) [25], nor did it use QFD to connect risks, RCs, and RFs, let alone sustainable fashion supply chains. Furthermore, fashion supply chain research has identified two important issues of sustainability and risk. However, investigation of these issues is relatively sparse and has primarily been independent with little combinatory research, despite their important interrelationships [33]. Therefore, the objective of this study is to develop an integrated QFD approach and to identify major risks by deploying RCs and RFs for the fashion industry to mitigate supply chain risk and establish resilient SFSCs. The aim is also to investigate the relationships between these three sets of variables (Risks, RCs, and RFs) and ultimately to prioritize resilience approaches for the fashion industry. This study makes a practical contribution to the fashion industry in establishing resilient SFSCs. Other actors and stakeholders involved in SFSCs will also be interested in the results of this study because their business performance is affected by their level of resilience. This paper aims to accomplish the research objective and apply the QFD approach so that resilience can be used to mitigate risk in SFSCs.
After the introduction, the next section reviews the related literature. Section 3 presents the methodology, while Section 4 explains the results and provides discussions. An empirical case study of fashion company is presented to demonstrate the practicality of the proposed approach. Section 5 is the last section which outlines the main conclusions and contributions of the study.
2. Literature Review
Sustainable fashion as an emerging discipline has gained more attention recently among researchers. Sustainable fashion areas for future research, as classified by Mukendi et al. (2020), include (1) supply chains, (2) retailing, (3) consumer behavior, (4) sustainable fashion business models, (5) social marketing interventions, (6) consumer practices and communities and (7) future leaders [34]. These fields are in fact interconnected with SFSCs, and this study draw the link between risks and resilience in SFSCs.
2.1. Sustainable Fashion Supply Chain Risk
Many researchers have shown that modern supply chains face a greater range of risk than supply chain managers can identify [35]. However, while the literature on supply chain risk management is very rich [36,37,38,39,40,41], research in this vein in the context of fashion supply chains is limited. Wang et al. (2012) developed a model for risk assessment of implementing green initiatives in the fashion supply chain [42]. Choi (2013) provided a game theoretic analysis of multi-period fashion supply chain with a risk averse retailer [43]. Xu et al. (2013) investigated the channel coordination in a fashion supply chain with risk-averse retailer and price-dependent demand [44]. Mehrjoo and Pasek (2016) conducted a risk assessment for the supply chain of the fashion industry [45]. Martino et al. (2017) prioritised supply chain risks in the fashion retail industry by analytic network process approach [46]. Choi (2018) uncovered the impacts by the retailer’s risk averse behavior on the quick response fashion supply chains [47]. Fierro Hernandez and Haddud (2018) unveiled the elements driving the supply chain risk strategies by followng a social constructivist approach oriented to fashion organisations outsourcing to China [48]. McMaster et al. (2020) analyzed the widespread and catalytic implications of the 2020 COVID-19 pandemic on the supply chain risks of fashion multinational corporations [49]. Moreover, the literature on SFSC risk is even scarcer. Choi and Chiu (2012) explored mean-downside-risk and mean-variance newsvendor models for sustainable fashion retailing [50]. Rafi-Ul-Shan et al. (2018) reviewed the relationship between sustainability and risk management in fashion supply chains [33]. Xu et al. (2019) developed a framework to evaluate supply chain sustainability risk for the apparel and automotive industry [51].
There has been little substantial research on risk in SFSCs [33], and there has been no unified approach to risk classification. As individual fashion companies face different risks, a committee made up of supply chain experts from the case study company used the KJ method to generate risk factors. After brainstorming, an objective group consensus was obtained, and five types of risk were identified: production, management, information, supply/demand, and environmental risks. Conventional sustainability covers social, environmental and economic aspects [52]. However, these three dimensions do not handle the entire system of an organisation. Therefore, Iddrisu and Bhattacharyya (2015) proposed a five-dimensional sustainability model, which considers the social, environmental, economic, technical and institutional dimensions [53]. Valinejad and Rahmani (2018) adopted a five-dimensional approach to assess risks in the telecommunications sector [3]. Moktadir (2021) also used the five-dimensional method to identify 30 potential risk factors in the Bangladesh leather industry [54]. After analysing the five risk types and 22 supply chain risks, we consider the five-dimensional sustainability model applicable to our study.
2.2. Sustainable Fashion Supply Chain Resilience
In recent years, research on supply chain resilience has become increasingly common in various fields [41,55,56,57,58,59,60,61,62,63,64,65,66], but research in a fashion context is still relatively sparse. Bevilacqua et al. (2019) developed a fuzzy cognitive maps approach for analyzing the domino effect of factors affecting fashion supply chain resilience [67]. Moreover, the literature on SFSC resilience is even scarcer. Mari et al. (2016) analyzed sustainable and resilient garment supply chain network design with fuzzy multi-objectives under uncertainty [18]. To date, related studies remain lacking. Based on a comprehensive review of the literature, this study summarizes 24 RCs and 26 RFs as shown in Table 1 and Table 2. These capabilities and features are evaluated in Section 4.
3. Methodology
The case study company is China’s leading fashion brand enterprise, and its core products have occupied the market leader position. The company adopts the business vertical integration mode, set brand promotion, research and development design, production, and sales as one to meet the needs of diverse consumers on different occasions. The company passed the IS09001 quality management system and product quality certification, ensuring its products aligned with the IS014001 environmental management system and environmental product certification in China. At present, the huge population in the country constitutes a huge fashion consumption market. With the increase in residents’ income, the fashion industry’s sales growth plays a big role in driving the economy. The China sustainable fashion consumption report (2020) stated that fashion product sustainable attributes would lead consumers to have rational and mature judgment and choice instead of short-term decisions under impulse buying.
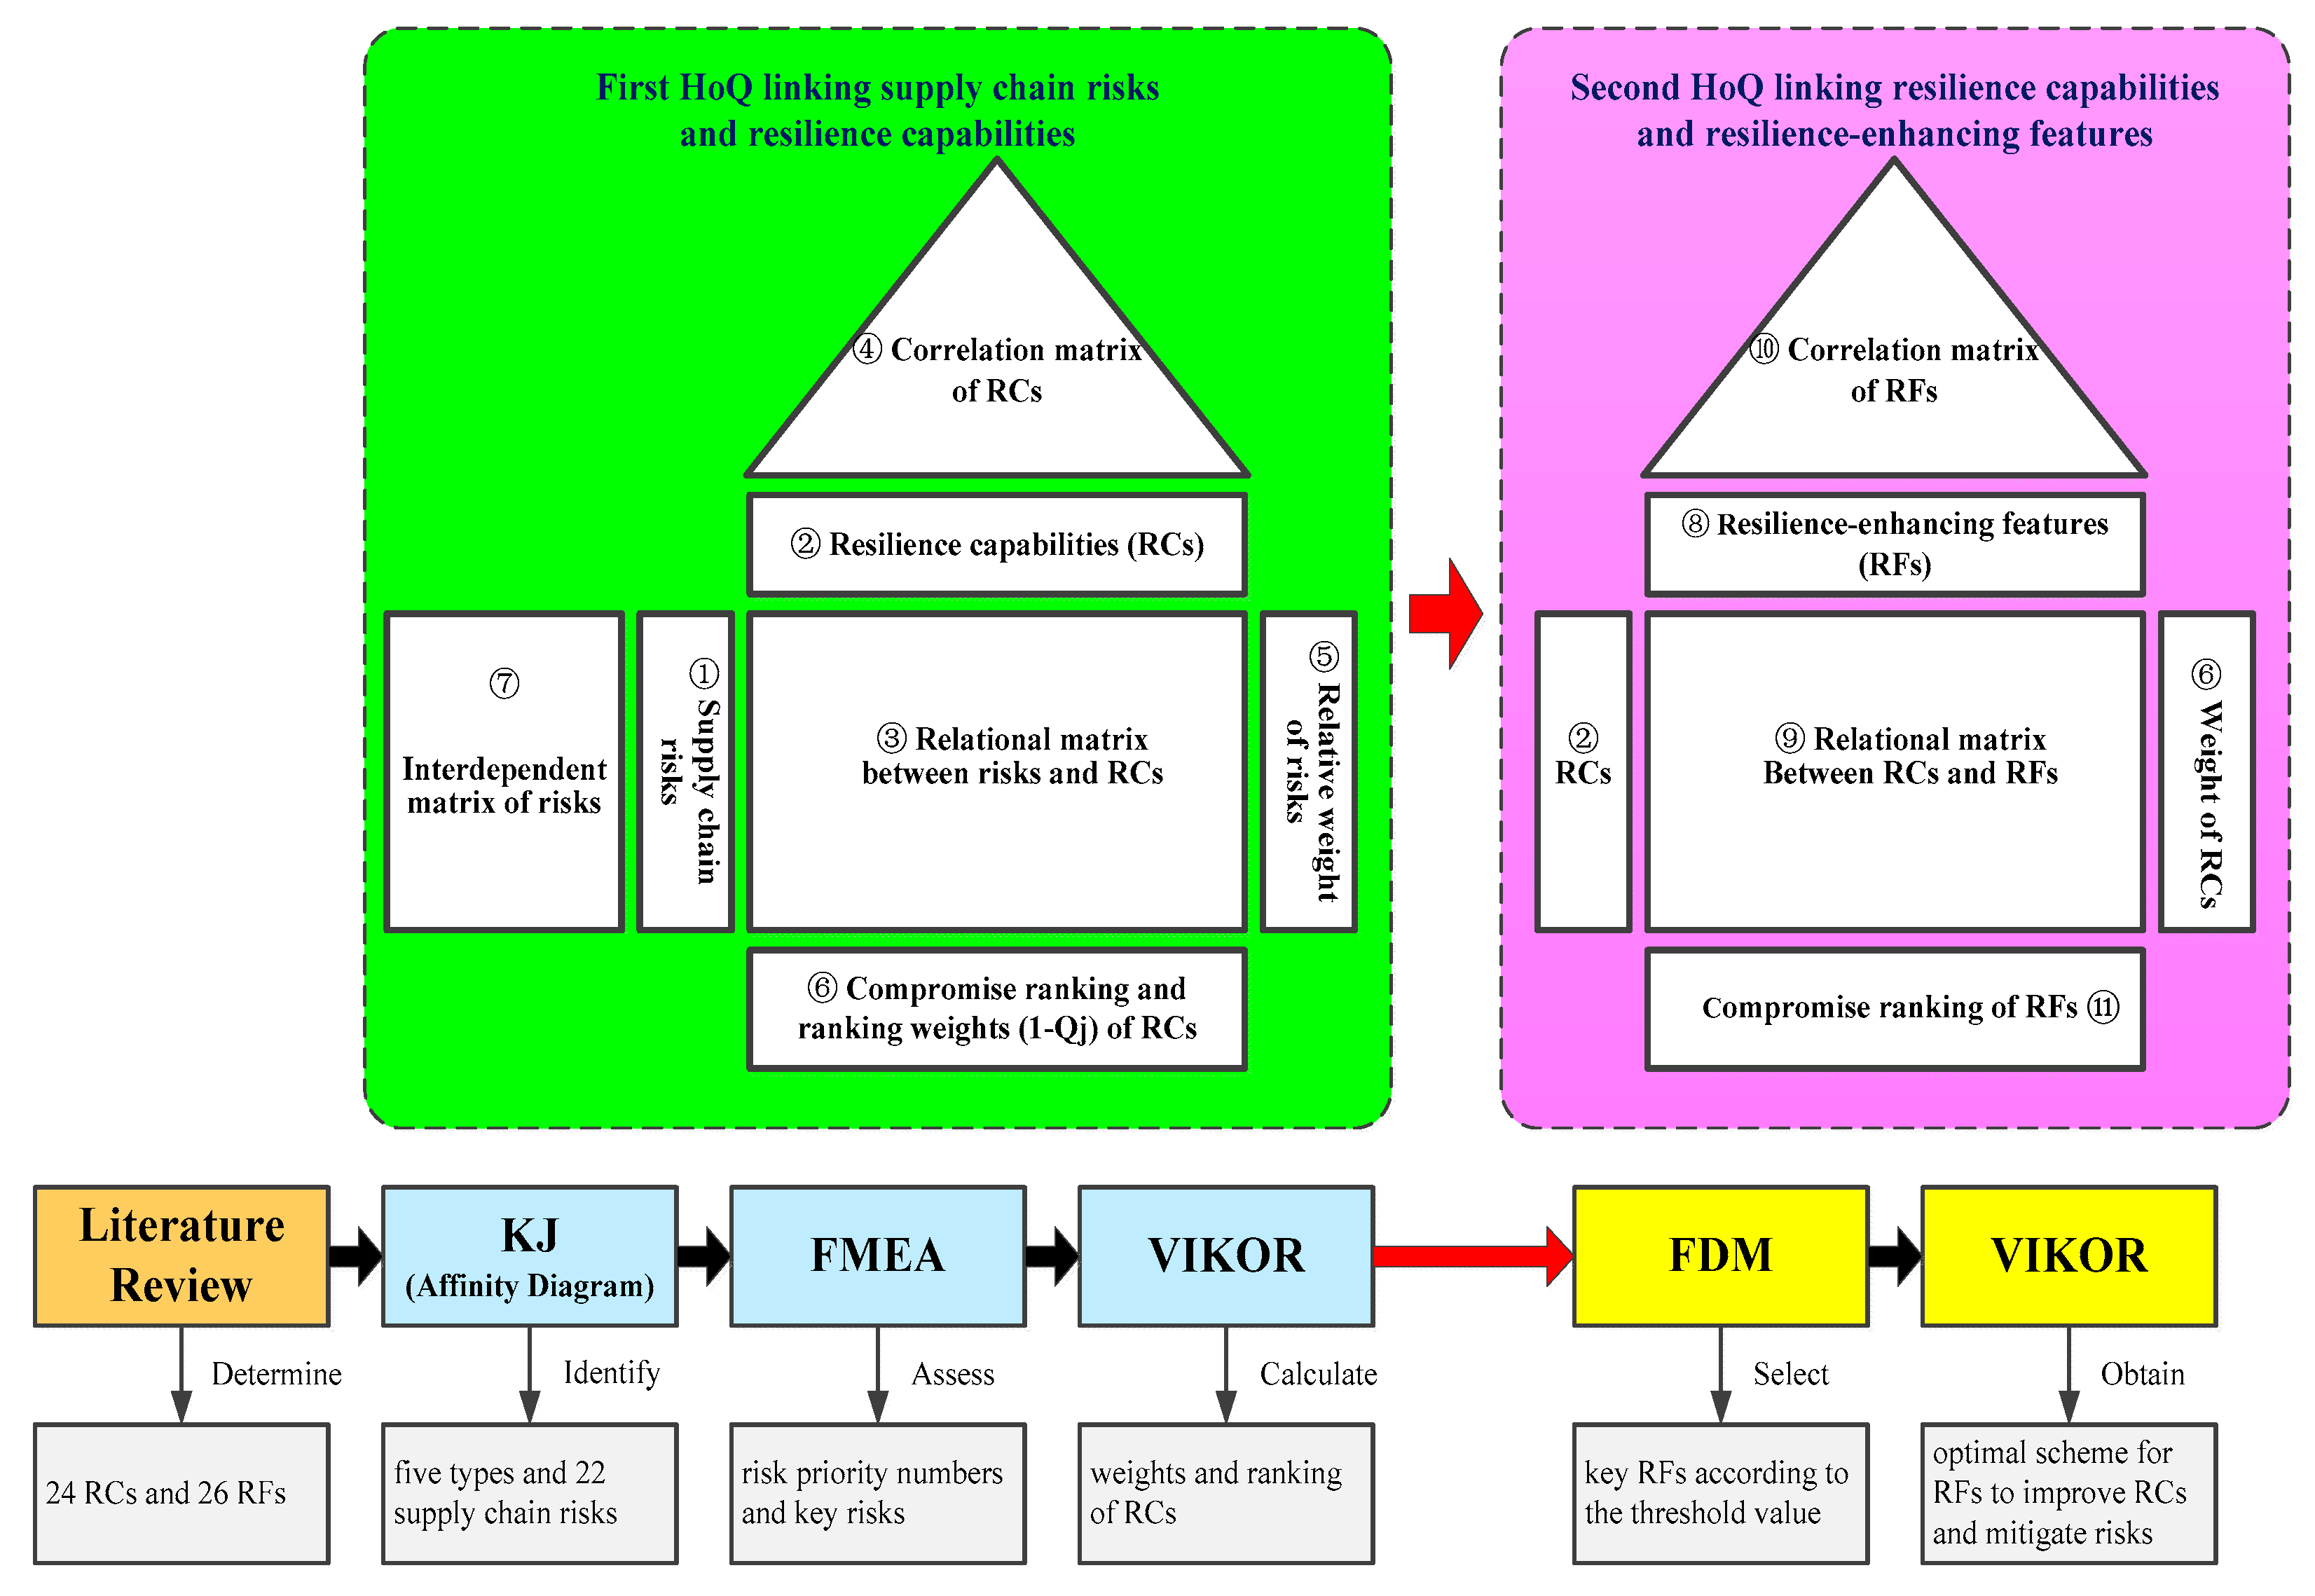
This paper adopted an integrated QFD approach to translate supply chain risk into resilience within the fashion industry, with reference from Lam and Bai (2016) [27]. The main advantage of this approach is the ability to establish supply chain resilience linked to risk. Specifically, we proposed an approach to exploit the HoQ matrix to first relate various risks to associated RCs, which are then linked to RFs for risk mitigation. The steps involved in the two HoQs are shown in Figure 1 and described in the following sub-sections. The symbols in the text from ① to ⑪ correspond to the steps illustrated in Figure 1. In this study, the data generated by the analysis were converted into HoQs, as shown in Figure 2 and Figure 3. The details of how to build an integrated QFD framework are explained and validated in Section 4.
3.1. HoQ 1: Connecting Supply Chain Risks and RCs
By consulting experts and reviewing past studies, the supply chain risks, RCs, and RFs for the fashion industry were determined. The first HOQ connected the risks to the RCs. The risks were represented as “whats” because the company should first determine the priority of the risk impacts, while the RCs were represented as “hows” because they directly affect how the risks are handled (Figure 1).
First, using the KJ method, this study identified the supply chain risks. Experts then identified potential causes and effects based on these risks and further designed a failure mode and effects analysis (FMEA) questionnaire. This study also identified RCs from a review of the literature.
Second, risk priority numbers (RPNs) were obtained using the FMEA. In this study, the 10 risks with the highest RPNs were selected as the key supply chain risks (Step ①). These selected risks were then used to implement the interdependent matrix (Step ⑦). Following this, the key RCs (Step ②) were selected by experts and a correlation matrix (Step ④) of RCs was established. A relational matrix (Step ③) between the risks and the RCs was also constructed. As the risks interact with each other, the integrated relational matrix of risks and RCs was obtained using Equation (1):
Finally, this study normalized the RPNs as the relative weight of the risks (Step ⑤). The VIKOR method was used to obtain the ranking weights and rank the RCs (Step ⑥). The KJ, FMEA and VIKOR methods in the first HoQ are described in detail in Section 3.3, Section 3.4 and Section 3.6.
3.2. HoQ 2: Connecting RCs to RFs
The second HoQ attempted to identify RFs that could improve RCs and mitigate the supply chain risks in the first HoQ. The RCs appeared as “whats” in the HoQ, while the RFs were listed as “hows” because they are practical measures the company can use to enhance its RCs. In addition, as shown in Figure 1, the weights of the RCs calculated in the first HoQ were the starting point for the construction of the second HoQ, which can directly be used as the importance weight in the second HoQ. Therefore, the second HoQ followed the same steps as the first HoQ.
In the second HoQ, the FDM was used to select key RFs according to the threshold values established by the experts (Step ⑧). The correlation matrix of RFs (Step ⑩) and the relational matrix (Step ⑨) for the RCs and RFs were then calculated. Secondly, the VIKOR method was used to normalize the integrated relational matrix and identify the positive and negative ideal solutions. This study used (1 − ) as the weight (Step ⑥) and calculated the group utility, individual regret, and benefit ratio. The VIKOR method then produced a compromise ranking based on conditional judgments of the RFs. Finally, an optimal scheme for the use of RFs (Step ⑪) to improve the RCs and mitigate supply chain risk in SFSCs was obtained. The FDM is described in Section 3.5.
3.3. KJ Method
KJ method, also known as Affinity Diagram, was invented by Jiro Kawakita in the 1960s. KJ method is a method that collects relevant facts from problems that have not been touched by group discussion, and classifies them into groups by virtue of their internal relations, so as to sort out ideas from complex phenomena and find ways to solve problems. When resources are limited, they can help prioritize actions and improve team decisions. The steps are described as follows [96]:
Step A: Identify problems and present them to team members in a concise and understandable manner.
Step B: Give team members note cards and a pen and ask them to write down ideas related to the problem. An idea should be written on every card.
Step C: Place the written cards on the table so that all members can see them.
Step D: Ask everyone to divide the cards into groups with similar themes.
Step E: When all the cards are in the groups and the team members stop moving the cards, a consensus can be reached. When the team members agree on the location of the cards, create header cards.
3.4. FMEA
FMEA is an important reliability design, which evaluates the various possible risk priority levels in order to start from the highest priority risks, eliminate these risks or reduce them to acceptable levels. It is an “ex ante action”, not an “ex post action” [97]. As different enterprises have different disruption risks, their degree of occurrence and impact varies. FMEA analyses potential failures using three criteria: Severity (impact of the failure), Occurrence (failure cause and frequency), Detection (likelihood of failure detection). Accordingly, the three criteria should be discussed depending on the situation. This study referred to the corresponding semantic levels of international standard MIL-STD-882 to design FMEA questionnaire and calculate the RPNs by using Equation (2).
RPN = S × O × D
3.5. FDM
Murray et al. (1985) proposed an optimized FDM by combining the traditional Delphi method with fuzzy theory. Some attributes of FDM include: reducing the number of rounds of questionnaire survey, and thus improvement in the response rate, time and cost; reduce the distortion of individual expert opinion; a clear expression of the semantic structure of predicted items [98]. The specific steps are as follows:
Step A: FDM questionnaire was designed to identify the important RFs. Each expert evaluated the content of each criterion.
Step B: The most conservative and optimistic values given by all experts were calculated. The minimum value, geometric mean, and maximum value in the conservative value, as well as the minimum value , geometric mean , and maximum value in the optimistic value were calculated.
Step C: In line with the Step B, the conservative value of triangular fuzzy number for every assessment item i,and the triangular fuzzy number of “most optimistic cognitive value” were obtained, .
Step D: The consensus level was calculated. refers to the “value importance level that has reached a consensus” as far as opinions of experts are concerned. The higher the , the higher the consensus on a particular assessment criterion among the experts. The consensus level is calculated by the following rules:
(1) If the triangular fuzzy numbers show no overlapping, it signifies that the opinion intervals of experts possess a consensus section. If that is the case, the evaluation item i “value importance level that has reached a consensus” , equals the average of and .
(2) If two triangular fuzzy numbers overlap, then and , where , and . In that case, the “value importance that has reached a consensus” of assessment item is calculated based on Equation (3) [31].
(3) If two triangular fuzzy numbers show overlapping, and. This implies a great conflict among the experts’ opinions. Step A to Step D need to be iterative until a convergence is obtained.
Step E: After setting the threshold value of remove criteria that did not reach the threshold.
3.6. VIKOR
The VIKOR method proposed by Opricovic (1998) is a compromise ranking method. Although there are many ways to deal with management-related problems, when there is conflict or substitution between indicators, the results may be biased. The VIKOR method overcomes this problem and can be used to sort and select a set of conflicting alternatives. The advantage of VIKOR is that it can reflect the subjective preferences of decision makers. For problems with conflicting indicators, it is characterized by maximization of “group utility” and minimization of “individual regrets” of opponents. Therefore, compared with other methods, it can determine more effective results [99]. The specific steps are as follows:
Step A: The original data are normalized.
In the first HOQ, the original data are normalized as rij, where m is the number of risks, n is the number of RCs, and B is the set of criteria. The second HOQ steps are similar.
Step B: The positive ideal solution and negative ideal solution were found.
The is the performance evaluation value of alternative j on the i evaluation criteria, is a set of benefit-oriented criteria, is the set of cost-oriented criteria.
Step C: The group utility and the individual regret were calculated.
where is the relative weight of risk factor i.
Step D: The benefit ratio was calculated.
where ; . v ∈ [0, 1] is the decision-making mechanism coefficient.
Step E: The ranking of alternatives was conducted.
When the following two conditions are satisfied, this study sort the alternatives according to the value of .
(1) Condition 1:
In Formula (10) above, according to the sorting of Qj, Q′ represents the Qj value of the first-ranked alternative, Q″ represents the Qj value of the second-ranked alternative, and J represents the number of alternatives. The formula shows that the difference between the two benefit rates () of two adjacent alternatives must exceed the threshold 1/(J − 1) to determine that the first-ranked alternative is significantly superior to the second-ranked alternative.
(2) Condition 2:
After considering the ranking of Q values, the S value (S’) of the first-ranked alternative must also be better than the S value (S″) of the second-ranked alternative; or the R value (R’) of the first-ranked alternative must also be better than the R value (R″) of the second-ranked alternative. When more than one alternative is available for comparison at the same time, using the above procedure, the following two alternatives should be checked for compliance with Condition 2.
Step F: Decision rules.
If the relationship between the first-ranked alternative and the second-ranked alternative conforms to both Condition 1 and Condition 2, the first alternative is the best. If only satisfies Condition 2,” then both alternatives are the best.
4. Results and Discussions
Today, fashion supply chains are faced with unprecedented risk due to internationalization, accelerated trend cycles, greater consumer demand for sustainability, and the need to reduce losses and increase profits in an increasingly competitive market. Economic and geopolitical uncertainty and the unpredictability of natural and human-made disasters are the current realities of the global fashion industry. Thus, developing resilience in SFSCs to ensure risk mitigation while maintaining market competition has become an important task for manufacturers.
The present study used the example of an anonymous fashion manufacturer as a case study. The proposed approach involving the two HoQs (i.e., that for supply chain risks and RCs and that for RCs and RFs) was applied to this company. Nine supply chain experts from different departments were asked to contribute their expertise in order to generate a holistic judgment. The data obtained were translated into the QFD framework.
4.1. Stage I of the First HoQ: Identification of Supply Chain Risks Using the KJ Method
The first step involved the identification of the risks facing supply chains. A committee comprising supply chain experts from the case study company was formed to determine these risks using the KJ method. After brainstorming, an objective group consensus was reached on five risk types and 22 supply chain risks in total (Table 3). Based on these 22 risks, the experts were then asked to identify possible causes and effects, and then an FMEA questionnaire was designed.
4.2. Stage II of the First HoQ: Relational Matrix between the Risks and RCs Using FMEA
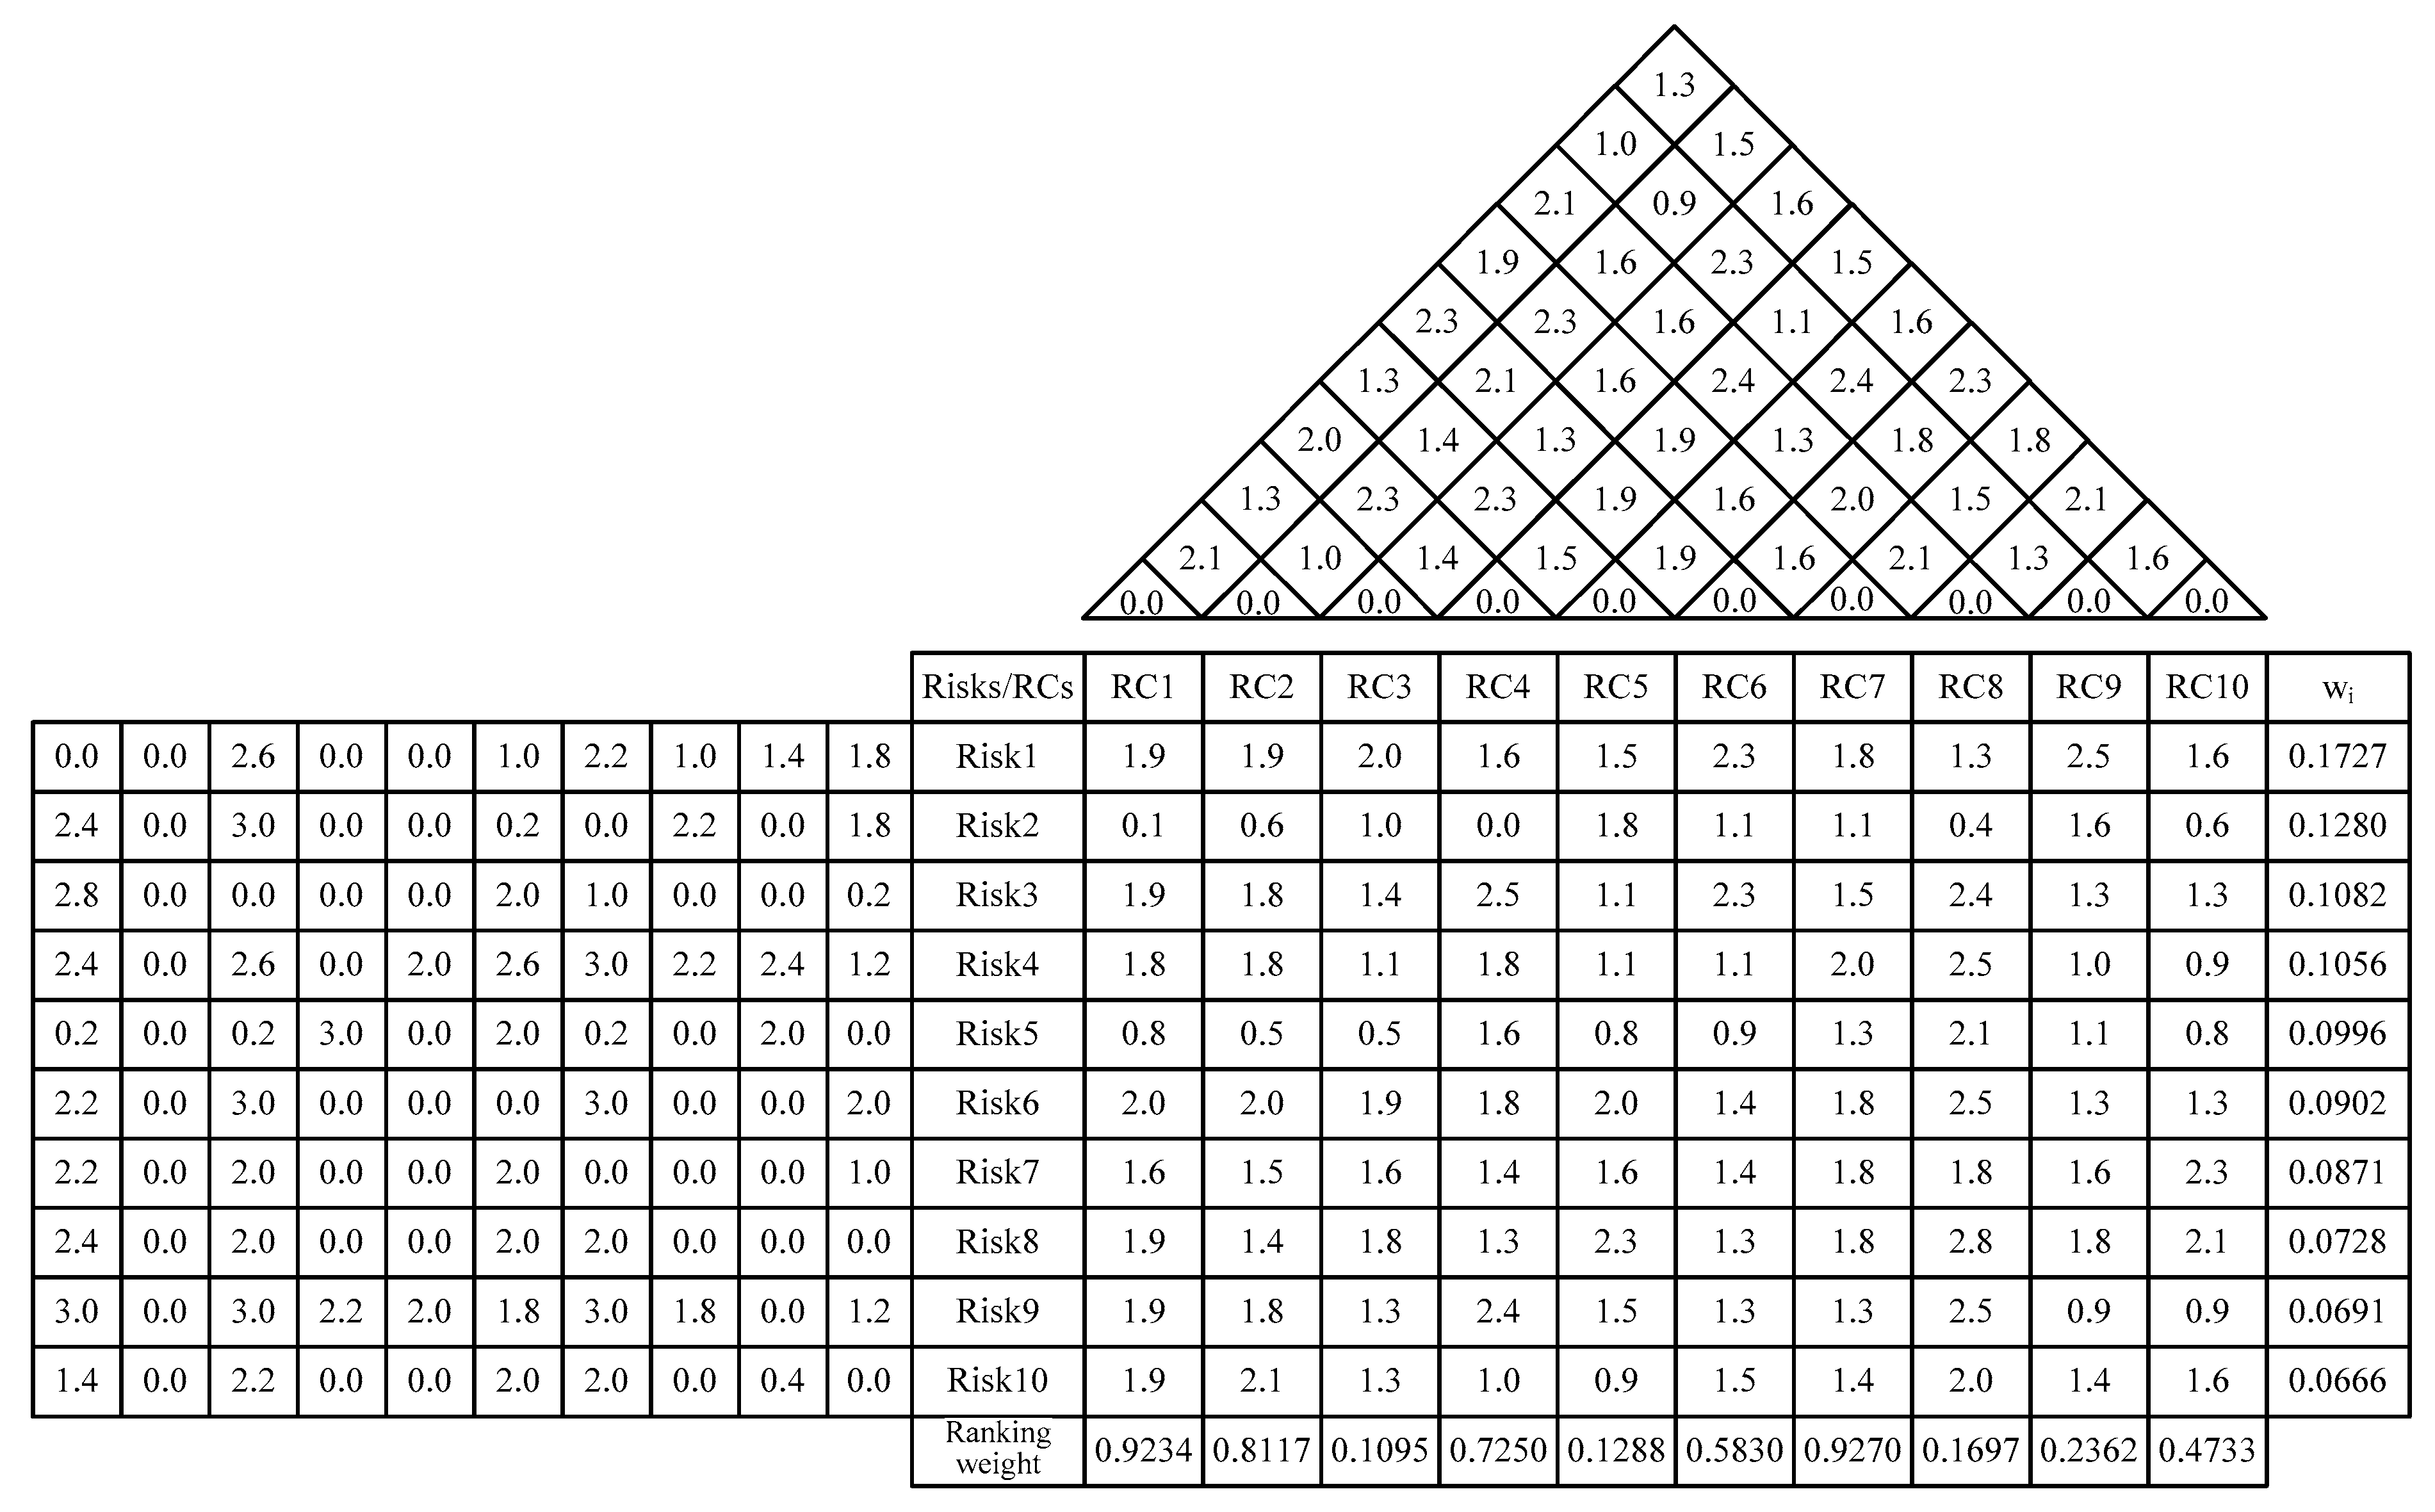
In this study, an FMEA questionnaire was designed according to the international standard MIL-STD-882, and each member was asked to evaluate three failure items for each risk: severity (S), occurrence (O), and detection (D). Equation (2) was then used to calculate the RPNs, based on which the top 10 key supply chain risks were listed. The calculated results are shown in Table 4. These key risks were included in Step ① of the first HoQ as shown in Figure 2. It can be seen in Table 4 that the top three RPNs were “delays in supplier delivery due to an accident,” “natural disasters and political instability,” and “problematic materials from the suppliers affecting the customers”.
Past studies have pointed out that individual risks have interdependent effects [100,101], so it is necessary to conduct interdependent analysis. To investigate the interaction between the identified supply chain risks, the case study company’s supply chain experts were asked to evaluate the 10 key risks based on the FMEA results. The experts considered whether there was an interaction between the risks using a four-point scale (0–3). The averages from the experts are shown in Table 5. An interdependent matrix was thus included in Step ⑦ of the first HoQ, as shown in Figure 2.
The supply chain experts also conducted screening based on the RCs in Table 1. According to the specific operation status of the case study company, 10 key RCs with guiding significance were selected: agility (RC1), flexibility (RC2), visibility (RC3), collaboration (RC4), security (RC5), velocity (RC6), adaptability (RC7), capacity (RC8), risk awareness (RC9), and information sharing (RC10). These key RCs were included in Step ② of the first HoQ (Figure 2). The supply chain experts also assessed the correlations between the RCs using a four-point scale rating scale (0–3). The questionnaires were collected and the averages calculated. The correlation matrix in Table 6 was included in Step ④ of the first HoQ (Figure 2).
4.3. Stage III of the First HoQ: Ranking Weights for RCs Using VIKOR
This study applied the VIKOR method to calculate the ranking weights for the RCs required by the case study company to mitigate its supply chain risks. As past research has found that risks are interdependent, an integrated relational matrix was constructed that considered the correlation, relational matrix, and interdependent matrices. In this study, Equation (1) in Section 3 was used to multiply the three matrices; the resulting integrated relational matrix is presented in Table 8.
The integrated relational matrix in Table 8 was first applied to Equation (4) to normalize the data within the interval [0,1]. The normalized matrix was input into Equations (5) and (6) to obtain the positive ideal solution and the negative ideal solution for the RCs, respectively. The results are shown in Table 9.
In this process, group utility and individual regret were calculated according to Equations (7) and (8), where is the relative weight of the normalized RPNs in Table 2. The relative weight of the supply chain risks was included in Step ⑤ of the first HoQ (Figure 2). The relative weight was also input into Equations (7) and (8) to calculate the group utility and individual regret , respectively. The results are presented in Table 10.
Equation (9) was used to calculate the benefit ratio , in which v is the coefficient for the decision-making mechanism. After careful consideration, this study set a goal of 0.5 in VIKOR to maximize group utility and minimize individual regret. The benefit ratio for the RCs is summarized in Table 11.
Based on the two conditions, in Table 11 was inserted into Equation (10): if the two conditions are true, this study can rank according to .
In this study, based on Table 12, the first two values of were inserted into Equation (10); it was found that , which was less than 1/(81) and thus did not meet Condition 1.
However, Table 12 shows that RC7 (adaptability) was 0.1173, which was less than RC1 (agility; 0.1178). The performance was thus better, satisfying Condition 2.
Based on these results, RC7 and RC1, which were the top two RCs when ranked according to , were both selected as the best choice after being evaluated against the two conditions.
Using this process, the 10 RCs were analysed in pairs to determine whether the two conditions were met. The ranking weights in Table 12 were included in Step ⑥ of the first HoQ (Figure 2). The ranking weights and compromise rankings for the RCs, summarized at the bottom of Table 12, revealed that RC1 (agility) and RC7 (adaptability) are top concerns for the case study company, followed by RC2 (flexibility) and RC4 (collaboration). Following these were RC6 (velocity) and RC10 (information sharing).
After completing the KJ, FMEA, and VIKOR methods for the first HoQ, the ranking weights for the RCs were obtained. The results for the first HoQ are summarized in Figure 2. For , a smaller value is preferable. Therefore, this study used as the weight for the RCs in the second HoQ.
4.4. Stage I for the Second HoQ: Selection of RFs Using FDM
In this study, a second HoQ was adopted to connect the RCs and RFs using the FDM and VIKOR methods. Key RFs from Table 2 were first selected using FDM.
For the RFs in Table 2, a total of 26 features under five dimensions were screened using FDM. An FDM questionnaire was distributed to the supply chain experts of the case study company asking them to evaluate according to their experience the minimum and maximum values of each feature using a scoring range of 0–10. The results show that the questionnaire answers all fell within the range of two standard deviations, with no extreme values. This study calculated the most conservative and the most optimistic scores given by the experts. The triangular fuzzy numbers for the most conservative score,and for the most optimistic cognitive score, were calculated for every criterion i.
The higher the level of , the higher the expert consensus on an RF. If the consensus level for a feature is too low or below the threshold, that feature should be removed. The threshold in this study was 7.0, set based on the needs of the case study company. A total of 16 criteria were removed. The selected RFs presented in Table 13 were included in Step ⑧ of the second HoQ (Figure 3).
4.5. Stage II for the Second HOQ: Compromise Ranking of the RFs Using VIKOR
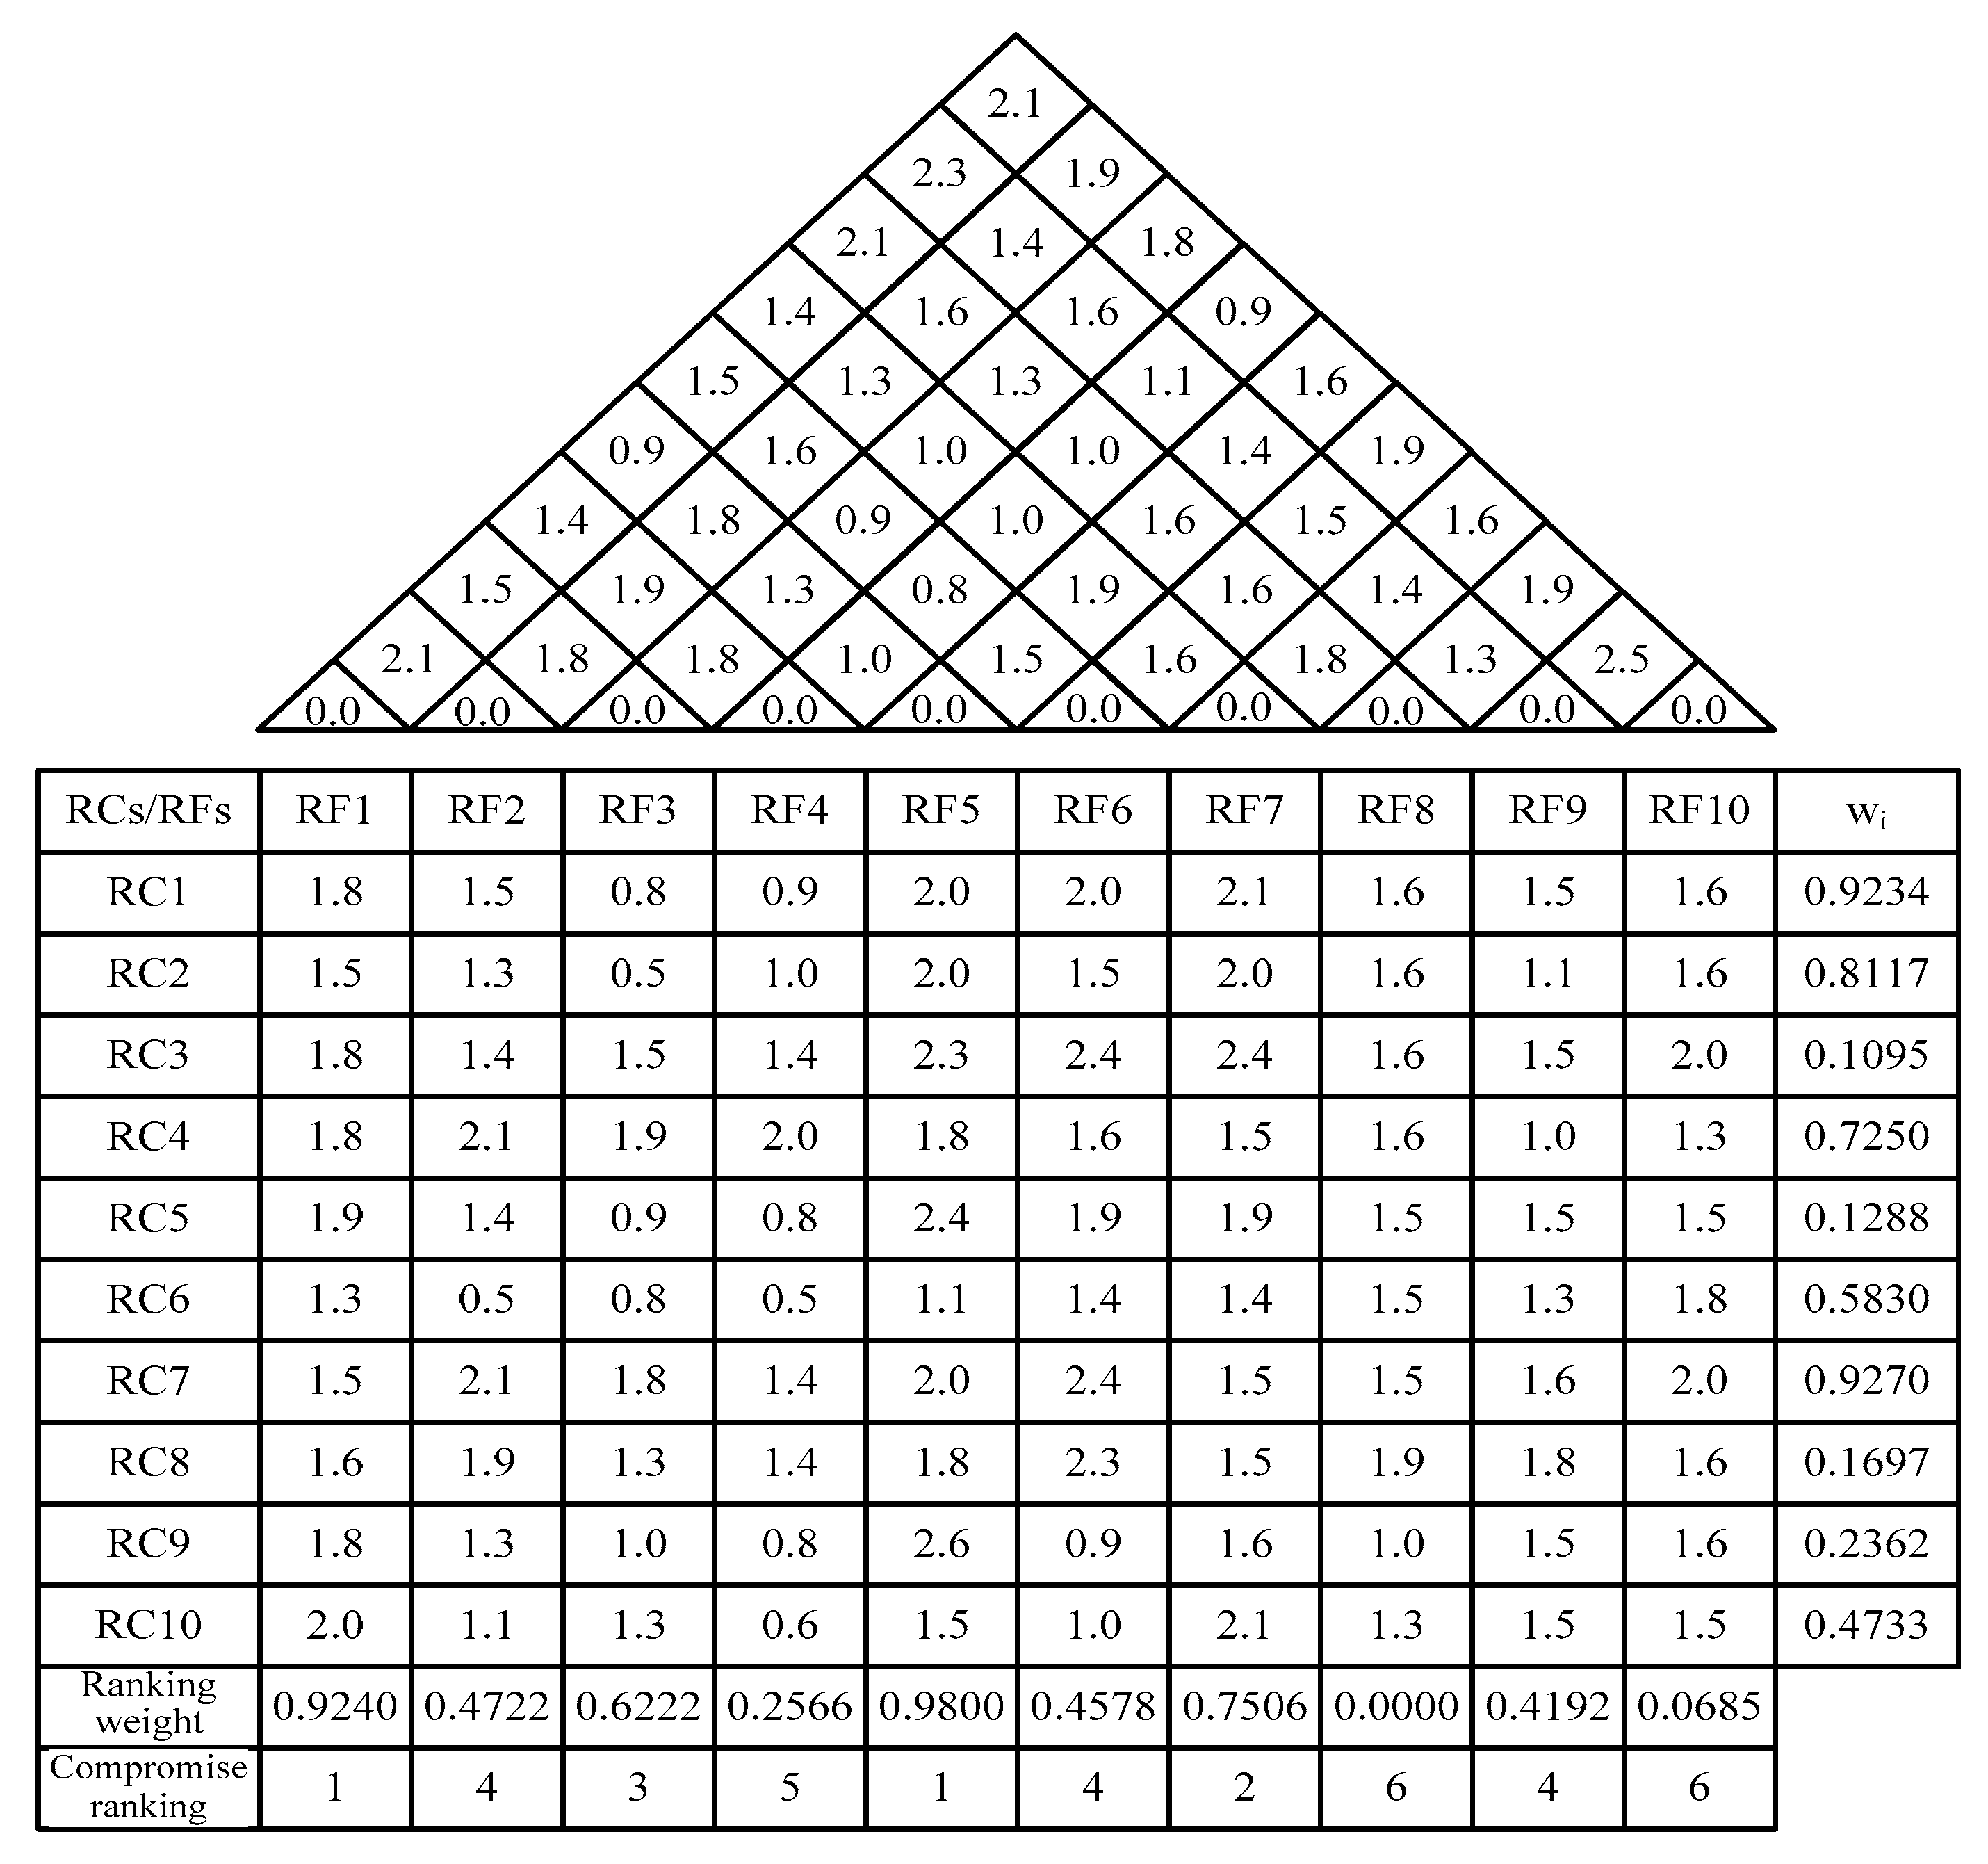
The calculation steps for the second HoQ are the same as those for the first HoQ: (1) correlation matrix between the RFs; (2) relational matrix between the RCs and RFs; (3) integrated relational matrix between the RCs and RFs; and (4) compromise ranking of the RFs.
The ranking weight (1 − ) for the RCs from the first HoQ was input into the second HoQ to determine the ranking of the RFs. Table 14 and Figure 3 summarize the results of the entire second HoQ process. The second HoQ found that the most important RFs were “Reconfiguring company resources” (RF1) and “On-site risk monitoring and responsibility sharing” (RF5), followed by “Sharing real-time job information” (RF7) and “Establishing a feasible incentive system” (RF3).
4.6. Implications and Recommendations
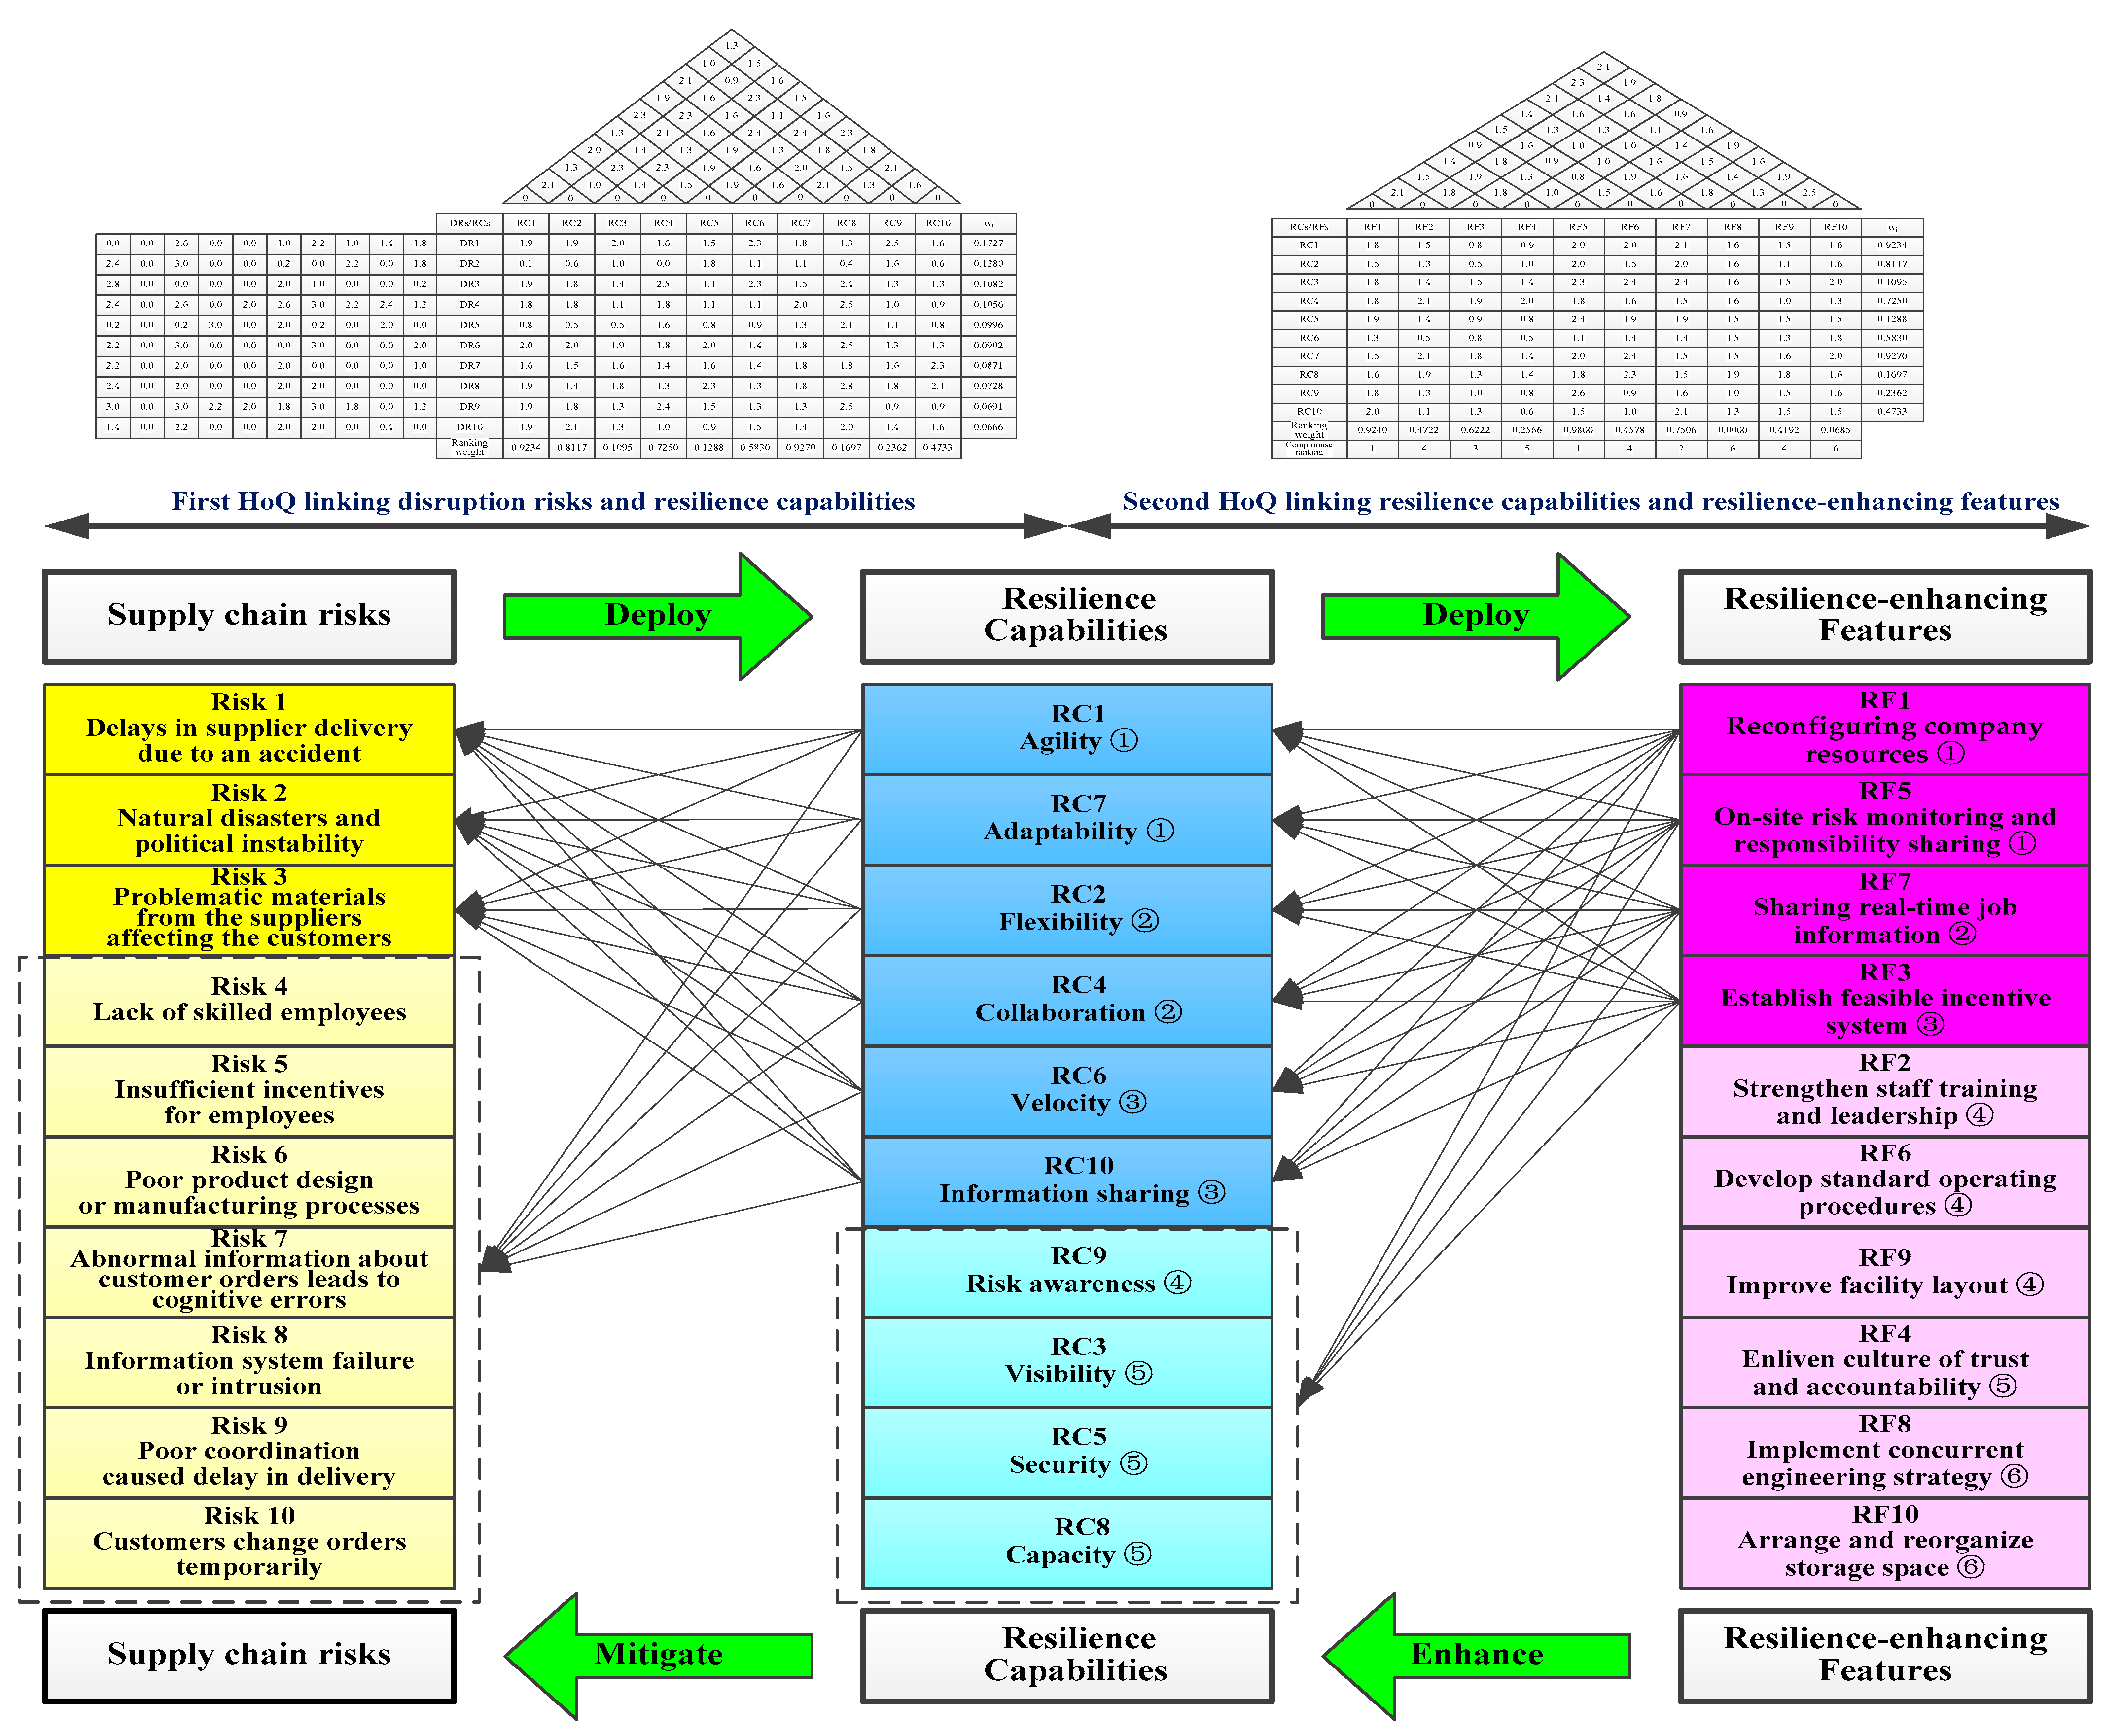
Given the limited resources of each company, improving all dimensions of resilience at the same time may be difficult. To prioritise resilience, enterprise managers must gradually invest part resources in accordance with their companies’ current abilities. By doing so, they can improve resilience step-by-step following the resilience priority to mitigate risks in SFSCs. Therefore, it is important to develop a risk-mitigation approach that can maximize supply chain resilience within the fashion industry. This study proposed a systematic resilience approach that integrates KJ, FMEA, FDM, and VIKOR methods into QFD for risk mitigation in SFSCs (Figure 4). By implementing two HoQs, the supply chain risks are expanded into RCs, which are then translated into RFs. This approach can explore the relationship between two variables (i.e., that for supply chain risks and RCs and that for RCs and RFs).
The Pareto effect is when a small group of causes has a large number of effects, meaning that a few vital improvements can achieve a significant proportion of the desired results. Thus, a few vital causes may need special attention, while trivial causes can be deprioritized [102]. With limited resources, the Pareto effect can be applied to the results based on the proposed approach. The fashion industry can first aim to strengthen the most important RFs and jointly enhance the most important RCs, thereby mitigating the most important supply chain risks. This action not only strengthens RFs, but also indirectly enhances and mitigates the effects for other minor RCs and risks. Alternatively, once the top three RFs have been enhanced, the other RFs can be addressed sequentially, thus continuing to affect the RCs and risks. Finally, when all of the RFs have been strengthened, overall RC enhancement and risk mitigation can be greatly improved to facilitate SFSC risk resilience.
Using the systematic process of an integrated QFD approach, the fashion industry can gain detailed knowledge concerning how resilience affects supply chain risk and what resilience solutions should be prioritized in order to mitigate risk in SFSCs. In the following sub-sections, we refer to the results of the two HoQs to discuss the importance rankings associated with the three variables.
4.6.1. Supply Chain Risks and RCs in the First HoQ
In terms of supply chain risks and RCs in the first HoQ for the case study company, it can be seen from Table 2 that the top three risks are “Delays in supplier delivery due to an accident”, “Natural disasters and political instability”, and “Problematic materials from the suppliers affecting the customers”. The ranking weights and compromise ranking of the RCs (Table 11) reveal that agility and adaptability were perceived to be the key concerns, followed by flexibility and collaboration, and then velocity and information sharing. Figure 4 indicates that prioritizing these important forms of resilience will go a long way toward mitigating the top three supply chain risks.
Delays in supplier delivery due to an accident—This risk is a common problem in supply chains, with supplier deliveries affected by large, small, natural, and human-made problems. It is understandable, as Norrman and Wieland (2020) pointed out, that the main effect of accidents is a delay in delivery, especially in a supply chain context [103]. For example, two fires on the same day in separate garment factories in Pakistan killed more than 300 workers in 2012, while the 2013 Dhaka garment factory collapse was a structural failure with a death toll of 1134. These accidents affect delivery. Companies in the fashion industry are usually faced with the pressures of maintaining both short delivery times and low costs [104]. This has led to the formation of buyer-driven and geographically complex outsourced supply chains. The impact of lead times on supply chain performance is key to the success of the fashion industry [45].
Natural disasters and political instability—In the long term, natural disasters such as droughts, flooding, tropical storms, wildfires, volcano eruptions, earthquakes, and tsunamis can have wide-ranging and devastating effects on global supply chains. The recent COVID-19 outbreak, in particular, has exposed the vulnerability of existing supply chains, with millions of workers losing their jobs. Due to differences in the ability to control the virus, social distancing and travel restrictions have limited production in key supplier markets. Although new techniques for predicting and preventing natural disasters are being developed, McMaster et al. (2020) calls for risk reflection with regard to fashion supply chains [49].
Geopolitical factors also play an important role in the disruption of global supply chains. Governmental policies, actions, and stability can significantly affect supply chain sustainability [105], including geopolitical instability, terrorism, Brexit, stalled trade deals, and protectionism. Fashion companies with global sourcing needs must understand the potential negative impact these threats can have on productivity and develop resilient strategies to mitigate risk.
Problematic materials from the suppliers affecting the customers—In support of the research by Martino et al. (2017) [46], the experts in the present study believed that the appropriate management of materials requires significant effort from the company in terms of ensuring supply chain sustainability. For example, past studies have identified health hazards arising from the wearing of toxic fabrics and fibres. Fashion industry materials can also be damaging to the environment, especially if they are not easily recycled and their production and/or biodegradation emits toxins into the water and air. Furthermore, sustainable fashion seeks to minimize waste and keep the materials within the consumption/production loop as long as possible. Therefore, facilitating recycling and reuse is an important issue. Overall, consumers are paying more attention to supply chain sustainability from production to transport to recycling, including the use of materials at all stages of the supply chain [106].
The three greatest risks described above could be affected by all of the RCs listed, but the top three RCs are likely to have the largest effect. These risks are in line with the actual situation of the case study company. As this company is located in a coastal region, severe weather such as typhoons in the summer can cause various delays. In addition, unexpected incidents involving the supplier can delay the company’s production schedule, while the quality of the suppliers’ raw materials and production components is an influential factor. Thus, the case study company should develop a plan to improve the supply chain resilience as soon as possible to avoid the recurrence of these risks.
4.6.2. RCs and RFs in the Second HoQ
In the second HoQ, because the RCs act as an intermediary between the risks and RFs, they serve as a link between two variables. However, the RCs are abstract nouns that can be difficult to understand. Therefore, considering the top three RCs in a causal way, we can conclude that the case study company’s current goal of improving its overall resilience involves sharing information and collaborating with other members of the supply chain in order to develop a supply chain with agility, flexibility, velocity, and adaptability. The top three RFs were “reconfiguring company resources”, “on-site risk monitoring and responsibility sharing”, and “sharing real-time job information”. Following these was “establishing a feasible incentive system”. In order to achieve the current overall resilience goal, this study suggests that the top three risks should be prioritized for mitigation through the reallocation of internal and external resources from the perspective of an SFSC, on-site real-time monitoring of risks, and the sharing of risk responsibility. This is discussed in more detail for each of the three main risks.
Delays in supplier delivery due to an accident—Maintaining a partnership with suppliers and viewing them as an extension of the off-site plant would be more advantageous for meeting production requirements. There are many ways to improve RCs and mitigate the first risk; these are listed below.
1. Monitor global economic, social, and environmental trends and risks, and rationally allocate corporate resources to comply with relevant local laws and regulations. Strengthen the communication between the purchasing department and internal production, marketing and other departments, and divide the rights and responsibilities. Share information and risks with suppliers in a fair and reasonable manner. Shorten the time between ordering and arrival and shorten the distance between the shop and supply. Identify backup suppliers and build up inventory.
2. Develop a supply chain emergency plan. Establish a reasonable time for purchase and delivery that is acceptable to both parties. Encourage suppliers to shorten the lead and cycle times and manage their inventory more effectively. Use blanket orders to forecast future purchase quantities to allow the supplier to prepare the materials. Encourage suppliers to use EDI, the Internet, and other communication tools to improve the procurement process. Strengthen control of the delivery schedule for the supplier’s materials.
3. Classify suppliers and impose penalties for breaches of contract for manufacturers who delay delivery. Reward manufacturers who meet delivery times. Commit to corporate social responsibility and urge suppliers to protect labour rights and comply with local safety, health, and labour laws.
Only when the company can rapidly access information and manage data in each link of the supply chain can a flexible reaction time be achieved. Thus, the gradual adoption of artificial intelligence, big data, blockchain, and other new technologies can be harnessed to improve the transparency of the supply chain, connecting all of its information and components via the Internet to create a wisdom factory. By doing so, the RF measures will be easier to achieve, thus obtaining the goal of an SFSC.
Natural disasters and political instability—Despite the uncertainty of natural disasters and politics, risks can be minimized by seeking to prevent damage before it occurs. There are many ways to improve RCs and mitigate the second risk, and these are described below.
1. Monitor the global climatic, ecological, environmental, and political trends. Strengthen information sharing and cooperation with governments, trade associations, and all links in the supply chain in order to gather more complete information, make judgments in advance, and allocate company resources in a timely manner. Interact with local policy-makers to build positive local relationships and influence regulatory changes. Train employees how to deal with unstable situations. Encourage notification incentives when disaster precursors are discovered.
2. Adjust purchasing portfolios and adopt multi-source suppliers. Spread the risk by relocating inventory in different locations and reducing reliance on products at risk of disruption. In the long term, seek to enhance the online presence of the company. Adopt recent developments in augmented-reality technology to create digital showrooms and fitting rooms. Support key vendors in financial distress during a crisis [49].
Fashion companies can use digital supply chain platforms to monitor the weather, port closures, traffic jams, political protests, and infrastructure disruptions in real-time to anticipate and mitigate supply chain risks.
Problematic materials from suppliers affecting the customers—Managing materials correctly with the idea of “getting things right the first time” is more advantageous for meeting the needs of customers. There are many ways to improve RCs and mitigate the third risk. These are listed below.
1. Implement clear supplier certification. Establish clear quality standards and communicate them to suppliers. Establish a clear division of labour and separate supplier development and management. Evaluate supplier performance regularly. Assist suppliers in improving quality. Improve the quality and risk awareness of purchasing personnel and do not look to simply reduce supplier prices without reason.
2. Focus on sustainable fashion trends. Adopt sustainable materials at all stages of the supply chain to gradually replace materials that are harmful to sustainability. Change the design, production, transportation, purchase, use, recycling, and reuse of products in a sustainable way, eliminate waste, and reduce resource use.
From the above discussion, it is clear that suppliers are the most serious problem for the case study company, so it should pay more attention to supplier risk and take appropriate resilience measures to mitigate them. Many industries have established integrated supply chain strategies, such as the electronics industry. Companies like Erisson have transformed their supply chain management into one of their core competencies and developed good relationships with supplier groups. This practice could be applied to the fashion industry.
Companies in different industries can also use the proposed approach for risk mitigation. However, when constructing the list of risks, it should be noted that the risks vary from industry to industry. Therefore, when using this approach, it is necessary to identify the particular supply chain risks for the target company using supply chain experts from that company based on the nature of the industry. In addition, the corresponding resilience-enhancing plan should complete the plan–do–check–act cycle, and its performance should be reviewed at regular intervals.
5. Conclusions
The fashion industry has recognized the need to create resilient, sustainable supply chains in a highly competitive global market that faces greater supply chain risk. From the perspective of SFSCs, this study broadens the perspective of the resilience of the fashion industry by considering supply chain risk, resilience capabilities, and resilience-enhancing features. Based on this empirical research, the key findings are as follows.
- The top-three risks are, respectively, ‘delays in supplier delivery due to accidents’, ‘natural disasters and political instability’ and ‘problematic supplier materials affecting the customers’.
- The top-three RCs: Agility and adaptability were the most important, followed by flexibility and collaboration. Velocity and information sharing were also important in this context.
- The top-three RFs are, respectively, ‘reconfiguring company resources’ and ‘on-site risk monitoring and responsibility sharing’ and ‘real-time sharing of job information’ and ‘establishing a feasible incentive system’.
This study makes important academic and practical contributions. First, fashion supply chain research has identified two important issues: sustainability and risk. However, relatively few studies have combined these two problems [33]. In addition, for sustainability, the resilience of supply chains also needs to be strengthened to mitigate risk. Therefore, the two HoQs proposed in this study provide different risk resilience approaches for SFSCs in the fashion industry. This study is the first of its kind and accomplishes the research objective discussed in Section 1.
Second, the QFD approach was applied to produce the compromise ranking of RFs by deploying RCs, thus improving the RCs and mitigating supply chain risk. With the proposed approach, the fashion industry can understand which RCs and RFs should be focused on to improve the resilience of SFSCs. As a result, fashion companies will be able to increase their ability to absorb and adapt to problems and to restore their supply chain following disruption.
SFSC risk resilience is a relatively new research topic, thus there is a large research space. Though the fashion industry is large and influential, there has been little research on how companies can optimize the sustainability of their upstream operations [34]. Therefore, in future research, a sustainable QFD approach based on the mitigation of upstream supplier risk via resilience can be pursued.
Author Contributions
Conceptualization, C.-H.H. and A.-Y.C.; methodology, C.-H.H. and A.-Y.C.; software, W.-D.L. and W.-L.L.; validation, C.-H.H. and A.-Y.C.; formal analysis, C.-H.H. and W.-L.L.; investigation, C.-H.H. and W.-D.L.; resources, C.-H.H. and W.-L.L.; data curation, C.-H.H. and W.-D.L.; writing—original draft preparation, C.-H.H. and T.-Y.Z.; writing—review and editing, C.-H.H. and T.-Y.Z.; visualization, C.-H.H. and W.-L.L.; supervision, C.-H.H. and A.-Y.C.; project administration, C.-H.H. and T.-Y.Z.; funding acquisition, C.-H.H. All authors have read and agreed to the published version of the manuscript.
Funding
This paper was supported by Education and Scientific Research Foundation of Fujian Province Finance Department of China (Grant No. GY-Z21001) and Natural Science Foundation of Fujian Province of China (Grant No. 2019J01790).
Institutional Review Board Statement
Not applicable.
Informed Consent Statement
Not applicable.
Data Availability Statement
Not applicable.
Acknowledgments
The authors are very much indebted to the Editor-in-Chief and anonymous referees who greatly helped to improve this paper by their valuable comments and suggestions.
Conflicts of Interest
The authors declare no conflict of interest.
References
- Choi, T.Y.; Hong, Y. Unveiling the structure of supply networks: Case studies in Honda, Acura, and DaimlerChrysler. J. Oper. Manag. 2002, 20, 469–493. [Google Scholar] [CrossRef]
- Guo, S.; Choi, T.-M.; Shen, B. Green product development under competition: A study of the fashion apparel industry. Eur. J. Oper. Res. 2020, 280, 523–538. [Google Scholar] [CrossRef]
- Valinejad, F.; Rahmani, D. Sustainability risk management in the supply chain of telecommunication companies: A case study. J. Clean. Prod. 2018, 203, 53–67. [Google Scholar] [CrossRef]
- Brydges, T. Closing the loop on take, make, waste: Investigating circular economy practices in the Swedish fashion industry. J. Clean. Prod. 2021, 293, 126245. [Google Scholar] [CrossRef]
- Pedersen, E.R.G.; Gwozdz, W.; Hvass, K.K. Exploring the relationship between business model innovation, corporate sustainability, and organisational values within the fashion industry. J. Bus. Ethic 2018, 149, 267–284. [Google Scholar] [CrossRef] [Green Version]
- Colucci, M.; Tuan, A.; Visentin, M. An empirical investigation of the drivers of CSR talk and walk in the fashion industry. J. Clean. Prod. 2020, 248, 119200. [Google Scholar] [CrossRef]
- Bick, R.; Halsey, E.; Ekenga, C.C. The global environmental injustice of fast fashion. Environ. Health 2018, 17, 1–4. [Google Scholar] [CrossRef] [Green Version]
- Fung, Y.-N.; Chan, H.-L.; Choi, T.-M.; Liu, R. Sustainable product development processes in fashion: Supply chains structures and classifications. Int. J. Prod. Econ. 2021, 231, 107911. [Google Scholar] [CrossRef]
- Zhang, B.; Zhang, Y.; Zhou, P. Consumer attitude towards sustainability of fast fashion products in the UK. Sustainability 2021, 13, 1646. [Google Scholar] [CrossRef]
- Nayak, R.; Akbari, M.; Far, S.M. Recent sustainable trends in Vietnam’s fashion supply chain. J. Clean. Prod. 2019, 225, 291–303. [Google Scholar] [CrossRef]
- Koberg, E.; Longoni, A. A systematic review of sustainable supply chain management in global supply chains. J. Clean. Prod. 2019, 207, 1084–1098. [Google Scholar] [CrossRef]
- Dong, Q.; Cooper, O. An orders-of-magnitude AHP supply chain risk assessment framework. Int. J. Prod. Econ. 2016, 182, 144–156. [Google Scholar] [CrossRef]
- Chang, A.Y.; Cheng, Y.T. Analysis model of the sustainability development of manufacturing small and medium-sized en-terprises in Taiwan. J. Clean. Prod. 2019, 207, 458–473. [Google Scholar] [CrossRef]
- D’Adamo, I.; Lupi, G. Sustainability and resilience after COVID-19: A circular premium in the fashion industry. Sustainability 2021, 13, 1861. [Google Scholar] [CrossRef]
- Souza, V.D.; Bloemhof-Ruwaard, J.; Borsato, M. Exploring ecosystem network analysis to balance resilience and performance in sustainable supply chain design. Int. J. Adv. Oper. Manag. 2019, 11, 26–45. [Google Scholar] [CrossRef]
- Mandal, S.; Dubey, R.K. Role of tourism IT adoption and risk management orientation on tourism agility and resilience: Impact on sustainable tourism supply chain performance. Int. J. Tour. Res. 2020, 22, 800–813. [Google Scholar] [CrossRef]
- He, L.; Wu, Z.; Xiang, W.; Goh, M.; Xu, Z.; Song, W.; Ming, X.; Wu, X. A novel Kano-QFD-DEMATEL approach to optimise the risk resilience solution for sustainable supply chain. Int. J. Prod. Res. 2020, 1–22. [Google Scholar] [CrossRef]
- Mari, S.I.; Lee, Y.H.; Memon, M.S. Sustainable and resilient garment supply chain network design with fuzzy multi-objectives under uncertainty. Sustainability 2016, 8, 1038. [Google Scholar] [CrossRef] [Green Version]
- Chopra, S.; Sodhi, M.S. Reducing the risk of supply chain disruptions. MIT Sloan Manag. Rev. 2014, 55, 73. [Google Scholar]
- Hasan, M.; Jiang, D.; Ullah, A.S.; Alam, N.-E. Resilient supplier selection in logistics 4.0 with heterogeneous information. Expert Syst. Appl. 2020, 139, 112799. [Google Scholar] [CrossRef]
- Tang, C.S. Robust strategies for mitigating supply chain disruptions. Int. J. Logist. Res. Appl. 2006, 9, 33–45. [Google Scholar] [CrossRef]
- Jüttner, U.; Maklan, S. Supply chain resilience in the global financial crisis: An empirical study. Supply Chain Manag. Int. J. 2011, 16, 246–259. [Google Scholar] [CrossRef]
- Rezapour, S.; Farahani, R.Z.; Pourakbar, M. Resilient supply chain network design under competition: A case study. Eur. J. Oper. Res. 2017, 259, 1017–1035. [Google Scholar] [CrossRef] [Green Version]
- Ghavamifar, A.; Makui, A.; Taleizadeh, A. Designing a resilient competitive supply chain network under disruption risks: A real-world application. Transp. Res. Part E Logist. Transp. Rev. 2018, 115, 87–109. [Google Scholar] [CrossRef]
- Hosseini, S.; Ivanov, D.; Dolgui, A. Review of quantitative methods for supply chain resilience analysis. Transp. Res. Part. E Logist. Transp. Rev. 2019, 125, 285–307. [Google Scholar] [CrossRef]
- Hauser, J.; Clausing, D. The house of quality. Harv. Bus. Rev. 1988, 66, 63–73. [Google Scholar]
- Lam, J.S.L.; Bai, X. A quality function deployment approach to improve maritime supply chain resilience. Transp. Res. Part. E Logist. Transp. Rev. 2016, 92, 16–27. [Google Scholar] [CrossRef]
- Hsu, C.H.; Chang, A.Y.; Kuo, H.M. Data mining QFD for the dynamic forecasting of life cycle under green supply chain. WSEAS Trans. Comput. 2012, 11, 1–10. [Google Scholar]
- Ayağ, Z.; Samanlioglu, F.; Büyüközkan, G. A fuzzy QFD approach to determine supply chain management strategies in the dairy industry. J. Intell. Manuf. 2013, 24, 1111–1122. [Google Scholar] [CrossRef]
- Chowdhury, M.H.; Quaddus, M.A. A multiple objective optimization based QFD approach for efficient resilient strategies to mitigate supply chain vulnerabilities: The case of garment industry of Bangladesh. Omega 2015, 57, 5–21. [Google Scholar] [CrossRef]
- Hsu, C.-H.; Chang, A.-Y.; Luo, W. Identifying key performance factors for sustainability development of SMEs—Integrating QFD and fuzzy MADM methods. J. Clean. Prod. 2017, 161, 629–645. [Google Scholar] [CrossRef]
- Sharma, N.; Singhi, R. Logistics and supply chain management quality improvement of supply chain process through vendor managed inventory: A QFD approach. J. Supply Chain Manag. Syst. 2018, 7, 23–33. [Google Scholar]
- Rafi-Ul-Shan, P.M.; Grant, D.B.; Perry, P.; Ahmed, S. Relationship between sustainability and risk management in fashion supply chains: A systematic literature review. Int. J. Retail Distrib. Manag. 2018, 46, 466–486. [Google Scholar] [CrossRef] [Green Version]
- Mukendi, A.; Davies, I.; Glozer, S.; McDonagh, P. Sustainable fashion: Current and future research directions. Eur. J. Mark. 2020, 54, 2873–2909. [Google Scholar] [CrossRef]
- Sheffi, Y. Building a resilient organization. Bridge J. Natl. Acad. Sci. 2007, 37, 30–38. [Google Scholar]
- Sorensen, L.B. How risk and uncertainty is used in supply chain management: A literature study. Int. J. Integr. Supply Manag. 2005, 1, 387. [Google Scholar] [CrossRef] [Green Version]
- Colicchia, C.; Strozzi, F. Supply chain risk management: A new methodology for a systematic literature review. Supply Chain Manag. Int. J. 2012, 17, 403–418. [Google Scholar] [CrossRef]
- Ho, W.; Zheng, T.; Yildiz, H.; Talluri, S. Supply chain risk management: A literature review. Int. J. Prod. Res. 2015, 53, 5031–5069. [Google Scholar] [CrossRef]
- Prakash, S.; Soni, G.; Rathore, A.P.S. A critical analysis of supply chain risk management content: A structured literature review. J. Adv. Manag. Res. 2017, 14, 69–90. [Google Scholar] [CrossRef]
- Hamdi, F.; Ghorbel, A.; Masmoudi, F.; Dupont, L. Optimization of a supply portfolio in the context of supply chain risk management: Literature review. J. Intell. Manuf. 2015, 29, 763–788. [Google Scholar] [CrossRef]
- Shekarian, M.; Mellat Parast, M. An integrative approach to supply chain disruption risk and resilience management: A lit-erature review. Int. J. Logist. Res. Appl. 2020, 1–29. [Google Scholar] [CrossRef]
- Wang, X.; Chan, H.K.; Yee, R.W.; Diaz-Rainey, I. A two-stage fuzzy-AHP model for risk assessment of implementing green initiatives in the fashion supply chain. Int. J. Prod. Econ. 2012, 135, 595–606. [Google Scholar] [CrossRef]
- Choi, T.M. Game theoretic analysis of a multi-period fashion supply chain with a risk averse retailer. Int. J. Inven. Res. 2013, 2, 63. [Google Scholar] [CrossRef]
- Xu, M.; Wang, Q.; Ouyang, L. Coordinating contracts for two-stage fashion supply chain with risk-averse retailer and price-dependent demand. Math. Probl. Eng. 2013, 2013, 1–12. [Google Scholar] [CrossRef]
- Mehrjoo, M.; Pasek, Z.J. Risk assessment for the supply chain of fast fashion apparel industry: A system dynamics frame-work. Int. J. Prod. Res. 2016, 5, 28–48. [Google Scholar] [CrossRef]
- Martino, G.; Fera, M.; Iannone, R.; Miranda, S. Supply chain risk assessment in the fashion retail industry: An analytic network process approach. Int. J. Appl. Eng. Res. 2017, 12, 140–154. [Google Scholar]
- Choi, T.-M. Impacts of retailer’s risk averse behaviors on quick response fashion supply chain systems. Ann. Oper. Res. 2016, 268, 239–257. [Google Scholar] [CrossRef]
- Fierro Hernandez, D.; Haddud, A. Value creation via supply chain risk management in global fashion organizations out-sourcing production to China. J. Global Oper. Strateg. Sourc. 2018, 11, 250–272. [Google Scholar] [CrossRef]
- McMaster, M.; Nettleton, C.; Tom, C.; Xu, B.; Cao, C.; Qiao, P. Risk management: Rethinking fashion supply chain management for multinational corporations in light of the COVID-19 outbreak. J. Risk Financ. Manag. 2020, 13, 173. [Google Scholar] [CrossRef]
- Choi, T.-M.; Chiu, C.-H. Mean-downside-risk and mean-variance newsvendor models: Implications for sustainable fashion retailing. Int. J. Prod. Econ. 2012, 135, 552–560. [Google Scholar] [CrossRef]
- Xu, M.; Cui, Y.; Hu, M.; Xu, X.; Zhang, Z.; Liang, S.; Qu, S. Supply chain sustainability risk and assessment. J. Clean. Prod. 2019, 225, 857–867. [Google Scholar] [CrossRef]
- Boussemart, J.-P.; Leleu, H.; Shen, Z.; Valdmanis, V. Performance analysis for three pillars of sustainability. J. Prod. Anal. 2020, 53, 305–320. [Google Scholar] [CrossRef]
- Iddrisu, I.; Bhattacharyya, S.C. Sustainable energy development index: A multi-dimensional indicator for measuring sus-tainable energy development. Renew. Sustain. Energy Rev. 2015, 50, 513–530. [Google Scholar] [CrossRef] [Green Version]
- Moktadir, A.; Dwivedi, A.; Khan, N.S.; Paul, S.K.; Khan, S.A.; Ahmed, S.; Sultana, R. Analysis of risk factors in sustainable supply chain management in an emerging economy of leather industry. J. Clean. Prod. 2021, 283, 124641. [Google Scholar] [CrossRef]
- Kamalahmadi, M.; Parast, M.M. A review of the literature on the principles of enterprise and supply chain resilience: Major findings and directions for future research. Int. J. Prod. Econ. 2016, 171, 116–133. [Google Scholar] [CrossRef]
- Elleuch, H.; Dafaoui, E.; Elmhamedi, A.; Chabchoub, H. Resilience and vulnerability in supply chain: Literature review. IFA PapersOnLine 2016, 49, 1448–1453. [Google Scholar] [CrossRef]
- Ali, A.; Mahfouz, A.; Arisha, A. Analysing supply chain resilience: Integrating the constructs in a concept mapping framework via a systematic literature review. Supply Chain Manag. Int. J. 2017, 22, 16–39. [Google Scholar] [CrossRef]
- Yuqi, W.; Yan, G.; Chunxian, T. Literature review and research prospects of supply chain resilience under disrup-tion. Manag. Rev. 2017, 12, 20. [Google Scholar]
- Karl, A.A.; Micheluzzi, J.; Leite, L.R.; Pereira, C.R. Supply chain resilience and key performance indicators: A systematic literature review. Production 2018, 28. [Google Scholar] [CrossRef] [Green Version]
- Kochan, C.G.; Nowicki, D.R. Supply chain resilience: A systematic literature review and typological framework. Int. J. Phys. Distrib. Logist. Manag. 2018, 48, 842–865. [Google Scholar] [CrossRef]
- Ribeiro, J.P.; Barbosa-Povoa, A. Supply chain resilience: Definitions and quantitative modelling approaches—A literature review. Comput. Ind. Eng. 2018, 115, 109–122. [Google Scholar] [CrossRef]
- Bevilacqua, M.; Ciarapica, F.; Marcucci, G. Supply chain resilience research trends: A literature overview. IFAC PapersOnLine 2019, 52, 2821–2826. [Google Scholar] [CrossRef]
- Hosseini, S.; Ivanov, D. Bayesian networks for supply chain risk, resilience and ripple effect analysis: A literature review. Expert Syst. Appl. 2020, 161, 113649. [Google Scholar] [CrossRef] [PubMed]
- Calvo, J.; Olmo, J.L.D.; Berlanga, V. Supply chain resilience and agility: A theoretical literature review. Int. J. Supply Chain Oper. Resil. 2020, 4, 37–69. [Google Scholar] [CrossRef]
- Han, Y.; Chong, W.K.; Li, D. A systematic literature review of the capabilities and performance metrics of supply chain resilience. Int. J. Prod. Res. 2020, 58, 4541–4566. [Google Scholar] [CrossRef]
- Golan, M.S.; Jernegan, L.H.; Linkov, I. Trends and applications of resilience analytics in supply chain modeling: Systematic literature review in the context of the COVID-19 pandemic. Environ. Syst. Decis. 2020, 40, 222–243. [Google Scholar] [CrossRef]
- Bevilacqua, M.; Ciarapica, F.E.; Marcucci, G.; Mazzuto, G. Fuzzy cognitive maps approach for analysing the domino effect of factors affecting supply chain resilience: A fashion industry case study. Int. J. Prod. Res. 2019, 58, 6370–6398. [Google Scholar] [CrossRef]
- Christopher, M.; Peck, H. Building the resilient supply chain. Int. J. Logist. Manag. 2004, 15, 1–14. [Google Scholar] [CrossRef] [Green Version]
- Sheffi, Y.; Rice, J.B., Jr. A supply chain view of the resilient enterprise. MIT Sloan Manag. Rev. 2005, 47, 41–48. [Google Scholar]
- Priya Datta, P.P.; Christopher, M.; Allen, P. Agent-based modelling of complex production/distribution systems to improve resilience. Int. J. Logist. Res. Appl. 2007, 10, 187–203. [Google Scholar] [CrossRef]
- Pereira, J.V. The new supply chain’s frontier: Information management. Int. J. Inf. Manag. 2009, 29, 372–379. [Google Scholar] [CrossRef]
- Ponis, S.T.; Koronis, E. Supply chain resilience: Definition of concept and its formative elements. J. Appl. Bus. Res. 2012, 28, 921–930. [Google Scholar] [CrossRef]
- Carvalho, H.; Azevedo, S.G.; Cruz-Machado, V. Agile and resilient approaches to supply chain management: Influence on performance and competitiveness. Logist. Res. 2012, 4, 49–62. [Google Scholar] [CrossRef]
- Simangunsong, E.; Hendry, L.; Stevenson, M. Supply-chain uncertainty: A review and theoretical foundation for future research. Int. J. Prod. Res. 2012, 50, 4493–4523. [Google Scholar] [CrossRef]
- Pettit, T.J.; Croxton, K.L.; Fiksel, J. Ensuring supply chain resilience: Development and implementation of an assessment tool. J. Bus. Logist. 2013, 34, 46–76. [Google Scholar] [CrossRef]
- Soni, U.; Jain, V.; Kumar, S. Measuring supply chain resilience using a deterministic modeling approach. Comput. Ind. Eng. 2014, 74, 11–25. [Google Scholar] [CrossRef]
- Rajesh, R.; Ravi, V. Supplier selection in resilient supply chains: A grey relational analysis approach. J. Clean. Prod. 2015, 86, 343–359. [Google Scholar] [CrossRef]
- Rajesh, R. Forecasting supply chain resilience performance using grey prediction. Electron. Commer. Res. Appl. 2016, 20, 42–58. [Google Scholar] [CrossRef]
- Sahu, A.K.; Datta, S.; Mahapatra, S. Evaluation of performance index in resilient supply chain: A fuzzy-based approach. Benchmarking Int. J. 2017, 24, 118–142. [Google Scholar] [CrossRef]
- Jain, V.; Kumar, S.; Soni, U.; Chandra, C. Supply chain resilience: Model development and empirical analysis. Int. J. Prod. Res. 2017, 55, 6779–6800. [Google Scholar] [CrossRef]
- Chowdhury, M.M.H.; Quaddus, M. Supply chain resilience: Conceptualization and scale development using dynamic capa-bility theory. Int. J. Prod. Econ. 2017, 188, 185–204. [Google Scholar] [CrossRef]
- Yazdanparast, R.; Tavakkoli-Moghaddam, R.; Heidari, R.; Aliabadi, L. A hybrid Z-number data envelopment analysis and neural network for assessment of supply chain resilience: A case study. Cent. Eur. J. Oper. Res. 2018, 1–21. [Google Scholar] [CrossRef]
- Sabahi, S.; Parast, M.M. Firm innovation and supply chain resilience: A dynamic capability perspective. Int. J. Logist. Res. Appl. 2020, 23, 254–269. [Google Scholar] [CrossRef]
- Singh, C.S.; Soni, G.; Badhotiya, G.K. Performance indicators for supply chain resilience: Review and conceptual frame-work. J. Ind. Eng. Int. 2019, 15, 1–13. [Google Scholar] [CrossRef] [Green Version]
- López, C.; Ishizaka, A. A hybrid FCM-AHP approach to predict impacts of offshore outsourcing location decisions on supply chain resilience. J. Bus. Res. 2019, 103, 495–507. [Google Scholar] [CrossRef] [Green Version]
- Bell, M.A. The Five Principles of Organizational Resilience; Gartner Research: Stamford, CT, USA, 2002. [Google Scholar]
- Rice, J.B.; Caniato, F. Building a secure and resilient supply network. Supply Chain Manag. Rev. 2003, 7, 22–30. [Google Scholar]
- Baramichai, M.; Zimmers, E.W., Jr.; Marangos, C.A. Agile supply chain transformation matrix: An integrated tool for creating an agile enterprise. Supply Chain Manag. Int. J. 2007, 12, 334–348. [Google Scholar] [CrossRef] [Green Version]
- Iakovou, E.; Vlachos, D.; Xanthopoulos, A. An analytical methodological framework for the optimal design of resilient supply chains. Int. J. Logist. Econ. Glob. 2007, 1, 1–20. [Google Scholar] [CrossRef]
- Vugrin, E.D.; Warren, D.E.; Ehlen, M.A. A resilience assessment framework for infrastructure and economic systems: Quantitative and qualitative resilience analysis of petrochemical supply chains to a hurricane. Process Saf. Prog. 2011, 30, 280–290. [Google Scholar] [CrossRef]
- Bevilacqua, M.; Ciarapica, F.; Marcucci, G.; Mazzuto, G. Conceptual model for analysing domino effect among concepts affecting supply chain resilience. Supply Chain Forum Int. J. 2018, 19, 282–299. [Google Scholar] [CrossRef]
- Kumar, S.; Anbanandam, R. An integrated Delphi—Fuzzy logic approach for measuring supply chain resilience: An illustrative case from manufacturing industry. Meas. Bus. Excel. 2019, 23, 350–375. [Google Scholar] [CrossRef]
- Adobor, H. Supply chain resilience: A multi-level framework. Int. J. Logist. Res. Appl. 2018, 22, 533–556. [Google Scholar] [CrossRef]
- Sanchis, R.; Canetta, L.; Poler, R. A conceptual reference framework for enterprise resilience improvement. Sustainability 2020, 12, 1464. [Google Scholar] [CrossRef] [Green Version]
- Kumar, P.S.; Anbanandam, R. Theory building on supply chain resilience: A SAP–LAP analysis. Glob. J. Flex. Syst. Manag. 2020, 21, 113–133. [Google Scholar] [CrossRef]
- Awasthi, A.; Chauhan, S.S. A hybrid approach integrating affinity diagram, AHP and fuzzy TOPSIS for sustainable city logistics planning. Appl. Math. Model. 2012, 36, 573–584. [Google Scholar] [CrossRef]
- Bhuvanesh Kumar, M.; Parameshwaran, R. Fuzzy integrated QFD, FMEA framework for the selection of lean tools in a manufacturing organization. Prod. Plan. Control. 2018, 29, 403–417. [Google Scholar] [CrossRef]
- Rejab, M.M.; Firdaus, N.; Chuprat, S. Fuzzy delphi method for evaluating HyTEE Model (Hybrid software change management tool with test effort estimation). Int. J. Adv. Comput. Sci. Appl. 2019, 10, 529–535. [Google Scholar] [CrossRef]
- Opricovic, S.; Tzeng, G.-H. Compromise solution by MCDM methods: A comparative analysis of VIKOR and TOPSIS. Eur. J. Oper. Res. 2004, 156, 445–455. [Google Scholar] [CrossRef]
- Jung, K.; Song, M.; Park, H.J. The dynamics of an interorganizational emergency management network: Interdependent and independent risk hypotheses. Public Adm. Rev. 2018, 79, 225–235. [Google Scholar] [CrossRef]
- Kuper, G.; Massacci, F.; Shim, W.; Williams, J. Who should pay for interdependent risk? Policy implications for security interdependence among airports. Risk Anal. 2020, 40, 1001–1019. [Google Scholar] [CrossRef]
- Erdil, A. An evaluation on lifecycle of products in textile industry of turkey through quality function deployment and pareto analysis. Procedia Comput. Sci. 2019, 158, 735–744. [Google Scholar] [CrossRef]
- Norrman, A.; Wieland, A. The development of supply chain risk management over time: Revisiting Ericsson. Int. J. Phys. Distrib. Logist. Manag. 2020, 50, 641–666. [Google Scholar] [CrossRef]
- Shen, B.; Chen, C. Quality management in outsourced global fashion supply chains: An exploratory case study. Prod. Plan. Control. 2019, 31, 757–769. [Google Scholar] [CrossRef]
- Kaufmann, D.; Kraay, A.; Mastruzzi, M. The Worldwide Governance Indicators: Methodology and Analytical Issues; The World Bank: Washington, DC, USA, 2010. [Google Scholar]
- Macchion, L.; Da Giau, A.; Caniato, F.; Caridi, M.; Danese, P.; Rinaldi, R.; Vinelli, A. Strategic approaches to sustainability in fashion supply chain management. Prod. Plan. Control. 2018, 29, 9–28. [Google Scholar] [CrossRef]
Figure 1.
Structure of the first and second houses of quality.

Figure 2.
First HoQ linking supply chain risks and resilience capabilities.

Figure 3.
Second HoQ linking resilience capabilities and resilience-enhancing features.

Figure 4.
An integrated QFD approach for risk mitigation through resilient deployment in SFSCs. Notes: The symbols in Figures① to ⑥ represent the VIKOR ranking of importance.
Figure 4.
An integrated QFD approach for risk mitigation through resilient deployment in SFSCs. Notes: The symbols in Figures① to ⑥ represent the VIKOR ranking of importance.


Table 1.
The constituent elements of RCs by scholars.
| Christopher and Peck (2004) [68] | Sheffi and Rice (2005) [69] | Priya Datta et al. (2007) [70] | Pereira (2009) [71] | Jüttner and Maklan (2011) [22] | Ponis and Koronis (2012) [72] | Carvalho et al.(2012) [73] | Simangunsong et al. (2012) [74] | Pettit et al.(2013) [75] | Soni et al. (2014) [76] | Rajesh and Ravi (2015) [77] | Rajesh (2016) [78] | Kamalahmadi and Parast (2016) [55] | Sahu et al. (2017) [79] | Ali et al. (2017) [57] | Jain et al. (2017) [80] | Chowdhury and Quaddus (2017) [81] | Yazdanparast et al.(2018) [82] | Kochan and Nowicki (2018) [60] | Karl et al.(2018) [59] | Sabahi and Parast (2019) [83] | Singh et al. (2019) [84] | López and Ishizaka (2019) [85] | Shekarian and Mellat Parast (2020) [41] | |
|---|---|---|---|---|---|---|---|---|---|---|---|---|---|---|---|---|---|---|---|---|---|---|---|---|
| Risk awareness | ● | ● | ● | ● | ● | ● | ● | ● | ● | ● | ● | |||||||||||||
| Security | ● | ● | ● | ● | ● | ● | ● | ● | ● | |||||||||||||||
| Information sharing | ● | ● | ● | ● | ● | ● | ● | ● | ● | ● | ● | ● | ||||||||||||
| Collaboration | ● | ● | ● | ● | ● | ● | ● | ● | ● | ● | ● | ● | ● | ● | ● | ● | ● | ● | ● | ● | ||||
| Adaptability | ● | ● | ● | ● | ● | ● | ● | ● | ||||||||||||||||
| Velocity | ● | ● | ● | ● | ● | ● | ● | ● | ● | ● | ||||||||||||||
| Flexibility | ● | ● | ● | ● | ● | ● | ● | ● | ● | ● | ● | ● | ● | ● | ● | ● | ● | ● | ● | ● | ● | ● | ||
| Visibility | ● | ● | ● | ● | ● | ● | ● | ● | ● | ● | ● | ● | ● | ● | ● | ● | ● | ● | ||||||
| Agility | ● | ● | ● | ● | ● | ● | ● | ● | ● | ● | ● | ● | ● | ● | ● | ● | ||||||||
| Capacity | ● | ● | ● | ● | ● | |||||||||||||||||||
| Redundancy | ● | ● | ● | ● | ● | ● | ● | ● | ● | ● | ● | ● | ● | |||||||||||
| Knowledge | ● | ● | ● | ● | ● | ● | ● | |||||||||||||||||
| Responsiveness | ● | ● | ● | ● | ||||||||||||||||||||
| Efficiency | ● | ● | ● | |||||||||||||||||||||
| Financial strength | ● | ● | ● | ● | ● | ● | ● | |||||||||||||||||
| Market position | ● | ● | ● | ● | ● | ● | ● | ● | ||||||||||||||||
| Anticipation | ● | ● | ● | |||||||||||||||||||||
| Recovery | ● | ● | ● | ● | ||||||||||||||||||||
| Dispersion | ● | ● | ● | ● | ● |
Table 2.
List of resilience-enhancing features by scholars.
| Dimension | Resilience-Enhancing Feature | Dimension | Resilience-Enhancing Feature |
|---|---|---|---|
| Management | 1. Reconfiguring company resources | Relationship | 14. Maintain communication and cooperation with customers and suppliers |
| 2. Strengthen staff training and leadership | System | 15. Upgrade information systems that integrate resources | |
| 3. Construct risk emergency mechanism | 16. Upgrade system functionality and transaction automation | ||
| 4. Establishing a feasible incentive system | 17. Establish and train cross-functional organisations | ||
| 5. Employ multiple supplier sources | 18. Develop standard operating procedures | ||
| Enterprise culture | 6. Encourage non-hierarchical communication | 19. Improve product design and development | |
| 7. Enliven culture of trust and accountability | 20. Share real-time job information | ||
| 8. Foster awareness of environmental protection and social responsibility | Logistics | 21. Implement concurrent engineering strategy | |
| 9. Strictly abide by the rules and develop self-discipline | 22. Maintain and update equipment | ||
| Relationship | 10. On-site risk monitoring and responsibility sharing | 23. Improve facility layout | |
| 11. Recruit experts for improvement | 24. Arrange and reorganize storage space | ||
| 12. Strengthen the linkage between production site and support | 25. Maintain adequate buffer stock | ||
| 13. Improve and summarize customer feedback | 26. Optimize transportation modes and routes |
(1) Bell (2002) [86]; (2) Rice and Caniato (2003) [87]; (3) Christopher and Peck (2004) [68]; (4) Tang (2006) [21]; (5) Baramichai et al. (2007) [88]; (6) Iakovou et al. (2007) [89]; (7) Vugrin et al. (2011) [90]; (8) Chowdhury and Quaddus (2015) [30]; (9) Elleuch et al.(2016) [56]; (10) Chowdhury and Quaddus (2017) [81]; (11) Sahu et al. (2017) [79]; (12) Karl et al. (2018) [59]; (13) Bevilacqua et al. (2018) [91]; (14) Kumar and Anbanandam (2019) [92]; (15) Adobor (2019) [93]; (16) Sanchis et al. (2020) [94]; (17) Kumar and Anbanandam (2020) [95]; (18) He et al. (2020) [17].
Table 3.
Consensus of supply chain risks by KJ method.
| Risk Type | Supply Chain Risk |
|---|---|
| Production risk | Equipment failure or damage |
| Poor product design or manufacturing processes | |
| Product safety and quality is not up to standard | |
| Outdated equipment or methods lead to waste of resources | |
| Management risk | Low work efficiency leads to low labor productivity |
| Lack of skilled employees | |
| Poor organisational management at the top | |
| Poor coordination caused delay in delivery | |
| Insufficient incentives for employees | |
| Information risk | Information system failure or intrusion |
| Loss of data leads to loss of information | |
| Abnormal information about customer orders leads to cognitive errors | |
| Supply and demand risk | Delays in supplier delivery due to an accident |
| Problematic materials from the suppliers affecting the customers | |
| Insufficient customer credit | |
| Customers change orders temporarily | |
| Environmental risk | Economic downturns or technology changes |
| Failure to grasp sustainable trends leads to sales problems | |
| Failure to fulfil corporate social responsibility | |
| Natural disasters and political instability | |
| Abnormal logistics resulted in delayed delivery | |
| Diseases and epidemics |
Table 4.
Key supply chain risks and RPNs.
| No. | Key Supply Chain Risk | RPN | Order |
|---|---|---|---|
| Risk 1 | Delays in supplier delivery due to an accident | 37.939 | 1 |
| Risk 2 | Natural disasters and political instability | 28.125 | 2 |
| Risk 3 | Problematic materials from the suppliers affecting the customers | 23.766 | 3 |
| Risk 4 | Lack of skilled employees | 23.203 | 4 |
| Risk 5 | Insufficient incentives for employees | 21.875 | 5 |
| Risk 6 | Poor product design or manufacturing processes | 19.824 | 6 |
| Risk 7 | Abnormal information about customer orders leads to cognitive errors | 19.141 | 7 |
| Risk 8 | Information system failure or intrusion | 15.984 | 8 |
| Risk 9 | Poor coordination caused delay in delivery | 15.188 | 9 |
| Risk 10 | Customers change orders temporarily | 14.625 | 10 |
Table 5.
Interdependent matrix of supply chain risks.
| Risk 1 | Risk 2 | Risk 3 | Risk 4 | Risk 5 | Risk 6 | Risk 7 | Risk 8 | Risk 9 | Risk 10 | |
|---|---|---|---|---|---|---|---|---|---|---|
| Risk 1 | 0.0 | 0.0 | 2.6 | 0.0 | 0.0 | 1.0 | 2.2 | 1.0 | 1.4 | 1.8 |
| Risk 2 | 2.4 | 0.0 | 3.0 | 0.0 | 0.0 | 0.2 | 0.0 | 2.2 | 0.0 | 1.8 |
| Risk 3 | 2.8 | 0.0 | 0.0 | 0.0 | 0.0 | 2.0 | 1.0 | 0.0 | 0.0 | 0.2 |
| Risk 4 | 2.4 | 0.0 | 2.6 | 0.0 | 2.0 | 2.6 | 3.0 | 2.2 | 2.4 | 1.2 |
| Risk 5 | 0.2 | 0.0 | 0.2 | 3.0 | 0.0 | 2.0 | 0.2 | 0.0 | 2.0 | 0.0 |
| Risk 6 | 2.2 | 0.0 | 3.0 | 0.0 | 0.0 | 0.0 | 3.0 | 0.0 | 0.0 | 2.0 |
| Risk 7 | 2.2 | 0.0 | 2.0 | 0.0 | 0.0 | 2.0 | 0.0 | 0.0 | 0.0 | 1.0 |
| Risk 8 | 2.4 | 0.0 | 2.0 | 0.0 | 0.0 | 2.0 | 2.0 | 0.0 | 0.0 | 0.0 |
| Risk 9 | 3.0 | 0.0 | 3.0 | 2.2 | 2.0 | 1.8 | 3.0 | 1.8 | 0.0 | 1.2 |
| Risk 10 | 1.4 | 0.0 | 2.2 | 0.0 | 0.0 | 2.0 | 2.0 | 0.0 | 0.4 | 0.0 |
Table 6.
Correlation matrix of resilience capabilities.
| RC1 | RC2 | RC3 | RC4 | RC5 | RC6 | RC7 | RC8 | RC9 | RC10 | |
|---|---|---|---|---|---|---|---|---|---|---|
| RC1 | 0.0 | 2.1 | 1.3 | 2.0 | 1.3 | 2.3 | 1.9 | 2.1 | 1.0 | 1.3 |
| RC2 | 2.1 | 0.0 | 1.0 | 2.3 | 1.4 | 2.1 | 2.3 | 1.6 | 0.9 | 1.5 |
| RC3 | 1.3 | 1.0 | 0.0 | 1.4 | 2.3 | 1.3 | 1.6 | 1.6 | 2.3 | 1.6 |
| RC4 | 2.0 | 2.3 | 1.4 | 0.0 | 1.5 | 1.9 | 1.9 | 2.4 | 1.1 | 1.5 |
| RC5 | 1.3 | 1.4 | 2.3 | 1.5 | 0.0 | 1.9 | 1.6 | 1.3 | 2.4 | 1.6 |
| RC6 | 2.3 | 2.1 | 1.3 | 1.9 | 1.9 | 0.0 | 1.6 | 2.0 | 1.8 | 2.3 |
| RC7 | 1.9 | 2.3 | 1.6 | 1.9 | 1.6 | 1.6 | 0.0 | 2.1 | 1.5 | 1.8 |
| RC8 | 2.1 | 1.6 | 1.6 | 2.4 | 1.3 | 2.0 | 2.1 | 0.0 | 1.3 | 2.1 |
| RC9 | 1.0 | 0.9 | 2.3 | 1.1 | 2.4 | 1.8 | 1.5 | 1.3 | 0.0 | 1.6 |
| RC10 | 1.3 | 1.5 | 1.6 | 1.5 | 1.6 | 2.3 | 1.8 | 2.1 | 1.6 | 0.0 |
Table 7.
Relational matrix of supply chain risks and resilience capabilities.
| RC1 | RC2 | RC3 | RC4 | RC5 | RC6 | RC7 | RC8 | RC9 | RC10 | |
|---|---|---|---|---|---|---|---|---|---|---|
| Risk 1 | 1.9 | 1.9 | 2.0 | 1.6 | 1.5 | 2.3 | 1.8 | 1.3 | 2.5 | 1.6 |
| Risk 2 | 0.1 | 0.6 | 1.0 | 0.0 | 1.8 | 1.1 | 1.1 | 0.4 | 1.6 | 0.6 |
| Risk 3 | 1.9 | 1.8 | 1.4 | 2.5 | 1.1 | 2.3 | 1.5 | 2.4 | 1.3 | 1.3 |
| Risk 4 | 1.8 | 1.8 | 1.1 | 1.8 | 1.1 | 1.1 | 2.0 | 2.5 | 1.0 | 0.9 |
| Risk 5 | 0.8 | 0.5 | 0.5 | 1.6 | 0.8 | 0.9 | 1.3 | 2.1 | 1.1 | 0.8 |
| Risk 6 | 2.0 | 2.0 | 1.9 | 1.8 | 2.0 | 1.4 | 1.8 | 2.5 | 1.3 | 1.3 |
| Risk 7 | 1.6 | 1.5 | 1.6 | 1.4 | 1.6 | 1.4 | 1.8 | 1.8 | 1.6 | 2.3 |
| Risk 8 | 1.9 | 1.4 | 1.8 | 1.3 | 2.3 | 1.3 | 1.8 | 2.8 | 1.8 | 2.1 |
| Risk 9 | 1.9 | 1.8 | 1.3 | 2.4 | 1.5 | 1.3 | 1.3 | 2.5 | 0.9 | 0.9 |
| Risk 10 | 1.9 | 2.1 | 1.3 | 1.0 | 0.9 | 1.5 | 1.4 | 2.0 | 1.4 | 1.6 |
Table 8.
Integrated relational matrix by considering three matrices.
| RC1 | RC2 | RC3 | RC4 | RC5 | RC6 | RC7 | RC8 | RC9 | RC10 | |
|---|---|---|---|---|---|---|---|---|---|---|
| Risk 1 | 260.53 | 258.00 | 239.61 | 274.49 | 254.26 | 292.36 | 279.61 | 269.79 | 231.03 | 259.72 |
| Risk 2 | 259.20 | 256.74 | 240.81 | 274.44 | 259.69 | 288.01 | 278.13 | 272.01 | 229.28 | 261.59 |
| Risk 3 | 162.96 | 161.08 | 153.08 | 173.53 | 165.95 | 183.39 | 174.65 | 175.62 | 147.30 | 165.64 |
| Risk 4 | 470.10 | 467.83 | 437.64 | 492.93 | 460.96 | 527.87 | 501.65 | 487.59 | 418.22 | 471.94 |
| Risk 5 | 193.69 | 191.35 | 175.40 | 202.65 | 182.70 | 218.05 | 204.95 | 195.49 | 169.51 | 196.11 |
| Risk 6 | 267.15 | 264.16 | 246.60 | 280.95 | 269.44 | 295.96 | 285.15 | 284.34 | 235.16 | 266.12 |
| Risk 7 | 196.03 | 192.83 | 179.29 | 205.73 | 195.72 | 215.72 | 209.39 | 206.48 | 172.69 | 198.65 |
| Risk 8 | 228.76 | 226.79 | 211.67 | 239.33 | 228.85 | 253.82 | 243.54 | 243.06 | 204.12 | 230.01 |
| Risk 9 | 457.54 | 455.13 | 425.64 | 480.49 | 451.80 | 511.33 | 484.43 | 475.80 | 403.96 | 459.09 |
| Risk 10 | 216.64 | 214.82 | 199.21 | 225.75 | 213.82 | 240.39 | 230.62 | 227.82 | 192.90 | 217.15 |
Table 9.
Positive ideal solution and negative ideal solution of resilience capabilities.
| RC1 | RC2 | RC3 | RC4 | RC5 | RC6 | RC7 | RC8 | RC9 | RC10 | |
|---|---|---|---|---|---|---|---|---|---|---|
| 0.017 | 0.017 | 0.016 | 0.018 | 0.017 | 0.019 | 0.018 | 0.018 | 0.015 | 0.017 | |
| 0.006 | 0.006 | 0.006 | 0.006 | 0.006 | 0.007 | 0.006 | 0.006 | 0.005 | 0.006 |
Table 10.
Group utility and individual regret for risks and resilience capabilities.
| RC1 | RC2 | RC3 | RC4 | RC5 | RC6 | RC7 | RC8 | RC9 | RC10 | ||
|---|---|---|---|---|---|---|---|---|---|---|---|
| Risk 1 | 0.1727 | 0.1178 | 0.1181 | 0.1202 | 0.1181 | 0.1210 | 0.1181 | 0.1173 | 0.1206 | 0.1193 | 0.1197 |
| Risk 2 | 0.1280 | 0.0879 | 0.0881 | 0.0886 | 0.0876 | 0.0873 | 0.0891 | 0.0875 | 0.0885 | 0.0893 | 0.0879 |
| Risk 3 | 0.1082 | 0.1082 | 0.1082 | 0.1082 | 0.1082 | 0.1082 | 0.1082 | 0.1082 | 0.1082 | 0.1082 | 0.1082 |
| Risk 4 | 0.1056 | 0.0000 | 0.0000 | 0.0000 | 0.0000 | 0.0000 | 0.0000 | 0.0000 | 0.0000 | 0.0000 | 0.0000 |
| Risk 5 | 0.0996 | 0.0896 | 0.0898 | 0.0918 | 0.0905 | 0.0939 | 0.0896 | 0.0904 | 0.0932 | 0.0914 | 0.0897 |
| Risk 6 | 0.0902 | 0.0596 | 0.0599 | 0.0606 | 0.0599 | 0.0586 | 0.0608 | 0.0597 | 0.0588 | 0.0610 | 0.0606 |
| Risk 7 | 0.0871 | 0.0778 | 0.0781 | 0.0791 | 0.0784 | 0.0783 | 0.0790 | 0.0779 | 0.0785 | 0.0790 | 0.0777 |
| Risk 8 | 0.0728 | 0.0572 | 0.0572 | 0.0578 | 0.0578 | 0.0572 | 0.0579 | 0.0574 | 0.0570 | 0.0575 | 0.0575 |
| Risk 9 | 0.0691 | 0.0028 | 0.0029 | 0.0029 | 0.0027 | 0.0021 | 0.0033 | 0.0036 | 0.0026 | 0.0036 | 0.0029 |
| Risk 10 | 0.0666 | 0.0549 | 0.0549 | 0.0558 | 0.0557 | 0.0558 | 0.0556 | 0.0552 | 0.0554 | 0.0554 | 0.0554 |
| - | 0.6559 | 0.6572 | 0.6649 | 0.6588 | 0.6626 | 0.6615 | 0.6572 | 0.6629 | 0.6647 | 0.6596 | |
| - | 0.1178 | 0.1181 | 0.1202 | 0.1181 | 0.1210 | 0.1181 | 0.1173 | 0.1206 | 0.1193 | 0.1197 |
Table 11.
Benefit ratio for resilience capabilities.
| Coefficient v = 0.5 | RC1 | RC2 | RC3 | RC4 | RC5 | RC6 | RC7 | RC8 | RC9 | RC10 |
|---|---|---|---|---|---|---|---|---|---|---|
| Q | 0.0766 | 0.1883 | 0.8905 | 0.2750 | 0.8712 | 0.4170 | 0.0730 | 0.8303 | 0.7638 | 0.5267 |
Where .
Table 12.
Ranking weights and compromise ranking for resilience capabilities.
| RC1 | RC2 | RC3 | RC4 | RC5 | RC6 | RC7 | RC8 | RC9 | RC10 | |
|---|---|---|---|---|---|---|---|---|---|---|
| 0.6559 | 0.6572 | 0.6649 | 0.6588 | 0.6626 | 0.6615 | 0.6572 | 0.6629 | 0.6647 | 0.6596 | |
| 0.1178 | 0.1181 | 0.1202 | 0.1181 | 0.1210 | 0.1181 | 0.1173 | 0.1206 | 0.1193 | 0.1197 | |
| 0.0766 | 0.1883 | 0.8905 | 0.2750 | 0.8712 | 0.4170 | 0.0730 | 0.8303 | 0.7638 | 0.5267 | |
| Ranking | 1 | 2 | 10 | 4 | 7 | 6 | 3 | 8 | 9 | 5 |
| Ranking | 2 | 5 | 8 | 4 | 10 | 3 | 1 | 9 | 6 | 7 |
| Ranking | 2 | 3 | 10 | 4 | 9 | 5 | 1 | 8 | 7 | 6 |
| Ranking weight (1−) | 0.9234 | 0.8117 | 0.1095 | 0.7250 | 0.1288 | 0.5830 | 0.9270 | 0.1697 | 0.2362 | 0.4733 |
| Compromise ranking | 1 | 2 | 5 | 2 | 5 | 3 | 1 | 5 | 4 | 3 |
Table 13.
Resilience-enhancing features by FDM.
| Dimension | Resilience-Enhancing Feature | Gi | Rank | Selected Feature |
|---|---|---|---|---|
| Management | Reconfiguring company resources | 8.190 | 1 | RF1 |
| Strengthen staff training and leadership | 7.691 | 2 | RF2 | |
| Construct risk emergency mechanism | 6.203 | 14 | ||
| Establishing a feasible incentive system | 6.747 | 8 | RF3 | |
| Employ multiple supplier sources | 6.274 | 12 | ||
| Enterprise culture | Encourage non-hierarchical communication | 6.378 | 11 | |
| Enliven culture of trust and accountability | 6.379 | 10 | RF4 | |
| Foster awareness of environmental protection and social responsibility | 3.633 | 24 | ||
| Strictly abide by the rules and develop self-discipline | 5.909 | 16 | ||
| Relationship | On-site risk monitoring and responsibility sharing | 7.453 | 3 | RF5 |
| Recruit experts for improvement | 5.047 | 17 | ||
| Strengthen the linkage between production site and support | 3.771 | 21 | ||
| Improve and summarize customer feedback | 3.443 | 25 | ||
| Maintain communication and cooperation with customers and suppliers | 6.249 | 13 | ||
| System | Upgrade information systems that integrate resources | 6.144 | 15 | |
| Upgrade system functionality and transaction automation | 3.693 | 22 | ||
| Establish and train cross-functional organisations | 5.047 | 18 | ||
| Develop standard operating procedures | 6.888 | 6 | RF6 | |
| Improve product design and development | 3.687 | 23 | ||
| Sharing real-time job information | 7.125 | 4 | RF7 | |
| Implement concurrent engineering strategy | 6.511 | 9 | RF8 | |
| Logistics | Maintain and update equipment | 2.604 | 26 | |
| Improve facility layout | 6.842 | 7 | RF9 | |
| Arrange and reorganize storage space | 7.033 | 5 | RF10 | |
| Maintain adequate buffer stock | 4.027 | 20 | ||
| Optimize transportation modes and routes | 4.145 | 19 |
Table 14.
Compromise ranking of resilience-enhancing features.
| RF1 | RF2 | RF3 | RF4 | RF5 | RF6 | RF7 | RF8 | RF9 | RF10 | |
|---|---|---|---|---|---|---|---|---|---|---|
| 2.5787 | 2.6353 | 2.6123 | 2.6819 | 2.5562 | 2.6311 | 2.5963 | 2.7042 | 2.6523 | 2.6990 | |
| 0.5983 | 0.6245 | 0.6172 | 0.6304 | 0.6003 | 0.6274 | 0.6097 | 0.6486 | 0.6241 | 0.6435 | |
| 0.0760 | 0.5278 | 0.3778 | 0.7434 | 0.0200 | 0.5422 | 0.2494 | 1.0000 | 0.5808 | 0.9315 | |
| Ranking | 2 | 6 | 4 | 8 | 1 | 5 | 3 | 10 | 7 | 9 |
| Ranking | 1 | 6 | 4 | 8 | 2 | 7 | 3 | 10 | 5 | 9 |
| Ranking | 2 | 5 | 4 | 8 | 1 | 6 | 3 | 10 | 7 | 9 |
| Compromise ranking | 1 | 4 | 3 | 5 | 1 | 4 | 2 | 6 | 4 | 6 |
Publisher’s Note: MDPI stays neutral with regard to jurisdictional claims in published maps and institutional affiliations. |
© 2021 by the authors. Licensee MDPI, Basel, Switzerland. This article is an open access article distributed under the terms and conditions of the Creative Commons Attribution (CC BY) license (http://creativecommons.org/licenses/by/4.0/).
Share and Cite
MDPI and ACS Style
Hsu, C.-H.; Chang, A.-Y.; Zhang, T.-Y.; Lin, W.-D.; Liu, W.-L. Deploying Resilience Enablers to Mitigate Risks in Sustainable Fashion Supply Chains. Sustainability 2021, 13, 2943. https://0-doi-org.brum.beds.ac.uk/10.3390/su13052943
AMA Style
Hsu C-H, Chang A-Y, Zhang T-Y, Lin W-D, Liu W-L. Deploying Resilience Enablers to Mitigate Risks in Sustainable Fashion Supply Chains. Sustainability. 2021; 13(5):2943. https://0-doi-org.brum.beds.ac.uk/10.3390/su13052943
Chicago/Turabian StyleHsu, Chih-Hung, An-Yuan Chang, Ting-Yi Zhang, Wei-Da Lin, and Wan-Ling Liu. 2021. "Deploying Resilience Enablers to Mitigate Risks in Sustainable Fashion Supply Chains" Sustainability 13, no. 5: 2943. https://0-doi-org.brum.beds.ac.uk/10.3390/su13052943
Note that from the first issue of 2016, this journal uses article numbers instead of page numbers. See further details here.