Article

Impacts of Different Tillage Practices on Soil Water Infiltration for Sustainable Agriculture

1
Higher Institute of Agricultural Sciences, University of Sousse, 4042 Chott Meriem, Tunisia
2
School of Mechanical, Aerospace and Automotive Engineering, Faculty of Engineering, Environmental and Computing, Coventry University, Coventry CV1 5FB, UK
3
Institute for Future Transport and Cities, Coventry University, Priory Street, Coventry CV1 5FB, UK
4
Hawkesbury Institute for the Environment, Western Sydney University, LB 1797, Penrith 2751, NSW, Australia
5
Regional Centre for Field Crop Researches, 9000 Beja, Tunisia
6
Department of Zoology, University of the Punjab, Lahore 54590, Pakistan
7
International Society of Engineering Science and Technology, Coventry CV1 5EH, UK
8
Tecnologico de Monterrey, School of Engineering and Sciences, Monterrey 64849, Mexico
*
Authors to whom correspondence should be addressed.
Sustainability 2021, 13(6), 3155; https://0-doi-org.brum.beds.ac.uk/10.3390/su13063155
Submission received: 21 February 2021 / Revised: 8 March 2021 / Accepted: 9 March 2021 / Published: 13 March 2021

Abstract

:
Over the years, cultivation using sustainable tillage practices has gained significant importance, but the impact of tillage on soil water infiltration is still a concern for landowners due to the possible effects on crop yield. This study investigates the impact of different tillage managements on the infiltration rate of sandy clay loam soil under a semiarid environment. Field experiments were conducted in Chott Mariem Sousse, Tunisia. The tillage practices consisted of three treatments, including a tine cultivator (TC, 16 cm), moldboard plows (MP, 36 cm) and no-tillage (NT). Three infiltration models, Kostiakov, Philip and Horton, were applied to adjust the observed data and evaluate the infiltration characteristics of the studied soils. Comparison criteria, including the coefficient of determination (R2), along with the root mean square error (RMSE) and mean absolute error (MAE), were used to investigate the best-fit model. The results showed that moldboard plowing enhanced soil infiltration capacity relative to tine cultivation and no-tillage treatments. The mean saturated hydraulic conductivity was highest under MP, while it was lowest in NT, with 33.4% and 34.1% reduction compared to TC and MP, respectively. Based on the obtained results, Philip’s model showed better results with observed infiltration due to a higher R2 (0.981, 0.973 and 0.967), lower RMSE (3.36, 9.04 and 9.21) and lower MAE (1.46, 3.53 and 3.72) recorded, respectively, for NT, MP and TC. Horton’s model had a low regression coefficient between observed and predicted values. It was suggested that the Philip two-term model can adequately describe the infiltration process in the study area.

1. Introduction

Conservation agriculture (CA) proceeds in a way to minimize harm to the environment [1], and there is a need to fulfill necessary requirements in facilitating investment in sustainable agriculture practices [2]. Agriculture in semiarid regions is facing great challenges related to water resource availability. Hence, increasing water use efficiency (WUE) through water management strategies is crucial, especially from the perspective of climate change. In the last fifteen years, irrigated lands have doubled more than six times in Tunisia. Irrigated farms represent 8% of the total cultivable land and contribute 35% to agricultural products [3]. Rapid infiltration of water is essential for reducing erosion potential and increasing water storage in semiarid and arid areas [4], and it is regarded as one of the most crucial parameters for irrigation in the agriculture sector [5]. Understanding the process of infiltration is crucial for agriculture, watershed management and hydrology [6], as it helps in the description of hydrological processes that possess significant importance in the design of hydraulic structures [7]. Soil water infiltration can be affected by various factors, including vegetal and tillage cover, soil porosity, density, surface roughness, organic carbon, stability level and size of the aggregates and water content in the soil [8].
Numerous models have been developed to estimate infiltration and help design irrigation schemes, and field management and can be divided into three groups [9,10]. The first group includes the physical models inferred from the law of mass conservation and Darcy’s law [11]. The second group is of semiempirical models, which includes simple hypotheses about the correlation between the infiltration rate and cumulative infiltration [12], and finally, the third group of empirical models comprises the field data and laboratory experiments [13,14]. From the proposed infiltration models, only a few have been successfully applied to the field data under specific conditions. The research conducted on a wasteland in Kharagpur, India, indicated the Philip two-term infiltration model to be most suitable for the entire study area [15]. In a study, the analytical models such as empirical models (Kostiakov, Kostiakov–Lewis and Horton models) and the Philip model were widely used to predict the infiltration functions in surface irrigation, and it was concluded that the Kostiakov–Lewis model showed the best relationship between time and cumulative infiltration [16].
Another study, which was based on the uncertainty analysis of different infiltration models, suggested that the Phillip two-term model indicated the widest (8.23 mm/min) 95% confidence band, followed by the Kostiakov–Lewis model, Stroosnijder model and other models, indicating that they have poor predictability [17]. Recently, for more sustainable and productive agriculture, the use of the decision support system (DSS) is significantly increasing in the agricultural sector because of increasing climate change. This system can collect and analyze different types of data using various mathematical models [18]. As the sustainability of agricultural production has become an issue of wide public concern, the impacts of different soils and land management strategies on soil hydraulic properties have been a subject of extensive research [19,20]. Soil moisture can be regarded as a vital component in plant growth and a basic ecosystem resource in the terrestrial vegetation, managing plant transpiration [21]. In agricultural systems, the soil infiltration rate is mainly affected by tillage and increases with its intensity [22]. The physical properties of soil with respect to different tillage systems have been thoroughly documented, but there is a need for a systematic synthesis to understand how such practices can affect the physical properties of soil around the world and how changes in physical properties of soil are associated with various ecological components [23].
The literature on tillage-related effects on soil water movement suggests that the magnitude of the effects of tillage on infiltrability could vary with factors, including soil structure, aggregation and soil water content, porosity, organic matter and texture [24,25]. However, under conventional tillage, land preparation and its interaction with soil physical properties affect water infiltration [26]. Studies have compared the impact of four land-use systems of sustainable and conventional tillage on the hydraulic properties of soil, finding that tillage management had the most pronounced influence on the infiltrability of the topsoil layer [26,27]. A study suggested that under primary tillage practices, infiltration is increased with an increase in soil porosity and with the formation of voids in the upper layer of the soil that conducts water into the soil profile. However, secondary tillage-reduced pores broke the channel continuity and filled most of the voids [28]. Research was carried out to evaluate the effect of 36 years of conventional tillage to no-tillage on the physical properties of soil and indicated that long-term tillage had minimal effect on factors such as bulk density, total porosity and air-filled porosity. However, it was suggested that there was a 26% increase in water-holding capacity with no-tillage compared to conventional tillage [29].
In Tunisia, in the past few decades, there has been an increasing interest in conservation tillage as a tool for sustainable soil management. Consequently, better and clearer information regarding the impacts of such tillage systems on soil water infiltration is required by the decision-makers, and infiltration rate estimation models have proven to be efficient for this purpose. Therefore, this study is aimed to investigate the short-term impacts of tillage management (moldboard plow, tine cultivation, no-tillage) on the infiltration capacity of a sandy clay loam soil and to examine the performance of three infiltration models, including the Kostiakov, Philip and Horton models, in predicting water infiltration rates under the three tillage treatments. The information obtained from this research could help to evaluate surface irrigation systems in the study area.

2. Materials and Methods

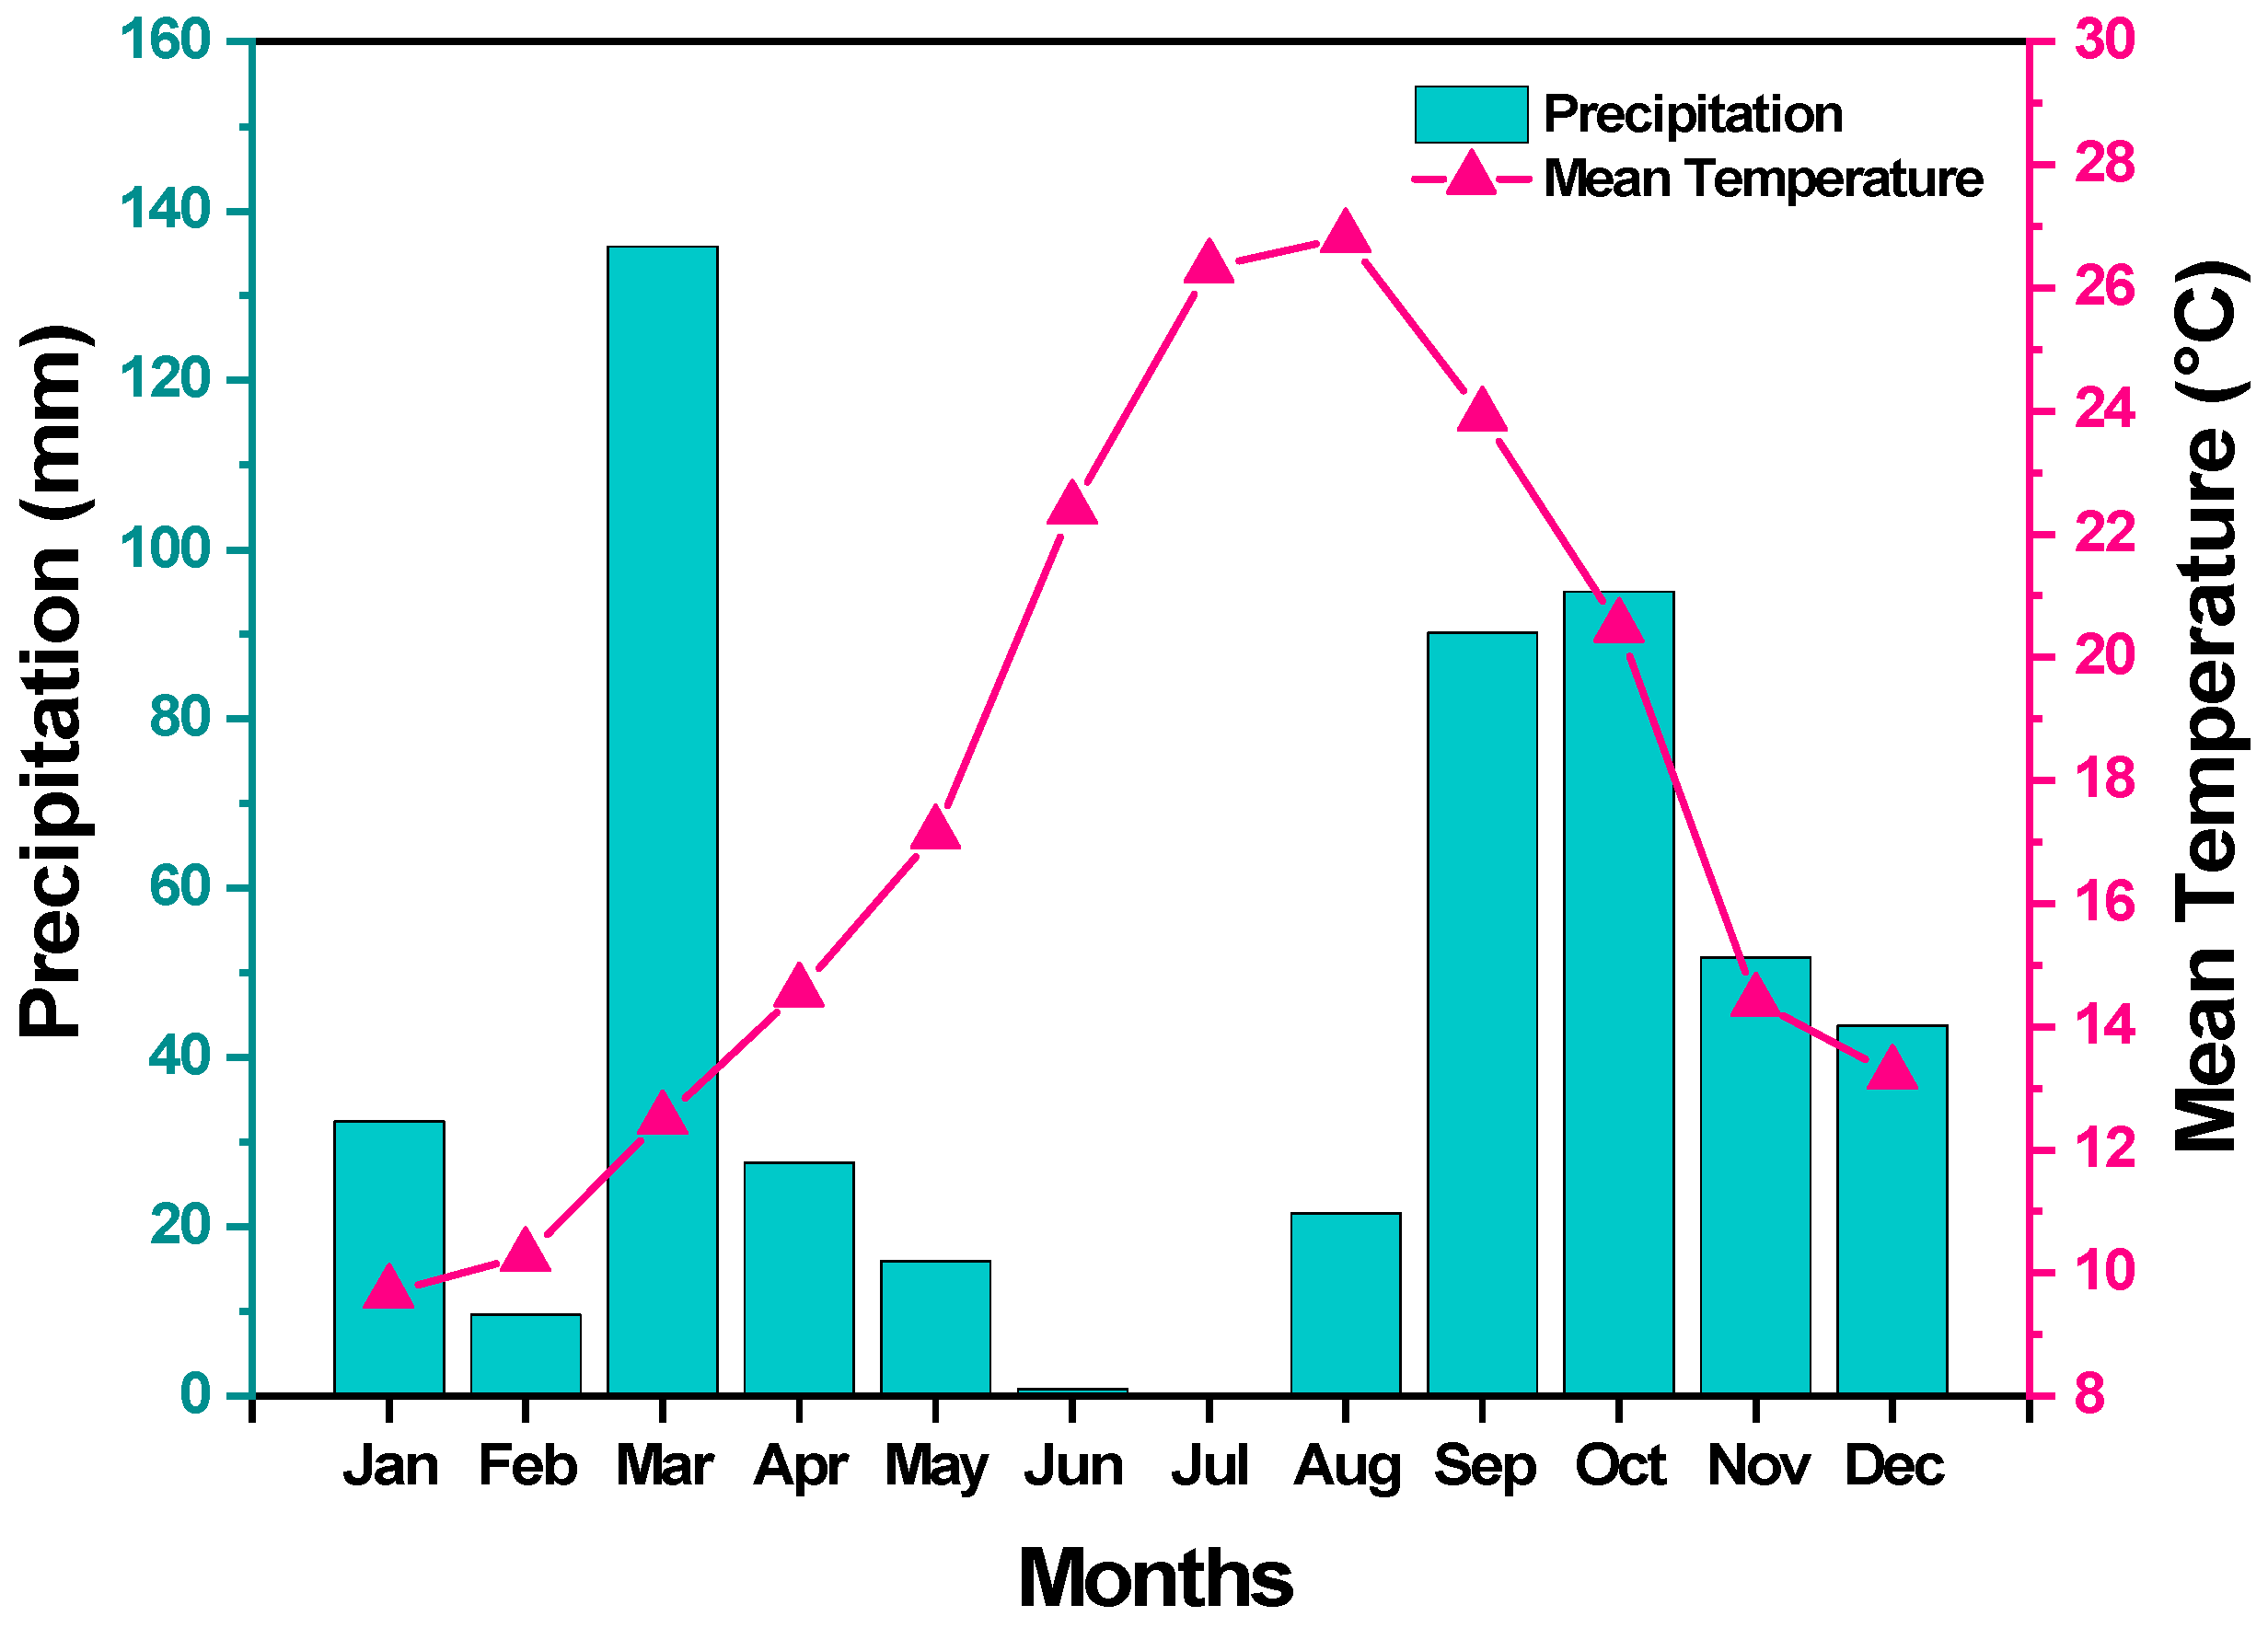
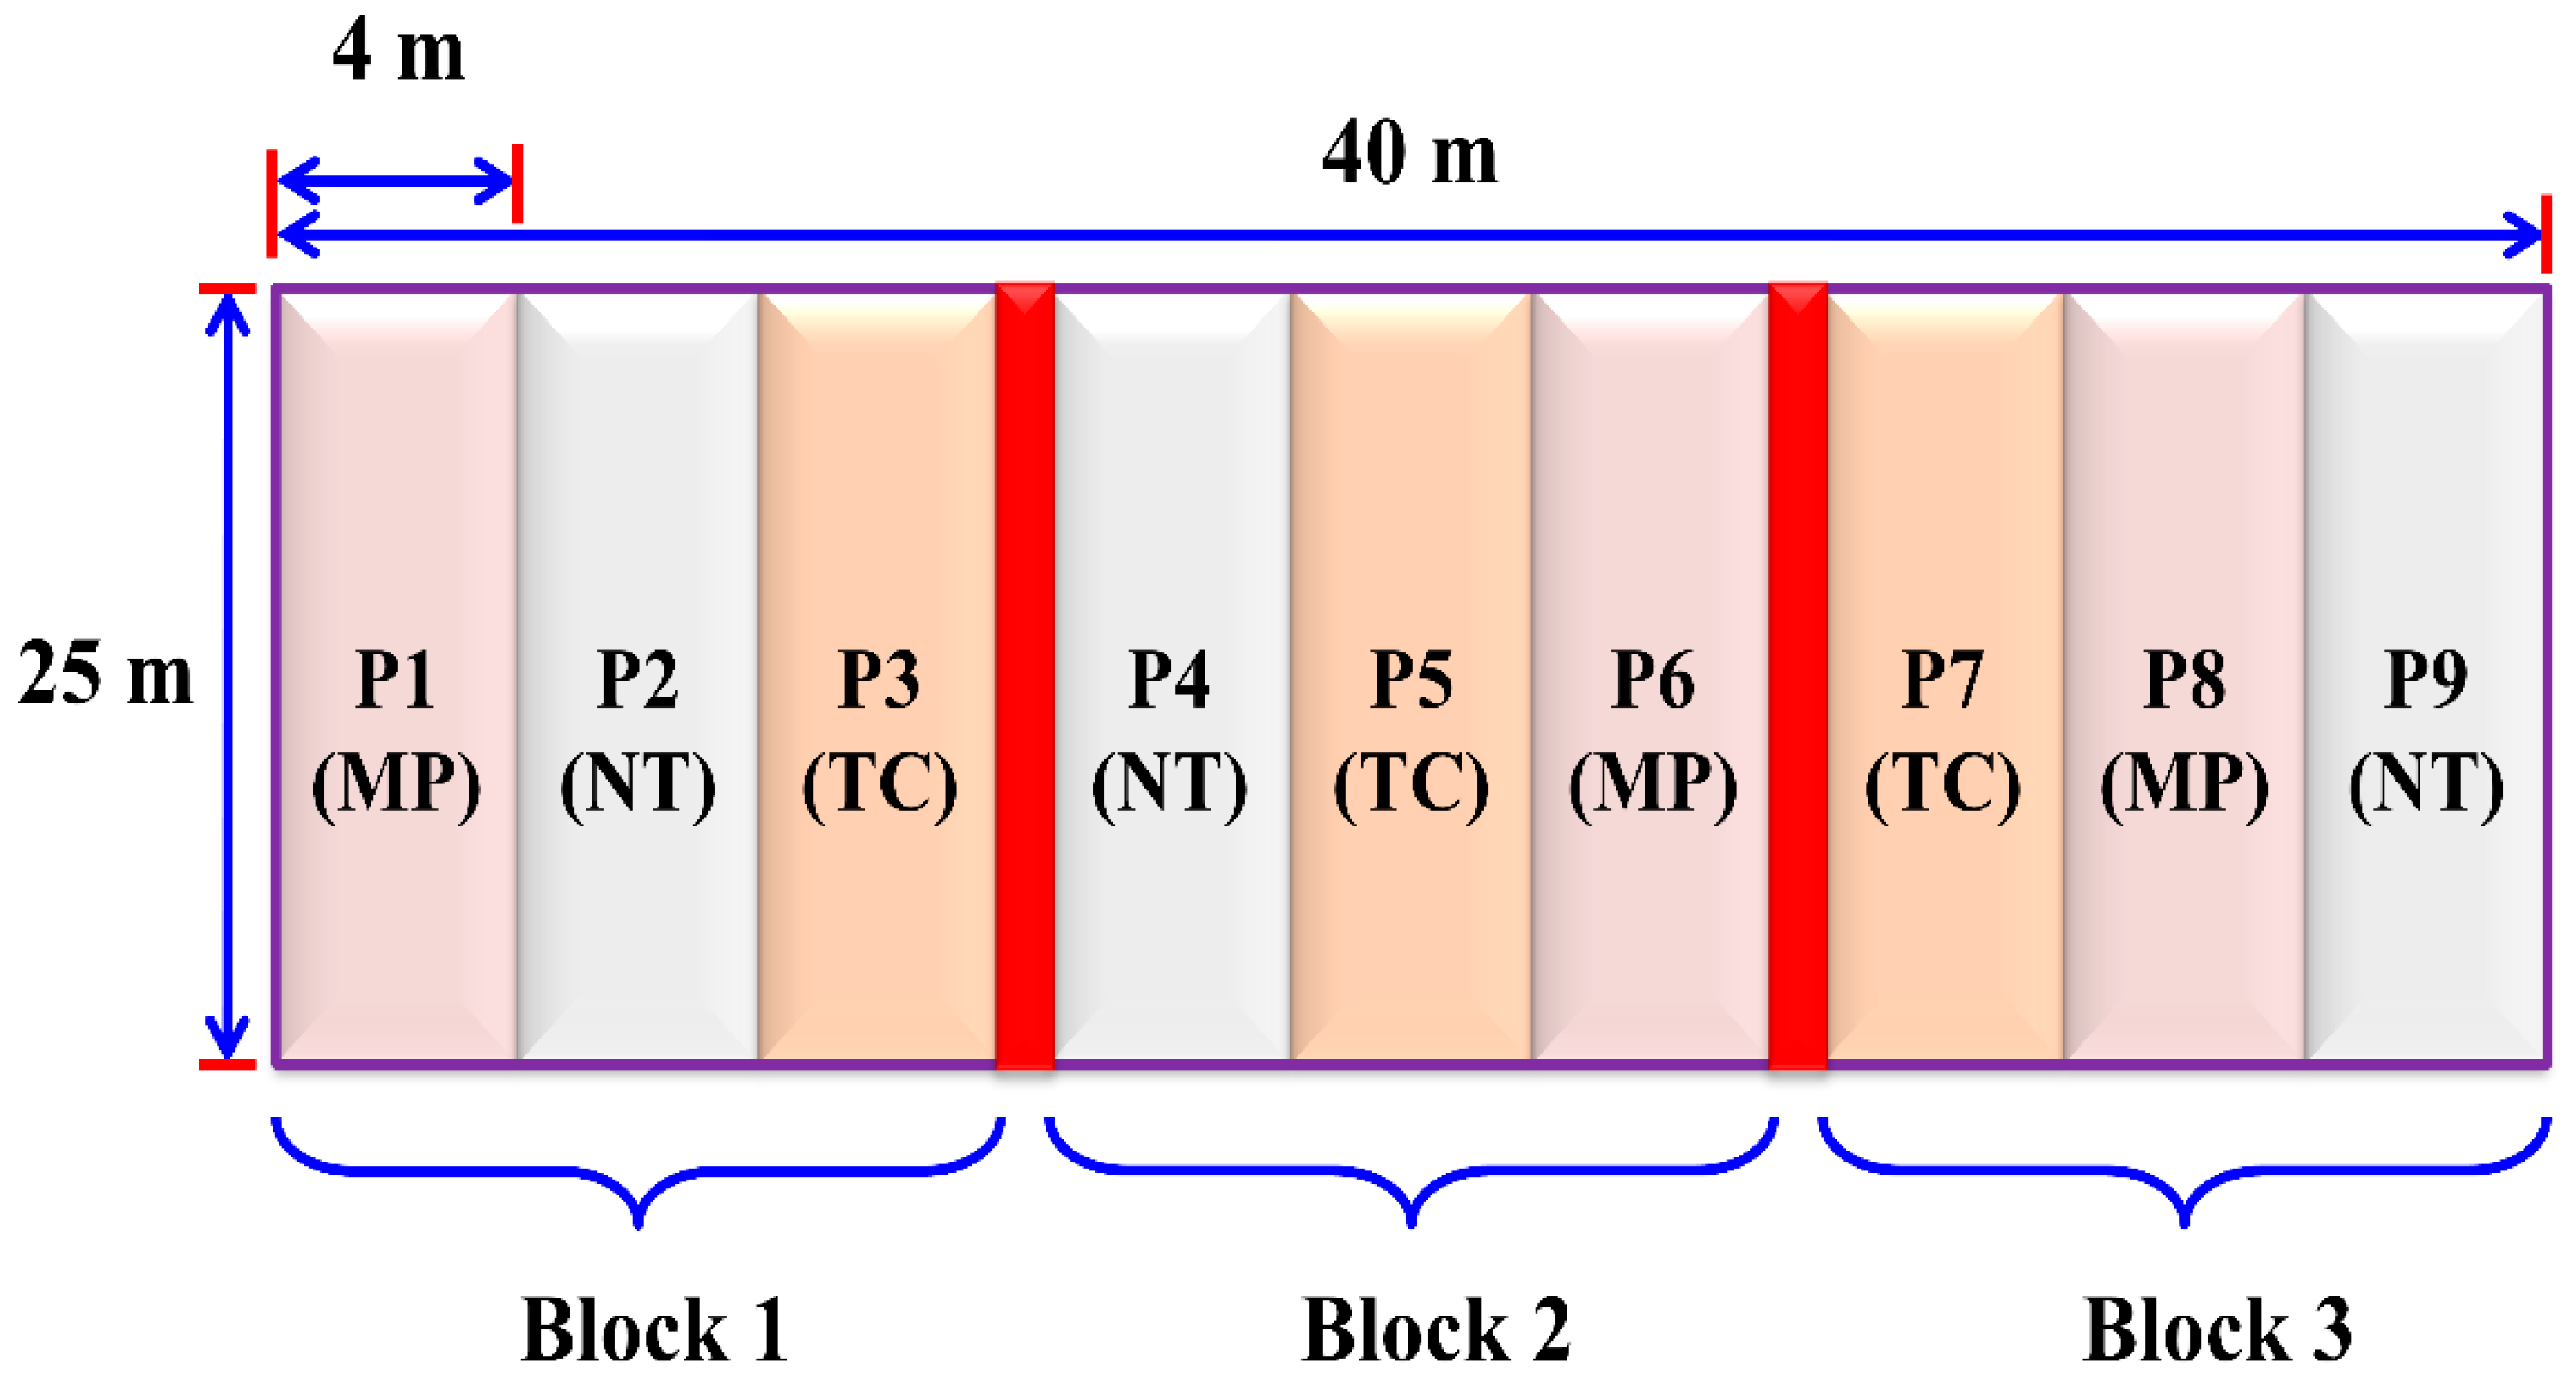
2.1. Characterizations of the Study Area, Soil Properties and Experimental Layout

The research was carried out at the experimental station of the Technical Center of Organic Farming located in Sousse of Eastern Central Tunisia (latitude: 35.55 °N; longitude: 10.34 °W) and at altitudes of 12 m above sea level. According to the measured data acquired by the Meteorological Service of the Technical Center of Organic Farming, the area is characterized by a semiarid climate with hot, dry summers and mild, rainy winters. The minimum and maximum temperatures are seen in January and July, respectively. The mean daily temperature ranges from 6.37 to 31.05 °C, with an average annual of 17.7 °C (Figure 1). The mean annual precipitation for the studied region is 450 mm, falling mostly between September and April (Figure 1). However, the precipitation is mainly concentrated in autumn and winter.
According to the USDA classification, the top layer of the soil (0–10 cm) is a sandy clay loam. During the investigation period, the main physical and chemical properties of the soil (bulk density, penetration resistance and total porosity) were studied. Results of this characterization are presented in Table 1.
The field was sown with the winter faba bean (Vicia faba L.) grown under no-tillage, minimum-tillage and deep-tillage treatments. It was designed as a randomized block with three replicates (blocks), each consisting of 40 × 25 m, separated by 2 m spacing and divided into subplots (P1 through P9). The tillage treatments were: (1) deep tillage to 36 cm by a moldboard plow (MP), (2) shallow tillage by a tine cultivator (TC) and (3) no-tillage (NT) as the control treatment (Figure 2).

2.2. Soil Water Infiltration Measurement

The water infiltration was measured within each replicate plot with the help of a double-ring infiltrometer [36], consisting of double concentric stainless-steel rings, a driving plate with handles for inner (23 cm) and outer rings (36 cm). The two rings driven into the ground were partially filled with water to determine the infiltration capacity of the soil. Measurements were conducted by maintaining a constant water column of 30 mm in the outer and inner rings. The initial soil water content corresponded to approximate field capacity and continued until the infiltration rate became steady or until it became equal to, or less than, a specified value. All experiments were conducted in daylight during the same time to have the same climatic conditions.

2.3. Infiltration Rate Estimation Models

Infiltration (noted i) can be defined as the variation of the infiltrated water in the soil (noted I) over time (Equation (1)).
i ( t ) = d ( I ) d ( t )
Three infiltration models, including Kostiakov, Philips and Horton, were chosen for this investigation based on their practical performance and popularity in existing studies. The data of infiltration rate and cumulative infiltration acquired from the field experiments (9 plots) were predicted by these infiltration models, and a linear curve fitting was used for the infiltration tests’ data to obtain the parameters of the infiltration equations. The fitness of these three model parameters was evaluated according to the OriginLab 8.5 packages. A compressive description of the selected infiltration models is given below.

2.3.1. Philip Model

The infiltration model proposed by Philip included the soil sorptivity (S) and stable infiltration rate (A) from the series of solutions from the Richards equation [11]. For “cumulative infiltration (I),” the two-term infiltration equation of Philip is expressed by Equations (2) and (3).
I ( t ) = A t + S t 1 / 2
The differentiation of Equation (1) yields the following equation for “infiltration rate (i).”
i ( t ) = ( S t 1 / 2 2 ) + A
where i(t) and I(t) represent infiltration rate and the cumulative infiltration, respectively, at infiltration time t. A is related to saturated hydraulic conductivity (Ksat), S is the soil water sorptivity term and t is the time elapsed.

2.3.2. Kostiakov Model

Kostiakov proposed one of the earliest empirical infiltration models (Hillel, 1982). With the help of experimental data, he proposed the following model for estimating “infiltration rate” (Equation (4)) [13].
i ( t ) = a t b
where i(t) is the infiltration rate (mm.min−1) at time t (min), and >0 (Kostiakov’s time coefficient) and 0 < b < 1 (Kostiakov’s time exponent) are the Kostiakov model parameters that depend on the soil texture and conditions, including initial moisture content. The integration of Equation (4) gives the expression of cumulative infiltration I(t) in mm, as given in Equation (5).
I ( t ) = ( a 1 b ) t 1 b

2.3.3. Horton Model

Horton [14] proposed an infiltration model for the simulation of the infiltration process, as represented in Equation (6).
f p f c = ( f 0 f c ) e k t
where fp, fc and f0 indicate the infiltration rates at time t (min), final infiltration rate and infiltration rate at t = 0, respectively, k is the empirical constant representing the delay of time and e is a constant (~2.71828).

2.4. Model Performance Evaluation Criteria

To select a suitable model between Philip, Horton and Kostiakov, there are various approaches, but the simplest is to compare the difference between observed and fitted cumulative infiltration. Three performance evaluation parameters such as root mean square error (RMSE), mean absolute error (MAE) and coefficient of determination (R2) were considered to determine the best model for estimating the cumulative infiltration. The parameter estimation technique with lower values of MAE and RMSE and higher values of R2 was considered providing better fitness of the observed model-predicted cumulative infiltration (pi) and cumulative infiltration in the field (mi). The RMSE, MAE and R2 were calculated using Equations (7) and (8) [37,38]
RMSE = i = 1 n ( p i m i ) 2 n
R 2 = i = 1 n ( p i p ) 2 i = 1 n ( m i m ) 2
MAE = i = 1 n ( | p i m i | ) n
where n indicates the total number of cumulative infiltration samples, pi represents the mean simulated cumulative infiltration and mi is the mean observed cumulative infiltration. The RMSE provides an overall idea of the dispersion between measured and predicted cumulative infiltration.

3. Results and Discussion

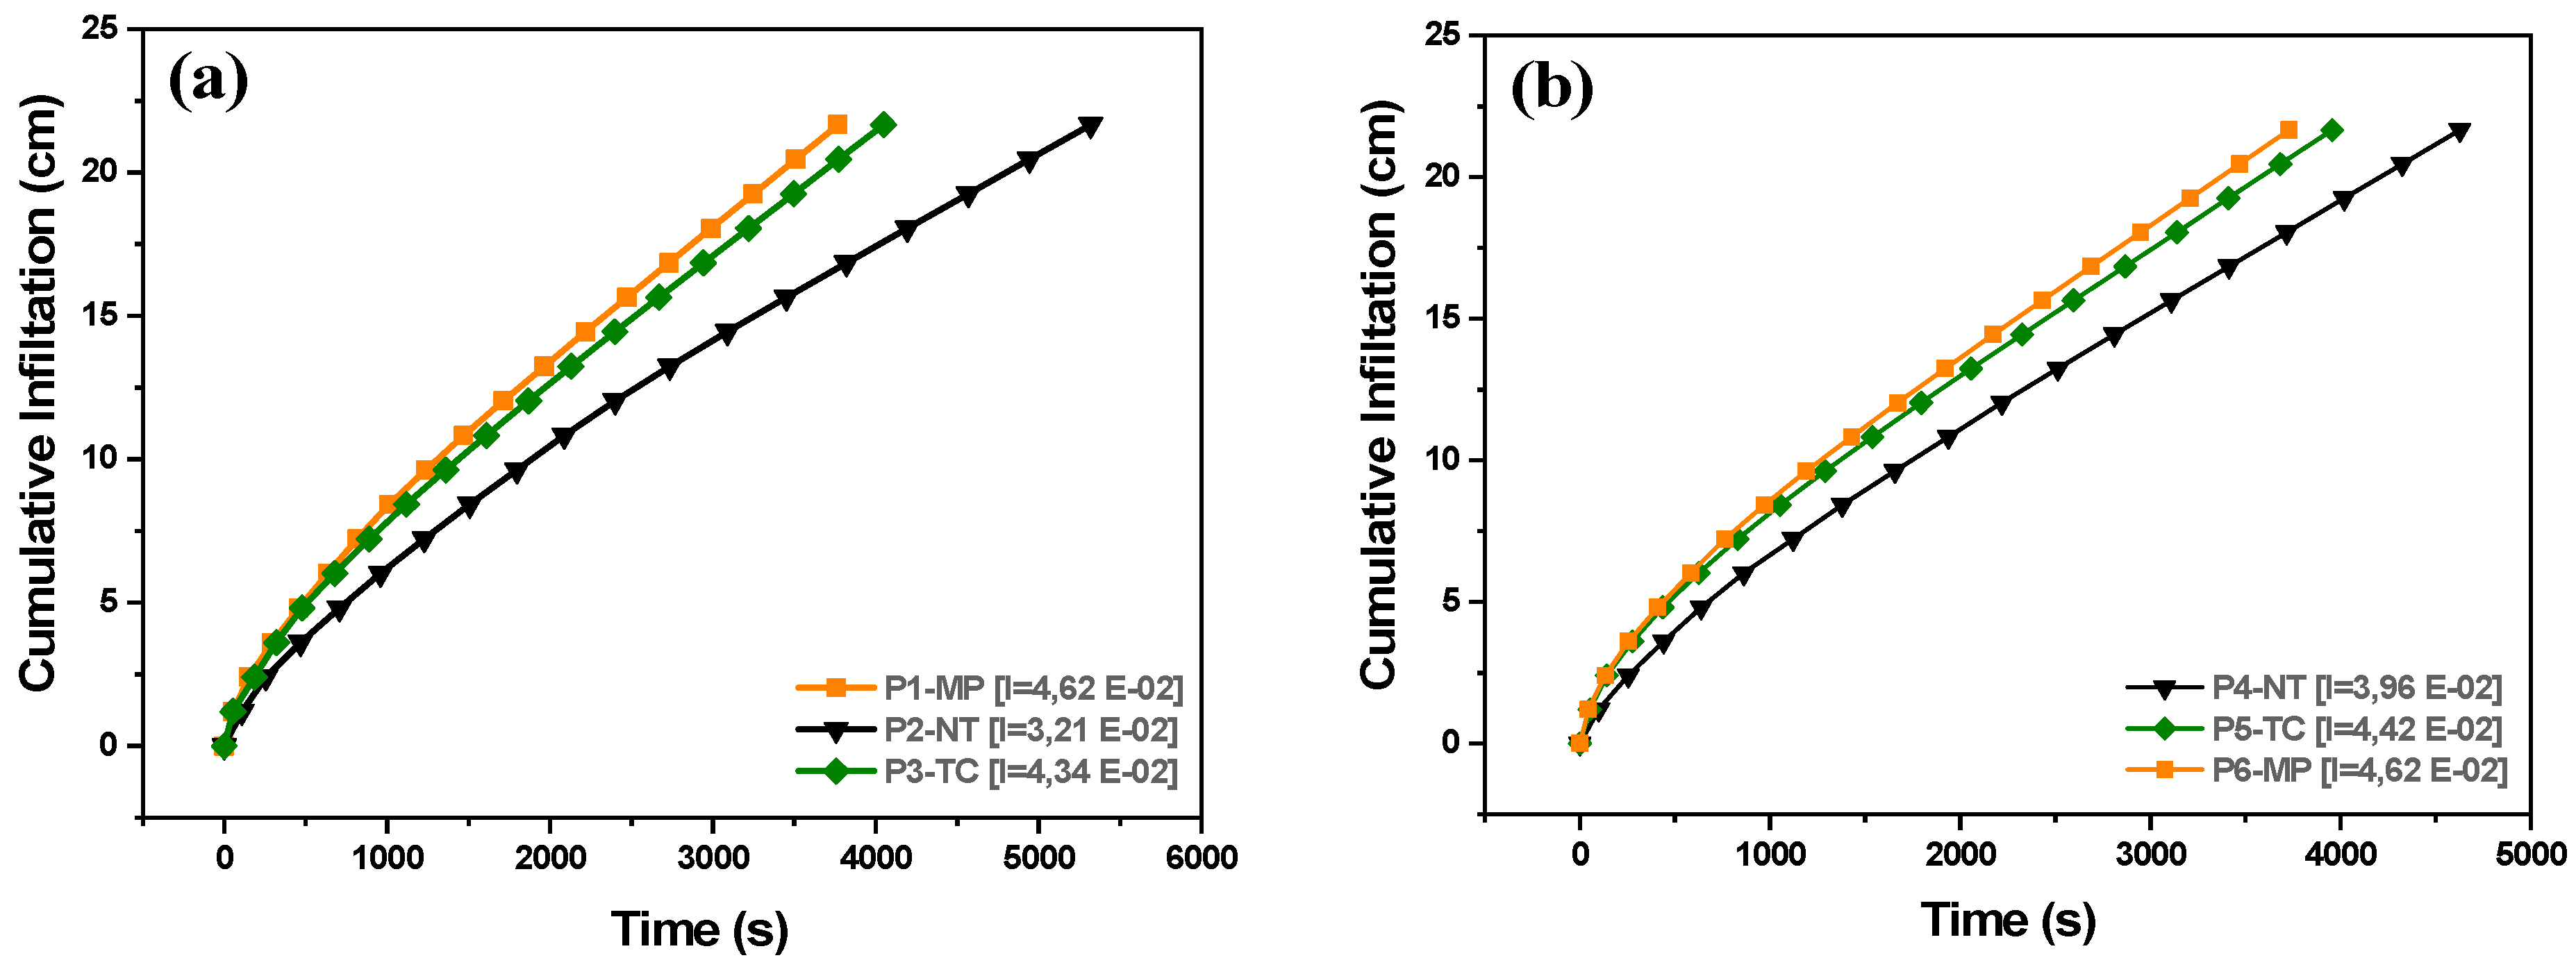
3.1. Effect of Tillage Practices on Measured Soil Water Infiltration

In each tillage treatment, measured infiltration rates in all plots were initially high and declined gradually toward a steady rate (Figure 3a, b). These findings are consistent with those reported by Fan et al. [39]. For example, the mean infiltration rate under moldboard plow (MP) and tine cultivator (TC) was greater than under no-tillage (NT) management by 7 and 5.6 cm/h at 5 min and by 4.6 and 2.5 cm/h at 60 min, respectively. After 60 min of measurement, there was no difference in infiltration rates between NT, TC and MP tillage. During the steady-state, the Ksat ranged from 0.0462 to 0.0471 cm/s in MP, 0.0434 to 0.0485 cm/s in TC and from 0.0214 to 0.0396 cm/s in NT. The variation in Ks values in soil was likely due to differences in soil disturbance.
However, NT decreased water infiltration rates between 34.1% and 33.4% compared with MP and TC, respectively (Figure 3a). Studies have inferred that no-till management may increase [40] or decrease [41] water infiltration compared with plow-tilled systems. Based on this consideration, the results suggest that tilled soils can take in the water at a faster rate than untilled soil. This could be due to the porous nature of tine cultivator tillage and considering the fact that the soil is more loosened and finer than other tillage treatments [42]. These findings are in agreement with previous studies [43,44] but disagree with some other researchers [45,46]. Somewhat contrary to a conventional understanding regarding NT, a review of experiments in the Argentine Pampas found that no-till doubled infiltration rates [47]. Generally, there were no significant differences among the tillage treatments in the values for saturated hydraulic conductivity, and the same trends were observed by other studies [48,49].

3.2. Parameter Estimation for the Infiltration Models

The estimated parameter values for the three selected infiltration models (Philip, Kostiakov and Horton) are listed in Table 2. The fitted infiltration model parameters (S, A, a, b, fc, f0 and k) varied among treatments. This variation is mainly related to soil physical and hydrological properties as affected by tillage operations [50].
The results in Table 2 revealed that Kostiakov’s time coefficient (a) was highest under CT (0.069 cm/min), followed by MT (0.062 cm/min), while the lowest coefficient was observed under NT treatment (0.043 cm/min). Another research obtained similar results and determined that coefficient (b) was the largest for conventional tillage and the least for no-tillage [50]. Another study considered that the parameter (a) in Kostiakov’s model is an index of infiltrability at the beginning of the infiltration process [51]. Some studies [52,53] associated higher infiltration with higher Kostiakov’s a, while lower infiltration was associated with lower values. The mean values of Kostiakov’s exponent coefficient (b) were observed as 0.700, 0.706 and 0.745 for MP, TC and NT, respectively. These (b) values were in concordance with the theory of infiltration, whereby the values were positive and always less than unity. Another study obtained similar results with Kostiakov’s exponent coefficient b, ranging between 0.781 and 0.785 [53].
The nonlinear three-parameter Horton (1940) model showed that fc and f0 were the highest (16.77 and 21.85 cm/min) for MP and the lowest (11.90 and 14.46 cm/min) for the NT treatment (Table 2). The parameter k, which reflects the steepness of initial portions of the infiltration curve, was the largest for MP (3.39) and the least for NT (2.29). These findings contradict the study reported in the literature [50]. The S parameter of the Philip model and i0 of the Horton model depends on initial soil infiltration rates, and both parameters were the largest for the MP treatment. This result suggests that tillage with moldboard plow increases the water transmission properties of soil.
Table 2 shows the mean values of the Philip model parameters (S) that were 0.17, 0.147 and 0.116 cm/min1/2, while the values of (A) were 0.0031, 0.0032 and 0.002 cm/min for MP, TC and NT, respectively. Therefore, the variations in parameter S of Philip’s model may be related to the differences in the continuity and arrangement of soil pores caused or left intact by tillage treatments. A study also showed higher vertical connectivity and continuity of macrospores in conservation tillage than in MP treatments [54]. Additionally, the results showed the highest values for NT, whereas the lowest values occurred under the TC treatment. This contradicts with the present study findings because the parameter S of Philip’s model is highest under MP treatment (0.170 cm/min1/2) and lowest under NT (Table 2). The reason for our higher values of S and A may be attributed to the loamy sand texture and higher permeability of the soil. Some researchers have also concluded in their research work the existence of a close relationship between Philip’s parameters (S, A) with soil permeability and the capacity of infiltration [55].

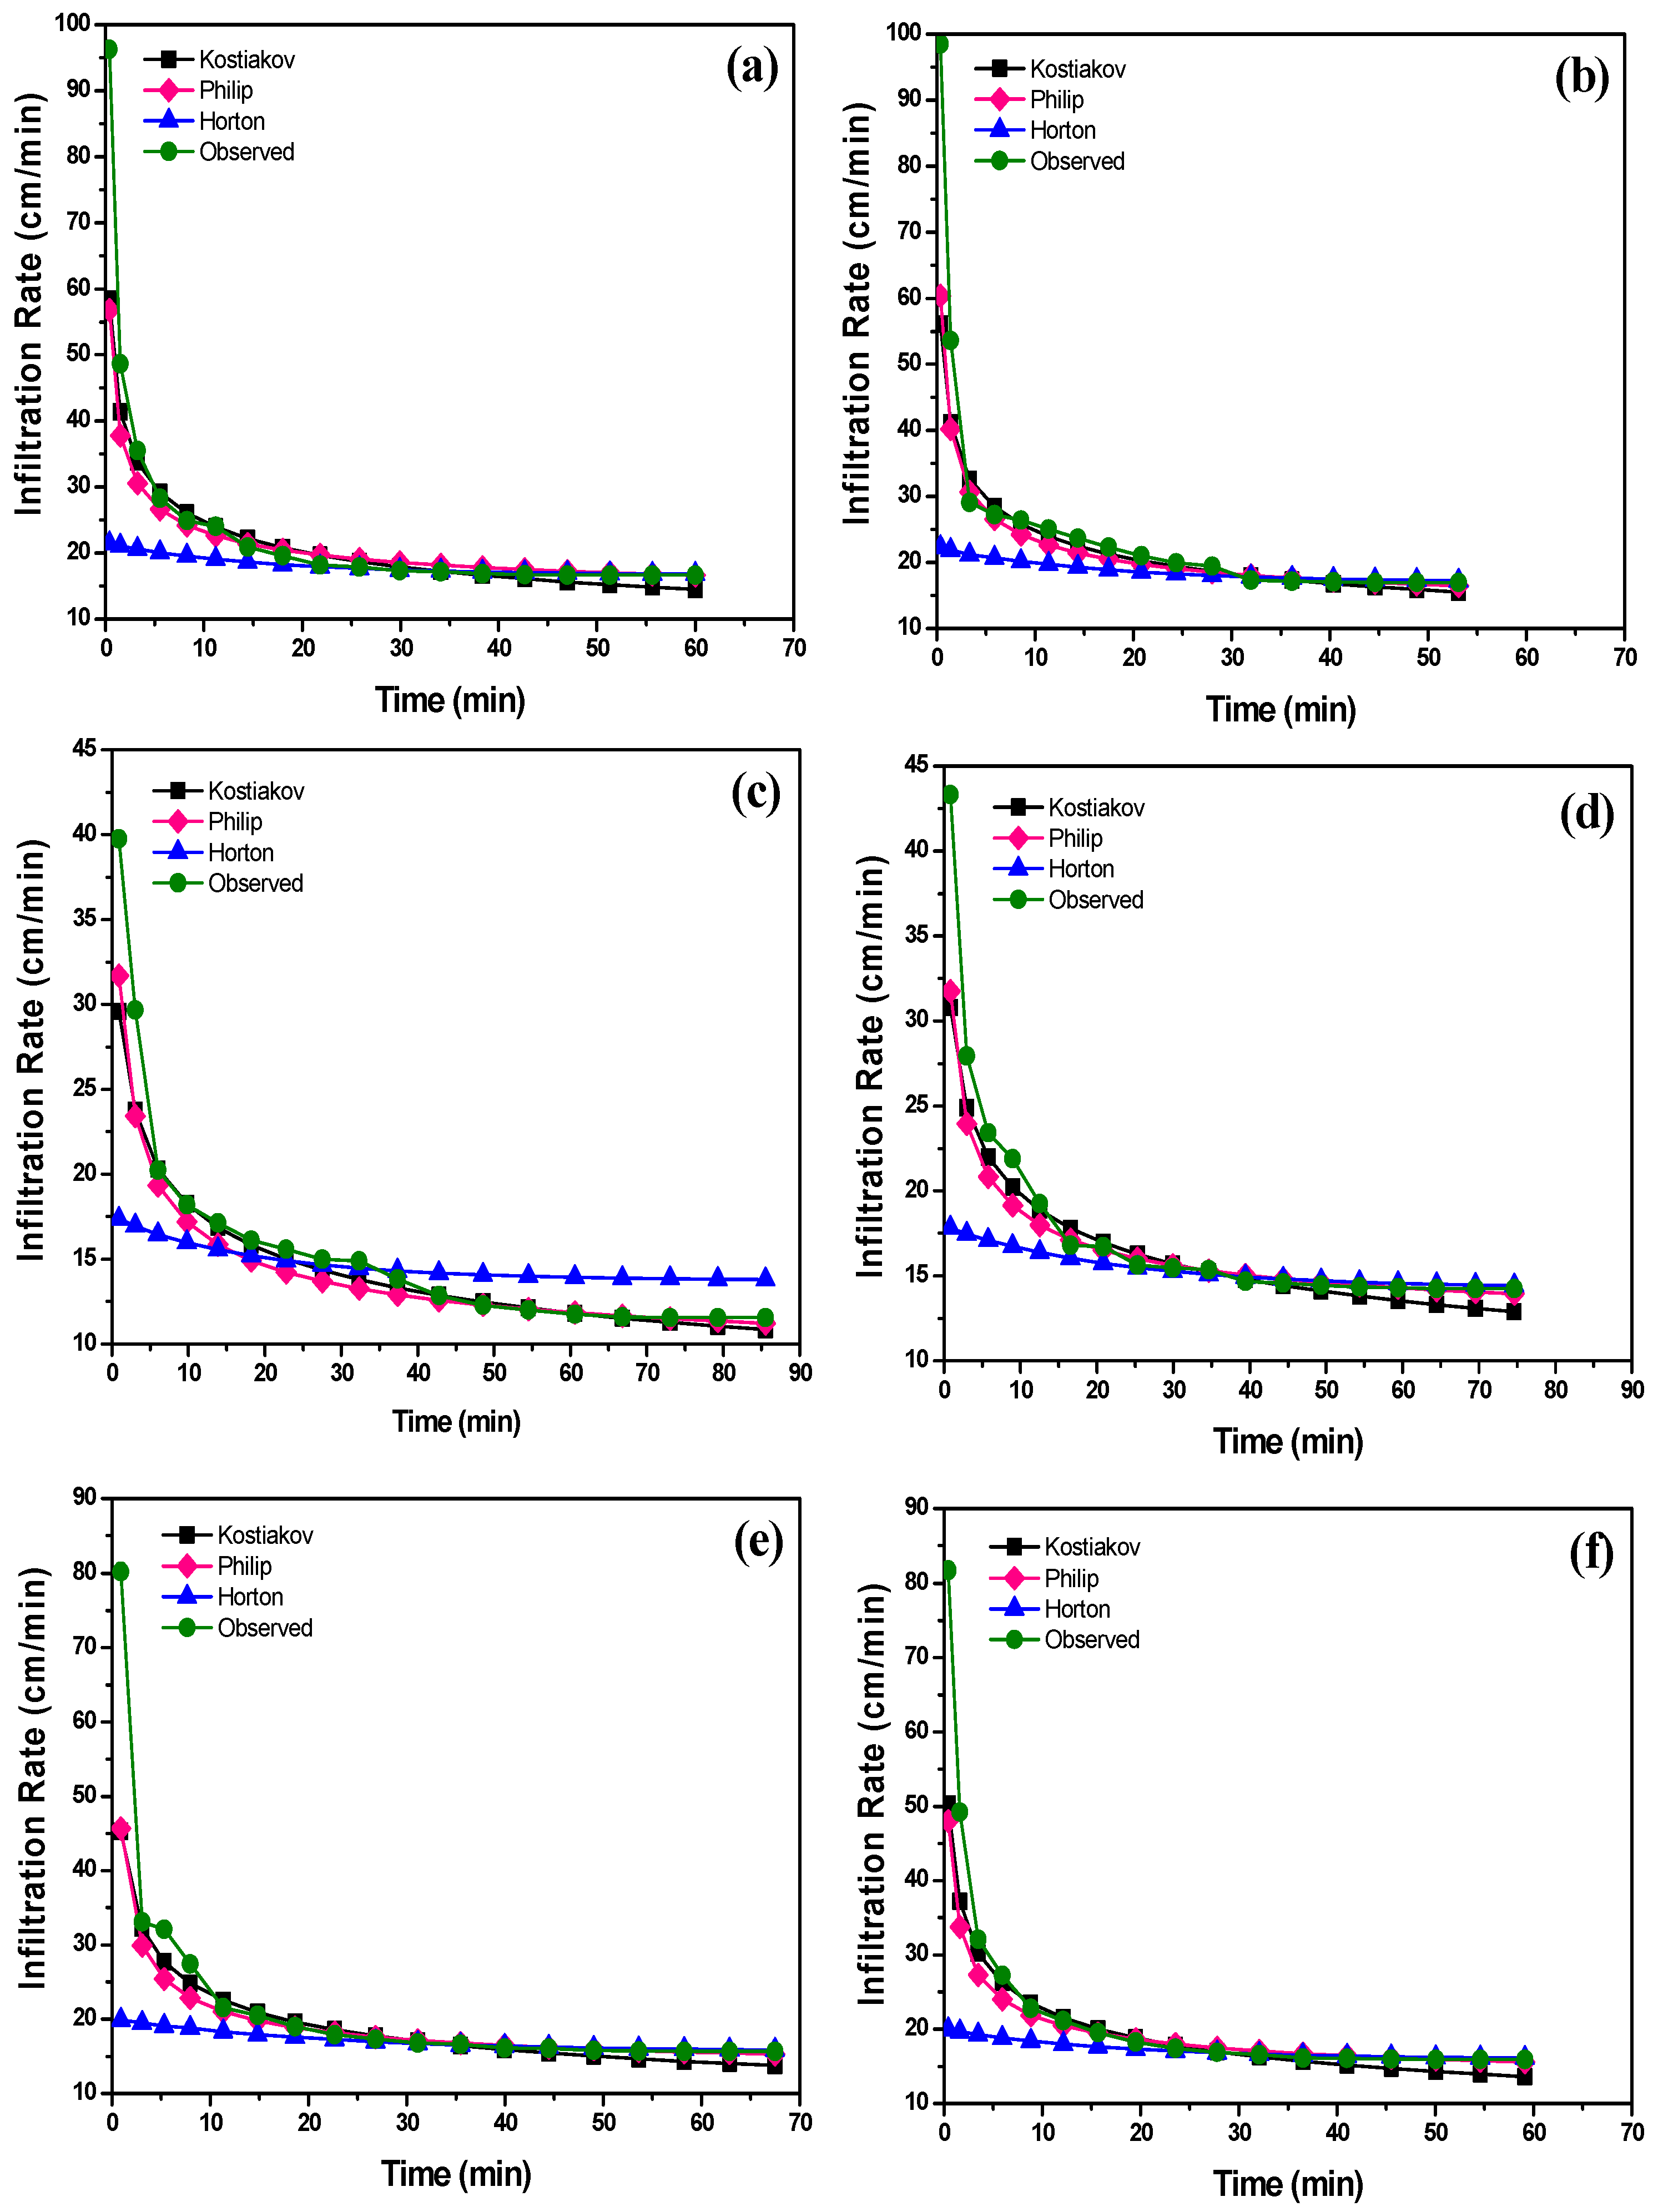
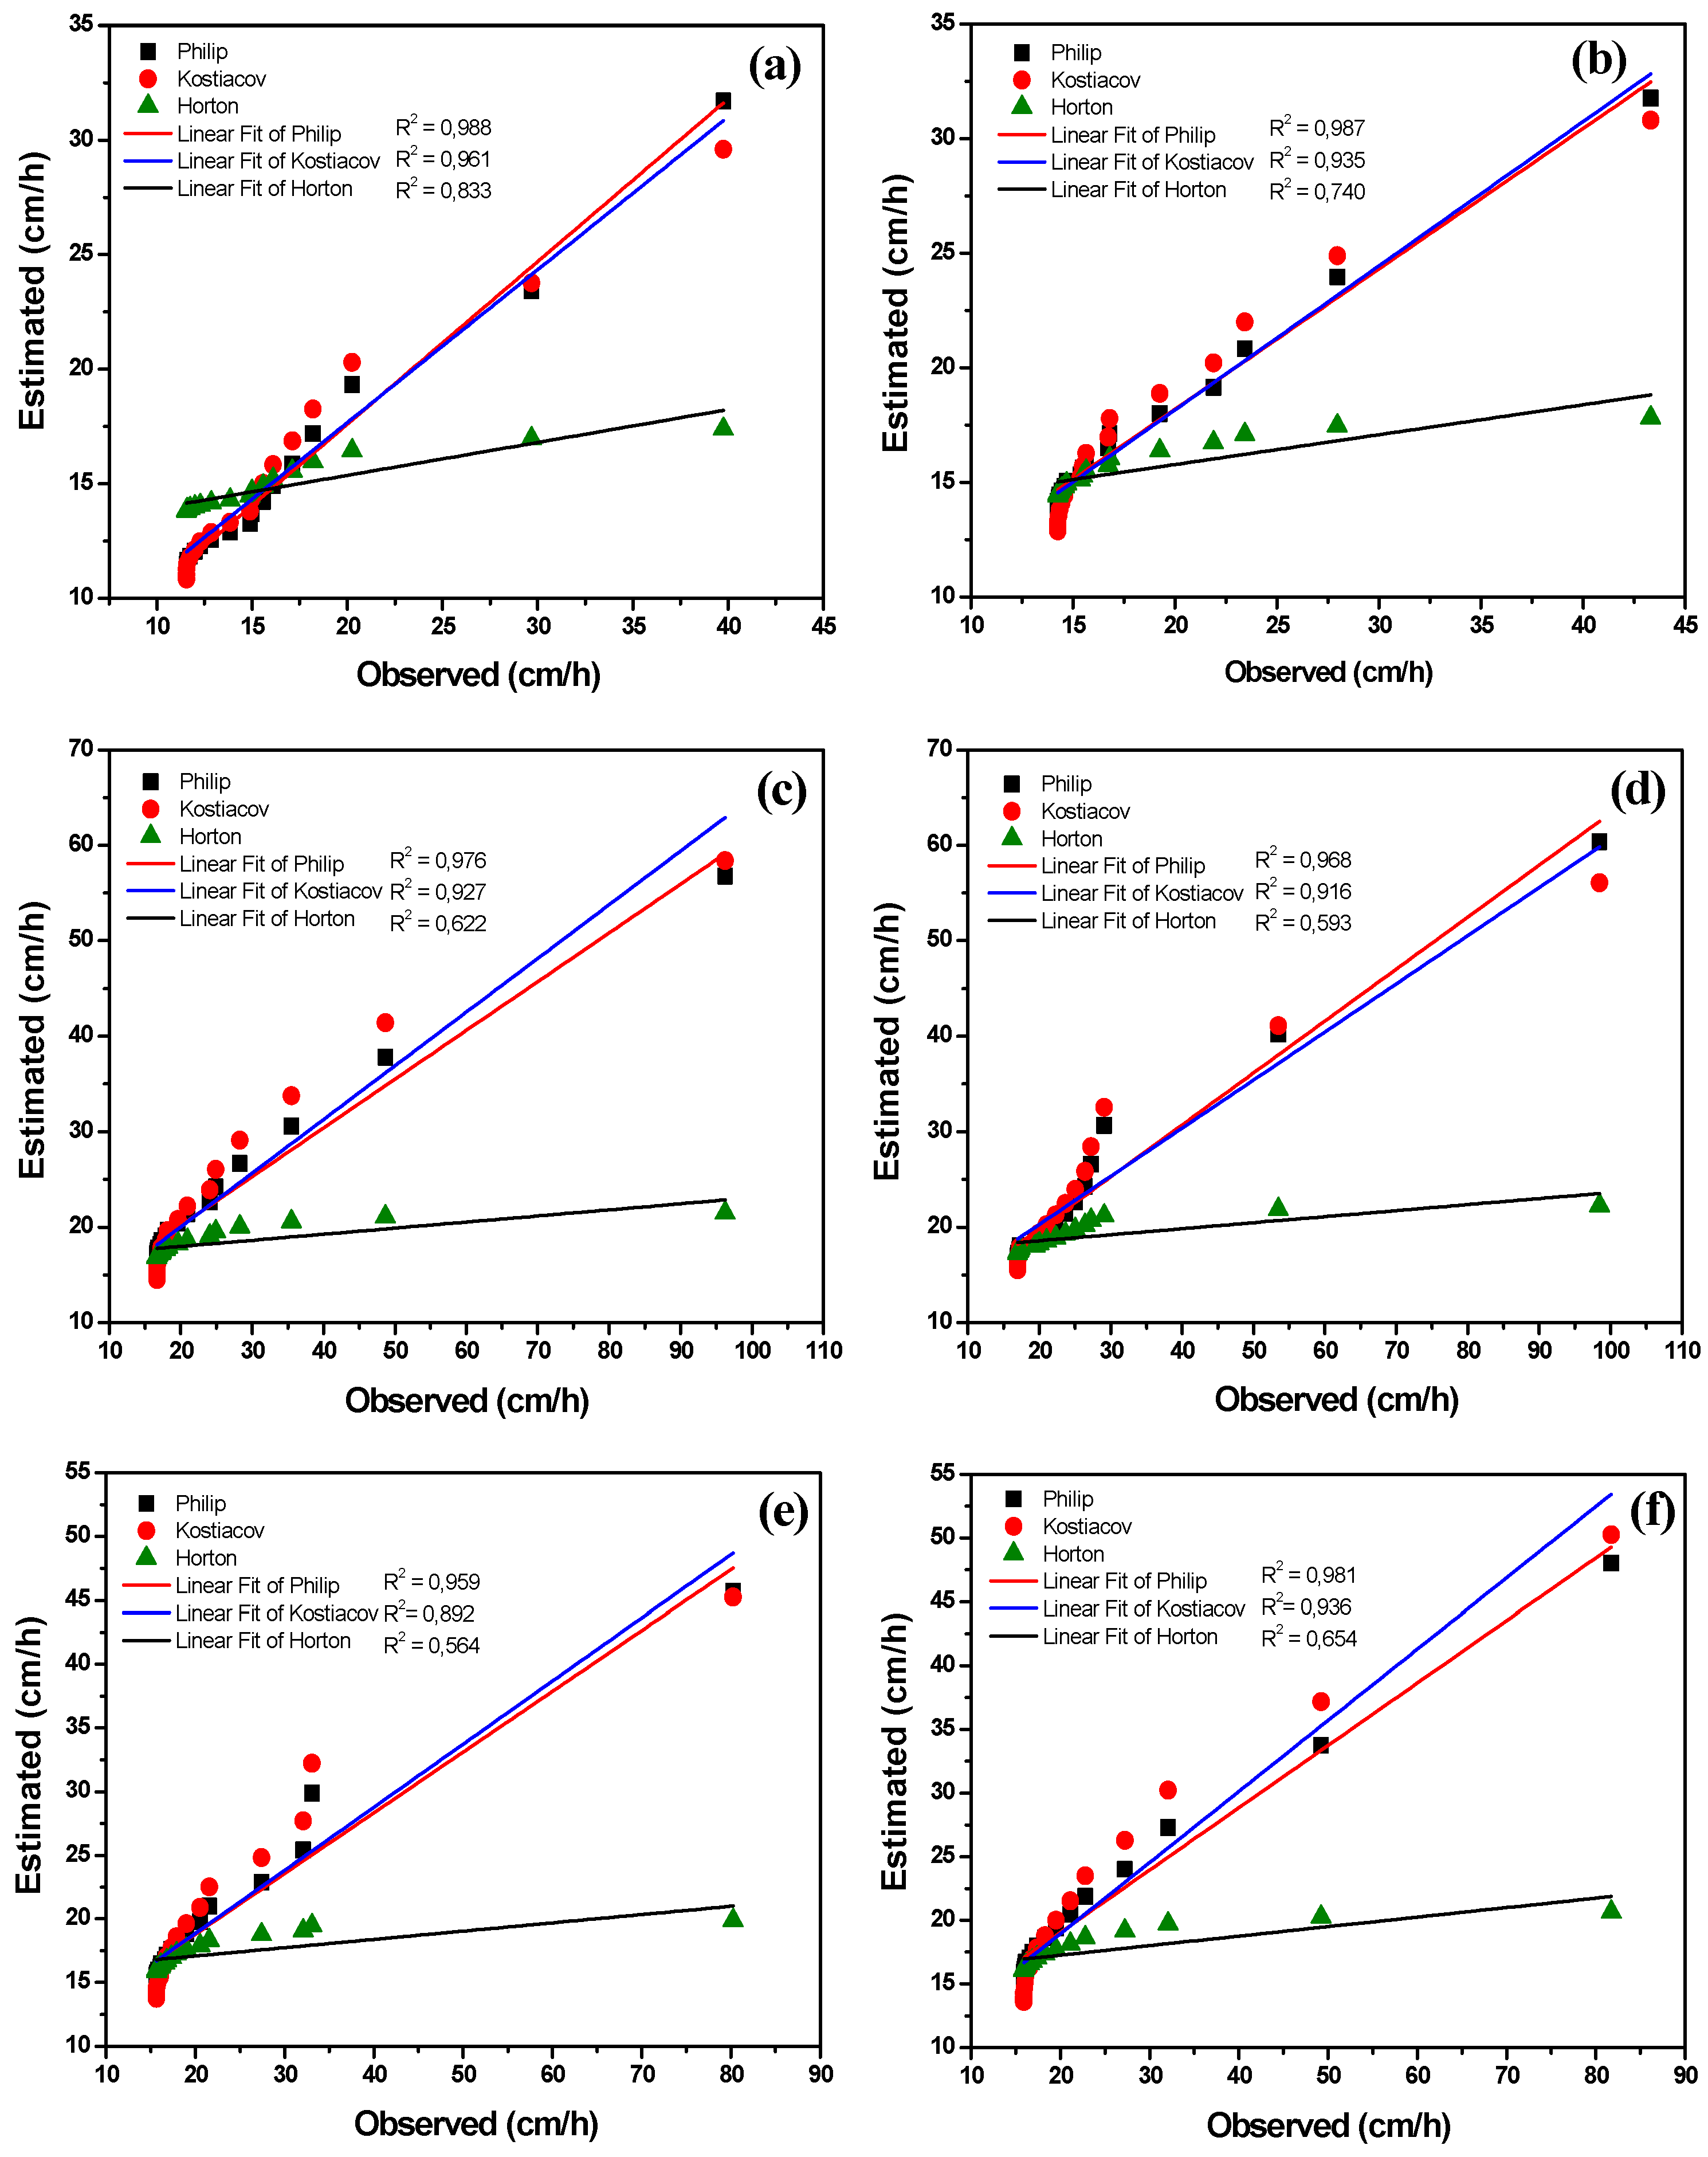
3.3. Performance of the Infiltration Models for Predicting Cumulative Infiltration

Predictions were made within each tillage treatment using three infiltration models (Kostiakov, Philips and Horton). The predicted and observed infiltration rates were plotted against each other and fitted with a linear equation and zero intercepts to test the validity of each prediction. At this point, the coefficient of determination (R2) the mean absolute error (MAE) and root mean square error (RMSE) were adopted for each model in order to verify the difference between the modeled and measured values of the infiltration water in the soil, and both performance evaluation parameters are given in Table 2. A model is considered to be better when RMSE and MAE are smaller and its R2 is higher and the model performance diminishes in the order Philip (1957) > Kostiakov (1932) > Horton (1940) [38,56].
The single most marked observation to emerge from the data comparison is that the Kostiakov and Philips models satisfactorily predicted the cumulative infiltration of the field for all tillage treatments according to the values of the coefficient of determination (R2), (MAE) and (RMSE). Based on the overall mean values, the Kostiakov model systematically underestimated the cumulative infiltration in the studied soil since the mean absolute error (MAE) and RMSE. The R2 values between the predicted and observed values were between 0.610–0.988 among all the models (Table 3), and the highest R2 values were linked to the Kostiakov and Philip’s models, which exceeded 0.9, indicating excellent performance for all tillage treatments. The present study experimental setup has a close resemblance to that of those who have suggested that Philips’s model gave the most satisfactory results [57,58].
These results indicated that the Horton three-parameter model gave the poorest fit with the largest RMSE (19, 75) and MAE (8, 32) and the lowest R2 (0.537). With the combined consideration of RMSE, R2, MAE, the Philip and Kostiakov models were best to describe and predict the cumulative infiltration in the researched soil. On the contrary, one study suggested that the Horton model is the best fitting in measured infiltration and prediction ability for cumulative infiltration in the lawn soils with healthy growth of grass [50], and other studies have suggested the same [10,38]. In contrast, the present study findings contradict those reported in sandy soils with a fast infiltration rate on the Nsukka plains of SE Nigeria. Both the Philip (1957) [11] and Kostiakov (1932) [13] models were not appropriate to predict cumulative infiltration because their transmissivity terms are not completely accurate for either the Ksat or the equilibrium infiltration rate [52].
Therefore, Mizuba et al. [27] investigated the impact of soil tillage management and vegetal cover on water infiltration of the soil. Plant cover is effective in preventing infiltration as it protects the soil surface from the impact of precipitation and slows the speed of rain runoff, changing the soil properties [8,59] along with the infiltration characteristic [59,60]. Figure 4 illustrates a representative comparison between the observed and fitted infiltration curves. The Kostiakov model gave a relatively good estimation of the observed infiltration rates, while the Horton model failed to accurately predict infiltration rates, especially at the early stage of the infiltration process in all types of tillage practices. Contrary to this, research conducted in India indicated that the Kostiakov model and the Philip two-term model had the lowest rank in the infiltration models in predicting “cumulative infiltration” before and after paddy cultivations [61].
The correspondence between observed and fitted infiltration for selected replicates of tillage treatments (MP (P6, P8), NT (P2, P4) and TC (P3, P5)) indicated by the R2 value revealed a higher value for the Philip model and a lower value for Horton model (Figure 4). There are several possible explanations for these findings where the empirical models (Philip and Kostiakov) predict infiltration data better than the Horton model because the calibration of empirical models is done with field experiments data without any presumptions about the hydrologic process. Thus, it should be considered that the theoretical models are mainly predictive, whereas the empirical models are only adjustment models, which reduce the accuracy of the estimation of the infiltration rates. It was concluded in research that one of the major drawbacks in adopting theoretical models is the need to measure certain soil properties, which are either unavailable or difficult to obtain [62].

4. Effect of Tillage on Soil Water Infiltration Characteristics by Model Analysis

Figure 5 shows a schematic description of the progress of infiltration rate with time based on different infiltration models and observed values. At the startup stage within the first 10–15 min (10 min for tilled plots and 15 min for untilled plots), the infiltration rate overtime was always less for the experimental values than for modeled values. The predicted infiltration curves of the selective plots of untilled soil (NT: P2, P4), tilled soil with a moldboard plow (MP: P6, P8) and tilled soil with a tine cultivator (TC: P3, P5) are examples of the validation results by visually assessing the performance of the model. From Figure 5, it is possible to see that our curves show a high-quality presentation of the fit of the models, with the exception of the NT. However, each infiltration curve obtained after the infiltration test revealed a similar trend and showed that after 20 min of the beginning of the experiment, the infiltration rate for both Philip and Kostiakov models and observed values are identical. These findings are supported by the literature [63,64].
In addition, it is also apparent that the infiltration rate of each model decreases over time. As put forward by a study [65], we found the evidence points to all similar values at the end of the infiltration test, which can be attributed to the increase in soil surface compaction increased following a decrease in its porosity or crust formation.

5. Conclusions

In conclusion, the capacity of infiltration in the studied sandy clay loam soil increased in the order of no-tillage, tine cultivation and moldboard plowing. Furthermore, the saturated hydraulic conductivity (Ksat) varied in the order of MP > TC > NT, with the big mean Ksat at the steady-state is 0.0471, 0.0466 and 0.03104 cm/s for MP, TC and NT, respectively. This trend suggested that infiltration capacity increased with increased soil disturbance. Furthermore, three commonly used infiltration models (Kostiakov, Philip, Horton) were applied to the field measured data to predict infiltration rates under tilled and untilled conditions. The Philip model was better at predicting the measured infiltration rates compared to the Horton and Kostiakov models under all tillage treatments (R2 ranged between 0.967 and 0.981, and RMSE ranged between 3.359 and 9.21). Hence, this model is useful for the measured field data and can be applied for better tillage management in the study site or other areas with similar soil conditions. These topics are reserved for future work to investigate the relationship between structural variables of the soil such as aggregate stability, bulk density and hydraulic properties by using traditional statistical methods or physical-based models. Future studies on the current topic are therefore required to understand the processes of infiltration under tillage practices in this region that should be based on long-term field experiments with additional soil types.

Author Contributions

Conceptualization, Methodology, Software, Validation, Formal Analysis, Investigation, Resources, Data Curation, Visualization, Funding Acquisition, Writing–Original Draft Preparation, R.A., K.I. and S.C.; Conceptualization, Validation, Investigation, Resources, Data Curation, Writing–Original Draft Preparation, Administration, Supervision, F.S.; Writing–Review and Editing, P.M.; Project Administration, Writing–Original Draft Preparation, Software, Formal Analysis, Validation, Project Administration, Writing–Review and Editing, H.G., Z.H. and H.M.N.I. All authors have read and agreed to the published version of the manuscript.

Funding

This study was supported by the Research Unit 13AGRO. The authors are grateful to the field staff of the Higher Agronomic Institute of Chott Mariem for assistance in the field research work.

Institutional Review Board Statement

Not applicable.

Informed Consent Statement

Not applicable.

Data Availability Statement

Not applicable.

Acknowledgments

The authors are highly obliged to their respective institutes for financial support.

Conflicts of Interest

The authors declare no conflict of interest.

Nomenclature

ECElectrical conductivity
KsatSaturated hydraulic conductivity
Ssoil sorptivity
Astable infiltration rate
aKostiakov’s time Coefficient
bKostiakov’s time exponent
fpInfiltration rates at time t (min)
fcFinal infiltration rate
f0Infiltration rate at t = 0
piMean observed cumulative infiltration
pObserved cumulative infiltration
miMean simulated cumulative infiltration
mSimulated cumulative infiltration
nTotal numbers of samples
I (t)Cumulative infiltration rate
i (t)Infiltration rate
tTime
NTNo-tillage
MPMoldboard plow
TCTine cultivation
R2Coefficient of determination
RMSERoot mean square error

References

  1. Klik, A.; Rosner, J. Long-term experience with conservation tillage practices in Austria: Impacts on soil erosion processes. Soil Tillage Res. 2020, 203, 104669. [Google Scholar] [CrossRef]
  2. Dokić, D.; Gavran, M.; Gregić, M.; Gantner, V. The Impact of Trade Balance of Agri-Food Products on the State’s Ability to Withstand the Crisis. HighTech Innov. J. 2020, 1, 107–111. [Google Scholar] [CrossRef]
  3. Ghazouani, H.; Capodici, F.; Ciraolo, G.; Maltese, A.; Rallo, G.; Provenzano, G. Potential of thermal images and simulation models to assess water and salt stress: Application to potato crop in central Tunisia. Chem. Eng. Trans. 2017, 58, 709–714. [Google Scholar]
  4. Williams, J.; Reardon, C.; Wuest, S.; Long, D. Soil water infiltration after oilseed crop introduction into a Pacific Northwest winter wheat–fallow rotation. J. Soil Water Conserv. 2020, 75, 739–745. [Google Scholar] [CrossRef]
  5. Chari, M.M.; Poozan, M.T.; Afrasiab, P. Modelling soil water infiltration variability using scaling. Biosyst. Eng. 2020, 196, 56–66. [Google Scholar] [CrossRef]
  6. Singh, B.; Sihag, P.; Deswal, S. Modelling of the impact of water quality on the infiltration rate of the soil. Appl. Water Sci. 2019, 9, 15. [Google Scholar] [CrossRef] [Green Version]
  7. Ekwueme, B.N.; Agunwamba, J.C. Modeling the Influence of Meteorological Variables on Runoff in a Tropical Watershed. Civ. Eng. J. 2020, 6, 2344–2351. [Google Scholar] [CrossRef]
  8. Carvalho, D.F.; Eduardo, E.N.; Almeida, W.S.D.; Santos, L.A.; Alves Sobrinho, T. Water erosion and soil water infiltration in different stages of corn development and tillage systems. Rev. Bras. Eng. Agríc. Ambient. 2015, 19, 1072–1078. [Google Scholar] [CrossRef] [Green Version]
  9. Sihag, P.; Tiwari, N.; Ranjan, S. Estimation and inter-comparison of infiltration models. Water Sci. 2017, 31, 34–43. [Google Scholar] [CrossRef] [Green Version]
  10. Mishra, S.K.; Tyagi, J.V.; Singh, P.V.P. Comparison of infiltration models. Hydrol. Process. 2003, 17, 2629–2652. [Google Scholar] [CrossRef]
  11. Philip, J. The theory of infiltration: 1. The infiltration equation and its solution. Soil Sci. 1957, 83, 345–358. [Google Scholar] [CrossRef]
  12. Singh, V.P.; Yu, F.X. Derivation of Infiltration Equation Using Systems Approach. J. Irrig. Drain. Eng. 1990, 116, 837–858. [Google Scholar] [CrossRef]
  13. Kostiakov, A.N. On the dynamics of the coefficient of water percolation in soils and the necessity of studying it from the dynamic point of view for the purposes of amelioration. Trans. Sixth Comm. Int. Soc. Soil Sci. 1932, 1, 7–21. [Google Scholar]
  14. Horton, R.E. An Approach Toward a Physical Interpretation of Infiltration-Capacity. Soil Sci. Soc. Am. J. 1941, 5, 399–417. [Google Scholar] [CrossRef]
  15. Machiwal, D.; Jha, M.K.; Mal, B. Modelling Infiltration and quantifying Spatial Soil Variability in a Wasteland of Kharagpur, India. Biosyst. Eng. 2006, 95, 569–582. [Google Scholar] [CrossRef]
  16. Zhang, Y.; Wu, P.; Zhao, X.; Li, P. Evaluation and modelling of furrow infiltration for uncropped ridge - furrow tillage in Loess Plateau soils. Soil Res. 2012, 50, 360–370. [Google Scholar] [CrossRef]
  17. Mahapatra, S.; Jha, M.K.; Biswal, S.; Senapati, D. Assessing Variability of Infiltration Characteristics and Reliability of Infiltration Models in a Tropical Sub-humid Region of India. Sci. Rep. 2020, 10, 1–18. [Google Scholar] [CrossRef] [Green Version]
  18. Fenu, G.; Malloci, F.M. DSS LANDS: A Decision Support System for Agriculture in Sardinia. HighTech Innov. J. 2020, 1, 129–135. [Google Scholar] [CrossRef]
  19. Schjønning, P.; Lamandé, M.; Crétin, V.; Nielsen, J.A. Upper subsoil pore characteristics and functions as affected by field traffic and freeze–thaw and dry–wet treatments. Soil Res. 2017, 55, 234–244. [Google Scholar] [CrossRef]
  20. Blanco-Canqui, H.; Ruis, S.J. No-tillage and soil physical environment. Geoderma 2018, 326, 164–200. [Google Scholar] [CrossRef]
  21. Salem, H.M.; Valero, C.; Muñoz, M.Á; Gil Rodríguez, M.; Silva, L.L. Short-term effects of four tillage practices on soil physical properties, soil water potential, and maize yield. Geoderma 2015, 237–238, 60–70. [Google Scholar] [CrossRef] [Green Version]
  22. Ahuchaogu, I.; Etim, I.; Etuk, A. Research Paper Effects of Tillage Methods on Soil Infliltration Rate in Uyo, Nigeria. Cont. J. Eng. Sci. 2015, 10, 10–20. [Google Scholar]
  23. Li, Y.; Li, Z.; Cui, S.; Jagadamma, S.; Zhang, Q. Residue retention and minimum tillage improve physical environment of the soil in croplands: A global meta-analysis. Soil Tillage Res. 2019, 194, 104292. [Google Scholar] [CrossRef]
  24. Cullum, R. Macropore flow estimations under no-till and till systems. Catena 2009, 78, 87–91. [Google Scholar] [CrossRef]
  25. Truman, C.; Potter, T.; Nuti, R.; Franklin, D.; Bosch, D. Antecedent water content effects on runoff and sediment yields from two Coastal Plain Ultisols. Agric. Water Manag. 2011, 98, 1189–1196. [Google Scholar] [CrossRef]
  26. Głąb, T.; Kulig, B. Effect of mulch and tillage system on soil porosity under wheat (Triticum Aestivum). Soil Tillage Res. 2008, 99, 169–178. [Google Scholar] [CrossRef]
  27. de Almeida, W.S.; Panachuki, E.; de Oliveira, P.T.S.; da Silva Menezes, R.; Sobrinho, T.A.; de Carvalho, D.F. Effect of soil tillage and vegetal cover on soil water infiltration. Soil Tillage Res. 2018, 175, 130–138. [Google Scholar] [CrossRef]
  28. Mizuba, M.; Hammel, J. Infiltration rates in fall-seeded winter wheat fields following preplant subsoil tillage. J. Soil Water Conserv. 2001, 56, 133–137. [Google Scholar]
  29. Govindasamy, P.; Mowrer, J.; Rajan, N.; Provin, T.; Hons, F.; Bagavathiannan, M. Influence of long-term (36 years) tillage practices on soil physical properties in a grain sorghum experiment in Southeast Texas. Arch. Agron. Soil Sci. 2021, 67, 234–244. [Google Scholar] [CrossRef]
  30. Robinson, G.W. A new method for the mechanical analysis of soils and other dispersions. J. Agric. Sci. 1922, 12, 306–321. [Google Scholar] [CrossRef] [Green Version]
  31. Brady, N.; Weil, R. The Nature and Properties of Soils, 12th ed.; Prentice-Hall: Upper Saddle River, NJ, USA, 1999. [Google Scholar]
  32. Yoro, G.; Godo, G. Les méthodes de mesure de la densité apparente: Analyse de la dispersion des résultats dans un horizon donné. Cah. ORSTOM. Pédol. 1990, 25, 423–429. [Google Scholar]
  33. Campbell, D.; Henshall, J. Bulk density. In Soil Analysis: Physical Methods; Smith, K.A., Mullins, C.E., Eds.; Marcel Dekker: New York, NY, USA, 1991. [Google Scholar]
  34. Okalebo, J.R.; Gathua, K.W.; Woomer, P.L. Laboratory Methods of Soil and Plant Analysis: A Working Manual, 2nd ed.; Sacred Africa: Nairobi, Kenya, 2002. [Google Scholar]
  35. Ibitoye, A. Laboratory Manual on Basic Soil Analysis, 2nd ed.; Foladaye Publishing Company: Akure, Nigeria, 2006. [Google Scholar]
  36. Reynolds, W. Ring or cylinder infiltrometers. Methods Soil Anal. 2002, 4, 818–843. [Google Scholar]
  37. Qiaosheng, S.; Zuoxin, L.; Zhenying, W.; Haijun, L. Simulation of the soil wetting shape under porous pipe sub-irrigation using dimensional analysis. Irrig. Drain. 2007, 56, 389–398. [Google Scholar] [CrossRef]
  38. Duan, R.; Fedler, C.B.; Borrelli, J. Field evaluation of infiltration models in lawn soils. Irrig. Sci. 2011, 29, 379–389. [Google Scholar] [CrossRef]
  39. Fan, R.; Zhang, X.; Yang, X.; Liang, A.; Jia, S.; Chen, X. Effects of tillage management on infiltration and preferential flow in a black soil, Northeast China. Chin. Geogr. Sci. 2013, 23, 312–320. [Google Scholar] [CrossRef] [Green Version]
  40. Stone, L.R.; Schlegel, A.J. Tillage and Crop Rotation Phase Effects on Soil Physical Properties in the West-Central Great Plains. Agron. J. 2010, 102, 483–491. [Google Scholar] [CrossRef]
  41. Wienhold, B.J.; Tanaka, D.L. Haying, tillage, and nitrogen fertilization influences on infiltration rates at a conservation reserve program site. Soil Sci. Soc. Am. J. 2000, 64, 379–381. [Google Scholar] [CrossRef] [Green Version]
  42. Osanyinpeju, K.L.; Dada, P.O. Soil Porosity and Water Infiltration as Influenced by Tillage Practices on Federal University of Agriculture Abeokuta, Ogun State, Nigeria Soil. Int. J. Latest Technol. Eng. Manag. Appl. Sci. 2018, 7, 2278–2540. [Google Scholar]
  43. Schwartz, R.; Baumhardt, R.; Evett, S. Tillage effects on soil water redistribution and bare soil evaporation throughout a season. Soil Tillage Res. 2010, 110, 221–229. [Google Scholar] [CrossRef]
  44. Celik, I.; Ersahin, S. Evaluation of tillage influence on infiltration characteristics in a clay soil. J. Food Agric. Environ. 2011, 9, 653–658. [Google Scholar]
  45. Presley, D.R.; Sindelar, A.J.; Buckley, M.E.; Mengel, D.B. Long-Term Nitrogen and Tillage Effects on Soil Physical Properties under Continuous Grain Sorghum. Agron. J. 2012, 104, 749–755. [Google Scholar] [CrossRef] [Green Version]
  46. Kahlon, M.S.; Lal, R.; Ann-Varughese, M. Twenty two years of tillage and mulching impacts on soil physical characteristics and carbon sequestration in Central Ohio. Soil Tillage Res. 2013, 126, 151–158. [Google Scholar] [CrossRef]
  47. Alvarez, R.; Steinbach, H. A review of the effects of tillage systems on some soil physical properties, water content, nitrate availability and crops yield in the Argentine Pampas. Soil Tillage Res. 2009, 104, 1–15. [Google Scholar] [CrossRef]
  48. Ordoñez-Morales, K.D.; Cadena-Zapata, M.; Zermeño-González, A.; Campos-Magaña, S. Effect of Tillage Systems on Physical Properties of a Clay Loam Soil under Oats. Agriculture 2019, 9, 62. [Google Scholar] [CrossRef] [Green Version]
  49. Capowiez, Y.; Cadoux, S.; Bouchant, P.; Ruy, S.; Roger-Estrade, J.; Richard, G.; Boizard, H. The effect of tillage type and cropping system on earthworm communities, macroporosity and water infiltration. Soil Tillage Res. 2009, 105, 209–216. [Google Scholar] [CrossRef]
  50. Shukla, M.K.; Lal, R.; Unkefer, P. Experimental Evaluation of Infiltration Models for Different Land Use and Soil Management Systems. Soil Sci. 2003, 168, 178–191. [Google Scholar] [CrossRef]
  51. Saito, T.; Yasuda, H.; Suganuma, H.; Inosako, K.; Abe, Y.; Kojima, T. Predicting Soil Infiltration and Horizon Thickness for a Large-Scale Water Balance Model in an Arid Environment. Water 2016, 8, 96. [Google Scholar] [CrossRef] [Green Version]
  52. Mbagwu, J. Testing the goodness of fit of selected infiltration models on soils with different land use histories. Int. Centr. Theor. Phys. 1993. Available online: https://inis.iaea.org/search/search.aspx?orig_q=RN:25043561 (accessed on 9 March 2021).
  53. Ogbe, V.; Jayeoba, O.; Ode, S. Comparison of four soil infiltration models on a sandy soil in Lafia, Southern Guinea Savanna Zone of Nigeria. Prod. Agric. Technol. 2011, 7, 116–126. [Google Scholar]
  54. Hangen, E.; Buczko, U.; Bens, O.; Brunotte, J.; Hüttl, R. Infiltration patterns into two soils under conventional and conservation tillage: Influence of the spatial distribution of plant root structures and soil animal activity. Soil Tillage Res. 2002, 63, 181–186. [Google Scholar] [CrossRef]
  55. Adindu, R.U.; Igbokwe, K.; Dike, I. Philip Model. Capability to Estimate Infiltration for Solis of Aba, Abia State. J. Earth Sci. Geotech. Eng. 2015, 5, 63–68. [Google Scholar]
  56. Nnoli, N.O.; Balogun, A.A.; Omotosho, J.A.; Agele, S.O. Empirical analysis of dry spells during growing season with respect to maize crop in Nigeria. Theor. Appl. Clim. 2020, 142, 525–542. [Google Scholar] [CrossRef]
  57. Al-Janabi, A.M.S.; Ghazali, A.H.; Yusuf, B. Modified models for better prediction of infiltration rates in trapezoidal permeable stormwater channels. Hydrol. Sci. J. 2019, 64, 1918–1931. [Google Scholar] [CrossRef]
  58. Ghorbani Dashtaki, S.; Homaee, M.; Mahdian, M. Estimating soil water infiltration parameters using Artificial Neural Networks. J. Water Soil 2009, 23, 185–198. [Google Scholar]
  59. Shao, Q.; Baumgartl, T. Field evaluation of three modified infiltration models for the simulation of rainfall sequences. Soil Sci. 2016, 181, 45–56. [Google Scholar] [CrossRef]
  60. Puigdefábregas, J. The role of vegetation patterns in structuring runoff and sediment fluxes in drylands. Earth Surf. Process. Landf. 2005, 30, 133–147. [Google Scholar] [CrossRef]
  61. Jha, M.K.; Mahapatra, S.; Mohan, C.; Pohshna, C. Infiltration characteristics of lateritic vadose zones: Field experiments and modeling. Soil Tillage Res. 2019, 187, 219–234. [Google Scholar] [CrossRef]
  62. Dashtaki, S.G.; Homaee, M.; Mahdian, M.H.; Kouchakzadeh, M. Site-Dependence Performance of Infiltration Models. Water Resour. Manag. 2009, 23, 2777–2790. [Google Scholar] [CrossRef]
  63. Silva, L.L. Fitting infiltration equations to centre-pivot irrigation data in a Mediterranean soil. Agric. Water Manag. 2007, 94, 83–92. [Google Scholar] [CrossRef]
  64. Basahi, J.; Kenimer, A.L.; Fipps, G.; Sabbagh, G.J. The effect of droplet impact energy produced by sprinkler system on soil erosion, runoff and infiltration rate. ASAE Pap. 1998, 98, 2060. [Google Scholar]
  65. Silva, L.L. The effect of spray head sprinklers with different deflector plates on irrigation uniformity, runoff and sediment yield in a Mediterranean soil. Agric. Water Manag. 2006, 85, 243–252. [Google Scholar] [CrossRef]
Figure 1. Air temperature and precipitation during the year at the region of Sousse in east-central Tunisia.
Sustainability 13 03155 g001
Figure 2. Experimental layout of tillage treatments with three replicates. MP: moldboard plow, TC: tine cultivator, NT: no-tillage. P1 through P9: subplots. The dotted areas are spacing between blocks.
Sustainability 13 03155 g002
Figure 3. Cumulative infiltration over time for treatment replications: (a) subplots P1, P2 and P3; (b) subplots P4, P5 and P6. MP: moldboard plow, TC: tine cultivation and NT: no-tillage.
Sustainability 13 03155 g003
Figure 4. Comparison between observed and estimated infiltration rates for different models in different treatments: no-tillage; (a) Plot 4, (b) Plot 2; moldboard plow; (c) Plot 8, (d) Plot 6; tine cultivator; (e) Plot 3 and (f) Plot 5.
Sustainability 13 03155 g004
Figure 5. Variations in the infiltration rate fp over time for different selected tillage treatments plots: moldboard plow; (a) P6, (b) P8; no tillage; (c) P2, (d) P4; tine cultivator; (e) P3 and (f) P5.
Sustainability 13 03155 g005
Table 1. Soil physical and chemical properties in the horizon (0 ± 30 cm) of the experimental site before the commencement of the tillage treatments.
Soil PropertyValueAnalysis MethodReference
Clay (%)25.60Pipette method[30]
Sand (%)67.15--
Silt (%)6.90--
TextureSandy clay loamTextural triangle[31]
Bulk density (g/cm3)1.69Core method[32]
Penetration resistance (daN/cm2)2.04Electronic penetrometer[33]
Water content (cm3/cm3)13.27Gravimetric method[33]
Water field porosity (%)67.58Core method[32]
Total porosity (%)32.78Core method[32]
EC (dS/m)0.98Saturated paste extract[34]
pH7.54pH meter[35]
Soil organic matter (%)2.01Colorimetric method[34]
Table 2. Estimated parameters for the three soil infiltration models of Philip, Kostiakov and Horton.
TreatmentsField/Plot
Number
Infiltration Models
PhilipKostiakovHorton
S
(cm/min1/2)
A
(cm/min)
abfc
(cm/min)
f0
(cm/min)
k
MP10.1590.00310.0590.71416.66321.3703.136
60.1680.00320.0790.68416.66321.7053.483
80.1830.00290.0680.70216.98922.4903.555
Mean0.1700.00310.0690.70016.77221.8553.391
TC30.1400.00310.0520.72415.64020.0632.808
50.1490.00310.0690.69115.92020.8903.493
70.1510.00340.0670.70217.46922.2843.424
Mean0.1470.00320.0620.70616.34321.0793.242
NT20.1390.00210.0370.74113.75017.7282.961
40.1160.00300.0630.77214.25118.0802.453
90.0940.00150.0310.7227.70811.2051.635
Mean0.1160.0020.0430.74511.90314.4672.298
MP: moldboard plow, TC: tine cultivator and NT: no-tillage.
Table 3. Calibration accuracy measures for infiltration models under different tillage treatments.
TreatmentsField/Plot NumberInfiltration Models
PhilipKostiakovHorton
R2RMSEMAER2RMSEMAER2RMSEMAE
MP10.9757.783.040.9197.952.980.62815.716.55
60.9769.763.780.9279.153.420.62219.307.87
80.9689.583.770.91610.463.890.59319.758.32
Mean0.9739.043.530.929.193.430.6118.257.58
TC30.9598.402.930.8928.372.980.56415.075.88
50.9829.123.690.948.253.400.67616.847.19
70.96210.124.530.9278.664.080.67118.097.82
Mean0.9679.213.720.928.433.490.6416.676.96
NT20.9882.541.390.9612.801.190.8336.323.43
40.9873.041.370.9353.141.480.7406.823.03
90.9684.501.620.9064.341.640.6267.342.76
Mean0.9813.361.460.9343.571.440.7336.833.07
MP: moldboard plow, TC: tine cultivator and NT: no-tillage.
Publisher’s Note: MDPI stays neutral with regard to jurisdictional claims in published maps and institutional affiliations.

