Article

Measuring the Economic Performance of Small Ruminant Farms Using Balanced Scorecard and Importance-Performance Analysis: A European Case Study

1
Department of Agricultural, Food and Environmental Sciences (D3A), Università Politecnica delle Marche, via Brecce Bianche, 60131 Ancona, Italy
2
Organic Research Centre, Trent Lodge, Stroud Road, Cirencester GL7 6JN, UK
*
Author to whom correspondence should be addressed.
Sustainability 2021, 13(6), 3321; https://0-doi-org.brum.beds.ac.uk/10.3390/su13063321
Submission received: 21 February 2021 / Revised: 11 March 2021 / Accepted: 12 March 2021 / Published: 17 March 2021
(This article belongs to the Special Issue Sustainable Agricultural Economy and Marketing Management)

Abstract

:
Given the increasing complexity of the agro-food sector, the analysis of financial performance alone may not be sufficient to assess the economic sustainability of farmers. This paper presents a practical method to measure the performance of farm businesses by combining the Balanced Scorecard (BSC) theoretical framework and Importance–Performance Analysis (IPA). The proposed model of Business Performance Indicators (BPI) measurement allows identification and validation of the indicators that consistently measure the latent dimension of the BSC framework while allowing identification Buin of the BPI areas where farm businesses need to concentrate their efforts to assure economic sustainability. The method was applied to small ruminant farm businesses across Europe through visits and interviews. The case study application showed that the model could help measure the performance of small farms while allowing detection of the areas of fragility and intervention. The case study results showed that finance and internal business management were the most relevant farmers’ weaknesses, alongside low priority given to innovation. In conclusion, to prevent the potential long-term decline of the sector, the study provided evidence for policy changes to support the farmers’ innovation potential and a higher level of integration in the supply chain.

1. Introduction

This study aims to propose a practical method to evaluate the performance of the farm business, from the perspective of economic sustainability. The aim is to widen the traditional focus on economic performances, based on profits and added value performances, by including the analysis of the role that marketing, innovation management, and human resources may play for farms’ economic sustainability.
The method was implemented in a case study including a selection of small ruminant farms in seven countries (Greece, Finland, France, Italy, Spain, Turkey, and the UK). According to the latest EU statistics [1], in 2015, the value of EU sheep and goat meat production accounted for about 5.5 billion euros (3.6% of the total value of meat production in EU). In France, Italy and Spain it ranges from minimum of 0.9% to a maximum of 1.8%, while in Greece sheep and goat milk contributes about 9% [2]. Nonetheless, the 86 million sheep [3] and 12.5 million goats [4] spread across Europe utilise a significant amount of the agricultural land, particularly in the United Kingdom and in the European Mediterranean basin. The largest sheep flocks are located in UK, Spain and Greece (27%, 19% and 10% of the EU total population respectively), while Greece and Spain together hold more than 50% of the EU total goat population (32%, and 22% respectively).
In the last decade, the sector has experienced economic and structural difficulties, which have led to a consistent decrease in small ruminants livestock numbers: the total number of animals dropped by 2% for sheep and 6% for goats, with substantial differences from county to country [3,4]. The main reasons behind the vulnerability of the sector are the ageing farming labour force, the lack of intergeneration transfer of farms [5,6], the need for specific policies in less favored areas that consider more infrastructures (e.g., community pastures and common land) [7], and a better integration with other on-farm activities [8].
In the context of difficult economic conditions for small ruminants’ farmers, limited attention is paid to business and managerial factors that could set the basis for the sustainability of sector. Belanche et al. [9] provide an analysis of priorities for sustainability from the perspective of experts in the small ruminant sector, and indicate the economic challenges among those most relevant for the future development of this sector. Paraskevopoulou et al. [10] provide a more general study on the sustainability of small ruminants farms, and report a low performance in economic resilience of farms due to limited entrepreneurial organization and strategic management.
This study examines the conditions that may affect the economic sustainability of small ruminants’ farms, particularly focusing on the potential role of finance, innovation, marketing and internal business processes at the farm level. Farm sustainability assessment is approached by proposing a new method combining the balanced scorecard (BSC) framework Kaplan and Norton [11], and importance-performance analysis (IPA), an analytical method originally developed in strategic marketing [12]. The model integrates data from farmers’ self-assessment of both current and expected performance measures referring to the four constructs of the BSC approach: Finance, Market, Learning and growth (innovation) and Internal business process. Confirmatory factor analysis was used to validate the measurement model consisting of a set Business Performance Indicators (BPI).
The BSC approach was developed by Kaplan and Norton (1992) [11] to analyse performances of firms and organisations. While there is no specific agreed definition of what performance measurement is [13,14], the BSC approach was developed to enable organisations to measure not only the financial performance, but also other non-financial performance dimensions, such as relations with customers, organisational structures, and internal skills and competencies. A BSC measures the performance of a firm both in the past and as a prediction of future performance [15]. As a full account of the vast theoretical and empirical literature based on the extension of the BSC is beyond the scope of this study, the interested reader is referred to the work of Kaplan and Norton [11], Richard et al. [16] and Van Looy and Shafagatova [15].
Although the BSC approach has been extensively researched, only few studies in the agri-food literature have applied the framework. Most of the studies to date have examined large farms and agri-businesses [17,18,19]. Paustian et al. [20] considered a modified version of the BSC for analysis of the performance of German arable farms. Byrne and Kelly [21] and Noell and Lund [22] developed and applied the BSC approach to dairy farm management in Ireland, and Denmark, respectively. In this study, an original BSC model explicitly developed for rapid assessment of small business performance is presented.
Importance-performance analysis is a method that was originally developed in strategic marketing to measure customer satisfaction [12]. It has been widely applied in the tourism and leisure sectors, the banking sector, healthcare and other sectors, due to the simplicity of the method and ease of interpretation of the results [23].
The proposed model could provide farmers’, advisers, and researchers with a tool to undertake business analysis in contexts where hard data are limited or not available, and may provide insights into managerial strategies and the relative fragility or antifragility of a business [24]. The rest of the paper is structured as follows: in the second section, the proposed measurement and analytical method is illustrated; in the third section, the case study data are presented; in the fourth section, the results are reported; the last section includes the discussion of results and conclusions.

2. Materials and Methods

2.1. Business Performance Indicators

Based on Kaplan and Norton [11] and previous literature, a set of BPIs were identified for each of the four BSC performance dimensions: Finance (4 items); Learning and growth (2 items); Customer/market (2 items); and Internal business process (5 items) (Table 1). All of the indicators included in the latent constructs were selected according to the scientific literature on firm performance and were adapted to consider the particularities of goat and sheep farming systems. The scale was pre-tested for face and content validity. Minor modifications were made based on the comments collected throughout the pre-test.
As well-known in the operations management literature, subjective measurements of business performance are considered to be a valuable alternative to objective measures, especially for small enterprises (see, among others [25,26]). In the case of smallholders, subjective business performance measures might even be more appropriate than accountancy data, for two main reasons. First of all, farm accountancy data are often not readily available and, even if available, farmers are often generally be reluctant to release what might be sensitive information about their farm [25,26]. Secondly, subjective measures might facilitate benchmarking across farms that operate in different countries and socio-economic contexts [25,26,27].
We have tested the validity of the the aggregation of the single BPIs in the respective BSC latent constructs using two statistical analysis: confirmatory factor analysis (CFA) and computation of the Chronbach’s Alpha indicator.
CFA is a multivariate statistical technique which analyses a priori measurement models in which both the number of factors and the correspondence with the indicators or measurement items are explicitly specified [41]. In other words, CFA is used to assess the measurement properties of latent variables of constructs or scales that represent multidimensional concepts measured by a series of indicators or items. Each indicator has two causes: An underlying latent factor that is reflected in the true score of the indicator, and a (random) measurement error, which is assumed to be normally distributed with a zero mean. Cronbach’s alpha may be interpreted as an indicator of internal consistency [42], measuring how closely related a set of items (BPIs in our case) are as a group (the latent construct).

2.2. Importance-Performance Analysis

IPA compares measures of importance; and (I) performance (P) for a set of indicators in a two-dimensional space. Each indicator is uniquely specified in an orthogonal axis diagram by its coordinates referring to the importance and performance scores. The origin of the orthogonal axis–indicated as the crossing point (CP) usually refers to the mean or median of the scores of these indicators. The choice of the CP is not neutral in terms of defining the categories and interpreting the results. Martilla and James [12] suggested the use of the mean or the median of the indicator scores, while Oh [43] recommended the use of the scale mean, to facilitate interpretation and comparison of results. In agreement with Martilla and James [12], in this study, the indicator means (or medians) were utilised to facilitate the extraction of meaningful categories in cases where there is limited variance of the ratings.
IPA classify each BPI into four categories, which are usually defined as: ‘Keep up’, ‘Concentrate here’, ‘Possible overkill’ and ‘Low priority’. These are defined as follows:
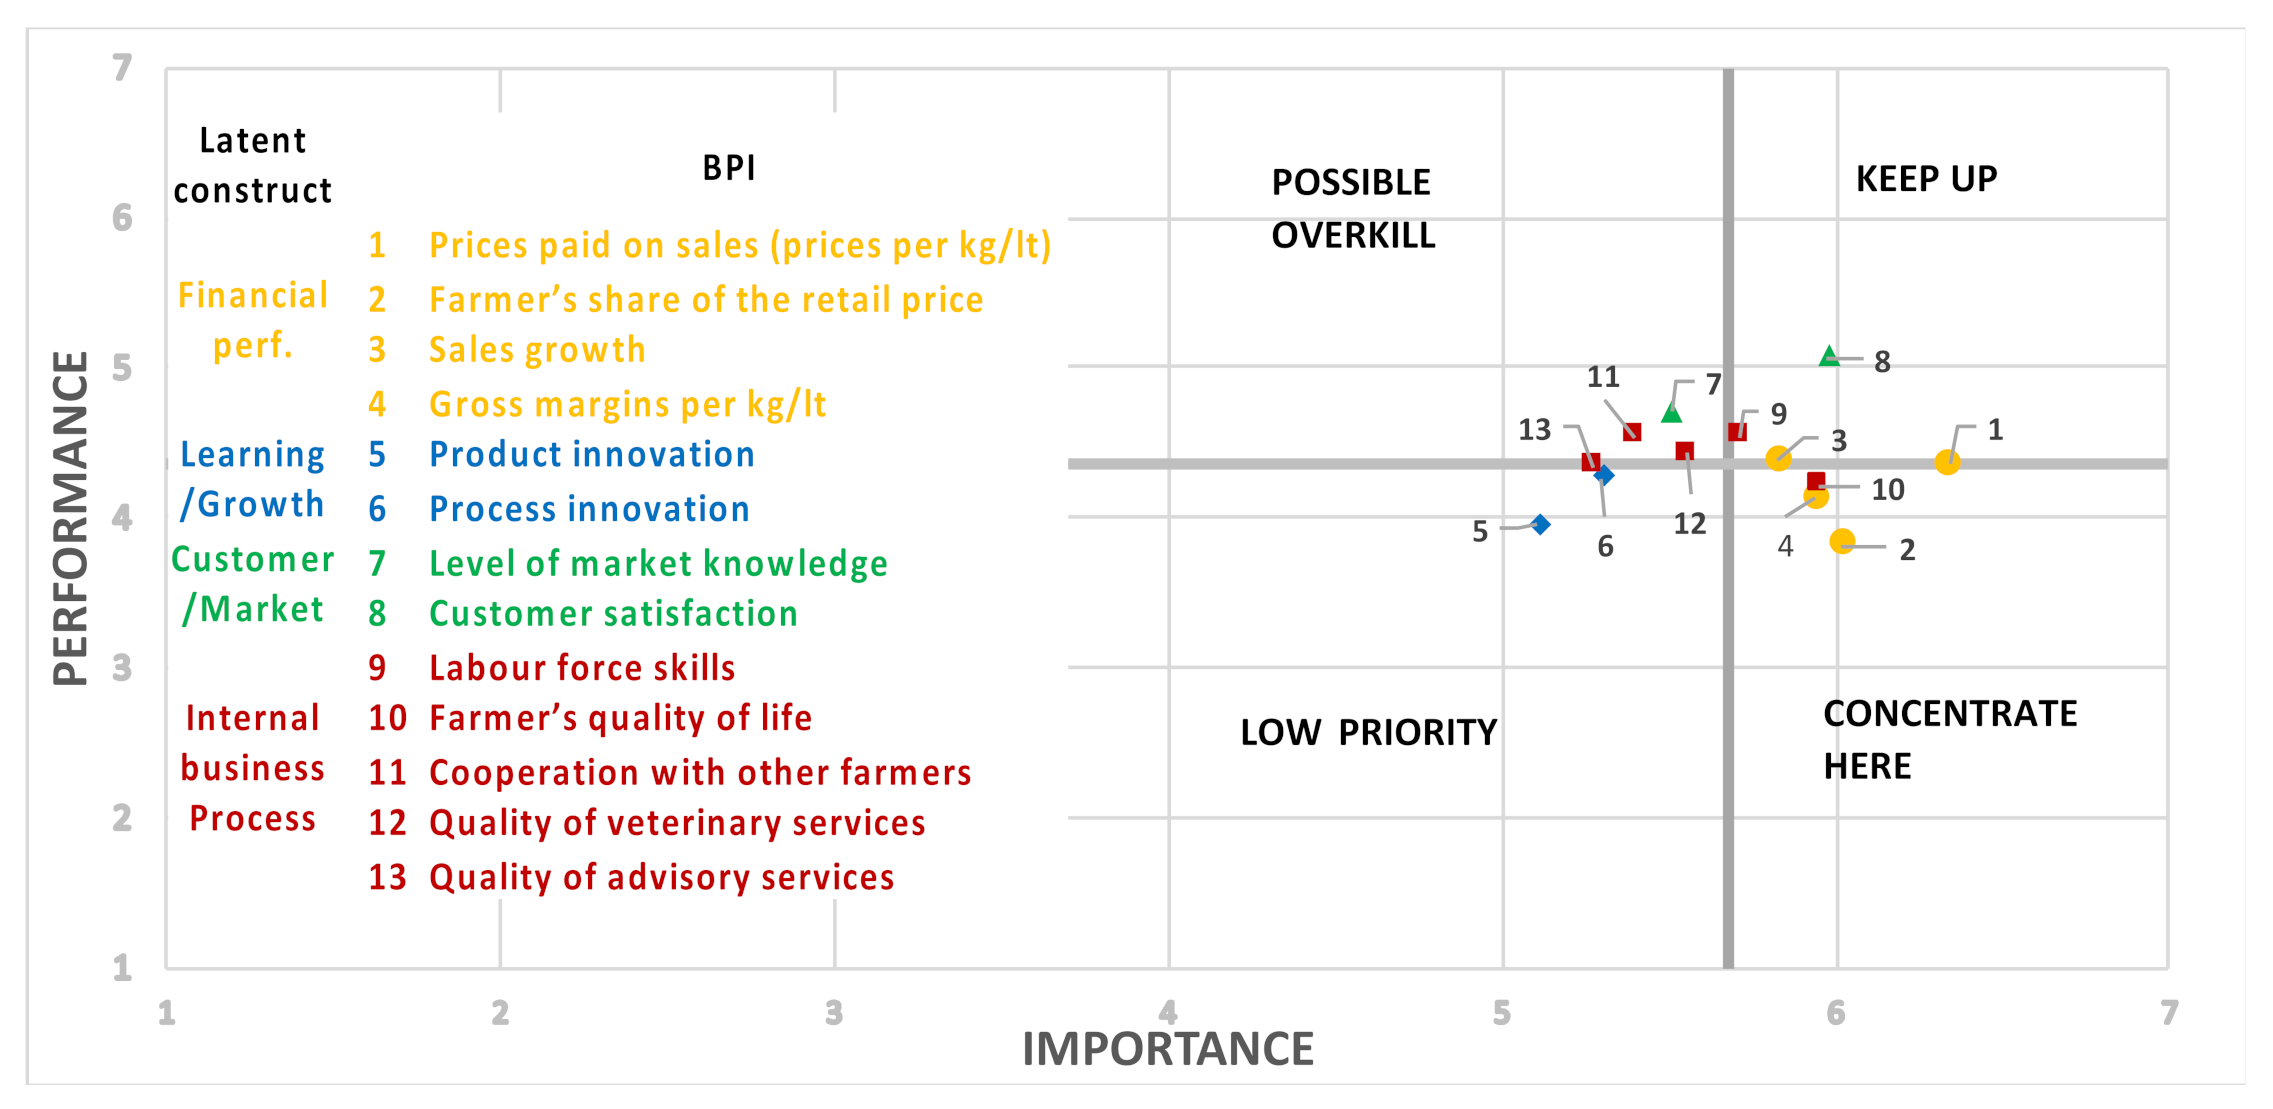
  • ‘Keep up (with the good job)’ refers to indicators that have both importance (I) and performance (P) scores that are higher than the respective CP (i.e., I > CP; P > CP). This category, therefore, identifies areas where good practices should be maintained.
  • ‘Concentrate here’ refers to indicators with I > CP and P < CP. This category is the most critical, as it indicates situations where the performance obtained is not adequate compared to the importance attributed to the indicator. This identifies areas where intervention is needed.
  • ‘Possible overkill’ refers to indicators with I < CP and P > CP. This category indicates that a business might be overperforming for the indicator, given its limited importance, and thus identifies areas where businesses can look for potential cost savings.
  • ‘Low priority’ refers to indicators with I < CP and P < CP. This category refers to cases where the performance is limited, but in a context of limited importance. However, caution is needed here, as this category is often the result of an underestimation of the importance of some indicators by businesses.

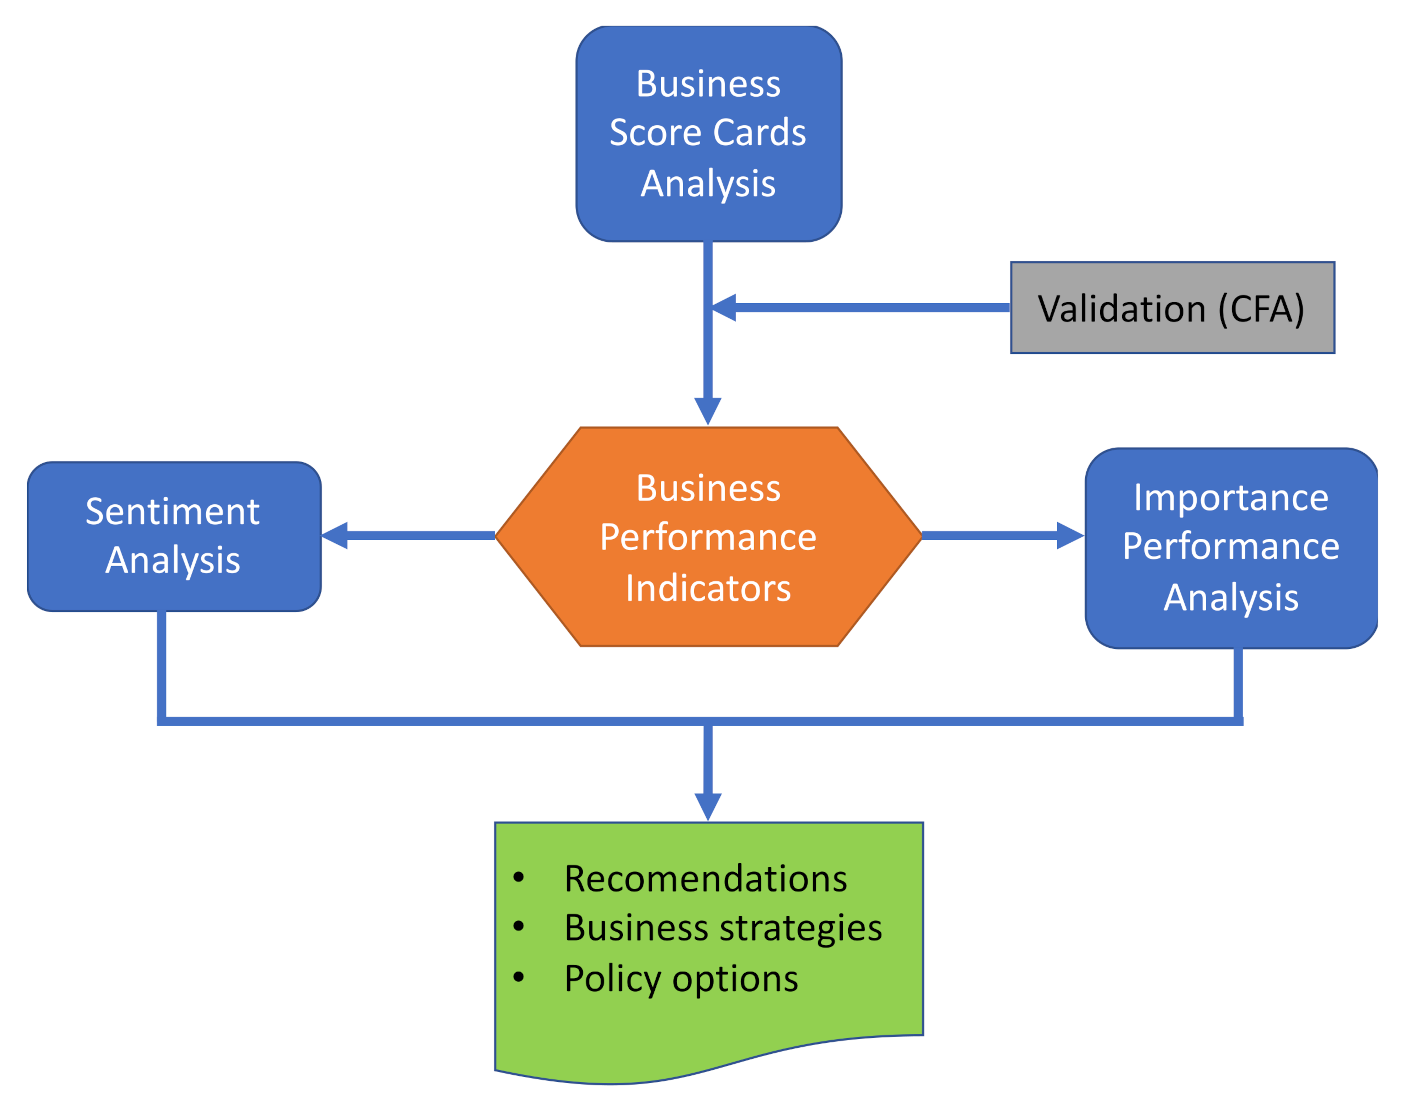
2.3. The Combined Model

The combined BSC and IPA model is summarised in Figure 1, which shows the sequence of steps in the analysis: BPIs selected according to BSC analysis, and then used as inputs for sentiment analysis and IPA. Conclusion follow based on results. Our model is based on the analysis of qualitative information elicited and validated through quantitative approaches. It therefore suffers from the intrinsic limit of the lack of statistical hard data to base more quantitative analysis, but represents a feasible approach to provide insights in fields of the managerial aspects of farms that would otherwise neglected due to data limitations.
The study is operationalised as follows. Farmers are asked to rate the past performance (e.g., over the last 5 years) and the future performance (e.g., expectations for the next 5 years) for each BPI, on the basis of their own knowledge of their own farm performance with respect to their perceived average industry performance. All of the answers are coded on a seven-point Likert scale, from 1 (worst in sector) to 7 (best in sector).
The farmers are also asked to assess the level of importance of the BPIs for their current business. The importance scale again goes from 1 (unimportant) to 7 (very important). Shorter scales (e.g., four-or five-point Likert scales) can also be used to further simplify the measurements.
As a result, three sets of scores are obtained for each BPI: past performance, expected (future) performance, and importance of business indicators and dimensions.

3. Case Study Data

The model was applied using a multiple-case study approach [44] of the small-ruminant sector in Europe. The European goat and sheep farm classification developed by Theodoridis et al. (2016) [45] was used to help the selection process and to ensure that the main farm types were included in the study. Goat and sheep farm businesses were selected using a replication approach across different farm types (meat/dairy, dual-purpose; goat/sheep; extensive/intensive) in six European countries–Finland, France, Greece, Italy, Spain and the UK–and in Turkey, as part of an EU-funded project. The aim of the study was not to achieve universal representativeness or statistical generalisation, although the countries from which the cases were selected accounted for >80% and >76% of the European goat, and sheep populations, respectively [3,4].
For each country, farms were selected across different regions and climate zones to ensure a wide variability of conditions for validation of the model. The farm businesses were chosen considering the prevailing farm types in each country. The farms were classified based on their key structural and management characteristics, such as grazing management practices, intensification of production system, and product purpose (i.e., milk or meat production).
Direct interviews with the farmers were performed in person by local experts. The farmers were asked to provide evaluations for the importance and past and future performances for each of the BPIs. The interviews were usually completed in a short time (about 10–15 min each), which facilitated the farmer involvement and participation. Overall, the model was tested on 202 case study farms. The distribution of the selected cases is shown in Table 2.

4. Results

4.1. Validation of the Business Performance Indicators

The factorial validity of the scores of the selected BPIs was confirmed (χ2 = 88.25; degrees of freedom [df] = 56; p < 0.004; root mean square error of approximation [RMSEA] = 0.055; 90% confidence interval [CI], 0.032–0.076]; comparative fit index = 0.952; standardised root mean square residual = 0.055). The final empirical BSC model included the 13 indicators that referred to the four latent constructs of Finance, Learning and growth, Customer/market and Internal business processes (Table 1).
Cronbach’s alpha provided strong evidence of measurement reliability for the latent constructs, except for Internal business processes, where the Cronbach’s alpha was 0.67, which can, however, still be considered as acceptable [42] (see Table 3, for the measurement properties). Convergent validity was supported by the high and significant standardised loadings for the measures [46]. For parsimony, only the tests on past performance perceptions are reported in Table 3, although the future performance perceptions showed the same measurement properties and invariance.
Multiple-group measurement invariance was tested for the species farmed and the level of livestock intensity, to validate the model across the different groups:
Goat (n = 70) versus sheep farms (n = 132): The model showed a good fit across the two groups for configural invariance (RMSEA = 0.064; 90% CI: 0.036–0.087) and the construct-level metric (equal factor loadings: RMSEA = 0.061; 90% CI: 0.034–0.084). The Wald chi-squared (9 df) was 8.69, so this was not statistically significant (p > 0.05). Therefore, we cannot reject the hypothesis of the same factor loadings for the goat and sheep farms (partial measurement invariance).
Extensive (n = 112) versus intensive (n = 90) farms: The model showed a good fit across the two groups for configural invariance (RMSEA = 0.064; 90% CI: 0.036–0.088) and construct-level metric (equal factor loadings: RMSEA = 0.060; 90% CI: 0.033–0.083). The Wald chi-squared (9 df) was 5.76, which was again not statistically significant (p > 0.05). Therefore, we cannot reject the hypothesis of the same factor loadings for extensive and intensive farms (partial measurement invariance). Unfortunately, the measurement invariance across the groups for the different production orientations (i.e., dairy, meat, dual purpose) could not be tested due to degrees of freedom issues (the dual-purpose group was too small; with n = 41).
Nevertheless, the BSC measurement model was not just specific to a group of farms, but holds for all of the groups. In other words, these tests show that the perceptions of business performance did not significantly differ between the goat and sheep farmers, and the extensive and intensive farmers, and we can therefore consider the model as valid across all cases.

4.2. Sentiment Analysis of Future Performance

As a multiple-case study is not a sample extracted from a population, there is no need to use statistical inference tests to make comparisons between the farmers’ business performance scores in the past versus their expected future business performance scores. A simple analysis of the differences between the scores is sufficient for the analysis of the farmers’ sentiments in relation to their future performance. Therefore, once a reliable measurement model has been established, the proposed BSC model is easily applicable by farmers or advisers with basic math knowledge.
In the case study, all of the differences of future performance versus past performance were positive (Table 4): Farmers expected their performance to increase. This result indicates a positive sentiment of the case study farmers towards their future performance. The sentiment analysis might help us to understand how to address the IPA results presented below. If a positive sentiment is found, addressing the improvement of the indicators classified as ‘Concentrate here’ is more likely to be supported by the farmers. A negative sentiment on their performance might indicate the need to focus on the ‘Keep up’ factors to improve the farmers’ morale and avoid them dropping out of the sector.

4.3. Importance-Performance Analysis

The mean and median of the BPIs were very similar for the importance-performance analysis. Therefore, to avoid redundancy, only the results based on the CPs defined by the means are reported. Table 5 shows the results of the IPA for all of the case study farms, as well as for three groupings of cases: production purpose (dual purpose, meat, dairy), species (goat, sheep), and production system (extensive, intensive). Figure 2 illustrates the IPA results for each indicator grouped according to the four latent constructs (Financial performance, Customer/market, Learning and growth, Internal business processes).
To inspect the results, Table 5 could be read row by row, i.e., by considering how each single BPI has been classified. A similar examination can be accomplished by moving from the top to the bottom of the grid in Figure 2, to consider each attribute in order of importance.
The most relevant IPA categories to consider are ‘Concentrate here’ and ‘Keep up’, which refer to the respective critical situations where particular attention is needed to solve the inadequate performance, and where good practices should be maintained and possibly reinforced. The ‘Concentrate here’ cases mainly refer to the BPIs for the Finance latent construct. In particular, ‘Gross unit margins’ and ‘Farmer’s share of retail price’ show critical situations for all cases and for all of the groups considered. ‘Price paid on sales’ is also classified as a critical indicator, though with some differences across the groupings. ‘Sales growth’ is just on the boundary between ‘Keep up’ and ‘Concentrate here’ across all cases. It is, however, critical for sheep and dual-purpose farmers, while it is even evaluated as ‘Possible overkill’ by extensive farmers. Among the Internal business processes indicators, ‘Farmer’s quality of life’ is classified as ‘Concentrate here’ for all cases and all of the groups, except for the meat farmers, where it scores as ‘Keep up’.
‘Customer satisfaction’ shows the best scores for the Customer/market latent construct, where it is evaluated as ‘Keep up’ for all cases and all of the groups. ‘Labour force skills’ are also reported as the ‘Keep up’ category for all cases, although it is classified as ‘Possible overkill’ by both sheep and extensive farmers. In the dual-purpose group, ‘Labour force skills’ is even classified as ‘Low priority’, and hence shows lower-than-mean scores for both performance and importance. When using the proposed model, such an incoherence might indicate a situation that is worth investigation and intervention.
Three indicators are classified as ‘Possible overkill’ for all cases: Namely for ‘Level of market knowledge’, ‘Cooperation with other farmers’ and ‘Quality of veterinary services’. These case study farmers appeared to feel more than happy about these items of the BSC.
Finally, ‘Low priority’ characterizes most of the indicators in the Learning and growth latent construct. ‘Product innovation’ and ‘Process innovation’ are always classified as ‘Low priority’, with the notable exception of dual-purpose farms that believe they overperform for this BPI.
Similarly, the indicator ‘Quality of advisory services’ is classified as ‘Low priority’ for all cases, and for the meat, sheep and extensive farmers. Again, the farmers in the other groups believe they overperform for this indicator. In general, this result shows the limited importance paid by farmers to this indicator, no matter how its performance is evaluated.
Another way to explore Table 5 is according to the columns, to check whether there are any differences among the sub-groups of the farms. For example, the results show that the dual-purpose farms show lower performance scores than the specialised farms, particularly in factors that influence the Finance indicators (e.g., ‘Gross unit margin’) and the Internal business processes indicators. Similarly, sheep and intensive farms perform slightly better than goat farms for many of the BPIs.

5. Discussion and Conclusions

The following discussion focus on each BSC latent construct separately. The conclusions include those on the overall outcomes and on lessons learned.
Finance. The proposed model applied to the case study farms has shown that with respect to the BSC latent constructs, Finance is the area of major concern for these farmers. This result is consistent with outcomes from Dubeuf [47], who showed that in many European countries the income from goat and sheep farms is declining, and is usually lower compared to the other types of farming. While the future outlook and sentiment of the surveyed farmers is optimistic, even the perceived future performances will not match the importance that farmers attribute to each BPI.
Customer/market. This is where farmers believe to perform better, with both indicators falling in the IPA grid quadrants “Keep Up” or “Possible Overkill”, no matter how the farms are grouped. Despite the good perceived performance, the BPI “Level of market knowledge” is not considered particularly important by farmers. This last result is worth of attention as underestimation of marketing potential may be detrimental for the future development of the sector. Mandolesi et al. [48] show that active marketing strategies such as increased media visibility of sheep and goat products may be beneficial for promoting the consumption of sheep meat, while Montossi et al. (2013) [49] discuss how communication about the origin and production methods, may support the demand for this type of products.
Learning and growth. The BPIs referring to the Learning and growth latent construct show low performance and importance scores, as all of the groups, but one, are classified as ‘Low priority’. In other words, these farm businesses consider innovation to be a secondary performance factor. These results are consistent with those reported in Belanche [9]. Relative to other agricultural sectors, both technology and innovation have remained relatively stagnant and neglected in the goat and sheep sectors, by both the supply chain actors and mainstream research [50]. Unfortunately, a limited attitude to innovation, as well as limited investment in knowledge and the development and testing of innovations are factors that might challenge the long-term viability of goat and sheep farms in Europe [47,50]. Using the proposed model, a finding like this might trigger strategic actions (or, in the macro case, policy actions) that are targeted to increase the innovation potential of a sector.
Internal Business Process. The low importance attributed to all of the Internal business processes indicators, with the exclusion of ‘Labour force skills’, might indicate the need for policy changes, such as increased provision of more and improved targeted services or incentives for better cooperation among farmers. On this issue, Camanzi et al. [51] showed the potential benefits from collaboration amongst supply chain actors and correct alignment between the supply chain and the demand in the dairy sheep supply chain in southern Europe. Other studies have also indicated that increasing trust and collaboration between farmers and other actors in the supply chain are key factors to increase the overall supply-chain performance [52,53].
As a general result, all of the latent constructs are perceived as secondary to Finance. The farmers do not appear to be able to prioritise innovation if their main concern is to break even. Unfortunately, as shown by Taleb (2012) [24], the antifragility of a system is strongly dependent on its capacity to focus on the ‘right knowledge’, making it possible to detect, understand, and endure the changes that affect it. These findings indicate that the low priority given to innovation might be among the relevant factors that explain the low performance and long-term decline of small ruminant systems.
The model based on combined use of BSC and IPA provides a simple tool to measure the economic sustainability of small farms. The BPIs used in these cases appear robust with respect to the measurement of the farmers’ perceived performance as well as their priorities. In other applications, of course, the indicators used to measure the BSC dimensions might vary. However, testing the internal consistency and validity of the BSC latent constructs by confirmatory factor analysis allows the selection of effective indicators of business performance.

Author Contributions

D.G., writing original draft, writing-review and editing, formal analysis, methodology, visualisation; F.S., fata curation, investigation, writing original draft, formal analysis, methodology; R.Z., funding acquisition, formal analysis, supervision, conceptualization, writing–review and editing, investigation, methodology; S.O., data curation, investigation, resources. All authors have read and agreed to the published version of the manuscript.

Funding

This paper was produced as part of the research project ‘Innovation for Sustainable Sheep and Goat Production in Europe- iSAGE’–Horizon 2020, Grant Agreement No 679302. Responsibility for the information and views set out in this study lies entirely with the authors.

Institutional Review Board Statement

Not applicable.

Informed Consent Statement

Not applicable.

Data Availability Statement

Data are published at: “Zanoli, Raffaele (2021), “Small-ruminants farmers BSC Business Performance Indicators”, Mendeley Data, V1, doi: 10.17632/tj7zck96nm.1”.

Conflicts of Interest

The authors declare no conflict of interest. The funders had no role in the design of the study; in the collection, analyses, or interpretation of data; in the writing of the manuscript, or in the decision to publish the results.

References

  1. European Commission. Lamb, Mutton and Goatmeat Detailed Information on Imports, Trade, Market Measures, Legal Bases, Market Monitoring and Committees for Sheepmeat and Goatmeat. Available online: https://ec.europa.eu/info/food-farming-fisheries/animals-and-animal-products/animal-products/lamb-mutton-and-goatmeat (accessed on 8 March 2021).
  2. Pulina, G.; Milán, M.J.; Caja, G.; Morin, E.; Lavín, M.P. Invited Review: Current Production Trends, Farm Structures, and Economics of the Dairy Sheep and Goat Sectors. J. Dairy Sci. 2018, 101, 6715–6729. [Google Scholar] [CrossRef] [PubMed] [Green Version]
  3. Eurostat. EU Agricultural Production Statistics. Available online: https://appsso.eurostat.ec.europa.eu/nui/show.do?dataset=apro_mt_lssheep&lang=en (accessed on 8 March 2021).
  4. Eurostat. Eurostat Agriculture Database. Available online: https://appsso.eurostat.ec.europa.eu/nui/show.do?dataset=apro_mt_lsgoat&lang=en (accessed on 8 March 2021).
  5. Theodoropoulu, H.; Theodoropoulu, G.; Zervas, G. Employment of Farmers in the Sheep and Goat Livestock Sector of the Trikala Region in Greece. New Medit 2000, 1, 37–40. [Google Scholar]
  6. Truchero, G.R. Economic, Social and Environmental Sustainability in Sheep and Goat Production Systems. In Proceedings of the International Seminar of the Sub-Network on Production Systems of the FAO-CIHEAM Inter-Regional Cooperative Research and Development Network on Sheep and Goats, Zaragoza, Spain, 10–12 November 2010; pp. 365–375. [Google Scholar]
  7. Dýrmundsson, Ó.R. Sustainability of Sheep and Goat Production in North European Countries—From the Arctic to the Alps. Small Rumin. Res. 2006, 62, 151–157. [Google Scholar] [CrossRef]
  8. Sossidou, E.; Ligda, C.; Mastranestasis, I.; Tsiokos, D. Sheep and Goat Farming in Greece: Implications and Challenges for the Sustainable Development of Less Favoured Areas. Anim. Sci. Biotechnol. 2013, 46, 446–449. [Google Scholar]
  9. Belanche, A.; Martín-Collado, D.; Rose, G.; Yáñez-Ruiz, D.R. A Multi-Stakeholder Participatory Study Identifies the Priorities for the Sustainability of the Small Ruminants Farming Sector in Europe. Animal 2021, 15, 100131. [Google Scholar] [CrossRef]
  10. Paraskevopoulou, C.; Theodoridis, A.; Johnson, M.; Ragkos, A.; Arguile, L.; Smith, L.; Vlachos, D.; Arsenos, G. Sustainability Assessment of Goat and Sheep Farms: A Comparison between European Countries. Sustainability 2020, 12, 1–23. [Google Scholar] [CrossRef] [Green Version]
  11. Kaplan, R.S.; Norton, D.P. The Balanced Scorecard--Measures That Drive Performance. Harv. Bus. Rev. 1992, 70, 71–79. [Google Scholar]
  12. Martilla, J.A.; James, J.C. Importance-Performance Analysis. J. Mark. 1977, 41, 77–79. [Google Scholar] [CrossRef]
  13. Andy, N. The Evolution of Performance Measurement Research: Developments in the Last Decade and a Research Agenda for the Next. Int. J. Oper. Prod. Manag. 2005, 25, 1264–1277. [Google Scholar]
  14. de Lima, E.; da Costa, S.E.; Angelis, J.; Munik, J. Performance Measurement Systems: A Consensual Analysis of Their Roles. Int. J. Prod. Econ. 2013, 146, 524–542. [Google Scholar] [CrossRef]
  15. Van Looy, A.; Shafagatova, A. Business Process Performance Measurement: A Structured Literature Review of Indicators, Measures and Metrics. Springerplus 2016, 5, 1–24. [Google Scholar] [CrossRef] [Green Version]
  16. Richard, P.J.; Devinney, T.M.; Yip, G.S.; Johnson, G. Measuring Organizational Performance: Towards Methodological Best Practice. J. Manag. 2009, 35, 718–804. [Google Scholar] [CrossRef] [Green Version]
  17. Bigliardi, B.; Bottani, E. Performance Measurement in the Food Supply Chain: A Balanced Scorecard Approach. Facilities 2010, 28, 249–260. [Google Scholar] [CrossRef]
  18. Prakash, G.; Pant, R.R. Performance Measurement of a Dairy Supply Chain: A Balance Scorecard Perspective. In Proceedings of the IEEE International Conference on Industrial Engineering and Engineering Management, Bangkok, Thailand, 10–13 December 2014; pp. 196–200. [Google Scholar]
  19. Susanty, A.; Bakhtiar, A.; Purwaningsih, R.; Dewanti, D.F. Performance Measurement of the Relationship between Farmers-Cooperatives-Industrial Processing Milk in a Dairy Supply Chain: A Balanced Supply Chain Management Scorecard Approach. In Proceedings of the 2017 IEEE International Conference on Industrial Engineering and Engineering Management, Singapore, 10–13 December 2017; pp. 1387–1391. [Google Scholar]
  20. Paustian, M.; Wellner, M.; Theuvsen, L. The Balanced Scorecard as a Management Tool for Arable Farming. Int. J. Food Syst. Dyn. 2015, 6, 147–158. [Google Scholar]
  21. Byrne, A.; Kelly, T. The Development and Application of the Balanced Scorecard for the Irish Dairy Farm Manager. In Proceedings of the 20th Annual Conference AIAEE 2004, Dublin, Ireland, 23–29 May 2004; pp. 851–861. [Google Scholar]
  22. Noell, C.; Lund, M. The Balanced Scorecard (BSC) for Danish Farms–Vague Framework or Functional Instrument? In Proceedings of the Farm Management: Proceedings of NJF Seminar no. 345, Oslo, Norway, 2–4 October 2002; pp. 187–204. [Google Scholar]
  23. Sever, I. Importance-Performance Analysis: A Valid Management Tool? Tour. Manag. 2015, 48, 43–53. [Google Scholar] [CrossRef]
  24. Taleb, N.N. Antifragile: Things That Gain from Disorder; Random House: New York, NY, USA, 2012. [Google Scholar]
  25. Vij, S.; Bedi, H.S. Are Subjective Business Performance Measures Justified? Int. J. Product. Perform. Manag. 2016, 65, 603–621. [Google Scholar] [CrossRef]
  26. Zulkifli, S.N.A. Business Performance for SMEs: Subjective or Objective Measures? Rev. Intergrative Bus. Econ. 2014, 3, 371–381. [Google Scholar]
  27. Wall, T.D.; Michie, J.; Patterson, M.; Wood, S.J.; Sheehan, M.; Clegg, C.W.; West, M. On the Validity of Subjective Measures of Company Performance. Pers. Psychol. 2004, 57, 95–118. [Google Scholar] [CrossRef]
  28. Laitinen, E.K.; Chong, G. How Do Small Companies Measure Their Performance? Probl. Perspect. Manag. 2006, 4, 49–68. [Google Scholar]
  29. Joshi, P.L.; Kumar, R.; Al-Ajmi, J. An Empirical Study of the Use and Usefulness of Financial, Non-Financial and Subjective Measures for Performance Evaluation in Industrial Companies in Bahrain. Int. J. Manag. Financ. Account. 2011, 3, 140. [Google Scholar] [CrossRef]
  30. ’Atikah Zulkiffli, S.N.; Perera, N. A Literature Analysis on Business Performance for SMEs: Subjective or Objective Measures? In Proceedings of the 2011 SIBR Conference on Interdisciplinary Business and Economics Research, Bangkok, Thailand, 16–18 June 2011; pp. 1–9. [Google Scholar]
  31. Vij, S.; Bedi, H.S. Effect of Organisational and Environmental Factors on Innovativeness and Business Performance Relationship. Int. J. Innov. Manag. 2016, 20, 1–28. [Google Scholar] [CrossRef]
  32. Singh, S.; Darwish, T.K.; Potočnik, K. Measuring Organizational Performance: A Case for Subjective Measures. Br. J. Manag. 2016, 27, 214–224. [Google Scholar] [CrossRef]
  33. Clauss, T. Measuring Business Model Innovation: Conceptualization, Scale Development, and Proof of Performance. R D Manag. 2017, 47, 385–403. [Google Scholar] [CrossRef]
  34. Calantone, R.J.; Cavusgil, S.T.; Zhao, Y. Learning Orientation, Firm Innovation Capability, and Firm Performance. Ind. Mark. Manag. 2002, 31, 515–524. [Google Scholar] [CrossRef]
  35. Craig, J.B.; Dibrell, C.; Davis, P.S. Leveraging Family-Based Brand Identity to Enhance Firm. J. Small Bus. Manag. 2008, 46, 351–371. [Google Scholar] [CrossRef]
  36. Rahman, M.N.A.; Doroodian, M.; Kamarulzaman, Y.; Muhamad, N. Designing and Validating a Model for Measuring Sustainability of Overall Innovation Capability of Small and Medium-Sized Enterprises. Sustainability 2015, 7, 537–562. [Google Scholar] [CrossRef] [Green Version]
  37. Babakus, E.; Cravens, D.W.; Grant, K.; Ingram, T.N.; LaForge, R.W. Investigating the Relationships among Sales, Management Control, Sales Territory Design, Salesperson Performance, and Sales Organization Effectiveness. Int. J. Res. Mark. 1996, 13, 345–363. [Google Scholar] [CrossRef]
  38. Forker, L.B.; Vickery, S.K.; Droge, C.L.M. The Contribution of Quality to Business Performance. Int. J. Oper. Prod. Manag. 1996, 16, 44–62. [Google Scholar] [CrossRef]
  39. Darnhofer, I. Resilience and Why It Matters for Farm Management. Eur. Rev. Agric. Econ. 2014, 41, 461–484. [Google Scholar] [CrossRef]
  40. Markussen, T.; Fibæk, M.; Tarp, F.; Tuan, N.D.A. The Happy Farmer: Self-Employment and Subjective Well-Being in Rural Vietnam. J. Happiness Stud. 2018, 19, 1613–1636. [Google Scholar] [CrossRef]
  41. Kline, R.B. Principles and Practice of Structural Equation Modeling; Methodology in the Social Sciences; Guilford Publications: New York, NY, USA, 2011. [Google Scholar]
  42. Taber, K.S. The Use of Cronbach’s Alpha When Developing and Reporting Research Instruments in Science Education. Res. Sci. Educ. 2018, 48, 1273–1296. [Google Scholar] [CrossRef]
  43. Oh, H. Revisiting Importance–Performance Analysis. Tour. Manag. 2001, 22, 617–627. [Google Scholar] [CrossRef]
  44. Yin, R.K. Case Study Research and Applications: Design and Methods, Sixth Edition, 6th ed.; SAGE: Los Angeles, CA, USA, 2018. [Google Scholar]
  45. Theodoridis, R.A.; Ragkos, A.; Zaralis, K.; Mullender, S.; Rose, G.; Arsenos, G. ISAGE Deliverable No: 1.1 Report on New Farm Typologies for Sheep and Goat Systems within the EU for ISAGE; Aristotle University of Thessaloniki: Thessaloniki, Greece, 2016. [Google Scholar]
  46. Anderson, J.C.; Gerbing, D.W. Structural Equation Modeling in Practice: A Review and Recommended Two-Step Approach. Psychol. Bull. 1988, 103, 411–423. [Google Scholar] [CrossRef]
  47. Dubeuf, J.P. Science, Technology, Innovation and Governance for the Goat Sectors. Small Rumin. Res. 2014, 121, 2–6. [Google Scholar] [CrossRef]
  48. Mandolesi, S.; Naspetti, S.; Arsenos, G.; Caramelle-Holtz, E.; Latvala, T.; Martin-Collado, D.; Orsini, S.; Ozturk, E.; Zanoli, R. Motivations and Barriers for Sheep and Goat Meat Consumption in Europe: A Means–End Chain Study. Animals 2020, 10, 1–16. [Google Scholar] [CrossRef]
  49. Montossi, F.; Font-i-Furnols, M.; del Campo, M.; San Julián, R.; Brito, G.; Sañudo, C. Sustainable Sheep Production and Consumer Preference Trends: Compatibilities, Contradictions, and Unresolved Dilemmas. Meat Sci. 2013, 95, 772–789. [Google Scholar] [CrossRef] [PubMed]
  50. Rose, I.; Martin-Collado, D.; Orsini, S.; Zanoli, R.; Yañez-Ruiz, D.; Zaralis, K.; Arsenos, G. Using the Multi-Stakeholder Approach to Match Potential Innovations with Challenges Experienced by European Sheep and Goat Farms. In Innovative Approaches and Applications for Sustainable Rural Development; Theodoridis, A., Ragkos, A., Salampasis, M., Eds.; Springer International Publishing: Cham, Switzerland, 2019; pp. 119–130. [Google Scholar]
  51. Camanzi, L.; Arba, E.; Rota, C.; Zanasi, C.; Malorgio, G. A Structural Equation Modeling Analysis of Relational Governance and Economic Performance in Agri-Food Supply Chains: Evidence from the Dairy Sheep Industry in Sardinia (Italy). Agric. Food Econ. 2018, 6, 1–21. [Google Scholar] [CrossRef] [Green Version]
  52. Farrell, H. Trust and Political Economy Institutions and the Sources of Interfirm Cooperation. Comp. Polit. Stud. 2005, 38, 459–483. [Google Scholar] [CrossRef] [Green Version]
  53. Naspetti, S.; Lampkin, N.; Nicolas, P.; Stolze, M.; Zanoli, R. Organic Supply Chain Collaboration: A Case Study in Eight EU Countries. J. Food Prod. Mark. 2011, 17, 141–162. [Google Scholar] [CrossRef]
Figure 1. Methodological approach for the evaluation of farm business performance.
Sustainability 13 03321 g001
Figure 2. Importance Performance analysis of business performance indicators: all farm types.
Sustainability 13 03321 g002
Table 1. Definitions and measurements of business performance of goat and sheep farms.
Latent ConstructDefinitionBusiness Performance IndicatorSources
FinanceThe perceived level of farm profitability and financial performancePrices paid on sales (€/kg; €/L)[15,25,28,29,30,31,32]
Farmer’s share of retail price
Sales growth
Gross margins (€/kg; €/L)
Learning and growth (innovation)The perceived level of commitment to learning & growth in terms of innovationProduct innovation[15,25,28,29,30,31,32,33,34,35,36]
Process innovation
Customer/marketThe perceived level of access to market information and product conformance to customer expectationsLevel of market knowledge[15,25,28,29,30,31,37,38]
Customer satisfaction
Internal business processThe perceived level of internal business process qualityLabour force skills[15,25,29,30,31,33,34,36,39,40]
Farmer’s quality of life
Cooperation with other farmers
Quality of veterinary services
Quality of advisory services
Table 2. Distribution of case study farms included in the present study, according to country and farm type.
CountryIntensiveExtensiveDual PurposeTotal Farms Per Country
MilkMeatMilkMeat
Greece6082824
Finland0205310
France33144024
Italy20113521
Spain210713041
Turkey591362255
UK33314427
Totals4017564742202
Table 3. Validation of the multi-item latent constructs: results from confirmatory factor analysis and Cronbach’s alpha.
Latent ConstructBusiness Performance IndicatorConfirmatory Factor Analysis/CovarianceCronbach’s Alpha
Standard LoadingMeanS.D.
Finance 0.83
Price paid on sales0.81 ***4.351.15
Farmer’s share of retail price0.69 ***3.811.35
Sales growth0.63 ***4.381.01
Gross unit margins0.82 ***4.111.58
Learning and growth 0.79
Product innovation0.87 ***3.951.51
Process innovation0.75 ***4.261.45
Customer/market 0.74
Level of market knowledge0.87 ***5.111.11
Customer satisfaction0.66 ***5.061.00
Internal business process 0.67
Labour force skills0.38 ***4.541.17
Farmer’s quality of life0.59 ***4.201.25
Cooperation with other farmers0.51 ***4.541.37
Quality of veterinary services0.55 ***4.421.41
Quality of advisory services0.48 ***4.301.60
*** p < 0.001.
Table 4. Sentiment analysis of future versus past business performance indicator scores.
Business Performance IndicatorFuture Versus Past Performance Difference
Prices paid on sales (prices: €/kg; €/L)0.34
Farmer’s share of retail price0.39
Sales growth0.21
Gross margins (€/kg; €/L)0.34
Product innovation (new product development)0.36
Process innovation (new production methods)0.36
Level of market knowledge0.27
Customer satisfaction0.23
Labour force skills0.26
Farmer’s quality of life0.50
Cooperation with other farmers0.28
Quality of veterinary services0.26
Quality of advisory services0.25
Table 5. Importance-performance analysis of BPIs per type of farm (cross-point for classification: sample mean).
Latent ConstructBPIAll CasesSub-Groups
By PurposeBy SpeciesBy System
Dual PurposeDairyMeatGoatSheepExtensiveIntensive
Financial performancePrices paid on salesConcentrate hereConcentrate hereConcentrate hereKeep upKeep upConcentrate hereKeep upKeep up
Farmer’s share of retail priceConcentrate hereConcentrate hereConcentrate hereConcentrate hereConcentrate hereConcentrate hereConcentrate hereConcentrate here
Sales growthKeep upConcentrate hereKeep upKeep upKeep upConcentrate herePossible overkillKeep up
Gross marginsConcentrate hereConcentrate hereConcentrate hereConcentrate hereConcentrate hereConcentrate hereConcentrate hereConcentrate here
Learning and growthProduct innovationLow priorityPossible overkillLow priorityLow priorityLow priorityLow priorityLow priorityLow priority
(innovation)Process innovationLow priorityLow priorityLow priorityLow priorityLow priorityLow priorityLow priorityLow priority
Customer/marketLevel of market knowledgePossible overkillPossible overkillPossible overkillPossible overkillPossible overkillPossible overkillPossible overkillKeep up
Customer satisfactionKeep upKeep upKeep upKeep upKeep upKeep upKeep upKeep up
Internal businessLabour force skillsKeep upLow priorityKeep upKeep upKeep upPossible overkillPossible overkillKeep up
processFarmer’s quality of lifeConcentrate hereConcentrate hereConcentrate hereKeep upConcentrate hereConcentrate hereConcentrate hereConcentrate here
Cooperation with other farmersPossible overkillLow priorityPossible overkillPossible overkillLow priorityPossible overkillPossible overkillPossible overkill
Quality of veterinary servicesPossible overkillKeep upPossible overkillLow priorityPossible overkillLow priorityLow priorityKeep up
Quality of advisory servicesLow priorityLow priorityPossible overkillLow priorityPossible overkillLow priorityLow priorityPossible overkill
Publisher’s Note: MDPI stays neutral with regard to jurisdictional claims in published maps and institutional affiliations.

