
Are Cities Truly Dispersed? A Long-Term Analysis of Vertical Profile of Settlements in Athens’ Metropolitan Region


1
Soil Erosion and Degradation Research Group, Department of Geography, University of Valencia, Blasco Ibàñez, 28, 46010 Valencia, Spain
2
Department of Physical Geography, Trier University, D-54286 Trier, Germany
3
Department of Socioeconomic Sciences, Polytechnic University of Marche, Piazza Martelli 8, I-60121 Ancona, Italy
*
Author to whom correspondence should be addressed.
Sustainability 2021, 13(6), 3365; https://0-doi-org.brum.beds.ac.uk/10.3390/su13063365
Submission received: 17 February 2021
/
Revised: 5 March 2021
/
Accepted: 17 March 2021
/
Published: 18 March 2021
(This article belongs to the Special Issue Urban Sprawl and Sustainability II)
Abstract
:Using nonparametric, exploratory statistics, the spatial structure of the city’s vertical profile was investigated at the municipal scale in Athens’ metropolitan region (Greece), evaluating changes over a sufficiently long time interval (1983–2019) that encompasses different phases of the urban cycle in Greece. Assuming the vertical profile of cities as an honest indicator of urban form, the study was aimed to test the intensity and spatial direction of the (supposed) change in settlement models toward sprawl. Transitioning slowly from a dense to a more dispersed settlement structure, Athens’ dynamics revealed a quite representative model for cities expanding significantly but remaining substantially compact and dense, while responding similarly to different (external) economic stimuli. Nonparametric correlation between the average (vertical) profile of each municipality and the distance from downtown Athens revealed a substantially stable mono-centric structure over time, with small changes over time still responding to factors dependent on the urban gradient. The inherent shift towards “horizontal” urban expansion was relatively modest and characteristic of few periurban contexts. The empirical results of this study can be envisaged as a practical tool of regional planning, allowing continuous monitoring of urban sprawl and land take in complex systems under rapid socioeconomic changes.
1. Introduction
A city is a complex entity, which contains diverse ecosystems influenced by social, economic, environmental, and cultural factors among others, therefore, finding the correct indicators is thus an important topic [1]. Scholars have developed different evaluation indicators, indexes and models assessing sustainable development, fundamentally applied to urbanism management, regional geography, ecological planning, housing and social policy [2,3,4]. Næss [5] stated that urban planning and Sustainable Development should not be focused solely on means-ends rationality, paying attention in turn to the consensus among stakeholder’s circles and enhancing the “alliance-building” among those groups who can help the minimum “equity and environmental values of a sustainable development”.
After World War II, Mediterranean landscapes reflected similar changes across regions, mainly, moving from diffused and fragmented human settlements to more dense ones [6,7]. Some authors proposed the terms “dispersed”, “compact” or “mono-centric” cities referring to these new contexts, which, following specific patterns, they were not studied that deeply to date [8,9,10,11,12,13]. Dieleman and Wagener [14] defined compact cities as a growing concern about the development of cities, based on the deconcentration of urban territory use in the form of urban sprawl. These authors also consider some “unintentional consequences” of this process such as city center decline, increased reliance on the use of private automobiles, and the loss of open space. On the other hand, other scholars such as Neuman [15] remarked that considering the urban space in terms of form is neither necessary nor sufficient to achieve the goals ascribed to the compact city. All in all, nowadays, it could be possible to present a consensus among scholars to distinguish in these urban changes two different socioeconomic manifestations along with the territory [16,17]: (i) urban agglomeration or congestion (population density) and (ii) vertical city profile (higher buildings). Growing in both population density and vertical profile is proof of urbanization (the effectiveness of scale and agglomeration factors), in turn showing negative consequences such as congestion, air pollution, the decline in life quality, higher land/housing prices and social deprivation, among others [18,19,20]. For instance, Asian big metropolitan regions are experiencing this process [21]. In these super-populated areas, we can highlight some terms and methods easily applicable to the Mediterranean belt. For example, Chen et al. [22] stated that densification and vertical growth can be estimated using the term “city breathability”, which is widely used in ideal urban models. Yang et al. [23] insisted that new techniques such as mobile phone signals should be good indicators to measure this process within a new context reflecting the “smart cities” ideology, although it still supposes a big challenge for urban scholars.
In southern Europe, especially in Greece during the 1990s, Leontidou [24,25,26] stated in different investigations that the informal action of the private agents together with a substantial ineffectiveness of the national planning systems has generated a drastic modification of numerous Greek urban regions influencing the core cities and its compactness and hyper-density. Nowadays, Greece continues to be affected by the global recession and austerity measures, which shows clear impacts on its most important urban areas: Thessaloniki and Athens [27]. Some authors expressed that this situation also remarks other biophysical issues related to the compaction and vertical growth, among them, the lack of availability of suitable space for edification [28] and the variability of the topographical conditions [29]. Accordingly, Giannakourou [30] observed two opposite directions in these urban landscapes: a polycentric development and others affected by planning deregulation. Arapoglou and Sayas [31] noted new gender and ethnic divisions in the occupational structure at the intraurban scale and migratory flows reflecting diversified occupational trajectories among women, which contribute to shaping the socioeconomic profile of the destination areas.
However, a reduced number of specific indicators have been selected and used to profile the different phases of this Mediterranean urban expansion in this country. To date, and especially in Greece, this empirical evidence is scarce and needs confirmation with further studies using long time series data and available statistical indicators characterized by a high spatial resolution [32]. It is key to understand these recent dynamics and collect valuable data to demonstrate which patterns follow urban diffusion and compactness, reflected in an increase in the vertical profile. This could derive from comparative and holistic analyses of several indicators describing the city’s form, demographic trends, socioeconomic characters, and land-use variables [33,34,35].
Therefore, the main goal of this research was to assess the annual changes in the vertical profile of the metropolitan region of Athens over a sufficiently long time interval (1983–2019) encompassing different phases of its urban cycle. We consider this area because it can be considered as a representative laboratory to evaluate urban dynamics in the Mediterranean due to (i) available data and (ii) previous research works to be compared. In this study, shifting toward a more horizontal city profile was considered less sustainable in terms of land consumption. We hypothesize that taking dense settlements as land-saving morphologies, long-term changes in the vertical profile of Athens’ municipalities may indirectly reflect the inherent transition toward socioeconomic processes of metropolitan growth with high pressure on nonurban land.
2. Materials and Methods
2.1. Study Area
We studied an area coinciding with the Athens metropolitan region (nearly 3000 km2) following the definition of the European Urban Atlas on behalf of the Global Monitoring and Environmental Surveillance (GMES) Copernicus Land initiative (e.g., [30,31]). This area (Figure 1) mostly corresponds with the mainland area of the administrative region of Attica in Central Greece [36]. The investigated area was administered by 115 municipalities and local communities; a total of 58 municipalities formed the Greater Athens area that represents the consolidated urban area of the Greek capital.
Between 1951 and 2011 resident population increased from 1.5 to 3.8 million people, reaching a density above 1200 inhabitants/km2 in Attica [28]. A drastic increase in building density—forming mainly dense, “vertical” settlements—accompanied this intense urbanization wave and candidates Athens as one of the best examples of “intrinsically compact” Mediterranean cities [6,37,38]. In more recent decades, a substantial decoupling between population (stable or slightly decreasing) and building stock (increasing at a slower pace than before) was observed, outlining the consolidation of sprawl processes in some parts of the metropolitan region [39].
2.2. Data Sources and Elementary Variables
Aggregated data from building permits (including new constructions only) released between 1983 and 2019 by each statutory municipality in the study area were considered in this study. Considering the whole time series released, a total of 37 observations (i.e., years) is regarded as a sufficient representation of recent urban phases in Athens, encompassing sequential economic downturns, from expansion to the recession. Municipal-level data including the average number of floor for each authorized (new building) construction were published annually by the Greek Statistical Authority (ELSTAT; [40]). The average number of floors in newly issued building permits by year and municipality was used as the dependent variable in this study. The spatial distribution of the average number of floors in newly authorized buildings was analyzed at the same geographical level, assuming municipalities as the appropriate scale for a detailed analysis of the vertical profile of settlements in Athens and using a map of municipal boundaries provided by ELSTAT cartographical service.
Contextual variables derived from official statistics and maps were also made available for spatial analysis in this study (e.g., [35,36,37,41]). These variables were classified as topographic (n = 6 variables) or territorial (n = 6 variables) and were adopted as predictors of basic urbanization processes in the area. Topographic variables included linear distances (km) from individual poles of growth such as (i) downtown Athens, (ii) Piraeus, (iii) the new central business district gravitating on the Olympic Stadium in Maroussi (Northern Athens), (iv) the “E. Venizelos” international airports in the municipalities of Spata and Markopoulo belonging to the suburban district of Messoghia, Eastern Attica, (v) the industrial pole of Thriasio mostly gravitating on the municipality of Aspropyrgos (Western Attica), and (vi) the rural district of Oropos (Northern Attica). As other previous studies confirmed in the past, they can provide a comprehensive evaluation of climate and soil quality, among others, composing some basic variables in a summary score index to observe if there are any kinds of environmental or social limitations or promotion in one specific area [42,43,44]. The main reason to use linear distance is to consider influencing travel distances to work, the distance of residence from the urban cores and provision of public transport [45]. Territorial variables include (i) average municipal elevation (m), (ii) minimum distance from the sea coastline (km), (iii) economically disadvantaged municipalities (a dummy classifying local communities as affluent or depressed based on Salvati and Serra [46], (iv) municipal size (km2), (v) soil quality index, and (vi) climate quality index both calculated following the Environmentally Sensitive Area approach. The main reason to include these territorial variables is that they allow to be used as a monitoring framework to assess land sensitivity to degradation and desertification risk.
2.3. Data Analysis
Trends over time in the dependent variable (average number of floors per building permit) were summarized at three spatial levels in the study area moving radio-centrically from the inner city to the periphery (downtown Athens, Greater Athens area with the exclusion of downtown Athens and the Athens metropolitan region with the exclusion of the Greater Athens area). The (evolving) spatial structure of the vertical profile of settlements in Athens (based on building permits data) was investigated at each year between 1983 and 2019 assessing the pairwise correlation of the average number of floors per building in each municipality of the study area with each of the 12 predictors illustrated above (Section 2.2). A nonparametric Spearman cograduation analysis was adopted here to identify both linear and nonlinear correlations testing for significant coefficients at p < 0.05 after Bonferroni’s correction for multiple comparisons [44,47,48]. This analysis provided a rectangular matrix (12 × 37) of correlation coefficients by predictor (columns) and year (rows) that were further analyzed through the spectral decomposition of principal components, the so-called principal component analysis (PCA) [49]. This multivariate, exploratory analysis was run with the specific aim at delineating the latent relationships between contextual predictors of the vertical profile of buildings and the economic/urban cycle in Athens, distinguishing (i) a period of economic stability or less intense downturns (both expansions and stagnations) between the early 1980s and the mid-1990s, from a phase of (ii) intense economic growth (mid-1990s to late-2000s, the so-called “gold decade” culminated with the 2004 Olympic Games in Athens) and (iii) a drastic recession afterwards. Components with eigenvalue >1 were extracted and analyzed further, computing variable loadings and case scores [50,51,52]. Component loadings (indicating the degree of association between each predictor and the respective component) were tabulated and classified as highly significant (bold) or moderately significant (italics) according to the loading’s value (bold: loadings > |0.65|; italics: |0.4| < loadings < |0.65|). The geometrical distribution of loadings and scores on the most representative components was finally illustrated using a biplot [43,46,53], a typical result of the PCA delineating similarities among cases, among variables and the two sets of variables and cases together. The position of each variable and case in the components’ space was represented by individual dots in the biplot. Close points indicate similar statistical behavior leading to a comparable spatial pattern characterizing the studied variables. Years were classified in a few homogeneous groups based on the biplot representation.
3. Results and Discussion
3.1. Descriptive Statistics
In Figure 2, a total of 430 km2 of the study area can be observed. Additionally, the total number of building permits released between 1983 and 2019 in the study area is illustrated in Figure 3. Two poles of growth were located in the Greater Athens corresponding to individual municipalities [54]: downtown Athens, the core of the Greek capital and Piraeus, the main harbor of Greece and one of the largest in the Eastern Mediterranean. While the metropolitan region consists mainly of mountain chains bordering the Greater Athens, some flat areas are located in Attica: the Messoghia plain, the Marathon plain, and the Thriasio plain [46]. After a long history of demographic stability or slow increase, Athens experienced massive population growth since the early 1920s [41]. After World War II, urban settlements expanded further responding to a huge increase of resident population driven by an intense exodus from rural and marginal areas all over the country [42]. Compact expansion of settlements was continuously observed in the 1950s, 1960s, and 1970s. In these decades, the population grew at a rate of 2–3% per year determining settlement concentration and urban congestion [43]. In addition, it is worth highlighting the explicit and implicit impacts of town planning regulations in redirecting future processes of building permits, which also require further clarification. In this regard, analysis of building permits may intrinsically incorporate the double effect of town planning regulations (since permits’ release strongly depends on them) and socioeconomic forces [55,56].
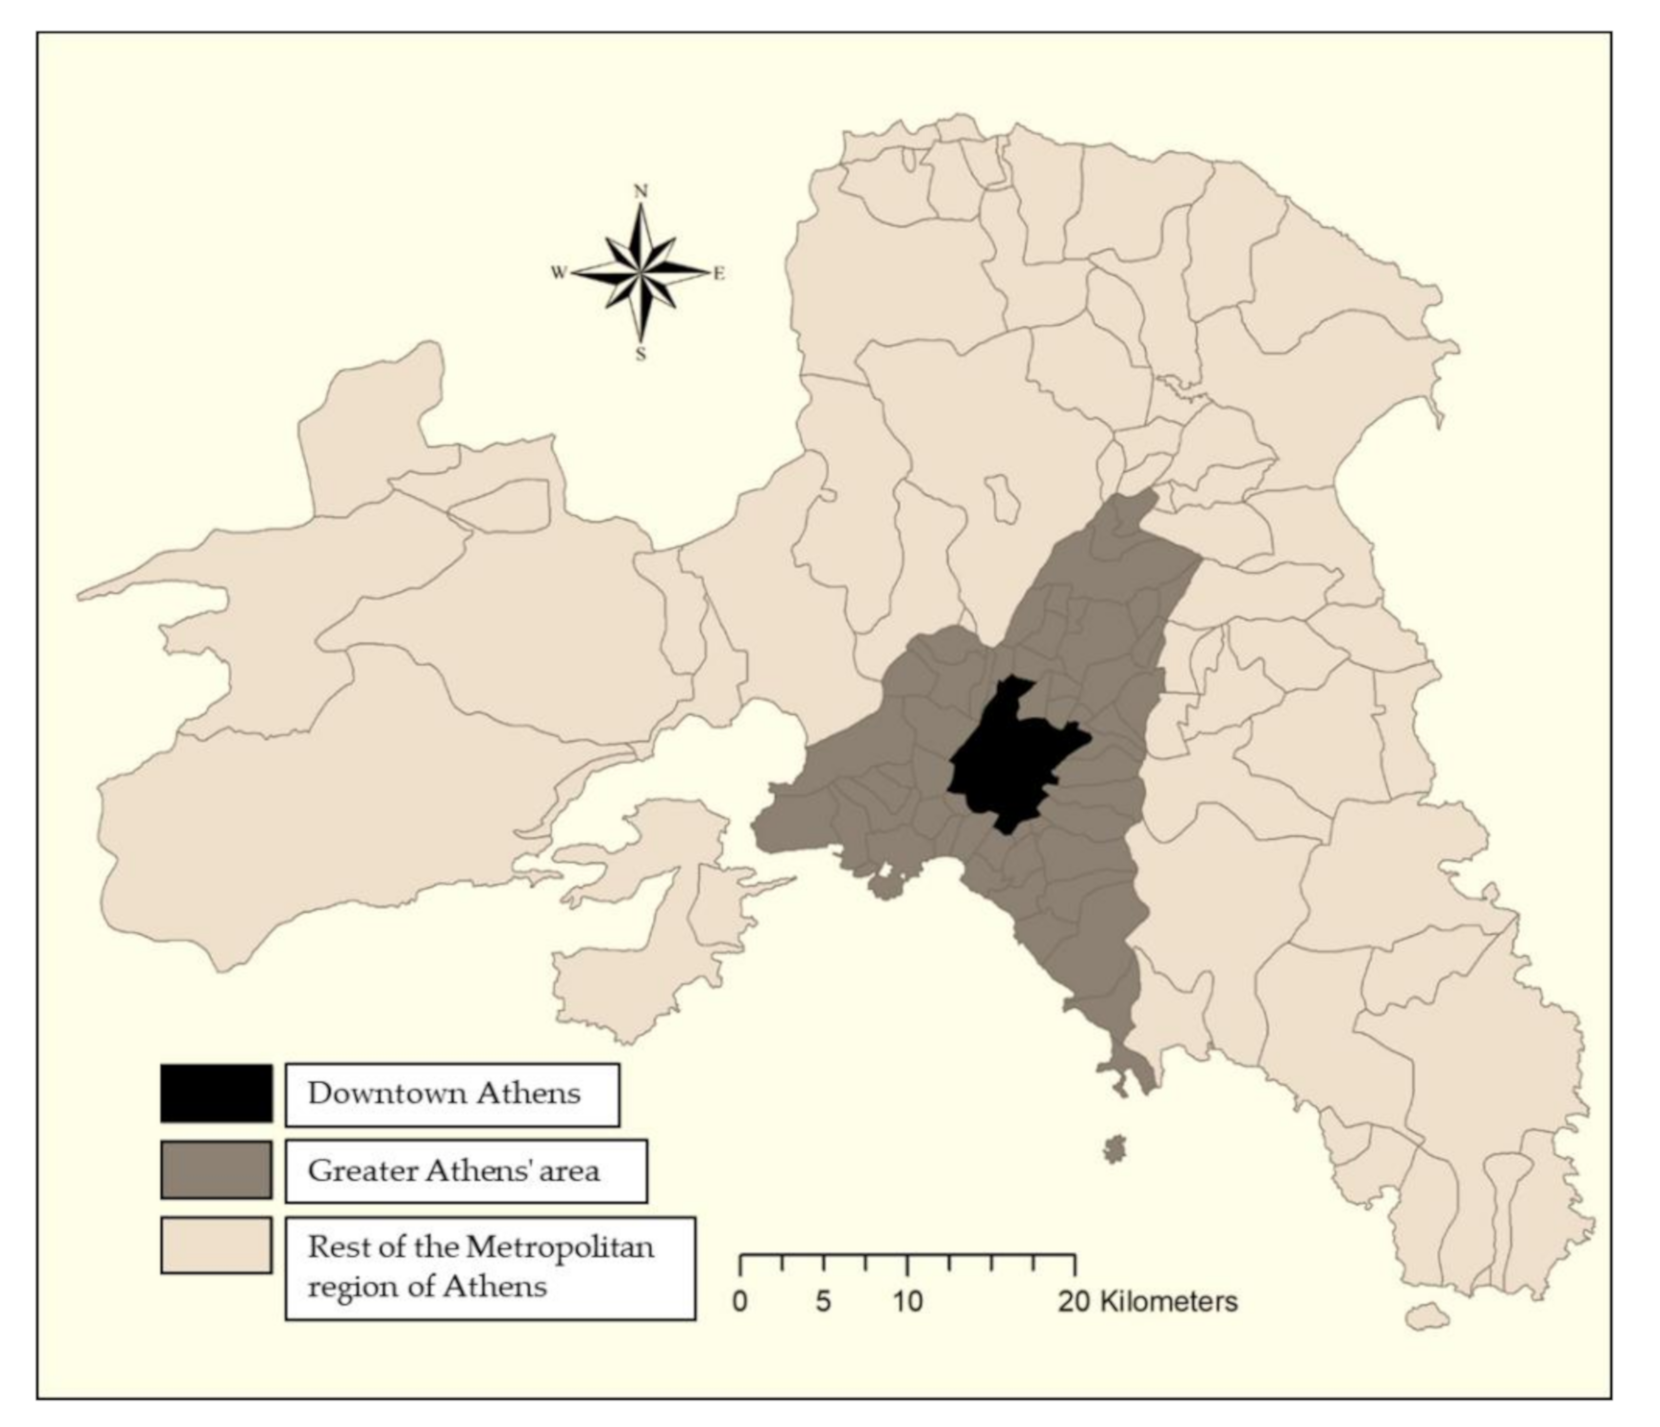
The long-term evolution of the vertical profile in the Athens metropolitan region is illustrated in Figure 4 by dividing the whole study area into three radio-centric districts (downtown Athens, corresponding with the respective municipality encompassing a total area of 40 km2; the Greater Athens area, corresponding with the urban conurbation around downtown Athens, extending almost 400 km2; the entire region, with the exclusion of the Greater Athens area, covering nearly 2600 km2 and including mostly rural districts with low-density settlements and isolated houses, and few urban subcenters; Figure 5). A common trend toward an increase in the vertical profile of the city was observed, although with different intensities, in all spatial partitions, from the early 1980s up to the end of the economic expansion in the mid-2000s, corresponding with the end of the “gold decade” culminated in the 2004 Olympic Games. Being more evident in downtown Athens, this trend reverted substantially and quite rapidly at the end of the 2000s, in correspondence with the great recession in Greece [27] and also due to town planning regulations. Gkartzios [57] pointed out the possible phenomenon of counter-urbanization movements during those times of economic crisis, considering key a centrifugal methodological model for understanding principally the role of family and housing availability. In this way, Souliotis [58] recovered the concept of “embeddedness” in a combination of statistical and ethnographic analysis to attribute as main reasons of these obtained results the cultural economy in relation with social stratification and urban policy dynamics during the affiliation of Greece to the EC/EU.
On average, permits released in the early 1980s allowed the construction of mostly low-rise buildings in both downtown Athens (3–4 floors), Greater Athens (2–3 floors) and the rest of the metropolitan region (2 floors). Conversely, permits released in the mid-2000s allowed construction of taller buildings on average (downtown Athens: more than 5 floors, Greater Athens (3–4 floors), the remaining part of the metropolitan region (3 floors). The average number of floors in building permits issued annually revealed to be a particularly sensitive variable to economic downturns, being immediately affected by crisis and showing a relatively rapid recovery afterwards, especially in urban and peri-urban districts. This responds to an epoch highly influenced by urban movements in Athens historically developed through informal forms of collective organizing in response to weak welfare [59]. Leontidou [24,26], confirmed by Arampatzi and Nicholls [60], remarked that spontaneous popular squats could be found during the coming years after the post-war period until the Olympic Games period influenced by the absence of housing provision and gradually assumed control over social reproduction issues in the city.
Especially, it is worth highlighting that a similar trend toward an increase in the vertical profile of the core city was registered, although with diverse intensities, in all spatial partitions, from the early 1980s up to the end of the economic expansion in the mid-2000s [24,61,62]. This corresponded with the end of the most intense urbanization wave, in correspondence with the last economic expansion of the early 2000s. This was significant in downtown Athens, where the trend reverted substantially and quite rapidly at the end of the 2000s, in correspondence with the great recession in Greece [57,60]. In the first years of the 2010s, when the recession exerted the more intense negative impact on the construction industry in Greece, the average number of floors issued in building permits approached 2 floors in all spatial partitions. However, the average number of floors in building permits increased again rapidly in 2019, reaching 5 floors in downtown Athens and 3–4 floors in Greater Athens. The great recession was acting as the most impactful breakpoint in the studied time series since the early 1980s, testifying the relevance of sequential waves of economic expansion and recession not only for construction industry and real estate markets but also for more general attributes of urban landscapes [33]. In these regards, the evolving vertical profile of cities is considered one of the most characteristic traits of metropolitan landscapes [63,64,65].
3.2. Correlation Analysis
Figure 6 and Figure 7 report the results of a nonparametric correlation analysis based on Spearman coefficients and delineate the intimate relationship between the vertical profile of Athens (based on the average number of floors in the building permits released annually by competent authorities, i.e., municipalities) and selected topographic and territorial variables characterizing urban expansion in the study area. Basically, the average number of floors decreased significantly with the linear distance from downtown Athens and Piraeus (the biggest urban poles in the area), with negative (and highly significant) Spearman coefficients ranging between −0.7 and −0.8 during a relatively long time span from 1983 to 2010. Although remaining statistically significant, the intensity of pairwise correlations between the variable’s pairs mentioned above declined substantially in the 2010s, approaching coefficients that range between −0.4 and −0.6. These results suggest how the recession impacted not only on the volume stock but also on the spatial structure of building permits with specific characteristics (e.g., the concentration of low-rise buildings in central and semicentral districts), contributing to the increased geographical heterogeneity in the vertical profile of Athens in more recent times [16,66]. This coincides with other studies developed in Asian cities with rapid and nonplanned urban expansions affected by different growth development and recession periods [67,68]. Correlations between the average number of floors and linear distances from three subcentral locations (Maroussi Olympic Stadium in the northern periphery of Athens, the “E. Venizelos” international airport in Messoghia district and the industrial area of Thriasio based in the municipality of Aspropyrgos) were negative as well, although with less intense coefficients over the whole time period and with a further decline since 2010. For the 2010s, nonsignificant coefficients were occasionally observed for the distances from the international airport and the industrial pole. Finally, correlation coefficients with the distance from Oropos’ rural pole were systematically low and statistically insignificant.
Figure 7 illustrates a couple of pairwise running correlations over time between the dependent variable (average number of floors in building permits) and selected territorial variables at the municipal scale in the study area. Medium-intensity, statistically significant correlations were found with an average elevation of municipalities and municipal size (negative coefficients). In both cases, coefficients decreased in the last decade, indicating a less homogeneous spatial structure of building permits as far as the vertical profile of newly authorized settlements is concerned [33,46]. Distance from the sea coastline, the economic status of municipalities (affluent vs. disadvantaged communities), soil quality and climate quality were weakly correlated with the average number of floors in building permits, displaying systematically insignificant coefficients from the statistical point of view. This remarks the complex understanding of the urban sprawl, horizontal or vertically, where biophysical factors in some occasions do not play a key role (e.g., [59,60,61,62]).
3.3. Multivariate Analysis
A principal component analysis (PCA) was carried out on a data matrix composed of the pairwise correlation coefficients with the dependent variable (average number of floors per building permit) by predictor (columns) and year (rows). Results are illustrated in Table 1 and Figure 8. Four significant components were extracted, explaining together 87% of the total matrix variance. Component 1 accounted for the largest amount of explained variance (51%) and clearly describes the urban–rural gradient in Athens (based on the linear distance from downtown Athens and Piraeus) and the elevation gradient. This component was also associated positively with the distance from the new Athens business district (gravitating on Maroussi Olympic Stadium) while being negatively associated with the distance from Oropos’ rural pole. Economically disadvantaged local communities and municipal size are other predictors positively associated with this component, which coincide with other investigations about urban sprawl [69,70,71,72]. Component 2 explained 18% of the total variance attributing positive loadings to the distance from the international airport and proximity to the sea coastline. While less intense, significant loadings were recorded also for the distance from Maroussi (positive coefficient) and economically disadvantaged municipalities (negative coefficient). This coincides with the research conducted by Sheard [73] who demonstrated how airports influence economic growth in US metropolitan areas. This author in another investigation also pointed out the positive impact on the employment share of tradable services, which are able to affect local employment [74]. Additionally, the main finding is that airport size has a positive effect on local employment, which also is reported in Athens [75,76]. Component 3, explaining nearly 10% of the total variance, discriminates the possible impact of soil quality (positive loading) and climate quality (negative loading) indexes in the evolving vertical profile of buildings in Athens. The impact of soil quality increased linearly with distance from Oropos’ rural pole and with the minimum distance from the sea coastline. Soil quality is a clear indicator of urban and rural processes. High-quality soils used to correspond to nonurban soils such as forests or mountain area far from the coast [77,78,79]. On the contrary, degraded ones used to coincide with cultivated and abandoned areas, which in metropolitan regions are located in the periurban areas, also placed non-close to the sea. This was also confirmed in other Mediterranean countries such as Italy [80] or mega-cities such as New York [81]. Component 4, explaining about 9% of the total variance, was finally extracted delineating a residual, latent spatial gradient from low to high climate/soil quality. Urban growth has implications for the likelihood of climate change and for the social costs that climate change will impose on the world’s quality of life because it affects greenhouse gas production and local temperatures [82,83]. Some authors found that densification and compactness of the core cites can generate heat islands, which can be a factor to motivate decentralization because of the vertical growth of the cities [84,85,86]; however, it is difficult to find a clear justification between vertical growth using climate quality as key factor.
Considering only the first two components (Figure 8) and plotting cases (years) and variables (topographic and territorial predictors), the PCA biplot classifies years in three main groups according to the economic cycle: (i) years from 1983 to 1998 (with the exception for 1993) associated with the lower left quadrant of the biplot (negative scores on both components); (ii) years from 1999 to 2010 associated with the higher left quadrant of the biplot (negative scores on Component 1 and positive scores on Component 2); (iii) years from 2011 to 2019 associated with the right quadrants (positive scores on Component 1) with a particularly heterogeneous pattern. Results of the PCA remark the peculiarity of the construction industry, building activity, and real estate local markets in the last decade, is primarily influenced by economic dynamics typical of a recessionary stage in Greece.
4. Conclusions
The main practical implications of this research were to indirectly estimate the spatial direction and intensity of urban expansion in Athens´ metropolitan region, allowing inference on the underlying role of urban-demographic cycles and economic downturns at both regional and local scale. Our results suggest that a transition from a strictly dense to a more dispersed settlement structure can be observed in the major parts of Athens´ metropolitan region. However, such a transition is relatively slow and not particularly intense over time, being in turn relatively homogeneously distributed over space. This model depicts a quite representative model for cities expanding significantly but remaining substantially compact while responding similarly to different (external) economic stimuli. A similar trend toward an increase in the vertical profile of the core city was registered, although with diverse intensities, in all spatial partitions, from the early 1980s up to the end of the economic expansion in the mid-2000s. This corresponded with the end of the most intense urbanization wave, in correspondence with the last economic expansion of the early 2000s. This was significant in downtown Athens, where the trend reverted substantially and quite rapidly at the end of the 2000s, in correspondence with the great recession in Greece. The results related to the nonparametric correlation between the average (vertical) profile by the municipality and the distance from downtown Athens revealed a substantially stable mono-centric structure, with small changes over time still depending on key factors related to the urban gradient. It can be finally stated that the inherent shift towards “horizontal” urban expansion was relatively modest and characteristic of few periurban contexts.
The intrinsic role of social forces should be more extensively investigated in further research to delineate future transitions toward a different settlement model for Mediterranean cities. As a matter of fact, the main limitation of this study is the use of a unique indicator for the investigation of relatively complex spatial dynamics. Despite the reliability and robustness of the vertical profile indicator, a comprehensive description of settlement models may require the use of other multiple socioeconomic predictors. Our study finally suggests the importance of a practical tool of regional planning able to continue monitoring sprawl, considering complex systems under rapid socioeconomic change. Explicit and implicit impacts of town planning regulations in redirecting future processes of urban also require further clarification. In this regard, analysis of building permits may intrinsically incorporate the double effect of town planning regulations (since permits’ release strongly depends on them) and socioeconomic forces.
Author Contributions
Conceptualization, J.R.-C. and B.E.; methodology, J.R.-C. and B.E.; formal analysis, J.R.-C. and B.E. investigation, J.R.-C. and B.E.; data curation, J.R.-C. and B.E.; writing—original draft preparation, J.R.-C. and B.E., writing—review and editing, J.R.-C. and B.E.; visualization, J.R.-C. and B.E. All authors have read and agreed to the published version of the manuscript.
Funding
This research received no external funding.
Conflicts of Interest
The authors declare no conflict of interest.
References
- Li, F.; Liu, X.; Hu, D.; Wang, R.; Yang, W.; Li, D.; Zhao, D. Measurement Indicators and an Evaluation Approach for Assessing Urban Sustainable Development: A Case Study for China’s Jining City. Landsc. Urban Plan. 2009, 90, 134–142. [Google Scholar] [CrossRef]
- Rodrigues, M.; Franco, M. Measuring the Urban Sustainable Development in Cities through a Composite Index: The Case of Portugal. Sustain. Dev. 2020, 28, 507–520. [Google Scholar] [CrossRef]
- Wang, W.-M.; Peng, H.-H. A Fuzzy Multi-Criteria Evaluation Framework for Urban Sustainable Development. Mathematics 2020, 8, 330. [Google Scholar] [CrossRef] [Green Version]
- Lagarias, A. Urban Sprawl Simulation Linking Macro-Scale Processes to Micro-Dynamics through Cellular Automata, an Application in Thessaloniki, Greece. Appl. Geogr. 2012, 34, 146–160. [Google Scholar] [CrossRef]
- Næss, P. Urban Planning and Sustainable Development. Eur. Plan. Stud. 2001, 9, 503–524. [Google Scholar] [CrossRef]
- Carlucci, M.; Grigoriadis, E.; Rontos, K.; Salvati, L. Revisiting a Hegemonic Concept: Long-Term ‘Mediterranean Urbanization’ in Between City Re-Polarization and Metropolitan Decline. Appl. Spat. Anal. 2017, 10, 347–362. [Google Scholar] [CrossRef]
- Díaz-Pacheco, J.; García-Palomares, J.C. Urban Sprawl in the Mediterranean Urban Regions in Europe and the Crisis Effect on the Urban Land Development: Madrid as Study Case. Available online: https://www.hindawi.com/journals/usr/2014/807381/ (accessed on 21 September 2020).
- Kjærås, K. Towards a Relational Conception of the Compact City. Urban Stud. 2020, 0042098020907281. [Google Scholar] [CrossRef] [Green Version]
- Kasanko, M.; Barredo, J.I.; Lavalle, C.; McCormick, N.; Demicheli, L.; Sagris, V.; Brezger, A. Are European Cities Becoming Dispersed?: A Comparative Analysis of 15 European Urban Areas. Landsc. Urban Plan. 2006, 77, 111–130. [Google Scholar] [CrossRef]
- Swensen, G. Tensions between Urban Heritage Policy and Compact City Planning—A Practice Review. Null 2020, 35, 555–574. [Google Scholar] [CrossRef]
- Salvati, L.; Ricciardo Lamonica, G. Containing Urban Expansion: Densification vs Greenfield Development, Socio-Demographic Transformations and the Economic Crisis in a Southern European City, 2006–2015. Ecol. Indic. 2020, 110, 105923. [Google Scholar] [CrossRef]
- Michael, C.M. The Dialectics of European Integration. In Migration and the Crisis of Democracy in Contemporary Europe; Michael, C.M., Ed.; Europe in Transition: The NYU European Studies Series; Springer International Publishing: Cham, Switzerland, 2021; ISBN 978-3-030-64069-9. [Google Scholar]
- Shirazi, M.R. Compact Urban Form: Neighbouring and Social Activity. Sustainability 2020, 12, 1987. [Google Scholar] [CrossRef] [Green Version]
- Dieleman, F.; Wegener, M. Compact City and Urban Sprawl. Built Environ. 2004, 30, 308–323. [Google Scholar] [CrossRef] [Green Version]
- Neuman, M. The Compact City Fallacy. J. Plan. Educ. Res. 2005, 25, 11–26. [Google Scholar] [CrossRef]
- Zambon, I.; Colantoni, A.; Salvati, L. Horizontal vs Vertical Growth: Understanding Latent Patterns of Urban Expansion in Large Metropolitan Regions. Sci. Total Environ. 2019, 654, 778–785. [Google Scholar] [CrossRef] [PubMed]
- Griffith, D.A. Modelling Urban Population Density in a Multi-Centered City. J. Urban Econ. 1981, 9, 298–310. [Google Scholar] [CrossRef]
- Li, Y.; Zhu, K.; Wang, S. Polycentric and Dispersed Population Distribution Increases PM2.5 Concentrations: Evidence from 286 Chinese Cities, 2001–2016. J. Clean. Prod. 2020, 248, 119202. [Google Scholar] [CrossRef]
- Han, S.; Sun, B.; Zhang, T. Mono- and Polycentric Urban Spatial Structure and PM2.5 Concentrations: Regarding the Dependence on Population Density. Habitat Int. 2020, 140, 102257. [Google Scholar] [CrossRef]
- Yoon, C.-J. Between the Ideal and Reality of City Resizing Policy: Focused on 25 Cases of Compact City Plans in Japan. Sustainability 2020, 12, 989. [Google Scholar] [CrossRef] [Green Version]
- Pojani, D.; Stead, D. Sustainable Urban Transport in the Developing World: Beyond Megacities. Sustainability 2015, 7, 7784–7805. [Google Scholar] [CrossRef] [Green Version]
- Chen, L.; Hang, J.; Sandberg, M.; Claesson, L.; Di Sabatino, S.; Wigo, H. The Impacts of Building Height Variations and Building Packing Densities on Flow Adjustment and City Breathability in Idealized Urban Models. Build. Environ. 2017, 118, 344–361. [Google Scholar] [CrossRef]
- Yang, J.; Shi, Y.; Yu, C.; Cao, S.-J. Challenges of Using Mobile Phone Signalling Data to Estimate Urban Population Density: Towards Smart Cities and Sustainable Urban Development. Indoor Built Environ. 2020, 29, 147–150. [Google Scholar] [CrossRef] [Green Version]
- Leontidou, L. The Mediterranean City in Transition: Social Change and Urban Development; Cambridge Human Geography; Cambridge University Press: Cambridge, UK, 1990; ISBN 978-0-521-34467-8. [Google Scholar]
- Leontidou, L. Postmodernism and the City: Mediterranean Versions. Urban Stud. 1993, 30, 949–965. [Google Scholar] [CrossRef]
- Leontidou, L. Alternatives to Modernism in (Southern) Urban Theory: Exploring In-Between Spaces*. Int. J. Urban Reg. Res. 1996, 20, 178–195. [Google Scholar] [CrossRef]
- Christodoulou, C.; Lada, S. Urban Design in the Neoliberal Era: Reflecting on the Greek Case. J. Urban Des. 2017, 22, 144–146. [Google Scholar] [CrossRef]
- Chorianopoulos, I.; Pagonis, T.; Koukoulas, S.; Drymoniti, S. Planning, Competitiveness and Sprawl in the Mediterranean City: The Case of Athens. Cities 2010, 27, 249–259. [Google Scholar] [CrossRef]
- Pozoukidou, G.; Ntriankos, I. Measuring and Assessing Urban Sprawl: A Proposed Indicator System for the City of Thessaloniki, Greece. Remote Sens. Appl. Soc. Environ. 2017, 8, 30–40. [Google Scholar] [CrossRef]
- Giannakourou, G. Transforming Spatial Planning Policy in Mediterranean Countries: Europeanization and Domestic Change. Eur. Plan. Stud. 2005, 13, 319–331. [Google Scholar] [CrossRef]
- Arapoglou, V.P.; Sayas, J. New Facets of Urban Segregation in Southern Europe: Gender, Migration and Social Class Change in Athens. Eur. Urban Reg. Stud. 2009, 16, 345–362. [Google Scholar] [CrossRef]
- Salvati, L.; Sabbi, A. Exploring Long-Term Land Cover Changes in an Urban Region of Southern Europe. Int. J. Sustain. Dev. World Ecol. 2011, 18, 273–282. [Google Scholar] [CrossRef]
- Salvati, L.; Zitti, M.; Sateriano, A. Changes in City Vertical Profile as an Indicator of Sprawl: Evidence from a Mediterranean Urban Region. Habitat Int. 2013, 38, 119–125. [Google Scholar] [CrossRef]
- Zambon, I.; Benedetti, A.; Ferrara, C.; Salvati, L. Soil Matters? A Multivariate Analysis of Socioeconomic Constraints to Urban Expansion in Mediterranean Europe. Ecol. Econ. 2018, 146, 173–183. [Google Scholar] [CrossRef]
- Cecchini, M.; Zambon, I.; Pontrandolfi, A.; Turco, R.; Colantoni, A.; Mavrakis, A.; Salvati, L. Urban Sprawl and the ‘Olive’ Landscape: Sustainable Land Management for ‘Crisis’ Cities. GeoJournal 2019, 84, 237–255. [Google Scholar] [CrossRef]
- Pili, S.; Grigoriadis, E.; Carlucci, M.; Clemente, M.; Salvati, L. Towards Sustainable Growth? A Multi-Criteria Assessment of (Changing) Urban Forms. Ecol. Indic. 2017, 76, 71–80. [Google Scholar] [CrossRef]
- De Rosa, S.; Salvati, L. Beyond a ‘Side Street Story’? Naples from Spontaneous Centrality to Entropic Polycentricism, towards a ‘Crisis City’. Cities 2016, 51, 74–83. [Google Scholar] [CrossRef]
- Salvati, L.; Sateriano, A.; Grigoriadis, E. Crisis and the City: Profiling Urban Growth under Economic Expansion and Stagnation. Lett. Spat. Resour. Sci 2016, 9, 329–342. [Google Scholar] [CrossRef]
- Zambon, I.; Serra, P.; Sauri, D.; Carlucci, M.; Salvati, L. Beyond the ‘Mediterranean City’: Socioeconomic Disparities and Urban Sprawl in Three Southern European Cities. Geogr. Ann. Ser. BHum. Geogr. 2017, 99, 319–337. [Google Scholar] [CrossRef]
- Hellenic Statistical Authority Greek Statistical Authority (ELSTAT). Available online: https://www.statistics.gr/en/home/ (accessed on 12 March 2021).
- Di Feliciantonio, C.; Salvati, L.; Sarantakou, E.; Rontos, K. Class Diversification, Economic Growth and Urban Sprawl: Evidences from a Pre-Crisis European City. Qual. Quant. 2018, 52, 1501–1522. [Google Scholar] [CrossRef]
- Salvati, L.; Ferrara, A.; Chelli, F. Long-Term Growth and Metropolitan Spatial Structures: An Analysis of Factors Influencing Urban Patch Size under Different Economic Cycles. Geogr. Tidsskr. Dan. J. Geogr. 2018, 118, 56–71. [Google Scholar] [CrossRef]
- Rontos, K.; Grigoriadis, E.; Sateriano, A.; Syrmali, M.; Vavouras, I.; Salvati, L. Lost in Protest, Found in Segregation: Divided Cities in the Light of the 2015 “Oχι” Referendum in Greece. City Cult. Soc. 2016, 7, 139–148. [Google Scholar] [CrossRef]
- Gavalas, V.S.; Rontos, K.; Salvati, L. Who Becomes an Unwed Mother in Greece? Sociodemographic and Geographical Aspects of an Emerging Phenomenon. Popul. Space Place 2014, 20, 250–263. [Google Scholar] [CrossRef]
- Ciommi, M.; Chelli, F.M.; Salvati, L. Integrating Parametric and Non-Parametric Multivariate Analysis of Urban Growth and Commuting Patterns in a European Metropolitan Area. Qual. Quant. 2019, 53, 957–979. [Google Scholar] [CrossRef]
- Salvati, L.; Serra, P. Estimating Rapidity of Change in Complex Urban Systems: A Multidimensional, Local-Scale Approach. Geogr. Anal. 2016, 48, 132–156. [Google Scholar] [CrossRef]
- Chelleri, L.; Schuetze, T.; Salvati, L. Integrating Resilience with Urban Sustainability in Neglected Neighborhoods: Challenges and Opportunities of Transitioning to Decentralized Water Management in Mexico City. Habitat Int. 2015, 48, 122–130. [Google Scholar] [CrossRef]
- Kazemzadeh-Zow, A.; Shahraki, S.Z.; Salvati, L.; Samani, N.N. A Spatial Zoning Approach to Calibrate and Validate Urban Growth Models. Int. J. Geogr. Inf. Sci. 2017, 31, 763–782. [Google Scholar] [CrossRef]
- Serra, P.; Vera, A.; Tulla, A.F.; Salvati, L. Beyond Urban–Rural Dichotomy: Exploring Socioeconomic and Land-Use Processes of Change in Spain (1991–2011). Appl. Geogr. 2014, 55, 71–81. [Google Scholar] [CrossRef]
- Cuadrado-Ciuraneta, S.; Durà-Guimerà, A.; Salvati, L. Not Only Tourism: Unravelling Suburbanization, Second-Home Expansion and “Rural” Sprawl in Catalonia, Spain. Urban Geogr. 2017, 38, 66–89. [Google Scholar] [CrossRef]
- Duvernoy, I.; Zambon, I.; Sateriano, A.; Salvati, L. Pictures from the Other Side of the Fringe: Urban Growth and Peri-Urban Agriculture in a Post-Industrial City (Toulouse, France). J. Rural Stud. 2018, 57, 25–35. [Google Scholar] [CrossRef]
- Salvati, L.; Ciommi, M.T.; Serra, P.; Chelli, F.M. Exploring the Spatial Structure of Housing Prices under Economic Expansion and Stagnation: The Role of Socio-Demographic Factors in Metropolitan Rome, Italy. Land Use Policy 2019, 81, 143–152. [Google Scholar] [CrossRef]
- Kelly, C.; Ferrara, A.; Wilson, G.A.; Ripullone, F.; Nolè, A.; Harmer, N.; Salvati, L. Community Resilience and Land Degradation in Forest and Shrubland Socio-Ecological Systems: Evidence from Gorgoglione, Basilicata, Italy. Land Use Policy 2015, 46, 11–20. [Google Scholar] [CrossRef] [Green Version]
- Salvati, L. The Dark Side of the Crisis: Disparities in per Capita Income (2000–12) and the Urban-Rural Gradient in Greece. Tijdschr. Voor Econ. En Soc. Geogr. 2016, 107, 628–641. [Google Scholar] [CrossRef]
- Profous, G.V.; Rowntree, R.A.; Loeb, R.E. The Urban Forest Landscape of Athens, Greece: Aspects of Structure, Planning and Management. Arboric. J. 1988, 12, 83–107. [Google Scholar] [CrossRef]
- Costa, F.J.; Noble, A.G.; Pendleton, G. Evolving Planning Systems in Madrid, Rome, and Athens. GeoJournal 1991, 24, 293–303. [Google Scholar] [CrossRef]
- Gkartzios, M. ‘Leaving Athens’: Narratives of Counterurbanisation in Times of Crisis. J. Rural Stud. 2013, 32, 158–167. [Google Scholar] [CrossRef]
- Souliotis, N. Cultural Economy, Sovereign Debt Crisis and the Importance of Local Contexts: The Case of Athens. Cities 2013, 33, 61–68. [Google Scholar] [CrossRef]
- Arampatzi, A. The Spatiality of Counter-Austerity Politics in Athens, Greece: Emergent ‘Urban Solidarity Spaces. Urban Stud. 2017, 54, 2155–2171. [Google Scholar] [CrossRef]
- Arampatzi, A.; Nicholls, W.J. The Urban Roots of Anti-Neoliberal Social Movements: The Case of Athens, Greece. Environ. Plan A 2012, 44, 2591–2610. [Google Scholar] [CrossRef] [Green Version]
- Sayas, J.P. Urban Sprawl in the Periurban Coastal Zones of Athens. Grsr 2016, 121, 71. [Google Scholar] [CrossRef] [Green Version]
- Weber, C.; Petropoulou, C.; Hirsch, J. Urban Development in the Athens Metropolitan Area Using Remote Sensing Data with Supervised Analysis and GIS. Int. J. Remote Sens. 2005, 26, 785–796. [Google Scholar] [CrossRef]
- Pazos Perez, R.I.; Carballal, A.; Rabuñal, J.R.; Mures, O.A.; García-Vidaurrázaga, M.D. Predicting Vertical Urban Growth Using Genetic Evolutionary Algorithms in Tokyo’s Minato Ward. J. Urban Plan. Dev. 2018, 144, 04017024. [Google Scholar] [CrossRef] [Green Version]
- Palme, M.; Ramírez, J.G. A Critical Assessment and Projection of Urban Vertical Growth in Antofagasta, Chile. Sustainability 2013, 5, 2840–2855. [Google Scholar] [CrossRef] [Green Version]
- Lin, J.; Huang, B.; Chen, M.; Huang, Z. Modeling Urban Vertical Growth Using Cellular Automata—Guangzhou as a Case Study. Appl. Geogr. 2014, 53, 172–186. [Google Scholar] [CrossRef]
- Zitti, M.; Ferrara, C.; Perini, L.; Carlucci, M.; Salvati, L. Long-Term Urban Growth and Land Use Efficiency in Southern Europe: Implications for Sustainable Land Management. Sustainability 2015, 7, 3359–3385. [Google Scholar] [CrossRef] [Green Version]
- Zhang, W.; Li, W.; Zhang, C.; Ouimet, W.B. Detecting Horizontal and Vertical Urban Growth from Medium Resolution Imagery and Its Relationships with Major Socioeconomic Factors. Int. J. Remote Sens. 2017, 38, 3704–3734. [Google Scholar] [CrossRef]
- Zhang, W.; Li, W.; Zhang, C.; Hanink, D.M.; Liu, Y.; Zhai, R. Analyzing Horizontal and Vertical Urban Expansions in Three East Asian Megacities with the SS-CoMCRF Model. Landsc. Urban Plan. 2018, 177, 114–127. [Google Scholar] [CrossRef]
- Nazarnia, N.; Schwick, C.; Jaeger, J.A.G. Accelerated Urban Sprawl in Montreal, Quebec City, and Zurich: Investigating the Differences Using Time Series 1951–2011. Ecol. Indic. 2016, 60, 1229–1251. [Google Scholar] [CrossRef]
- Couch, C.; Leontidou, L.; Arnstberg, K.-O. Introduction: Definitions, Theories and Methods of Comparative Analysis. In Urban Sprawl in Europe; John Wiley & Sons, Ltd: Hoboken, NJ, USA, 2008; pp. 1–38. ISBN 978-0-470-69206-6. [Google Scholar]
- Lamphar, H. Spatio-Temporal Association of Light Pollution and Urban Sprawl Using Remote Sensing Imagery and GIS: A Simple Method Based in Otsu’s Algorithm. J. Quant. Spectrosc. Radiat. Transf. 2020, 251, 107060. [Google Scholar] [CrossRef]
- Munoz, F. Lock Living: Urban Sprawl in Mediterranean Cities. Cities 2003, 20, 381–385. [Google Scholar] [CrossRef]
- Sheard, N. Airport Size and Urban Growth. Economica 2019, 86, 300–335. [Google Scholar] [CrossRef] [Green Version]
- Sheard, N. Airports and Urban Sectoral Employment. J. Urban Econ. 2014, 80, 133–152. [Google Scholar] [CrossRef]
- Gounaridis, D.; Chorianopoulos, I.; Koukoulas, S. Exploring Prospective Urban Growth Trends under Different Economic Outlooks and Land-Use Planning Scenarios: The Case of Athens. Appl. Geogr. 2018, 90, 134–144. [Google Scholar] [CrossRef]
- Triantakonstantis, D.; Stathakis, D. Urban Growth Prediction in Athens, Greece, Using Artificial Neural Networks. Undefined 2015, 9, 234–238. [Google Scholar]
- Vrščaj, B.; Poggio, L.; Marsan, F.A. A Method for Soil Environmental Quality Evaluation for Management and Planning in Urban Areas. Landsc. Urban Plan. 2008, 88, 81–94. [Google Scholar] [CrossRef]
- Ruiz-Luna, A.; Berlanga-Robles, C.A. Land Use, Land Cover Changes and Coastal Lagoon Surface Reduction Associated with Urban Growth in Northwest Mexico. Landsc. Ecol. 2003, 18, 159–171. [Google Scholar] [CrossRef]
- Rojas, C.; Munizaga, J.; Rojas, O.; Martínez, C.; Pino, J. Urban Development versus Wetland Loss in a Coastal Latin American City: Lessons for Sustainable Land Use Planning. Land Use Policy 2019, 80, 47–56. [Google Scholar] [CrossRef]
- Martellozzo, F.; Amato, F.; Murgante, B.; Clarke, K.C. Modelling the Impact of Urban Growth on Agriculture and Natural Land in Italy to 2030. Appl. Geogr. 2018, 91, 156–167. [Google Scholar] [CrossRef] [Green Version]
- Schindelbeck, R.R.; van Es, H.M.; Abawi, G.S.; Wolfe, D.W.; Whitlow, T.L.; Gugino, B.K.; Idowu, O.J.; Moebius-Clune, B.N. Comprehensive Assessment of Soil Quality for Landscape and Urban Management. Landsc. Urban Plan. 2008, 88, 73–80. [Google Scholar] [CrossRef] [Green Version]
- Kahn, M.E. Urban Growth and Climate Change. Annu. Rev. Resour. Econ. 2009, 1, 333–350. [Google Scholar] [CrossRef] [Green Version]
- de Lima, G.N.; Magaña Rueda, V.O. The Urban Growth of the Metropolitan Area of Sao Paulo and Its Impact on the Climate. Weather Clim. Extrem. 2018, 21, 17–26. [Google Scholar] [CrossRef]
- Krüger, E.; Drach, P.; Emmanuel, R. Atmospheric Impacts on Daytime Urban Heat Island. AirSoil Water Res. 2018, 11, 1178622118810201. [Google Scholar] [CrossRef]
- Senciales-González, J.M.; Rodrigo-Comino, J.; Smith, P. Surveying Topographical Changes and Climate Variations to Detect the Urban Heat Island in the City of Málaga (Spain). Cuad. De Investig. Geográfica 2020, 46, 521–543. [Google Scholar] [CrossRef] [Green Version]
- Mariani, L.; Parisi, S.G.; Cola, G.; Lafortezza, R.; Colangelo, G.; Sanesi, G. Climatological Analysis of the Mitigating Effect of Vegetation on the Urban Heat Island of Milan, Italy. Sci. Total Environ. 2016, 569–570, 762–773. [Google Scholar] [CrossRef] [PubMed]
Figure 1.
Localization maps of Athens in Europe (above-left) and its physical contexts (above-right and below). Sources: Maps modified from Freepik, freeworldmaps.net and Maphill.
Figure 1.
Localization maps of Athens in Europe (above-left) and its physical contexts (above-right and below). Sources: Maps modified from Freepik, freeworldmaps.net and Maphill.

Figure 2.
Vertical profile of buildings (five height classes, m) in the study area (map derived from Global Monitoring and Environmental Surveillance (GMES) Copernicus Land module) and aerial photographs of selected urban and periurban districts (courtesy of Google Earth); numbers indicate the position of six geographical poles mentioned in Section 2.2 (1: downtown Athens; 2: Piraeus; 3: Maroussi; 4: Messoghia; 5: Thriasio; 6: Oropos).

Figure 3.
Total number of building permits issues released for the study area per year.

Figure 4.
Trend over time in the average number of floors (by building permit) in selected spatial domains of the study area.
Figure 4.
Trend over time in the average number of floors (by building permit) in selected spatial domains of the study area.

Figure 5.
Three radio-centric districts of Athens considered for this research.

Figure 6.
Nonparametric Spearman rank correlation coefficients between linear distance from selected urban poles and the average number of floors per building permit (n = 115 municipal domains, rs > |0.33| are significant at p < 0.001 after Bonferroni’s correction for multiple comparisons).
Figure 6.
Nonparametric Spearman rank correlation coefficients between linear distance from selected urban poles and the average number of floors per building permit (n = 115 municipal domains, rs > |0.33| are significant at p < 0.001 after Bonferroni’s correction for multiple comparisons).

Figure 7.
Nonparametric Spearman rank correlation coefficients between selected territorial variables and the average number of floors per building permit (n = 115 municipal domains, rs > |0.33| are significant at p < 0.001 after Bonferroni’s correction for multiple comparisons).
Figure 7.
Nonparametric Spearman rank correlation coefficients between selected territorial variables and the average number of floors per building permit (n = 115 municipal domains, rs > |0.33| are significant at p < 0.001 after Bonferroni’s correction for multiple comparisons).

Figure 8.
Biplot of principal component analysis investigating changes over time in the temporal structure of nonparametric Spearman coefficients (Table 1) in the study area.
Figure 8.
Biplot of principal component analysis investigating changes over time in the temporal structure of nonparametric Spearman coefficients (Table 1) in the study area.


Table 1.
Results of a principal component analysis investigating changes over time in the temporal structure of nonparametric Spearman coefficients in the study area (bold and italic, respectively, indicate highly significant and moderately significant loadings to each selected principal component, PC).
| Descriptor | PC 1 | PC 2 | PC 3 | PC 4 |
|---|---|---|---|---|
| Distance from downtown Athens | 0.96 | |||
| Distance from Piraeus harbor | 0.98 | |||
| Distance from Maroussi Olympic Stadium | 0.67 | 0.60 | ||
| Distance from the International Airport | 0.75 | |||
| Distance from Thriasio industrial district | 0.94 | |||
| Distance from Oropos rural pole | −0.79 | 0.50 | ||
| Economically disadvantaged municipalities | 0.76 | −0.40 | ||
| Average elevation | 0.81 | |||
| Minimum distance from the sea coast | 0.72 | 0.47 | ||
| Municipal area | 0.87 | |||
| Soil quality index | 0.51 | 0.66 | ||
| Climate quality index | −0.41 | 0.66 | ||
| Explained variance (%) | 51.2 | 17.6 | 9.5 | 8.7 |
Publisher’s Note: MDPI stays neutral with regard to jurisdictional claims in published maps and institutional affiliations. |
© 2021 by the authors. Licensee MDPI, Basel, Switzerland. This article is an open access article distributed under the terms and conditions of the Creative Commons Attribution (CC BY) license (http://creativecommons.org/licenses/by/4.0/).
Share and Cite
MDPI and ACS Style
Rodrigo-Comino, J.; Ermini, B. Are Cities Truly Dispersed? A Long-Term Analysis of Vertical Profile of Settlements in Athens’ Metropolitan Region. Sustainability 2021, 13, 3365. https://0-doi-org.brum.beds.ac.uk/10.3390/su13063365
AMA Style
Rodrigo-Comino J, Ermini B. Are Cities Truly Dispersed? A Long-Term Analysis of Vertical Profile of Settlements in Athens’ Metropolitan Region. Sustainability. 2021; 13(6):3365. https://0-doi-org.brum.beds.ac.uk/10.3390/su13063365
Chicago/Turabian StyleRodrigo-Comino, Jesús, and Barbara Ermini. 2021. "Are Cities Truly Dispersed? A Long-Term Analysis of Vertical Profile of Settlements in Athens’ Metropolitan Region" Sustainability 13, no. 6: 3365. https://0-doi-org.brum.beds.ac.uk/10.3390/su13063365
Note that from the first issue of 2016, this journal uses article numbers instead of page numbers. See further details here.