
On-Site Experimental and Numerical Investigations of Latticed Girder Composite Slabs


1
College of Civil Engineering, Zhejiang University of Technology, Hangzhou 310014, China
2
Engineering Technology R&D Center, Zhejiang University of Technology Engineering Design Group Co., Ltd., Hangzhou 310014, China
3
School of Civil Engineering and Architecture, Zhejiang Sci-Tech University, Hangzhou 310018, China
*
Author to whom correspondence should be addressed.
Sustainability 2021, 13(7), 3775; https://0-doi-org.brum.beds.ac.uk/10.3390/su13073775
Submission received: 10 February 2021
/
Revised: 14 March 2021
/
Accepted: 16 March 2021
/
Published: 29 March 2021
(This article belongs to the Special Issue Sustainable Concrete Materials and Technologies)
Abstract
:In this study, on-site bending experiments which represented realistic and pragmatic engineering applications were performed to investigate the resistance, deflection, and cracking process of latticed girder composite slabs. Then, utilizing ABAQUS software, nonlinear finite element (FE) models were established to investigate the behavior of the slabs. The modeling took into account the contact between the precast and cast-in-place concrete interfaces. Additionally, a damage-cracking methodology was introduced to evaluate the crack opening width of the slab. The results demonstrated that the proposed numerical model was capable of reproducing the typical behavior of the composite slabs’ performance analysis. The experimental and numerical results demonstrate that the lattice girder composite slabs conformed to the requirement of existing design codes.
1. Introduction
Precast concrete structures provide advantages such as standard quality, fast construction speed, the saving of formwork, low energy consumption, and structural sustainability [1,2,3]. Therefore, precast and composite concrete structures and components have been widely applied in industrial and civil buildings throughout the world in recent years [2]. Slabs are one of the most widely applied precast structural components in precast structures [4]. It has been reported that the usage of precast and composite slabs amounted to 270 million m2 in China in 2019 [5]. As a promising construction method, it has been predicted that over the next ten years the usage of precast slabs will expand to 3 billion m2 in China, which will bring about CNY 900 billion (about USD 140 billion) to the construction market [5]. Experimental and numerical studies help to reveal the mechanical behaviors of precast slabs.
A particularly common type of precast slab is the lattice girder composite slab. It is shown in Figure 1a. It consists of steel lattice girders which are cast with the precast plank, with cast-in-place concrete then poured after the installation of the precast plank. The surface of the precast plank is roughened to provide bonding between the precast plank and the cast-in-place concrete [4,6,7,8]. According to its configuration, the lattice girder composite slab can be modeled for simplification. It is suggested in the Technical Specification for the Application of Lattice Girder Slabs of China (T/CECS 715–2020) [9] that planks can be manufactured to be 600–3500 mm wide and 1000–12000 mm long, depending on the manufacturing methods and transportations. In order to maintain sufficient bonding to resist the interface shear force, truss-like lattice girders are set on the precast planks (Figure 1) to fulfill the following functions [3]: (a) they act as formwork and guarantee the stiffness of the slab until the cast-in-place concrete has sufficient strength, (b) they maintain enough bonding to resist the shear force between the precast and cast-in-place concrete, and (c) they offer a lifting point for the precast plank during transportation. The precast planks do not include any steel bars reaching out from the edge of the slab. In engineering applications the floor system is composed by several precast planks, thus, utilizing planks without additional steel bars significantly simplifies the construction measures between each slab. A cross-section view of the lattice girder composite slab is depicted in Figure 1b; the precast planks are closely arranged and the cast-in-place concrete makes the slab a whole that only leaves a monolithic joint at the bottom of the precast plank.
There are various retrofit experimental studies on the mechanical behavior of composite slabs, all of which aim at investigating one or several mechanical behaviors, such as the stiffness, resistance, deflection, and construction measures. Before the application of lattice girder composite slabs, several experiments were conducted to investigate the mechanical behaviors of composite hollowcore slabs. Girhammar and Pajari [10] evaluated the shear resistance of composite hollowcore slabs with a rough surface finish. Mones and Breña [11] implemented push-off experiments on 24 hollowcore slabs to evaluate their horizontal shear-bearing capacity. Adawi et al. [6,12] undertook a series of experiments to investigate the interfacial properties between precast planks and the concrete topping. Lam et al. [13] assessed the bonding of composite slabs subjected to flexural loads. Composite hollowcore slabs achieve satisfactory bonding and provide sufficient bending resistance. However, the thickness of hollowcore slabs is usually more than 240 mm, which increases the construction cost and reduces the internal space of structures. In order to decrease the thickness of composite slabs, composite slabs with cold-formed sections (CFSs) were developed. Euripides et al. [14] investigated the influence of embossed areas of CFSs in the composite slab on the total strength in terms of pure tension and pure bending. Alhajri et al. [15] performed experiments to examine the mechanical behavior of a precast U-shaped composite beam by integrating CFSs with a ferro-cement slab. Although CFS composite slabs are less thick when compared with hollowcore composite slabs, the cost of CFSs is relatively high due to their manufacturing process. Thus, lattice girder composite slabs were developed. Du et al. [16] conducted experimental work on the flexural bearing capacity of lattice girder composite slabs. Newell and Goggins [3] carried out experimental tests of lattice girder composite slabs at the construction stage and examined the key parameters that influence their behavior at both serviceability and ultimate bearing limit states. It can be noted that most of the experimental studies on lattice girder composite slabs have been carried out in laboratories. On-site experimental studies can help to reveal the mechanical behavior of slabs and develop engineering applications.
In the past few years, numerical studies have been developed to achieve a better understanding of the mechanical behavior of precast concrete structures. To represent the global behavior of precast structures, ranging from the bearing capacity, deformation, to seismic properties, macro-level element models have been developed, in which fiber elements are adopted to simulate the precast beams and columns [17,18,19] and layered shells are utilized to simulate the precast slabs. Work published by Abdullah and Easterling [20] developed a force equilibrium method to calculate the horizontal shear force-slip relationship in the FE modeling of composite slabs. Tzaros et al. [21] applied nonconvex-nonsmooth optimization to simulate the flexural behavior of composite slabs. Nevertheless, these macro-level element models present some obstacles to the precise simulation of the latticed girder and the contact between the precast and cast-in-place concrete. Ren et al. [22] proposed a 3D FE model to model the nonlinear behavior of precast concrete bridge panels by using a concrete damage plasticity constitutive model. Gholamhoseini et al. [23] generated a three-dimensional (3D) solid FE model by ATENA, where interface elements were introduced to represent the bonding between steel and concrete. Ríos et al. [24] put forward an effective FE model which reproduces the longitudinal shear behavior of composite slabs with profiled sheeting. Ferrer et al. [25] built 3D non-linear FEM models of composite slabs to represent the longitudinal slip mechanics in ‘‘pull-out’’ tests. Thanks to the development of computational speed, 3D finite element modelling is a promising prospect for the numerical analysis of precast concrete structures, due to its ability to describe complex connection behavior in an elaborate manner.
In accordance with the aforementioned background, this paper aims at investigating the safety of latticed girder composite slabs. Differing from previous laboratory experiments, we apply on-site experimentation of latticed girder composite slabs to assess the loads and response of the structure, such as resistance and deflection as well as the cracking process in an actual structure. In order to thoroughly analysis the mechanical behavior of the latticed girder composite slabs, a 3D finite element model of latticed girder composite slabs is provided, with a particular emphasis on the bending behavior of the slab and damage of the concrete. The proposed finite element model is validated by the experimental results of several indexes, such as load–deflection curve, reinforcement strain, final crack width, etc.
2. On-Site Experimental Study
2.1. Experimental Set Up
In this study, the location of the on-site experiment is in a 12-storey precast concrete frame structure. The latticed girder composite slab is settled within the 2nd floor. According to the layout of the frame structure, the size of the whole slab is 5.4 m × 9.2 m (measured from the axis of beams). The size of each precast slab is chosen as 2.96 m × 5.12 m. As depicted in Figure 2a, the precast bottom plank of the whole slab is composed of three precast concrete lattice girder planks. For the precast plank, there is no additional steel bar reaching out from the edge slab, so this type of plank will significantly simplify the construction measures between each slab. As demonstrated in Figure 2a, the precast planks are closely arranged, and the cast-in-place concrete makes the slab whole, only leaving a tightly packed joint (monolithic joint) at the bottom of the precast plank. As is shown in Figure 2a, the x direction is the short direction along the slab, namely parallel to the monolithic joint direction, and the y direction is the long direction along the slab.
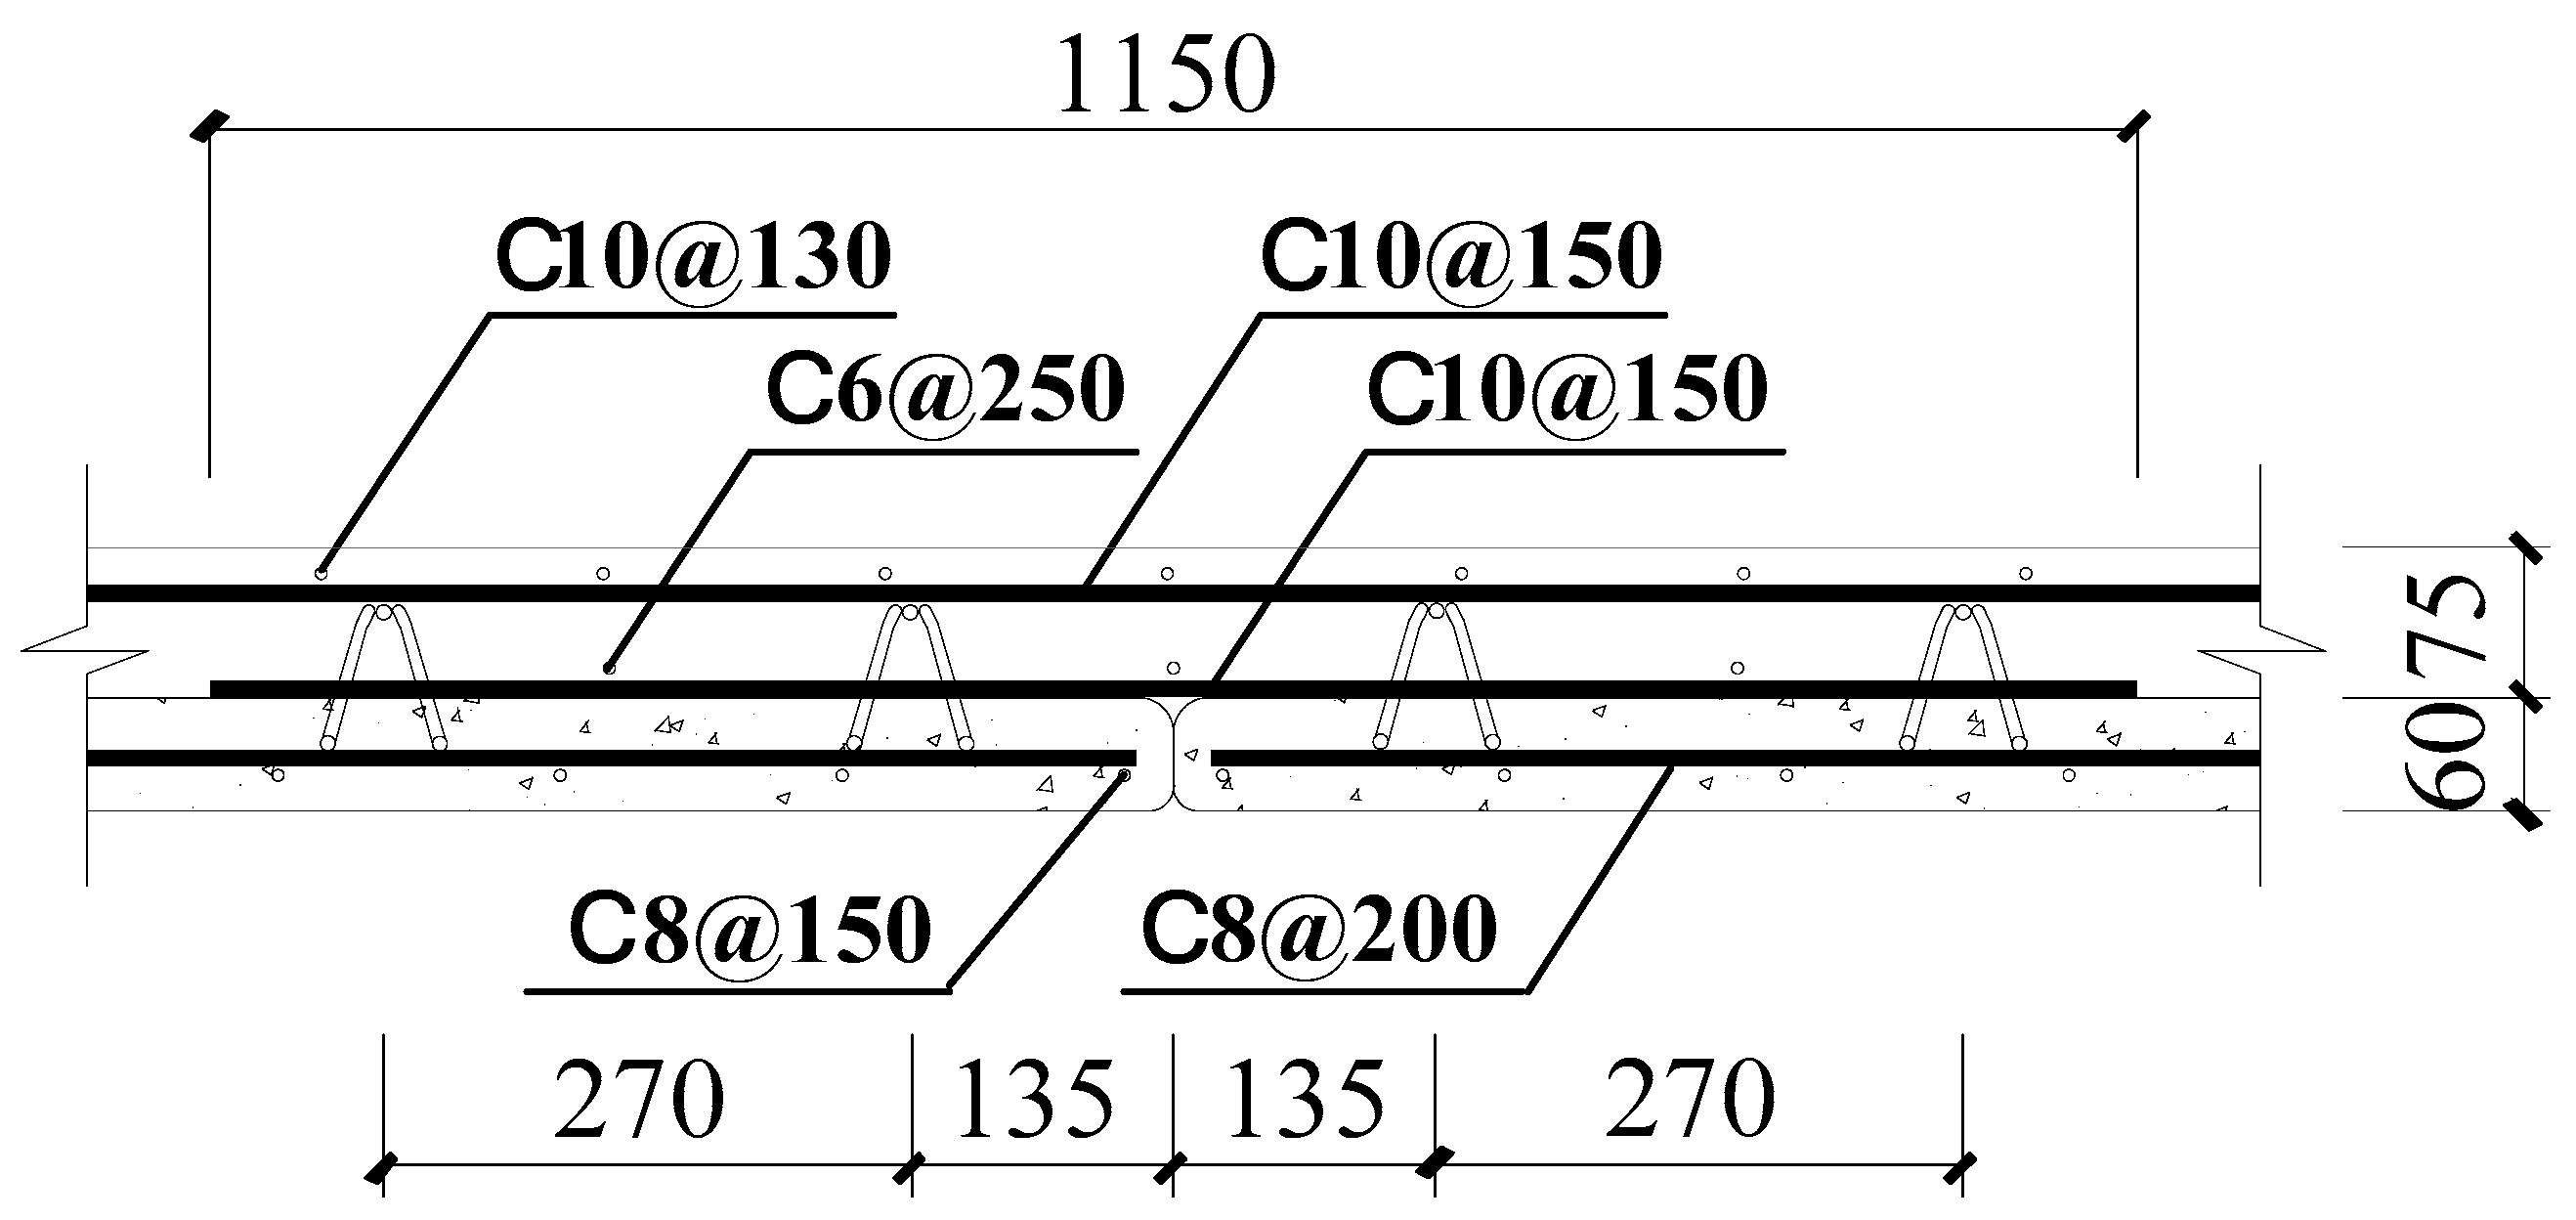
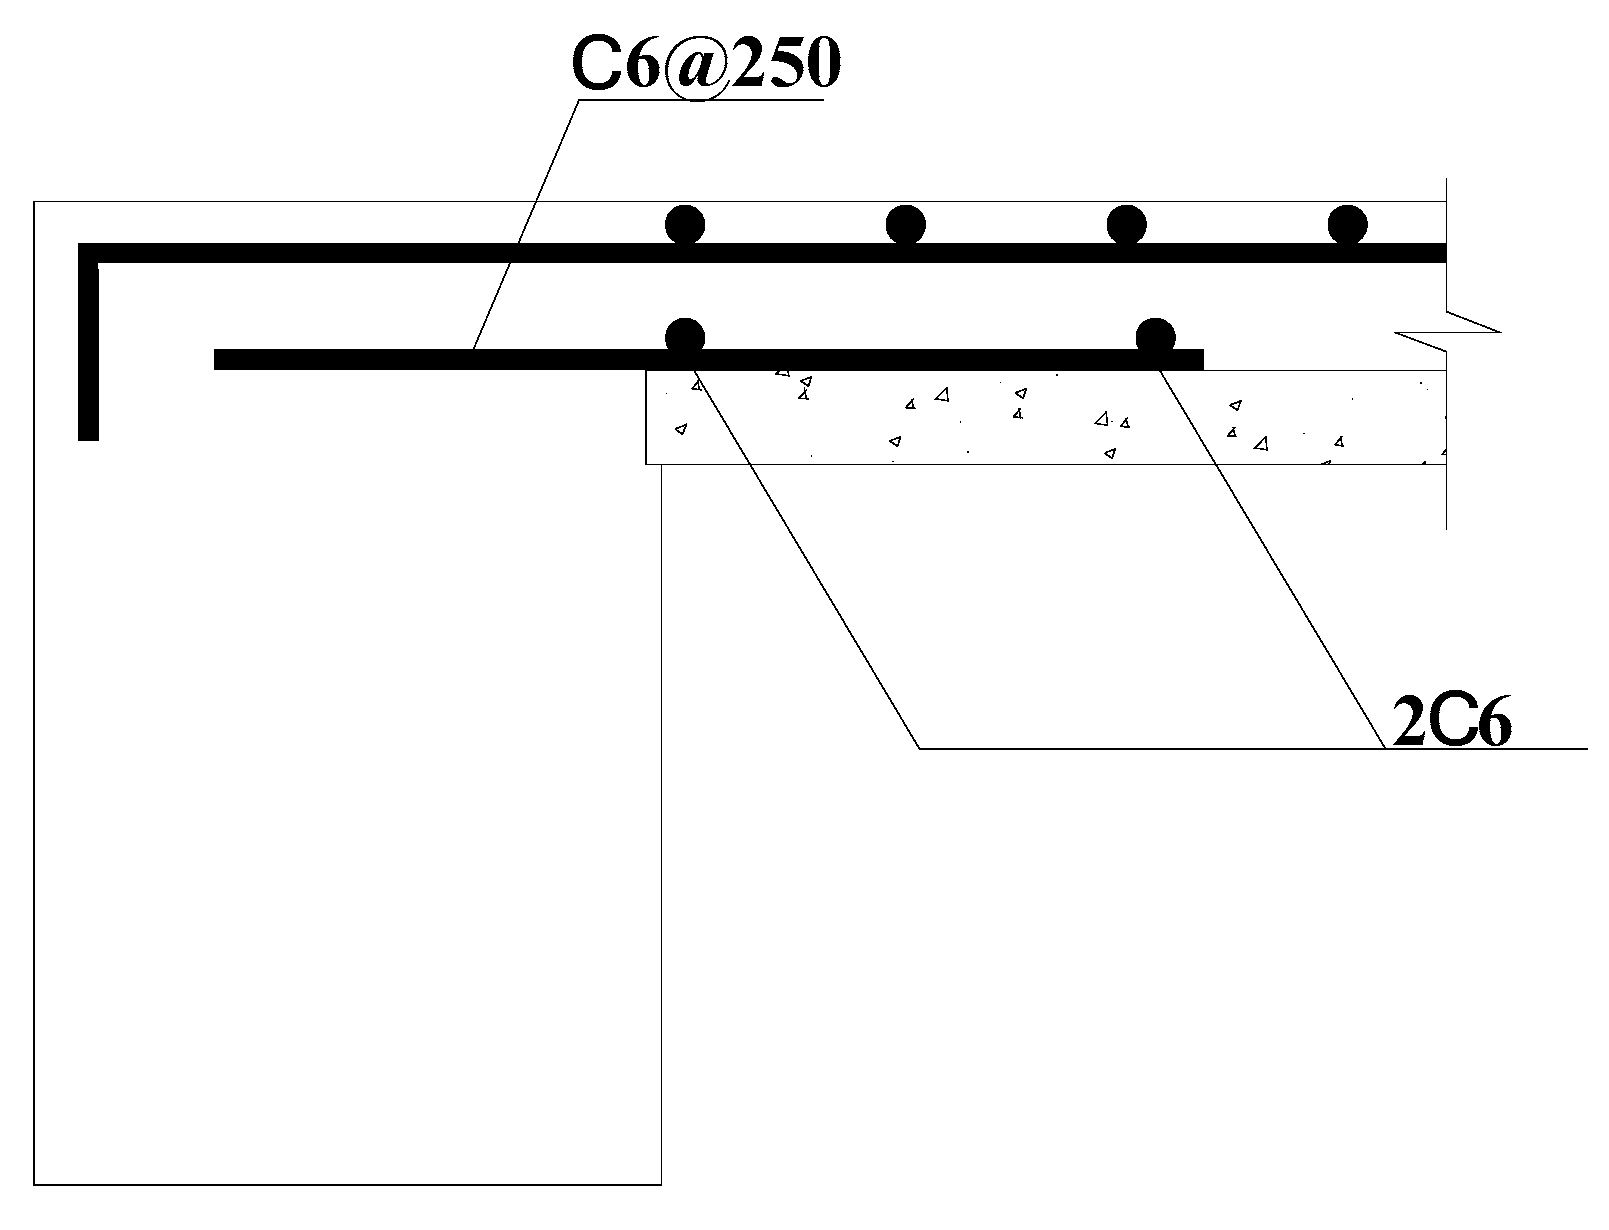
In this test, the thickness of precast bottom plank is chosen as 60 mm, and the thickness of the cast-in-place top plank is 75 mm. The beams and columns are cast-in-place, where the strength of the precast bottom plank and cast-in-place top plank are both C30, which means that the characteristic compressive strength is 30 MPa. The steel bars are all made of HRB400, which is the high strength reinforced bar (HRB) with a characteristic yield strength 400 MPa [26]. All of the steel bars were manufactured in Zhejiang hengyuan Steel CO. LTD. It is emphasized that the design parameters, such as size, thickness, and reinforcement of the slab, strictly followed the “Code for Design of Concrete Structures (GB50010-2010/2015) [26]” and the “Technical Specification for Application of Lattice Girder Slab (T/CECS 715–2020) [9]”. The position of latticed girder in one precast bottom plank (PCB1) is given in Figure 2b. The configuration of slab is illustrated in Figure 3. The longitudinal reinforcement within these three precast bottom planks is C8 (HRB400 with diameter of 8 mm) at intervals of 150 mm (C8@150) spacing in both the x and y directions, and the concrete cover to the reinforcement at the plank bottom surface is 25 mm. The reinforcement in the cast-in-place concrete is C10@150 spacing in both the x and y directions. Reinforcement is settled near the support as C10 at 150 mm (C10@150). In order to further enhance the resistance of the slab near the monolithic joint, additional reinforcement with C10@150 is located along the joint. The length of the additional reinforcement is 1150 mm. A demonstrated in Figure 4, the connection between the slab and beam should be strengthened. The additional reinforcement near the beam-slab joint is chosen as 2C6 with a length of 970 mm.
With regard to the adopted instrumentation, linear variable differential transformers are applied to record the vertical displacement of the slab at the midspan. In order to investigate the strain condition of different components in the lattice girder composite slab, electrical resistance (ER) strain gauges were bonded to the longitudinal reinforcement, latticed girder, and the concrete surface of the slab. Test data, including deflection and strain, are collected by a static data collector. The measurement range of the static data collector is ± 640,000 (10−6), and the measurement accuracy is ± 0.05%. The arrangement of the measuring points is illustrated in Figure 5. As shown in Figure 5a, the position of deflection measuring points are given in W1–W4b. It can be seen in Figure 5a that W2a and W2b are symmetrically arranged. In the experiment, the deflection of W2 is calculated as the mean value of W2a and W2b, the remaining deflection measuring points are the same. The strain measuring points of the slab top surface are depicted in Figure 5b, where C1 and C2 are the concrete strain measuring points and S3a, S3b, S4a, and S4b are the reinforcement strain measuring points. The strain measuring points of the slab bottom surface are depicted in Figure 5c, where C3a, C3b, C4a, and C4b are the concrete strain measuring points and S1 and S2 are the reinforcement strain measuring points. Under bending, the stress of the central area of the slab bottom surface is tension, while the stress of top surface is compression. Since concrete is prone to crack under tension, the concrete strain measuring points should avoid the central area of concrete bottom surface for the accuracy of the test. The concrete strain measuring points C3a, C3b, C4a, and C4b are settled near the beams.
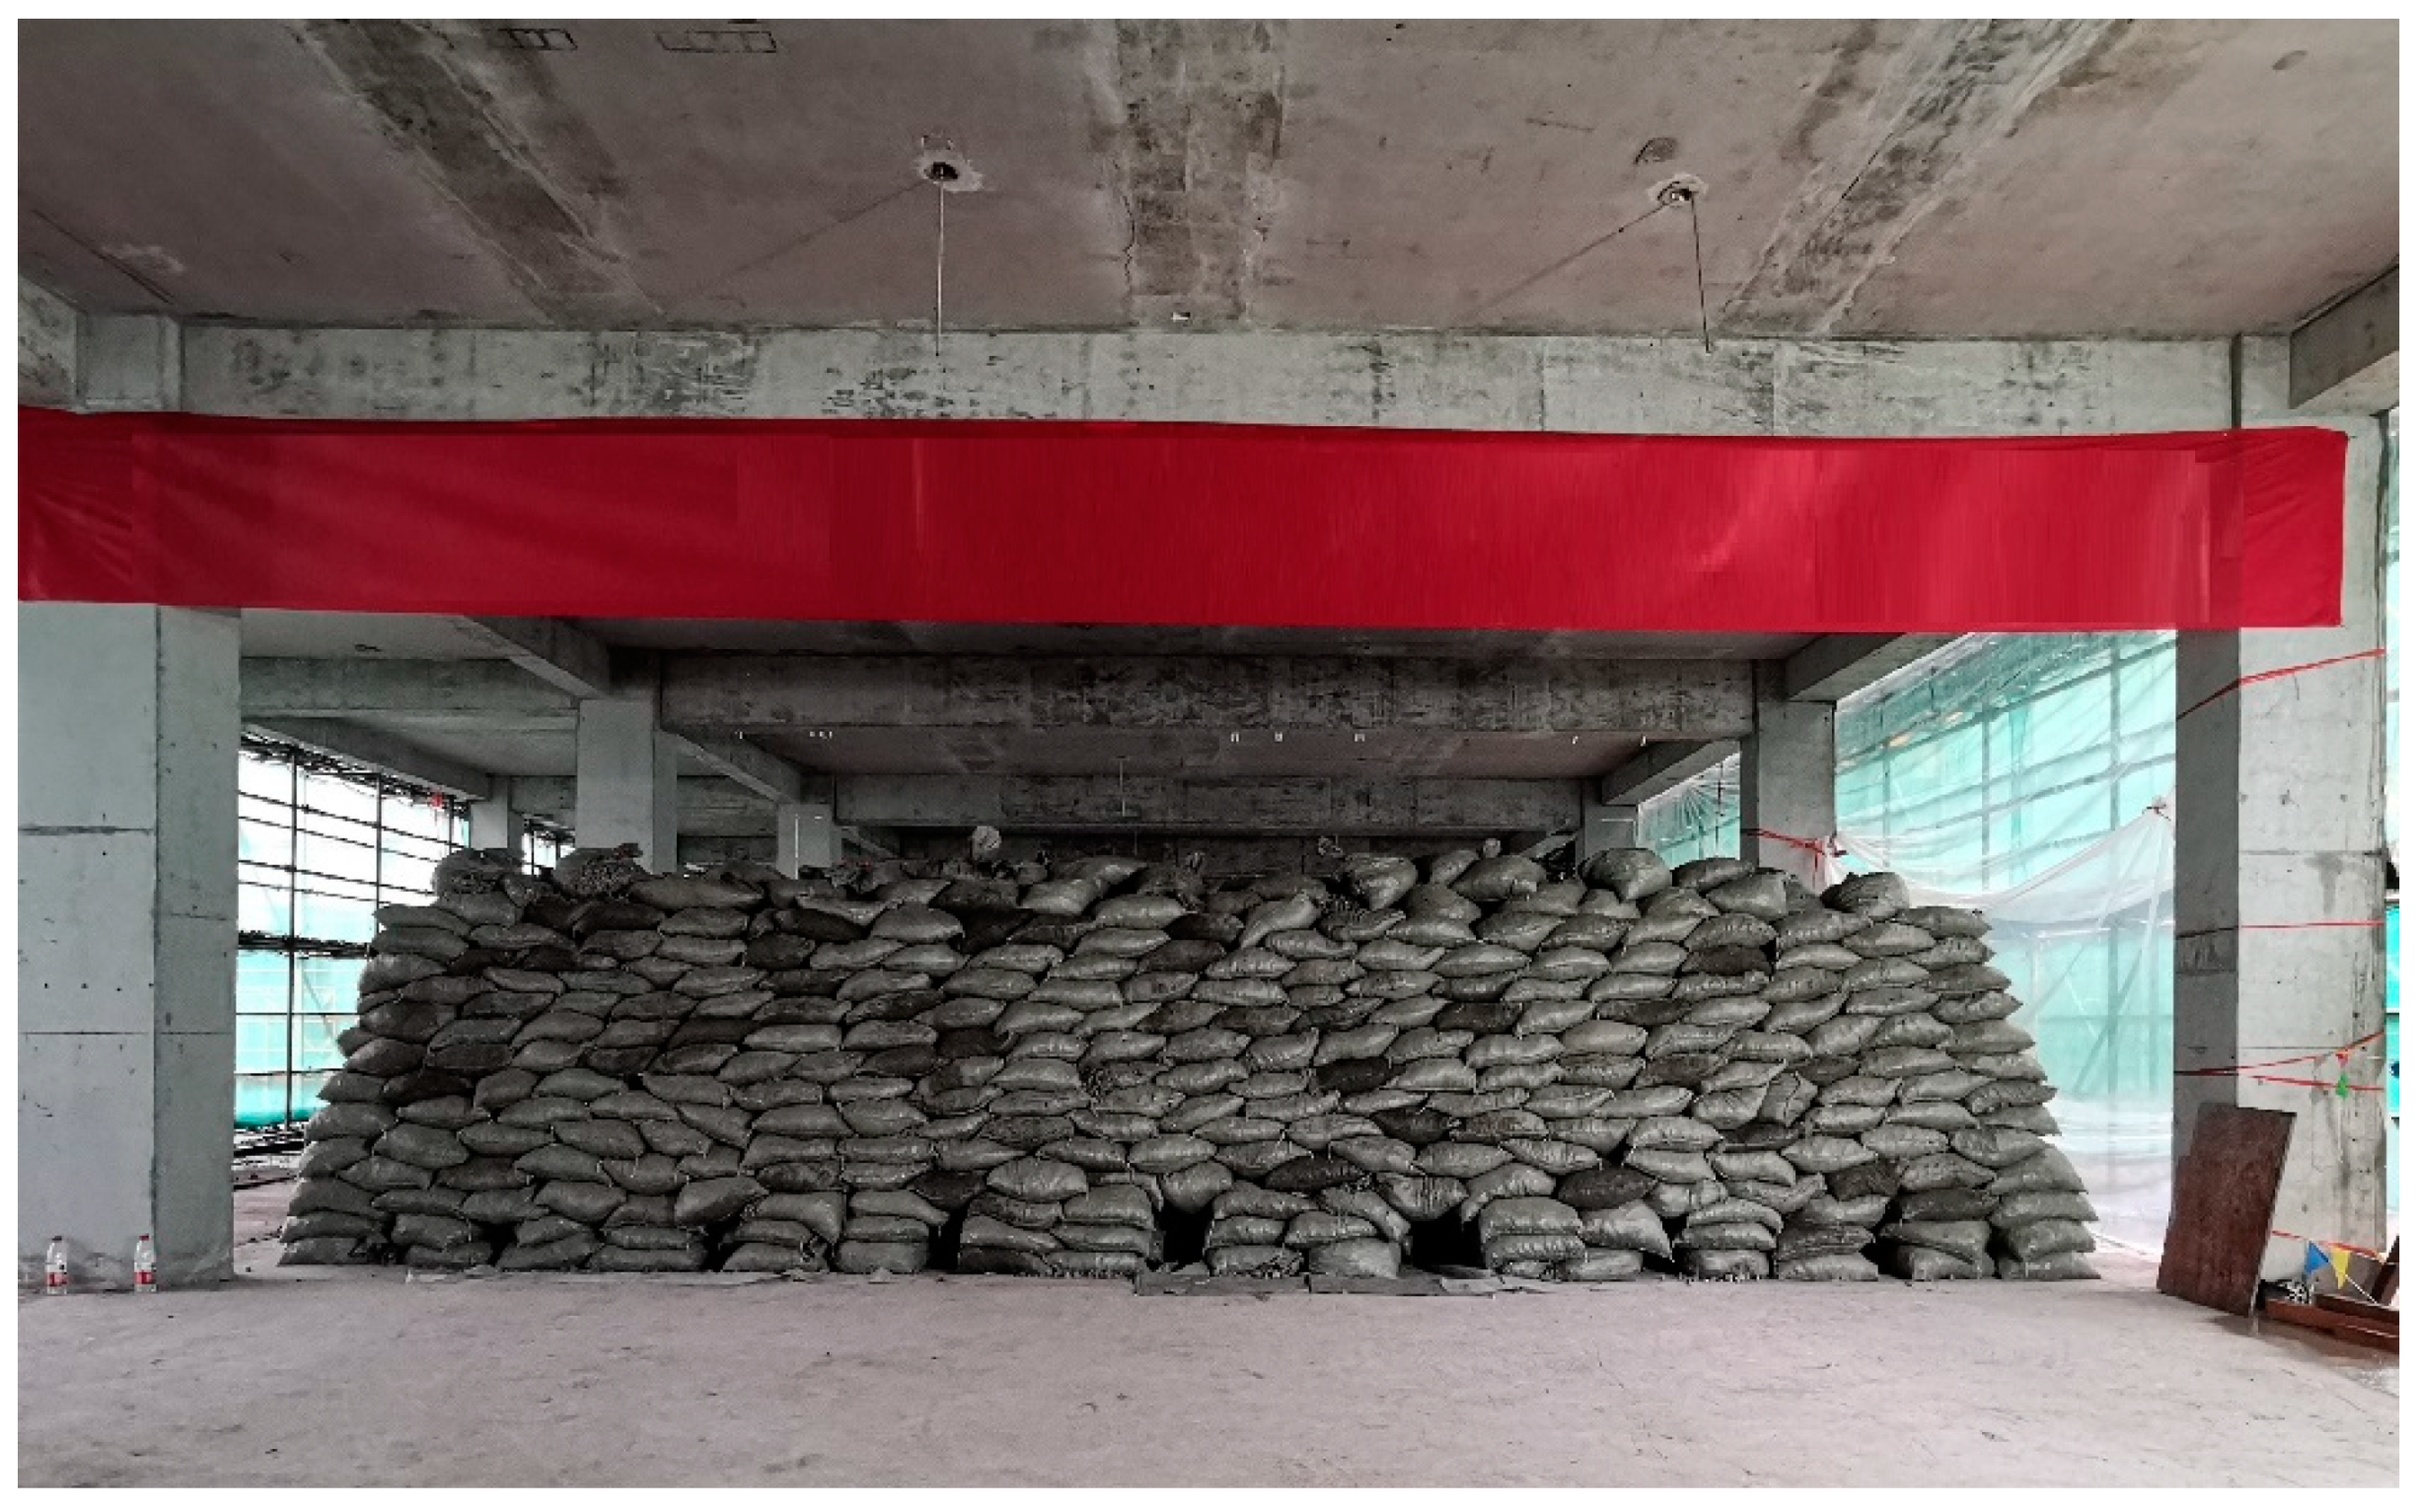
The loading scheme is carried out with reference to the “Chinese Standard for Testing Methods of Concrete Structures (GB/T 50152-2012) [27]”. The uniformly distributed load of the structure is represented by pile loading of sandbags in Figure 6. When the sandbags are piled up, they are distributed evenly in different zones to avoid arch effect after floor deformation.
Since the safety of the structure is the priority in the on-site experiment, the distributed load (including the weight of the slab and pile loading) applied to the slab should be carefully designed and calculated. According to the “Code for Design of Concrete Structures (GB50010-2010/2015) [26]”, the load which corresponds to the serviceability limit state is given as 6.6 kN/m2. Additionally, the load which corresponds to the bearing capacity limit state is calculated as 12.8 kN/m2. In order to investigate the ultimate bearing capacity of the composite slab in this experiment, the maximum value of the uniformly distributed load is chosen as 19.2 kN/m2, which corresponds to 1.5 times the value of ultimate bearing capacity of the slab. In this test, the slab and beams are cast-in-place together. The supports of the slabs are considered as fixed. Therefore, the midspan bending moment can be calculated as 15.03 kN/m and the support bending moment as 12.83 kN/m of x direction under the maximum value of the uniformly distributed load. The midspan bending moment and support bending moment can be calculated as 29.08 kN/m and 15.66 kN/m, correspondingly. The weight of the slab is 3.375 kN/m2, and weight of each pile sandbag is 0.25 kN. Before reaching the maximum distributed load (19.2 kN/m2), the loading procedure (including the weight of the slab and pile loading) is applied in steps, and for each step the load is 1.0 kN/m2. It should be noted that for each loading step, 180 sandbags are evenly piled onto the slab by a forklift. After each loading step, the load should be kept for 15 mins until the measured stress, strain, and deflection are stable.
2.2. Experimental Results
During the entire loading process of the slab, the crack development was carefully observed and monitored, in which the first crack appeared in the midspan of the precast bottom plank, extending along the y direction, when the slab was loaded to 13.4 kN/m2. When loaded to 15.4 kN/m2, the existing cracks in the midspan of the precast bottom plank gradually extended and passed through the monolithic joint. With a further increase of load, the cracks in the precast bottom plank continued to increase, and gradually developed towards the direction of 45°. It was also observed that some paralleled cracks developed near the main crack. Finally, when the load reached 19.2 kN/m2, the maximum width of the crack at the precast bottom plank was 0.16 mm, located in the middle of the span, and the maximum width of the crack at the joint was 0.10 mm. The crack distribution at the precast bottom plank is shown in Figure 7. It was observed that before the serviceability limit state no obvious cracks were found. It was also indicated that the maximum crack width did not exceed limit of the maximum crack width (0.2 mm) according to the Code for Design of Concrete Structures (GB50010-2010/2015) [26].
Before the distributed load of the composite plate reached 9.4 kN/m2, the deflection increased linearly with the load. When the distributed load reached 10.4 kN/m2, the midspan deflection of the slab reached 3.51 mm, and then the increase of the rate of deflection became faster. Due to the concrete cracking process, there was an internal load redistribution and stiffness degradation. When loaded to the ultimate state at 19.4 kN/m2, the midspan deflection of the bottom slab reached 14.15 mm, which is about 1/360 of the span of the slab. However, the deflection was far below the limit of the maximum deflection (1/50 of the span of the slab) corresponding to the bearing capacity limit state [26]. It should be noted that the deflection limit under serviceability limit state is 1/250 [26]. The deflection of lattice girder composite slab is 2.4 mm (1/2122 of the span of the slab) under serviceability limit state, which is below 1/250. The load–deflection curve of the latticed girder composite slab is depicted in Figure 8. In Figure 8, W1–W4 are the load–deflection curves obtained from deflection measuring points W1–W4b in Figure 5a.
According to the strain gauges at bottom chord of the girder and the longitudinal reinforcement in Figure 5, the strain distribution of the steel bars can be recorded in Figure 9a, where Sx is the maximum strain of reinforcement on the x direction and Sy is the maximum strain of reinforcement on the y direction. It is also depicted in Figure 9a that increases significantly faster than after the bearing capacity limit state at 12.8 kN/m2. Figure 9b shows the load–strain curve of concrete at the bottom plank, where Cx is the maximum strain of concrete on the x direction and Cy is the maximum strain of concrete on the y direction. In general, the value of strain at the x direction is bigger than the strain at the y direction in the whole loading process. However, both strain and of the concrete increase rapidly after 10.4 kN/m2 and the difference between and is less obvious when comparing with the strain of reinforcement.
3. Numerical Simulation
In this study, a finite element (FE) model based on ABAQUS is established to investigate the behavior of the latticed girder composite slab. The main components affecting the behavior of latticed girder composite slab are the thickness of the precast and cast-in-place slab, the set-up of latticed girder, and the material properties. In addition, to obtain accurate results from the FE analysis, the contact between the precast slab and the cast-in-place slab must be properly modeled [16,18,20]. Therefore, nonlinearities, such as contacts between slabs and material properties, are considered in the FE models.
3.1. Material Properties
The von Mises criterion is chosen for the steel material modeling, where the option (*PLASTIC) in ABAQUS is used in association with the plastic flow rule. In the PLASTIC model of ABAQUS, the steel material behavior is initially elastic with Young’s modulus , followed by strain hardening and then by the yielding criterion. In this numerical simulation, the Young’s modulus of steel is chosen as and the Poisson’s ratio is . The yield strength of steel is chosen as and the ultimate strength is . In the analysis of ABAQUS [28], the uniaxial behavior of the steel can be automatically transformed into a multiaxial stress state.
In this study, the concrete damage plastic (CDP) [28] model is used to represent the mechanical properties of concrete. In the CDP model, the stiffness degradation which can be represented by damage variables and coupled by constitutive relations, can be decoupled from the plastic evolution equations. Two damage variables, namely tensile damage and compressive damage, account for the different stiffness degradation states. The constitutive equations for elastoplastic responses are established from the degradation damage response. To control the evolution of the yield surface, the effective stress function is applied, so that the material parameters can be conveniently calibrated.
As for uniaxial tension and compression [22], the following equation can be given
where is the tensile damage variable and is the compressive damage variable in CDP.
Under uniaxial compression, the damage law is chosen as [26]:
where is the shape parameter of compression; is the Young’s modulus; is the compressive strength; and is the strain respective to the compressive strength .
The tensile damage law can also be given as [26]:
where is the shape parameter of tension; is the tensile strength; and is the strain corresponding to the tensile strength .
In this modeling, concrete material parameters are adopted as: ;; ; ;; ; and . In the CDP model of ABAQUS [28], the other material parameters are illustrated Table 1, where is the ratio of biaxial compressive strength and compressive strength of concrete; k is the ratio of tensile and compressive second stress invariant.
The concrete is the modeled by eight-node solid FE (C3D8R) in ABAQUS. The reinforcement is modeled by the Truss Element in ABAQUS. To avoid numerical inaccuracies, the shape of the C3D8R satisfies the limits and aspect ratio as recommended by ABAQUS [28]. The mesh size of the composite plate was selected as 100 mm, the meshing scheme is given in Figure 10. To model the loading process of the slab, the distributed load is applied on the top surface of the slab. Considering that this test is an in-situ loading test, the boundary condition of the composite plate is set as four-sided fixed support.
In this FE model, there are two surfaces of interaction: (a) the precast concrete plank and the cast-in-place concrete interface; (b) the contacts between the concrete and reinforcement, including the latticed girder and longitudinal reinforcement. To model (a), a surface-to-surface contact is chosen, where normal behavior and tangential behavior were considered. This default contact option consists of a hard contact pressure-over closure relationship and is applied in the finite element modeling. Regarding the tangential direction, the penalty frictional formulation with a friction coefficient equal to 0.3 is employed. As for (b), the fully coupled contact between reinforcement and concrete is adopted and the embedded region in ABAQUS is used in the simulation.
3.2. Simulation Results
Figure 11 shows the maximum principal stress of the concrete and reinforcement stress at the bottom of the slab, respectively. It can be seen that the overall structure shows the stress characteristics of the two-way slab, and the reinforcement stress at the end and mid-span of the slab is relatively large. The existence of the monolithic joint has no obvious influence on the stress distribution of the composite slab. The monolithic joint can implement effective force transmission, and the overall stress performance of the composite slab is preferable.
The midspan load–deflection curve of the composite slab shows the deformation development under the load. Figure 12 demonstrates the comparison between the simulation results and the test results of the load–deflection curve of the mid-span of the composite slab. A detailed comparison between the numerical and experimental results is given in Table 2. The maximum error of deflection is 15.9% in W2. These observations from Table 2 are in agreement with the experimental results that are given in Section 2.2, which testify to the correctness and effectiveness of the proposed numerical model. In Figure 12, the legend “Expt” means on-site experiment results, and the legend “FEM” means numerical simulation results.
3.3. Pragmatic Crack Width Evaluation
Apart from the bearing capacity and deformation of the concrete structure, the investigations of concrete cracking, including crack spacing and crack width, are also important in the numerical simulations of concrete structures. To estimate the crack spacing and the crack width of simple concrete components, empirical equations have been proposed in some design codes such as in the Code for Design of Concrete Structures (GB50010-2010/2015) [26]. When it comes to reinforced concrete structures with complex reinforcement and loading statuses, the estimations of crack spacing and crack width should rely on numerical methods. In the past decades, several advanced numerical models had been put forward to simulate the cracking process of concrete, ranging from cohesive elements [29,30], element-free methods [31,32,33], to extended finite element method (XFEM) [34,35]. Admittedly, these numerical methods provided relatively accurate ways to simulate and evaluate the cracks of concrete. However, for the finite element modeling of real structures, which usually contain huge amounts of elements, the aforementioned numerical methods might bring undesirable computational costs. Therefore, a pragmatic prediction of crack path and crack width of reinforced concrete structures based on the continuum damage-plasticity model has been established.
It is widely accepted that concrete exhibits hardly any plastic strain under tension [36]. Considering the occurrence of cracks in some elements of the finite element model under tension, the strain can be decomposed into the elastic strain and the strain brought by cracking as:
Taking the tensile stress state equation into consideration, the strain can also be written as:
The cracking strain can be expressed as:
In Equation (14), is the characteristic length. nd is the dimension of the unit, as for a one-dimensional finite element, ; as for a two-dimensional finite element, ; as for three-dimensional finite element, . is the measurement of the element volume. We have two length scales, e.g., the length of the element size of the FE model and the length of the crack-band determined by the micro-mechanical analysis [38]. In the FE simulation, the can be chosen as the length of the representative finite element length. If a 3D element is used in the modeling, is the volume of the finite element, where . If a 2D element (plane element) is used in the modeling, is the area of the finite element, where . If a 1D element (truss element or beam element) is used in the modeling, is the length of the finite element, where . However, several different element sizes are adopted in the structural modeling. It is suggested by Ren et al. [37,39,40] that for different element sizes, should be calculated separately.
Observing Equations (13) and (14), if only one crack is included in an element, the width of the crack can be obtained according to Equation (14). For the analysis of concrete structure, it is reasonable to assume that only one crack is allowed in a unit when a refined mesh is adopted. Equally, it can be said that in the finite element modeling of the structure, the crack width can be pragmatically evaluated by Equations (13) and (14), rather than introducing more sophisticated methods, including the XFEM and cohesive element. It should be noted that that the concrete compressive damage deduced is not only related to fractures, but also to plasticity mechanisms. In concrete structures, the most concerning concrete cracking occurrences in practical engineering are mainly governed by the tensile stress state [36].
In the present numerical study, the tensile damage state can be given by ABAQUS, and the corresponding crack width can be calculated. In Figure 13b, the final cracks of the concrete bottom slab are also represented by the contours of tensile damage (DAMAGET in the legends). Accordingly, the strain of concrete (E11 in the legends) is illustrated in Figure 13b. The simulated patterns of the cracks agree well with the experiment in Figure 7, in which the slab experiences a typical two-way slab cracking pattern.
In this simulation, a regular size mesh is chosen as and . Thus, the characteristic length is:
Taking maximum value strain and the corresponding tensile damage value into Equation (13), it yields:
The maximum crack width of the concrete by proposed pragmatic evaluation is 0.2086 mm, which is located in the midspan, and the experimental maximum crack width of concrete in the midspan of bottom plank is 0.16 mm. The difference of deflection between these two values is 0.0486 mm, which indicates satisfactory agreement between the numerical and experimental results.
4. Conclusions
This paper describes the on-site testing of a latticed girder composite slab to investigate the mechanical behavior of the precast concrete floor system. A nonlinear FE model utilizing ABAQUS software was established to investigate the behavior of the slab. The experimental results are used for the validation of FE models. The crack width is evaluated by FE modelling. The main conclusions are summarized below:
- (1)
- As for the load–deflection curve, it shows linear and elastic parts until the onset of cracking on the precast bottom plank. Then the stiffness of slab decreases and the load–deflection curve displays some nonlinear behavior when cracks develop and increase. The maximum midspan deflection of the bottom slab is 14.15 mm (1/360 of the span of the slab), which is far below the limit of the maximum deflection (1/50 of the span of the slab) corresponding to the bearing capacity limit state [26]. The safety of lattice girder composite slab is verified by the test. The test data in this study can be used to determine the load–deflection of the lattice girder composite slab that can result in significant efficiencies for propping arrangements on site.
- (2)
- No crack is shown under the serviceability limit state, which is under the limit of the maximum crack width (0.2 mm) under the design code. The final cracks distribute vertically to the monolithic joint in the center of the slab, while far away from the center they reach to the four corners of the slabs along the direction of 45°, which illustrates typical behavior of a two-way slab.
- (3)
- An FE model to simulate the latticed girder composite slabs is presented in this study. The simulated maximum deflection of the midspan is 14.89 mm, and the experimental maximum deflection is 14.15 mm. From the numerical analyses, it has been demonstrated that the numerical model can successfully predict the composite slab’s resistance capacity, load–deflection behavior, and the final cracking pattern of the on-site test. A pragmatic prediction method had been introduced to evaluate the crack path and crack width of the slab based on the continuum damage-plasticity model. It is verified that the predicted maximum crack width is relatively close to the experimental results, providing a useful, yet simple tool for the failure analysis of composite slabs.
Author Contributions
Conceptualization, S.L.; methodology, X.Z. (Xuefeng Zhang) and X.Z. (Xiaodan Zhu); software, Z.X.; validation, S.L. and Y.Y.; writing—original draft preparation, S.L.; writing—review and editing, S.L. All authors have read and agreed to the published version of the manuscript.
Funding
This research was funded by National Science Foundation of China, grant number 51808499; Science Foundation of Zhejiang Province of China, grant number LGF20E080019.
Institutional Review Board Statement
Not applicable.
Informed Consent Statement
Not applicable.
Data Availability Statement
Not applicable.
Acknowledgments
This study is supported by the Engineering Research Centre of Precast Concrete of Zhejiang Province. The help of all members of the Engineering Research Centre is sincerely appreciated. We would also like to express our sincere appreciation to the anonymous referee for valuable suggestions and corrections.
Conflicts of Interest
The authors declare no conflict of interest.
References
- Korkmaz, H.H.; Tankut, T. Performance of a precast concrete beam-to-beam connection subject to reversed cyclic loading. Eng. Struct. 2005, 27, 1392–1407. [Google Scholar] [CrossRef]
- Feng, D.; Wu, G.; Lu, Y. Finite element modelling approach for precast reinforced concrete beam-to-column connections under cyclic loading. Eng. Struct. 2018, 174, 49–66. [Google Scholar] [CrossRef] [Green Version]
- Newell, S.; Goggins, J. Experimental study of hybrid precast concrete lattice girder floor at construction stage. Structures 2019, 20, 866–885. [Google Scholar] [CrossRef]
- Baran, E. Effects of cast-in-place concrete topping on flexural response of precast concrete hollow-core slabs. Eng. Struct. 2015, 98, 109–117. [Google Scholar] [CrossRef]
- Annual report of precast concrete structures of China. In China Construction Industry Association; China Construction Industry Press: Beijing, China, 2019.
- Adawi, A.; Youssef, M.A.; Meshaly, M.E. Experimental investigation of the composite action between hollowcore slabs with machine-cast finish and concrete topping. Eng. Struct. 2015, 91, 1–15. [Google Scholar] [CrossRef]
- Daniel Ronald Joseph, J.; Prabakar, J.; Alagusundaramoorthy, P. Precast concrete sandwich one-way slabs under flexural loading. Eng. Struct. 2017, 138, 447–457. [Google Scholar] [CrossRef]
- Hou, H.; Liu, X.; Qu, B.; Ma, T.; Liu, H.; Feng, M.; Zhang, B. Experimental evaluation of flexural behavior of composite beams with cast-in-place concrete slabs on precast prestressed concrete decks. Eng. Struct. 2016, 126, 405–416. [Google Scholar] [CrossRef]
- Technical Specification for Application of Lattice Girder Slab; T/CECS 715-2020; China Construction Industry Press: Beijing, China, 2020.
- Girhammar, U.A.; Pajari, M. Tests and analysis on shear strength of composite slabs of hollow core units and concrete topping. Constr. Build. Mater. 2008, 22, 1708–1722. [Google Scholar] [CrossRef]
- Mones, R.M.; Brena, S.F. Hollow-core slabs with cast-in-place concrete toppings: A study of interfacial shear strength Response. PCI J. 2014, 3, 132–133. [Google Scholar] [CrossRef]
- Adawi, A.; Youssef, M.A.; Meshaly, M. Analytical Modeling of the Interface between Lightly Roughened Hollowcore Slabs and Cast-In-Place Concrete Topping. J. Struct. Eng. 2015, 141, 4014119. [Google Scholar] [CrossRef]
- Lam, S.S.E.; Wong, V.; Lee, R.S.M. Bonding assessment of semi-precast slabs subjected to flexural load and differential shrinkage. Eng. Struct. 2019, 187, 25–33. [Google Scholar] [CrossRef]
- Mistakidis, E.S.; Dimitriadis, K.G. Bending resistance of composite slabs made with thin-walled steel sheeting with indentations or embossments. Thin-Wal. Struct. 2008, 46, 192–206. [Google Scholar] [CrossRef]
- Alhajri, T.M.; Tahir, M.M.; Azimi, M.; Mirza, J.; Lawan, M.M.; Alenezi, K.K.; Ragaee, M.B. Behavior of pre-cast U-Shaped Composite Beam integrating cold-formed steel with ferro-cement slab. Thin-Wal. Struct. 2016, 102, 18–29. [Google Scholar] [CrossRef]
- Du, H.; Hu, X.; Meng, Y.; Han, G.; Guo, K. Study on composite beams with prefabricated steel bar truss concrete slabs and demountable shear connectors. Eng. Struct. 2020, 210, 110419. [Google Scholar] [CrossRef]
- Celik, O.C.; Ellingwood, B.R. Modeling Beam-Column Joints in Fragility Assessment of Gravity Load Designed Reinforced Concrete Frames. J. Earthq. Eng. 2008, 12, 357–381. [Google Scholar] [CrossRef]
- Yu, J.; Tan, K.H. Numerical analysis with joint model on RC assemblages subjected to progressive collapse. Mag. Concr. Res. 2014, 66, 1201–1218. [Google Scholar] [CrossRef]
- Nahar, M.; Islam, K.; Billah, A.M. Seismic collapse safety assessment of concrete beam-column joints reinforced with different types of shape memory alloy rebars. J. Build. Eng. 2020, 29, 101106. [Google Scholar] [CrossRef]
- Abdullah, R.; Samuel Easterling, W. New evaluation and modeling procedure for horizontal shear bond in composite slabs. J. Constr. Steel Res. 2009, 65, 891–899. [Google Scholar] [CrossRef] [Green Version]
- Tzaros, K.A.; Mistakidis, E.S.; Perdikaris, P.C. A numerical model based on nonconvex–nonsmooth optimization for the simulation of bending tests on composite slabs with profiled steel sheeting. Eng. Struct. 2010, 32, 843–853. [Google Scholar] [CrossRef]
- Ren, W.; Sneed, L.H.; Yang, Y.; He, R. Numerical Simulation of Prestressed Precast Concrete Bridge Deck Panels Using Damage Plasticity Model. Int. J. Concr. Struct. Mater. 2015, 9, 45–54. [Google Scholar] [CrossRef] [Green Version]
- Gholamhoseini, A.; Gilbert, R.; Bradford, M.; Chang, Z. Longitudinal shear stress and bond–slip relationships in composite concrete slabs. Eng. Struct. 2014, 69, 37–48. [Google Scholar] [CrossRef]
- Ríos, J.D.; Cifuentes, H.; Martínez-De La Concha, A.; Medina-Reguera, F. Numerical modelling of the shear-bond behaviour of composite slabs in four and six-point bending tests. Eng. Struct. 2017, 133, 91–104. [Google Scholar] [CrossRef]
- Ferrer, M.; Marimon, F.; Crisinel, M. Designing cold-formed steel sheets for composite slabs: An experimentally validated FEM approach to slip failure mechanics. Thin-Wal. Struct. 2006, 44, 1261–1271. [Google Scholar] [CrossRef]
- Code for Design of Concrete Structures; China Construction Industry Press: Beijing, China, 2015.
- Chinese Standard for Testing Methods of Concrete Structures; China Construction Industry Press: Beijing, China, 2012.
- Abaqus 6.14. In User’s Manual; SIMULIA: Providence, RI, USA, 2014.
- Xu, X.; Needleman, A. Numerical simulations of fast crack growth in brittle solids. J. Mech. Phys. Solid. 1994, 42, 1397–1434. [Google Scholar] [CrossRef]
- Camacho, G.T.; Ortiz, M. Computational modelling of impact damage in brittle materials. Int. J. Solid. Struct. 1996, 33, 2899–2938. [Google Scholar] [CrossRef]
- Belytschko, T.; Lu, Y.Y.; Gu, L. Element-free Galerkin methods. Int. J. Numer. Meth. Eng. 1994, 37, 229–256. [Google Scholar] [CrossRef]
- Liu, W.K.; Jun, S.; Zhang, Y.F. Reproducing kernel particle methods. Int. J. Numer. Meth. Fluid. 1995, 20, 1081–1106. [Google Scholar] [CrossRef]
- Chen, J.-S.; Pan, C.; Wu, C.-T.; Liu, W.K. Reproducing Kernel Particle Methods for large deformation analysis of non-linear structures. Comput. Methods Appl. Mech. Eng. 1996, 139, 195–227. [Google Scholar] [CrossRef]
- Sukumar, N.; Moes, N.; Moran, B.; Belytschko, T. Extended finite element method for three-dimensional crack modelling. Int. J. Numer. Meth. Eng. 2000, 48, 1549–1570. [Google Scholar] [CrossRef]
- Moes, N.; Belytschko, T. Extended finite element method for cohesive crack growth. Eng. Fract Mech. 2002, 69, 813–833. [Google Scholar] [CrossRef] [Green Version]
- Ju, J.W. On energy-based coupled elastoplastic damage theories: Constitutive modeling and computational aspects. Inter. J. Solid. Struct. 1989, 25, 803–833. [Google Scholar] [CrossRef]
- Ren, X.; Li, J. Damage theory based analysis of crack opening width for RC structures. J. Tongji Univ. Nat. Sci. 2015, 8, 1129–1134. (In Chinese) [Google Scholar]
- Bazant, Z.P.; Pijaudier-Cabot, G. Measurement of characteristic length of nonlocal continuum. J. Eng. Mech. 1989, 115, 755–767. [Google Scholar] [CrossRef] [Green Version]
- Ren, X.; Chen, J.-S.; Li, J.; Slawson, T.; Roth, M. Micro-cracks informed damage models for brittle solids. Int. J. Solids Struct. 2011, 48, 1560–1571. [Google Scholar] [CrossRef] [Green Version]
- Liang, S.; Ren, X.; Li, J. A mesh-size-objective modeling of quasi-brittle material using micro-cell informed damage law. Int. J. Dam. Mech. 2018, 27, 1249–1257. [Google Scholar] [CrossRef]
Figure 1.
Lattice girder composite slab: (a) configuration; (b) cross-section view to show the monolithic joint.
Figure 1.
Lattice girder composite slab: (a) configuration; (b) cross-section view to show the monolithic joint.

Figure 2.
On-site experimental arrangement: (a) the layout of composite slabs; (b) lattice girder of the precast bottom plank.
Figure 2.
On-site experimental arrangement: (a) the layout of composite slabs; (b) lattice girder of the precast bottom plank.

Figure 3.
Detailed construction of the lattice girder composite slab.

Figure 4.
Detailed construction of the beam-slab connection.

Figure 5.
Arrangement of measuring points: (a) deflection measuring points; (b) strain measuring point of slab top surfaces; (c) strain measuring point of slab bottom surfaces.
Figure 5.
Arrangement of measuring points: (a) deflection measuring points; (b) strain measuring point of slab top surfaces; (c) strain measuring point of slab bottom surfaces.

Figure 6.
On-site pile loading.

Figure 7.
Cracking distribution at the precast bottom plank.

Figure 8.
On-site experimental load–deflection curve.

Figure 9.
On-site experimental load–strain curves: (a) reinforcement; (b) concrete.

Figure 10.
Finite element meshes of the slabs.

Figure 11.
Maximum principal stress of the slab bottom: (a) concrete; (b) reinforcement.

Figure 12.
Load–deflection curve of the on-site experiment and numerical simulation.

Figure 13.
Damage contour and strain distribution of numerical simulation results: (a) Tensile damage contour of bottom plank; (b) strain distribution of bottom plank.
Figure 13.
Damage contour and strain distribution of numerical simulation results: (a) Tensile damage contour of bottom plank; (b) strain distribution of bottom plank.


Table 1.
Parameter value of the concrete damage plastic (CDP).
| Dilation Angle | Eccentricity | fbr/fcr | k | Viscosity Parameter |
|---|---|---|---|---|
| 30° | 0.1 | 1.16 | 0.667 | 0.0005 |
Table 2.
Comparison of numerical simulation and on-site experimental value of load–deflection curve.
Table 2.
Comparison of numerical simulation and on-site experimental value of load–deflection curve.
| Deflection/(mm) | W1 | W2 | W3 | W4 |
|---|---|---|---|---|
| On-site experiment | 10.70 | 5.92 | 8.40 | 7.43 |
| Numerical simulation | 12.11 | 6.86 | 9.19 | 6.66 |
| Error | 13.2% | 15.9% | 9.4% | −10.4% |
Publisher’s Note: MDPI stays neutral with regard to jurisdictional claims in published maps and institutional affiliations. |
© 2021 by the authors. Licensee MDPI, Basel, Switzerland. This article is an open access article distributed under the terms and conditions of the Creative Commons Attribution (CC BY) license (http://creativecommons.org/licenses/by/4.0/).
Share and Cite
MDPI and ACS Style
Zhang, X.; Zhu, X.; Xie, Z.; Yang, Y.; Liang, S. On-Site Experimental and Numerical Investigations of Latticed Girder Composite Slabs. Sustainability 2021, 13, 3775. https://0-doi-org.brum.beds.ac.uk/10.3390/su13073775
AMA Style
Zhang X, Zhu X, Xie Z, Yang Y, Liang S. On-Site Experimental and Numerical Investigations of Latticed Girder Composite Slabs. Sustainability. 2021; 13(7):3775. https://0-doi-org.brum.beds.ac.uk/10.3390/su13073775
Chicago/Turabian StyleZhang, Xuefeng, Xiaodan Zhu, Zhongshu Xie, Yang Yang, and Shixue Liang. 2021. "On-Site Experimental and Numerical Investigations of Latticed Girder Composite Slabs" Sustainability 13, no. 7: 3775. https://0-doi-org.brum.beds.ac.uk/10.3390/su13073775
Note that from the first issue of 2016, this journal uses article numbers instead of page numbers. See further details here.