1. Introduction
The increase in consumption entails the development of production, thus increasing the demand for transport services. This situation leads to the deepening of transport problems such as pollution, congestion, waste production, road incidents, or the intensive use of fossil fuels. Taking into account the importance of transport for social and economic life, it should be as environmentally friendly as possible and organized in a sustainable manner. A sustainable transport system is one that does not endanger the health of societies or ecosystems, and at the same time meets the needs for mobility using renewable resources at the level of their regeneration, and non-renewable resources at the level of replacing them with renewable substitutes [
1]. Freight transport is a key element of supply chains. It ensures the delivery of raw materials, semi-finished materials and finished products to the end customer. Additionally, taking into account the sensitivity of transported goods to changes in weather conditions (e.g., temperature), decision-makers face a difficult decision in choosing the right means of transport. It should be remembered that the costs generated when moving loads constitute 30% of the company’s operating costs [
2]. Therefore, making the decision to use owned or third-party transport or the use of a mixed variant is a critical decision for the company’s profits on which its future operation depends. In addition, a significant number of freight movements start and/or finish at city areas, especially considering the first and last mile delivery processes [
3]. As a result, decisions related to goods movement in the city area influence the general transportation processes in cities significantly [
4,
5]. Transport congestion occurring within their territory extends the time of delivery. In the case of some goods, this can influence many important delivery problems, such as losing the physicochemical properties of the transported products, especially if they are particularly susceptible to weather changes.
The ability to serve multiple customers with one type of motor vehicle raises the issue about the effectiveness of such servicing. On the other side, the constantly rising requirements for transportation need to meet the demand from an operator point of view [
6]. The variations in the parameters of material flow during the transportation period may change the requirement for their services. The relevance of this work is that when delivering goods in the system over a long period of time, it is important to address the issue of creating a fleet of vehicles.
Choosing alternatives usually proceeds from a certain system of criteria [
7]. The main goal of outsourcing is to reduce logistics and operating costs, become free from the organization of business processes that are not core to the company and provide the enterprise with the opportunity to focus on priority types of business and operations to ensure a competitive advantage [
8]. For example, given the current global trends and the development trends of the native market, in Ukraine it is possible to forecast the popularization of the outsourcing of logistics in the next 2–3 years, and, above all, outsourcing in distribution [
9]. The optimization of distribution costs and the simultaneous improvement of service quality provides significant competitive advantages [
10]. The use of outsourcing not only allows for achieving these results, but also has an additional advantage; the ability to concentrate company management on key competencies [
11].
Many works of the leading scientists [
12,
13] are devoted to the issue of the transportation servicing initiation problem. Considering the writings of these researchers, we may conclude the widespread development of the scientific ideas on this issue. The authors characterize transport services from different angles using various methods: analytical, statistical, and mathematical economics, logistics and others. According to these authors, the purpose of the movement of vehicles is to ensure the coherence of all participants of the transport process, linking the interests of: transporters, shippers, consignees, freight forwarders, supply and marketing and other participants [
14]. The conformity condition of the transporter to the technological, economical, and other requirements of different customer material flows can be carried by one type of motor vehicle. The changing of any parameters of the material flow can lead to variations in transportation technology, and to variations in the type of vehicle. These remarks lead to the following questions. How can we effectively perform transportation services of the material flows with variable parameters, and which efficiency criterion need to be chosen?
Transportation routing as a method of improving the efficiency of the transport process is most common in road transport. This is due to the most complex system of communication paths, which leads to the presence of such a large number of options that the solution of the problem by direct search becomes extremely difficult [
15]. Transportation activities reveal their role in the supply chain, as well as in the most important functions and directions of development [
16]. The authors point out that structurally, transportation function consists of the logistics of the transport process and the logistics of freight forwarding services [
17]. Logistics of the transport process are related to the transportation of goods from the supplier to the recipient, i.e., spatial and temporal movement. Logistics of expeditionary services include core activities and intermediary services and is mainly associated with the time that goods spend in different channels of freight traffic. They emphasize that every component of this complex needs control. The authors [
18] claim that transport is the most important factor in determining the logistics chain because it is through transport by which physical deliveries are made.
The basic methods of formation of a rational fleet for ensuring the effective functioning of a transport operator are analyzed in work [
19]. The analysis of the literature has investigated the choice of the most effective option of the fleet on specific operating conditions, taking into consideration the demand for transportations and the structure of the existing fleet, can be made by different methods, the essence of which is to compare the results of the rolling stock of different types and models among themselves in the same conditions [
20]. The main disadvantage of the methods considered is that they do not consider the influence of material flow parameters on the change of transportation technology [
21,
22,
23]. Thus, after the references review was established, the issue of fleet planning was not sufficiently studied as the parameters of material flow.
This paper presents the scenarios for the use of an owned, external and mixed fleet of vehicles for the transport of loads sensitive to changes in weather conditions (i.e., temperature). It should be mentioned that the general assumptions are that analyzed logistics processes are related to the first and last mile delivery with special attention on the transportation activities realized at the city area. The purpose of this paper is to study the formation of a rational freight fleet in the case of changing the parameters of material flow in time. The purpose of this research is focused on the activity of the freight operator and the efficiency of functioning of its distribution processes, and the goal is the structure of the fleet. In accordance with the stated purpose in this paper, the following tasks are set:
the references review (made in this section)
description of methodologies
analyzing the supply chain
identifying alternatives to the formation of a vehicle fleet based on seasonal changes in transportation conditions
outsourcing of transport services market research
determining the range of variation of data for simulation
estimating the optimal structure of the vehicle fleet formation
exploring patterns of invest indicators’ dependence on operational indicators
discussions and conclusions
2. The Background and Methodology
Vehicles with different types and models of configuration are being introduced. Differing parameters of motor vehicles introduce different technical, and economic performances [
24]. It is possible to use vehicles of different types and models under the same work conditions. Calculations show that the transportation of the same material flow can have different performance with different models of motor vehicles [
25].
Identification of the number and type of vehicles encompasses a wide range of issues solved in the course of the current and planned activities of the enterprise and one of the decision-making factors is the cost calculation [
26]. The costs of their own vehicles should consider not only the actual costs incurred at the initial period and during the execution of the project, but also the cost of investment in overtime: inflation risks, discounts, the cost of credit, and so on. In this order, take into account the cost of the equipment space for parking and maintenance of vehicles, the cost of supporting infrastructure and labor support staff (engineers), etc. [
27]. The composition and structure of costs are determined by the specifics of the enterprise (rental, purchase, lease, etc.) with each of the different vehicles. The cost, operation and maintenance of a tent semi-trailer is cheaper than insulated. Organizing and maintaining a car fleet requires a lot of investment and loan costs [
28,
29]. When considering the cost of the transport operator, the cost items listed in
Table 1 will be considered.
Under the condition of using only owned or only rented vehicles, it is not necessary to solve the problem of which customer to serve with owned vehicles and which with rented vehicles. When using mixed options, on the contrary, it is necessary to determine the effectiveness of possible options of the ratio of owned and rented for all orders. The following are the options for the use of owned or rented vehicles [
30]: allocate the demand via an owned fleet; allocate the demand via rented vehicles; allocate the demand between the owned fleet and rented vehicles. The owned and rented vehicles’ redistribution between different orders leads to changes in their efficiency of usage and consequently, profits. Therefore, hiring vehicles to fulfil contractual obligations reduces costs such as capital costs, costs associated with the maintenance of the vehicle, leasing or credit payments in the time period, but increases the instant cost of transportation compared to using the owned fleet [
31]. Vehicle absence in greatest demand periods leads to losses (ie., penalties) for the logistics operator [
32]. Large, owned vehicle fleet possession for meeting the demand peaks for some periods during the year is not appropriate from an economic point of view [
33]. This is especially important in long-term transportation contracts with seasonally changing parameters [
34].
The choice of one or other of these options should be economically viable from the perspective of a long-term project analysis. The owned and rented fleets will differ in cost for one vehicle; in the first case, all expenses are calculated from the actual number of operating vehicles, and in the second, from the proposed owned vehicles. The cost of fulfilling orders by the leased vehicle fleet is 95% of the average income per order since all calculations are carried out on average per month for the billing period.
The methods and models for choosing alternative solutions in logistics are mainly based on expert assessment, as they are based on qualitative parameters [
35]. The most common criteria for choosing the type of transport [
9], mode of transportation [
32], and carrier are the following parameters: minimum cost [
17,
32], delivery time [
22,
27], reliability [
21], capacity [
29], and safety [
20,
21]. These are the primary criteria. For a more detailed analysis, one can expand the list of considered criteria to include sociability (ability to speak the language available to the buyer), etc. [
36]. These methods involve, firstly, many solutions and, accordingly, the complexity of choosing the optimal option. Secondly, the decision is based on the subjective opinion of experts. However, the existing methods of fleet estimation do not sufficiently consider the temperature factor for the efficiency of long-turn servicing orders.
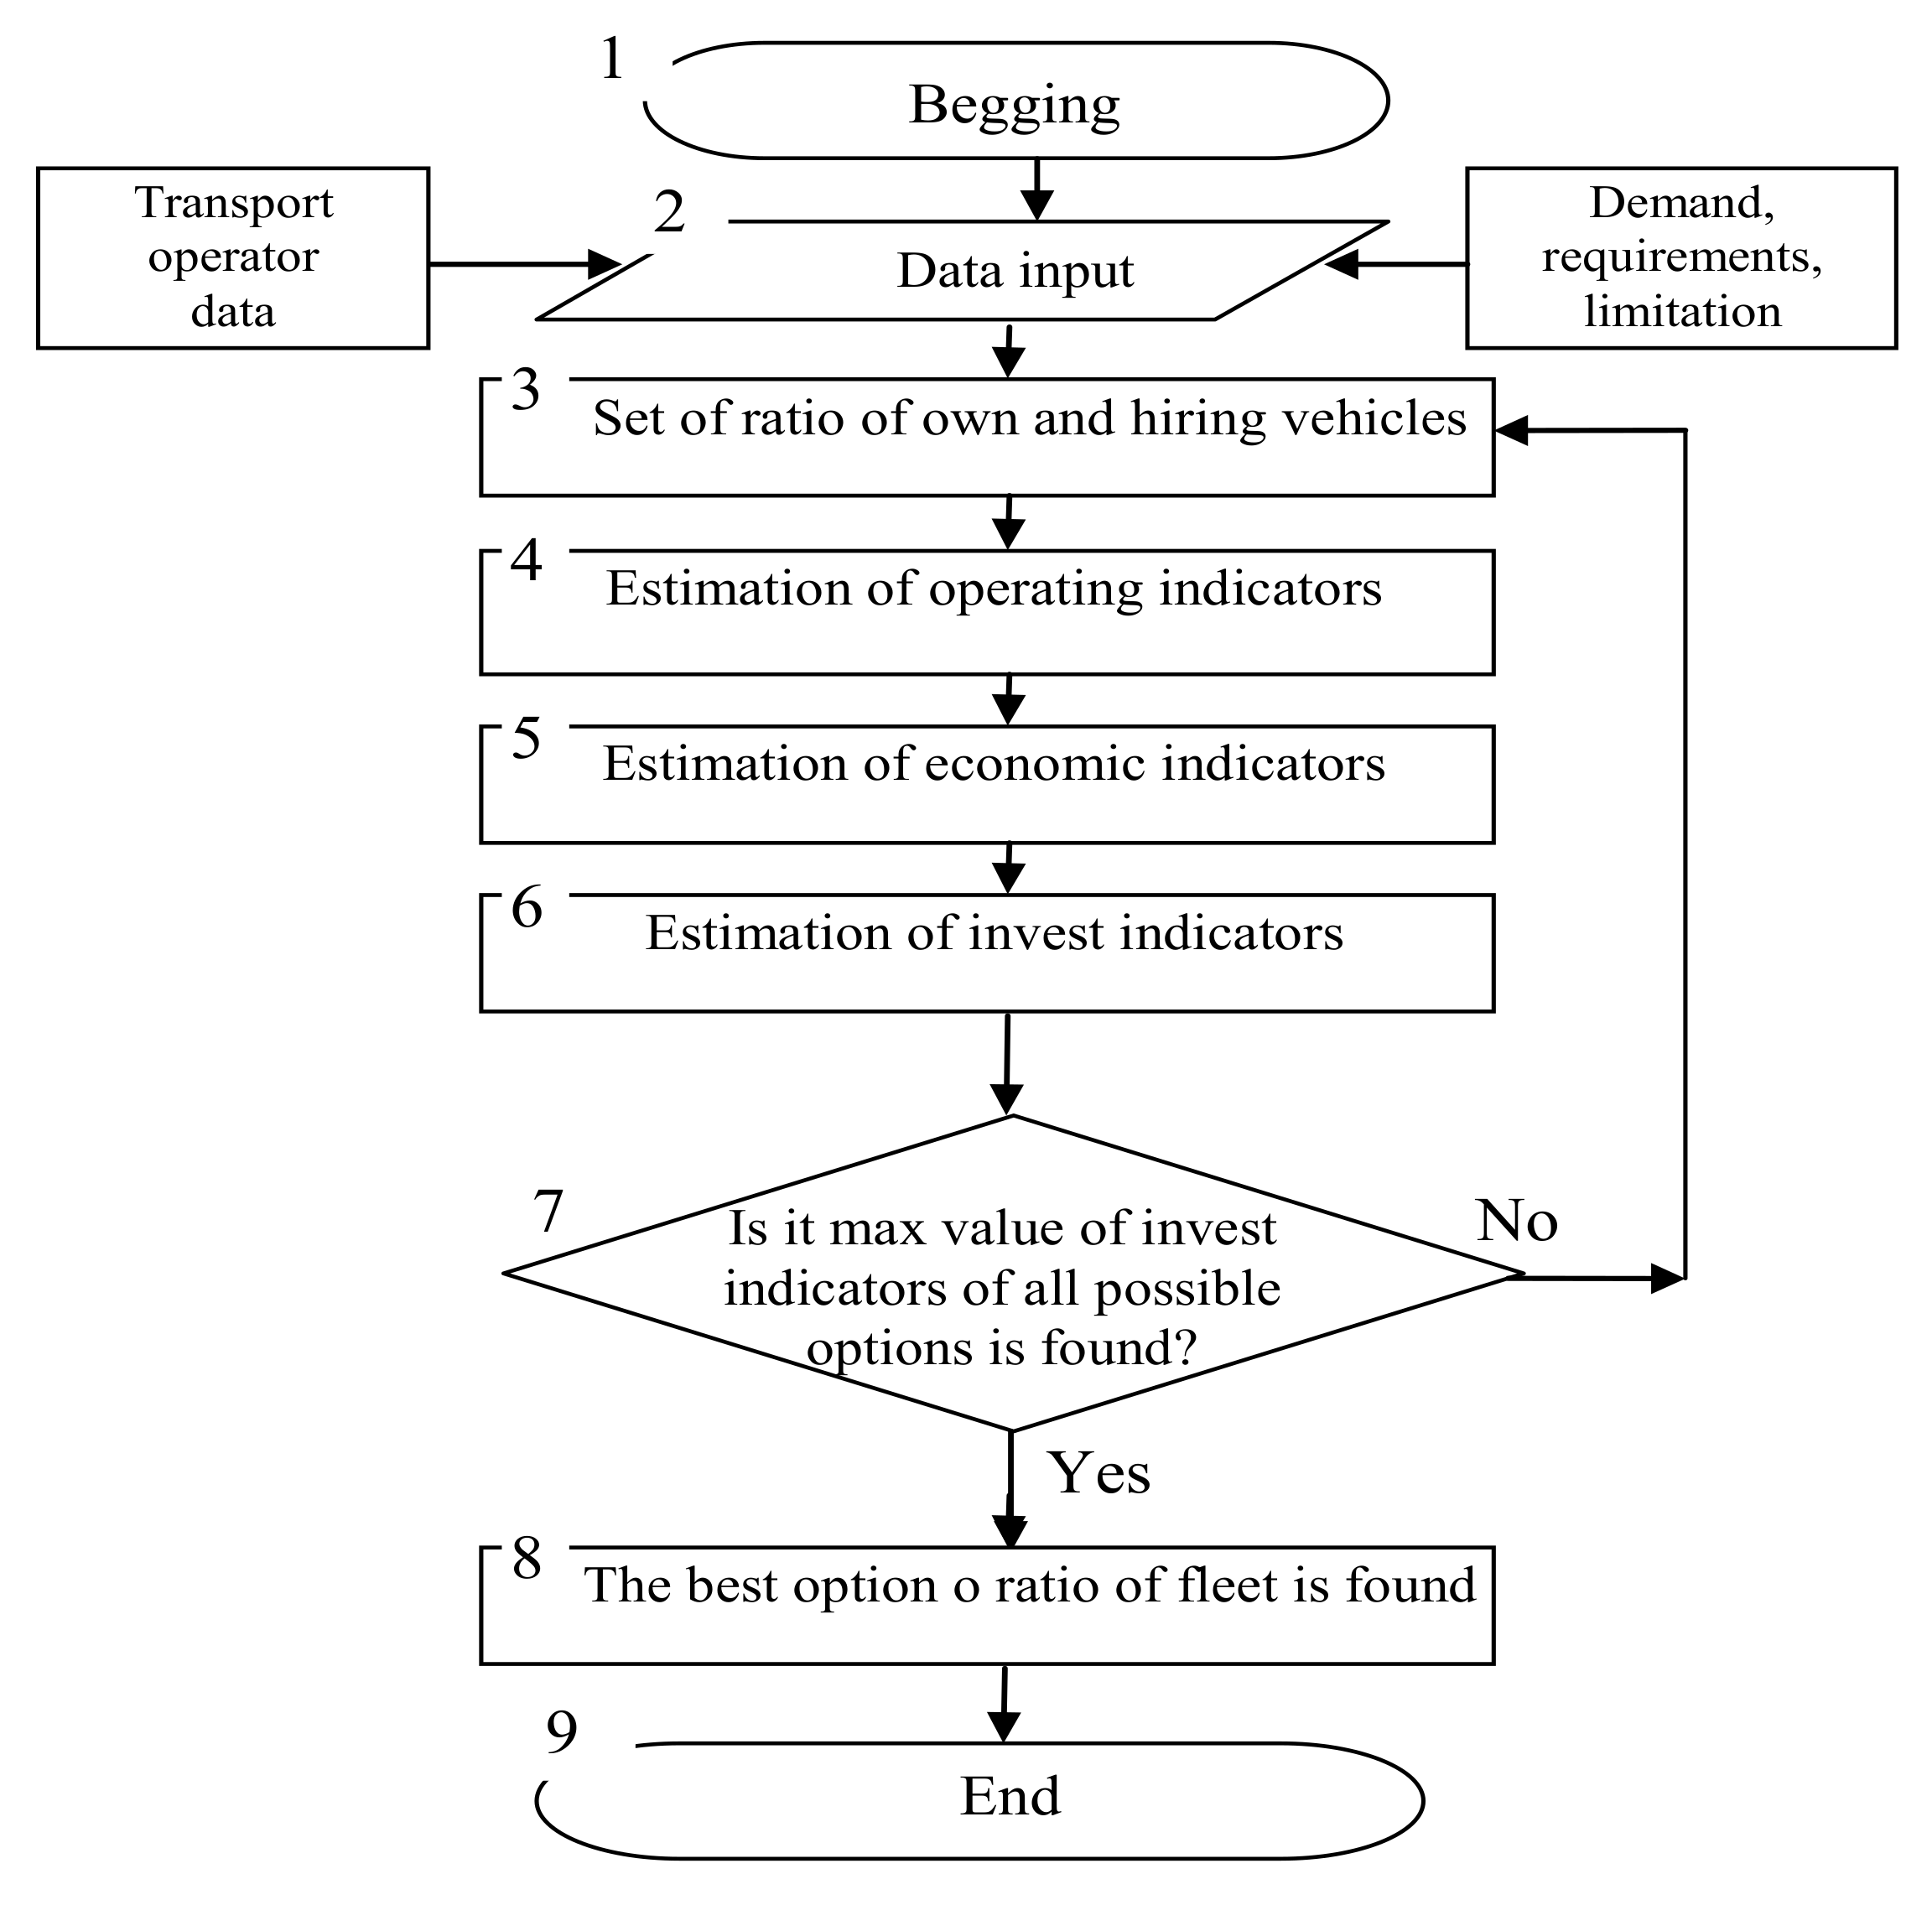
The performance criteria for transport service can be selected from commercial investment criteria in the «long run» project: [
37,
38,
39]: the net present value (NPV) and the payback period (PP). In this case, the efficiency of the formation of the vehicle fleet problem can be a net present value for all possible variants of fleets during the lifetime of the project.
The algorithm for determining the FVP to determine the efficiency of hired and owned vehicles is shown in
Figure 1.
3. Results and Discussion
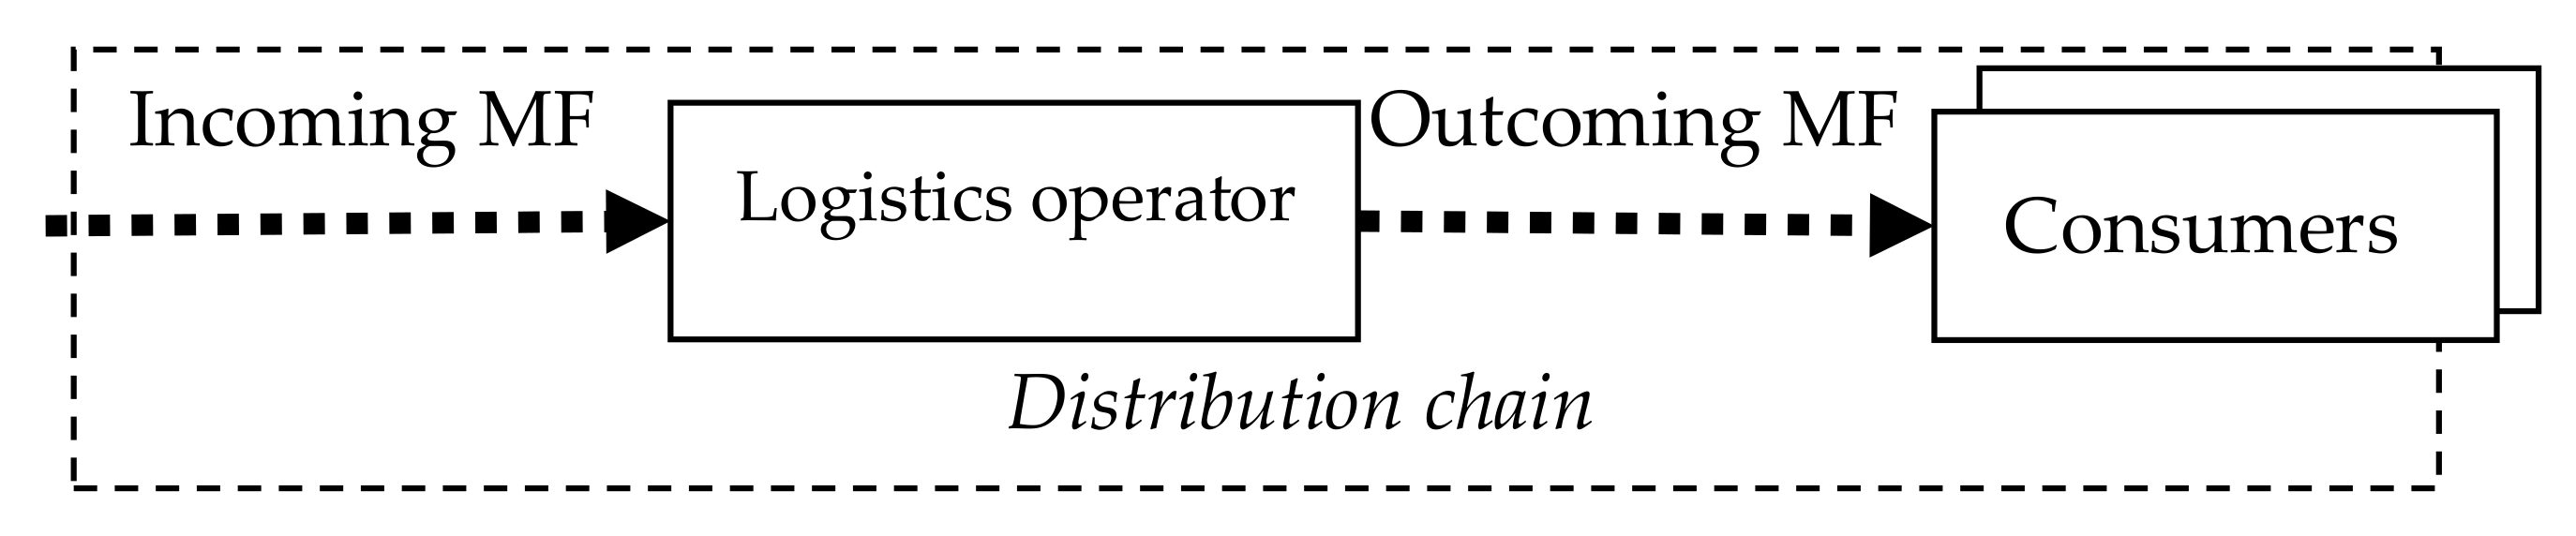
3.1. Analysis of Distribution Chain
The described distribution chain consists of the following elements: incoming and outcoming material flow, and the logistics operator presented in
Figure 2.
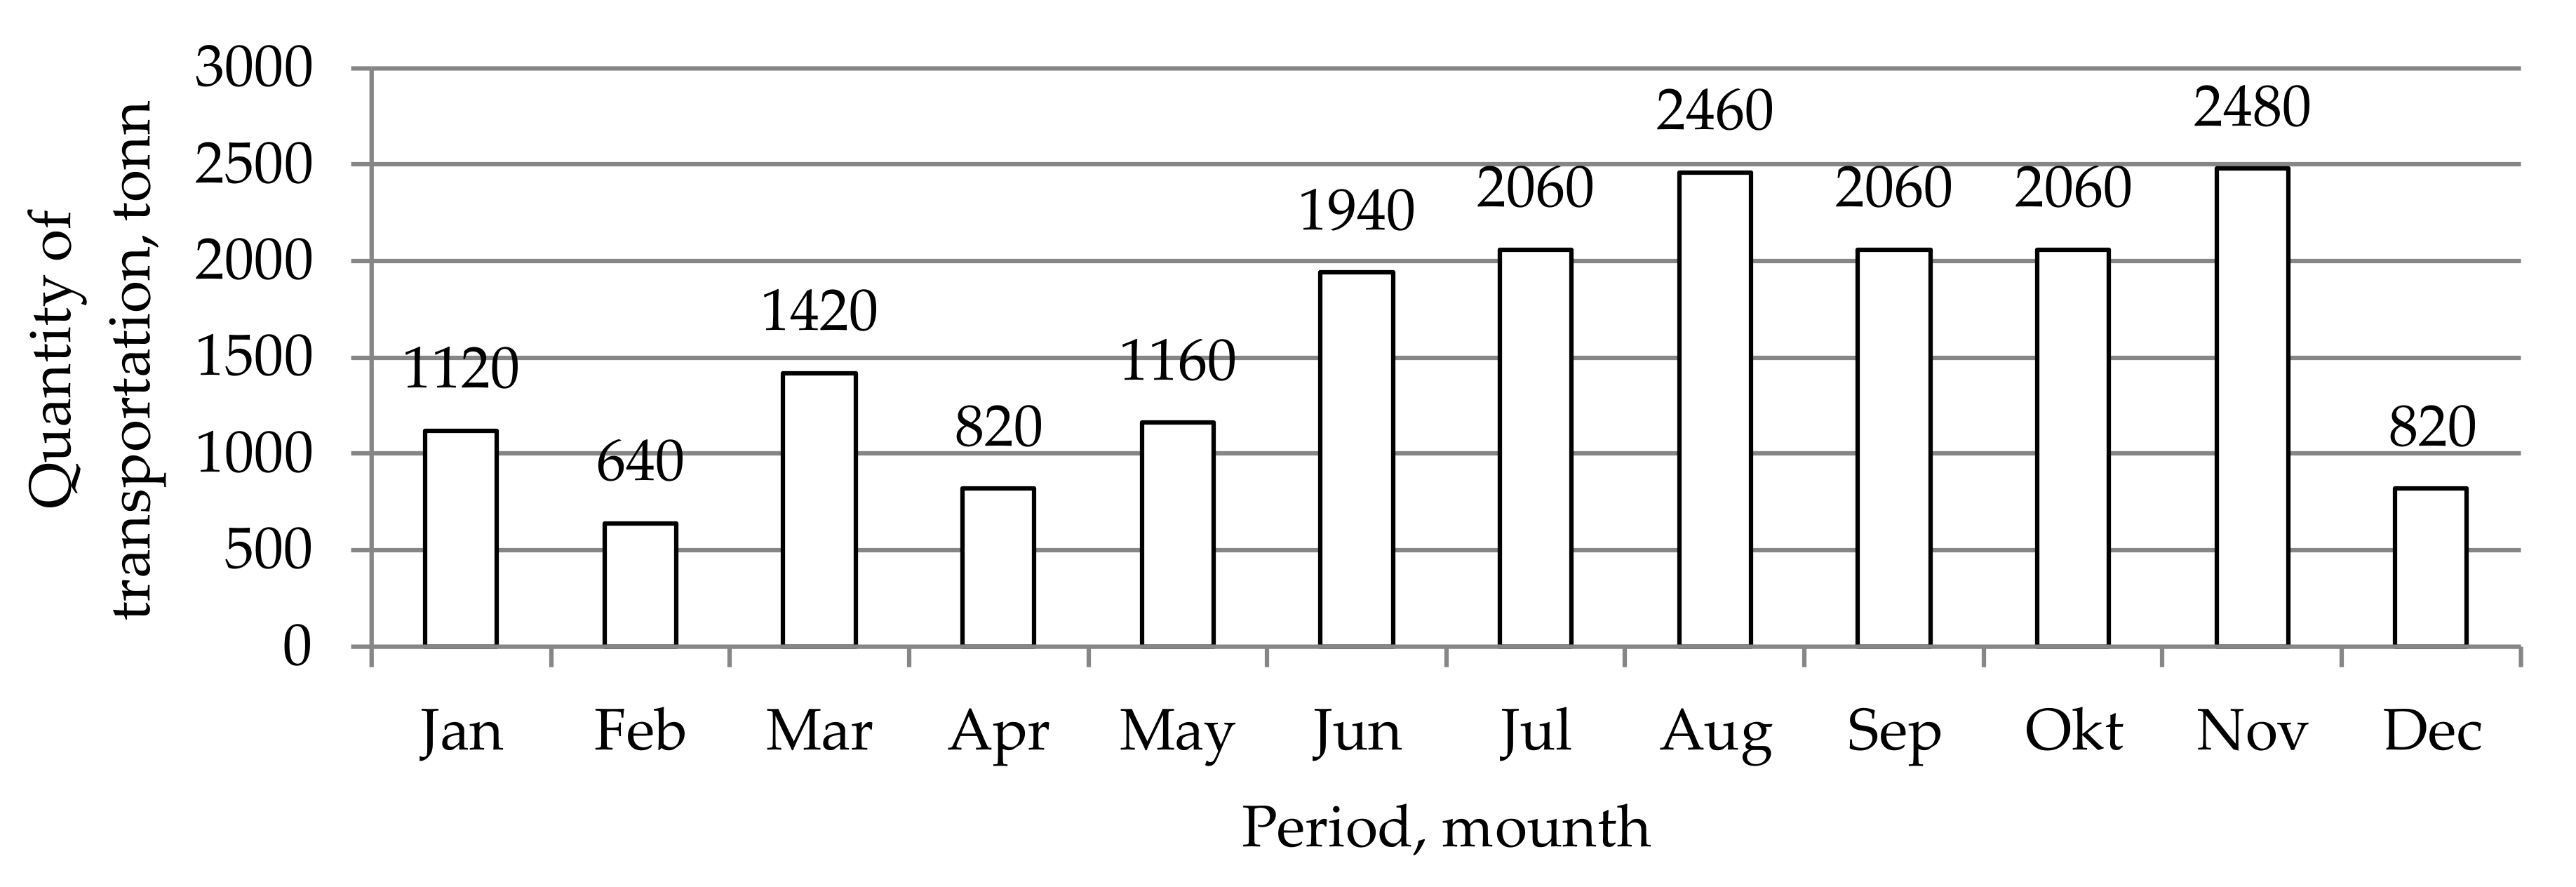
In this distribution chain, the logistics operator is the intermediary participant in distributing the material flow between the consignor and the consignee. The freight pallets are loaded onto the vehicle and transported to a warehouse using a long-haul scheme. The pallets are returned to the consignor in the same vehicle. The logistics operator manages the delivery process in the described link and could use an owned and hired fleet for transportation. The quantity of transportation of material flows during the year is presented in
Figure 3.
In
Figure 3, the largest quantity of transportation falls in the summer and autumn, and the lowest in the winter period. Logistics operators need to meet the temperature requirements for goods during freight transportation. To ensure the safety of freight transportation and to avoid losses due to perishable goods types in some periods, it is necessary to use a different vehicle fleet: insulated or tent. These goods require certain conditions: the temperature must be at least 0 °C and not more than 30 °C for the tent semi-trailer and between 1 to 6 °C for the insulated semi-trailer.
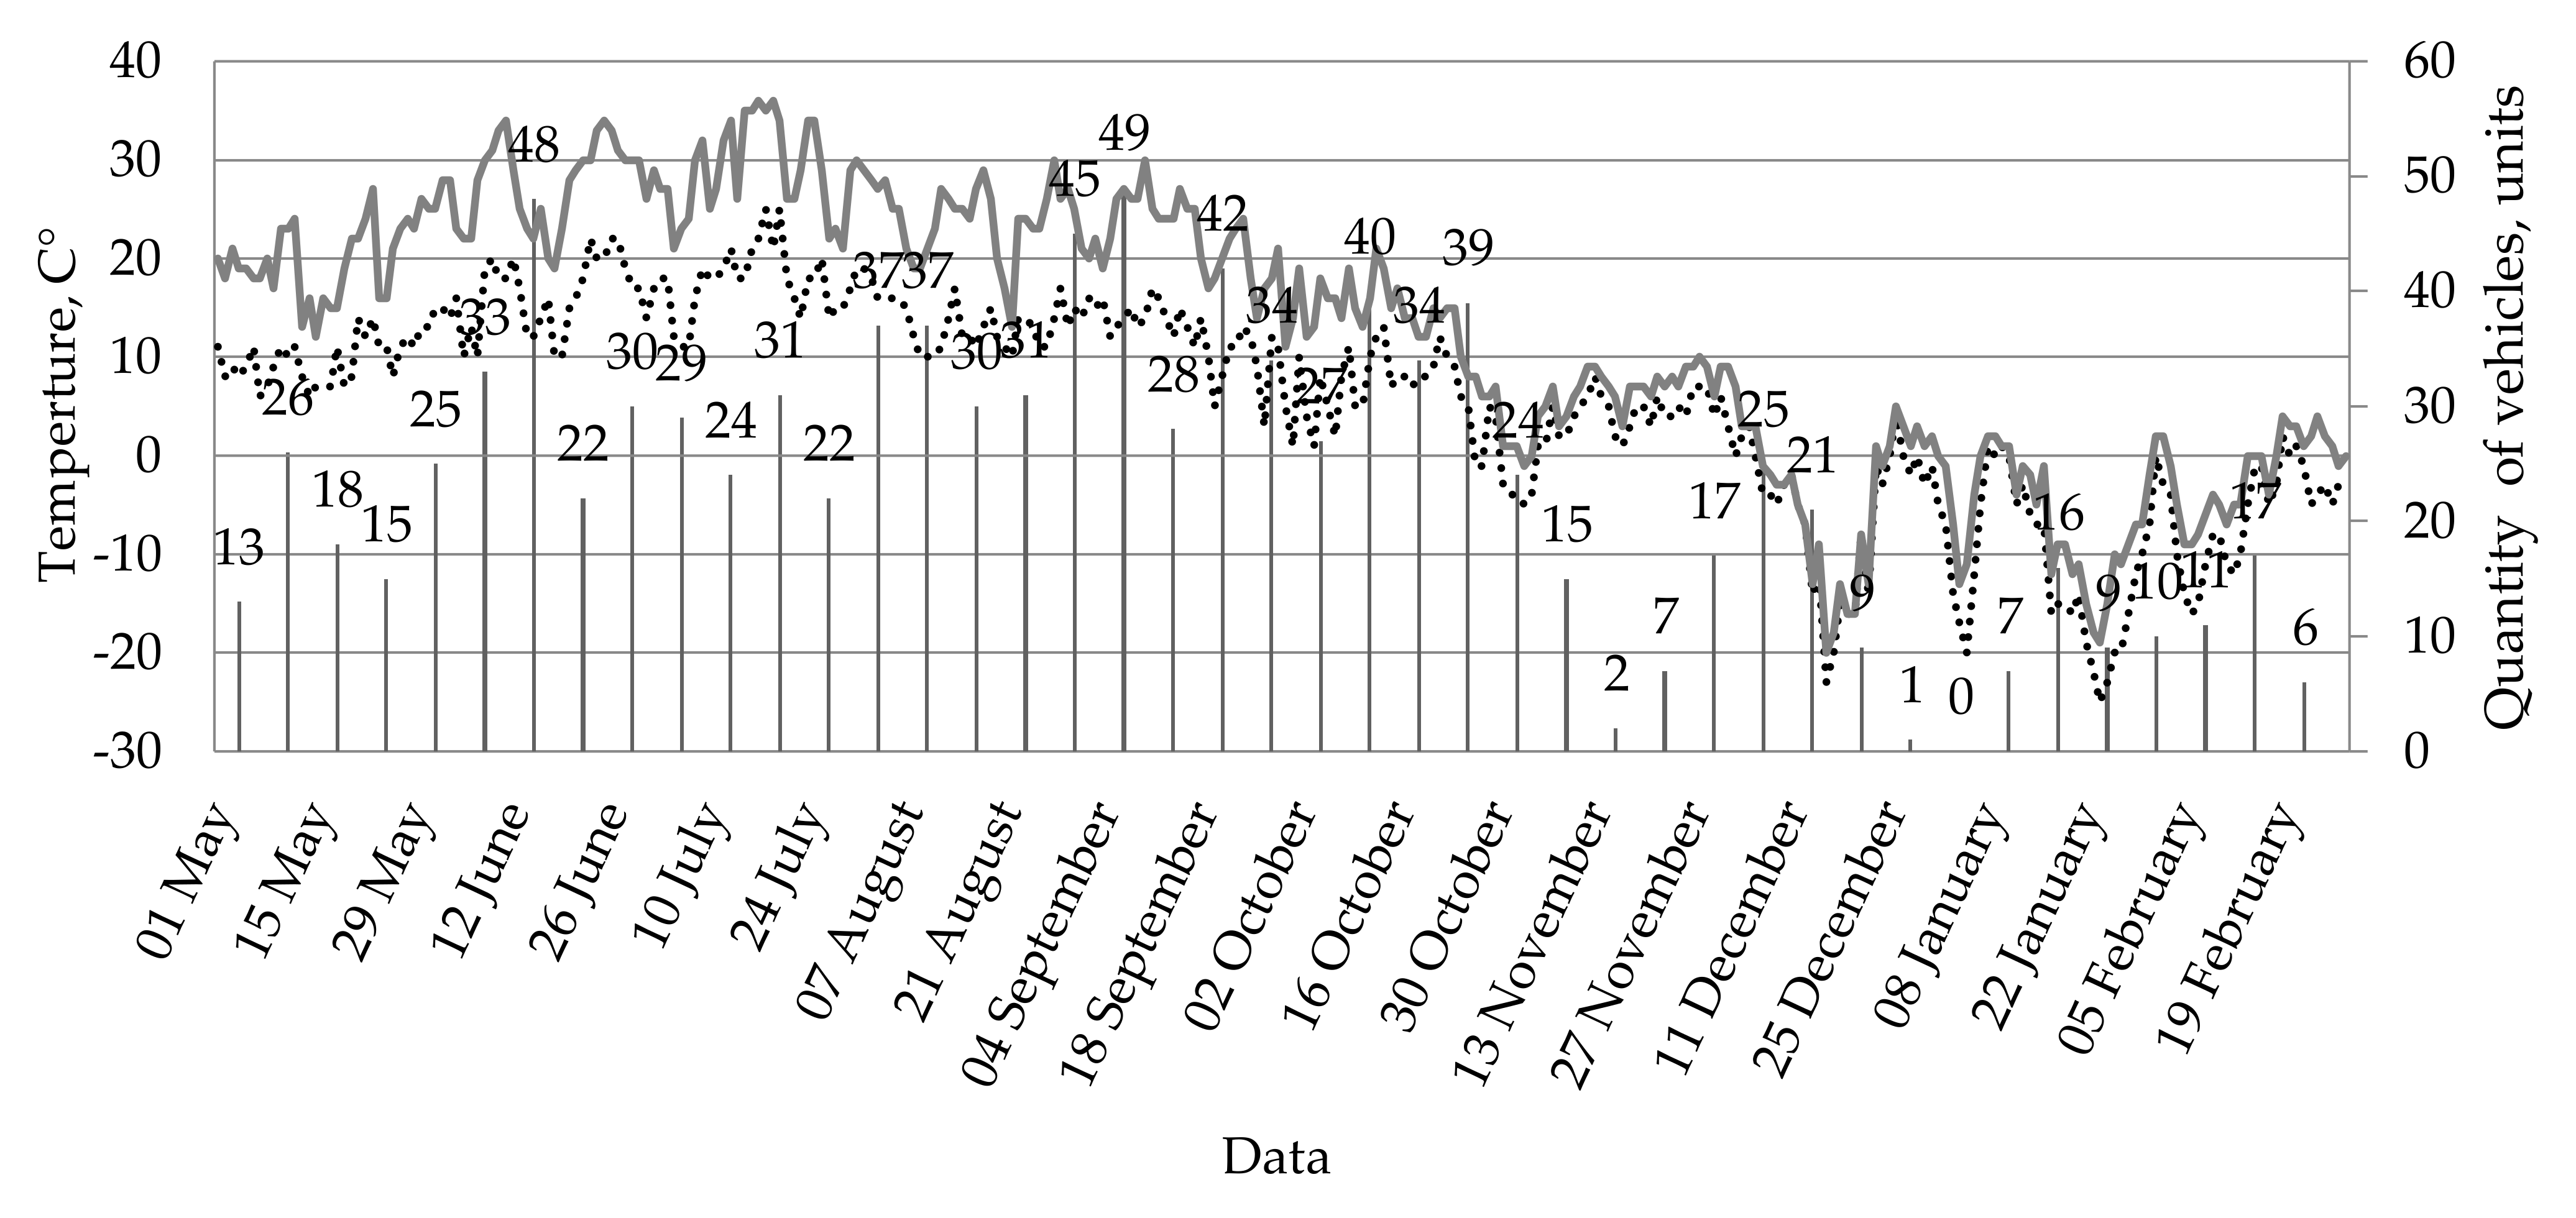
The quantity of the transportation of material flow, weekly for the period from 1 June 2018 to 31 May 2019, is presented in
Figure 4.
Taking into account the fluctuations of the temperature as shown in
Figure 4, it can be concluded that during the period from 1 June 2018 to 13 July 2018, the goods can be transported with the help of an insulated semi-trailer. During the peak of the summer period and at the beginning of autumn (from 13 July 2018 to 31 August 2018), it is advisable to transport the goods with an insulated semi-trailer, but optionally, during this period it is possible to carry out the transportation with the tent semi-trailer, provided it is for night transportation. In the period from 31 August 2018 to 4 January 2018, the daily temperature drops slightly, but is within the acceptable temperature limits, so in this case it is possible to use the tent semi-trailer. In the following weeks, namely from 11 January 2019 to 22 March 2019, the air temperature tends to decrease significantly, which requires the use of a specialized rolling stock: an insulated semi-trailer. From 22 March 2019 to 31 May 2019, the ambient temperature is suitable for freight transporting in a tent semi-trailer, but in the subsequent period, the temperature drops significantly, and the goods require transportation in an insulated semi-trailer.
Therefore, the logistics operator with its own tent semi-trailer fleet only, is forced to rent insulated road vehicles from third-party organizations to ensure high-quality freight transportation. Considering the above, the system demand should have at least two types of transport that are necessary for the transportation of goods (tent and insulated semi-trailers up to 20 tons) to ensure timeliness and quality of order execution.
Seasonal changes in ambient temperatures are very variable and it is impossible to predict them in full, so the transport operator, even with a constant volume of material flow, must have space for variation of the fleet to provide flexibility and adaptability of its activity to change the temperature regime of the freight. These various conditions and requirements for freight transportation result in underutilization of vehicles during the year.
3.2. Alternative Variants of Formation of a Vehicle Fleet Taking into Account the Seasonal Change of Conditions of Transportation
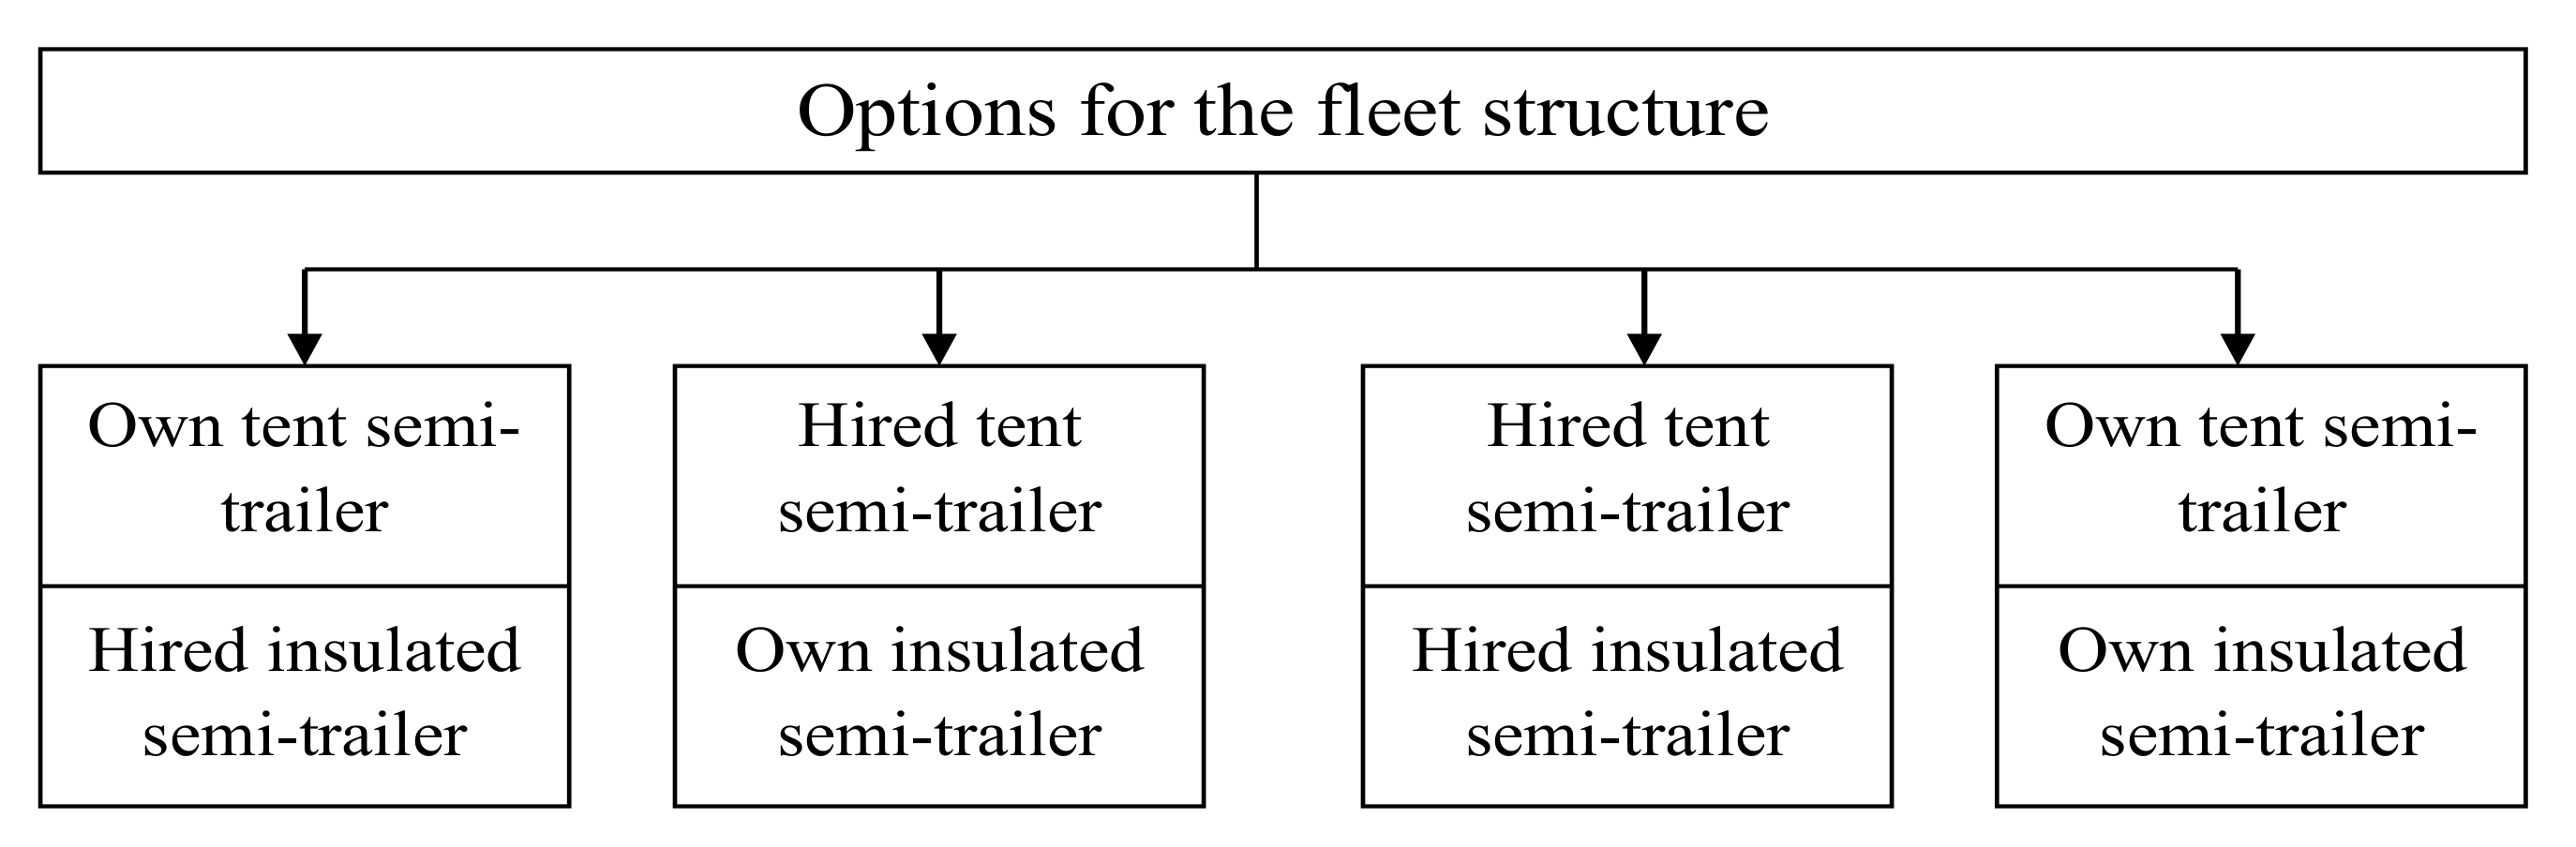
The process of transport services of material flows which depends on a temperature factor during the year influences the use efficiency of the vehicle fleet. These may reduce downtime through the efficient use of the vehicles. Let us consider the following alternative options for the formation of the logistics operator fleet to ensure the promotion of material flow in intercity traffic, considering the influence of the temperature regime (
Figure 5).
As can be seen in the above
Figure 5, the logistics operator has four options for organizing its car fleet. The first option involves the combined use of owned and rented insulated semi-trailers. The second option involves the sharing of rented tent and owned insulated semi-trailers. The third option involves the transportation of cargo by rented semi-trailers, both insulated and tent. The fourth variant is the opposite of the third one—all owned fleet for transportation.
The presented options are formed with the condition that the technology and parameters of the material flow of participants of the distribution chain will remain unchanged during the simulation process (
Table 2).
The distribution chains are the most complex, considering the large number of operating parameters and the mixed relationships between them [
40]. The research of these parameters is covered in many works of scientists, but to solve a particular problem it is necessary to identify those factors that directly affect the resulting indicators under study: NPV and payback period. The basis for calculating performance indicators is the definition of service technology.
The cost of logistics operator in intercity transportation was analyzed. We accept applications indicating the cost of transportation. Additional data for calculations of the functioning of the transport participant are given in
Table 3.
3.3. Transport Services Market Research
The purpose of the transport services market research is to determine the average value of transportation rates set by third parties.
The research of the transport market of intercity transportation was made, in the period from 20 to 26 February 2019. The Internet resource
www.lardi-trans.com (transport information server) was used as a data source. On the site «Lardy—Trans», participants of the market of freight transportation place requests for freight transportation and for information on the availability of free transport. This site was selected for research because it has a large target audience in the field of road transportation in Ukraine [
41,
42]. Initial data from the web-page are presented at
Appendix A. The variation range data is given in
Table 4.
Using correlation and regression analysis, the nonlinear multifactor model of changing the cost of hiring vehicles on the long-haul transport services has been obtained:
—profit rate of the logistics operator, %.
qнk—nominal load capacity, tons.
—the main distance of transportation, km.
—total scope of supply, tons.
The results of the statistical evaluation calculations are given in
Table 5 and
Table 6.
The results of the statistical evaluation prove that the obtained model is characterized by a sufficiently high information capacity, as evidenced by the estimated value of the obtained indicators (
Table 6). Therefore, we can conclude that the obtained model adequately describes the change in the cost of transport services in the main transportation of goods. By analyzing the factors and statistical processing of the results, we can conclude that the obtained model adequately describes the change in the cost of transport services in depending on the main freight transportation, nominal capacity of the vehicle, scope of supply, and profit rate of the logistics operator.
3.4. The Feasibility of Using Owned and Rented Vehicles When Transporting the Material Flow
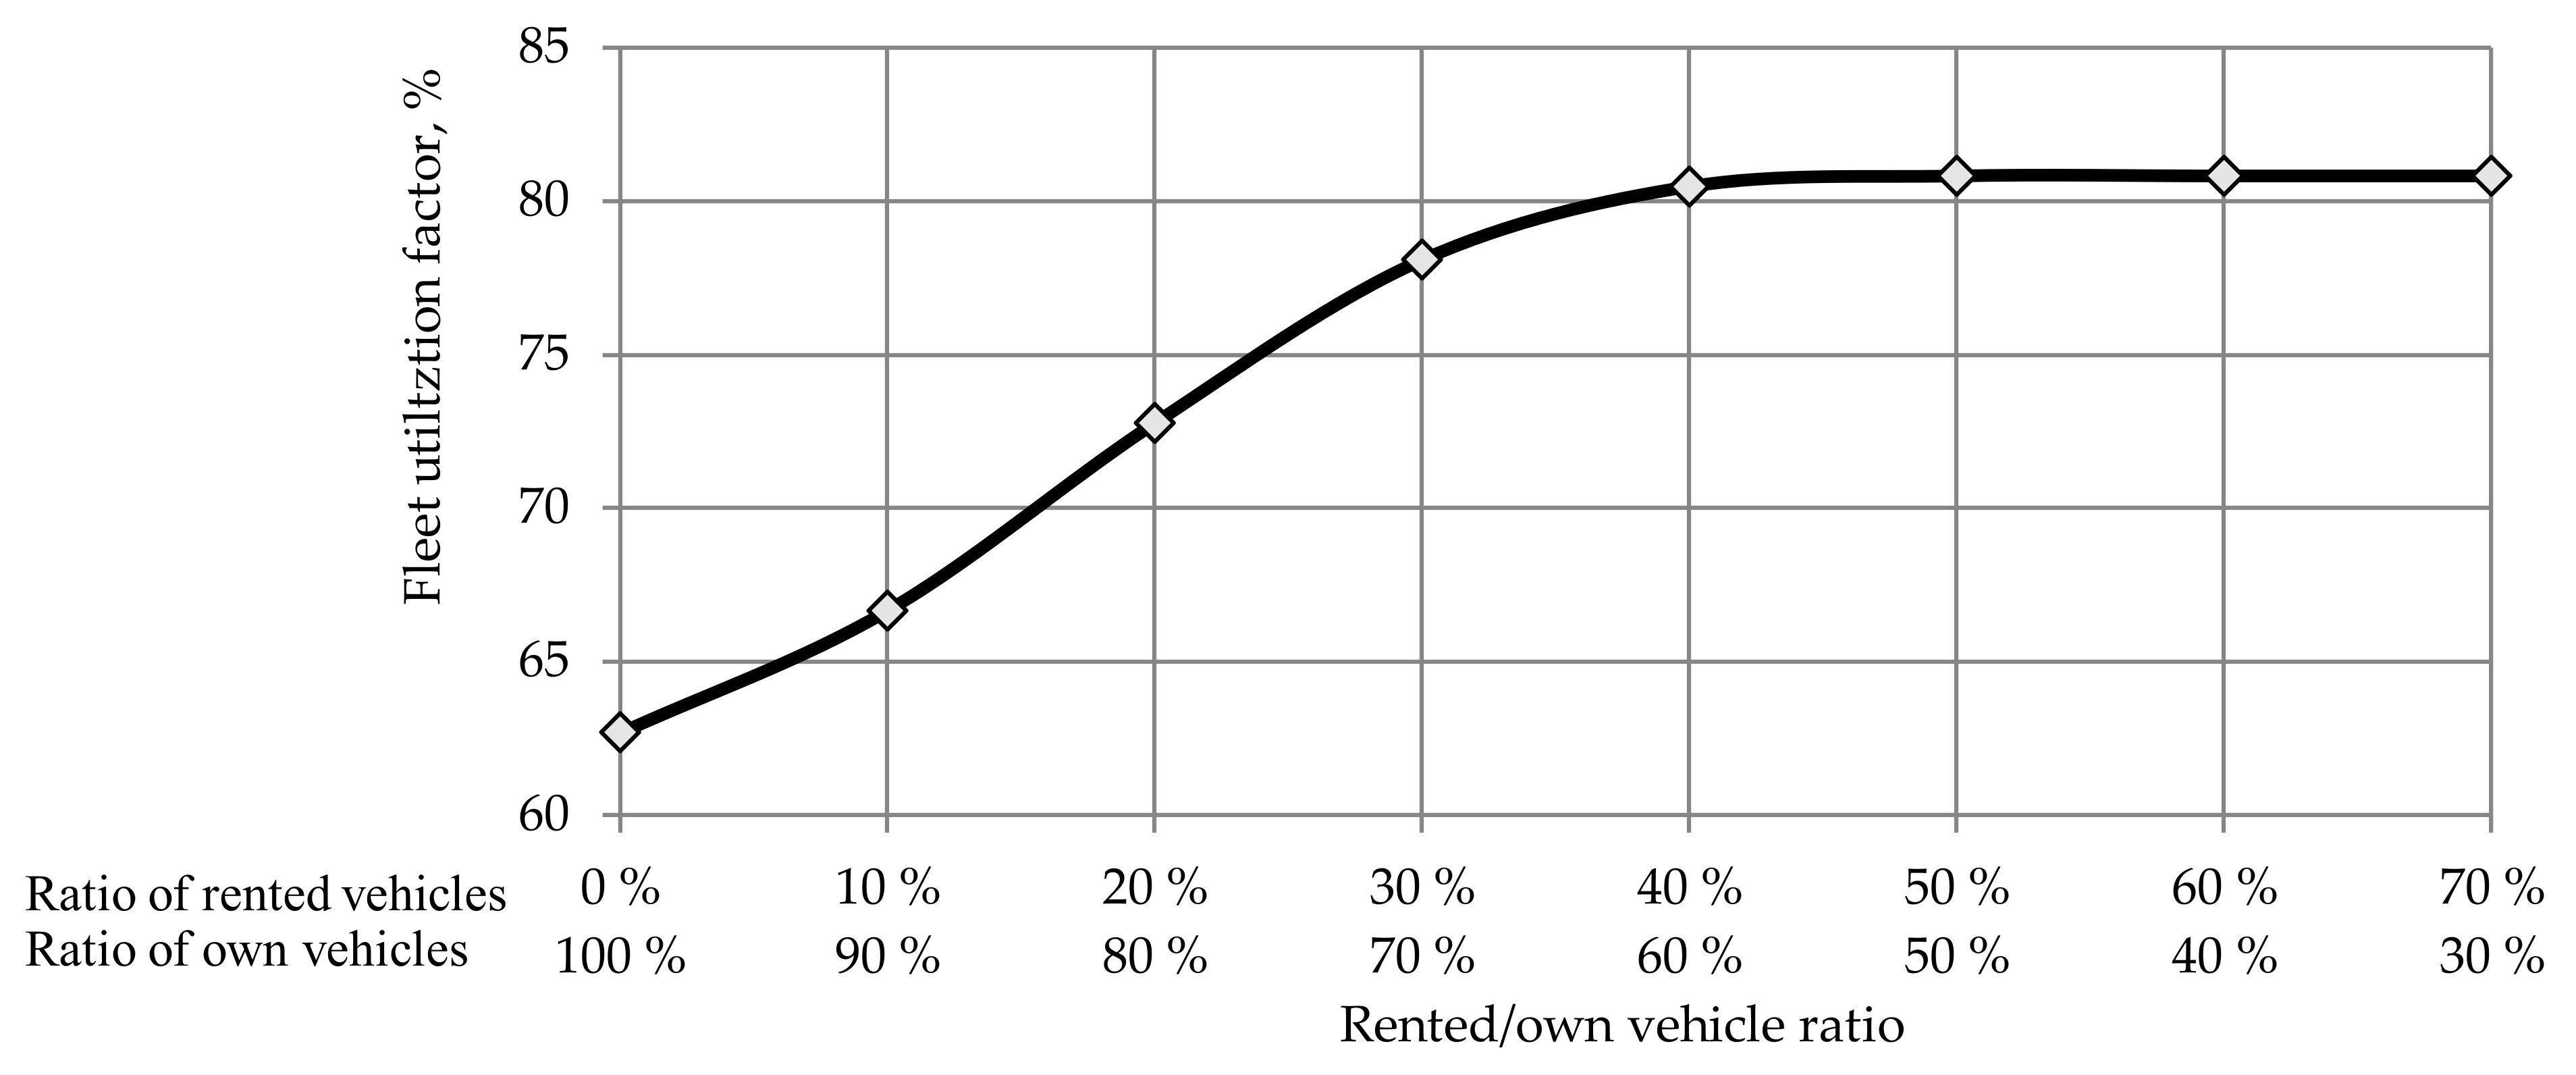
Various options are calculated for the number and ratio of owned and rented vehicles during the service of certain amounts of cargo. Technological indicators of the transport system of joint services change depending on the ratio and fixing of owned and hired vehicles for separate cargoes. The results of the calculation of the mileage utilization factor for different variants of the ratio of owned and hired vehicles are shown in
Figure 6. The simulation results show that the efficiency of transportation depends on the parameters of the goods and the ratio of owned and hired vehicles during their maintenance.
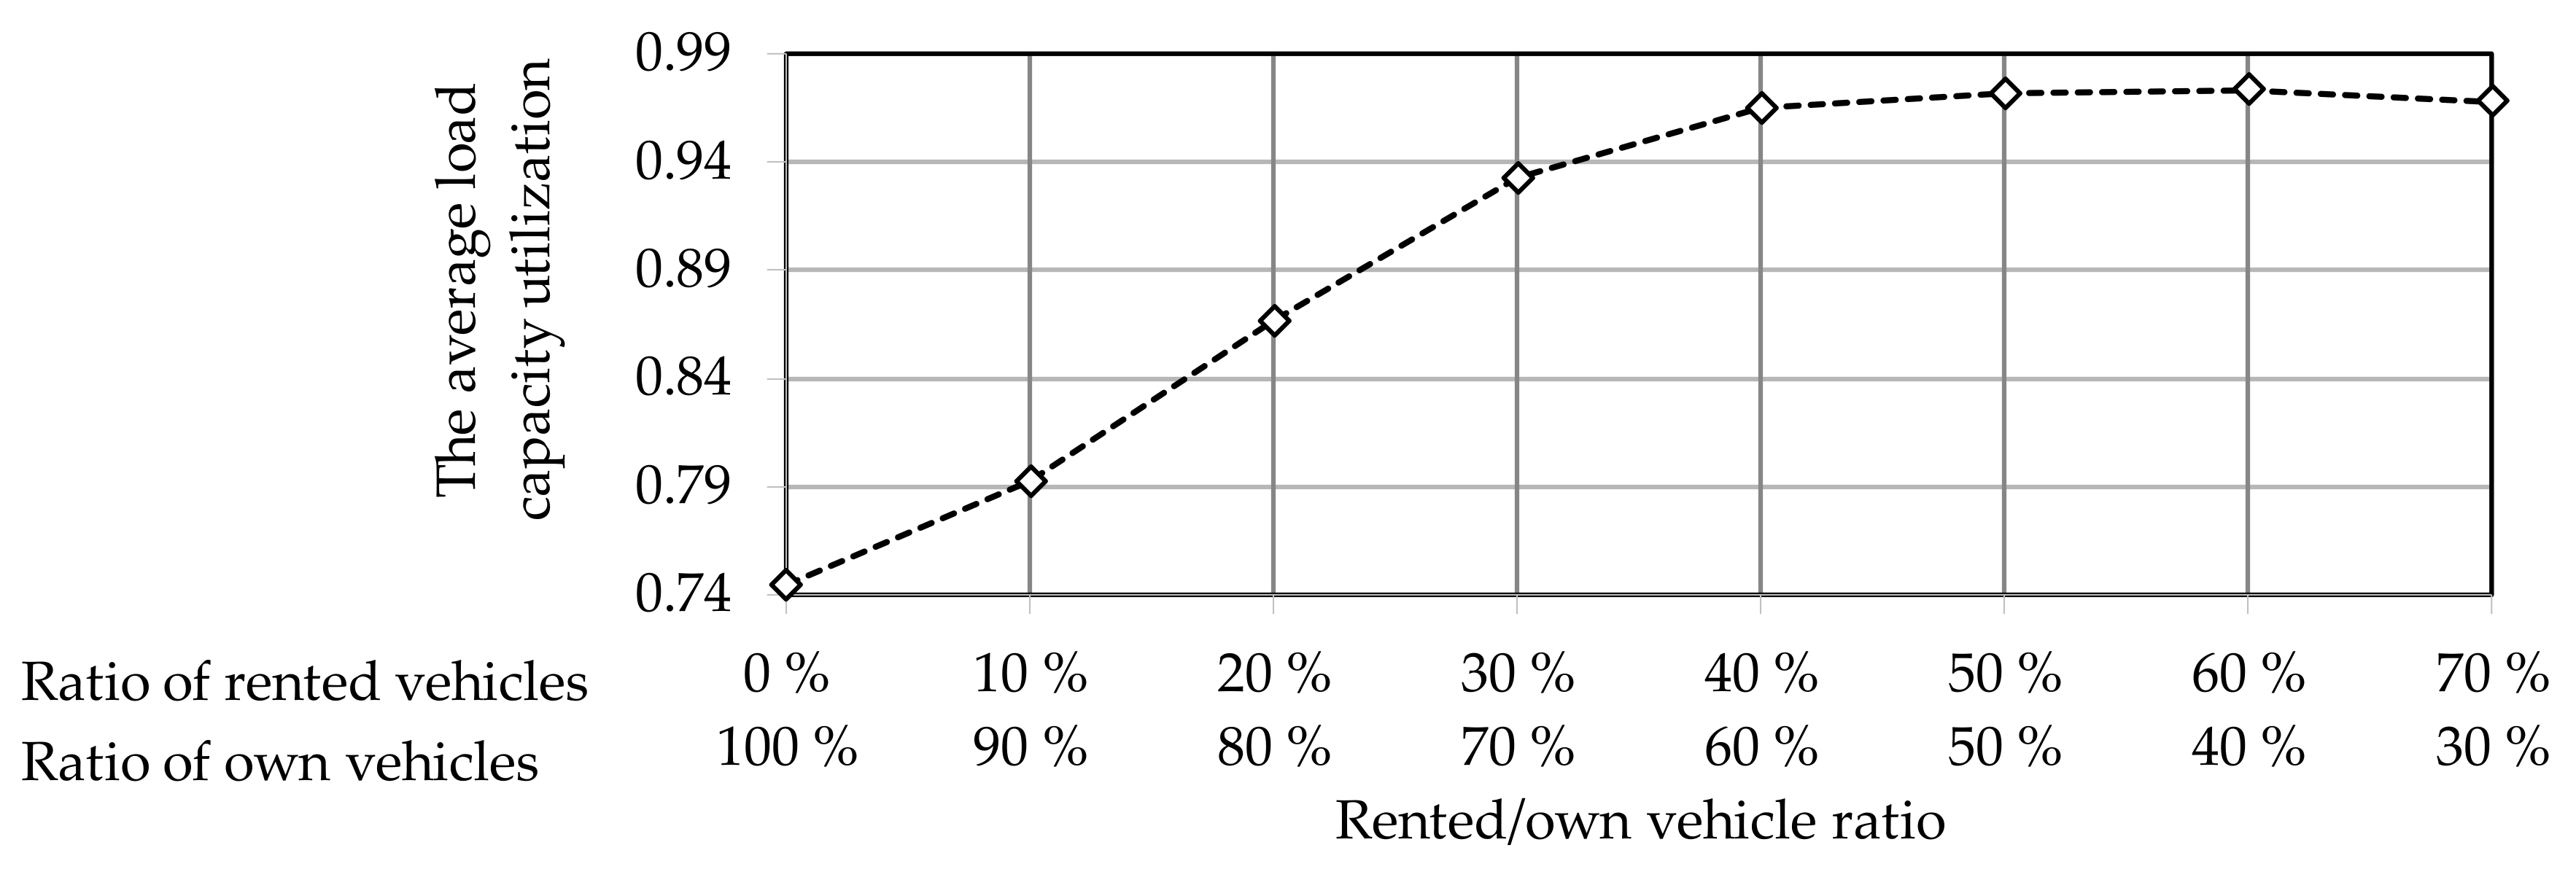
It is established that the total number of vehicles for transportation does not change, but the value of the mileage utilization factor depends on which goods will be serviced by owned vehicles and which by hired vehicles. Direct confirmation of this is done by the different indicators of mileage utilization factors for each option. Similarly, the change in the utilization factor of load capacity depending on the number and ratio of owned and hired vehicles during the transportation of goods (
Figure 7) is investigated.
There are plenty of combinations of transportation options with different efficiencies. The index variation range is from 0.75 to 0.983. The maximum ratio observed in the option is: 30% owned and 70% rented, and transportation 3rd commodity by rented vehicles is 0.983. By applying only owned vehicles, there is a minimum load capacity utilization factor of 0.745. As can be seen, the estimated total vehicles quantity in the combined joint transportation of all customers is unchanged, but the efficiency of transportation will change with their ratio.
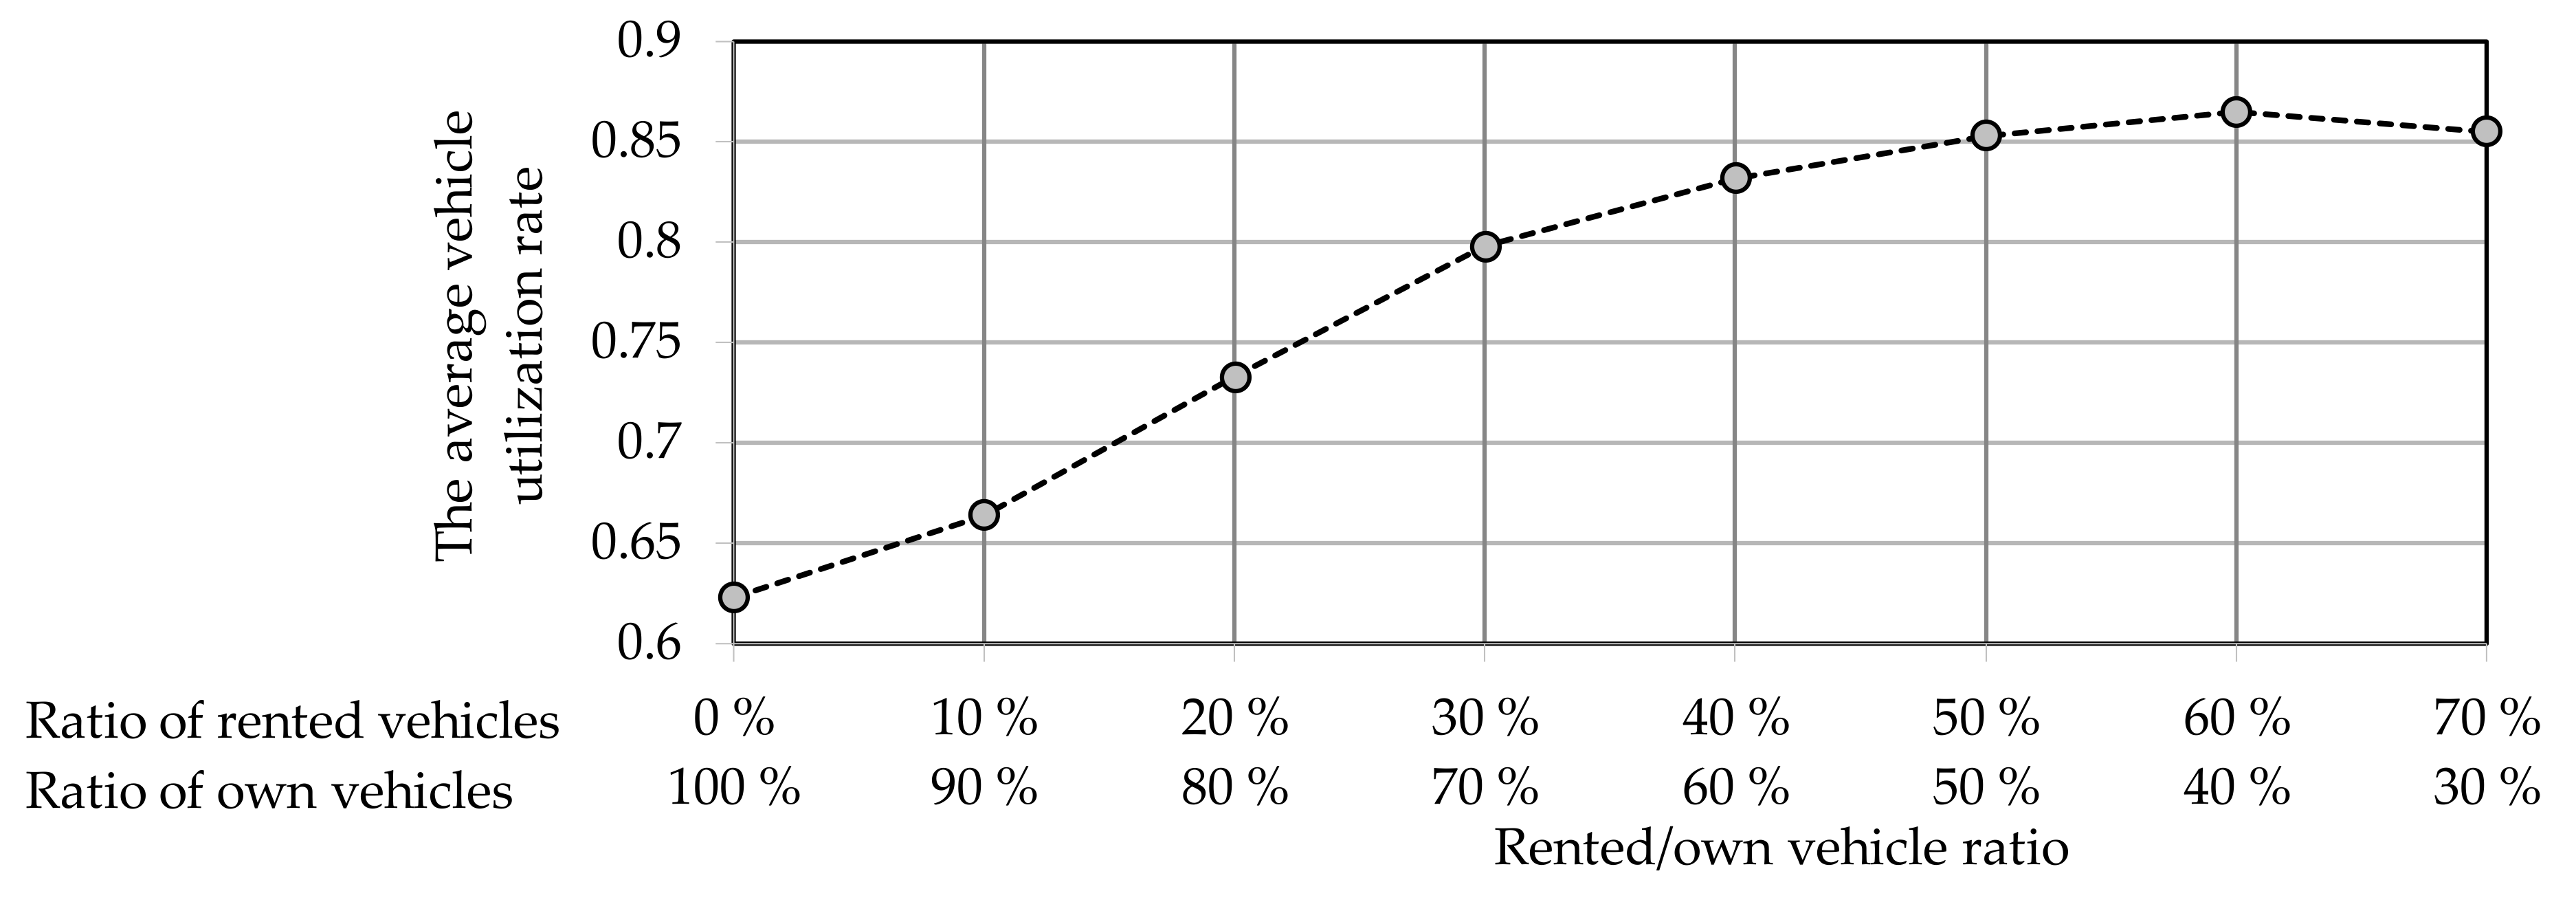
The results of the simulation of other indicators of fleet usage are presented in
Figure 8.
According to
Figure 6, the average vehicle utilization rate of using owned/rented vehicles during transportation would be unconstrained. According to the obtained data, the variation range stays between 0.664 to 0.87. The results show the influence of the owned/rented ratio on transportation efficiency.
Reducing owned vehicles in operations by hiring allows for the fulfillment of contractual obligations and increases the utilization factor of the owned fleet. The optimum option of fleet usage is observed with 60% of owned vehicles and 40% rented; further reduction of owned vehicles does not change the value of the factor (
Figure 8).
3.5. Patterns of Invest Indicators Dependence on Operational Indicators
The research establishes the influence of technological process indicators on project investment performances with different out/insourcing vehicles. The rented and owned vehicles estimation for transportation is based on a comparison of investment projects. The model simulation results show that outsourcing increases the investment performances. Increasing the rented vehicles number (outsourcing) increases the variation range of investment project indicators. This situation is explained via the different transport services efficiency via owned and rented fleets.
A conducted simulation shows the effect of different transportation options on the efficiency of fleet usage in
Figure 9 and
Figure 10.
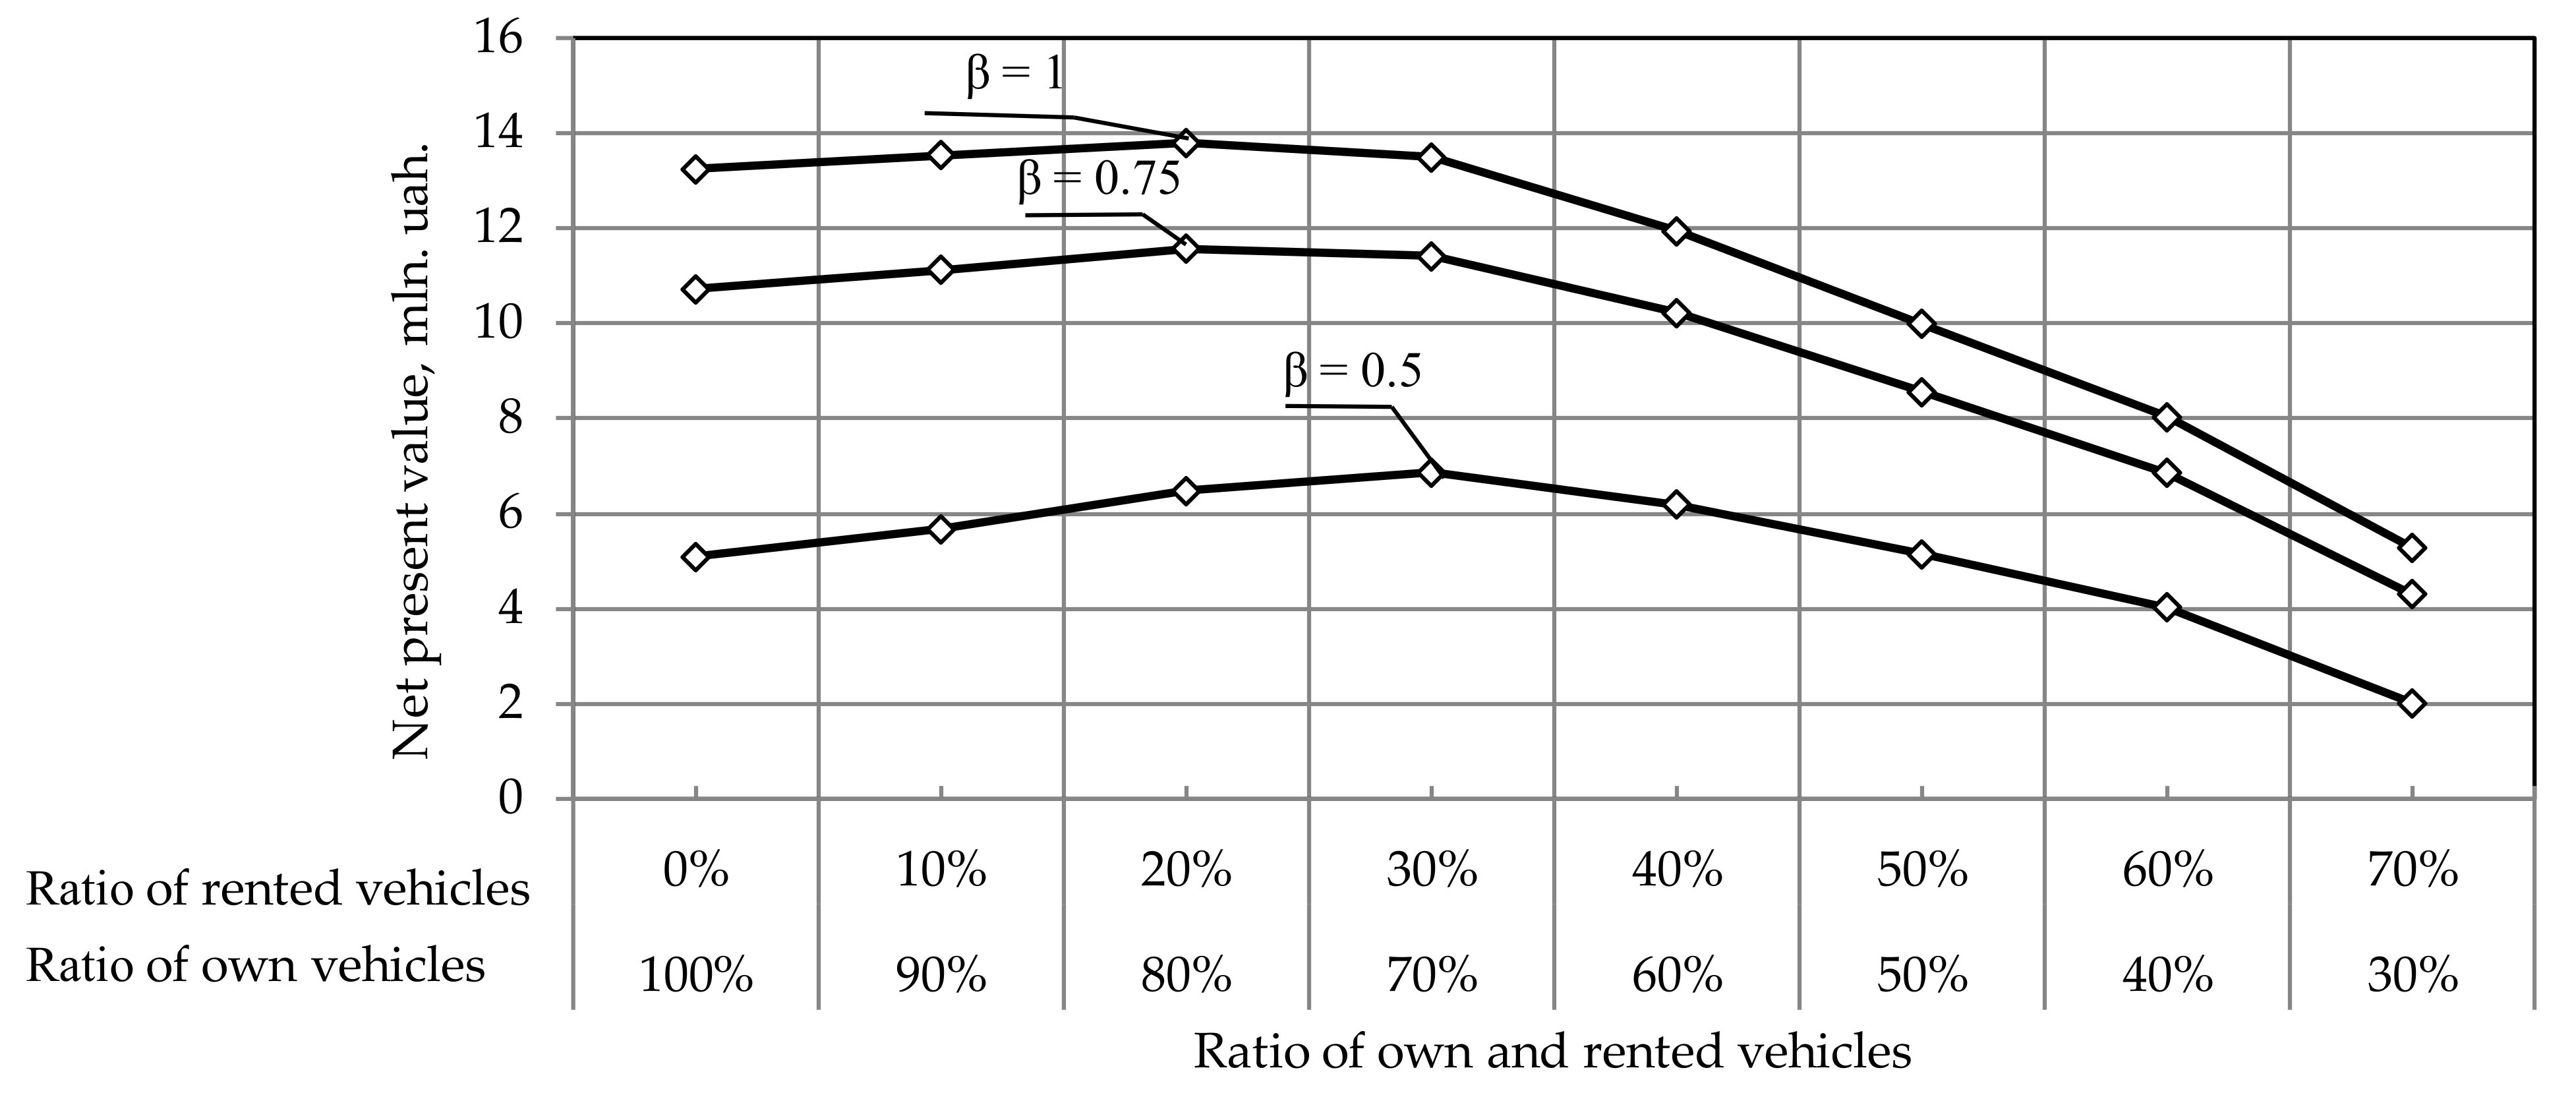
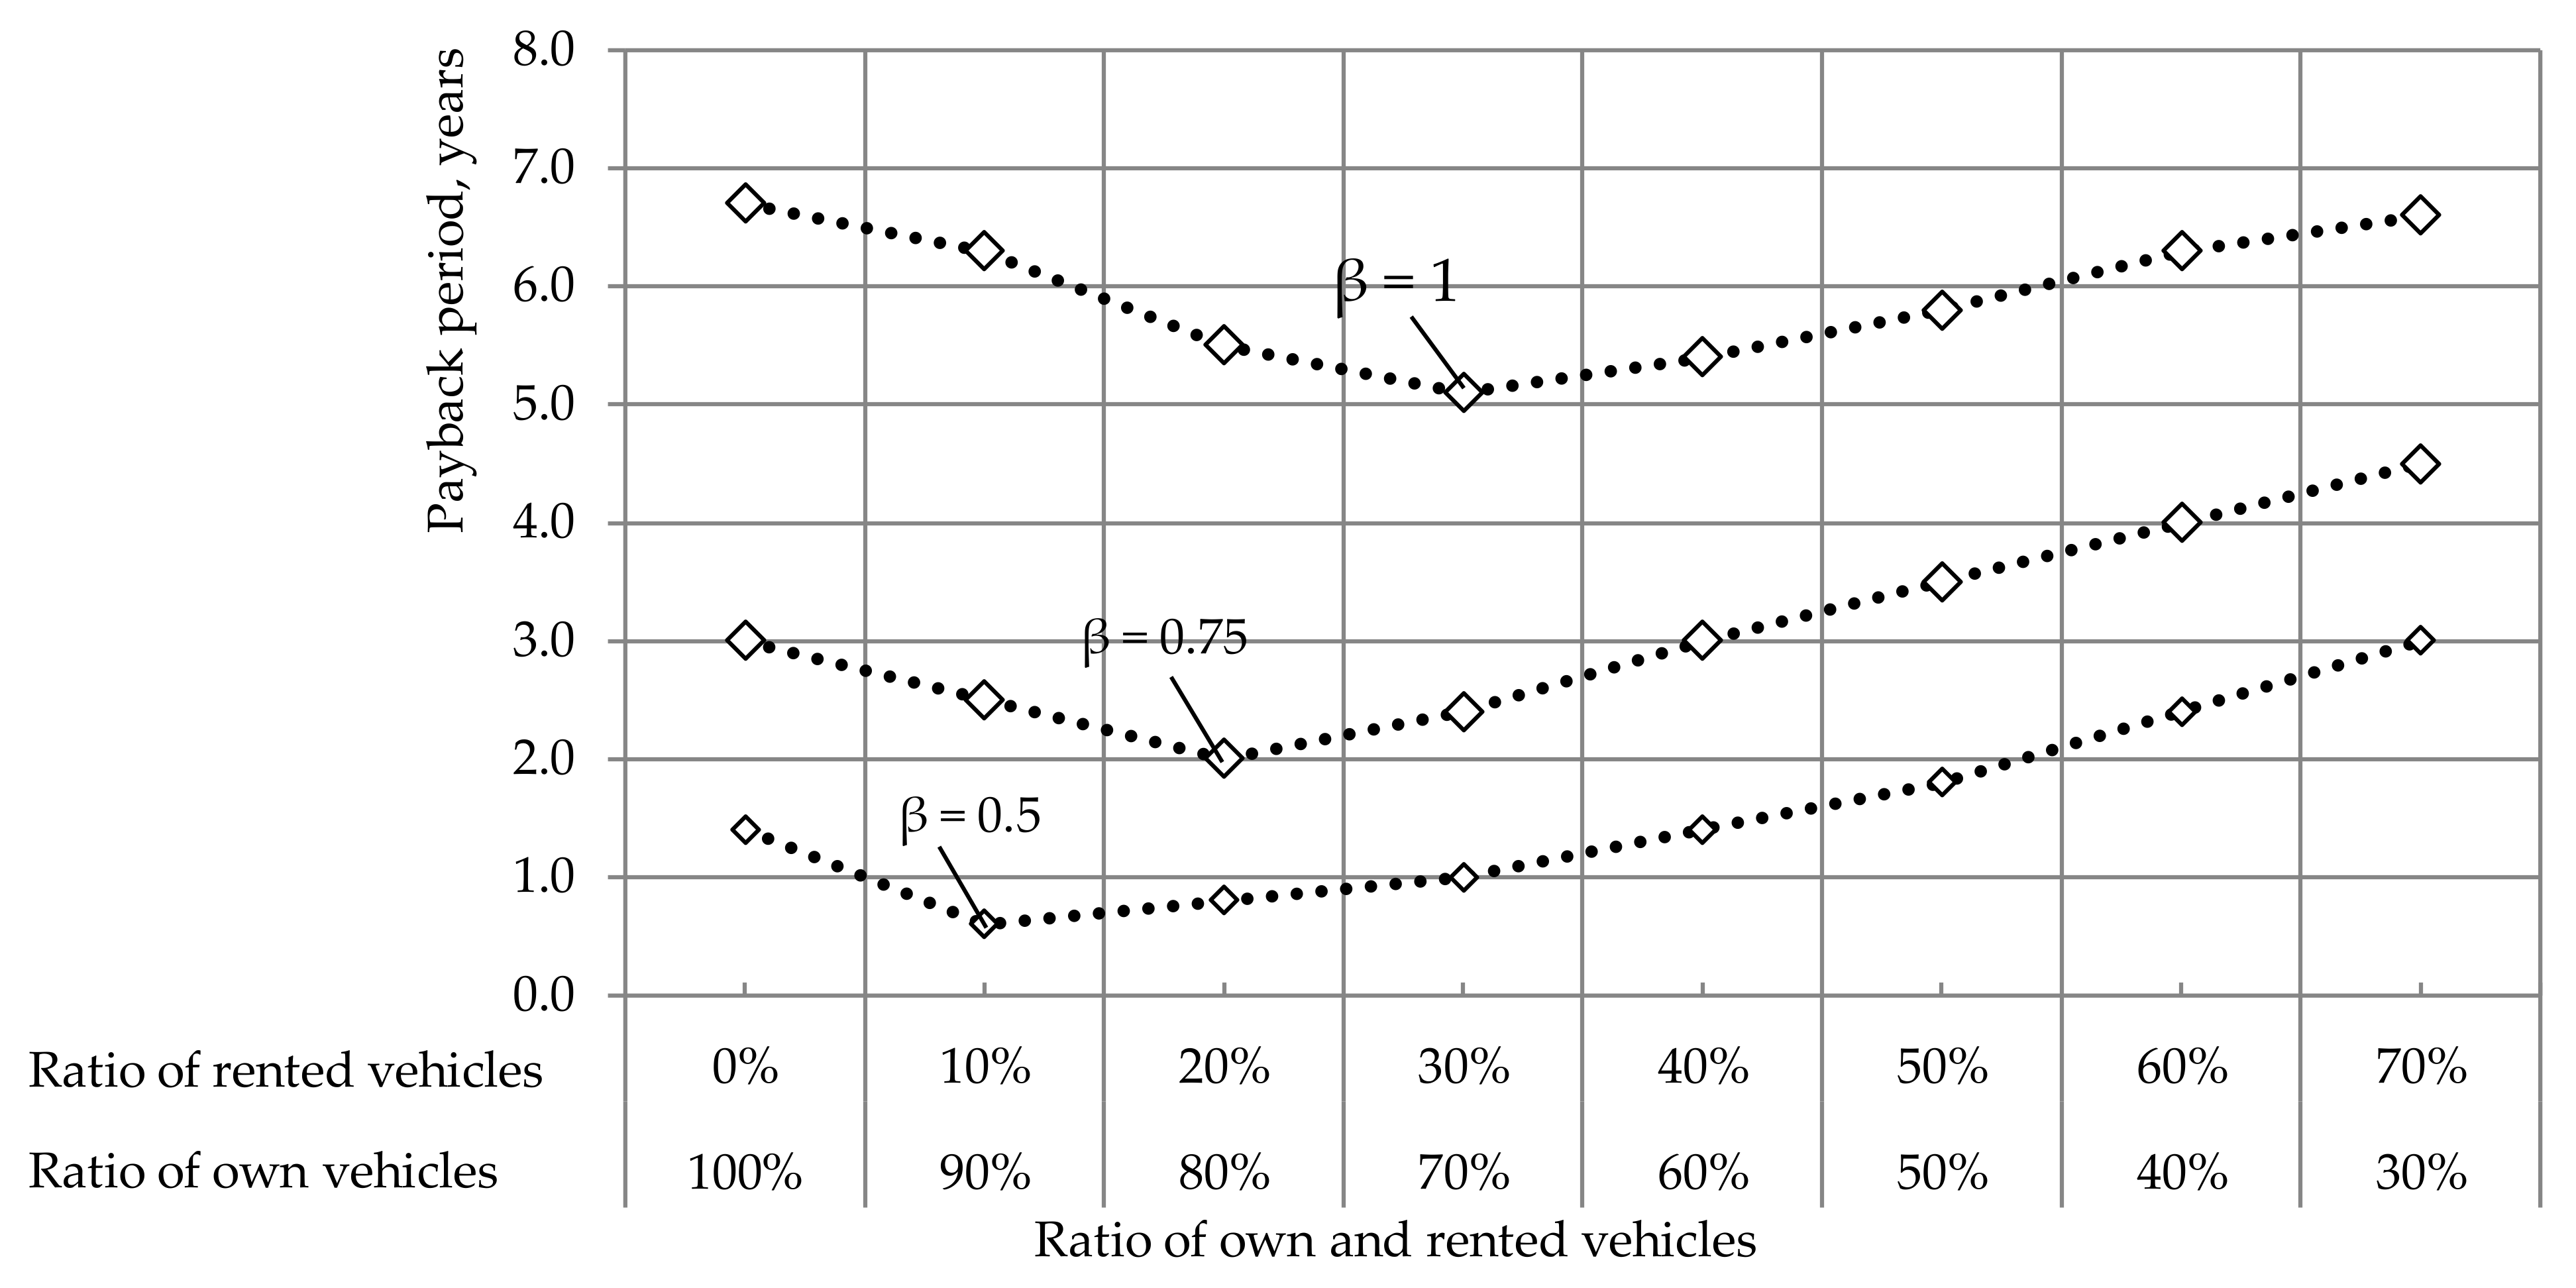
The change in net present value on the mileage utilization ratio shows that an increase in the ratio increases the investment ratio. This is due to the income of the logistics operator, which depends on the amount of mileage with the commodity that is paid.
The analysis of the obtained patterns in
Figure 9 and
Figure 10 displays directly proportional patterns of the payback period from the mileage utilization factor. The analysis of patterns allows us to draw the following conclusions:
The payback period will decrease with increasing mileage utilization. With the same ratio of the number of owned and rented road vehicles but under different operating scenarios, the payback period shows different efficiency results of the operating scenarios.
When implementing operating scenarios with a mileage utilization factor of 1, it is rational to use an equal ratio of owned and rented road vehicles. When the mileage utilization factor decreases, the rational number will increase, and the number of rented vehicles will decrease.
Operating scenario efficiency results: NPV and payback period show the same results which do not contradict each other.
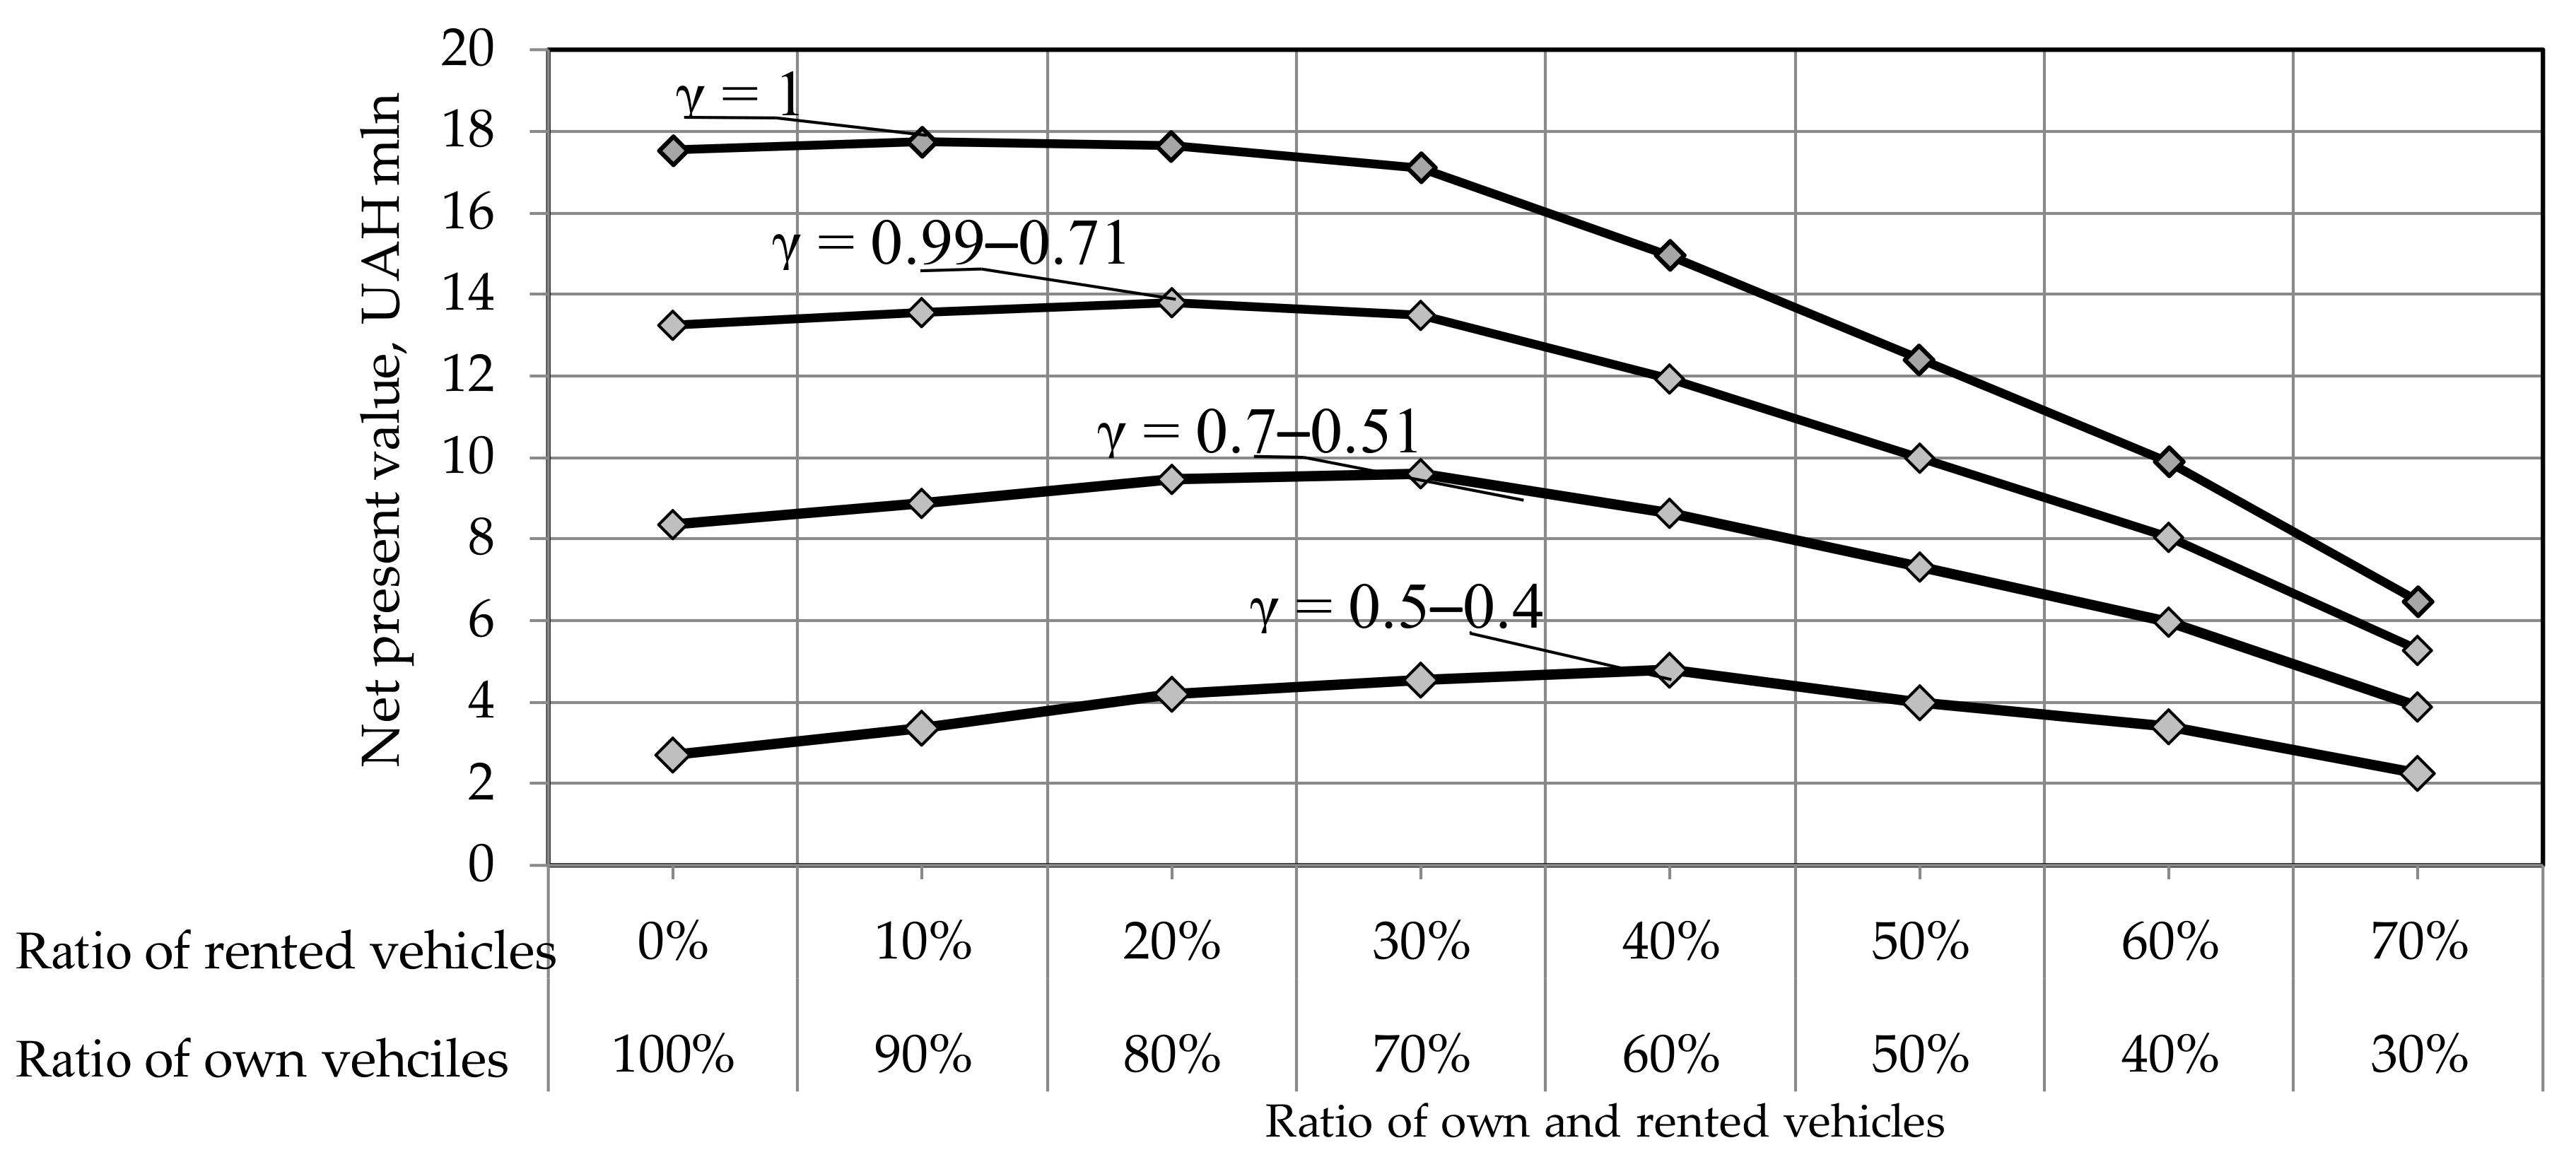
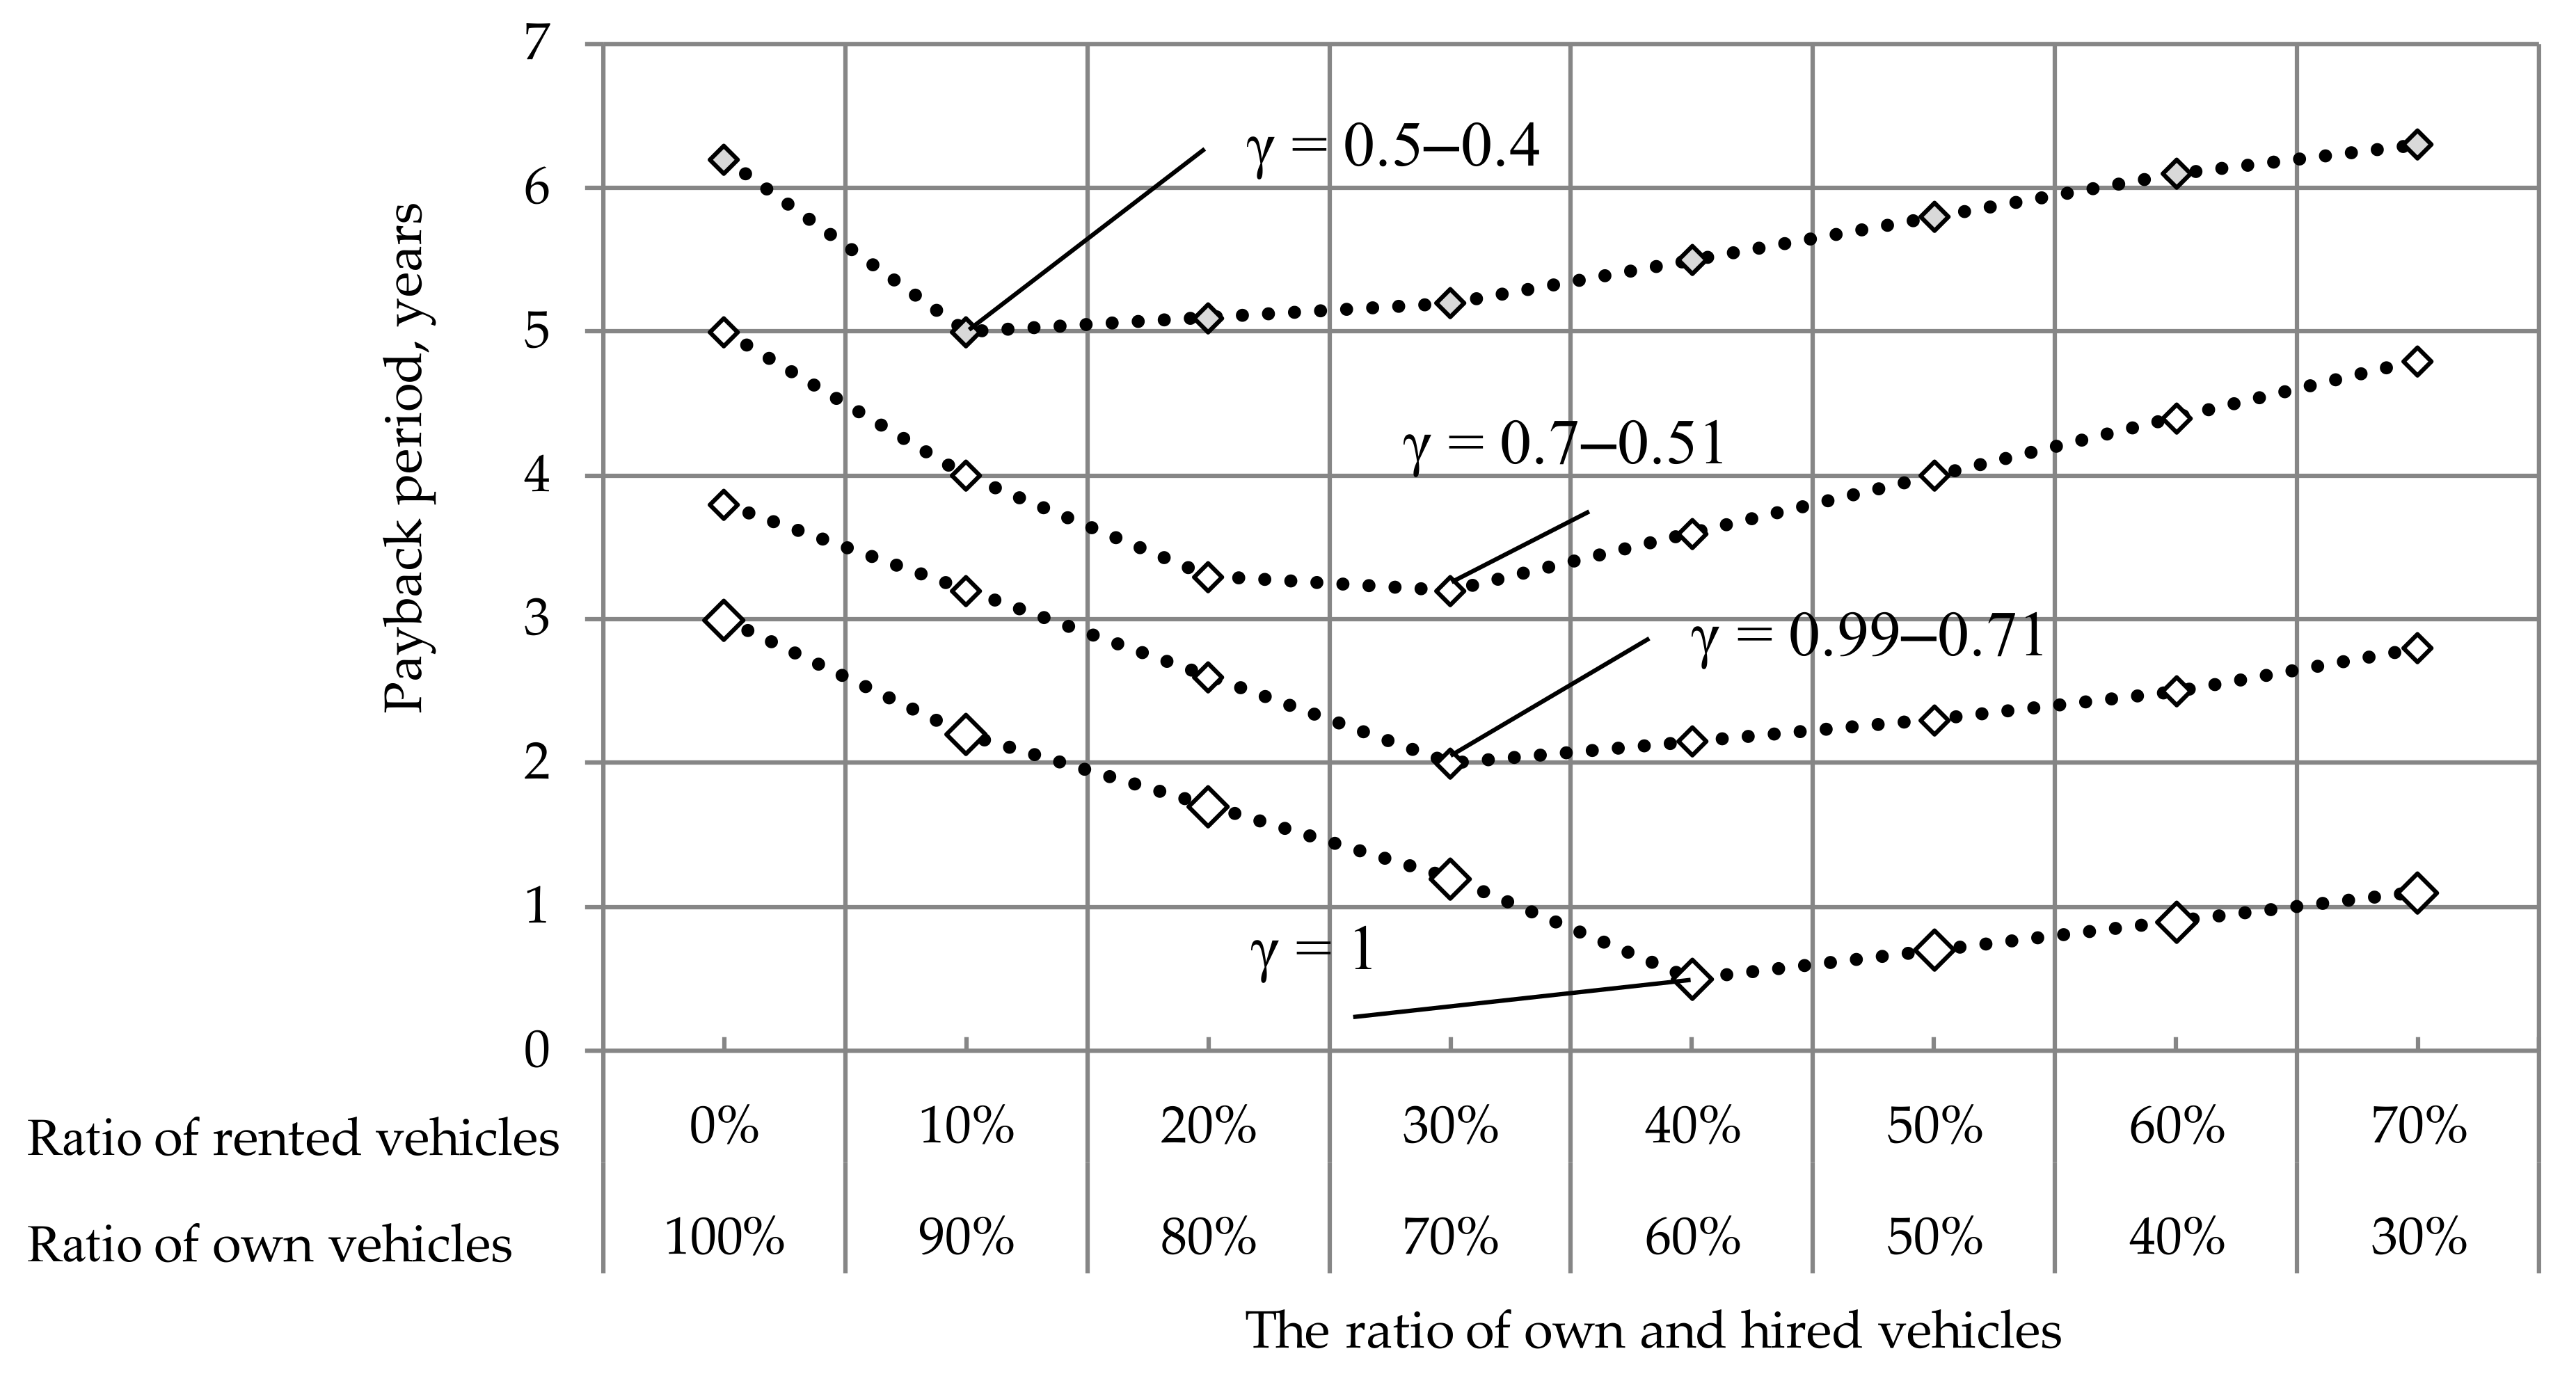
The results of transportation using out/insourcing vehicles depending on the passenger load factor, are presented in
Figure 11 and
Figure 12.
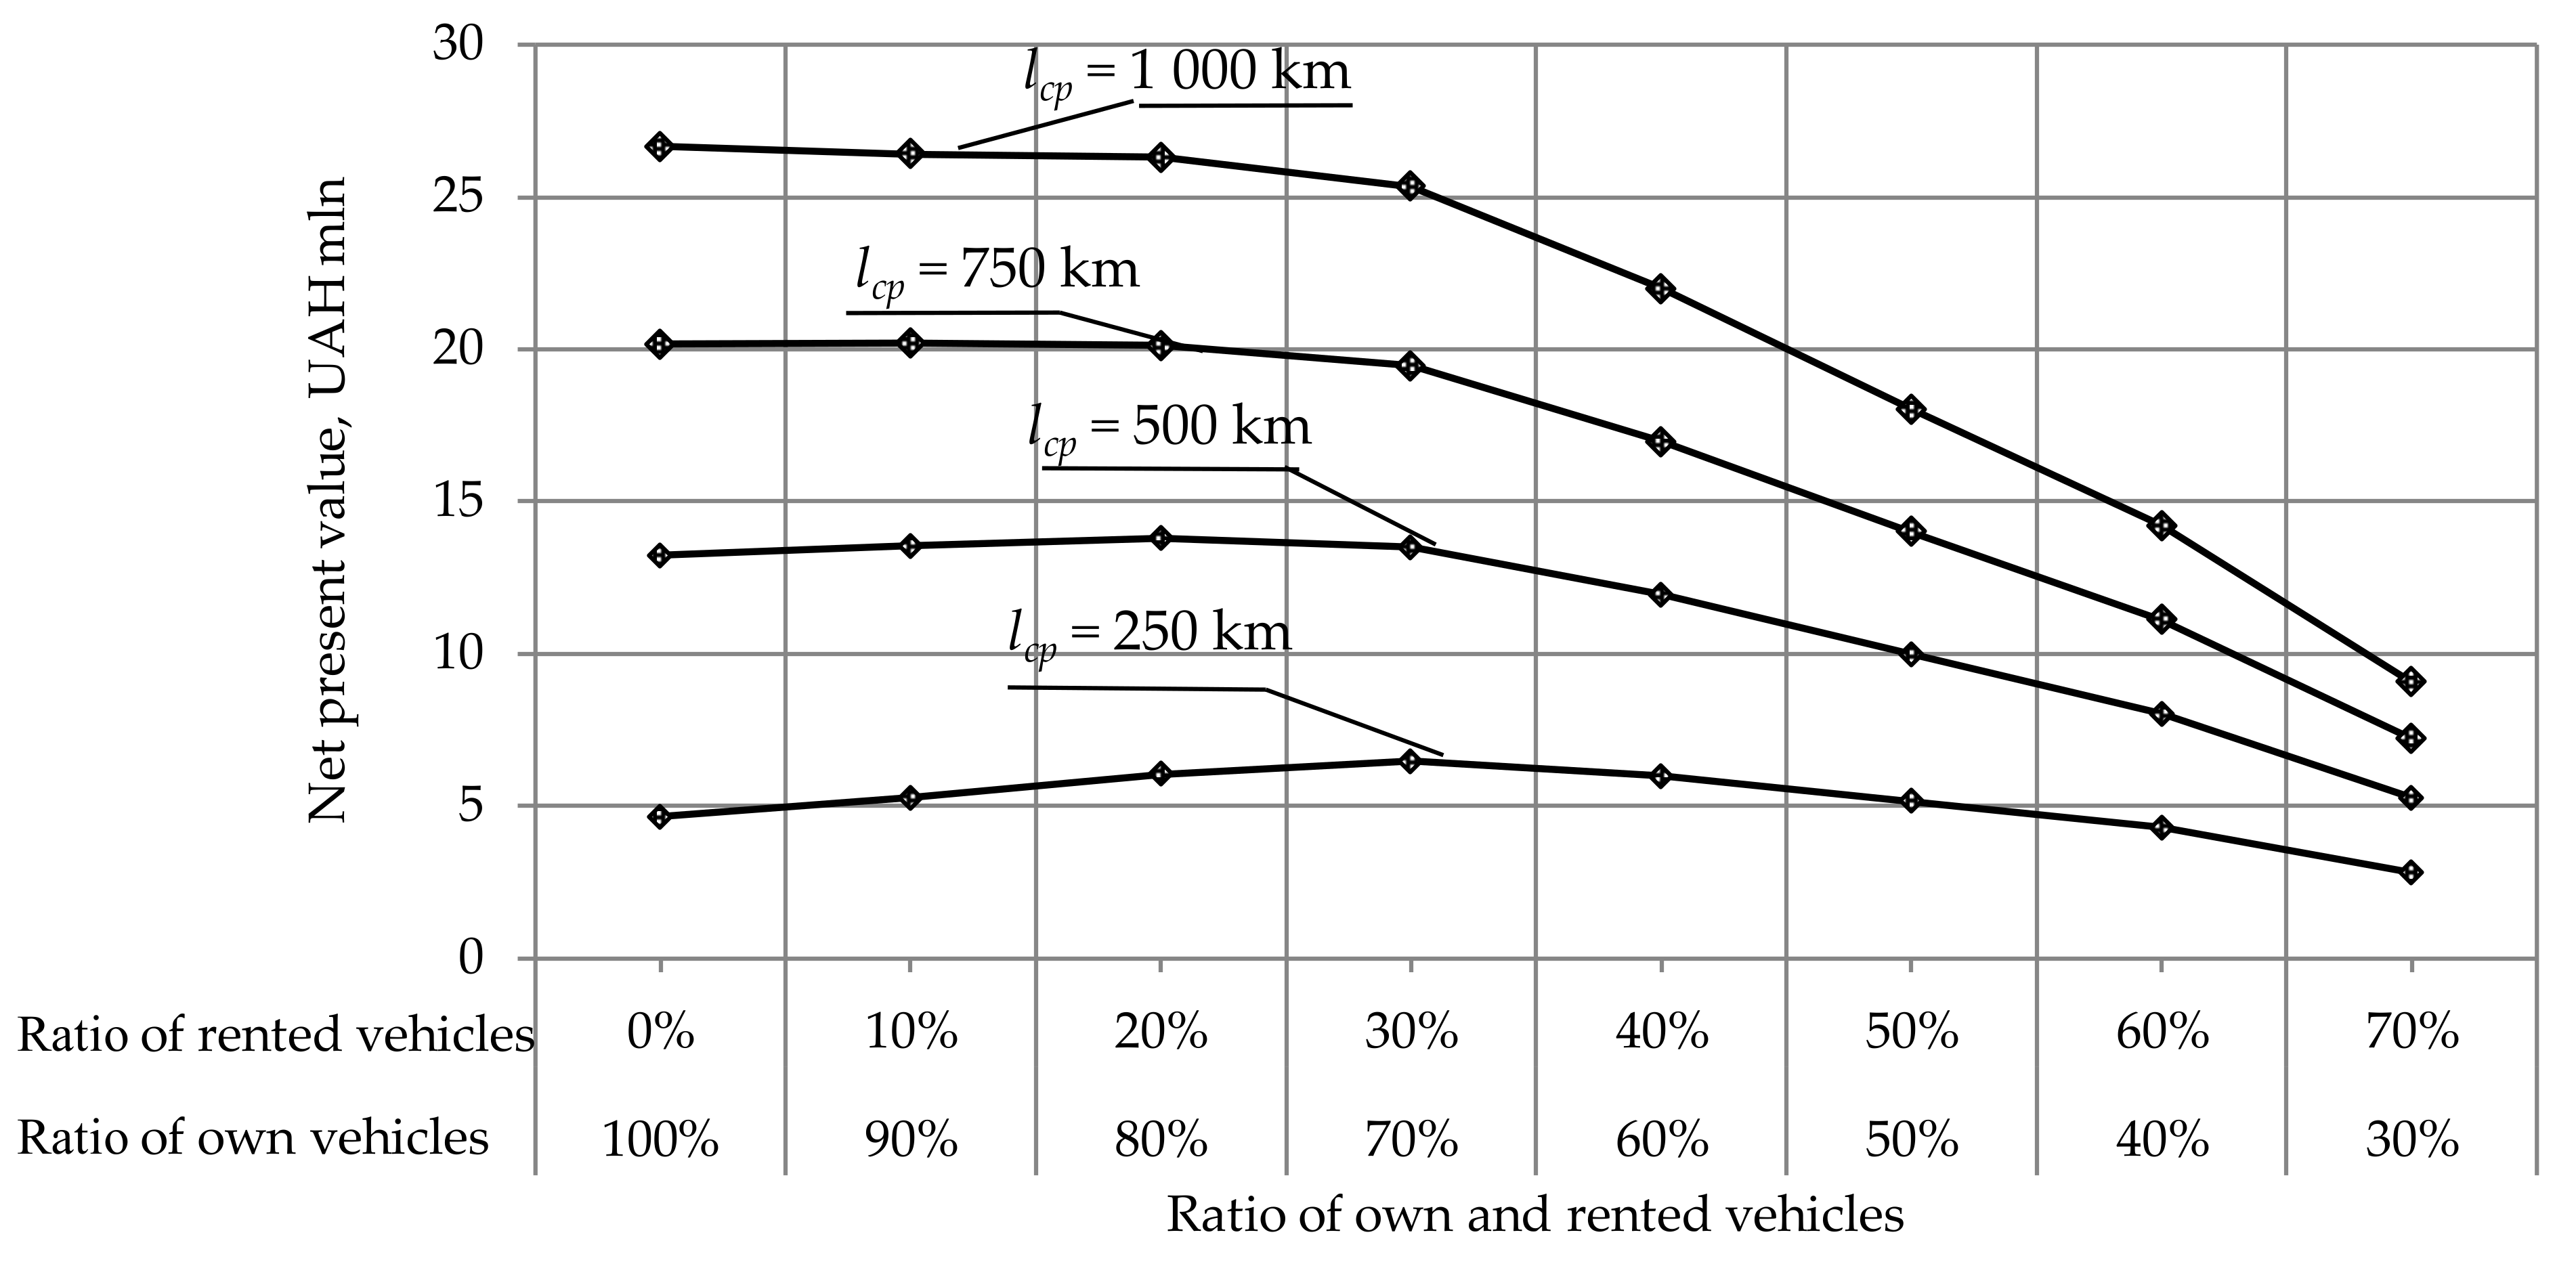
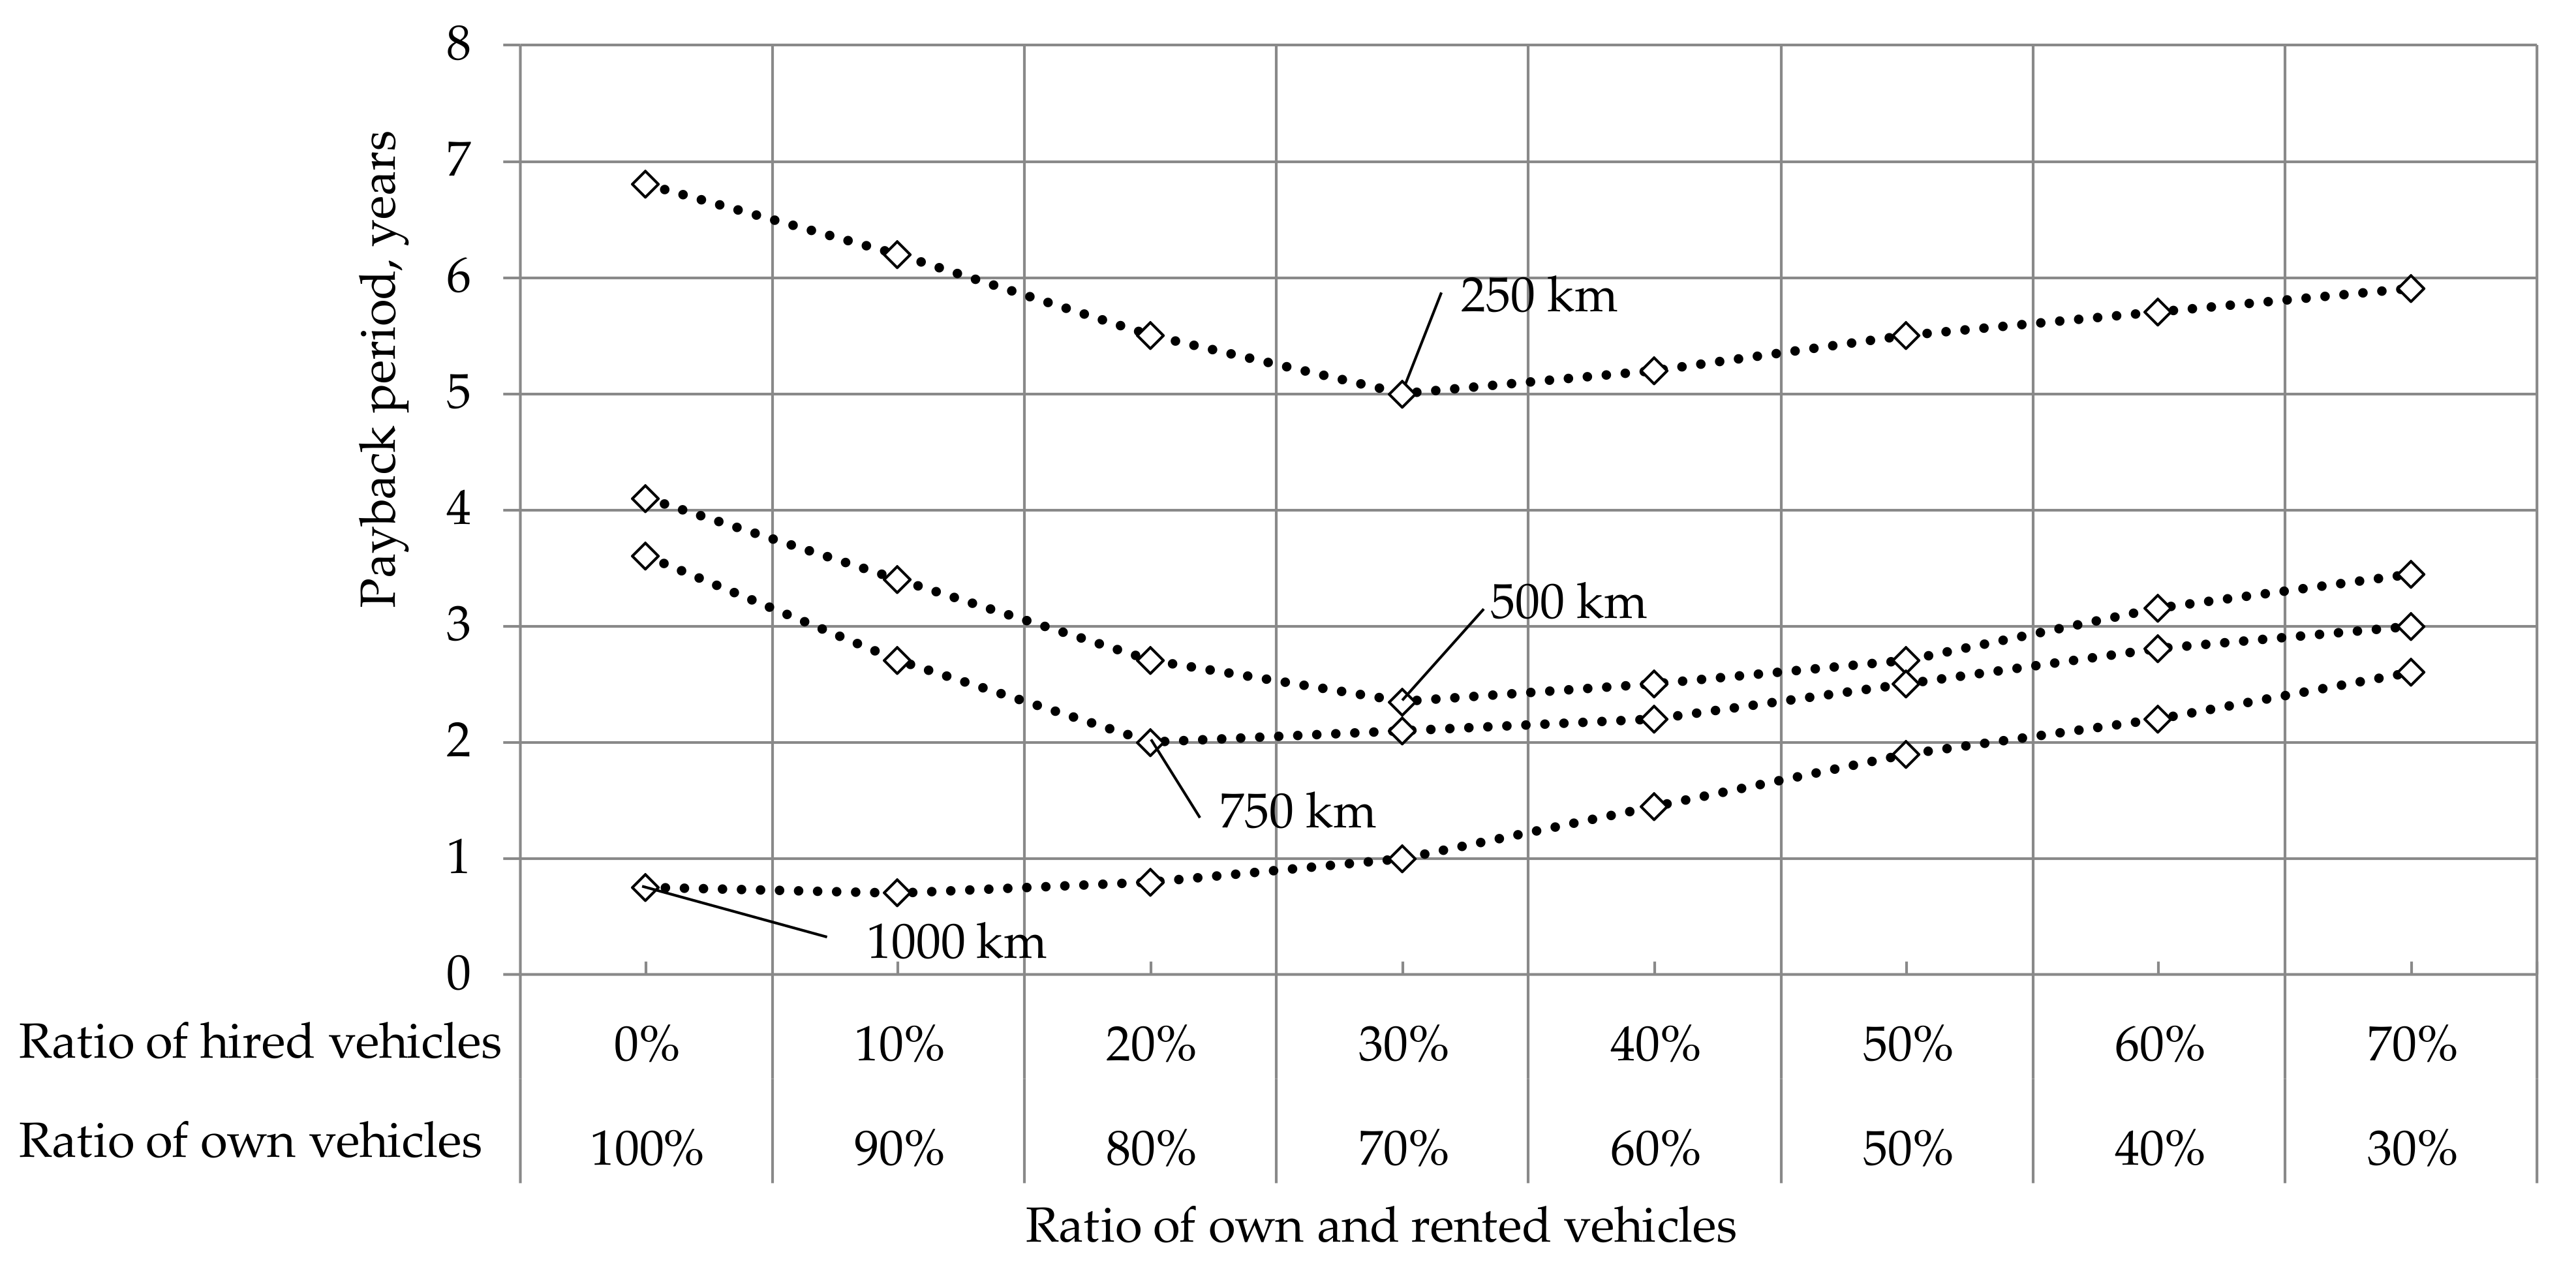
The patterns between the invest indicators and the distance of transportation are shown in
Figure 13 and
Figure 14.
The analysis of
Figure 13 and
Figure 14 showed the patterns of NPV on the average transport distance while maintaining several MF. Therefore, at a distance of 1000 km, it is rational to use all owned fleets. In the case of reducing the distance of transportation, it is advisable to attract more rented vehicles. In accordance with the simulation results, with an average distance of 250 km, the optimum ratio of fleet is 30% of rented and 70% of owned vehicles.
The analysis of the obtained regularities in
Figure 8 leads to the following conclusions:
Under an operating scenario of a transportation distance of 250 km, it is rational to use 60% of rented and 40% of owned vehicles. With an increase in the distance of transportation, it is rational to increase the number of owned vehicles, and to decrease the number of rented ones accordingly.
The same ratio of owned and rented road vehicles in the context of horizontal collaboration shows different results of the operating scenario efficiency. So, with a transportation distance of 500 km and a ratio of 70% of rented and 30% of owned vehicles, there are different patterns of the payback period depending on which product will be served by rented road vehicles.
The range of variation of indicators, at a distance of transportation of 1000 km, is between 2 to 4 years. Thus, we can say that the results of the operating scenario: NPV and payback period show the same results that do not contradict each other.
4. Conclusions
Based on a widespread analysis of contemporary research in science and best practices on the functioning of logistics operators, the fleet vehicle problem in the context of the seasonal temperature factor was established. Detailed analyses showed the importance of developing and improving mechanisms, methods, approaches of logistics activity in long-run periods of development, especially taking into consideration the seasonal change of the conditions of transportation for perishable goods which can spoil, potentially.
Analytical calculations allow for the first-time establishing effect of technological parameters on different seasons on the efficiency of logistics operators’ functioning. The proposed economic–mathematics model allows for establishing patterns of influence of the basic technical and operational indicators on investment indicators. Increasing the utilization rates of transportation, the run utilization factor, the distance of transportation increases the net present value and reduces the payback period.
The developed algorithm for finding the optimal ratio for owned and rented vehicles in the fleet vehicle problem allows for defining the optimal quantity and ratio in long-run periods of transportation contracts. The utilization both rented and owned vehicles improves the NPV and reduces PP indicators. The optimal option increases the efficiency of a logistics operator functioning at the maximum. The choice of in/outsourcing options for transporting goods affects utilization rates of transportation. The calculation showed than in case of a small value of the run utilization factor (0.4–0.5 for simple routes), more rented vehicles should be used. Increasing the value of the run utilization factor (collecting and distribution routes) will lead to changing of the optimal in/outsourcing ratio option for owned vehicles. The calculation showed that in case of a small value of the utilization rates of transportation (0.4 for low density consignments), more rented vehicles should be used. Increasing the value of the utilization rates of transportation (high density consignments) will lead to changing of the optimal in/outsourcing ratio option for owned vehicles. At a distance, up until 250 km, it is optimal to use the more rented and less owned vehicles ratio option. Increasing the distance of transportation will increase the ratio of owned vehicles, and reduce the rented ratio, respectively.
The obtained results of the evaluation of the efficiency of the transport service are considered for original logistics operators, which is typical for the market. At the same time, the real working conditions of any other carriers may be sufficiently different from those presented. The required number and ratio of owned and rented vehicles during the service of material flows largely depend on their unevenness over time. This paper considers mostly strategic planning for the logistics management of transport services and simplifies and assumes some operational tasks.


 ,
, 


 —the actual number of vehicles used for transportation during period, units;
  —minimum air temperature during the day, C°;
  —maximum air temperature during the day, C°.


