1. Introduction
At present, last-mile delivery is one of the important logistics functions that take place in commercial companies [
1]. Rational management of the last-mile plays an important role in the distribution of goods, such as its reliability, efficiency, and sustainability [
2]. The price of the product, the tools used for logistics, and the demand requirements influence the last-mile delivery methods choice, and as a result their overall efficiency [
3].
Most of the current deliveries in the EU are made by road [
4], but using only road transport for urban freight is not ideal as sustainable issues are arising from this transport mode. The urban traffic congestion, the fuel, and energy crisis, the increasing urban transportation network load, and unacceptable ecological indicators are some of the externalities caused by road transport [
5]. Transport operators of some European countries have faced a rise in demand during the pandemic and lockdown, which led to searching for new solutions for the last-mile.
Reducing the impact of negative factors is possible due to the introduction of new logistics services, such as crowdsourced delivery. In the “Sharing Economy” many new logistics initiatives arise, based on the principles of sharing resources by crowd participation [
6]. Such an example is crowdsourcing—the process of transferring some functions or logistics operations to a circle of people outside the company (external source) [
7,
8]. Crowdsourcing involves attracting people who are already traveling from points A to B, taking a package, thus creating new ad-hoc logistics networks [
9,
10]. Therefore, we consider that the concept of crowd shipping can be introduced into the delivery system of Bratislava.
However, the potential for the delivery of goods using crowd shipping technology in various respects is not yet clear. Existing methods never concentrate on gender and did not assess its influence on willingness to work as a courier. Moreover, the obtained research has been limited in estimating the maximum weight of the parcel, which courier of different genders agreed to take. The issue remains: “Who could become a crowd partner? Are there any special sociodemographic characteristics associated with potential crowd partners? What motives and factors influence them? How does gender affect the desire to be a courier? What fee do they expect?” Studies of willingness to work as an occasional courier in Bratislava have not been conducted before. Therefore, the specific objectives of this paper are:
Determine the impact of gender on the potential readiness to become a courier;
Determine the maximum weight of the parcel, agreed to be carried a courier of different gender depending on their socioeconomic characteristics and order parameters;
Determine the expected to pay value per delivery, for couriers of different genders depending on their socioeconomic characteristics and order parameters.
The paper aims to assess the potential for implementation of the crowdsourcing technology in the transport system of Bratislava. The first object of the study aims to receive information from potential customers about the type of goods and services demanded as well as their characteristics. The second object is assessing the supply and evaluates factors influencing the potential willingness of people to become occasional couriers (nonprofessional couriers) for the delivery of goods using crowd shipping technology. The gender issues will be discovered in this section. In the end, the equilibrium in the crowd shipping market in Bratislava is presented. The discussion and conclusions will close the paper. Several hypotheses can be set up: (1) the gender influence on potential readiness to become a courier; (2) the crowdsourcing technology can be effectively applied in Bratislava.
2. Literature Review
2.1. Demand Assessment
The problem of determining the demand for goods has been considered by many scholars from different perspectives [
11,
12,
13,
14,
15,
16,
17,
18]. The characteristics that affect demand are the type and the volume freight [
12], urgency and/or delivery time [
12,
17], tariffs [
12,
13], the need for storage of goods [
13], and the size of the territory being served [
14,
15]. Several publications analyze the demand for crowdsourcing services from the behavioral characteristics and preferences of consumers in different contexts, as well as their willingness to use crowdsourcing services and options [
16,
19]. For example, in [
19], the authors modeled the demand for crowdsourcing services for different products in two ways, namely maximizing random utility and minimizing accidental regret. The study found that the performance of the two approaches is not very different.
However, as expected, peripheral products (such as food products and instant foods) are more likely to be delivered via crowdsourcing delivery services. It should also be noted that medicines are delivered both through crowdsourcing and through urban transport logistics. Another study [
20] looks at consumer openness to crowdsourcing services. The behavior and benefits of possible couriers in crowdsourcing deliveries were significant depending on the distance of the trip, as well as the following aspects: speed, real-time tracking (local delivery), service options, and driver experience (medium and long-distance) [
21]. For comparison, “package size”, “delivery distance”, “frequency and distribution of demand”, “middle-aged customers” (i.e., 35–44 years old) and pricing strategies have significantly affected successful deliveries [
22], as well as “concern for society”, “price” had a significant impact on the behavior of the recipients [
23].
Most studies focus their attention on demand modeling. Thus, based on demand modeling, T. Bjørner conducted an empirical analysis of freight traffic in Denmark using a cointegration vector regression system, and based on the demand estimation found: transport volumes (measured in km), the distance between the supplier and the place of production and prices for transport services [
21]. M. Kulshreshtha and V. Nag also used cointegration vector autoregressive (VAR) models to model demand for passenger and freight transport in India [
22]. R. Ramanathan used a cointegration vector regression system to model the demand for passenger and freight in India [
23]. S. Shen, T. Fowkes, T. Whiteing and D. Johnson investigated the UK freight demand in more detail using six econometric models [
24]: the traditional ordinary least squares (OLS) regression model, the partial adjustment (PA) model, the reduced autoregression model with distributed delay (ReADM), VAR, a time-varying model (TVP), and a structural time series model. The analysis presented in this study is based on annual data on demand for road and rail transport in the UK at both aggregate and product groups levels over a given period [
25]. Exploring China’s transportation system, C. Cherry’s [
26] demand assessment is based on factors such as access to goods, quality and capacity of roads, alternative modes of transport, and the possibility of introducing fares.
2.2. Supply Assessment
Population growth and its urbanization, the rapid development of e-commerce, and the proliferation of fast delivery options require innovative solutions and business models to ensure the economic, environmental, and social transportation of goods. Understanding the demand for new types of services, such as crowdsourcing are emerging around the world: AmazonFlex, Uber, Blablacar, AirBNB, Wolt, Bringo, Postmaters, UberRush, Roadie, TringTring, Beelivery, Passenger.me [
13]. The development of these services promotes the advanced integration of ITS, smart infrastructure, technologies, and people which represents new trends in sustainable transport development today [
27]. Mixed passenger/freight transport systems have been innovative approaches to urban mobility [
28], which are linked to the sharing economy [
27,
28,
29] and the common smart city paradigms [
30].
An important aspect of assessing the crowd shipping supply is the study of the behavior of occasional couriers. Similar studies have previously been conducted to determine people’s interest in being nonprofessional couriers. Thus, the maximum willingness to work as crowd-shippers [
21], expected pay value per delivery [
31], and travel time tolerance issues [
32] were studied. The potential readiness of people to be couriers was studied using survey methods [
31,
33], regression and correlation analysis [
12,
32] interviews [
34], modeling [
35,
36,
37]. Analysis of methods used in crowd shipping is presented in
Table 1.
The references review shows the influence of the sociodemographic characteristics (age, sex, race, income, and level of education) of nonprofessional couriers on the decision to participate in the mass transportation market. Thus, about 50% of respondents of different gender want to be occasional couriers for a certain amount of money [
36]. Couriers were interested in supporting the environment [
39], as well as reducing the impact on public transport in the city [
42]. The benchmark solutions for crowd shipping help to adjust the business model and market offer of other providers to the needs of different groups of stakeholders [
38].
When using interview and survey methods, frequently asked questions include willingness to become a courier [
44,
45], route [
34], the amount of remuneration for work performed [
37], the maximum deviation (both in time and distance) that the respondent would take for consent and rejection of the package [
19,
35].
3. Case Study
In the fall of 2019, in Old Town, Bratislava, a field survey was conducted to find out the terms of delivery for merchants, namely questioning. The Old Town is a pedestrianized area, relatively small and virtually all of Bratislava’s main attractions are located right there: on the left bank of the Danube, between the Old and New Bridges.
To obtain the initial data necessary to determine the gravity function between the areas of application of labor and residence, field surveys were conducted. In total, 94 retailers located in the central part of Bratislava participated in the survey (
Table 2).
During the questioning the following information was recorded: time and frequency of delivery, the price for delivery, volume of goods, type of cargo. The total number of respondents amounted to 46 people. The processing of questionnaires consisted of identifying the amount of demand in retail outlets located in this part of the city. These districts were formed according to workers’ places of residence and their use of labor. Using this scheme, the average distance of the districts from the geographical center of the city was determined, and the distance to the area of application of labor.
Figure 1 shows the stores according to their order numbers.
The questionnaire was filled out in the presence of interviewers, who provided explanations to the questions if needed. A questionnaire contains the following questions:
What kind of goods do you sell?
How often do you use your car to deliver goods to your store?
Why do you use your car?
What is the average volume of imports in kg (m3)?
What is the maximum amount you are willing to pay for the delivery of goods? (EUR/delivery)
How often do you need fast delivery during the week? (within 1–3 h)
Can you wait until the next day to deliver the goods and still deliver at a reduced price?
Are you interested in extra storage space within a 5–10 min walk? (within the historic center)
What storage space do you need for a week?
What are the maximum costs you have to pay for 1 m3 (EUR/m3)?
Do you use perishable goods?
What do you think about the use of public transport, electric transport for cargo delivery?
What time of day is right for you?
The crowd can be divided into two groups, the customers who will use the services and pay for them, couriers, provide an active role to deliver the parcel and earn the money. Here, in the paper, the demand for services in the historical city of Bratislava would be assessed. The main object of the survey was to know what the population in this area could think about crowd-shipping.
The second part of the research is devoted to assessing the supply to meet the demand. A survey of the willingness of ordinary travelers to work as an occasional courier was made. To understand the influence of sociodemographic characteristics of nonprofessional couriers (age, gender, gender, income, travel time) on the load capacity of the courier-traveler, a questionnaire was developed:
Place of residence (territorial location, origin) __________________________
Place of work, study (territorial location, destination)____________________
Do you cross the city center (old town) when moving (underline): Yes _No _.
Travel start time (morning/evening) (specify as a fraction) ________________________
End time of the trip (morning/evening) (specify in fractions) _______________________
Do you agree or do you have such an opportunity to transfer the parcel from the area of your residence to the area of work, study, etc., or vice versa? Yes or No
For what minimum amount did you agree to transfer the accompanying parcel? (underline the answer): up to EUR 1 (fare); EUR 1–2; EUR 2–5; EUR 5–10; more than EUR 10.
Your average monthly income per family member, Euro _________:
Your age __ 10. Gender __
What is the maximum weight of the parcel you agree to take ___ kg.
4. Research Result
4.1. Demand Data Analysis
According to the results of the study, 46 questionnaires were collected from 94 stores, which is 49% of the total number of responses.
The parameters of the study area were selected and calculated using the methodology given in [
19,
20,
21,
22]. The data obtained are presented in
Table 1.
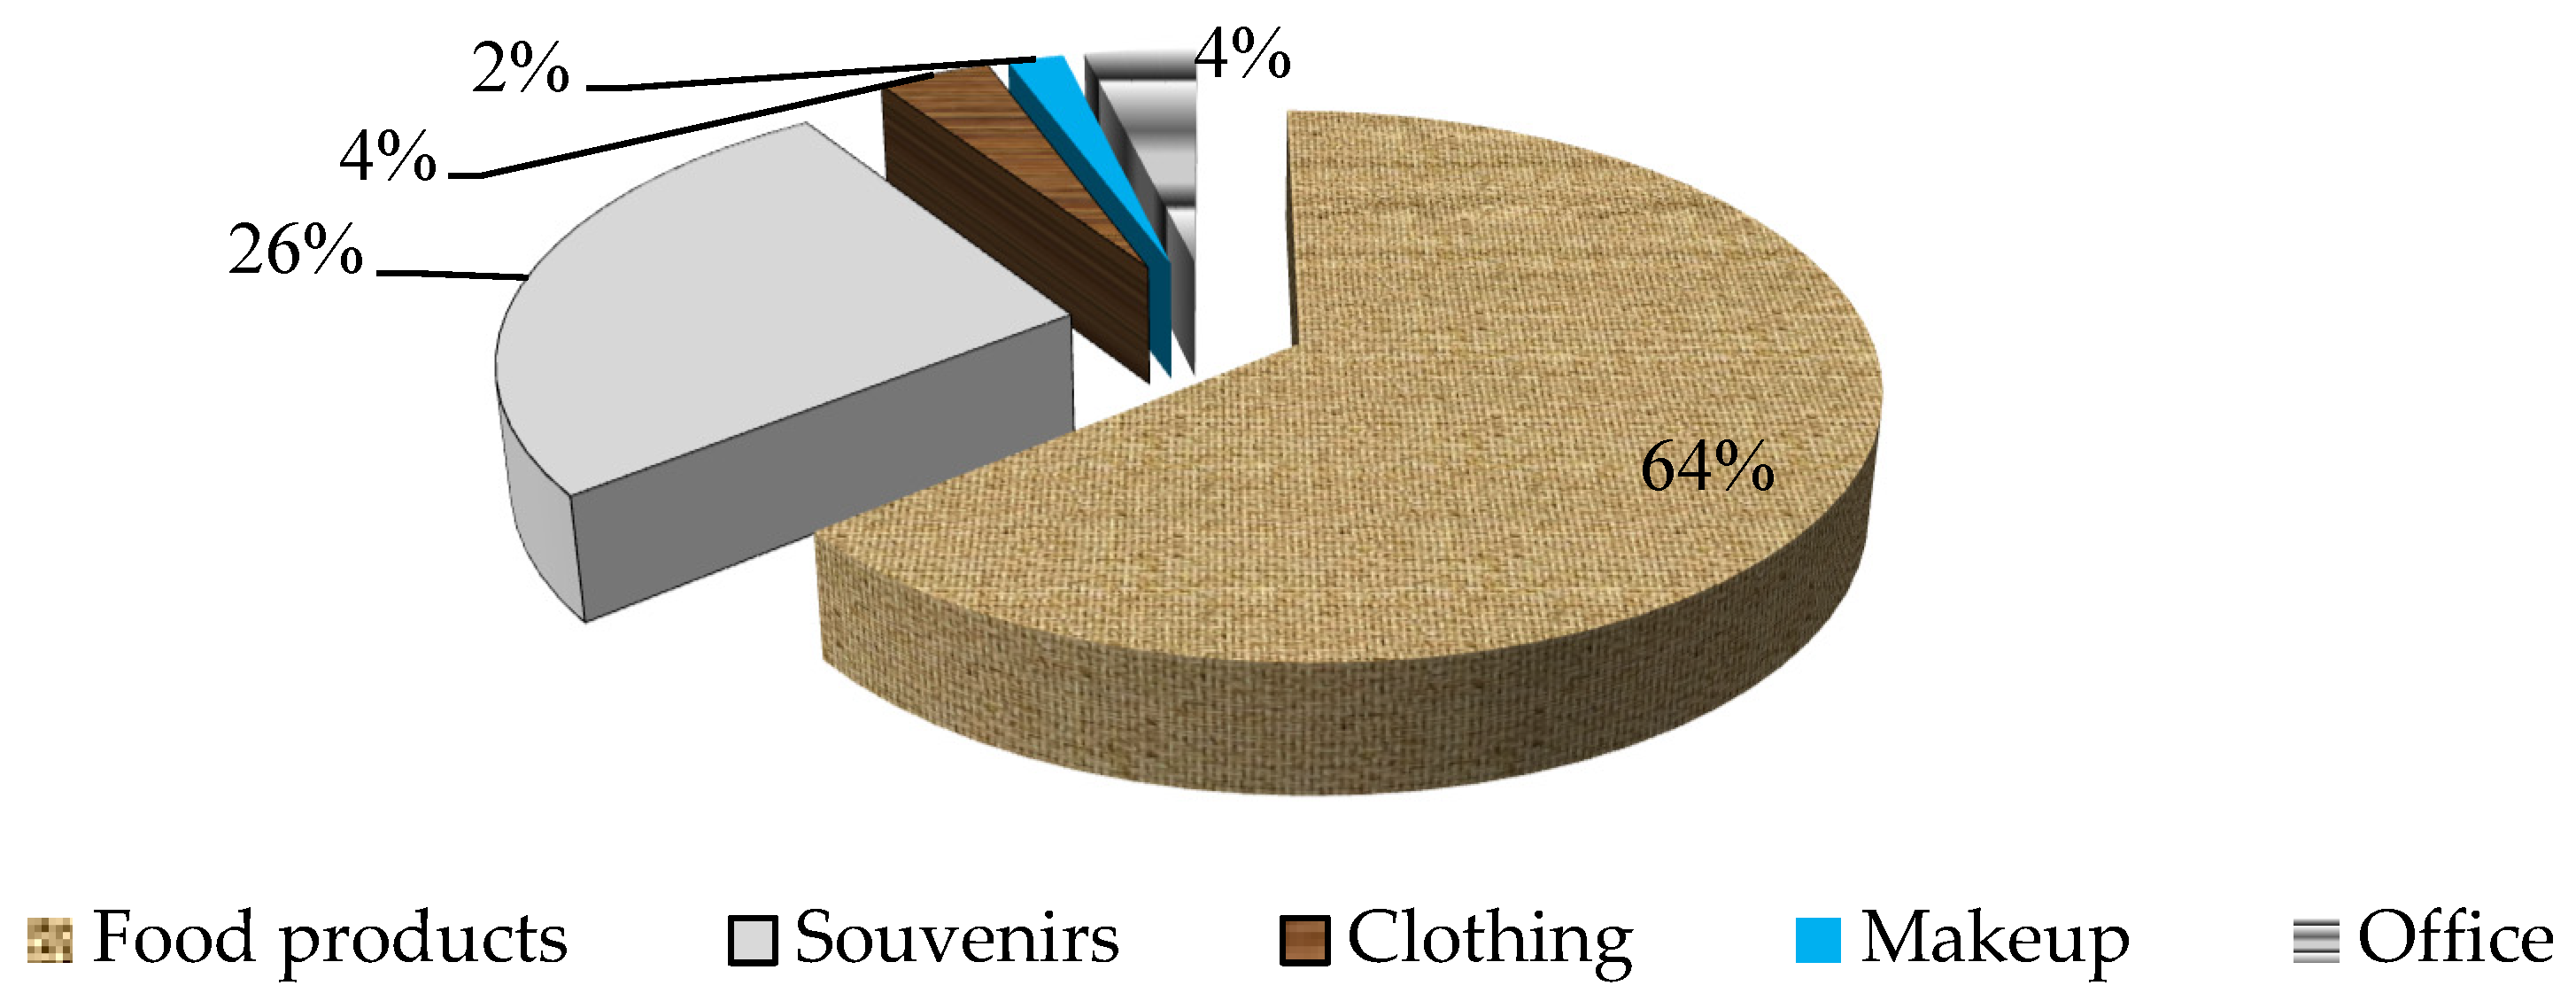
Figure 2 shows the distribution of retailers by type among those who participated in the survey. According to results 64% of the goods are from the food industry and have special requirements for transportation and storage of perishable goods. In total, 26% are fragile goods that also require packaging and manual handling of goods.
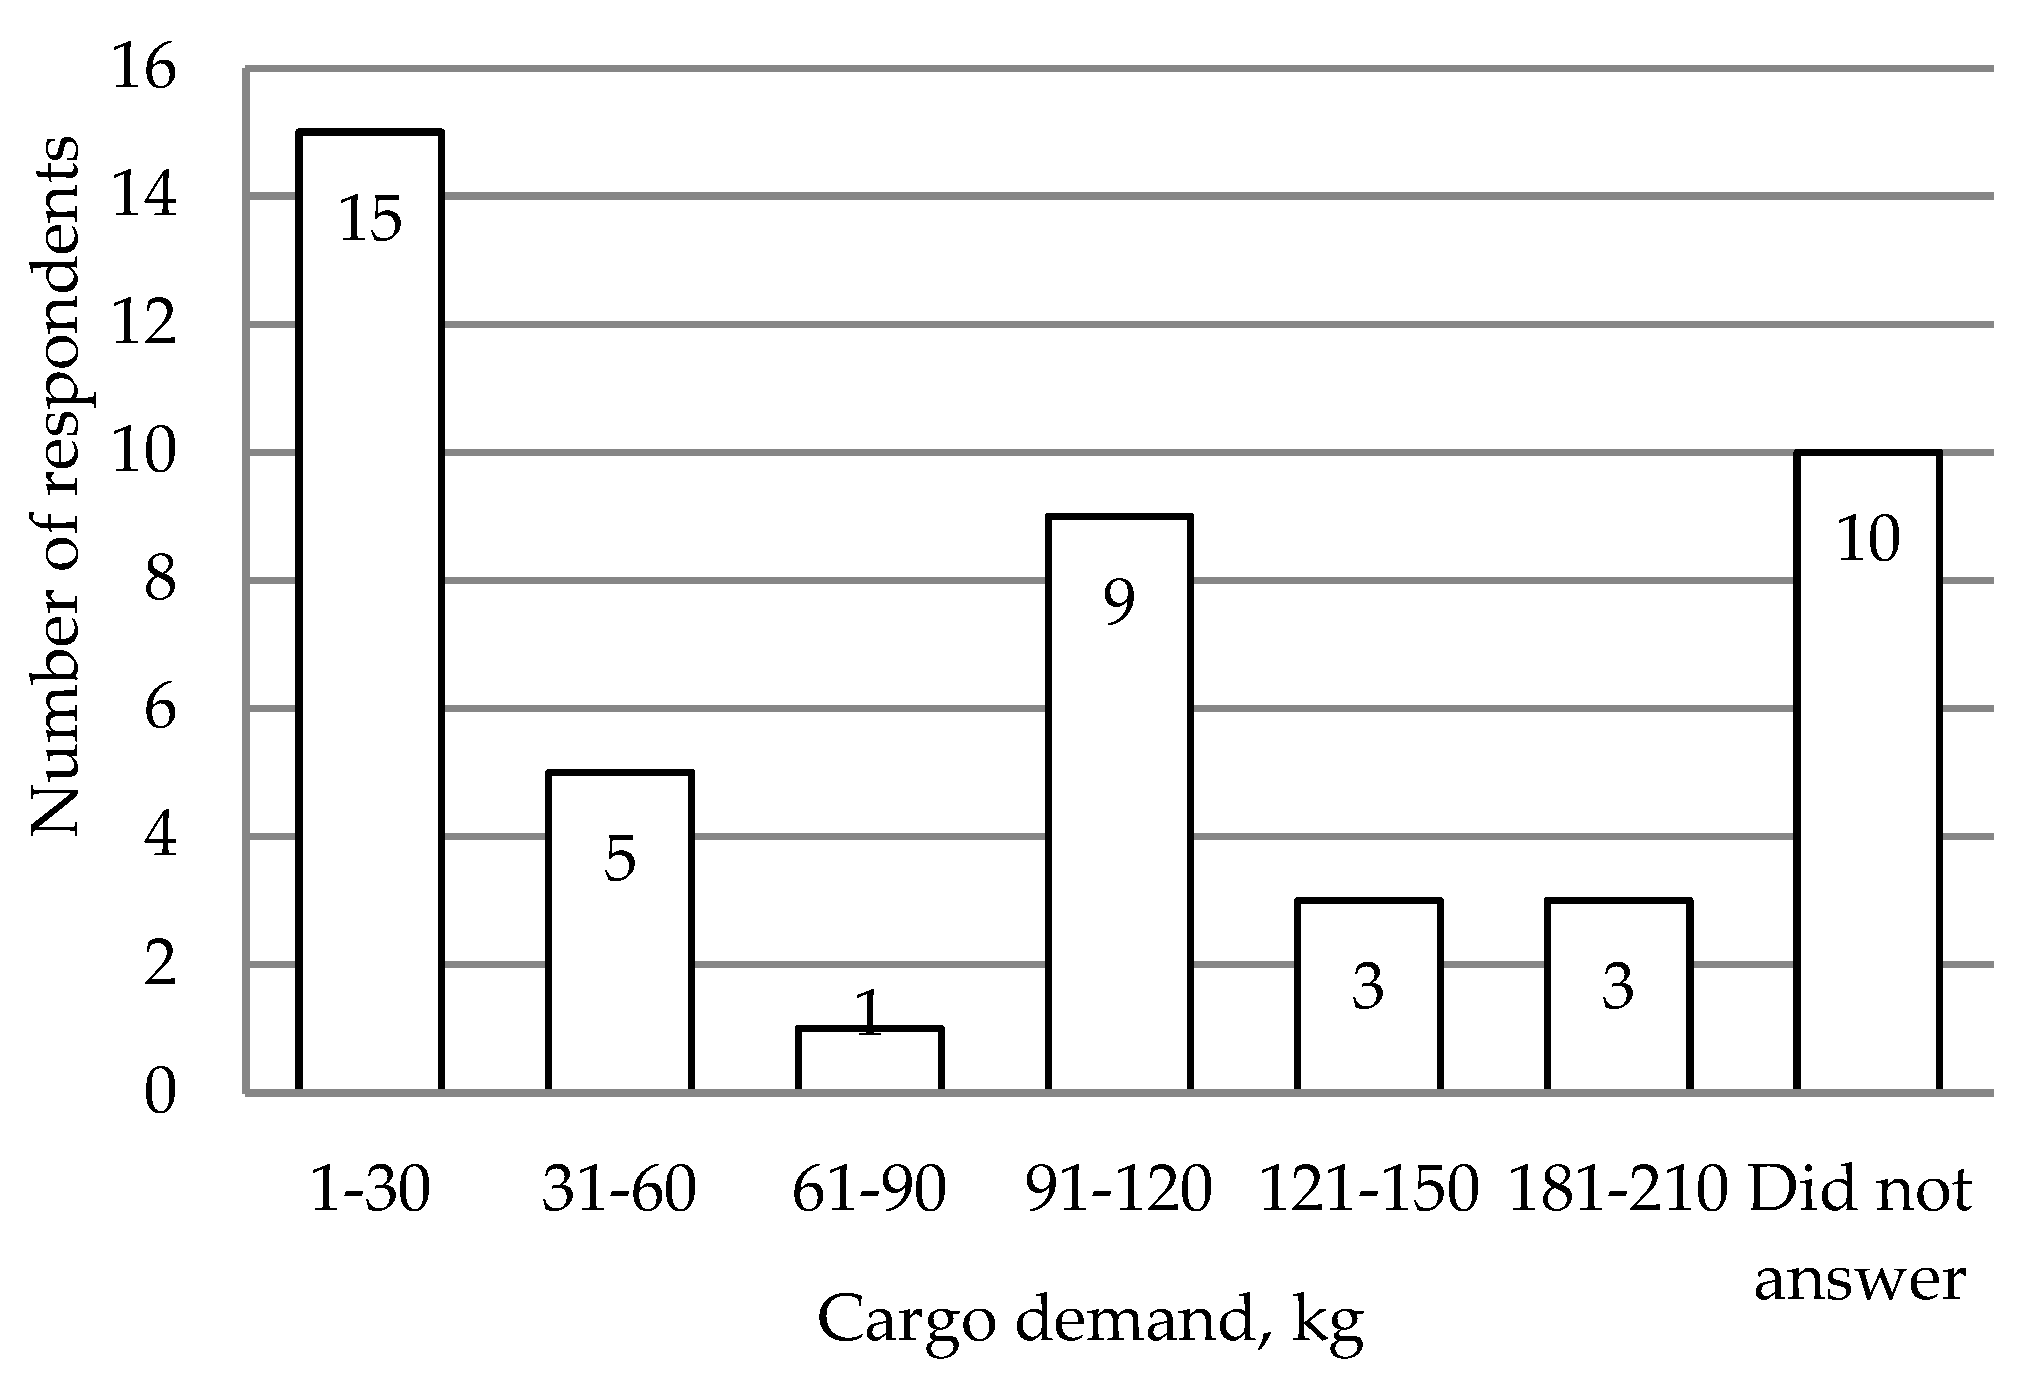
In the process of questioning, we received data on everyday demand (
Figure 3). According to the data obtained, the delivery volumes in most of the surveyed stores do not exceed 30 kg–32%; 10 (22%) respondents refused to answer this question, thus we took into account only that it varies from the day of the week; 46% of respondents distribute delivery demand between options from 31 to 210 ton. Larger cargoes require the use of a vehicle or special mechanical means—a wheelbarrow or another, and, if possible, the use of crowdsourcing. A weight of more than 31 kg requires the use of a vehicle. It is necessary to consider each variant and type of cargo, to say for sure whether crowdsourcing or traditional delivery must be used.
According to
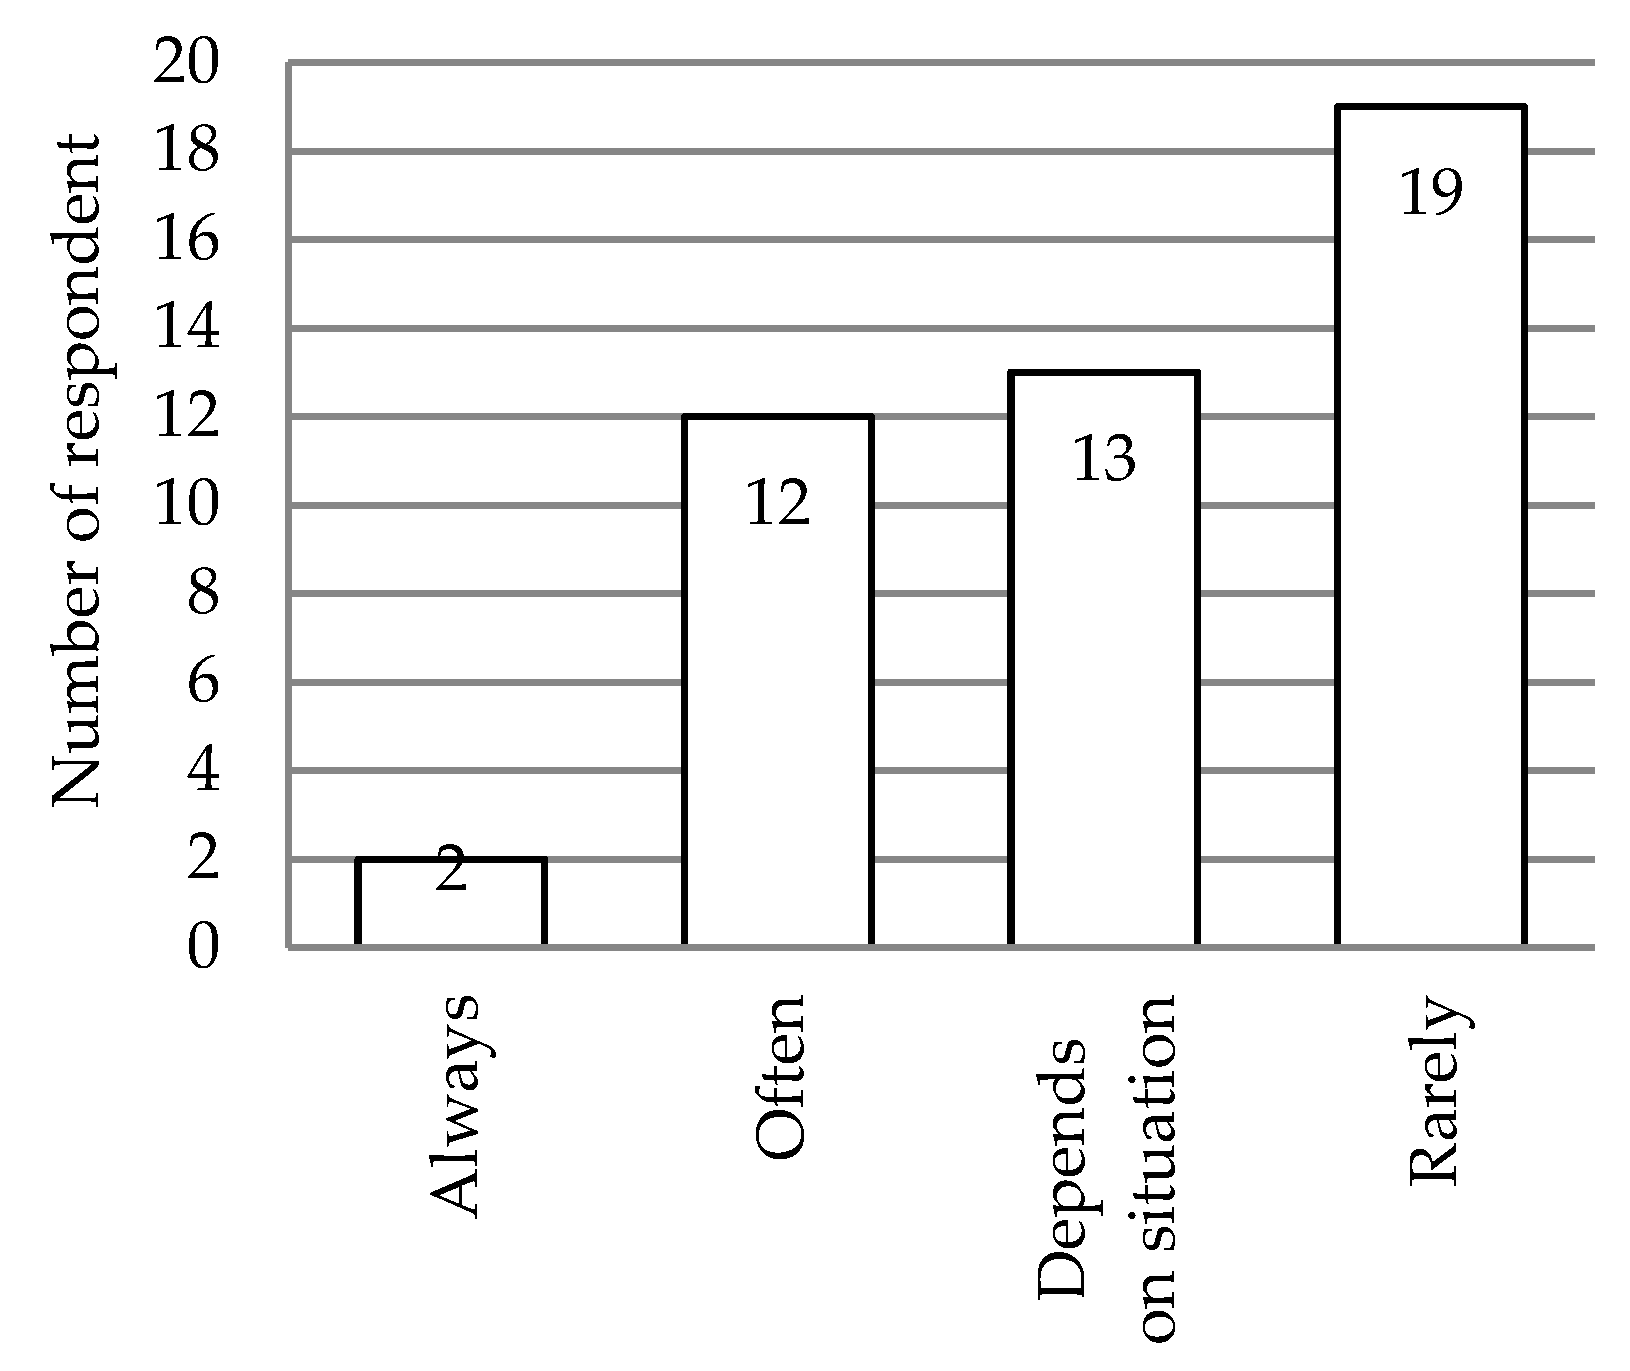
Figure 4, 4% of respondents always use their car for delivery, 28% depending on the situation, 26% often, which in total is more than 50% from all collected data. In this area several logistics operators are operating, which provide quality door-to-door delivery service. Therefore, most retailers request this service in this area.
Due to the existing tariffs for just-in-time delivery, delivery schedules, and timetable of the retailers (45% of retailers working hours from 11 a.m. till 4 p.m.), retailers use their own-account transport for the delivery of goods (
Figure 4). Simultaneously, the answer “rarely” got the highest response rate, more than 40%. Such an answer may be associated with a sufficiently large batch of delivery, which cannot be brought by own-account transport. This result explains the data obtained in
Figure 3. A supply of more than 91 kg is needed by more than 20 stores, which is more than 50% of the respondents surveyed.
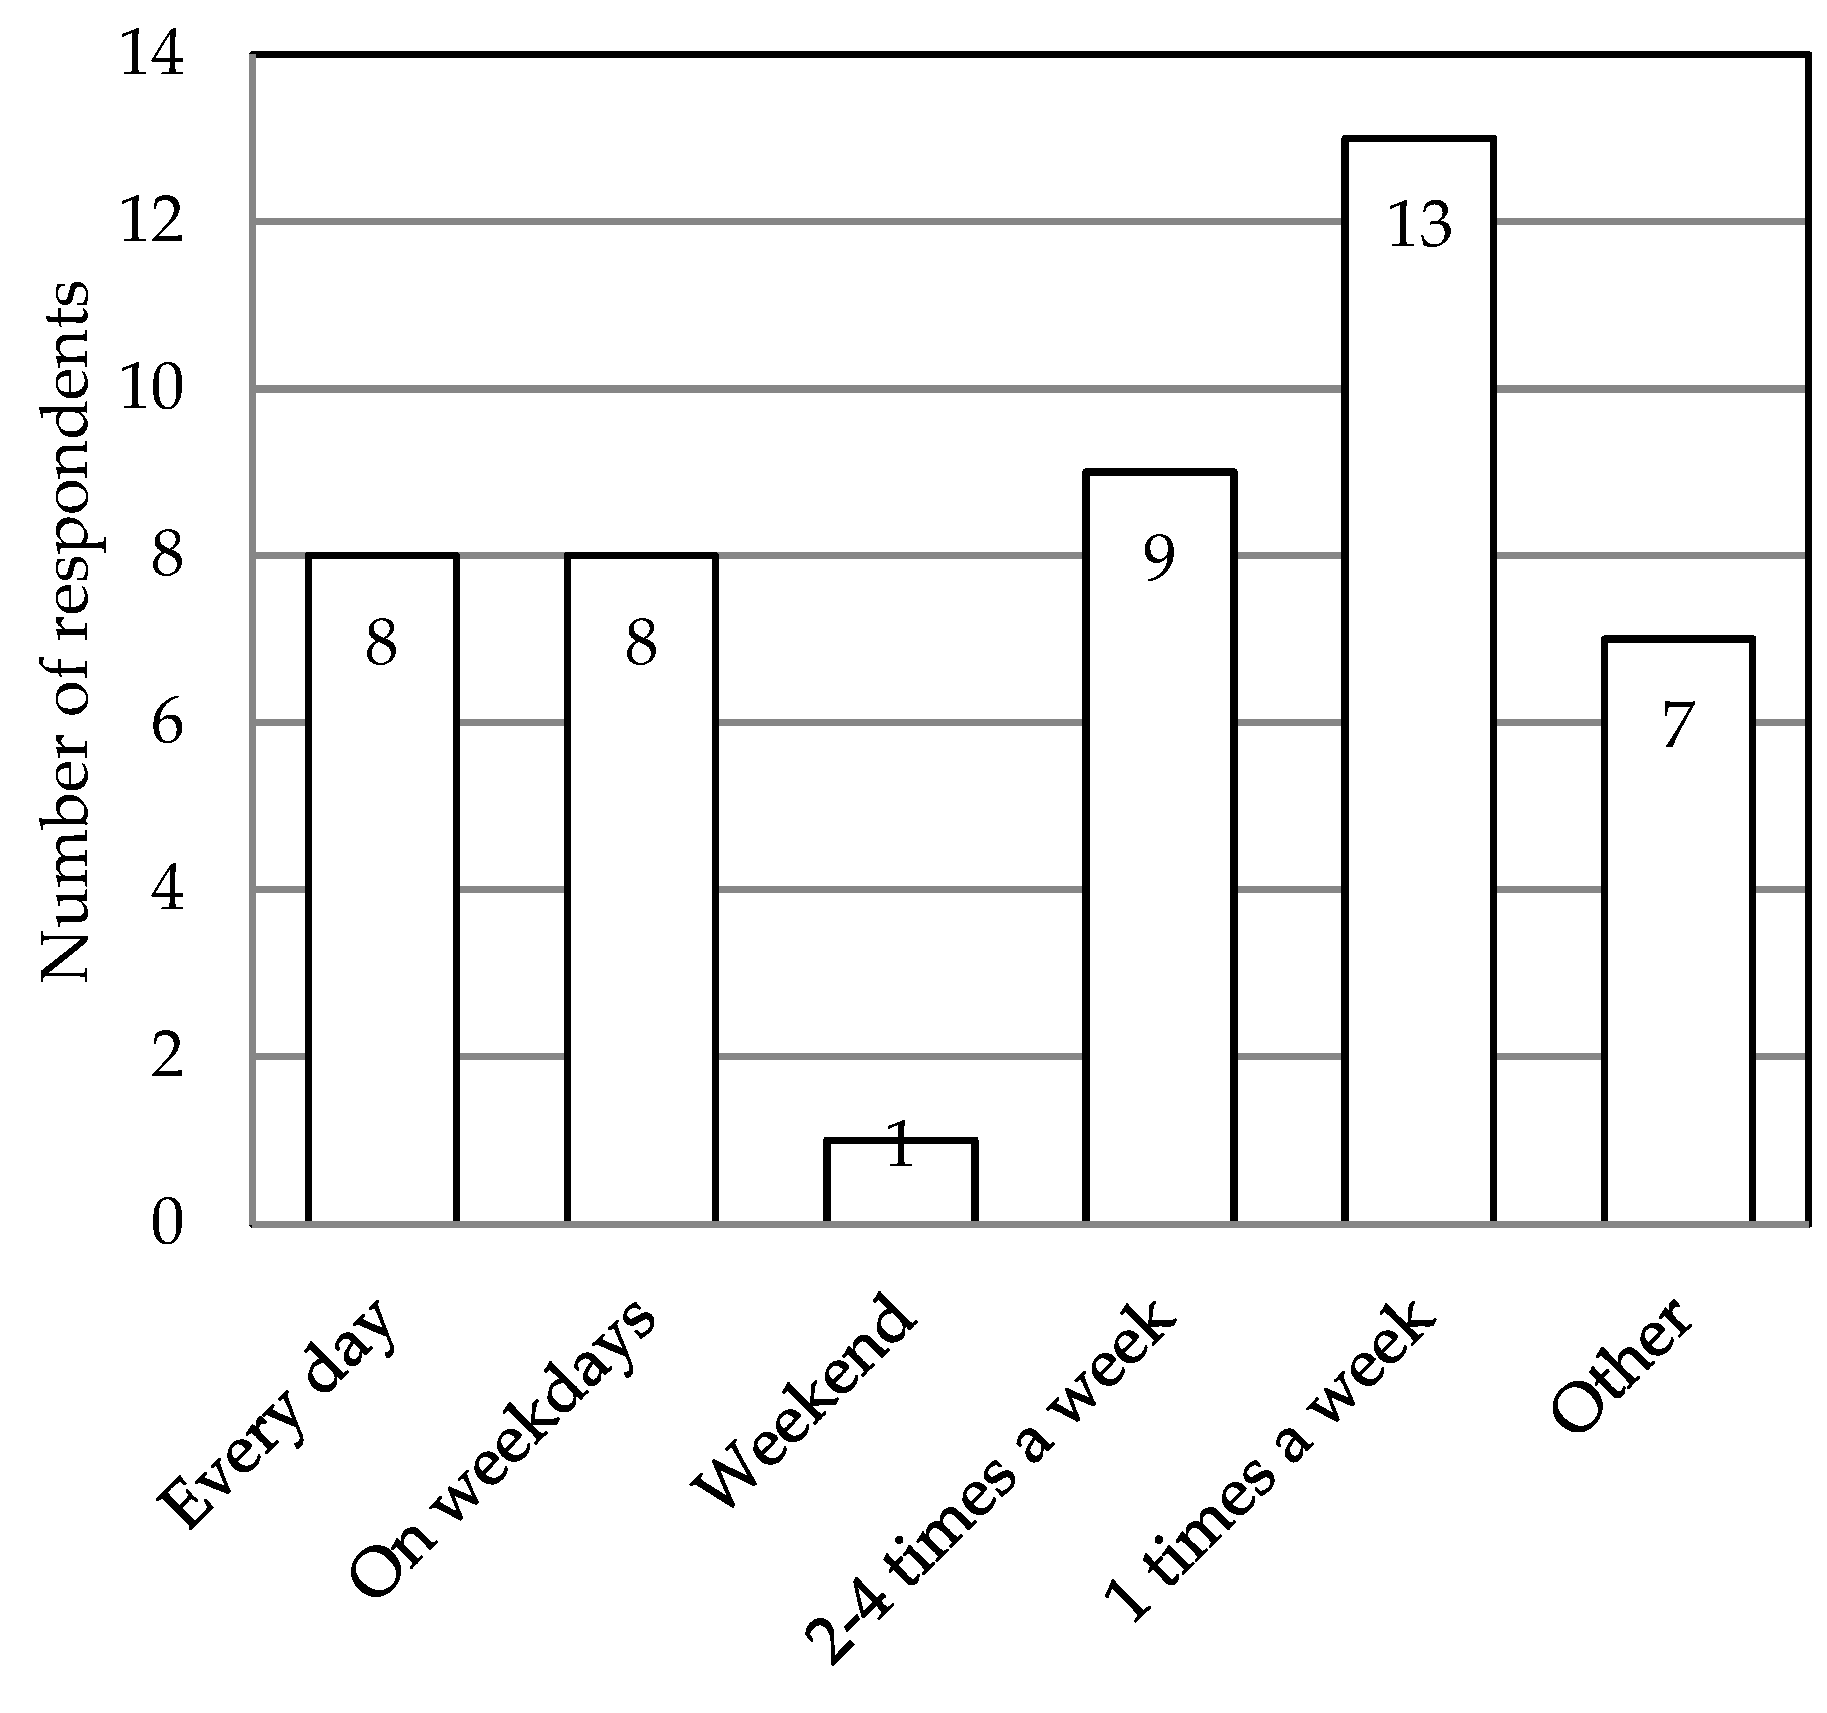
Since 64% of the answers are food points (
Figure 5 and
Figure 6), delivery there is made daily or every other day, depending on the situation. From this the need for constant delivery of goods can be seen (
Figure 6). Only 20% of respondents need delivery less than once a week or several deliveries a month.
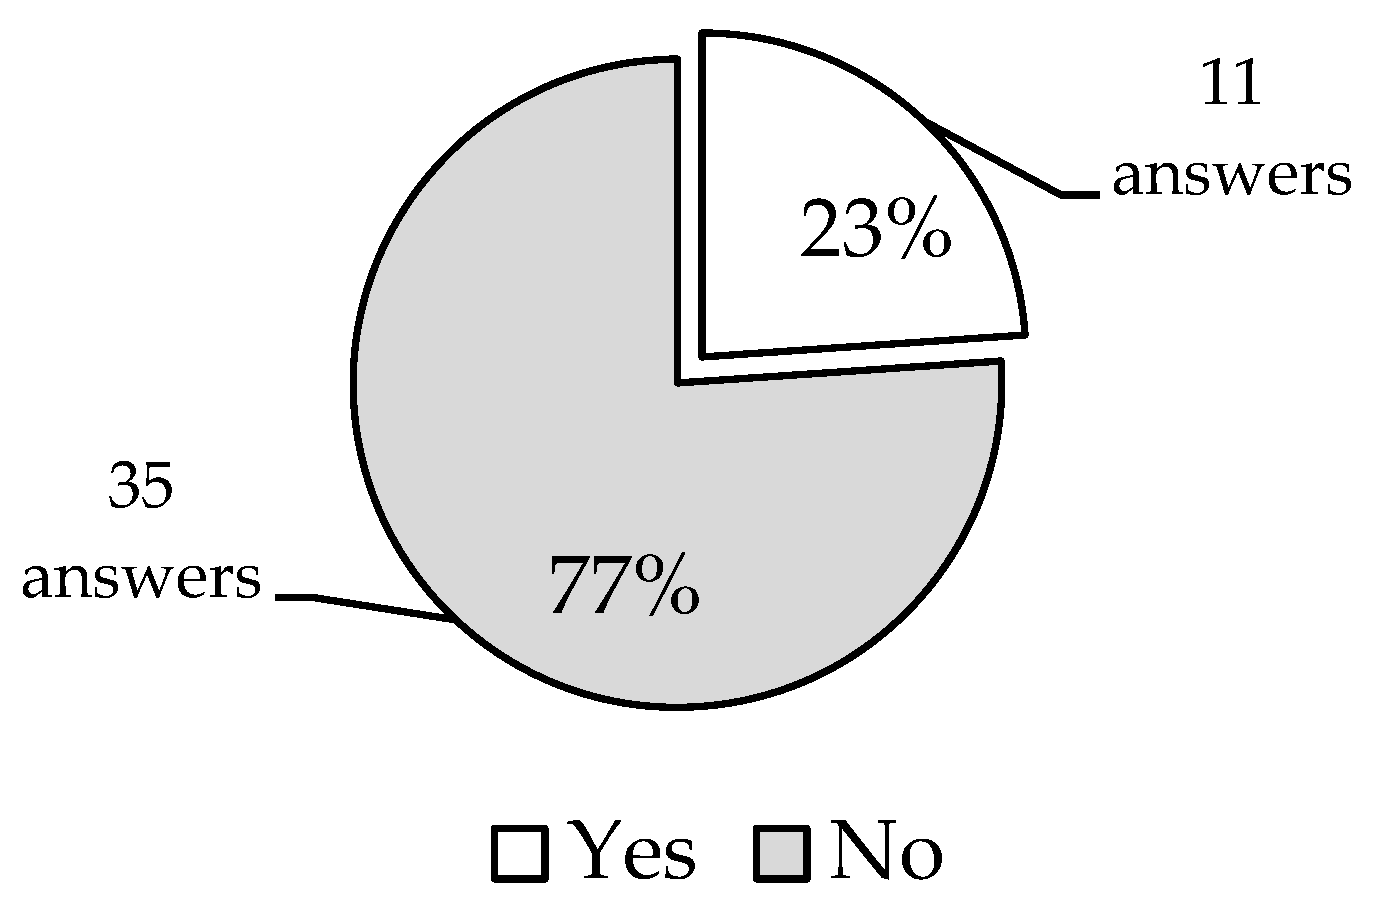
Analysis of survey showed over 65% retailers selling perishable products (
Figure 7). Similarly, it can be assumed that for the same reason, only 23% of respondents have additional storage space for goods (
Figure 8).
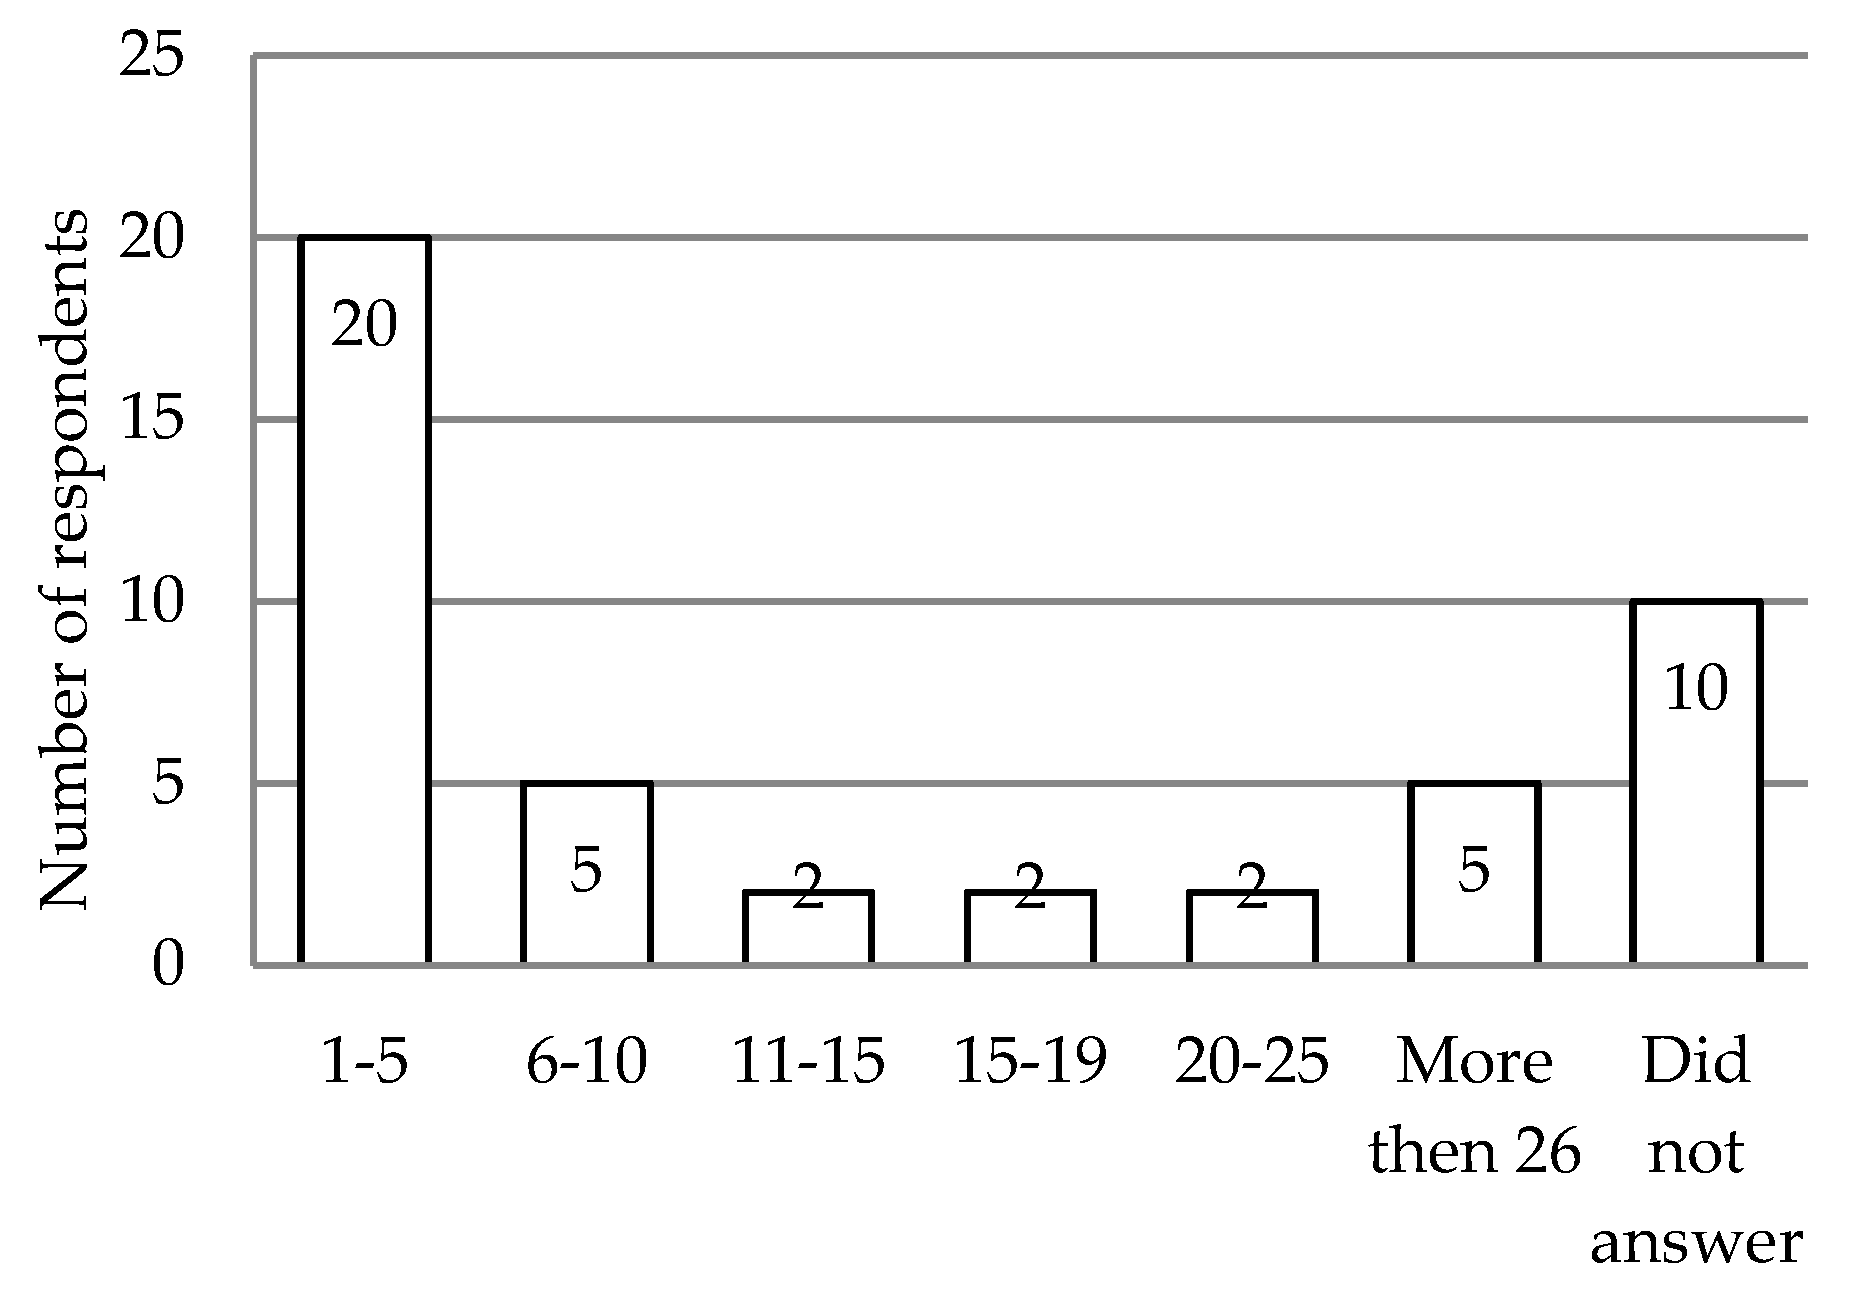
As for the payment for delivery by courier “to the door”, then more than 50% agree to pay in the range from EUR 1 to 5, as yet more entrepreneurs receive free delivery from retailers, because of their tariffs (
Figure 9). However, such tariffs are advantageous for suppliers; they minimize the available cargo space. Crowdsourcing delivery will allow consumers to obtain the required volume of goods, which will not depend on various logistics costs. More than 90% of outlets agree to wait until next day delivery (
Figure 10).
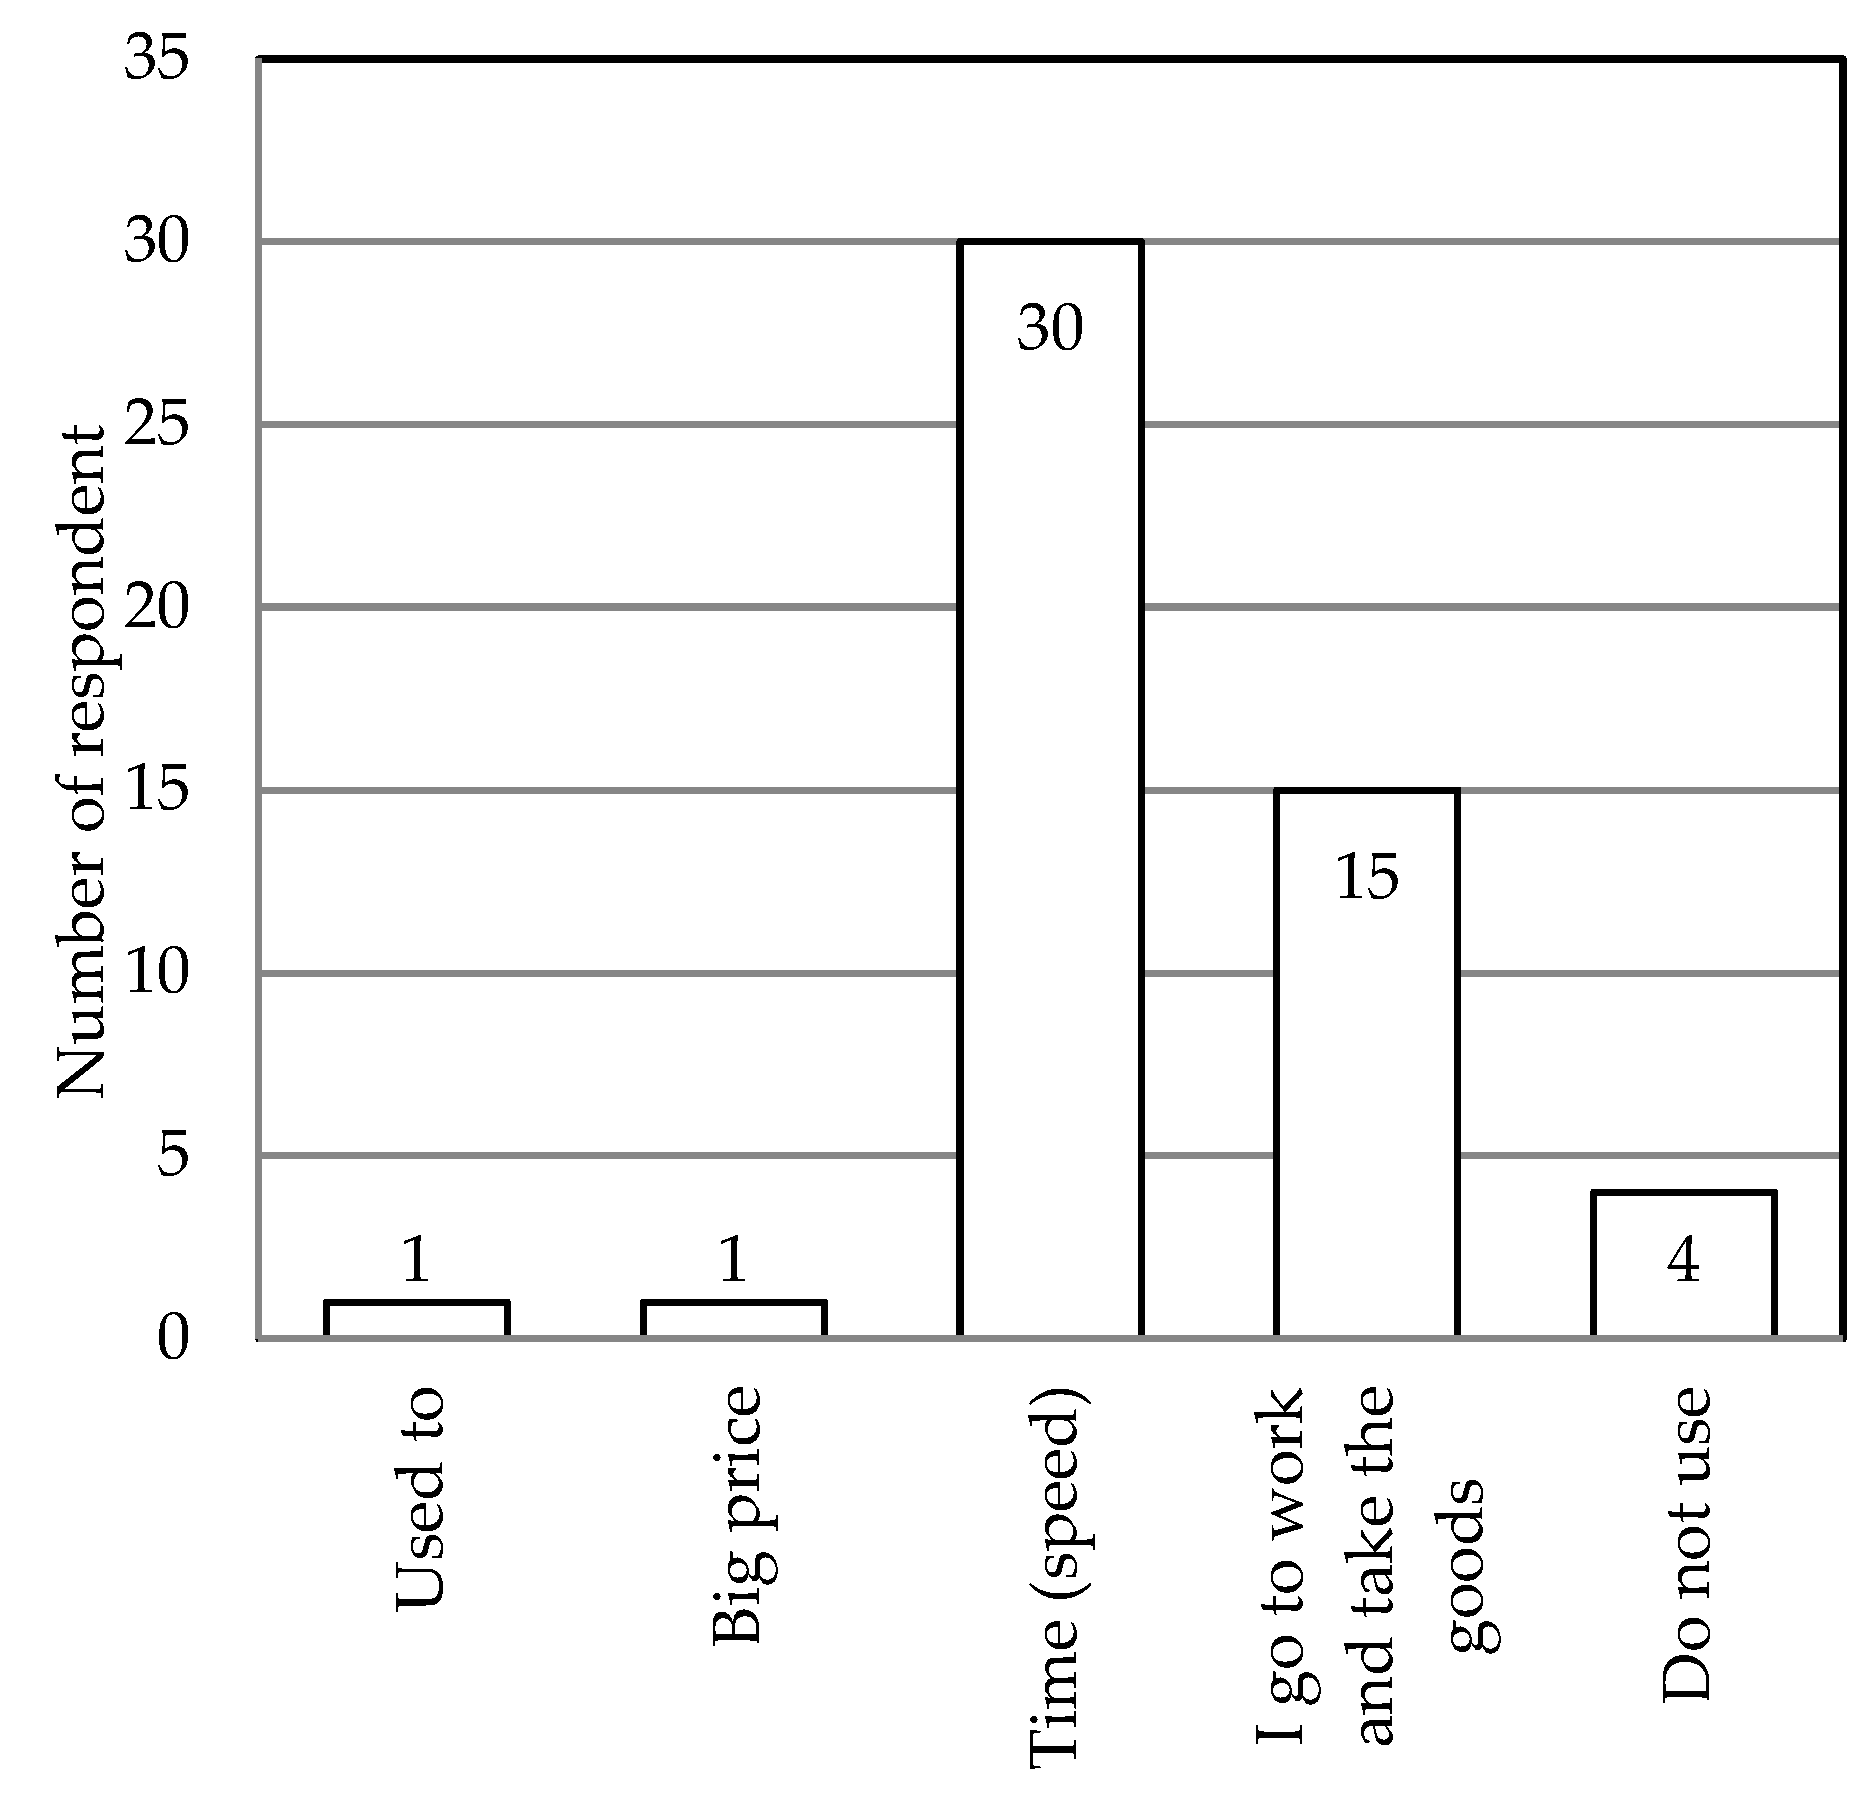
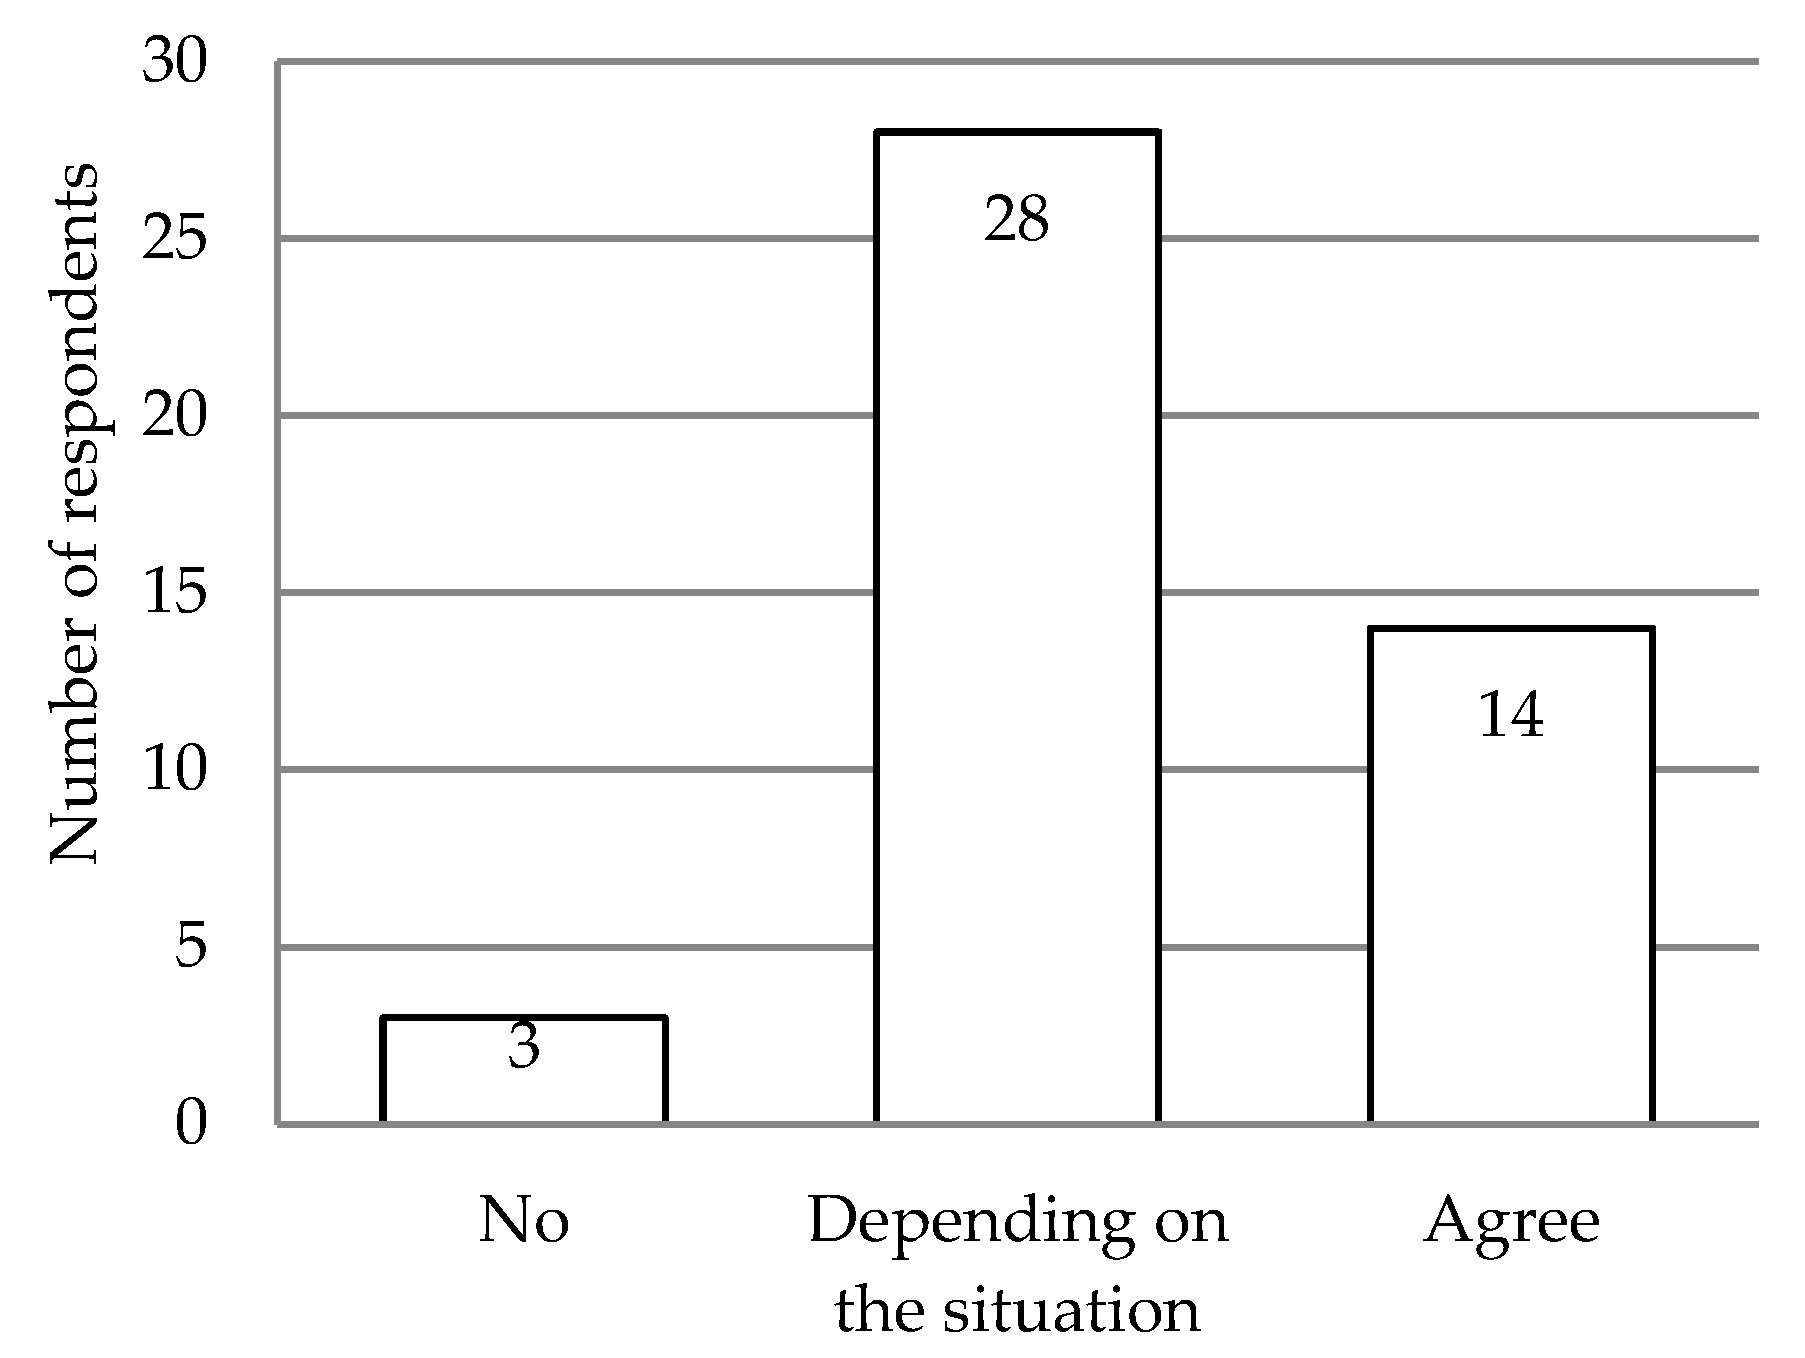
As for the issue of introducing public transport into the delivery system, 28% see this as new, alternative ways of development, 44% are ready to consider this way depending on the situation, and the other 28% do not consider it a good idea because of the large volume of supplies (
Figure 11). Due to the Green City trend, many respondents are aware of the negative impact of motorization and agree to consider alternative ways of delivery. However, such initiatives must be supported at the state level.
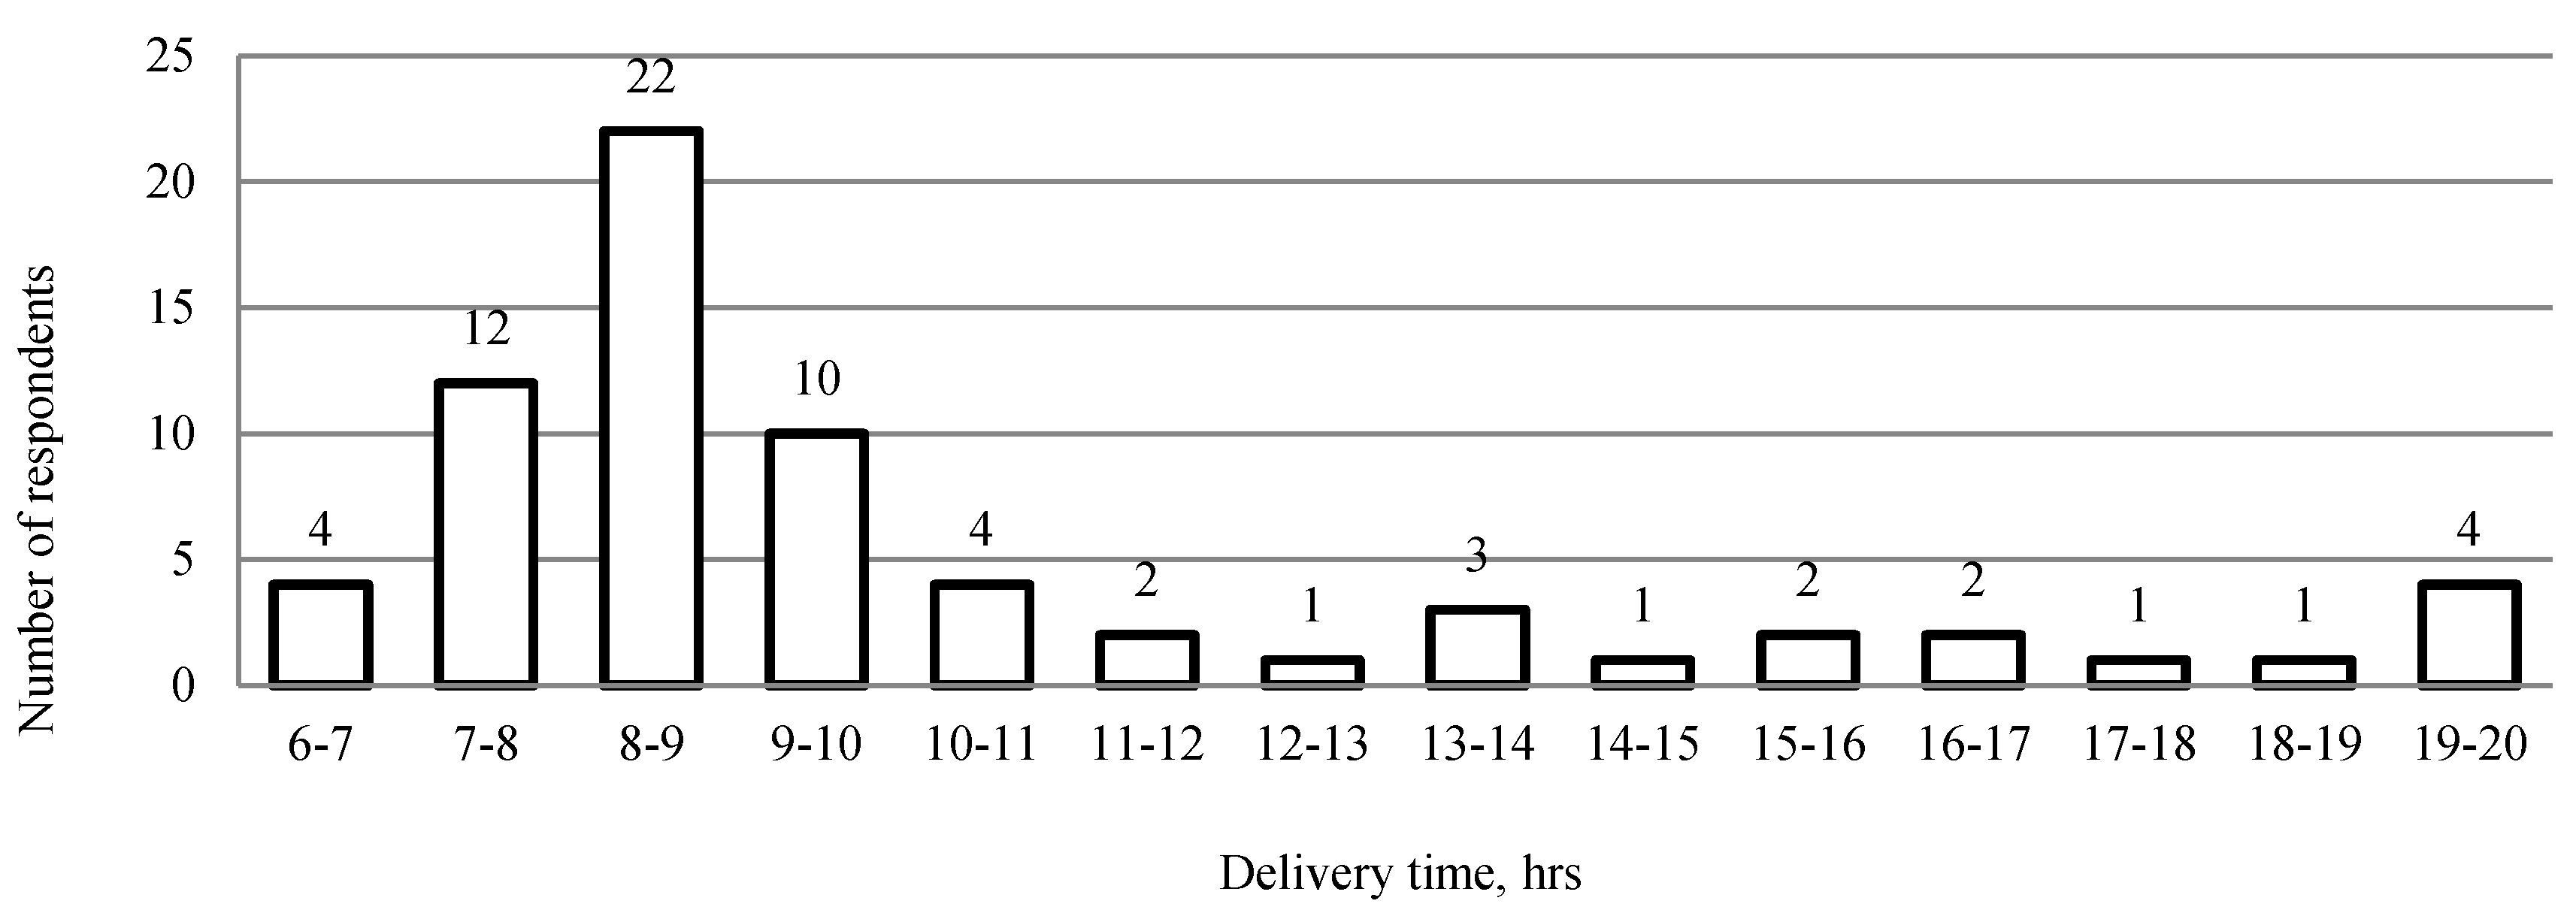
Respondents also answered questions about delivery time (
Figure 12), for the most complete delivery picture.
Their answers led to the conclusion that most goods are delivered in the time interval from 7 to 10 a.m. It is known that the city has a system of temporary windows for delivery of goods, from 6 to 9 a.m. At this time, the city has a morning rush hour, in connection with people going to work, study, all this leads to difficulty in maneuvering and traffic jams. The crowdsourcing model solves these problems. It will allow the seller and buyer to choose the most convenient for both delivery options, especially if you need to arrange it, in the morning, during peak periods.
4.2. Demand Model
The model of average daily retailer goods demand was obtained according to processing survey data via StatgraphicsX64. The degree of influence of variables on demand was analyzed. The regression coefficients were calculated using the least-squares method. The results of the calculations are given in
Table 3 and
Table 4.
The multifactor regression model of average daily retailer goods demand is described as follows:
where
Q—the average daily retailer goods demand, kg/day;
Smag—size of the retailer, m
3;
Np—frequency of deliveries to retailer per week, times;
Cp—average cost per delivery, euro;
C—average holding cost per unit, euro/1 m
2.
Thus, among all the factors studied, only three were significant. This was evidenced by the calculated value of the Student’s t-test, which is bigger than the tabulated value, as well as the absence of zero in the confidence interval of each model coefficient.
After the development of the regression model of average daily retailer goods demand, its statistical evaluation was conducted. The coefficient of multiple correlation of the model was 0.81, and the average approximation error was 10.3%. The obtained results allowed to draw a conclusion about the admissibility of using the obtained model of average daily retailer goods demand while designing the parameters of the process of freight transportation.
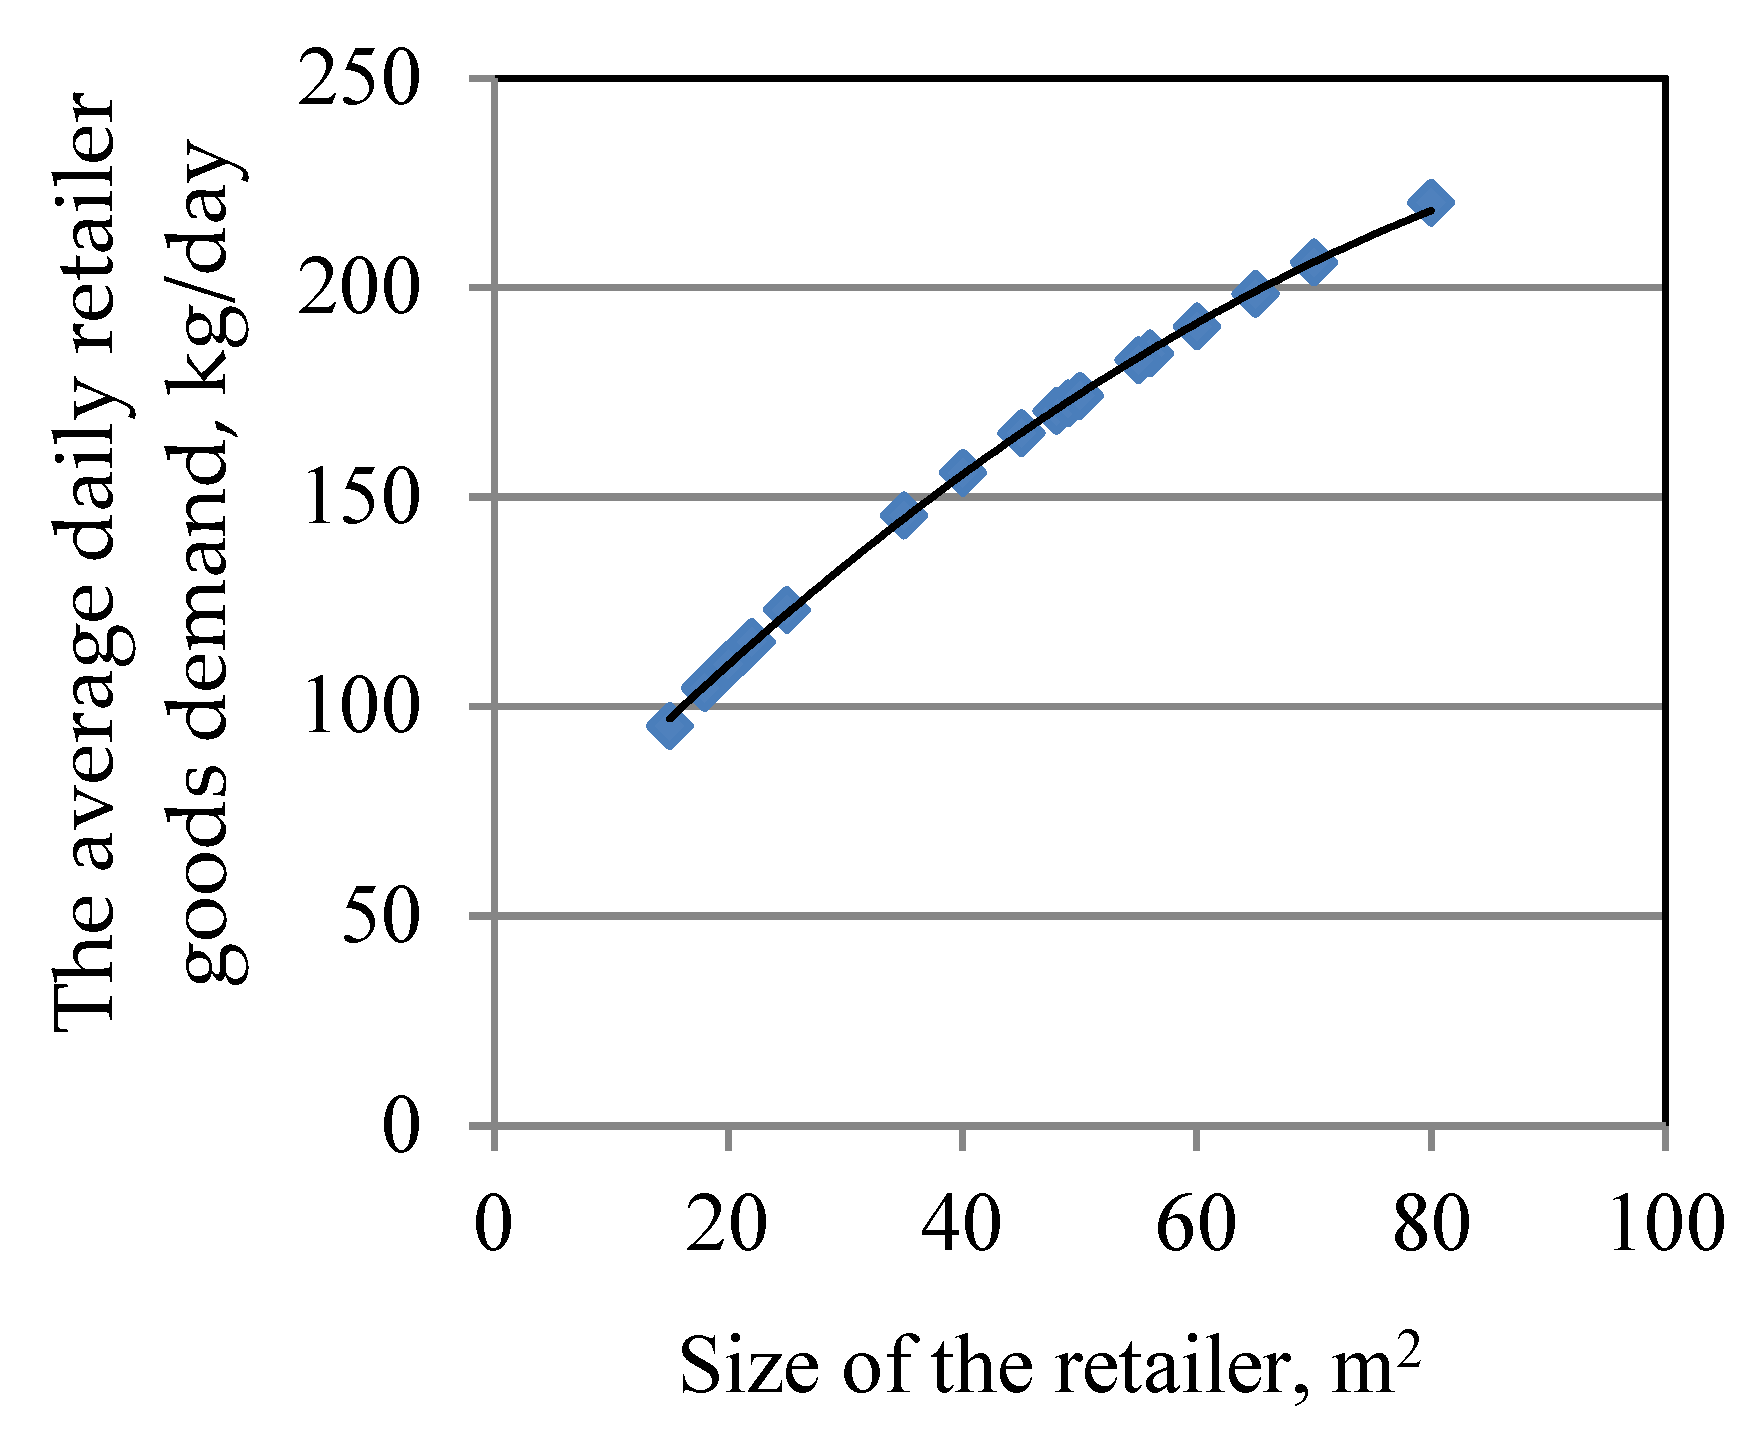
Analysis of
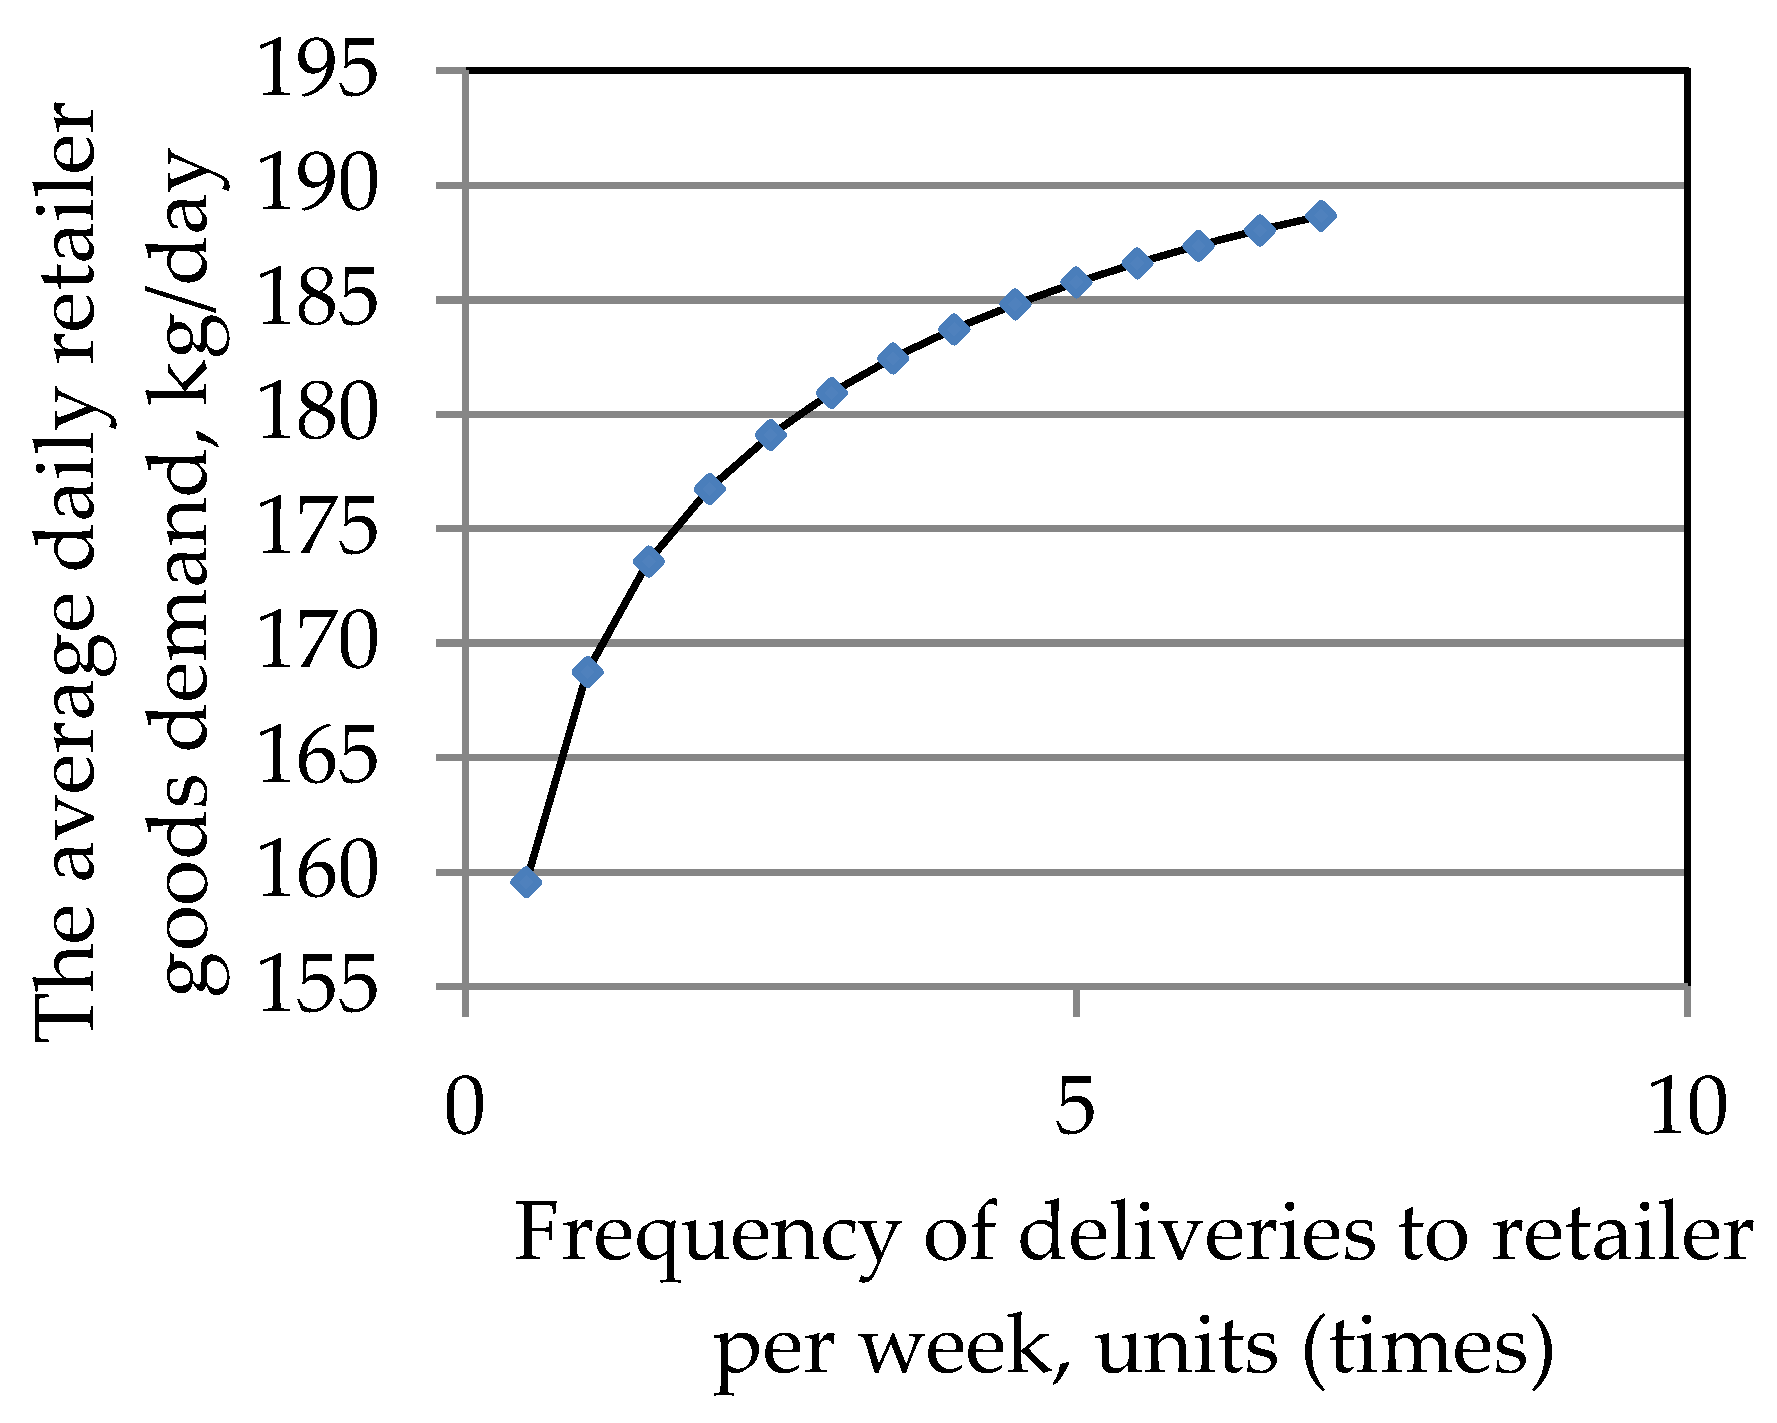
Figure 13 shows that with increasing the size of the retailer the average daily retailer goods demand will be also increased. Analysis of
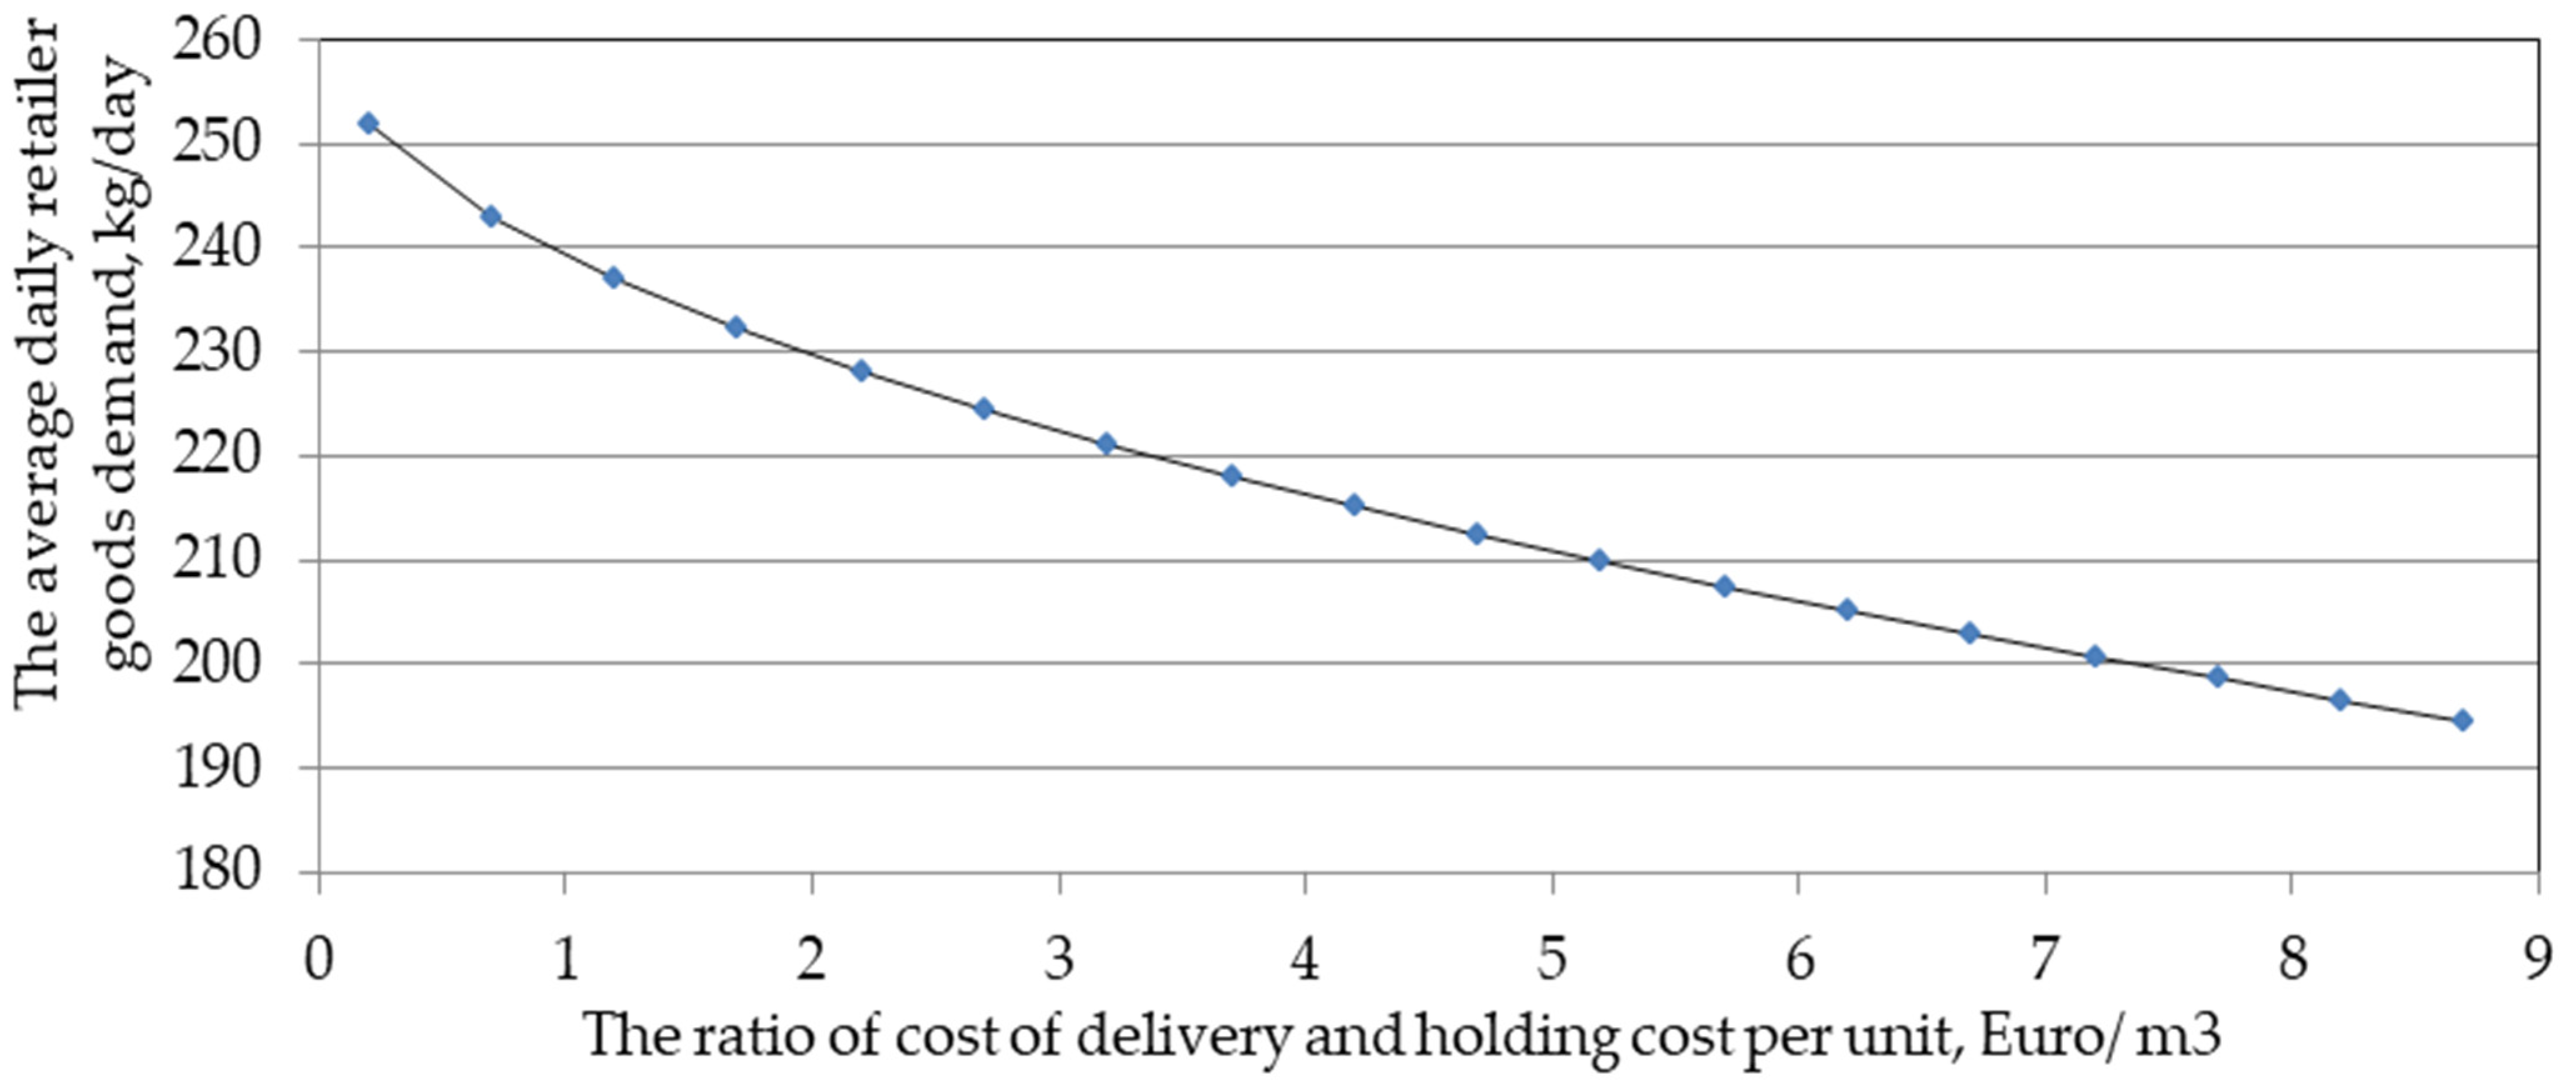
Figure 14 shows that there is a strong correlation between the average daily retailer goods demand and the frequency of deliveries per week. Analysis of
Figure 15 shows that with the increase the ratio of cost of delivery and holding cost per unit, the average daily retailer goods demand will decrease, and vice versa.
4.3. Supply Model and Data Analysis
The survey was attended by 129 respondents living in the city of Bratislava, aged 20–30 years.
Measuring the potential willingness of people to change status from regular passengers to partner passengers is of interest for sustainable transport and mobility. The simulation method involves the quantitative assessment of willingness to work as nonprofessional couriers in hypothetical scenarios with different parameters (in different delivery conditions).
Characteristics of the obtained personal data are given in
Table 5.
The results of the survey of respondents on the performance of courier functions of crowd shipping are as follows: 51% of respondents agree to consider such a possibility and 49% do not consider such a possibility. Further processing of the results was focused on 129 respondents: 72 men and 57 women, who answered that they potentially agreed to become couriers.
The maximum weight of a parcel that a courier of different genders agrees to carry was determined depending on their socioeconomic characteristics and the characteristics of the orders. Under the characteristics of orders, the delivery route, its cost, and time frame were considered. The results of statistical processing of the results for the two types of gender are given in
Table 6 (male) and
Table 7 (female). Regression models were developed.
The model maximum weight of the parcel that respondents agree to transport was obtained according to processing survey data via Statgraphics X64. The degree of influence of variables factors on the maximal weight of parcel ware analyzed. The regression coefficients were calculated using the least-squares method.
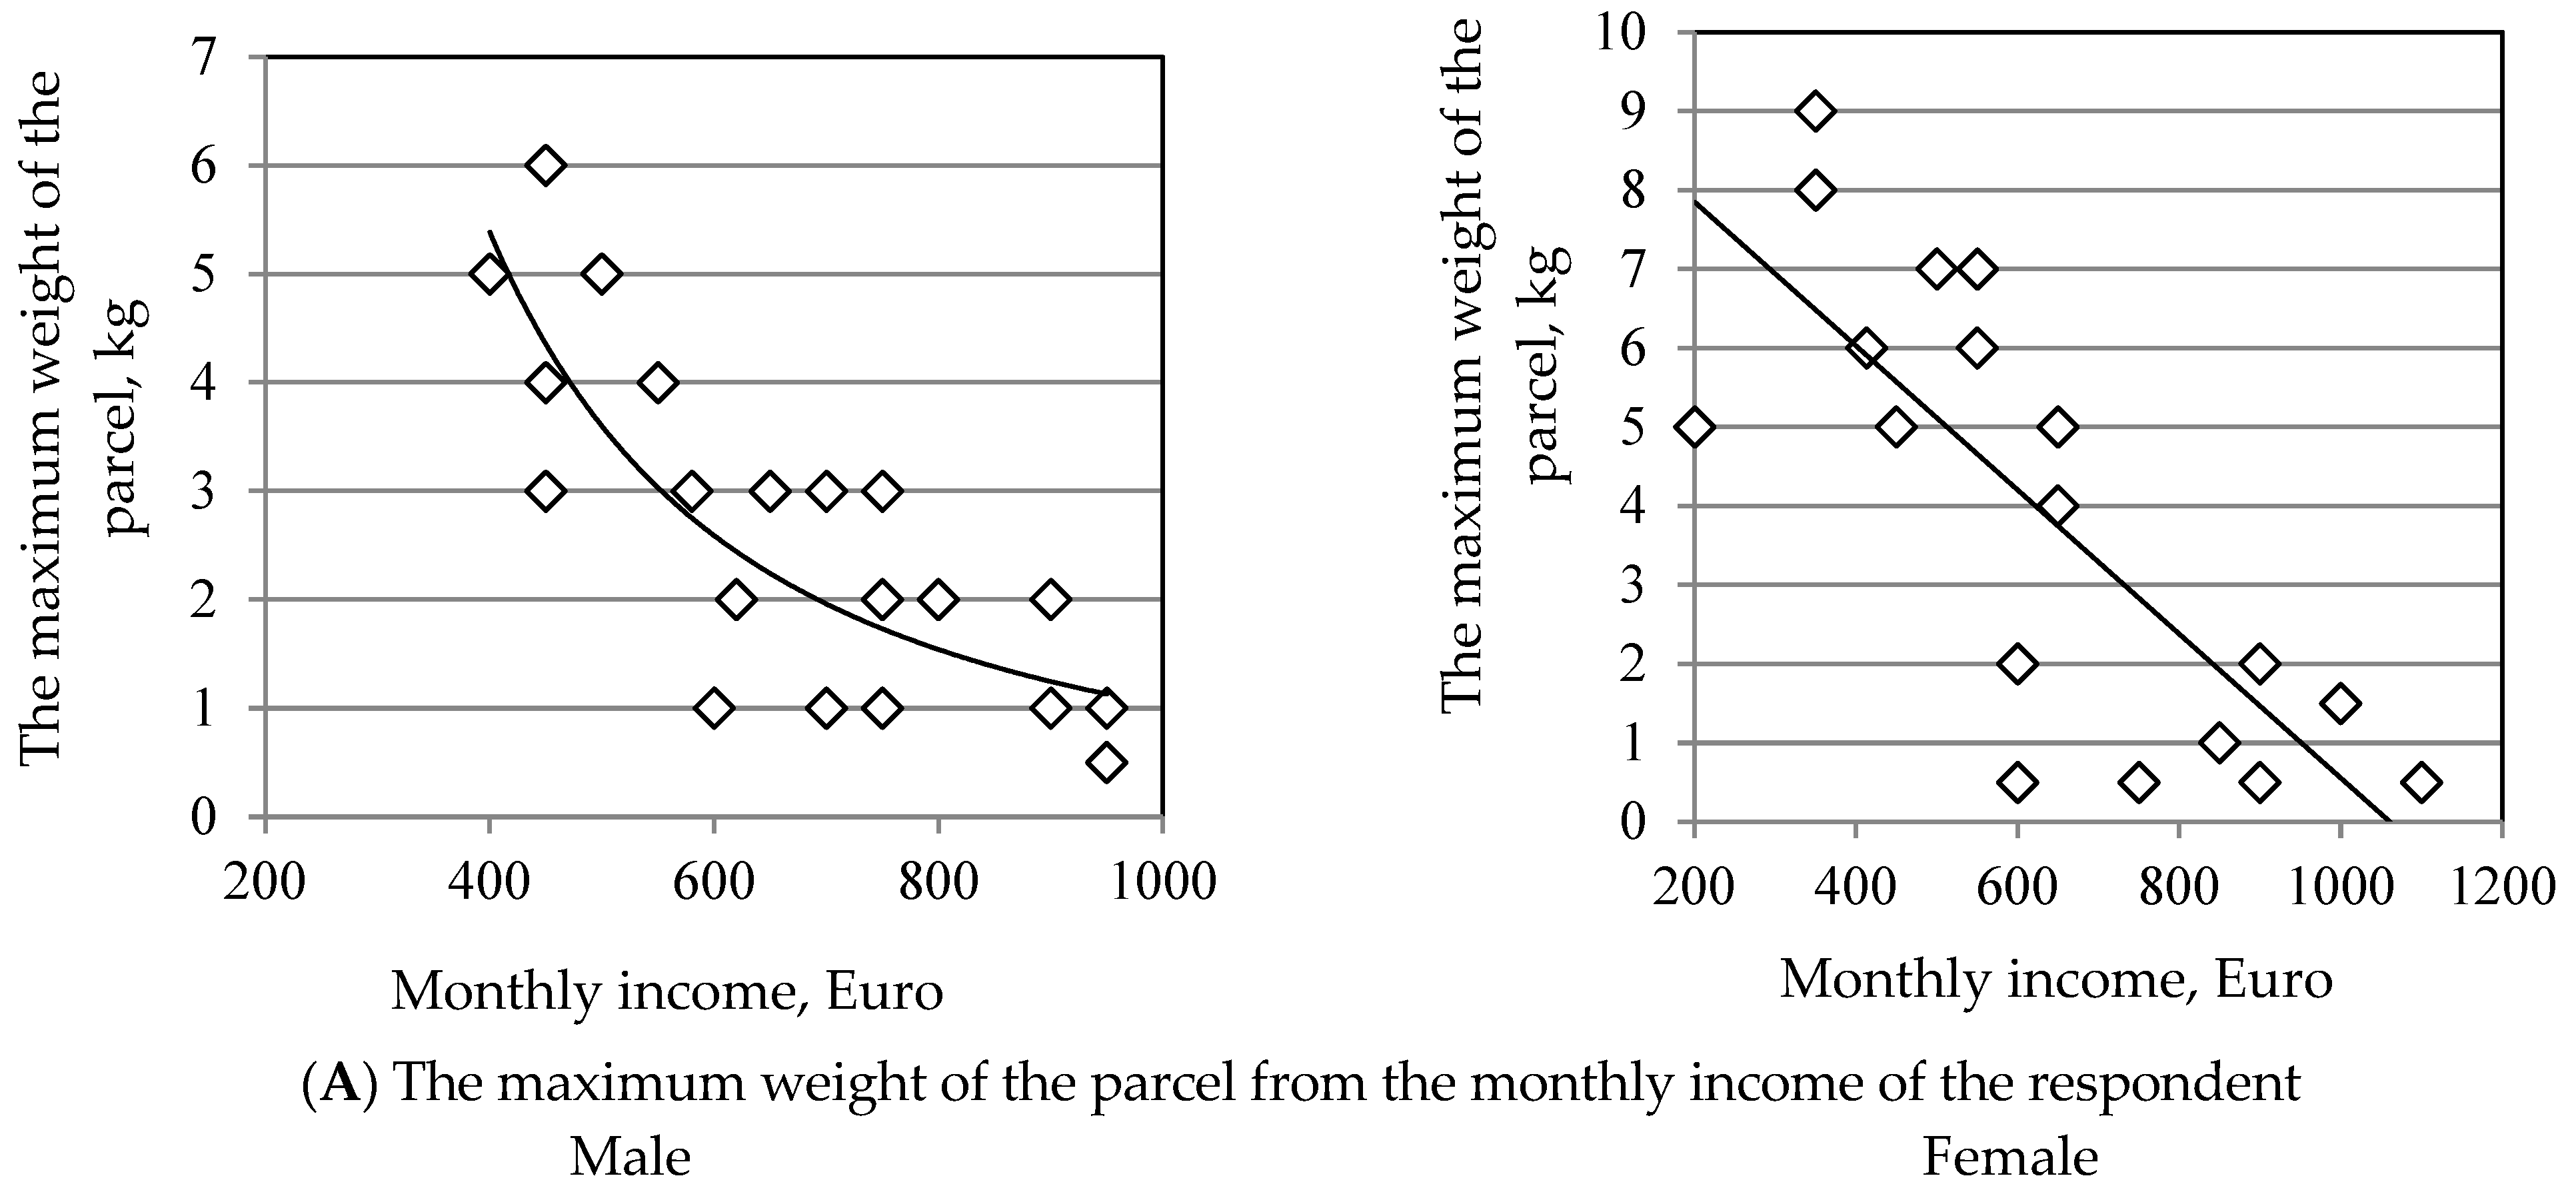
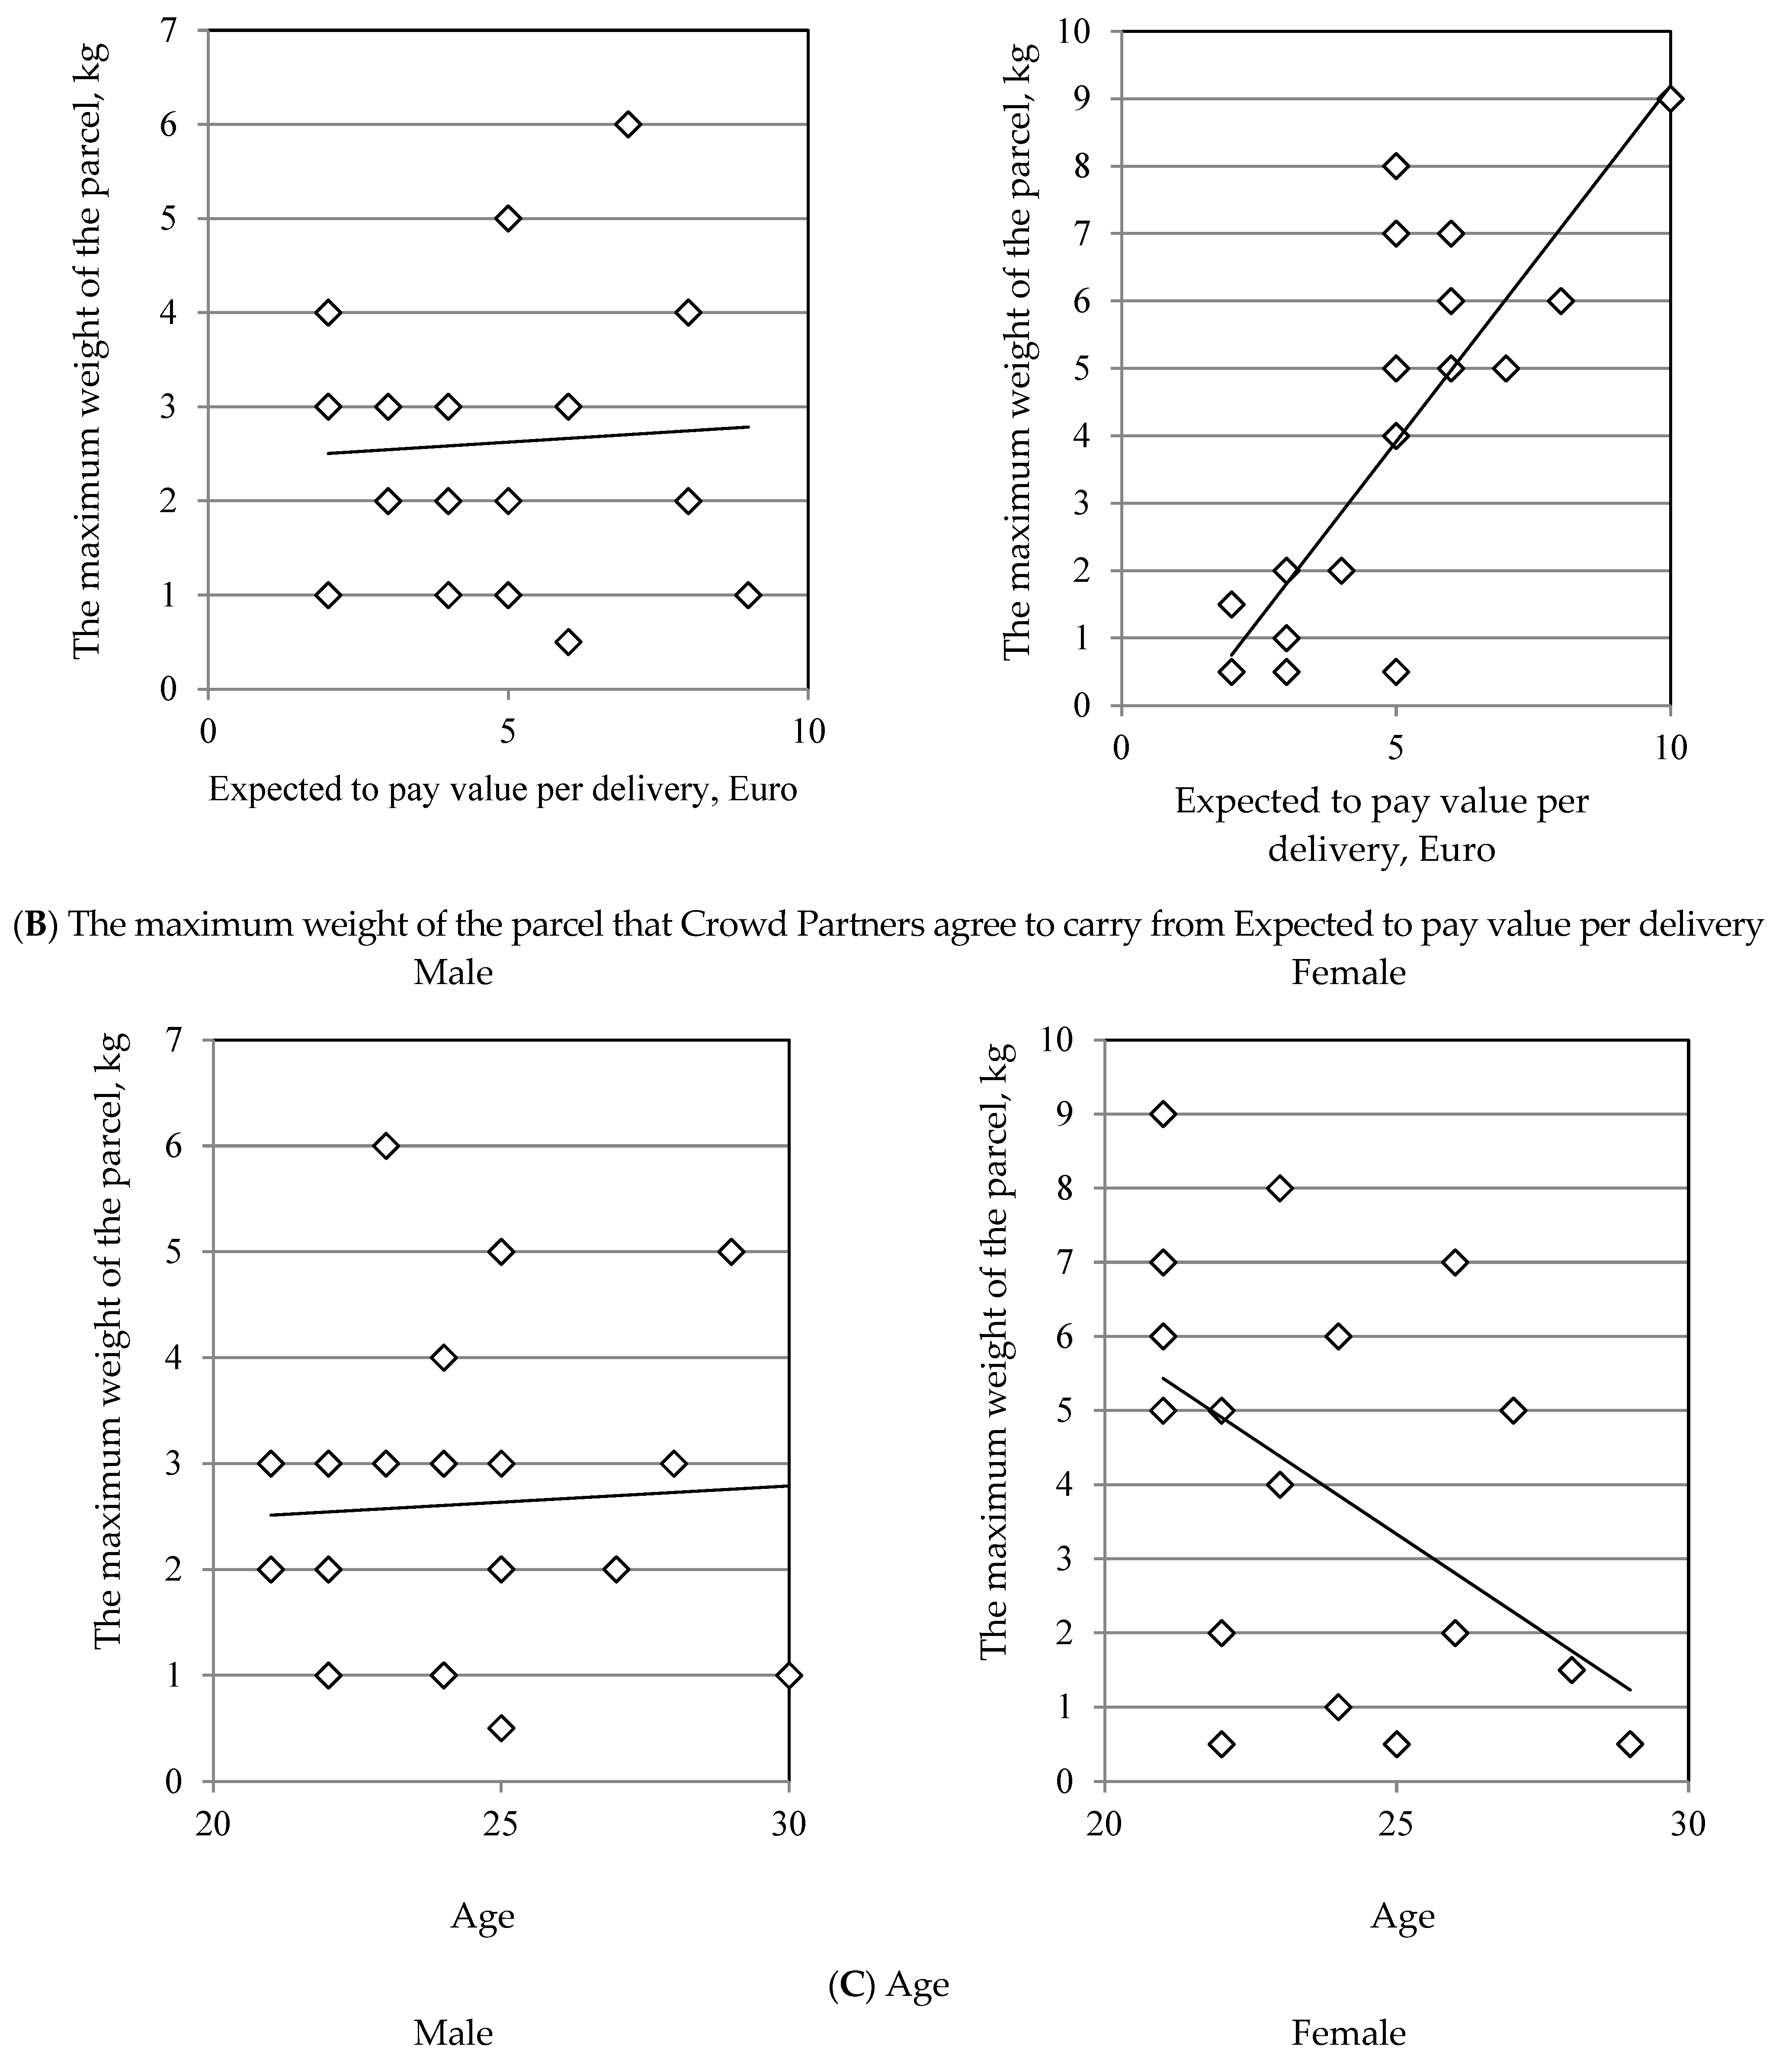
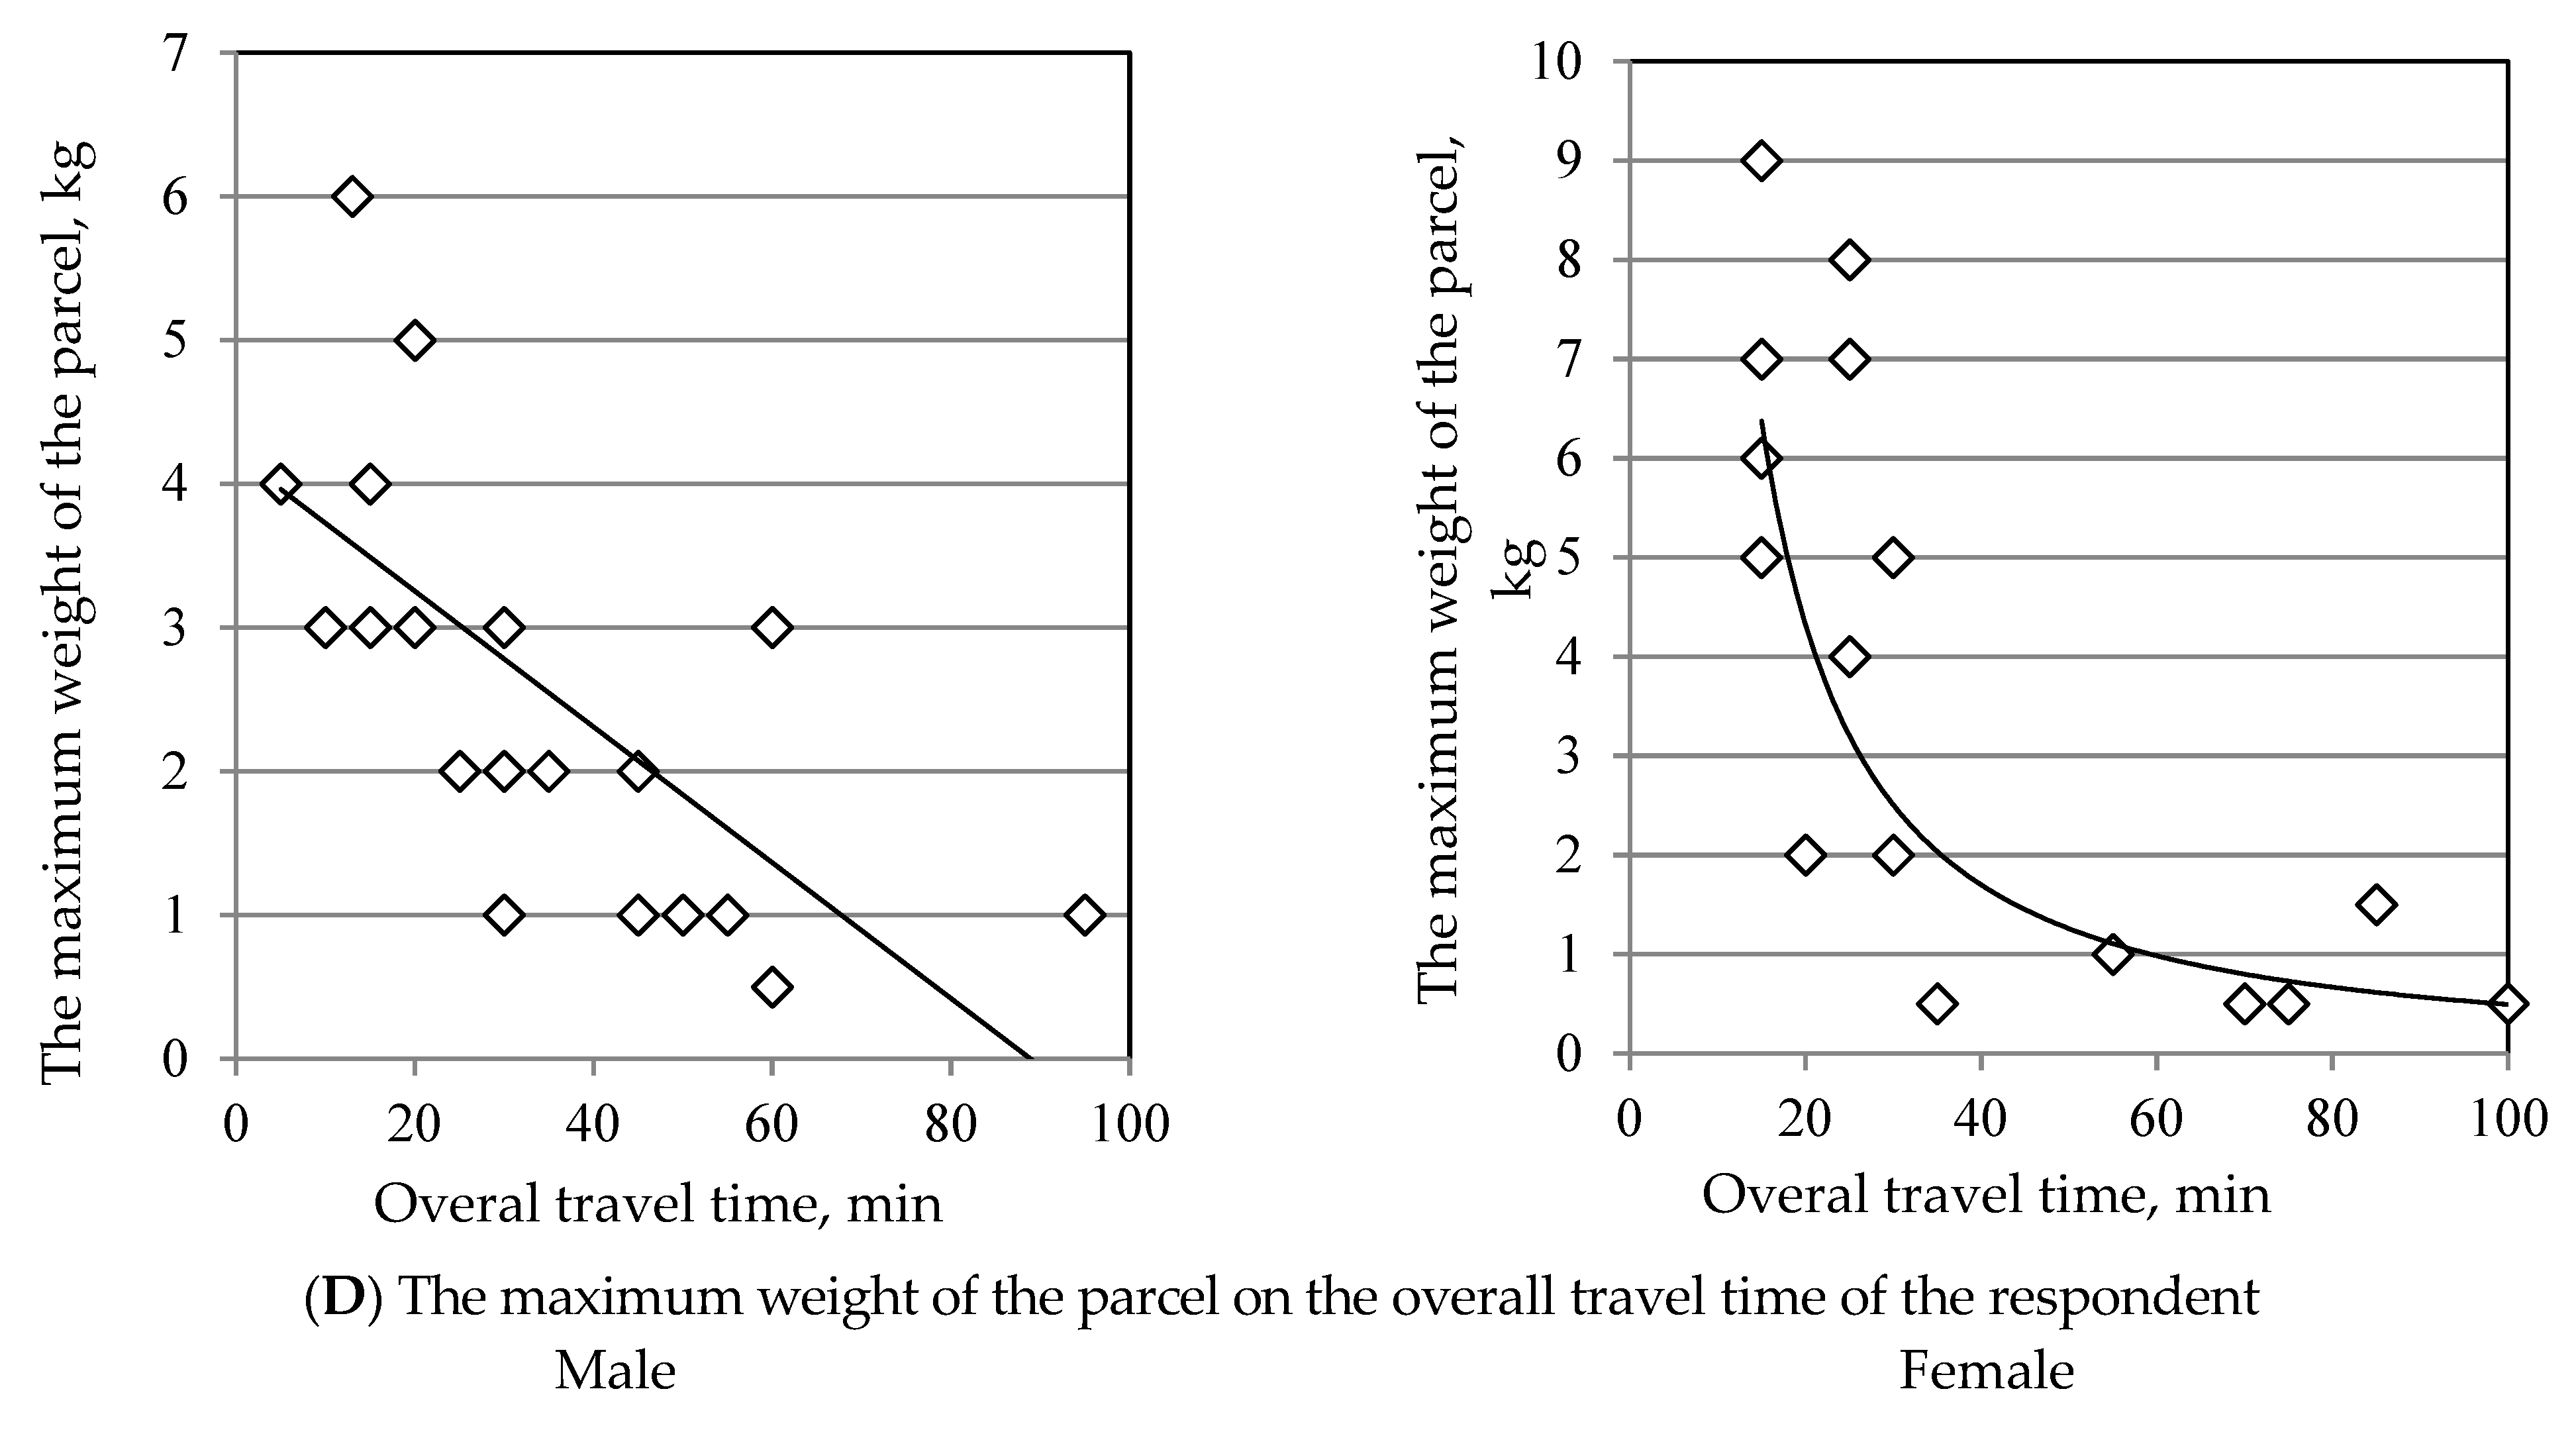
The obtained results allowed us to conclude the admissibility of using the model of maximum parcel weight for the design of the delivery process of the occasional courier. The analysis of factors affecting the maximum weight of a parcel that a random courier agrees to transport is shown in
Figure 16.
Analyzing
Figure 16A, it can be concluded that there is a relationship between monthly income and the maximum weight of the parcel, which respondents agree to transfer. Thus, with a decrease in monthly income, the maximum weight of the parcel decreases, and vice versa for couriers of different genders. The increase in monthly income for men more moderately (gradually) reduces the maximum weight of the parcel, in contrast to women where the increase in income reduces it more straightforwardly.
Analyzing
Figure 16B, it can be concluded that there is a relationship between the expected value to pay per delivery and the maximum weight of the parcel that respondents agree to transfer. The expected value to pay per delivery increases with the maximum weight of the parcel and vice versa for both genders. The increase in expected to pay value per delivery in men more moderately (gradually) increases with the maximum weight of the parcel, in contrast to women where the increase in expected value to pay per delivery increases the willingness to take more weight of the parcel.
From
Figure 16C, it can be concluded that there is a relationship between age and the maximum weight of the parcel, which respondents agree to transfer. Therefore, with age the maximum weight of a parcel increases and vice versa. According to the results of the assessment of the dependence of the maximum weight of the parcel on the age of the possible courier, it can be concluded that the younger the executor, the larger the volume of the parcel he agrees to deliver. According to the graphical display of answers, it can be concluded that the age of potential couriers decreases their potential capacity (capacity).
Analyzing
Figure 16D, it can be concluded that there is a relationship between the total time of movement of the respondent and the maximum weight of the parcel that the respondents agree to transfer. According to the graphical display of answers, we can conclude that increasing travel time decreases the maximum weight of the parcel and vice versa.
Additionally, on the official Slovak website
https://www.stavebnyportal.sk/, accessed date 3 January 2021, there are rules of procedure regarding the maximum allowable weight for the transportation of men and women. Therefore, for men under favorable conditions 15 kg, and unfavorable 10 kg. For women 10 and 5 kg, respectively. The data obtained indicate that the range of change in the weight of the parcel for men is from 1 to 10 kg, for women from 0.5 to 7 kg.
For couriers of different genders, the expected value per delivery was determined (
Figure 17).
Accordingly (
Figure 17a), 22.73% of male respondents agree to provide the service in the range of EUR 1–2; 27.27% from EUR 3 to 4; the same from EUR 5 to 6; 18.18% from EUR 7 to 8; 4.55% agree to provide a service of at least EUR 9. Accordingly (
Figure 17b), 16.67% of women respondents agree to provide the service in the range of EUR 1–2; 27.78% for EUR 3 or 4; 33.33% of respondents from EUR 5 to 6; 11.11% from EUR 7 to 8; the same percentage agree to provide a service of at least EUR 9.
A preliminary study of willingness to work as an occasional courier was conducted in Bratislava for the first time. A survey was conducted to determine the desire to work as a random courier using crowd shipping technology. As a result, respondents of different genders were interested in performing the functions of a courier and the main factors influencing the choice.
Overall the multifactor regression model of the amount of delivery by average occasional courier:
Results of the model evaluation are presented in
Table 8.
Of all the factors studied, only four were found to be significant, forming four relationships. This is evidenced by the calculated values of Student’s t-test, which is greater than the table value, as well as the absence of zero in the confidence interval of each factor of the model. The multiple correlation coefficient of the model was 0.93, and the average approximation error was 9.6%. The results obtained allowed us to conclude the admissibility of using the obtained model for modeling the supply amount of delivery.
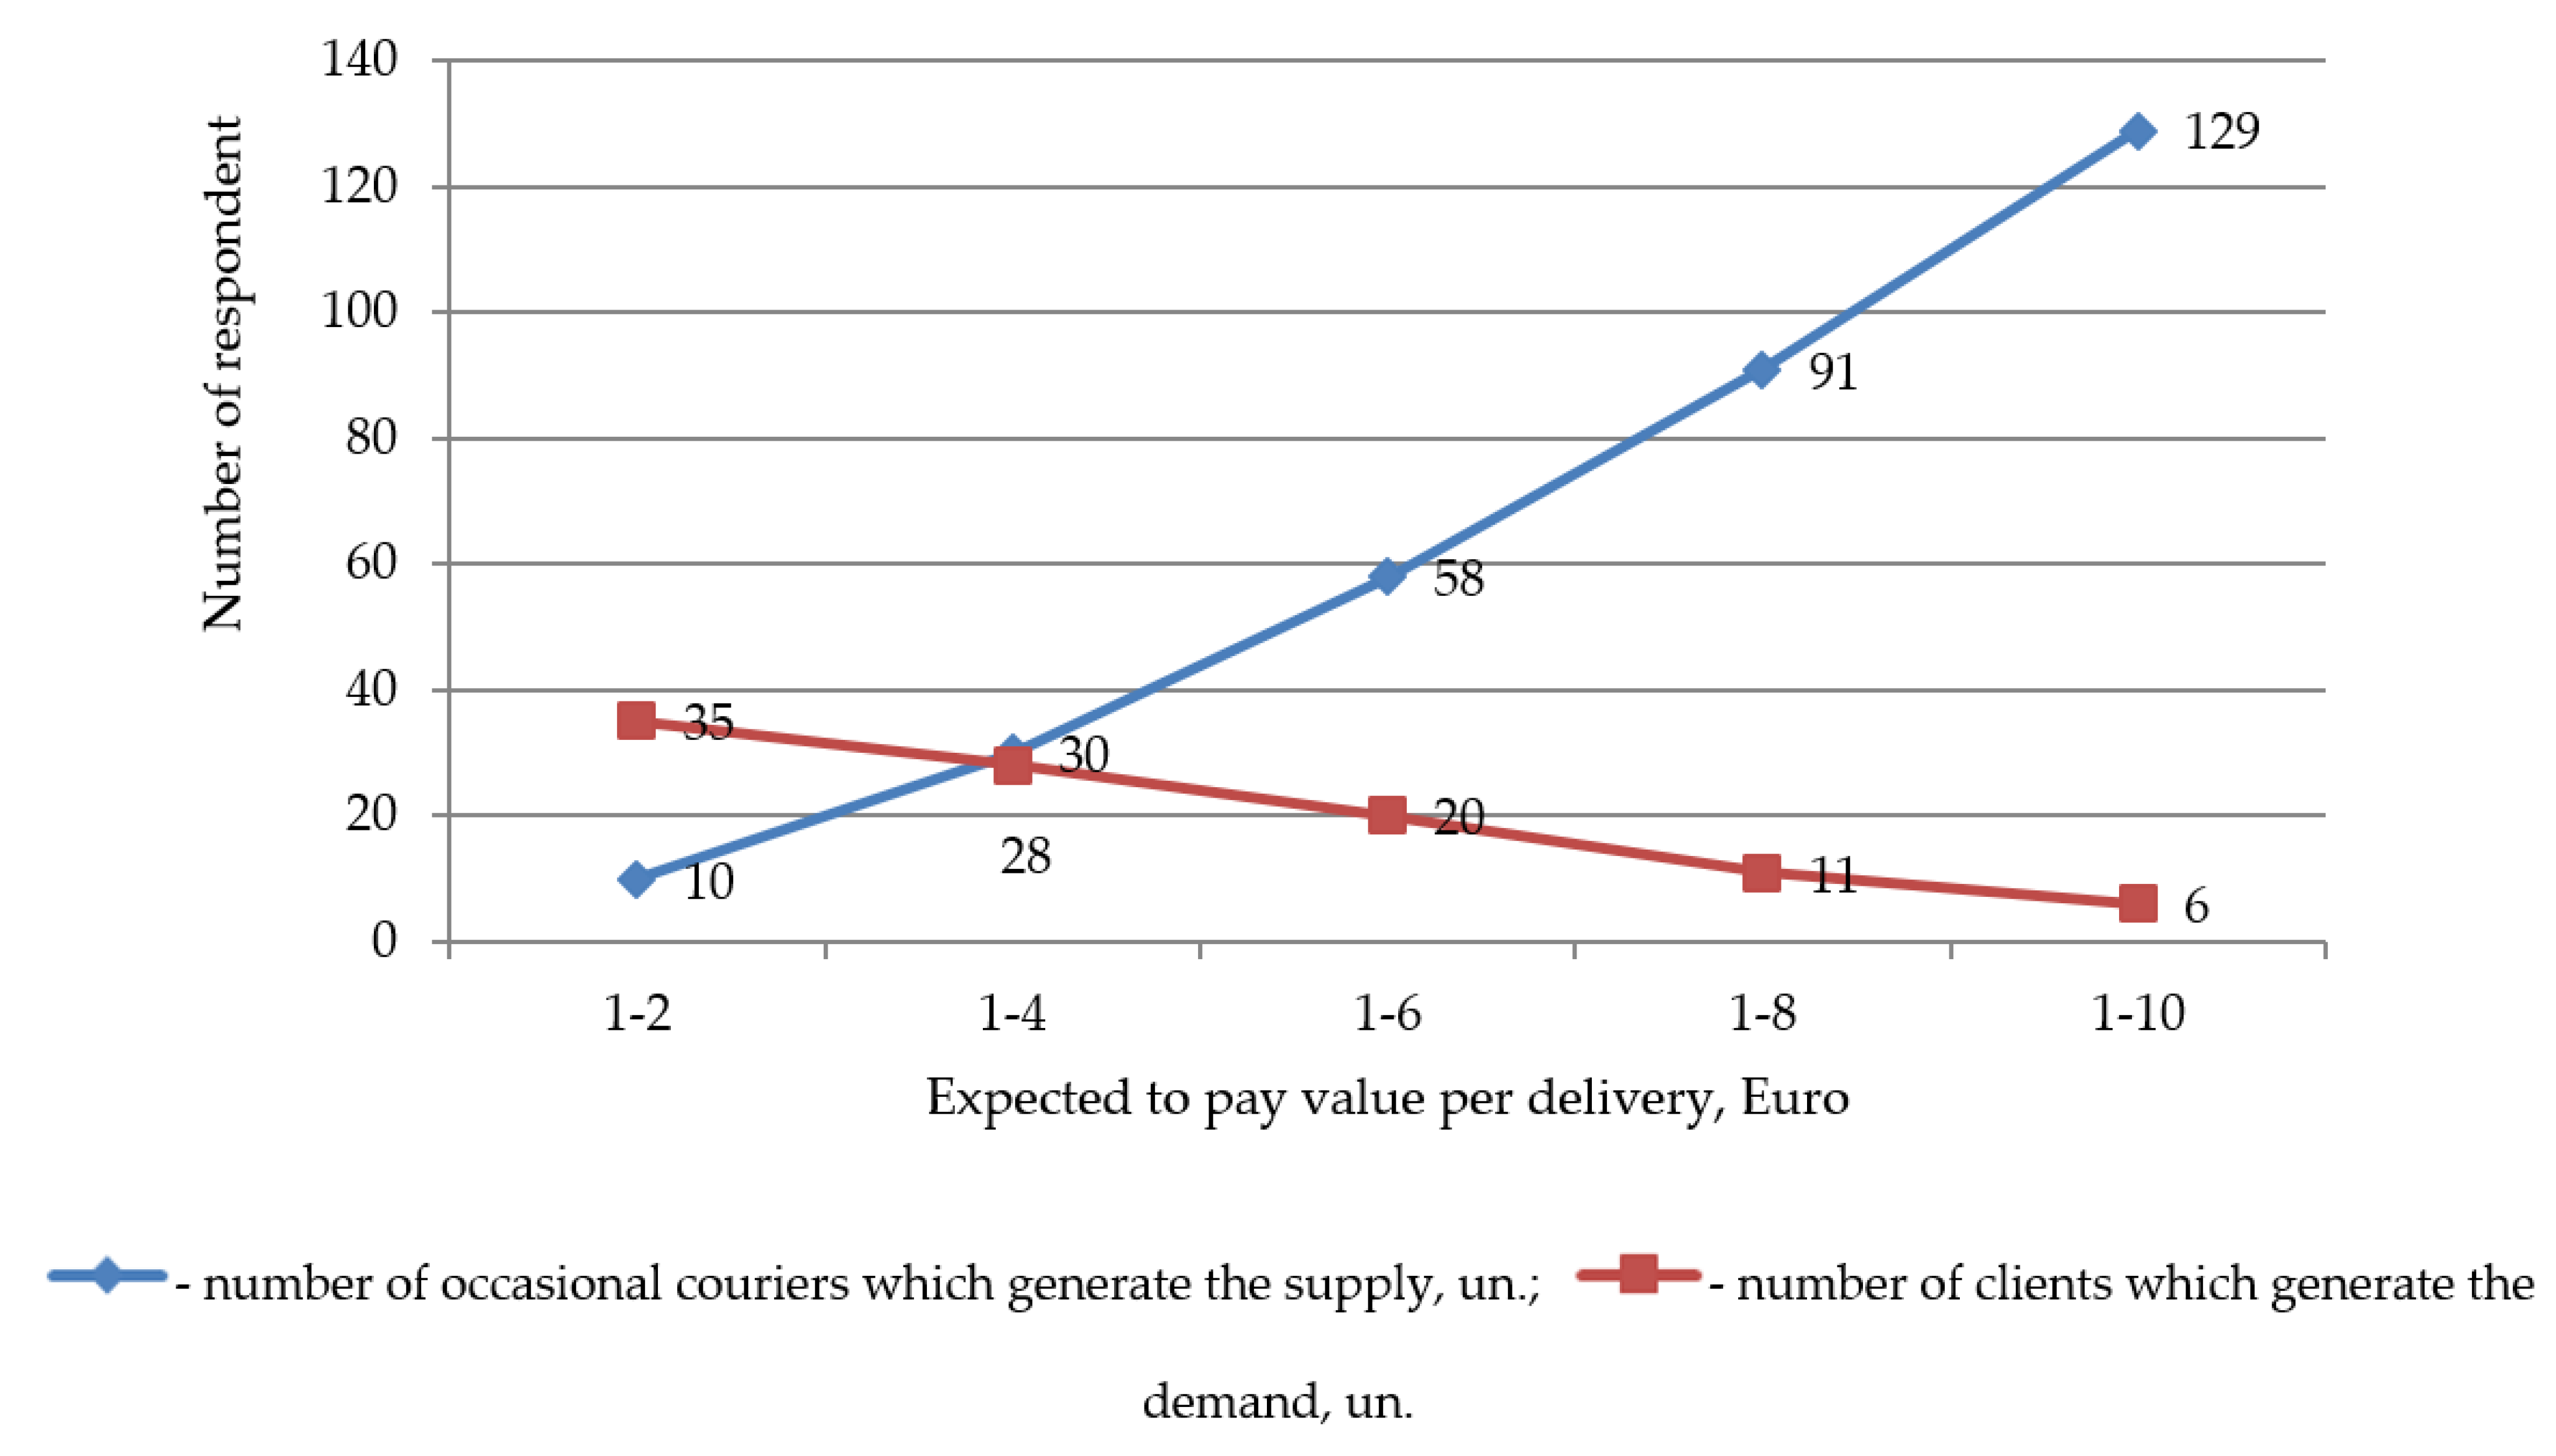
4.4. Demand–Supply Equilibrium for Crowdsourcing Technology in Bratislava
Consideration of the preferences of the clients and occasional couriers is formed within the framework of various markets, the system of prices for services. Among the many prices, there is only one at which customers want and can purchase a service, and occasional couriers are ready to provide it. This price is called the equilibrium (market) price and is located at the intersection of the supply and demand curves (
Figure 18). For any other price that is above or below equilibrium, there is a gap between supply and demand. A price higher than the equilibrium one attracts more occasional couriers, but the client’s desire to order this service decreases and they consider alternative types of delivery. As a result, there is an oversupply of couriers ready to carry out delivery on the market. However, this situation cannot be permanent. The need for work (earnings) will induce couriers to reduce the price of the service; as a result, the price may fall even below the equilibrium value. At the new price, the number of couriers ready to offer their services will be much smaller, but the number of customers for such a service will increase. Demand will exceed supply; a deficit will form. In turn, competition between customers will lead to an increase in price, and a price increase will attract an increase in the number of random couriers.
Thus, an excess of couriers will lower the price of services, and a shortage (shortage) will cause an increase in the price of services. This will continue until, at a certain price, the number of services that customers are ready to purchase coincides with the number of services that random couriers are ready to provide at the same price. This will be the equilibrium price, and the volume of services will be called the equilibrium quantity. In this case, we see the action of the price balancing function. The essence of this function lies in the fact that the competitive forces of supply and demand are able to come to a price level at which decisions to buy and sell will coincide in place and time. The equilibrium supply–demand model is:
If input the average data, the expected value to pay per delivery (V) for client and courier will be 3.48 EUR per deliver.
5. Discussion
According to the results of the survey, many difficulties were reported in the delivery of the last mile, as well as the nuances of crowdsourcing delivery. If it comes to a large consignment of goods, starting from 31 kg, the crowdsourcing model becomes uncompetitive, as it does not allow using the necessary logistics solutions that are used in traditional urban logistics: a selection of the type of transport by the volume and characteristics of goods, organization, planning, and control of delivery.
During the survey, various difficulties arose. Therefore, many respondents refused to give any information, others gave it only partially. This is because the study is only of scientific interest, but does not have the support of state bodies to solve existing problems in the central part of Bratislava. Even though the percentage of respondents was about 50%, we still do not have a complete picture of the model for delivering goods to the Old Town.
In favor of the use of crowd-shipping is the fact that more than 28% of respondents agree to use new services to reduce costs and improve the service and 41% have not yet decided on the answer, which provides a basis for beliefs and discussions in the future; almost 70% of respondents appreciate the speed of delivery and more than 50% of deliveries must be made at least once every two days, with 32% of respondents saying that the batch of such delivery should be less than 30 kg, and given limited access to the historic part of Bratislava (time window), which strengthens the position of crowd-shipping, which can deliver at any time. The study also took into account the number of respondents who agree to expect delivery the next day, subject to a decrease in its cost. This will optimize the operation of the supply and consumption system and give a temporary reserve for the execution of the order.
The results of the research show that the sociodemographic characteristics of nonprofessional couriers (age, sex, race, income, and level of education) significantly influence the decision to participate in the mass transportation market (H1). Thus, about 50% of respondents of different sexes want to be random couriers for a certain amount of money [
36]. Couriers were interested in supporting the environment [
39], as well as reducing the impact on public transport in the city [
5]. The benchmark solutions for the crowd-shipping help to adjust the business model and market offer of other providers to the needs of different groups of stakeholders [
38].
Similar studies have previously been conducted to determine people’s interest in being nonprofessional couriers. Thus, the maximum willingness to work as crowd-shippers, expected to pay value per delivery [
31], travel time tolerance issues [
32] was studied.
A preliminary study of willingness to work as an occasional courier was conducted in Bratislava for the first time. A survey was conducted to determine the desire to work as a random courier using crowd shipping technology. As a result, respondents of different genders were interested in performing the functions of a courier and the main factors influencing the choice.
The data processing results showed that the occasional courier’s gender plays an important role in making willingness to work as an occasional courier. Of the 81 respondents wishing to work, most were interested in earning money. The results of the survey showed that 51% of respondents would be willing to work as an occasional courier for a certain amount of money.
Besides, it was found that expectations to pay mass shippers are reasonable and somewhat consistent with the literature on the value of time [
39]. Researchers point to a different range of variation in expected courier payment for delivery service from USD 9.2 to USD 19 per hour [
7,
39]. The research was conducted in the United States, where the standard of living is higher than in Slovakia. Previous research [
30] has shown the cost of a one-time delivery is 20 euros/delivery by truck and 0.4 EUR per 1 kg for courier delivery. The detected range of expected payment costs will allow shipping companies to form a compensation scheme that matches the expectations of random couriers. This will potentially increase the recruitment and retention of crowd partners in the system. Overall, according to obtained results the crowdsourcing technology has great potential for implementation in Bratislava (H2).
In contrast to the existing methods of determining demand [
8], we obtained the parameters supply volumes, optimal delivery time. The number of potentially willing respondents to use public transport in the delivery system was determined.
The obtained dependences partially coincide with the previously known ones [
7,
36] where “age” is not a significant parameter. This is, in part, a correct statement when considering male couriers. If we consider the interest of women in the desire to work as couriers, then for them the age factor is significant. It is also possible that the results obtained may be related to the traditional foundations of society and the individual behavior of the people of Bratislava [
29]. When considering a wider range of age parameters, it will be possible to refine the results.
6. Conclusions
This article presents the results of field studies of methods for determining the demand for transportation using crowdsourcing services in the Old Town in Bratislava. Such a study was conducted for the first time in Slovakia. At the moment, there is no complete, developed methodology for determining the demand for crowdsourcing services. Additionally, there is very little information and research that is aimed at determining the demand and supply for crowdsourcing services within Slovakia, which creates certain difficulties for the implementation of crowdsourcing as a complete logistics solution. At the same time, there are quite a lot of examples of the successful implementation of crowdsourcing and its planning methods in cities. However, the specifics of technology planning must be considered separately for a specific localities. This is due to cultural, economic, technological, and other factors.
This document helps to assess the potential of the Bratislava market for the use of the crowd shipping service, as well as for freight companies to better understand how to motivate staff and determine the potential cost of the service. The introduction of alternative methods of urban goods delivery reduces the number of required trucks in the traffic flow, which will reduce the number of traffic jams that occur when transporting very small bulk cargo. This work provides a basis for analyzing the application and effectiveness of crowdsourcing by studying the propensity of ordinary travelers towards willingness to work as an occasional courier in Bratislava. Further research is still needed to validate the results in different contexts and to expand knowledge in this area.
Identifying the impact of key sociodemographic characteristics that influence the willingness of nonprofessional couriers to work on crowd-shipping technology can potentially help service providers hire employees more successfully. In future works, it is necessary to consider additional factors, such as packing, the size, possibility, and conditions of transportation of perishable cargoes, the combined routes of delivery. Thus, understanding the expected results is useful for evaluating the incentives and motivations in which people want to be crowd partners. These ideas are also valuable for operational scheduling (for example, this information helps to compare delivery requests and possible courier times to avoid congestion).
The study was conducted before the COVID-19 epidemic in Slovakia, due to which the behavior of couriers was not sufficiently taken into account, especially in the cost of one delivery and in the number of available couriers at different times of the day. It would be useful in the future to conduct a study of the interest of residents to be couriers of crowd shipping.


 ,
, 


