
Trade Policy Uncertainty, Innovation and Total Factor Productivity


School of Economics, Peking University, Beijing 100871, China
*
Author to whom correspondence should be addressed.
Sustainability 2022, 14(1), 266; https://0-doi-org.brum.beds.ac.uk/10.3390/su14010266
Submission received: 4 December 2021
/
Revised: 22 December 2021
/
Accepted: 24 December 2021
/
Published: 27 December 2021
Abstract
:This paper explores the impact of trade policy uncertainty (TPU) shock on China’s total factor productivity. Using economic panel data for China, OECD countries, Hong Kong SAR, Macao SAR, and Singapore from the period 2003–2019, in this paper, we treat U.S.–China trade frictional events in 2016 and 2017 as a quasi-experiment to study the impact of TPU surge on China’s TFP under the synthetic control method (SCM) and generalized synthetic control method (GSCM), treating the OECD countries, Hong Kong SAR, Macao SAR, and Singapore as a control group. We found that TPU surge has a significantly negative causal effect on China’s TFP. SCM analysis, taking 2016 (2017) as the policy implementation time, showed that the average TFP loss borne by China due to trade policy uncertainty in 2017 and 2018 was 2.7% (3.5%). The VAR model showed that China’s trade policy uncertainty reduces China’s TFP through two channels: the shrinking channel of domestic R&D innovation, and the shrinking channel of the domestic sector’s use of foreign patents. This conclusion is robust according to the GSCM. To the best of the authors’ knowledge, this paper is the first attempt to examine the long-term technological impact of TPU surge during U.S.–China trade frictional events. Our findings suggest that trade friction harms technological progress, and reducing TPU can significantly enhance innovation and TFP.
1. Introduction
Policy uncertainty harms economic activities [1,2]. In recent years, the process of trade liberalization has encountered a bottleneck, and the haze of trade friction has shrouded trade liberalization, manifested by increased fluctuations and uncertainty in global trade policy. In recent years, with the constant stalemate of WTO negotiation, Brexit, and the United States exiting the Trans-Pacific Partnership (TPP) and renegotiating the North American Free Trade Agreement (NAFTA), Sino–U.S. trade frictions and other events have increased the uncertainty of global trade policy. Trade policy uncertainty may be an important part of policy uncertainty in the future.
There has been a range of prior research on the economic outcomes of trade policy uncertainty. Facchini et al. [3] studied the effect of dynamic adjustment of the internal migration rate on the trade policy uncertainty of importing countries by examining the quasi-natural experiment of China joining the WTO. Handley and Limao [4] examined the impact scale and action of mechanism of policy uncertainty on price, trade, and true income under the general equilibrium framework. Pierce and Schott [5] analyzed the impacts of reduced uncertainty of U.S. tariffs on imported Chinese goods on U.S. employment. Caldara et al. [6] noted that trade policy uncertainty affected short-term investment in the U.S. economy.
Trade policy uncertainty research is a branch of policy uncertainty research. In the early stage of the study, the academic circle paid more attention to market uncertainty and economic activity uncertainty, such as inflation uncertainty, international trade and financial market uncertainty, and the impact of economic growth uncertainty on other economic variables [7,8,9,10,11]. For example, Alexopoulos and Cohen [10] pointed out that the volatility degree caused by market uncertainty shock to short-term economy was equivalent to that caused by production technology shock, and market uncertainty shock was the biggest source of economic volatility after technology shock. Basu and Bundick [1] pointed out that financial market uncertainty increased households’ willingness to supply labor, thus reducing the wage rate and the marginal cost of production. Under sticky prices, an increase in price markups was observed; thus, market uncertainty led to short-term contraction of output. Caldara et al. [12] pointed out that uncertainty of the financial market led to the tightening of financing constraints, and the interaction of financial uncertainty and financial shock jointly led to the occurrence of the Great Depression in 1929. At present, academia has focused on policy uncertainty, such as monetary policy and fiscal policy uncertainty, and a series of studies in the literature have emphasized the importance of policy uncertainty [6,13,14,15]: policy uncertainty may be a more important reason for the increased volatility of short-term economic activities. Existing research in the field of policy uncertainty has mainly focused on the short-term economic fluctuation effect of policy uncertainty, which affects short-term consumption, output, price level, and investment through the following channels. Gourio [16], Fernandez-Villaverde et al. [2], and others pointed out that households increase precautionary savings and thus reduce current consumption in response to increased policy uncertainty. Born and Pfeifer [17] proposed the inverse Oi–Hartman–Abel effect of policy uncertainty. Due to the sticky price setting of the New Keynesian model, the marginal profit function of enterprises is convex. After an increase in policy uncertainty, in order to avoid negative profit, companies raise the prices of their products to self-insure, leading to higher price levels and lower aggregate supply. Bloom [14] pointed out that due to the irreversible cost of investment, enterprises delay investment in response to increased policy uncertainty, resulting in short-term investment contraction.
Research on the long-term economic impact of policy uncertainty relating to the topic of this paper is relatively rare. Sohag et al. [18] applied quantile-based time-series approaches and a quantile ARDL model to deal with extreme values and investigate the exchange rate response to Russian domestic economic policy uncertainty. An empirical investigation showed that local currency appreciates in response to increased Russian economic policy uncertainty under different quantiles of the managed floating exchange rate, but it depreciates under most quantiles in a floating exchange rate period. Moreover, Sohag et al. [19] focused on the long-run and short-run total factor productivity. They applied cross-sectional autoregressive distributed lags (CS-ARDL) to confirm that the use of renewed energy in the production process spurs TFP in the long run through different macroeconomic channels.
Furthermore, on the trade policy and trade pattern of China, Rasoulinezhad and Jabalameli [20] showed that BRICS countries do not share common trade patterns. The dominance of China in the total trade flows of BRICS has made the Chinese Yuan’s effects on trade with partners from different groups stronger than the impacts from other BRICS members’ national currencies. Rasoulinezhad [21] showed that the trade pattern between China and OPEC member countries relies on the Heckscher–Ohlin theory, thus being explained by differences in factor endowments such as energy resources and technology.
At present, regarding trade policy uncertainty, the existing literature mainly focuses on the short-term impacts of trade policy uncertainty on short-term economic variables, such as import and export, and employment. The impact of trade policy uncertainty on long-term variables such as TFP, as explored in this paper, has rarely been reported.
To investigate the impact of TPU on TFP, in this paper, we innovatively use 2016 and 2017 U.S.–China trade frictional events as a quasi-experiment, applying the synthetic control method (SCM) and generalized synthetic control method (GSCM). We use 36 OECD countries, Hong Kong, Macao, and Singapore as the control group, and we confirm that TPU has a significantly negative causal effect on China’s TFP. SCM analysis, taking 2016 (2017) as the policy implementation time, shows that the average TFP loss borne by China due to trade policy uncertainty in 2017 and 2018 was 2.7% (3.5%). A VAR model shows that China’s trade policy uncertainty reduces China’s TFP through two channels: the shrinking channel of domestic R&D innovation, and the shrinking channel of the domestic sector’s use of foreign patents. This conclusion is shown to be robust. To the best of the authors’ knowledge, this paper is the first attempt to examine the long-term technological impact of TPU surge during U.S.–China trade frictional events. Our findings suggest that trade friction harms technological progress, and that reducing TPU can significantly enhance innovation and TFP.
2. Impacts of Trade Policy Uncertainty on China’s TFP: Based on the Synthetic Control Method
2.1. Measurement of Trade Policy Uncertainty
The current measurement methods of uncertainty in monetary, fiscal, and trade policy mainly include the following: first, policy uncertainty is measured by the forecast error of monetary, fiscal, and trade policy instruments or intermediary targets, such as Meinen and Roehe [22]; second, the implied volatility and realized volatility of financial derivatives are used to measure policy uncertainty, such as Kurov and Stan [23]; third, the time-varying variance of the GARCH model is used as an estimate of policy uncertainty, such as Kumo [24]; fourth, the standard deviation of the policy variable is directly used to measure the uncertainty; fifth, the text data method is used to measure monetary policy uncertainty [25,26,27,28]; and sixth, the time-varying volatility model is used to establish a policy rule equation to estimate policy uncertainty [2,29,30].
At present, the most frequently used methods for studying policy uncertainty in the academic circle are text-data-based measurement methods and time-varying volatility models. The former can more accurately capture the true perception of micro subjects, but its measurement accuracy depends on the range of media and the choice of keywords and is closely related to the behavior characteristics of micro subjects; the advantage of the latter is the ability to separate the impact of policy uncertainty from the impact of policy level. In contrast, the uncertainty measured by the unpredictable part of policy has an intuitive meaning, but it is difficult to distinguish true policy uncertainty from the subjective opinions of respondents and to separate the impact of macroeconomic uncertainty. Measures of volatility and rate of vibration, such as the GARCH model, are simple and practical, but the measurement results can hardly distinguish the impact of policy uncertainty and the impact of policy level.
We first use the trade policy uncertainty (TPU) measured by text data, from Davis et al. [28]. The trade policy uncertainty measured by the time-varying volatility model is used for later robustness analysis. This method (Davis et al. [28]) first sets a package of text keywords that can represent policy uncertainty: uncertain, unclear, indefinite, unknown, unpredictable, difficult to estimate, unexpected. Secondly, keywords related to trade policy are set for establishing TPU: import tariff, import tax, import barrier, WTO, Uruguay Round, GATT, trade barrier, export subsidy, protectionism, dumping, trade law, and protectionism. Finally, the index construction is finished through statistics of the frequencies of TPU-related keywords in Chinese involved in the articles published on People’s Daily and Guangming Daily every month. The index construction results are shown in Figure 1.
It can be seen from the construction method of economic uncertainty indices that only when the package of text keywords representing policy uncertainty appeared in combination with a package of keywords related to specific policies, one uncertainty expression was counted, and we increased the frequency of the uncertainty index by 1. Therefore, cases like “keywords related to the ‘14th Five-Year Plan’ intensively appeared in newspapers and periodicals right after the 13th National People’s Congress passed the 14th Five-Year Plan” would not increase the economic uncertainty index.
According to the above figure, TPU rose significantly in 2017 and 2018. TPU rose to 641.3 in the first half of 2017, significantly higher than the average level (150) before 2017, and in the second half of 2017, TPU showed a significant drop. In 2018, TPU jumped again to 1071, and it remained high after that. This indicates two trade policy uncertainty shocks experienced by China in 2017 and 2018.
2.2. Synthetic Control Method
The synthetic control method, an extension of the DID method, has wider applicability [31]. It was first proposed by Abadie and Gardeazabal [32] and then perfected by Abadie et al. [32]. Compared with the common DID method, the synthetic control method has the following advantages: (1) The assumptions about the trends of the experimental group and the control group are looser. The classical DID model sets the impact of unobservable factors as a linear function of time and eliminates the effects of unobservables by difference, while the synthetic control method is more relaxed about the setting of unobservable factors. Further, both the DID method and the DID method under propensity score matching (PSM) require that the experimental group and the control group have similar basic characteristics and a common trend. Differently, the synthetic control method obtains a control group similar to the experimental group by synthesizing multiple control groups, that is, synthesizing a control group that has a common trend with the experimental group. This also explains why this method is so named. Therefore, the synthetic control method has wider application scenarios compared with the DID method. (2) In terms of the estimation method and effect, the synthetic control method abandons the simple average of a single control group or multiple control groups adopted by DID, and instead conducts weighted averaging or estimation to the control group to obtain a synthetic group for the treatment group. The synthetic treatment group has a greater correlation with the true treatment group in terms of time trend. By subtracting readings and values of the experimental group from those of the synthetic group after the experiment, we can obtain the experiment or policy effects. Abadie et al. [33] demonstrated that the causal effect estimator under the synthetic control method has a series of good statistical properties.
2.3. Estimation of the Causal Effect of Trade Policy Uncertainty on TFP
For this paper, we take the trade friction events in 2016 and 2017 as a quasi-experiment and use the factor model of Abadie et al. [33] to conduct policy effect assessment under the synthetic control method. Based on the model developed by Abadie et al. [33], we set the result variables of the treatment group and control group as follows:
and respectively represent the outcome variable of the ith individual not treated and treated, represents the homogeneous time fixed effect, and respectively represent the observable and unobservable concomitant variables of the ith individual independent of the quasi-experiment, and represent corresponding time-varying parameter vectors, represents stochastic disturbance, and is the treated dummy variable, so is the treatment effect of the experiment.
The control group of this paper comprises 36 OECD countries, Hong Kong, Macao, and Singapore. Since the TFP growth rate sequence fluctuates greatly against the fitting of the synthetic control method, the result variable takes the TFP level, and the TFP in 2003 was standardized to 1. The selected observable covariates Zi independent of the quasi-experiment consist of three categories: (1) variables directly related to R&D activities, such as the number of researchers per one million people (logarithmic value); (2) population structure variables, such as the proportion of laborers aged 15–64 and the college enrollment rate; (3) economic structural variables, such as savings ratio, proportion of manufacturing added value in GDP, and proportion of industrial added value in GDP; and (4) time-delay terms of the explained variables added to the model, as Abadie et al. [33] did. The model data were obtained from the World Bank WDI database and OECD database (data from 2003 to 2019).
Next, the selection of the policy implementation time is described. It should be noted that the TFP discussed in this section is expressed in annual data. If we understand the two TPU surges in 2017 and 2018 as two trade policy uncertainty shocks, since the two TPU shocks in 2017 and 2018 have direct impacts on the TFP of these two years but have no impact on the TFP in 2016 and before, we consider two quasi-experiments and set their respective policy implementation times to 2016 and 2017 for the sake of preciseness.
To judge the applicability of the synthetic control method in this paper, the covariate differences between true China before the quasi-experiment and “synthetic China” are compared first. Table 1 offers a comparison between the synthetic values and the true values of the predictive covariates under the synthetic control method. According to Table 1, the synthetic control method achieved good fitting results.
The policy evaluation results of the two quasi-experiments under the synthetic control method are presented in Figure 2. The true China TFP represents the true TFP under the impact of trade policy uncertainty; the synthetic China TFP was simulated from the other sample countries and is independent of the impact of trade policy uncertainty. The difference between the two is the policy effect of trade policy uncertainty on China’s TFP. Prior to policy implementation, the actual China TFP sequence is highly fitted to the synthetic China TFP sequence. After the trade policy uncertainty increases, namely, after the policy implementation, the synthetic curve becomes significantly differentiated from the actual curve. In both experiments, the synthetic China TFP is higher than the true China TFP, which means that trade policy uncertainty reduces China’s TFP. The measurement results of the synthetic control method with 2016 as the policy implementation time show that the average TFP loss caused by trade policy uncertainty to China in 2017 and 2018 was 2.7%; the measurement results of the synthetic control method with 2017 as the policy implementation time show that the TFP loss caused by trade policy uncertainty to China in 2018 was 3.5%.
To verify the robustness of the above conclusion, we borrowed the placebo test method of Abadie et al. [33]. The idea is to successively conceive each country of the control group as an experimental group—that is, assuming that only that country experienced the positive impact of trade policy uncertainty in 2016 (2017)—while the remaining countries are included in the control group (including China). Then, the synthetic control method is used to estimate the treatment effect of trade policy uncertainty on the TFP of that country—that is, to estimate the difference between the true TFP result variable of the country and the result variable of “synthetic China”. Following this idea, we carried out the above operations on all the countries of the original control group, obtained the distribution of the treatment effects, and then compared them with the treatment effect of China. If some countries in the original control group have a similar performance to China—that is, the true TFP result variable is far smaller than the result variable of “synthetic China” after intervention—it suggests that the above conclusion that “trade policy uncertainty suppresses total factor productivity” is not robust. It should be noted that under the synthetic control method, the synthetic result variable is a convex combination of individual result variables in the control group, which will inevitably lead to poor fitting effects for some countries with extreme values and, thus, incredibility of the estimation results. Therefore, in a placebo test of the outcome variables, we excluded countries with poor fitting effects and only retained those countries for which the root-mean-square prediction error (RMSPE) relative to China’s RMSPE before policy intervention differed by a factor of less than 3.
The placebo test results shown in Figure 3 and 4 show that the trade policy uncertainty at the treatment time of the two quasi-experiments had significantly greater treatment effects on China’s TFP than on the TFP of other countries. In other words, if the trade policy uncertainty had no impact on China TFP, the probability for the occurrence of the above result is less than 1/25, so we have every reason to believe that the above empirical results are robust.
2.4. Robustness Analysis: Generalized Synthetic Control
Xu [34] proposed the generalized synthetic control (GSC) model, which not only relaxes the often-violated parallel paths assumption of difference-in-difference (DID), but also unifies the synthetic control method with a linear fixed effects models under a simple framework, of which DID is a special case. Shaya and Sohag [35] scrutinized the causal linkage between the fracking boom and crime rates by GSC, and they confirmed that shale oil and gas extraction induces crime through different channels. To improve the robustness of our conclusion, we further applied GSC as a robustness check (Figure 5). The robustness test showed that the causal linkage between trade policy uncertainty and TFP is robust.
3. Mechanism Discussion and Robustness Test
The test results of the synthetic control method above confirmed that trade policy uncertainty has a causal effect on China’s TFP, and that trade policy uncertainty reduces China’s TFP. Next, a VAR model was used for mechanism analysis. Empirical analysis of the VAR model showed that China’s trade policy uncertainty reduces China’s TFP through two channels, i.e., a domestic research and development innovation shrinkage channel, and a channel of shrinkage of domestic sectors using foreign patents. Variable substitution and a time-varying volatility model were then adopted to measure China’s trade policy uncertainty and conduct a robustness analysis.
3.1. Mechanism Analysis
In this paper, we first used a text-data-based measurement method to measure trade policy uncertainty and used a VAR model to study the mechanism of action of trade policy uncertainty on research and development and technology. To be specific, similar to Baker et al. [25] and Fernandez-Villaverde et al. [2], we first constructed a VAR model with a constant term and a time trend term. In particular, when setting the VAR model, we set the trade policy uncertainty variable as an exogenous variable, independent of the other endogenous variables of the VAR model.
The variables used by the model can be divided into three categories: (1) production technology variables relevant to this paper, such as the logarithm of China’s TFP; (2) research and development innovation variables, such as the logarithm of the number of Chinese patent applications, the logarithm of the internal expenditure of Chinese R&D funds, and the logarithm of Chinese expenses relating to the use and transfer of foreign patents; and (3) a trade policy uncertainty variable based on text data—the trade policy uncertainty (TPU). The TPU was measured by the method of Davis et al. [28]. According to a package of TPU keywords, the TPU calculation process from Davis et al. [28] contains two aspects: tariff policy uncertainty and non-tariff policy uncertainty.
For the VAR model in this section, we used data for 1995–2019. Research and development innovation data were obtained from the China Statistical Yearbook on Science and Technology and the World Bank WDI database, and China TFP data were obtained from the estimation in Chapter 3 of this article. Before estimating the VAR model, we took the logarithms of Chinese patent applications, internal expenditure of national research and development funds, and Chinese expenses relating to the use and transfer of foreign patents; then, we took their differences to obtain a stationary sequence and took the logarithm of the policy uncertainty variable before setting it as the exogenous variable of the VAR model.
The impulse response results suggest that trade policy uncertainty has a significant negative impact on Chinese research and development and technology; China’s policy uncertainty reduces China’s total factor productivity through two channels, i.e., a domestic research and development innovation shrinkage channel, and a channel of shrinkage of domestic sectors using foreign patents. From the perspective of impact scale, one unit standard deviation of trade policy uncertainty could reduce the total factor productivity by at most 2.5%.
3.2. Robustness Analysis
To improve the robustness of the conclusion, the following variable substitution was conducted to measure China’s tariff uncertainty with time-varying volatility policy rules. This method has been widely used in the areas of fiscal uncertainty and monetary uncertainty [2,17].
To be specific, in the aspect of tariff, we set the following first-order autoregression process with time-varying volatility for the tariff rules in this paper:
The subscript x in the above formulas represents the tariff type, i.e., tariffs on imported consumer goods, tariffs on imported investment goods, and tariffs on Chinese products by trading partners. The tax rate data used by the model estimation contain the rate of tariffs on Chinese imported consumer goods, the rate of tariffs on imported investment goods, and the rate of tariffs on Chinese products by trade partners published by WITS in 1995–2018. With reference to the estimation of time-varying volatility fiscal rules and monetary rules by Fernandez-Villaverde et al. [2], the prior distribution of each variable was set to a uniform distribution, and the estimation process was completed using the Bayesian MCMC method. After completing the parameter estimation, we took as the measure of trade policy uncertainty. Table 2 shows estimation results.
We substituted the measured three tariff uncertainty indices into the above VAR model to obtain new impulse responses of tariff policy uncertainty to technology.
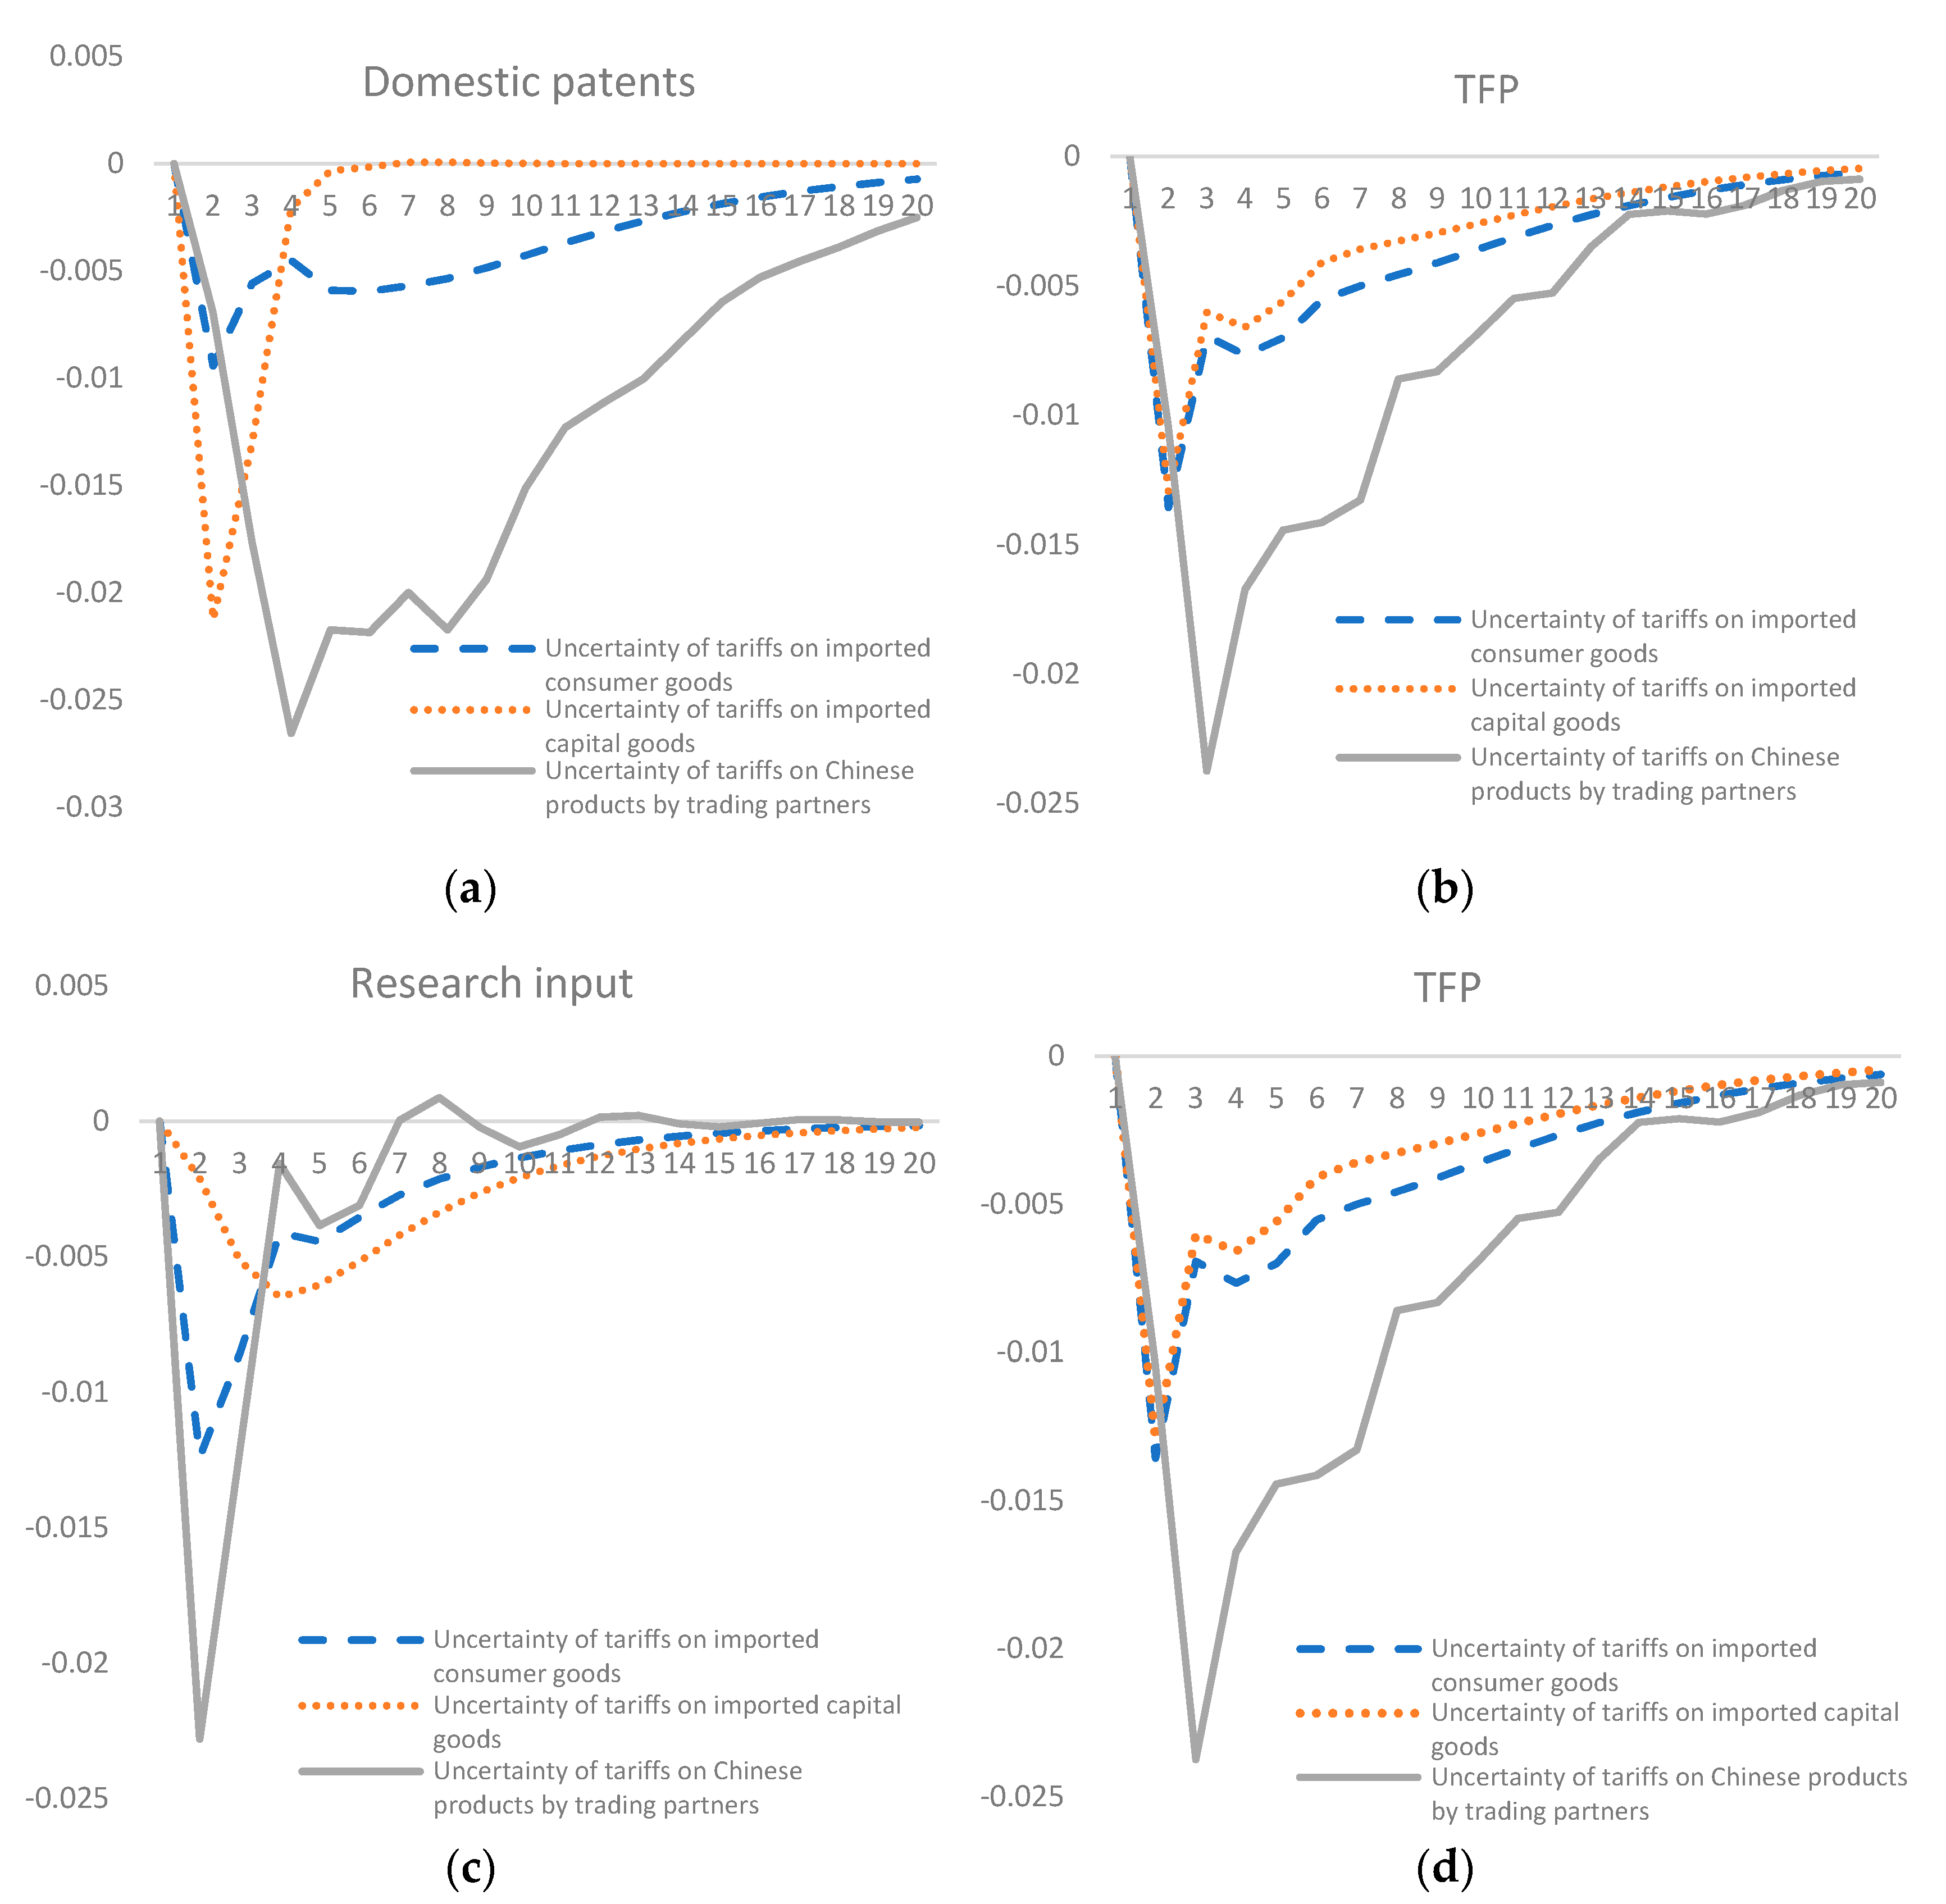
Figure 6 shows the conclusion obtained above: China’s trade policy uncertainty reduces China’s total factor productivity through two channels, i.e., a domestic research and development innovation shrinkage channel, and a channel of shrinkage of domestic sectors using foreign patents, and the conclusion is robust. Trade policy uncertainties from different sources have heterogeneous effects. A seen from the impact scale of policy uncertainty, the uncertainty of tariffs on Chinese products by trading partners has the greatest negative effect on total factor productivity and economic growth, followed by the uncertainty of tariffs on imported consumer goods. One unit standard deviation of uncertainty of tariffs on Chinese products by trading partners (tariffs on imported consumer goods) can cause a TFP contraction of around 2.3% (1.3%). At the same time, VAR evidence shows that the impact of tariff uncertainty has a faster rate of convergence. Figure 7 shows the heterogenous impacts of different types of tariff policy uncertainty on innovation.
4. Conclusions
In recent years, the process of trade liberalization has encountered a bottleneck, and the haze of trade friction has enveloped trade liberalization, which is embodied in the rise of global trade policy volatility and uncertainty. At present, in terms of trade policy uncertainty, the existing literature mainly focuses on the short-term impact of trade policy uncertainty on short-term economic variables, such as import, export, and employment, while there is no literature on the impact of trade policy uncertainty on long-term variables. This paper reports an innovative study on the impact of trade policy uncertainty on total factor productivity, which has both theoretical value and practical significance.
To assess the impact of trade policy uncertainty on China’s total factor productivity, in this paper, textual key words and time-varying volatility models were used to measure the uncertainty of China’s trade policy. The test results of the synthetic control method confirmed that trade policy uncertainty has a causal effect on China’s TFP, and trade policy uncertainty reduces China’s TFP. In terms of the mechanism of action, empirical analysis of the VAR model showed that China’s trade policy uncertainty reduces China’s total factor productivity through two channels: the shrinking channel of domestic R&D innovation, and the shrinking channel of the domestic sector’s use of foreign patents. The conclusion is robust.
In recent years, COVID-19 as a global phenomenon has reduced global GDP. From the perspective of this paper, our findings suggest that COVID-19 would have a detrimental effect on productivity. It has been proven that COVID-19 can be transmitted by traded goods, and several countries have set restrictions on international trade and travel. Since the outbreak of COVID-19 raises TPU, our conjecture is that it will have a detrimental effect on TFP. The most efficient way to combat COVID-19, to our best knowledge, is vaccines.
Trade policy during this period should ensure smooth flow of goods and increase policy transparency. As one of the largest economies, China should properly handle international trade policy and COVID-19 epidemic prevention to avoid the overflow of TPU over the world.
Author Contributions
Writing—original draft, Y.Z.; Writing—review and editing, Y.J. All authors have read and agreed to the published version of the manuscript.
Funding
This research received no external funding.
Institutional Review Board Statement
Not applicable.
Informed Consent Statement
Not applicable.
Data Availability Statement
All data generated or analyzed during this study are included in this published article.
Conflicts of Interest
The authors declare no conflict of interest.
References
- Basu, S.; Bundick, B. Uncertainty Shocks in a Model of Effective Demand. Econometrica 2017, 85, 937–958. [Google Scholar] [CrossRef]
- Fernández-Villaverde, J.; Quintana, P.F.; Kuester, K.; Ramirez, J.R. Fiscal Volatility Shocks and Economics Activity. Am. Econ. Rev. 2015, 105, 3352–3384. [Google Scholar] [CrossRef] [Green Version]
- Facchini, G.; Liu, M.Y.; Mayda, A.M.; Zhou, M. China’s great migration: The impact of the reduction in trade policy uncertainty. CEPR Discuss. Pap. 2018, 2018, 11279. [Google Scholar] [CrossRef]
- Handley, N.; Limao, N. Policy Uncertainty, Trade, and Welfare: Theory and Evidence for China and the United States. Am. Econ. Rev. 2017, 107, 2731–2783. [Google Scholar] [CrossRef] [Green Version]
- Pierce, J.R.; Schott, P.K. The surprising swift decline of US manufacturing employment. Am. Econ. Rev. 2016, 87, 545–564. [Google Scholar]
- Caldara, D.; Iacoviello, M.; Molligo, P.; Prestipino, A.; Raffo, A. The Economic Effects of Trade Policy Uncertainty. Int. Financ. Discuss. Pap. 2019, 2019, 1256. [Google Scholar] [CrossRef]
- Goel, R.K.; Ram, R. Irreversibility of R&D Investment and the Adverse Effect of Uncertainty: Evidence from the OECD Countries. Econ. Lett. 2000, 71, 287–291. [Google Scholar]
- Czarnitki, D.; Toole, A. Business R&D and the Interplay of R&D Subsidies and Product Market Uncertainty. Rev. Ind. Organ. 2007, 31, 169–181. [Google Scholar]
- Czarnitki, D.; Toole, A. Patent Protection, Market Uncertainty, and R&D Investment. Rev. Econ. Stat. 2011, 93, 147–159. [Google Scholar]
- Alexopoulos, M.; Cohen, J. Uncertain Times, Uncertain Measures; Working Paper 352; Department of Economics, University of Toronto: Toronto, ON, Canada, 2009. [Google Scholar]
- Basu, S.; Kimball, M. Cyclical Productivity with Unobserved Input Variation; National Bureau of Economic Research: Cambridge, MA, USA, 1997. [Google Scholar]
- Caldara, D.; Cristina, F.; Gilchrist, S.; Zakrajšek, E. The Macroeconomic Impact of Financial and Uncertainty Shocks. Eur. Econ. Rev. 2016, 88, 185–207. [Google Scholar] [CrossRef] [Green Version]
- Bloom, N. The Impact of Uncertainty Shocks. Econometrica 2009, 3, 623–685. [Google Scholar]
- Bloom, N.; Floetotto, M.; Jaimovich, N.; Saporta-Eksten, I.; Terry, S. Really Uncertain Business Cycles; National Bureau of Economic Research: Cambridge, MA, USA, 2012. [Google Scholar]
- Fernández-Villaverde, J.; Quintana, P.F.; Ramirez, J.R.; Uribe, M. Risk Matters: The Real Effects of Volatility Shocks. Am. Econ. Rev. 2011, 101, 2530–2561. [Google Scholar] [CrossRef] [Green Version]
- Gourio, F. Disaster Risk and Business Cycle. Am. Econ. Rev. 2012, 102, 2734–2766. [Google Scholar] [CrossRef] [Green Version]
- Born, B.; Pfeifer, J. Policy Risk and the Business Cycle. J. Monet. Econ. 2014, 6, 68–85. [Google Scholar] [CrossRef] [Green Version]
- Sohag, K.; Gainetdinova, A.; Mariev, O. The Response of Exchange Rates to Economic Policy Uncertainty: Evidence from Russia. Borsa Istanb. Rev. 2021, in press. [Google Scholar] [CrossRef]
- Sohag, K.; Chukavina, K.; Samargandi, N. Renewable energy and total factor productivity in OECD member countries. J. Clean. Prod. 2021, 296, 126499. [Google Scholar] [CrossRef]
- Rasoulinezhad, E.; Jabalameli, F. Do BRICS Countries Have Similar Trade Integration Patterns? J. Econ. Integr. 2018, 33, 1011–1045. [Google Scholar] [CrossRef]
- Rasoulinezhad, E. China’s foreign trade policy with OPEC member countries. J. Chin. Econ. Foreign Trade Stud. 2017, 10, 61–81. [Google Scholar] [CrossRef]
- Meinen, P.; Roehe, O. On measuring uncertainty and its impact on investment: Cross-country evidence from the euro area. Eur. Econ. Rev. 2017, 92, 161–179. [Google Scholar] [CrossRef]
- Kurov, A.; Stan, R. Monetary policy uncertainty and the market reaction to macroeconomic news. J. Bank. Financ. 2018, 86, 127–142. [Google Scholar] [CrossRef]
- Kumo, W. Inflation Targeting Monetary Policy, Inflation Volatility and Economic Growth in South Africa; Working Paper Series, 2154; African Development Bank: Abidjan, Côte d’Ivoire, 2015. [Google Scholar]
- Baker, S.R.; Bloom, N.; Davis, S. Measuring Economic Policy Uncertainty. Q. J. Econ. 2016, 131, 1593–1636. [Google Scholar] [CrossRef]
- Arbatli, E.; Davis, S.; Ito, A.; Miake, N.; Saito, I. Policy Uncertainty in Japan; National Bureau of Economic Research: Cambridge, MA, USA, 2017. [Google Scholar]
- Husted, L.; Rogers, J.; Sun, B. Monetary Policy Uncertainty. J. Monet. Econ. 2019, 115, 12–44. [Google Scholar]
- Davis, S.J.; Liu, D.; Sheng, X. Economic Policy Uncertainty in China since 1946: The View from Mainland Newspapers. Working Paper. Available online: https://dingqianl.github.io/web (accessed on 22 December 2021).
- Mumtaz, H.; Zanetti, F. The Impact of the Volatility of Monetary Policy Shocks. J. Money Credit. Bank. 2013, 45, 535–558. [Google Scholar] [CrossRef]
- Mumtaz, H.; Surico, P. Policy uncertainty and aggregate fluctuation. J. Appl. Econom. 2018, 33, 43–83. [Google Scholar] [CrossRef]
- Athey, S.; Imbens, G.W. The State of Applied Econometrics: Causality and Policy Evaluation. J. Econ. Perspect. 2017, 31, 3–32. [Google Scholar] [CrossRef] [Green Version]
- Abadie, A.; Gardeazabal, J. The Economic Costs of Conflict: A Case Study of the Basque Country. Am. Econ. Rev. 2003, 3, 113–132. [Google Scholar] [CrossRef] [Green Version]
- Abadie, A.; Diamond, A.; Hainmuller, J. Synthetic Control Methods for Comparative Case Studies: Estimating the Effect of California’s Tobacco Control Program. J. Am. Stat. Assoc. 2010, 6, 493–505. [Google Scholar] [CrossRef] [Green Version]
- Xu, Y. Generalized synthetic control method: Causal inference with interactive fixed effects models. Political Anal. 2017, 25, 57–76. [Google Scholar] [CrossRef] [Green Version]
- Shakya, S.; Sohag, K. The Fracking Boom and Crime Rates in Rural American States: Some Critical Insights. Extr. Ind. Soc. 2021, 8, 100948. [Google Scholar] [CrossRef]
Figure 1.
Trade Policy Uncertainty (TPU) indices measured by text data.

Figure 2.
China’s TFP loss under trade policy uncertainty (based on the synthetic control method).

Figure 3.
Robustness test (treatment time: 2016).

Figure 4.
Robustness test (treatment time: 2017).

Figure 5.
Robustness test (generalized synthetic control).

Figure 6.
Impact of policy uncertainty: (a) growth of Chinese patent applications; (b) Chinese R&D funds; (c) transfer of foreign patents; (d) TFP.
Figure 6.
Impact of policy uncertainty: (a) growth of Chinese patent applications; (b) Chinese R&D funds; (c) transfer of foreign patents; (d) TFP.

Figure 7.
Impacts of different types of tariff policy uncertainty (1 unit standard deviation): (a) Domestic patents; (b) TFP; (c) Research input; (d) TFP.
Figure 7.
Impacts of different types of tariff policy uncertainty (1 unit standard deviation): (a) Domestic patents; (b) TFP; (c) Research input; (d) TFP.


Table 1.
Synthetic values vs. true values of predictive variables.
| Policy Implementation Time | 2016 | 2017 | ||
|---|---|---|---|---|
| True Value (Average) | Synthetic Value (Average) | True Value (Average) | Synthetic Value (Average) | |
| Number of researchers per one million people | 974.50 | 943.12 | 991.85 | 961.93 |
| Proportion of service and commodity exports in GDP (%) | 27.72 | 26.52 | 27.20 | 26.33 |
| Proportion of service and commodity imports in GDP (%) | 23.63 | 22.96 | 23.26 | 22.76 |
| Proportion of laborers aged 15–64 (%) | 72.62 | 70.12 | 72.56 | 70.31 |
| Proportion of net FDI in GDP (%) | 3.33 | 3.03 | 3.20 | 3.06 |
| College enrollment rate (%) | 27.39 | 28.01 | 28.84 | 28.95 |
| Proportion of manufacturing added value in GDP (%) | 31.34 | 31.01 | 31.19 | 30.65 |
| Proportion of industry added value in GDP (%) | 45.21 | 44.76 | 44.90 | 44.54 |
| Savings rate (%) | 48.66 | 47.62 | 48.43 | 47.43 |
| Average TFP of 2004 | 1.022 | 1.023 | 1.022 | 1.223 |
| Average TFP of 2010 | 1.299 | 2.280 | 1.299 | 1.284 |
| Average treatment effect (TFP loss rate) | −2.7% | −3.5% | ||
Table 2.
Estimation results of tariffs.
| Parameter | Tariffs on Imported Consumer Goods | Tariffs on Imported Capital Goods | Tariffs on Chinese Products by Trading Partners |
|---|---|---|---|
| 0.5112 (−0.3113, 0.9773) | 0.4401 (0.1088, 0.7158) | 0.3451 (0.0078, 0.5612) | |
| 0.7312 (−0.7941, 1.014) | 0.9423 (0.1207, 1.396) | 0.6423 (0.1152, 1.231) | |
| 0.0213 (−0.0211, 0.091) | 0.05025 (−0.0122, 0.1213) | 0.04171 (0.0273, 0.0923) | |
| 0.7214 (0.5032, 0.8716) | 1.5432 (0.63, 2.502) | 1.0200 (0.93, 1.312) |
Publisher’s Note: MDPI stays neutral with regard to jurisdictional claims in published maps and institutional affiliations. |
© 2021 by the authors. Licensee MDPI, Basel, Switzerland. This article is an open access article distributed under the terms and conditions of the Creative Commons Attribution (CC BY) license (https://creativecommons.org/licenses/by/4.0/).
Share and Cite
MDPI and ACS Style
Zhou, Y.; Ji, Y. Trade Policy Uncertainty, Innovation and Total Factor Productivity. Sustainability 2022, 14, 266. https://0-doi-org.brum.beds.ac.uk/10.3390/su14010266
AMA Style
Zhou Y, Ji Y. Trade Policy Uncertainty, Innovation and Total Factor Productivity. Sustainability. 2022; 14(1):266. https://0-doi-org.brum.beds.ac.uk/10.3390/su14010266
Chicago/Turabian StyleZhou, Yuan, and Yao Ji. 2022. "Trade Policy Uncertainty, Innovation and Total Factor Productivity" Sustainability 14, no. 1: 266. https://0-doi-org.brum.beds.ac.uk/10.3390/su14010266
Note that from the first issue of 2016, this journal uses article numbers instead of page numbers. See further details here.