Article

Impact of Inter-Annual Variation in Meteorology from 2010 to 2019 on the Inter-City Transport of PM2.5 in the Beijing–Tianjin–Hebei Region

Key Laboratory of Beijing on Regional Air Pollution Control, Beijing University of Technology, Beijing 100124, China
*
Author to whom correspondence should be addressed.
Sustainability 2022, 14(10), 6210; https://0-doi-org.brum.beds.ac.uk/10.3390/su14106210
Submission received: 22 April 2022 / Revised: 14 May 2022 / Accepted: 14 May 2022 / Published: 20 May 2022
(This article belongs to the Special Issue Aerosols and Air Pollution)

Abstract

:
Air pollution has become a great challenge to achieving sustainable development. Among the pollutants, aerosols significantly affect human health and play an important role in global climate change. The concentration of aerosols in the ambient air is influenced strongly by the regional transport of pollutants and their precursors and may vary considerably under different meteorological conditions in different years. This inter-annual variation in meteorology may yield conflicting results in the quantification of the contribution from regional transport of air pollutants. It creates uncertainty for local governments to develop pollution control measures to reduce the challenges to sustainable development. Previous studies on this issue are often year-specific or cover short time spans, and the inter-city transport of air pollutants in the long term is still not fully understood. Therefore, in this study, the Weather Research and Forecasting (WRF) model and Community Multiscale Air Quality (CMAQ) model was used to assess inter-annual variations in the contribution of inter-city transport to the PM2.5 concentration in the Beijing–Tianjin–Hebei region from 2010 to 2019. To highlight the impact of inter-annual variations in meteorology, the authors used the same emission inventory and the same model configurations for the 10-year simulation. The major findings can be summarized as follows: (1) Both PM2.5 concentration and inter-city transport in the Beijing–Tianjin–Hebei (BTH) region were influenced by the inter-annual variation in meteorological conditions. (2) The simulated annual average concentrations in 13 cities in BTH are highly variable, with fluctuations ranging from 30.8% to 54.1%, and more evident variations were found in seasonal results. (3) Seven out of thirteen cities have a contribution from regional transport exceeding 50%, which are located in the eastern half of the Beijing–Tianjin–Hebei region. (4) The magnitude of the regional transport contribution varies significantly among the cities of BTH, on an annual basis, from a minimum inter-annual fluctuation of 8.9% to a maximum of 37.2%, and seasonal fluctuation is even more strongly evident. These results indicate that, when formulating pollution control strategies, inter-annual changes in meteorological conditions should not be ignored.

1. Introduction

Since the Chinese government implemented the “Action Plan on the Prevention and Control of Air Pollution” in 2013 to reduce anthropogenic emissions, the air quality in China has improved significantly. After the outbreak of COVID-19 in late 2019, the Chinese government enacted a strict isolation decision, which also had some temporary effects on air quality [1,2,3]. Specifically, in Beijing–Tianjin–Hebei (BTH), one of the most polluted regions of China, the annual concentration of fine particulate matter with an aerodynamic diameter ≤ 2.5 μm (PM2.5) showed a decrease of 51.9% from 2013 (106 μg/m3) to 2020 (51 μg/m3) (http://www.cnemc.cn/jcbg/zghjzkgb/, (accessed on 21 April 2022)). Behind these exciting achievements, it should be noted that under unfavorable meteorological conditions, cold-season PM2.5 pollution processes still occur, which have detrimental effects on human health and ecosystems. For example, on 22–24 January 2022, the average concentration of PM2.5 in Beijing reached 123 μg/m3.
The ambient PM2.5 concentration is influenced by both meteorological conditions and regional transport [4,5]. Previous studies found that meteorological factors, such as temperature, relative humidity, atmospheric pressure, and the planetary boundary layer (PBL) height, were closely related to PM2.5 concentration [6]. Specifically, high humidity promotes hygroscopic growth of aerosols and leads to a higher pollution level [7]. When the PBL height became lower, aerosols were generally confined near the surface, resulting in high surface PM2.5 concentration [8]. Enhanced near-surface winds will reduce the air pollution level through turbulence and outward transport of pollutants. Studies in China indicated that the influence of meteorological conditions on PM2.5 concentration, as well as its spatial and temporal distribution, is significant [9,10,11,12,13]. For instance, Zhai et al. [9] applied a stepwise multiple linear regression model to assess the meteorological contribution to PM2.5 and found that 12% of the decrease in PM2.5 from 2013 to 2018 was attributable to meteorology. Gui et al. [11] demonstrated that meteorology can explain 48% of PM2.5 concentration during 1998–2016 over Eastern China. Xu et al. [12] found that the fluctuating range of meteorological impact on PM2.5 concentration was between 9.3% and 55.1% from 2000 to 2017. Zhang et al. [14] estimated the contributions of meteorological changes to PM2.5 reduction from 2013 to 2017; the results show that PM2.5 concentration in winter increases by approximately 40–100% compared with other seasons due to unfavorable weather conditions.
Lots of studies have investigated the relationship between regional transport and the formation of PM2.5 pollution in different areas of China [15,16,17,18,19,20,21,22,23,24,25] and found that the air quality was affected by both local emissions and regional transport of pollutants. Hua et al. [26] found that during periods of severe air pollution, the effect of regional transport tends to be more significant, and changes in meteorology may lead to remarkable changes in the contribution rate of regional transport. However, there are significant differences in terms of how much PM2.5 pollution can be contributed by regional transport [27,28,29,30,31]. Taking Beijing as an example, Lang et al. [31] and Chang et al. [23] evaluated the contribution of regional transport to PM2.5 in Beijing in 2010 and 2014, respectively. Wang et al. [32] investigated this issue in the BTH region in 2015. The results of Lang et al.’s study reveal that the annual average contribution of regional transport to PM2.5 in Beijing was 42.2%, and 45.9% according to Chang et al., while Wang et al. found that regional transport only contributed 33.7%. Furthermore, significant differences in the regional contribution in each season between these studies could be found. For example, Lang et al. estimated that the regional contribution to PM2.5 in Beijing in July was 75.2%, Chang et al. stated it was 61.9%, but Wang et al. found that it was only 38.4%. These studies are often based on a specific year, and thus the differences in pollutant emissions, meteorological conditions, and simulation tools in these different years can lead to conflicting results. Among them, the role of meteorology may be very important, as the frequency of the occurrence of unfavorable meteorological conditions, the duration, and the scope of influence are different each year. However, the extent to which the regional contribution to air quality varies under various meteorological conditions is not yet fully understood.
In a pioneering study, Dong et al. [33] evaluated the impacts of inter-annual meteorological conditions on regional air pollution transport in the BTH region from 2014 to 2017 by employing CMAQ embedded within the Integrated Source Apportionment Model (CMAQ-ISAM). Their results suggest that the regional transport is sensitive to meteorology variation, with the impacts of meteorological variations on regional transport being up to 40% in spring and winter. However, their conclusion is based on a relatively limited time span. Inspired by Dong et al. [33], our previous study [34] employed the WRF/CMAQ model to investigate this issue in Beijing over a longer time span (2001–2015) and found that inter-annual meteorological variation has a considerable impact on both PM2.5 concentration in Beijing and the contribution of regional transport. However, the conclusions of our previous study are only based on a local scale, and whether the same conclusion can be drawn about the influence of inter-annual variation in meteorological conditions on inter-regional transport is still unknown.
Therefore, the WRF/CMAQ modeling system was employed to investigate the interannual variation in inter-regional transport contribution to PM2.5 under various meteorological conditions from 2010 to 2019. As one of most polluted regions, the BTH region was selected as the research area. Notably, the emission inventory and model configuration were kept constant throughout the study, except for the inter-annual meteorological condition. The results of this study will help policymakers formulate more effective, regional joint-emission control policies.

2. Methodology

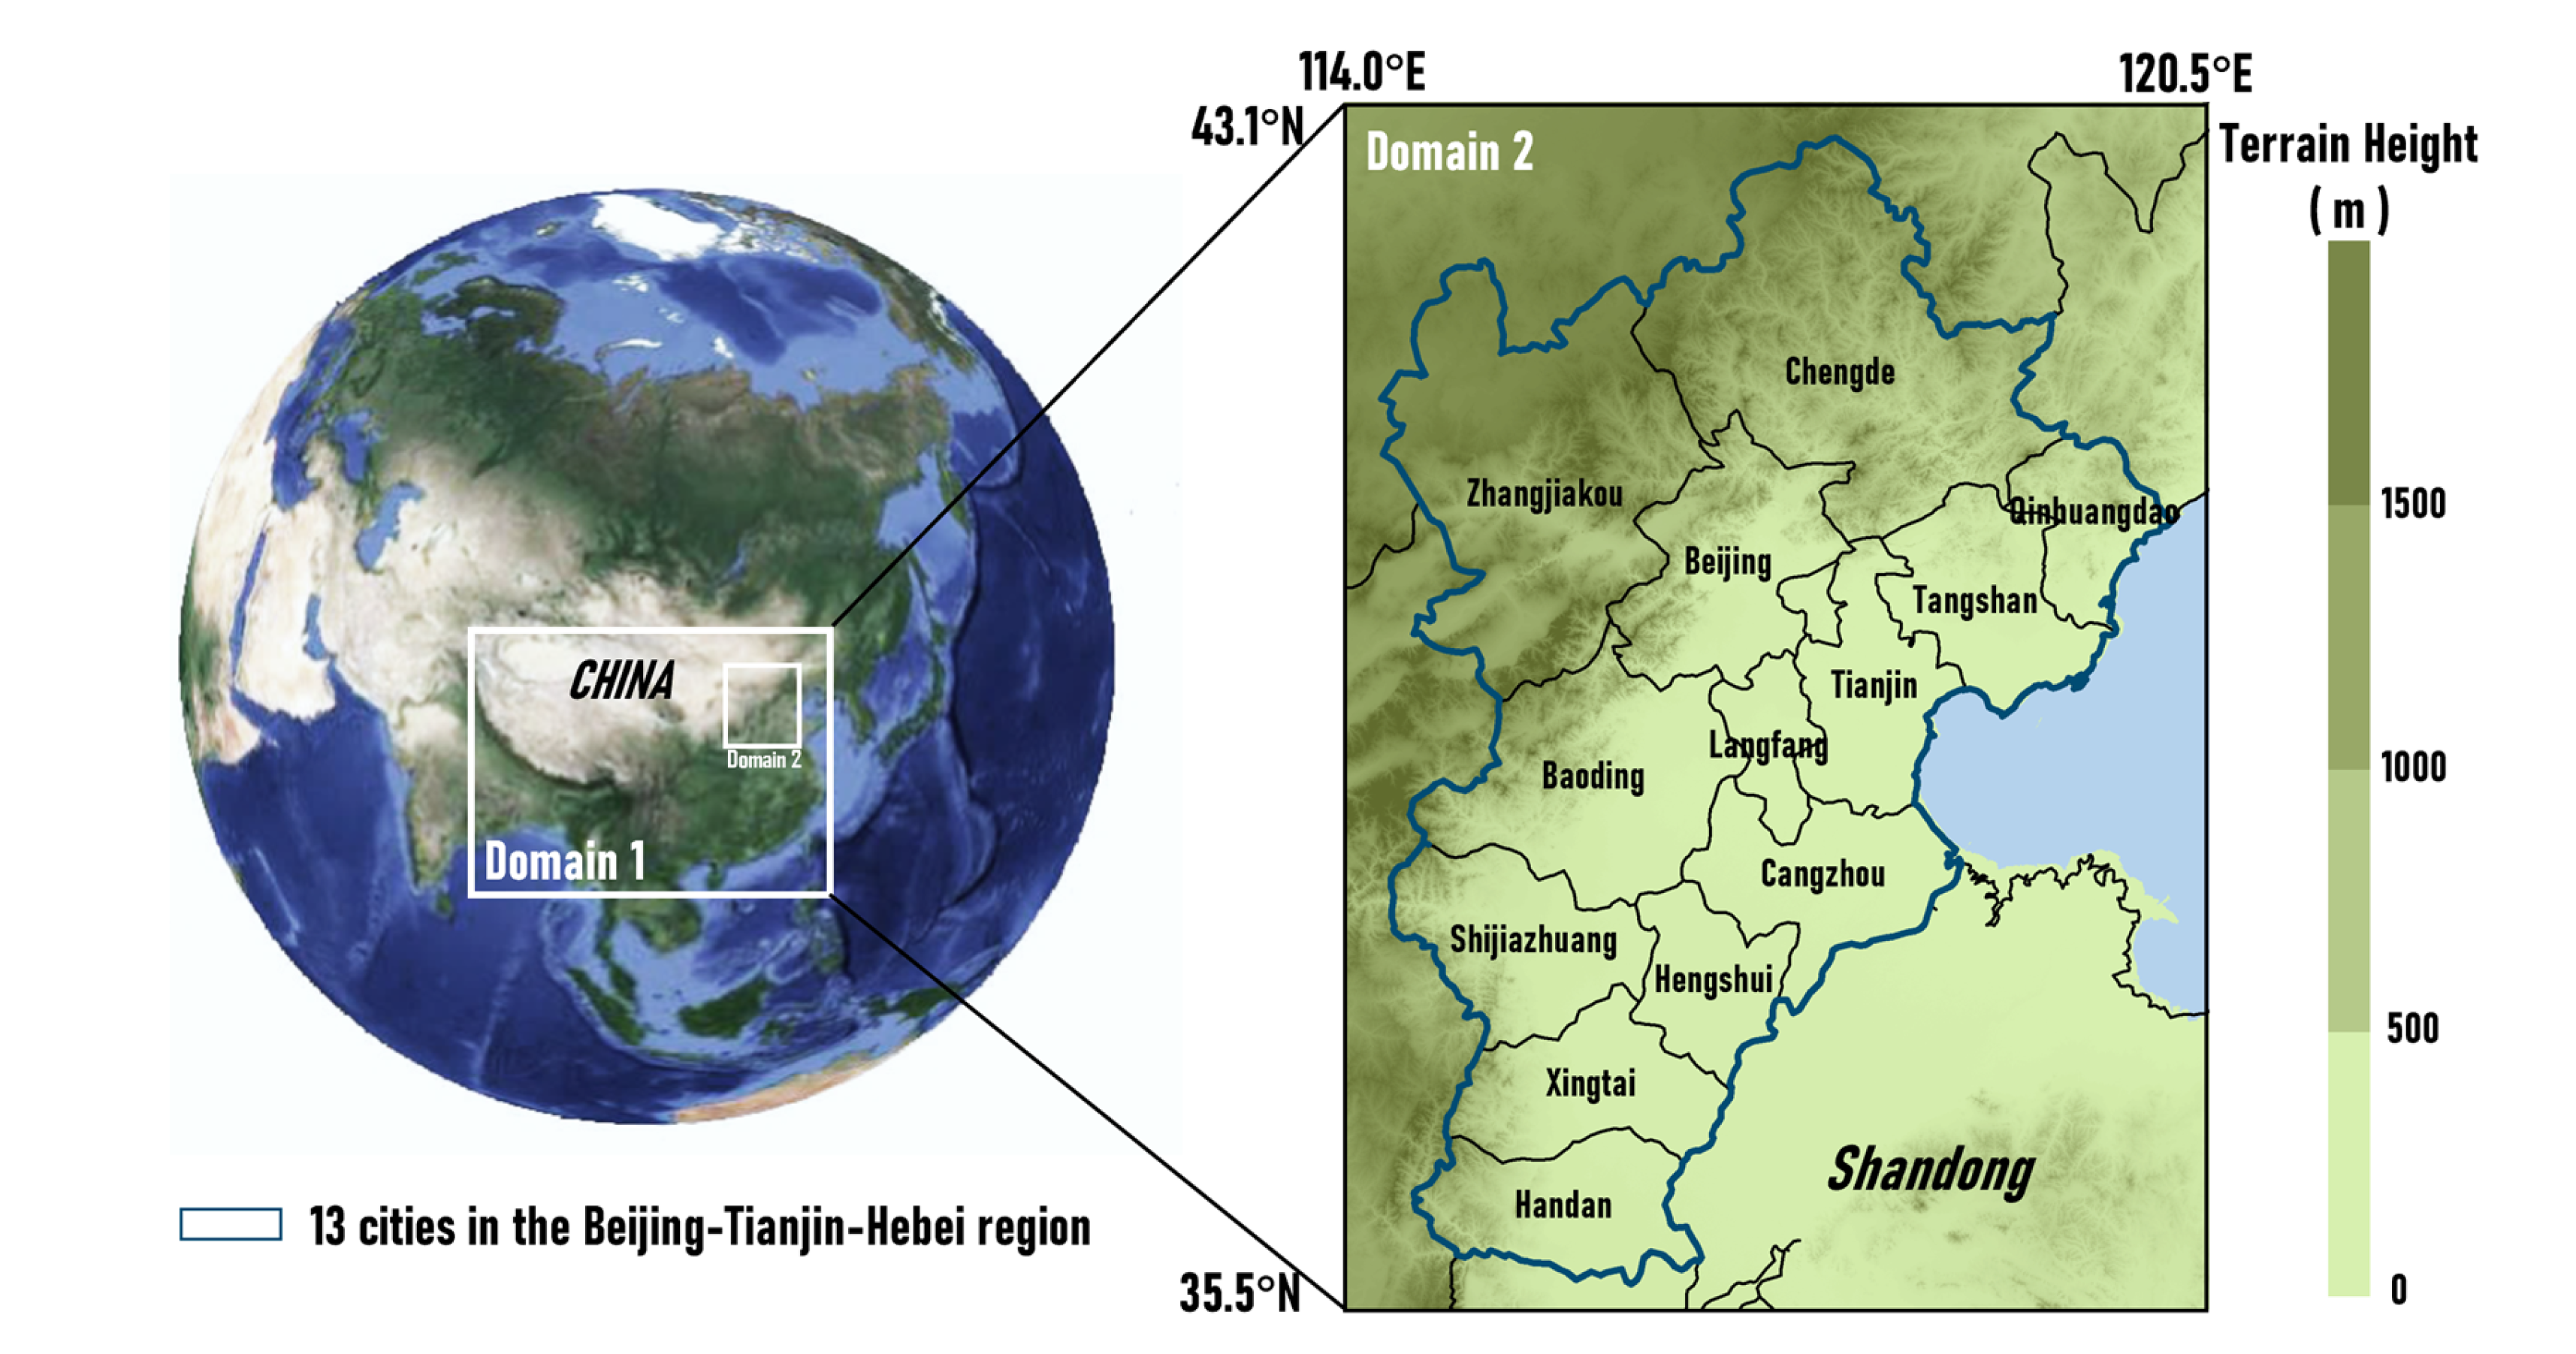
2.1. Study Area and Modeling Domains

The study area and the two-level nested domains of the model system are shown in Figure 1. The grid resolution of domain 1 is 27 km × 27 km (158 rows and 184 columns), covering most of China. Domain 2 is set with a grid resolution of 9 km × 9 km (90 rows and 65 columns), covering the BTH region.

2.2. Model Configuration and Input Data

In this study, to investigate the impact of interannual meteorological variation on the regional transport contribution from 2010 to 2019, the WRF/CMAQ model system was employed for simulation. The input data and model configuration of the modeling system are shown as follows:
Meteorological data: The WRF model uses Final Analysis (FNL) data with a temporal resolution of 6 h and a horizontal resolution of 1° × 1° provided by the National Center for Environmental Prediction (NCEP) to generate the initial and boundary conditions, which provided the meteorological input for the CMAQ model (https://rda.ucar.edu/datasets/ds083.2/, (accessed on 21 April 2022)).
Emission data: The anthropogenic emissions data used in this study were obtained from the Multi-resolution Emission Inventory of China (MEIC). As a complement, the biomass burning emission developed by Zhou et al. was also used [35].
The WRF model configuration: The Purdue-Lin microphysics parameterization scheme [36], the Noah Land-Surface scheme [37], the Yonsei University (YSU) Planetary Boundary Layer (PBL) scheme [38], the New Goddard shortwave radiation scheme, the GFDL longwave radiation scheme, and the Grell–Devenyi cumulus scheme were selected as the major meteorological physical schemes in this study.
The CMAQ model configuration: The Carbon Bond 05 (CB05) mechanism with chlorine and the updated toluene chemistry [39] was selected as the gaseous chemistry mechanisms; the sixth generation CMAQ aerosol module (AERO6), extended sea salt emission, and thermodynamics were used as aerosol mechanisms [40].The ISAM module, implemented within the CMAQ model and using the trace method to tag the emissions from different regions [41], was used to calculate the impact of inter-regional transport on PM2.5 in the BTH region.

2.3. Model Evaluation

The WRF model and the CMAQ model have been extensively used and evaluated in the authors’ [34,42,43,44,45,46] and other researchers’ studies [19,23,47,48]. The same is the case with the ISAM module [41,49,50]. In this study, a similar evaluation method by Chen et al. [34] and various statistical indicators were used to evaluate the performance of the model.
To evaluate the performance of the WRF model, simulated and observed meteorological parameters for 170 sites in January, April, July, and October 2014 were compared and shown in Table 1. The observation data were obtained from the China Meteorological Administration (http://data.cma.cn/, (accessed on 21 April 2022)) [51]. High correlation coefficients (R, 0.70–0.90) and low Normalized Mean Bias (NMB, ±20%) and Normalized Mean Error (NME, 3.37–32.97%) proved that the model performances were acceptable.
To evaluate the performance of the CMAQ model, the comparisons of simulated and observed PM2.5 concentrations at 130 sites (http://www.cnemc.cn/, (accessed on 21 April 2022)) [52] for each simulated month (January, April, July, October in 2014) are shown in Table 2. The results show a high correlation coefficient (R, 0.79–0.90) between the observed and simulated concentrations. The values of MFB and MFE ranged from −6.59% to −5.30%, and from 8.31% to 11.97%, respectively. According to the suggested criteria (MFB ± 60% and MFE < 75%) by Boylan and Russell [53], the simulation results are within the acceptable range. These differences exist between the simulated and the observed values and can be explained by the unavoidable deficiencies of meteorological and air quality models and the inherent uncertainties of meteorological data and emission inventories [54,55,56].

3. Results and Discussion

This study investigates the impact of inter-annual meteorological changes from 2010 to 2019 on the PM2.5 concentration in each city in the Beijing–Tianjin–Hebei region and the contribution of regional transport to PM2.5 between cities. In order to highlight the impact of meteorological variation in different years, the emission inventory of the same year (2014) was used in the 10-year simulation, and all model configurations were kept consistent, only changing each year’s meteorological data. It should be noted that, in order to improve the computational efficiency, four months (January, April, July, and October) were selected as the representative months of each year in this study. Although there will be some differences compared with the 12-month calculation scheme, this study can still reflect the impact of inter-annual changes in PM2.5 concentration and regional transport.
Before proceeding with further analysis, it is necessary to review the changes in PM2.5 concentration in the BTH region in the past decade. In order to show more clearly the improvement of air quality, the authors compare four-year periods by dividing the past 12 years from 2010 to 2021 into 3 phases for discussion. As shown in Figure 2, the air quality in the region has significantly improved in recent years. In particular, the central and southern regions, which were once highly polluted in the past, have improved more significantly.

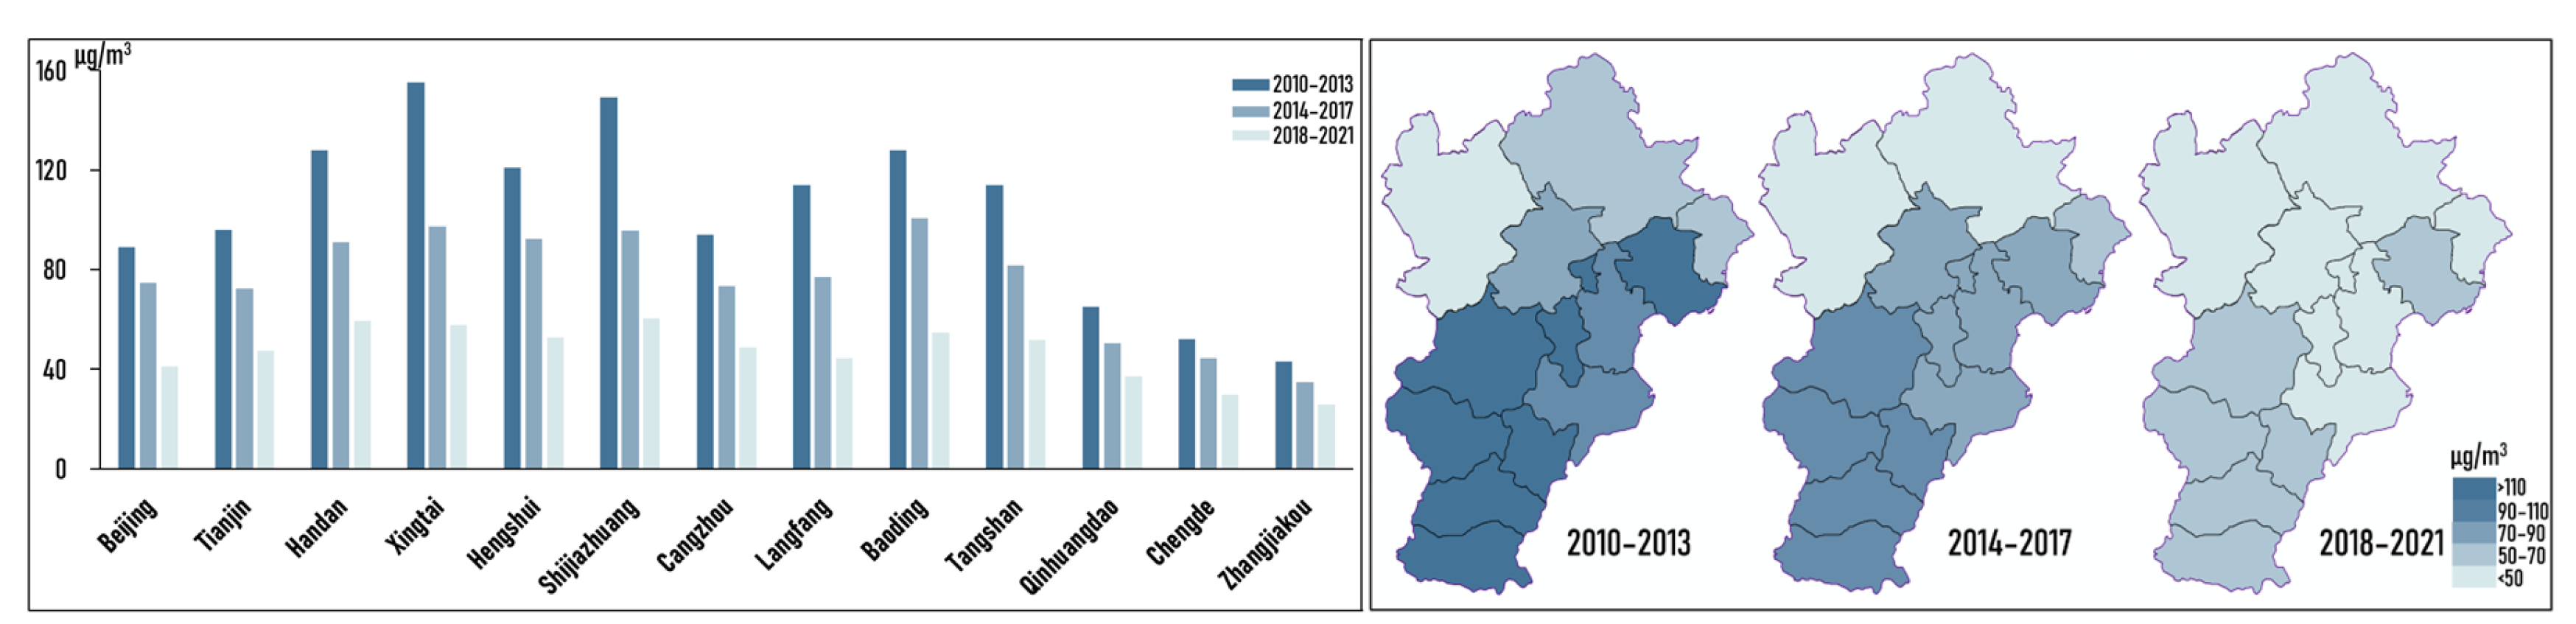
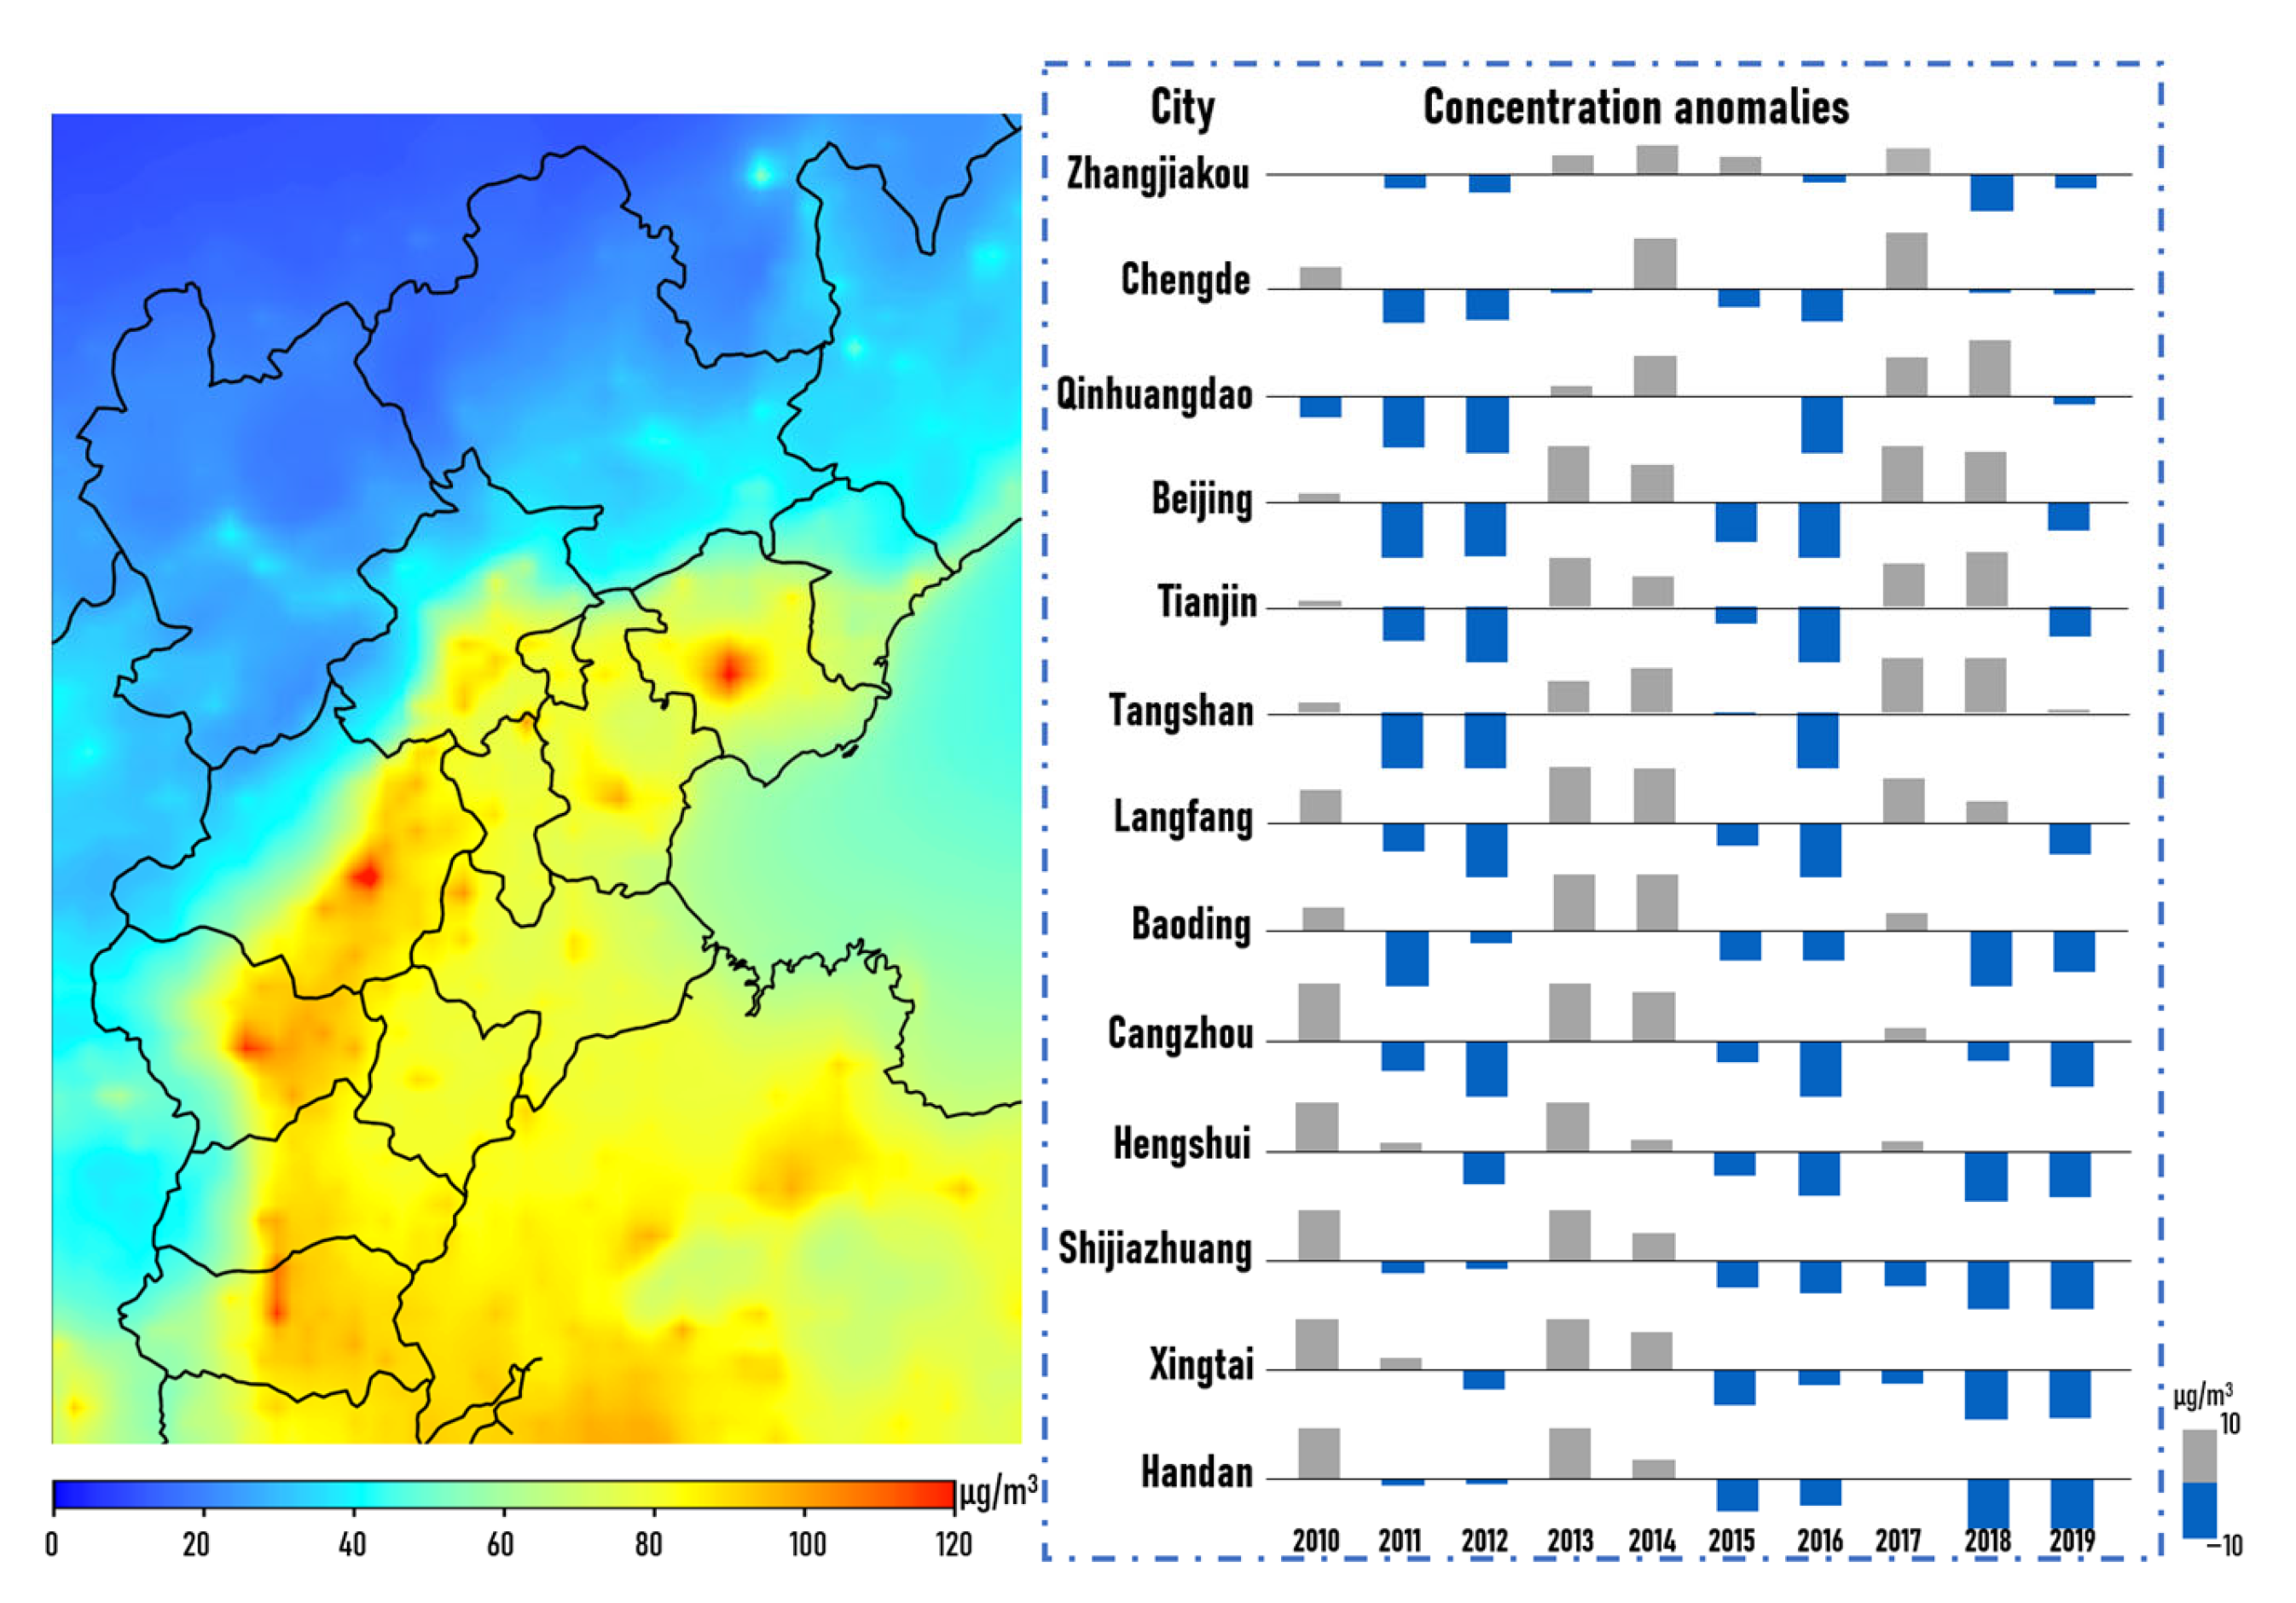
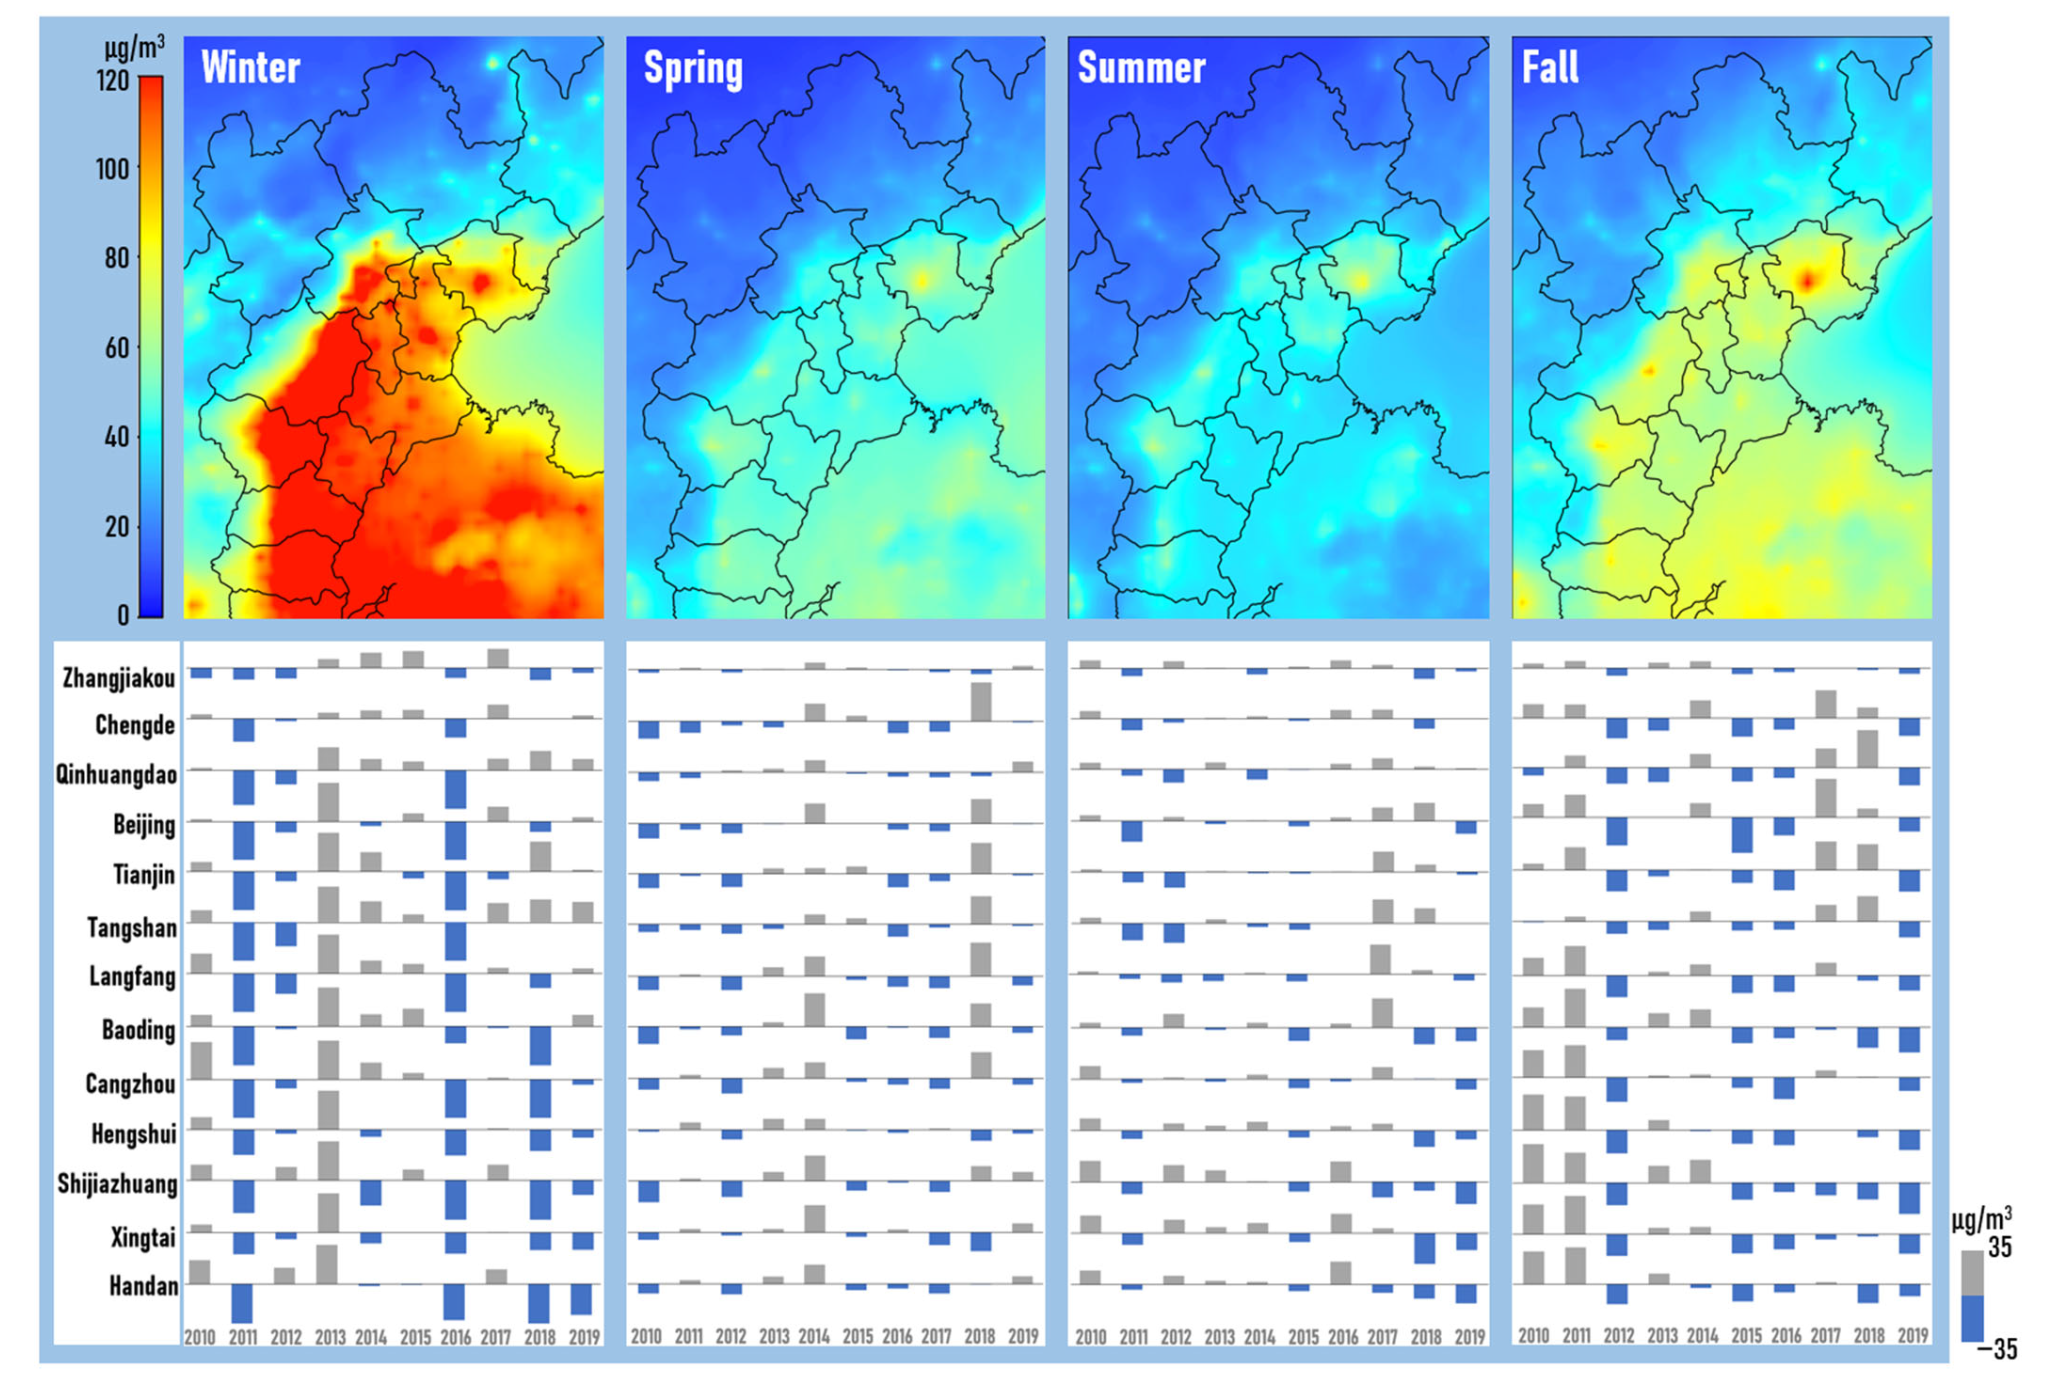
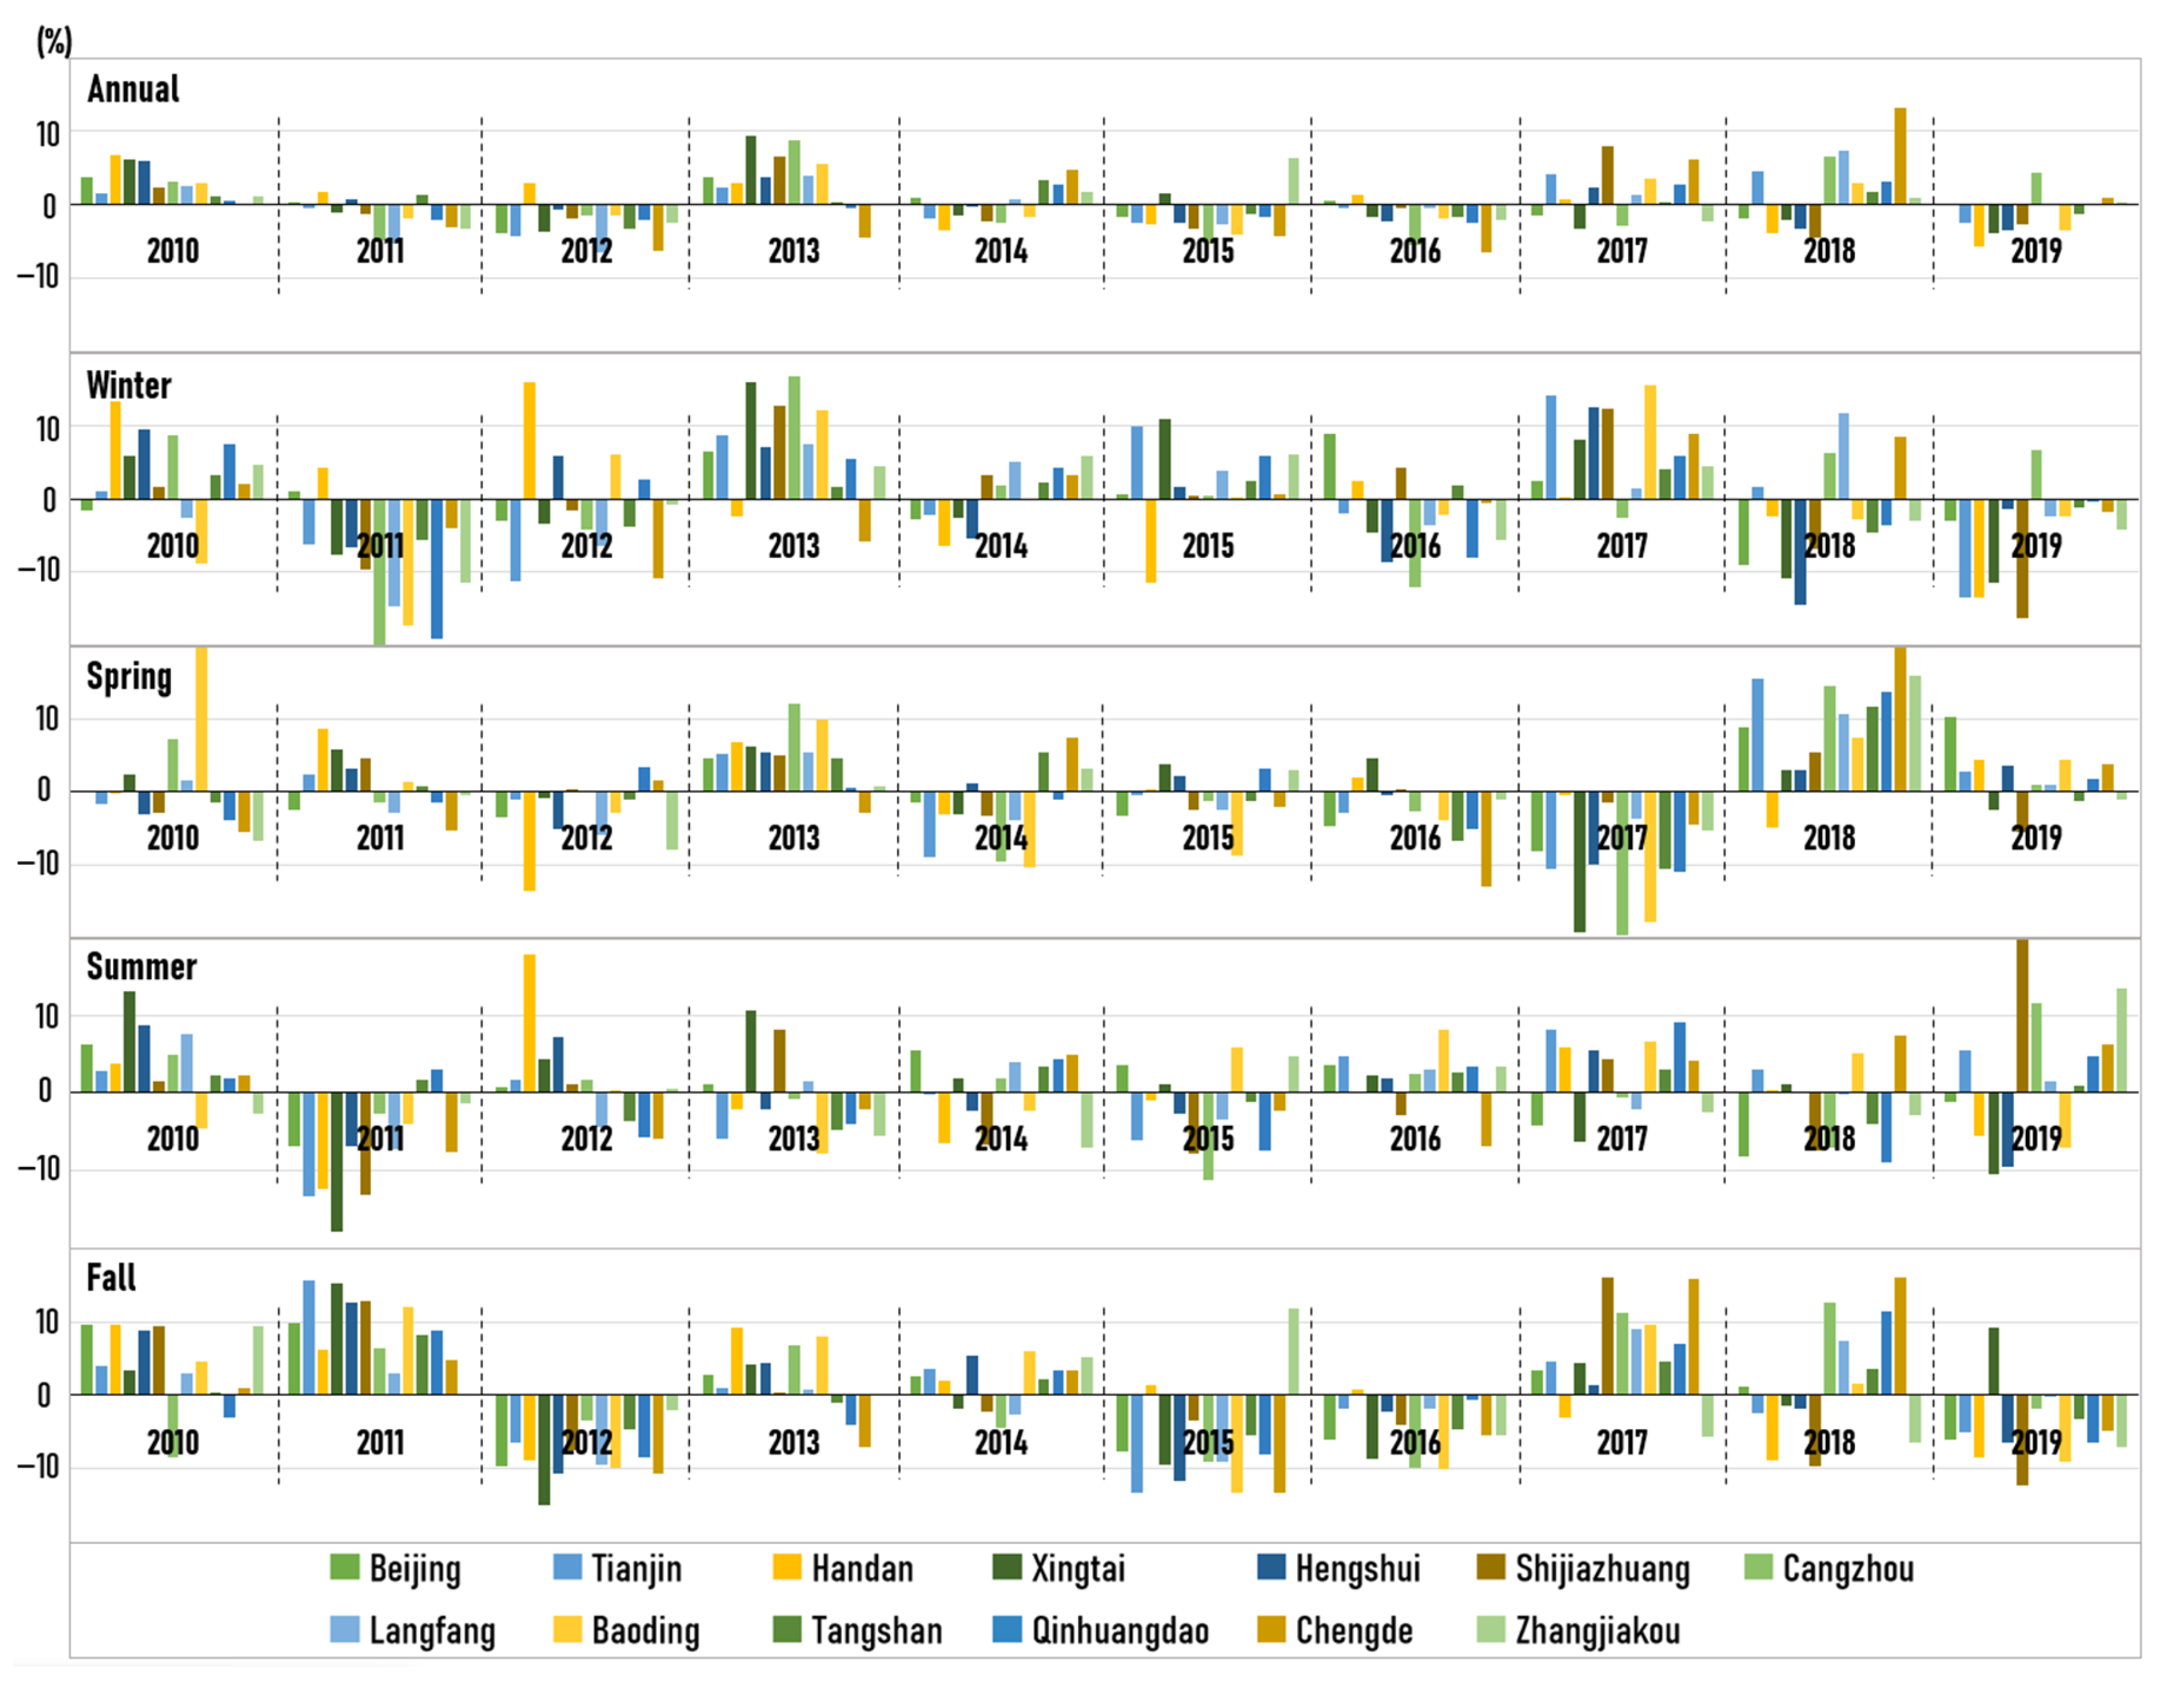
3.1. Impact of Inter-Annual Meteorological Variation on PM2.5 Concentration in Beijing–Tianjin–Hebei Region

Table 3 lists the average concentration of PM2.5 in 13 cities in the BTH region from 2010 to 2019 based on the 2014 emission inventory. The results show that the 10-year average PM2.5 concentration in 13 cities ranged from 30.1 μg/m3 to 134.4 μg/m3, showing a strong spatial inhomogeneity distribution. The highest PM2.5 concentration was found in Baoding (134.4 μg/m3), and the concentrations in cities located in the southern part of the study area, such as Shijiazhuang, Xingtai, and Handan, were also relatively higher (128.2 μg/m3, 104.2 μg/m3, and 122.0 μg/m3, respectively). In contrast, the PM2.5 concentrations in cities located in the northern part of the study area, such as Zhangjiakou and Chengde, were relatively low. It should be noted that the concentration of PM2.5 in all cities exceeded that recommended by the World Health Organization in 2006 (10 μg/m3, WHO, 2006), and the value was improved in 2021 (5 μg/m3, WHO, 2021).
In addition to evident changes in spatial distribution, the inter-annual variation in PM2.5 concentrations in these cities is also significant. The 10-year fluctuation rate (Fluctuation rate = (Maximum − Minimum)/Average × 100%) of PM2.5 concentration and the annual anomaly (the term “anomaly” refers to a departure from the reference value or long-term average; here, Anomaly = Annual Concentration − 10-year Average) were calculated in each city and are listed at the bottom of Table 3. The fluctuation rate in 13 cities ranged from 30.8% to 54.1%, indicating that the PM2.5 concentrations in BTH regions could be highly sensitive to the inter-annually varying meteorological conditions. Of the 13 cities, Shijiazhuang had the largest inter-annual variation in PM2.5 concentration (with a fluctuation rate of 54.1%), indicating that it was the most significantly affected by the inter-annual variation in meteorology. Although the fluctuation rate of Chengde was the smallest among the 13 cities, it still reached 30%.
Good regional consistency was found in the inter-annual changes in PM2.5 concentration in the 13 cities over the 10 years. As shown in Figure 3, in most cases, the anomalies of cities inside the BTH region had the same sign (all positive or negative). However, there were also a few years in which anomalies were of the opposite sign. For example, in 2018, some cities had positive anomalies, while other cities had negative anomalies. Specifically, cities in the southern part of the BTH region, such as Baoding, Shijiazhuang, Xingtai, Hengshui, and Handan have basically the same anomalies (negative), while positive anomalies are found in most cities in the northern region. However, regional characteristics could be found in the study area, and the geographically adjacent cities generally show good consistency, indicating that the inter-annual variations in meteorological conditions in the BTH region show more regional characteristics rather than local.
Figure 4 shows the simulated 10-year average PM2.5 concentration in the 13 cities for each season (represented by January, April, July, and October). Strong seasonality is also shown in the multi-year averaged PM2.5 concentration. The corresponding inter-annual variations in the seasonal values are also presented in the figure. It was found that the PM2.5 concentration in winter is the highest, followed by fall and spring, and the concentration in summer is the lowest. A similar situation occurred in the inter-annual changes in the average PM2.5 concentration in each season. The variation in winter is the most significant among the four seasons, with the fluctuations in 13 cities ranging from 59.5% to 112.3%. In winter, Baoding and southern cities, such as Shijiazhuang, Xingtai, and Handan are more sensitive to meteorological changes than the other cities. In contrast, in northern cities, such as Zhangjiakou, Chengde, and Qinhuangdao, the inter-annual changes among the four seasons are less significant than in other cities, although winter is still the most significant among the four seasons.

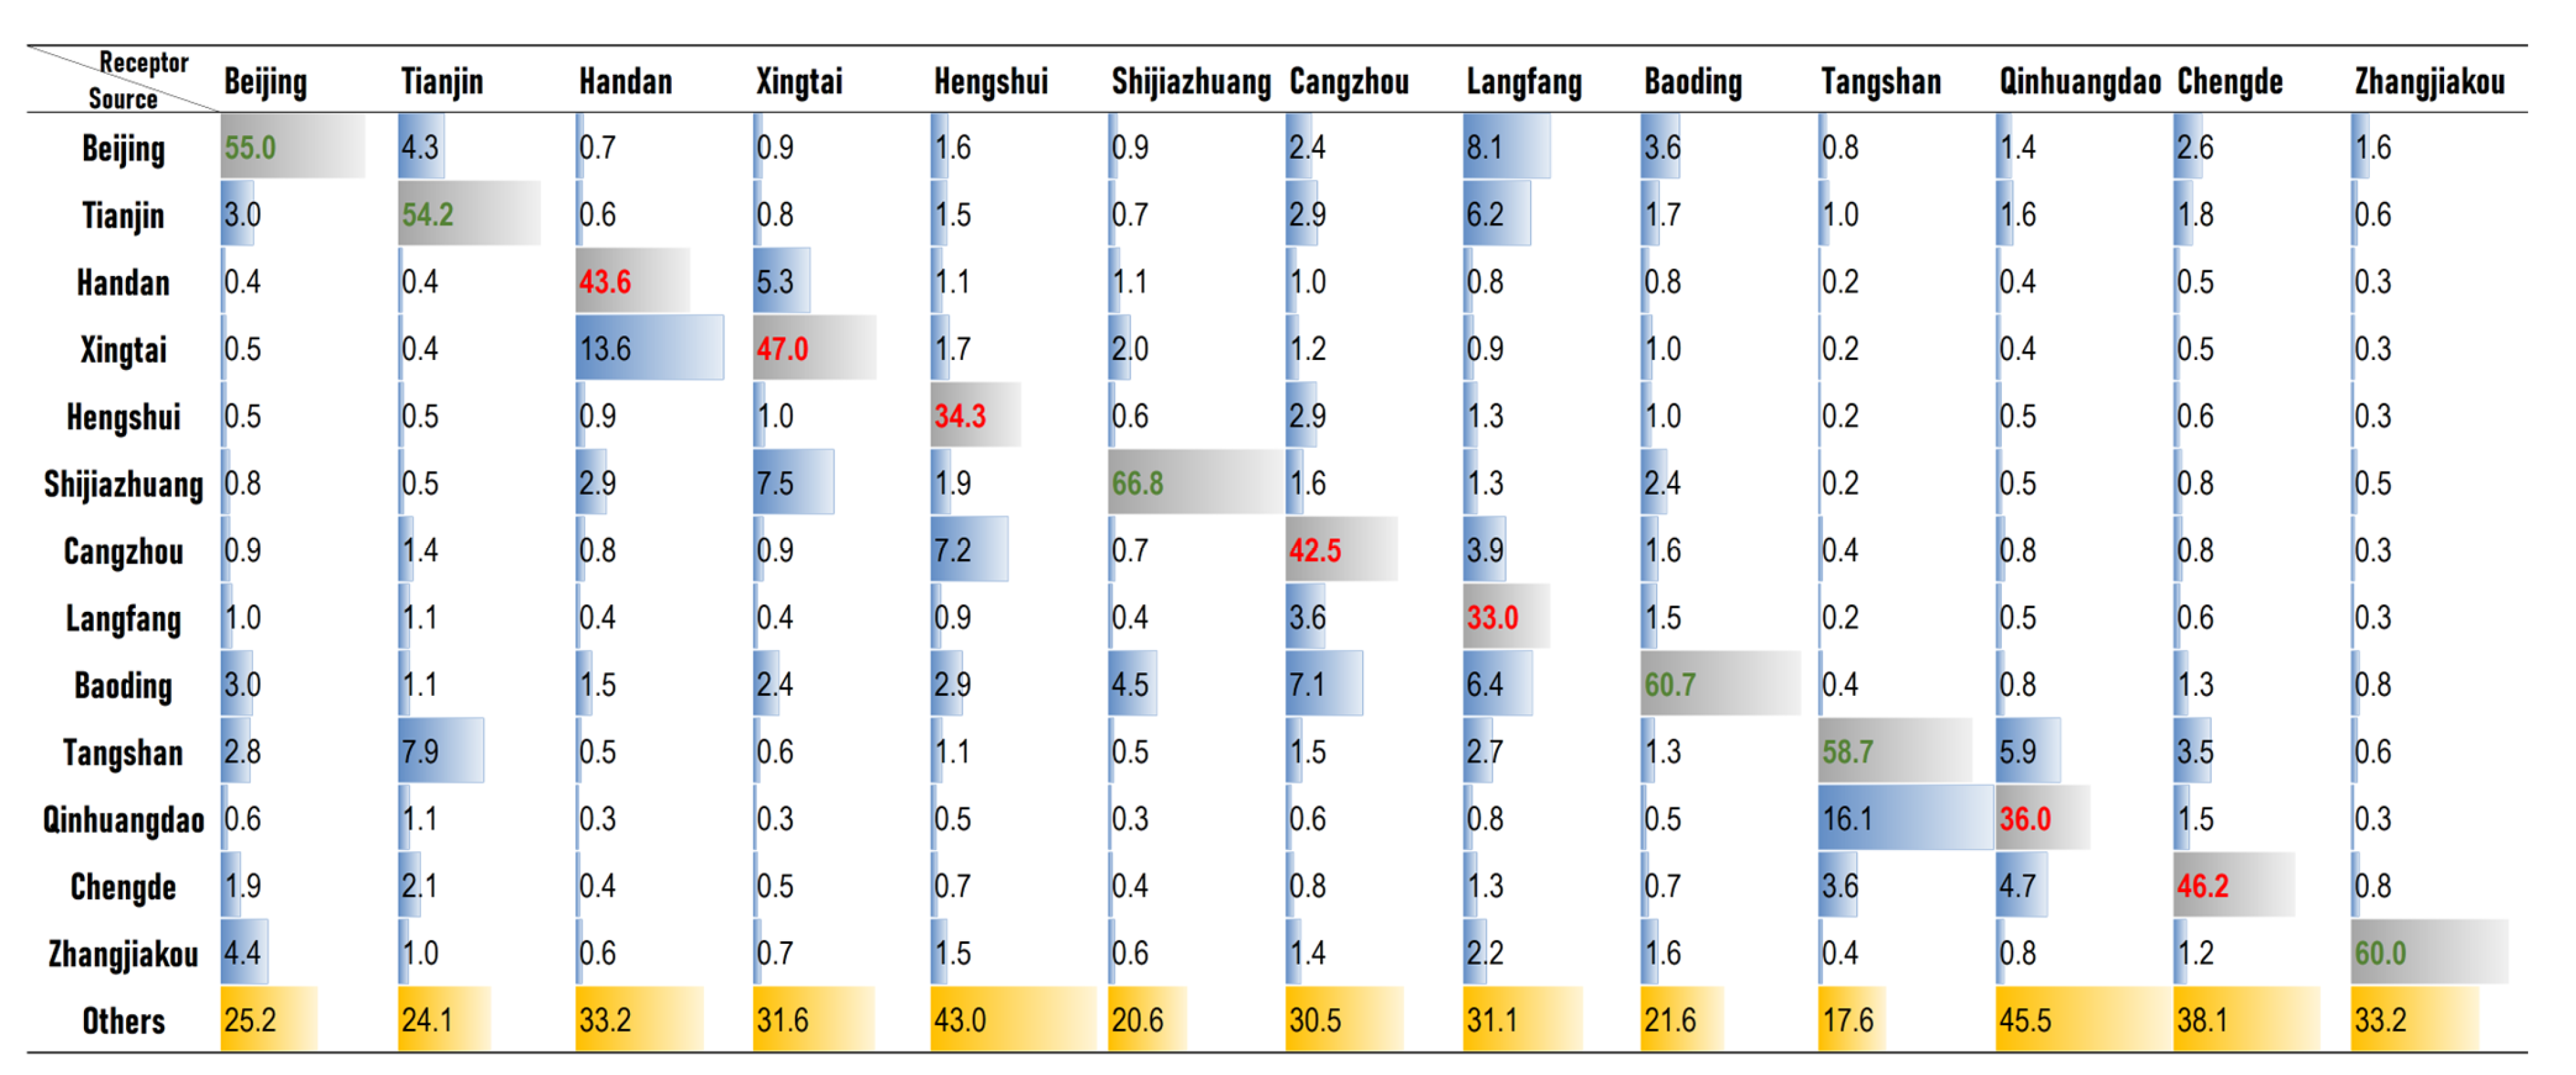
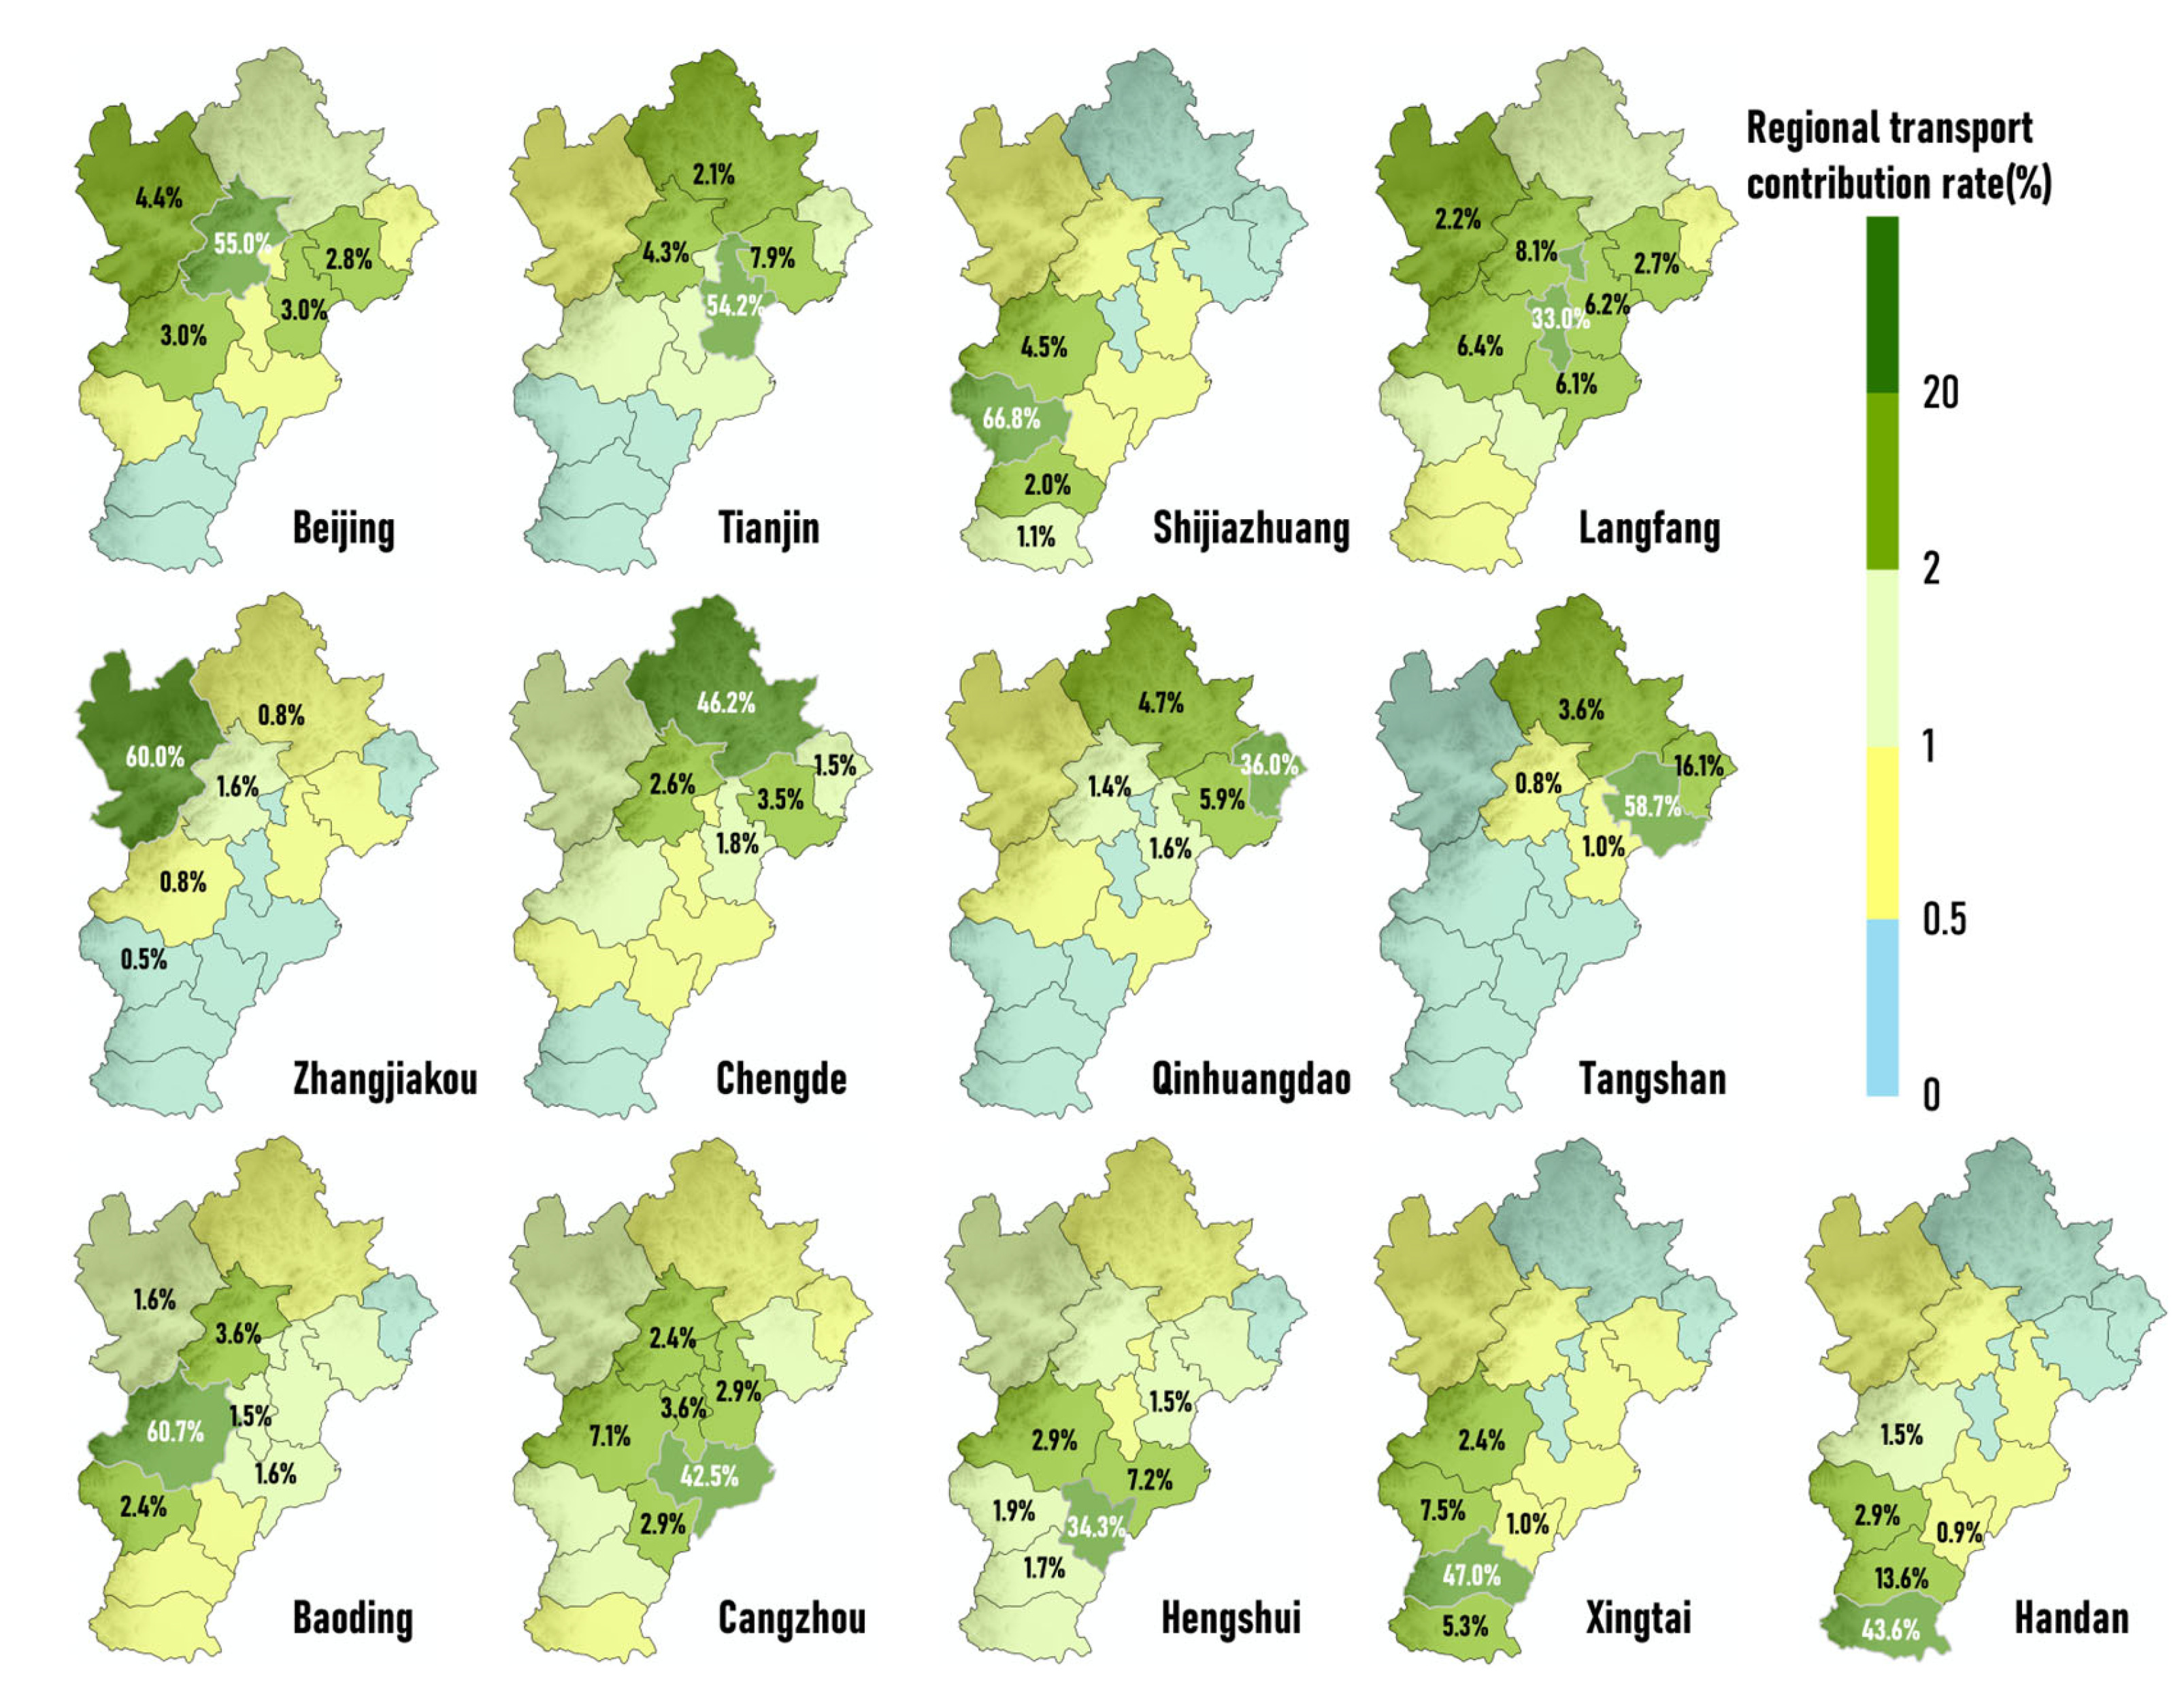
3.2. Average Transport of PM2.5 among Cities in the BTH Region from 2010 to 2019

Figure 5 lists the transport matrix of PM2.5 in the BTH region from 2010 to 2019. Similar to Li et al. [7], Wang et al. [21] and Chang et al. [14], the transport matrix was built by combining the interactions between each of the two cities in the study region. Each value in the table represents the 10-year averaged contribution of the source city to the PM2.5 concentration in the receptor city. It should be noted that the simulation grids that fall in the urban area of each city in BTH region were regarded as the receptors. The authors placed blue bars in the table with lengths proportional to the regional contribution values to show the relative level of each value more clearly. Local contribution values are marked with grey bars. It was found that nearly half of them have a local contribution of more than 50% (six cities, marked with green font in Figure 5), and the other half (seven cities, marked with red font in Figure 5) have a local contribution of less than 50% (meaning that the contribution of regional transport exceeds 50%). Figure 6 further illustrates the receptor cities’ local contribution and the regional contribution of major source cities. Each receptor city can be identified clearly in the map, since they are often dark green because of their large local contributions. The contribution rate of local areas and that of the surrounding cities with relatively large contributions are also labeled in the figure. By comparing Figure 5 and Figure 6, strong interactions can be found among the receptor city and its adjacent neighbors. Additionally, the contributions from remote areas outside of the BTH region (represented by others in Figure 5) also play an important role, with contribution values ranging from 17.6% to 45.5%, indicating that the concentration of PM2.5 can be influenced by emissions from local or surrounding cities, as well as by long-range transport of air pollutants.
Figure 7 shows the 10-year averaged PM2.5 contribution rate of regional transport in cities inside the BTH region from 2010 to 2019. The regional transport contribution over 50% is indicated in dark green, and 40–50% is indicated in green. In terms of the spatial distribution of the annual average, the eastern half of BTH region is more significantly influenced by regional transport, while the western half is dominated by local contributions. From the perspective of each season, winter is the weakest in terms of regional transport influence, while spring, summer, and fall are more pronounced overall, and do not show significant seasonal differences.

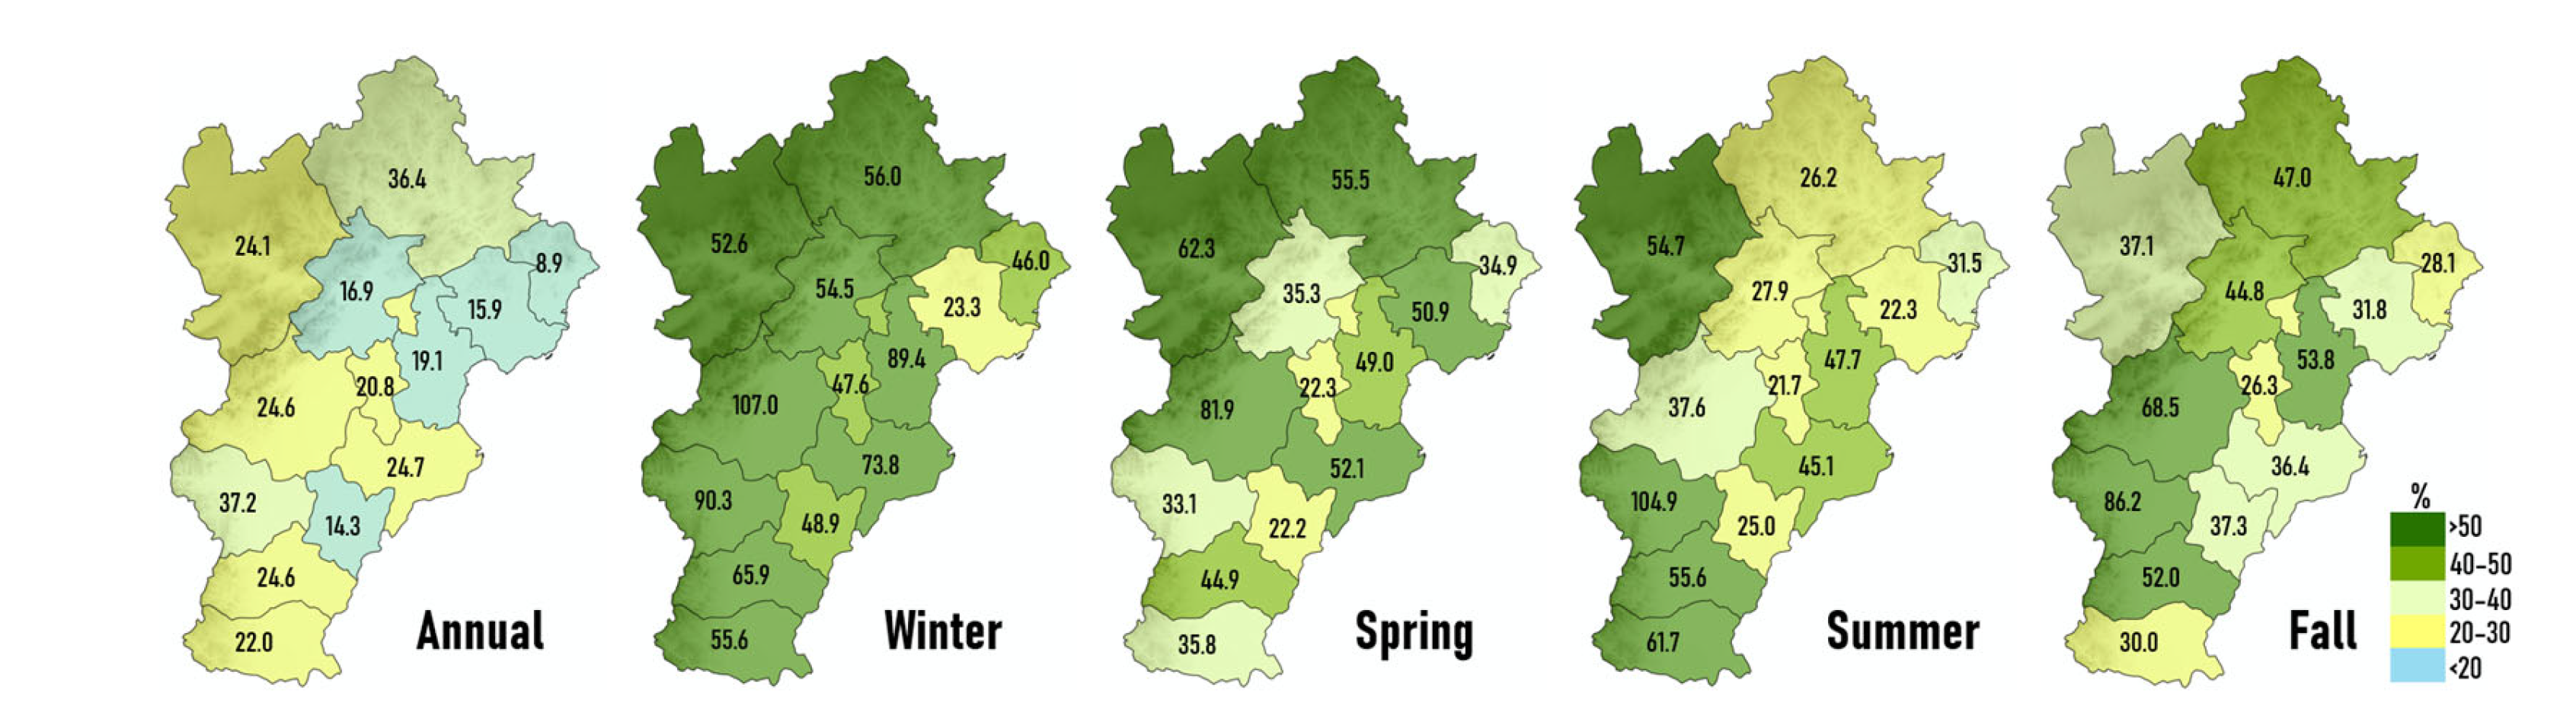
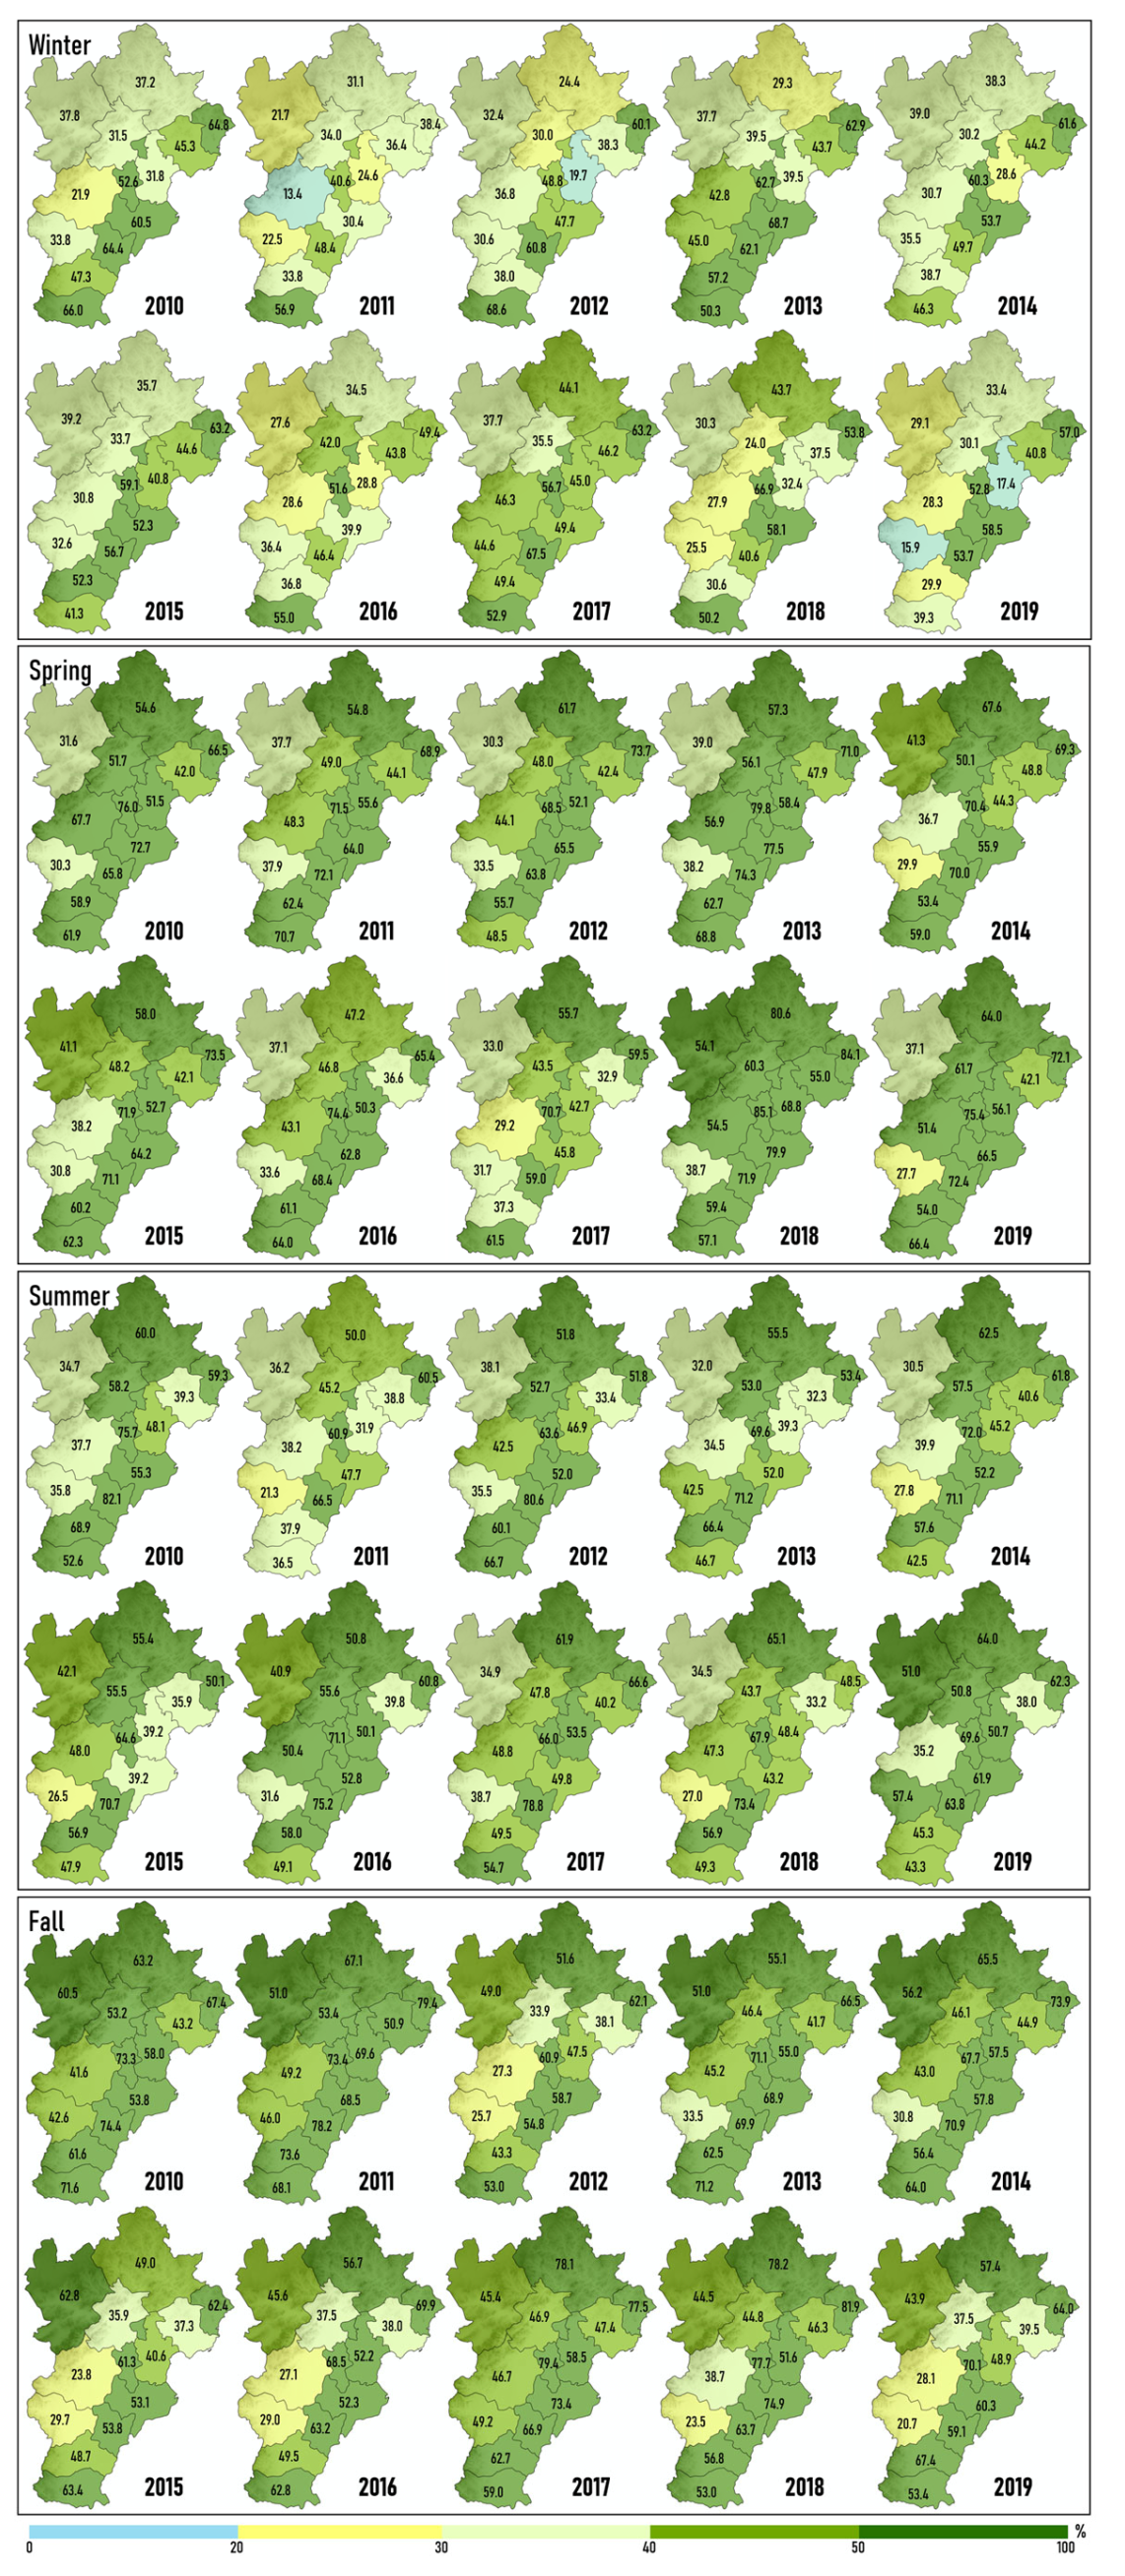
3.3. Impact of Inter-Annual Meteorological Variation on the Contribution of Regional Transport in the BTH Region

As the inter-annual variation in meteorological conditions has a significant influence on PM2.5 concentrations in the BTH region, it is necessary for us to further investigate the impact of meteorological variation on the regional transport in each city of the BTH region. In order to determine the fluctuation in the contribution of regional transport to the PM2.5 of each city due to the inter-annual variation in meteorological conditions, as shown in Figure 8, the authors calculated the fluctuation rate of the 10-year transport contribution values for each city, including the annual average and four-seasonal value. Figure 9 presents the detailed transport contributions in each season from 2010 to 2019. It was found that the magnitude of the regional transport contribution varies significantly among the cities of BTH, on an annual basis, from a minimum inter-annual fluctuation of 8.9% to a maximum of 37.2%. The adjacent cities of Beijing, Tianjin, Tangshan, and Qinhuangdao are located in regions with relatively minimal inter-annual fluctuations. Seasonally, winter has the most significant inter-annual variation in terms of regional contribution, followed by spring and fall, with summer showing the weakest variation in comparison. Generally, seasonal fluctuation is more evident than that of the annual average. In other words, the extremes that occur in the seasons may be masked by their annual averages. Therefore, the correlation between the annual averages and the values in each season was further investigated.
Figure 10 illustrates the contribution anomalies of regional transport. The anomalies were calculated based on the annual average of each year and the 10-year average during 2010–2019 in the BTH region, due to the inter-annual variation in meteorological conditions. It can be found that, compared with annual averages, the values of each season show a much more dramatic magnitude of change. Furthermore, values above and below the historical average in different seasons often cancel each other out, causing the annual average to be close to the historical average. For instance, in the summer and winter of 2011, the most unfavorable meteorological conditions for regional transport in 10 years (the largest negative anomaly) appeared in most cities, but the most favorable conditions (the largest positive anomaly) occurred in the fall of that same year, resulting in the annual average value being of normal magnitude when compared with the historical average. On the contrary, when the anomalies of each season are overwhelmingly polar (either positive or negative), their annual average values will undoubtedly show the largest anomalies. This situation can be seen in 2010 and 2013.

4. Conclusions

In this study, the WRF/CMAQ model was used to investigate inter-annual variations in the contribution of inter-city transport to the PM2.5 concentration in the Beijing–Tianjin–Hebei region from 2010 to 2019. To highlight the impact of inter-annual meteorological variations, the authors used the same emission inventory and the same model configurations for the 10-year simulation. In order to improve the computational efficiency, four months (January, April, July, and October) were selected as the representative months of each year in this study. There will be some differences compared with the 12-month calculation scheme, but this study can still reflect the impact of inter-annual changes in PM2.5 concentration and regional transport. The major findings can be summarized as follows:
(1)
Inter-annual variation in meteorological conditions has an impact on both PM2.5 concentration and inter-city transport in the Beijing–Tianjin–Hebei (BTH) region.
(2)
The results show that the 10-year average PM2.5 concentration in 13 cities ranged from 30.1 μg/m3 to 134.4 μg/m3, showing a strong spatial inhomogeneity distribution. The highest PM2.5 concentration was found in Baoding (134.4 μg/m3), and the cities located in the southern part of the study area.
(3)
The simulated annual average concentrations in 13 cities in BTH are highly variable, with fluctuations ranging from 30.8% to 54.1%, and more evident variations were found in seasonal results, with winter having the most significant inter-annual variation.
(4)
Seven out of thirteen cities have a contribution from regional transport exceeding 50%, which are located in the eastern half of the Beijing–Tianjin–Hebei region, while the western half is dominated by local contributions.
(5)
The magnitude of the regional transport contribution varies significantly among the cities of BTH, on an annual basis, from a minimum inter-annual fluctuation of 8.9% to a maximum of 37.2%, and seasonal fluctuation is even more strongly evident.
(6)
Both in terms of concentration and regional contribution, values above and below the historical average in different seasons often cancel each other out, causing the annual average to be close to the historical average.
These results suggest that regional transport of air pollutants has non-negligible contributions to the local air pollution and varies considerably with the inter-annual change in meteorology. For Chinese policy makers, it is necessary to consider inter-annual variation in meteorological conditions when developing pollution control strategies due to the significant interannual fluctuations in PM2.5 concentrations and the contribution of regional transport. The evaluation of policy options must be based on sufficient temporal data, as using only one year may result in significant uncertainty. Control strategies that can be adjusted seasonally are preferable to those that adjusted annually, since extremes that occur in one or several seasons may be masked by annual averages. For further PM2.5 reduction, local emissions must be controlled more effectively, but equal efforts must also be paid to regional emission. It should be noted that using emissions from different years as input for the simulations in this study may yield different results. This is because the emissions of different years have different combinations of PM2.5 and its precursors. This issue is subject to a more comprehensive follow-up study.

Author Contributions

Conceptualization: D.C.; methodology: D.C.; project administration: D.C.; validation: X.G., Y.Z., W.W. and J.L.; formal analysis: X.J.; investigation: X.J.; resources: X.F.; data curation: X.F.; writing—original draft preparation: X.J. and L.X.; writing—review and editing: D.C.; visualization: X.J. All authors have read and agreed to the published version of the manuscript.

Funding

This research was funded by the National Natural Science Foundation of China (51978011, 52022005).

Institutional Review Board Statement

Not applicable.

Informed Consent Statement

Not applicable.

Data Availability Statement

The data presented in this study are openly available in references [40,41].

Acknowledgments

The authors are grateful to the anonymous reviewers for their insightful comments.

Conflicts of Interest

The authors declare no conflict of interest.

References

  1. Paital, B. Nurture to nature via COVID-19, a self-regenerating environmental strategy of environment in global context. Sci. Total Environ. 2020, 729, 139088. [Google Scholar] [CrossRef] [PubMed]
  2. Paital, B.; Agrawal, P.K. Air pollution by NO2 and PM2.5 explains COVID-19 infection severity by overexpression of angiotensin-converting enzyme 2 in respiratory cells: A review. Environ. Chem. Lett. 2021, 19, 25–42. [Google Scholar] [CrossRef] [PubMed]
  3. Pata, U.K. How is COVID-19 affecting environmental pollution in US cities? Evidence from asymmetric Fourier causality test. Air Qual. Atmos. Health 2020, 13, 1149–1155. [Google Scholar] [CrossRef]
  4. Chen, Z.; Xie, X.; Cai, J.; Chen, D.; Gao, B.; He, B.; Cheng, N.; Xu, B. Understanding meteorological influences on PM2.5 concentrations across China: A temporal and spatial perspective. Atmos. Chem. Phys. 2018, 18, 5343–5358. [Google Scholar] [CrossRef] [Green Version]
  5. Zhang, X.; Zhang, Q.; Hong, C.; Zheng, Y.; Geng, G.; Tong Dan Zhang, Y.; Zhang, X. Enhancement of PM2.5 Concentrations by Aerosol-Meteorology Interactions Over China. J. Geophys. Res. Atmos. 2018, 123, 1179–1194. [Google Scholar] [CrossRef]
  6. Hou, K.; Xu, X. Evaluation of the influence between local meteorology and air quality in Beijing using generalized additive models. Atmosphere 2022, 13, 24. [Google Scholar] [CrossRef]
  7. Cheng, Y.; Zheng, G.; Wei, C.; Mu, Q.; Zheng, B.; Wang, Z.; Gao, M.; Zhang, Q.; He, K.; Carmichael, G.; et al. Reactive nitrogen chemistry in aerosol water as a source of sulfate during haze events in China. Sci. Adv. 2016, 2, e1601530. [Google Scholar] [CrossRef] [Green Version]
  8. Jia, W.; Zhang, X. The role of the planetary boundary layer parameterization schemes on the meteorological and aerosol pollution simulations: A review. Atmos. Res. 2020, 239, 104890. [Google Scholar] [CrossRef]
  9. Zhai, S.; Jacob, D.J.; Wang, X.; Shen, L.; Li, K.; Zhang, Y.; Gui, K.; Zhao, T.; Liao, H. Fine particulate matter (PM2.5) trends in China, 2013-2018: Separating contributions from anthropogenic emissions and meteorology. Atmos. Chem. Phys. 2019, 19, 11031–11041. [Google Scholar] [CrossRef] [Green Version]
  10. Chen, Z.; Cai, J.; Gao, B.; Xu, B.; Dai, S.; He, B.; Xie, X. Detecting the causality influence of individual meteorological factors on local PM2.5 concentration in the Jing-Jin-Ji region. Sci. Rep. 2017, 7, 40735. [Google Scholar] [CrossRef] [Green Version]
  11. Gui, K.; Che, H.; Wang, Y.; Wang, H.; Zhang, L.; Zhao, H.; Zheng, Y.; Sun, T.; Zhang, X. Satellite-derived PM2.5 concentration trends over Eastern China from 1998 to 2016: Relationships to emissions and meteorological parameters. Environ. Pollut. 2019, 247, 1125–1133. [Google Scholar] [CrossRef]
  12. Xu, Y.; Xue, W.; Lei, Y.; Huang, Q.; Zhao, Y.; Cheng, S.; Ren, Z.; Wang, J. Spatiotemporal variation in the impact of meteorological conditions on PM2.5 pollution in China from 2000 to 2017. Atmos. Environ. 2020, 223, 117215. [Google Scholar] [CrossRef]
  13. Gao, M.; Liu, Z.; Zheng, B.; Ji, D.; Sherman, P.; Song, S.; Xin, J.; Liu, C.; Wang, Y.; Zhang, Q.; et al. China’s emission control strategies have suppressed unfavorable influences of climate on wintertime PM2.5 concentrations in Beijing since 2002. Atmos. Chem. Phys. 2020, 20, 1497–1505. [Google Scholar] [CrossRef] [Green Version]
  14. Zhang, X.; Xu, X.; Ding, Y.; Liu, Y.; Zhang, H.; Wang, Y.; Zhong, J. The impact of meteorological changes from 2013 to 2017 on PM2.5 mass reduction in key regions in China. Sci. China Earth Sci. 2019, 62, 1885–1902. [Google Scholar] [CrossRef]
  15. Zhang, H.; Cheng, S.; Yao, S.; Wang, X.; Zhang, J. Multiple perspectives for modeling regional PM2.5 transport across cities in the Beijing-Tianjin-Hebei region during haze episodes. Atmos. Environ. 2019, 212, 22–35. [Google Scholar] [CrossRef]
  16. Li, X.; Zhang, Q.; Zhang, Y.; Zheng, B.; Wang, K.; Chen, Y.; Wallington, T.J.; Han, W.; Shen, W.; Zhang, X.; et al. Source contributions of urban PM2.5 in the Beijing-Tianjin-Hebei region: Changes between 2006 and 2013 and relative impacts of emissions and meteorology. Atmos. Environ. 2015, 123, 229–239. [Google Scholar] [CrossRef] [Green Version]
  17. Li, X.; Zhang, Q.; Zhang, Y.; Zhang, L.; Wang, Y.; Zhang, Q.; Li, M.; Zheng, Y.; Geng, G.; Wallington, T.J.; et al. Attribution of PM2.5 exposure in Beijing-Tianjin-Hebei region to emissions: Implication to control strategies. Sci. Bull. 2017, 62, 957–964. [Google Scholar] [CrossRef] [Green Version]
  18. Li, R.; Mei, X.; Wei, L.; Han, X.; Zhang, M.; Jing, Y. Study on the contribution of transport to PM2.5 in typical regions of China using the regional air quality model RAMS-CMAQ. Atmos. Environ. 2019, 214, 116856. [Google Scholar] [CrossRef]
  19. Li, D.; Liu, J.; Zhang, J.; Gui, H.; Du, P.; Yu, T.; Wang, J.; Lu, Y.; Liu, W.; Cheng, Y. Identification of long-range transport pathways and potential sources of PM2.5 and PM10 in Beijing from 2014 to 2015. J. Environ. Sci. 2017, 56, 214–229. [Google Scholar] [CrossRef]
  20. Jiang, C.; Wang, H.; Zhao, T.; Li, T.; Che, H. Modeling study of PM2.5 pollutant transport across cities in China’s Jing-Jin-Ji region during a severe haze episode in December 2013. Atmos. Chem. Phys. 2015, 15, 5803–5814. [Google Scholar] [CrossRef] [Green Version]
  21. Chang, X.; Wang, S.; Zhao, B.; Cai, S.; Hao, J. Assessment of inter-city transport of particulate matter in the Beijing-Tianjin-Hebei region. Atmos. Chem. Phys. 2018, 18, 4843–4858. [Google Scholar] [CrossRef]
  22. Chen, D.; Liu, X.; Lang, J.; Zhou, Y.; Wei, L.; Wang, X.; Guo, X. Estimating the contribution of regional transport to PM2.5 air pollution in a rural area on the North China Plain. Sci. Total Environ. 2017, 583, 280–291. [Google Scholar] [CrossRef] [PubMed]
  23. Chang, X.; Wang, S.; Zhao, B.; Xing, J.; Liu, X.; Wei, L.; Song, Y.; Wu, W.; Cai, S.; Zheng, H.; et al. Contributions of inter-city and regional transport to PM2.5 concentrations in the Beijing-Tianjin-Hebei region and its implications on regional joint air pollution control. Sci. Total Environ. 2019, 660, 1191–1200. [Google Scholar] [CrossRef] [PubMed]
  24. Wang, Z.; Li, J.; Wang, Z.; Yang, W.; Tang, X.; Ge, B.; Yan, P.; Zhu, L.; Chen, X.; Chen, H.; et al. Modeling study of regional severe hazes over mid-eastern China in January 2013 and its implications on pollution prevention and control. Sci. China Earth Sci. 2014, 57, 3–13. [Google Scholar] [CrossRef]
  25. Ying, Q.; Wu, L.; Zhang, H. Local and inter-regional contributions to PM2.5 nitrate and sulfate in China. Atmos. Environ. 2014, 94, 582–592. [Google Scholar] [CrossRef]
  26. Hua, Y.; Wang, S.; Wang, J.; Jiang, J.; Zhang, T.; Song, Y.; Kang, L.; Zhou, W.; Cai, R.; Wu, D.; et al. Investigating the impact of regional transport on PM2.5 formation using vertical observation during APEC 2014 Summit in Beijing. Atmos. Chem. Phys. 2016, 16, 15451–15460. [Google Scholar] [CrossRef] [Green Version]
  27. Zhao, N.; Wang, G.; Li, G.; Lang, J.; Zhang, H. Air pollution episodes during the COVID-19 outbreak in the Beijing-Tianjin-Hebei region of China: An insight into the transport pathways and source distribution. Environ. Pollut. 2020, 267, 115617. [Google Scholar] [CrossRef]
  28. Zhang, Y.; Li, X.; Nie, T.; Qi, J.; Chen, J.; Wu, Q. Source apportionment of PM2.5 pollution in the central six districts of Beijing, China. J. Clean. Prod. 2018, 174, 661–669. [Google Scholar] [CrossRef]
  29. Chuang, M.T.; Lee, C.T.; Hsu, H.C. Quantifying PM2.5 from long-range transport and local pollution in Taiwan during winter monsoon: An efficient estimation method. J. Environ. Manag. 2018, 227, 10–22. [Google Scholar] [CrossRef]
  30. Wang, Y.; Bao, S.; Wang, S.; Hu, Y.; Shi, X.; Wang, J.; Zhao, B.; Jiang, J.; Zheng, M.; Wu, M.; et al. Local and regional contributions to fine particulate matter in Beijing during heavy haze episodes. Sci. Total Environ. 2017, 580, 283–296. [Google Scholar] [CrossRef]
  31. Lang, J.; Cheng, S.; Li, J.; Chen, D.; Zhou, Y.; Wei, X.; Han, L.; Wang, H. A Monitoring and Modeling Study to Investigate Regional Transport and Characteristics of PM2.5 Pollution. Aerosol Air Qual. Res. 2013, 13, 943–956. [Google Scholar] [CrossRef] [Green Version]
  32. Wang, Y.L.; Xue, W.B.; Lei, Y.; Wang, J.N.; Wu, W.L. Regional Transport Matrix Study of PM2.5 in Jingjinji Region, 2015. Environ. Sci. 2017, 38, 4897–4904. [Google Scholar] [CrossRef]
  33. Dong, Z.; Wang, S.; Xing, J.; Chang, X.; Ding, D.; Zheng, H. Regional transport in Beijing-Tianjin-Hebei region and its changes during 2014–2017: The impacts of meteorology and emission reduction. Sci. Total Environ. 2020, 737, 139792. [Google Scholar] [CrossRef] [PubMed]
  34. Chen, D.; Xia, L.; Guo, X.; Lang, J.; Zhou, Y.; Wei, L.; Fu, X. Impact of inter-annual meteorological variation from 2001 to 2015 on the contribution of regional transport to PM2.5 in Beijing, China. Atmos. Environ. 2021, 260, 118545. [Google Scholar] [CrossRef]
  35. Zhou, Y.; Xing, X.F.; Lang, J.L.; Chen, D.S.; Cheng, S.Y.; Wei, L.; Wei, X.; Liu, C. A comprehensive biomass burning emission inventory with high spatial and temporal resolution in China. Atmos. Chem. Phys. 2017, 17, 2839–2864. [Google Scholar] [CrossRef] [Green Version]
  36. Lin, Y.L.; Farley, R.D.; Orville, H.D. Bulk Parameterization of the Snow Field in a Cloud Model. J. Clim. Appl. Meteorol. 1983, 22, 1065–1092. [Google Scholar] [CrossRef] [Green Version]
  37. Ek, M.B.; Mitchell, K.E.; Lin, Y.; Rogers, E.; Grunmann, P.; Koren, V.; Gayno, G.; Tarpley, J.D. Implementation of Noah land surface model advances in the National Centers for Environmental Prediction operational mesoscale Eta model. J. Geophys. Res. Atmos. 2003, 108, 8851. [Google Scholar] [CrossRef]
  38. Hong, S.-Y.; Noh, Y.; Dudhia, J. A new vertical diffusion package with an explicit treatment of entrainment processes. Mon. Weather Rev. 2006, 134, 2318–2341. [Google Scholar] [CrossRef] [Green Version]
  39. Sarwar, G.; Luecken, D.; Yarwood, G.; Whitten, G.Z.; Carter, W.P.L. Impact of an updated carbon bond mechanism on predictions from the CMAQ modeling system: Preliminary assessment. J. Appl. Meteorol. Clim. 2008, 47, 3–14. [Google Scholar] [CrossRef]
  40. Whitten, G.Z.; Heo, G.; Kimura, Y.; Mcdonald-Buller, E.; Allen, D.T.; Carter, W.P.L.; Yarwood, G. A new condensed toluene mechanism for Carbon Bond CB05-TU. Atmos. Environ. 2010, 44, 5346–5355. [Google Scholar] [CrossRef]
  41. Kwok, R.H.F.; Napelenok, S.L.; Baker, K.R. Implementation and evaluation of PM2.5 source contribution analysis in a photochemical model. Atmos. Environ. 2013, 80, 398–407. [Google Scholar] [CrossRef]
  42. Chen, D.S.; Liang, D.Y.; Li, L.; Guo, X.R.; Lang, J.L.; Zhou, Y. The Temporal and Spatial Changes of Ship-Contributed PM2.5 Due to the Inter-Annual Meteorological Variation in Yangtze River Delta, China. Atmosphere 2021, 12, 722. [Google Scholar] [CrossRef]
  43. Chen, D.; Fu, X.; Guo, X.; Lang, J.; Zhou, Y.; Li, Y.; Liu, B.; Wang, W. The impact of ship emissions on nitrogen and sulfur deposition in China. Sci. Total Environ. 2020, 708, 134636. [Google Scholar] [CrossRef] [PubMed]
  44. Chen, D.S.; Cheng, S.Y.; Zhou, Y.; Guo, X.R.; Fan, S.B.; Wang, H.Y. Impact of Road Fugitive Dust on Air Quality in Beijing, China. Environ. Eng. Sci. 2010, 27, 825–834. [Google Scholar] [CrossRef]
  45. Chen, D.S.; Cheng, S.Y.; Liu, L.; Lei, T.; Guo, X.R.; Zhao, X.Y. Assessment of the integrated ARPS-CMAQ modeling system through simulating PM10 concentration in Beijing, China. Environ. Eng. Sci. 2008, 25, 191–205. [Google Scholar] [CrossRef]
  46. Chen, D.S.; Cheng, S.Y.; Liu, L.; Chen, T.; Guo, X.R. An integrated MM5-CMAQ modeling approach for assessing trans-boundary PM10 contribution to the host city of 2008 Olympic summer games—Beijing, China. Atmos. Environ. 2007, 41, 1237–1250. [Google Scholar] [CrossRef]
  47. Wang, L.T.; Wei, Z.; Wei, W.; Fu, J.S.; Meng, C.C.; Ma, S.M. Source apportionment of PM2.5 in top polluted cities in Hebei, China using the CMAQ model. Atmos. Environ. 2015, 122, 723–736. [Google Scholar] [CrossRef]
  48. Han, X.; Zhang, M.G.; Skorokhod, A.; Kou, X.X. Modeling dry deposition of reactive nitrogen in China with RAMS-CMAQ. Atmos. Environ. 2017, 166, 47–61. [Google Scholar] [CrossRef]
  49. Napelenok, S.L.; Vedantham, R.; Bhave, P.V.; Pouliot, G.A.; Kwok, R.H.F. Source-receptor reconciliation of fine-particulate emissions from residential wood combustion in the southeastern United States. Atmos. Environ. 2014, 98, 454–460. [Google Scholar] [CrossRef]
  50. Lu, Y.L.; Chi, J.W.; Yao, L.; Yang, L.X.; Li, W.J.; Wang, Z.F.; Wang, W.X. Composition and mixing state of water soluble inorganic ions during hazy days in a background region of North China. Sci. China Earth Sci. 2015, 58, 2026–2033. [Google Scholar] [CrossRef]
  51. China Meteorological Administration. Available online: http://data.cma.cn/ (accessed on 21 April 2022).
  52. Ministry of Ecology and Environmental of the People’s Republic. Ecological and Environmental Bulletin. Available online: http://www.mee.gov.cn/hjzl/ (accessed on 21 April 2022).
  53. Boylan, J.W.; Russell, A.G. PM and light extinction model performance metrics, goals, and criteria for three-dimensional air quality models. Atmos. Environ. 2006, 40, 4946–4959. [Google Scholar] [CrossRef]
  54. Zheng, B.; Huo, H.; Zhang, Q.; Yao, Z.L.; Wang, X.T.; Yang, X.F.; Liu, H.; He, K.B. High-resolution mapping of vehicle emissions in China in 2008. Atmos. Chem. Phys. 2014, 14, 9787–9805. [Google Scholar] [CrossRef] [Green Version]
  55. Liu, F.; Zhang, Q.; Tong, D.; Zheng, B.; Li, M.; Huo, H.; He, K.B. High-resolution inventory of technologies, activities, and emissions of coal-fired power plants in China from 1990 to 2010. Atmos. Chem. Phys. 2015, 15, 13299–13317. [Google Scholar] [CrossRef] [Green Version]
  56. Li, M.; Zhang, Q.; Streets, D.G.; He, K.B.; Cheng, Y.F.; Emmons, L.K.; Huo, H.; Kang, S.C.; Lu, Z.; Shao, M.; et al. Mapping Asian anthropogenic emissions of non-methane volatile organic compounds to multiple chemical mechanisms. Atmos. Chem. Phys. 2014, 14, 5617–5638. [Google Scholar] [CrossRef] [Green Version]
Figure 1. Map of the study area and two nested domains established for modeling.
Sustainability 14 06210 g001
Figure 2. Changes in PM2.5 concentration in 13 cities in the Beijing–Tianjin–Hebei region from 2010–2021.
Sustainability 14 06210 g002
Figure 3. Simulated PM2.5 concentrations and the anomalies between the annual and the 10-year average in 13 cities inside the BTH region from 2010 to 2019 (unit: μg/m3).
Sustainability 14 06210 g003
Figure 4. Simulated PM2.5 concentration and the anomalies between the annual and the 10-year average in 13 cities inside the BTH region from 2010 to 2019 (unit: μg/m3).
Sustainability 14 06210 g004
Figure 5. Transport matrix of PM2.5 in the BTH region from 2010 to 2019 (unit: %). Note: the lengths of blue bars in the table are proportional to the regional contribution values. Local contribution values are marked with grey bars and the contributions from remote areas outside of the BTH region are marked with orange bars. The local contribution of more than 50% are in green font and less than 50% are in red font.
Sustainability 14 06210 g005
Figure 6. The receptor cities’ local contribution and the regional contribution of major source cities in the BTH region (based on the transport matrix in Figure 5).
Sustainability 14 06210 g006
Figure 7. The 10-year (2010–2019) averaged PM2.5 contribution rate of regional transport in cities in the BTH region (unit: %).
Sustainability 14 06210 g007
Figure 8. The fluctuation in the regional transport contribution to the PM2.5 of each city due to the inter-annual variation in meteorological conditions during 2010–2019 in the BTH region (Fluctuation = (Maximum − Minimum)/Average × 100%).
Sustainability 14 06210 g008
Figure 9. Regional transport contribution (%) for 4 seasons in 13 cities in the BTH region from 2010 to 2019.
Sustainability 14 06210 g009
Figure 10. Contribution anomalies of regional transport (%) based on the annual average of each year and the 10-year average during 2010−2019 in the BTH region, due to the inter-annual variation in meteorological conditions.
Sustainability 14 06210 g010
Table 1. Performance statistics for T2, RH2, and WS10 at 170 sites within the study area.
ParametersMonthMB 1MAE 2NMB 3 (%)NME 4 (%)R 5
T2
(Temperature at 2 m)
unit: °C
January0.931.636.233.370.87
April1.672.8310.7017.930.83
July4.374.6716.5017.430.83
October2.333.0317.5322.100.90
RH2
(Relative humidity at 2 m)
unit: %
January−6.6713.60−12.7324.600.80
April−6.8311.13−13.6024.330.73
July−13.7315.83−13.9318.870.80
October−12.6717.13−18.1324.730.77
WS10
(Wind speed at 10 m)
unit: m/s
January0.070.70−3.2030.430.70
April0.230.5015.5032.530.70
July0.470.6315.5729.900.70
October0.270.5017.4032.970.70
1 MB: Mean Bias. 2 MAE: Mean Absolute Error. 3 NMB: Normalized Mean Bias. 4 NME: Normalized Mean Error. 5 R: correlative coefficient.
Table 2. Performance statistics for PM2.5 concentrations at 130 sites within the study area.
SpeciesMonthNMB (%)NME (%)MFB 6 (%)MFE 7 (%)R
January−9.4119.54−6.5910.250.79
PM2.5April−7.9916.01−5.6110.490.83
(μg/m3)July1.1021.07−5.3011.970.83
October−9.5818.12−5.578.310.89
6 MFB: Mean Fractional Bias. 7 MFE: Mean Fractional Error.
Table 3. Annual average concentration of PM2.5 in 13 cities in the BTH region from 2010 to 2019 (Simulated based on the 2014 emission scenario, unit: μg/m3).
YearBJTJHDXTHSSJZCZLFBDTSQHDCDZJK
201087.191.1135.7115.0109.4141.0110.6103.4138.698.061.557.529.8
201175.483.8120.5106.598.0125.590.392.1121.279.256.147.527.7
201275.576.4120.8100.089.5126.284.982.8131.881.354.447.926.9
2013103.499.1149.3127.0119.5161.1121.8118.0169.1102.067.253.033.6
201492.495.5125.6111.798.8133.5104.4107.5149.5104.372.562.835.3
201578.186.9115.196.791.5122.391.893.1128.995.665.150.533.3
201671.173.8116.3100.987.4121.276.079.1128.878.152.647.728.6
201799.197.9121.8101.398.4122.897.8105.5137.4108.872.364.034.6
201894.8111.3104.888.783.7113.592.0101.2112.0116.587.853.023.4
201980.484.6110.094.187.0114.787.591.6126.796.663.752.627.7
Average85.790.0122.0104.296.3128.295.797.4134.496.065.353.630.1
Fluctuation (%)37.741.649.536.837.254.147.939.952.840.053.930.839.6
Abbreviations used for the cities: BJ, Beijing; TJ, Tianjin; HD, Handan; XT, Xingtai; HS, Hengshui; SJZ, Shijiazhuang; CZ, Cangzhou; LF, Langfang; BD, Baoding; TS, Tangshan; QHD, Qinhuangdao; CD, Chengde; ZJK, Zhangjiakou.
Publisher’s Note: MDPI stays neutral with regard to jurisdictional claims in published maps and institutional affiliations.

