
Environmental Impacts of Organic and Biodynamic Wine Produced in Northeast Italy


1
Department of Economics and Management, University of Trento, 38122 Trento, Italy
2
Department of Agronomy, Food, Natural Resources, Animals and Environment, University of Padova, Agripolis, 35020 Legnaro, Italy
3
Department of Economics, Business, Mathematics and Statistics, University of Trieste, 34127 Trieste, Italy
*
Author to whom correspondence should be addressed.
Sustainability 2022, 14(10), 6281; https://0-doi-org.brum.beds.ac.uk/10.3390/su14106281
Submission received: 22 April 2022
/
Revised: 15 May 2022
/
Accepted: 18 May 2022
/
Published: 21 May 2022
(This article belongs to the Special Issue Circular Economy and Sustainability: Practices and Strategies in the Wine Sector)
Abstract
:Increasing awareness of sustainability in the agri-food sector is leading to a gradual transition toward lower-impact farming systems, such as organic and biodynamic farming. The environmental performance of organic wines has largely been compared to that of conventional wines, and few researchers have investigated the differences between organic and biodynamic wine production from an environmental point of view. Therefore, in this study, the environmental profiles of two organic and two biodynamic wines produced in two areas in Northeast Italy were assessed by performing a “cradle-to-gate” analysis according to the life-cycle assessment (LCA) methodology. Results were used both to compare organic and biodynamic vitiviniculture and to draw overall conclusions on the environmental performance of each of the analyzed wines in order to identify environmental hotspots and provide recommendations to stakeholders. Production of the glass bottles was identified as the main source of environmental burden in all four systems, followed either by the production and use of fertilizers and pesticides, or the use of agricultural machinery. Results also showed that biodynamic wines seem to be responsible for lesser environmental impacts than organic ones.
1. Introduction
Due to growing awareness of the environmental consequences of human activities, sustainable development has become, over recent years, one of the main goals of many organizations and institutions at international, national, and regional levels. Among the most important initiatives is the United Nations 2030 Agenda for Sustainable Development, which, within its 17 goals, specifically aims to “promote sustainable agriculture” (Goal 2) as well as to “ensure sustainable consumption and production” (Goal 12) [1]. The wine industry, like all agri-food production, faces a large number of environmental issues [2], contributing to global and local concerns that are largely ignored by the media, regulators, consumers, and sometimes, by the winery operators themselves [3]. However, in recent years, thanks to increased awareness by institutions, producers, and especially, consumers [4,5,6,7], the need for lesser environmental impacts in wine production has progressively become more relevant [8,9,10,11], stimulating the search for environmentally sustainable viticultural practices, such as organic and biodynamic methods. This transitional pattern is also justified by the fact that literature indicates the agricultural phase as the main environmental hotspot in the life cycle of many food products, including wine [12,13,14].
Both organic and biodynamic management systems are characterized by low chemical inputs and the adoption of a series of practices that aim to foster the ecological stability of the grapevine. Common practices include the use of green manure, low tillage or no-tillage, the use of composted farmyard manure, integration with other crops, and a ban on synthetic fertilizers, pesticides, and genetically modified organisms. The use of copper and sulfur against grape pathogens is currently allowed by organic and biodynamic standards. The main difference between organic and biodynamic management systems is the adoption, by the latter, of preparations, as indicated by Steiner [15], to improve soil fertility and plant health. Biodynamic farmers state that these preparations have positive effects on different aspects of farming activities, but the actual benefits from biodynamic preparations are still under investigation. Indeed, recent literature reviews have reported controversial results. Chalker-Scott [16] highlighted the lack of significant evidence that the preparations could improve soil structure and fertility, modify microbial activity, increase crop yields, or control pathogens. On the contrary, more recent reviews [17,18] have pointed out that biodynamic management has positive effects on plants and soil health. Apart from these positive effects on ecosystems, the question of the actual quality of biodynamic wines—compared to conventional and organic ones—is still open (see, e.g., Döring et al. [19] and Cravero [20] for extensive reviews). It should also be investigated how the chemical and sensory characteristics of biodynamic wines can be affected by factors other than viticulture practices, such as, for instance, winemaking processes [21,22].
In the EU, organic wine production is regulated by specific norms and standards that have been updated over the years. Currently, Regulation 848/2018/EU, which entered into force on 1 January 2022, and several implementing and delegated acts define the organic production of food, including wine [23]. The same norms also recognize biodynamic farming as a specific type of organic agriculture. The main authority concerned with biodynamic agriculture is the Demeter Association, the international organization for biodynamic agriculture and viticulture, which provides standards, guidelines, and biodynamic certification [24]. Most biodynamic wine producers have two certifications: the organic one, released by third-party inspection bodies following the standards of the EU; and the biodynamic one, released by Demeter. Both are released after a three-year-long conversion period from conventional methods [23,24]. During recent decades, the organic wine market has been continuously growing. In contrast with a global trend that shows a reduction in the area of land planted with vines, the world’s area under organic grape cultivation has progressed in 15 years from 87,655 ha in 2004 to 467,760 ha in 2019, corresponding to 6.7% of the world’s grape-growing area [25]. In Europe, nearly 400,000 ha is currently organic, with Spain, France, and Italy being the countries with the largest organic-grape land area (each with over 100,000 ha) [25]. Among organic wine producers, a limited number produce biodynamic wines. The number of farms Demeter-certified for wine production has steadily increased, doubling within the last 20 years; France now accounts for about 300 biodynamic wine farms, followed by Italy, which accounts for almost 70 [26]. Accurate data on the diffusion and trends of biodynamic wine production are, however, difficult to provide as biodynamic vineyards and wine producers are statistically included in the organic producers group.
In this context of a necessary reduction in the environmental burdens of wine production and an equally necessary increase in transparency for the consumer, a set of recent studies tried to evaluate the environmental profile of wine using different tools and methodologies, among which life-cycle assessment (LCA) has increasingly gained relevance and popularity, as it allows for comprehensive analysis from a life-cycle perspective. Within LCA studies, wine has become one of the most investigated agri-food products in several countries, such as Italy, Spain, France, Portugal, Canada, Australia, and Greece (see, e.g., Petti et al. [14], Ferrara et al. [27], and Maiesano et al. [28] for extensive reviews; see [29,30,31,32,33,34,35,36,37,38,39,40,41] for more detail, among others published in the last decade). In these studies, LCA was used to estimate the environmental impacts of wine production (a “cradle-to-gate” approach) or the wine industry (a “cradle-to-grave” perspective) to identify hotspots and determine best practices to minimize the environmental footprint. However, to our best knowledge, only Villanueva-Rey [33] took biodynamic viticultural practices into consideration, specifically carrying out a comparative LCA between conventional, biodynamic, and intermediate conventional–biodynamic viticulture methods in Northwestern Spain, and concluding that biodynamic management of the vineyards produces the lowest impacts per unit of product (1.1 kg of grapes).
As organic and biodynamic farming systems are increasingly becoming the subject of public debate, we considered it appropriate to investigate and compare the relative environmental performances of these two agricultural practices when it comes to wine production. Therefore, a cradle-to-gate LCA was used to assess the environmental profile of two organic and two biodynamic wines, produced by four small wineries in two areas of Northeast Italy, a region historically devoted to wine production and with a currently flourishing wine industry.
2. Methods
The LCA method was applied according to the technical standards issued by the ISO [42,43]. The analysis was carried out with the support of SimaPro 8.3.0 software [44].
2.1. Goal and Scope
The study aimed to identify environmental hotspots in the life cycle and investigate to what extent the adopted agricultural approach influences the overall environmental performance of the wine. A cradle-to-gate study was performed: the entire wine production process, from grape cultivation to the winemaking, including bottling and packaging, was considered, whereas distribution, retail and consumption were not taken into account. The selected functional unit (FU) was one bottle of wine (i.e., 750 mL of wine) and referred to the grape harvested in 2016.
2.2. System Boundaries
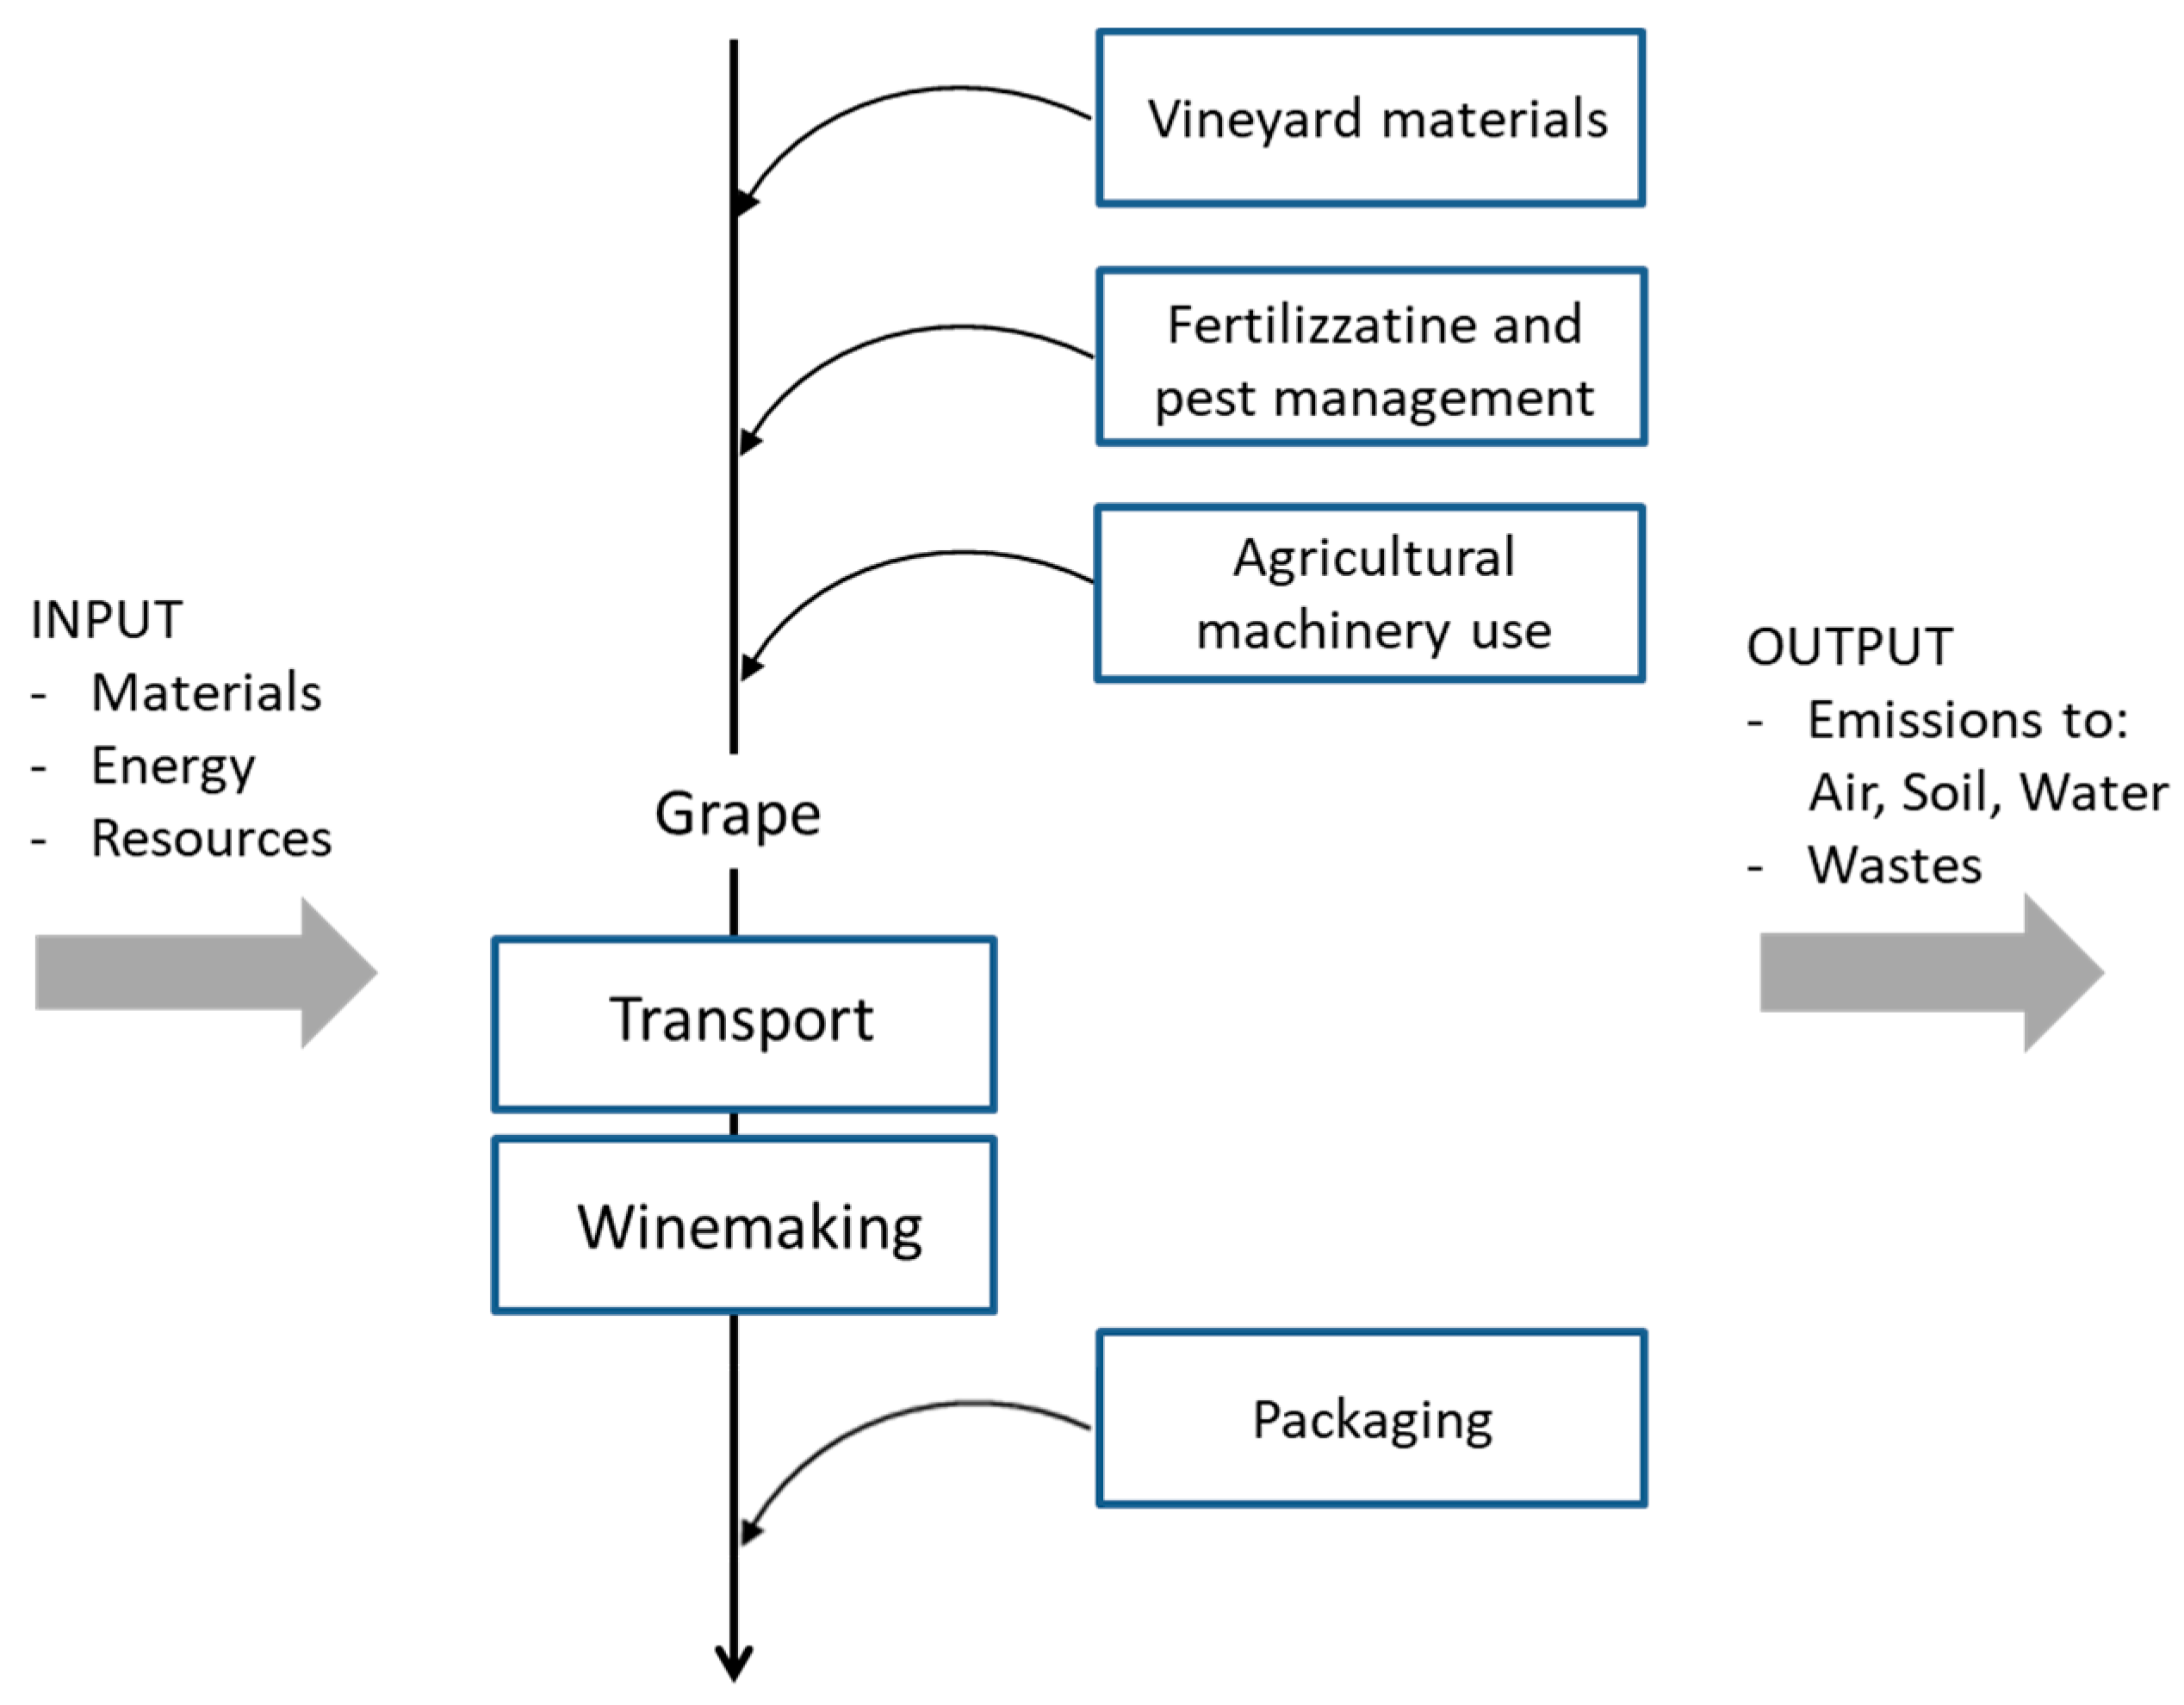
The system under study included all the major material and energy flows associated with grape growing, winemaking, and bottling (Figure 1). The boundaries of the system included all the processes, materials, and activities related to grape production (trellising, field operations, fertilization, treatments, harvest, transport, etc.), winemaking (use of winemaking equipment, refrigeration, bottling, etc.), and packaging (glass bottle, cork, heat shrink capsule, etc.). Farm construction and the production of agricultural machinery and winemaking equipment were not included in the analysis due to: (i) lack of data, (ii) exclusion of capital goods in previous LCA studies on wine [14,33,37], and (iii) assumption that these elements do not have a relevant contribution to a single bottle of wine (since they last many years and can therefore be considered negligible) as suggested by Point et al. [29]. Other processes that were excluded from the system’s boundaries due to the impossibility of retrieving accurate data were electricity consumption for lighting in the winery facility, the use of cleaning products, and the nursery stage of vine plants. It should be noted that the grapevine plants under study were between 25 to 70 years old and the number of plants replaced per year was on average very low (between 1% and 4%), and for this reason, the nursery stage was negligible [19]. Production-related emissions for copper, sulfur, and pyrethrin were included in the analysis, but field-level emissions were not, due to a lack of data and the current absence of site-specific models to estimate the fate of those emissions in air, soil, or water [2,13,29].
2.3. Systems under Study and Data Acquisition
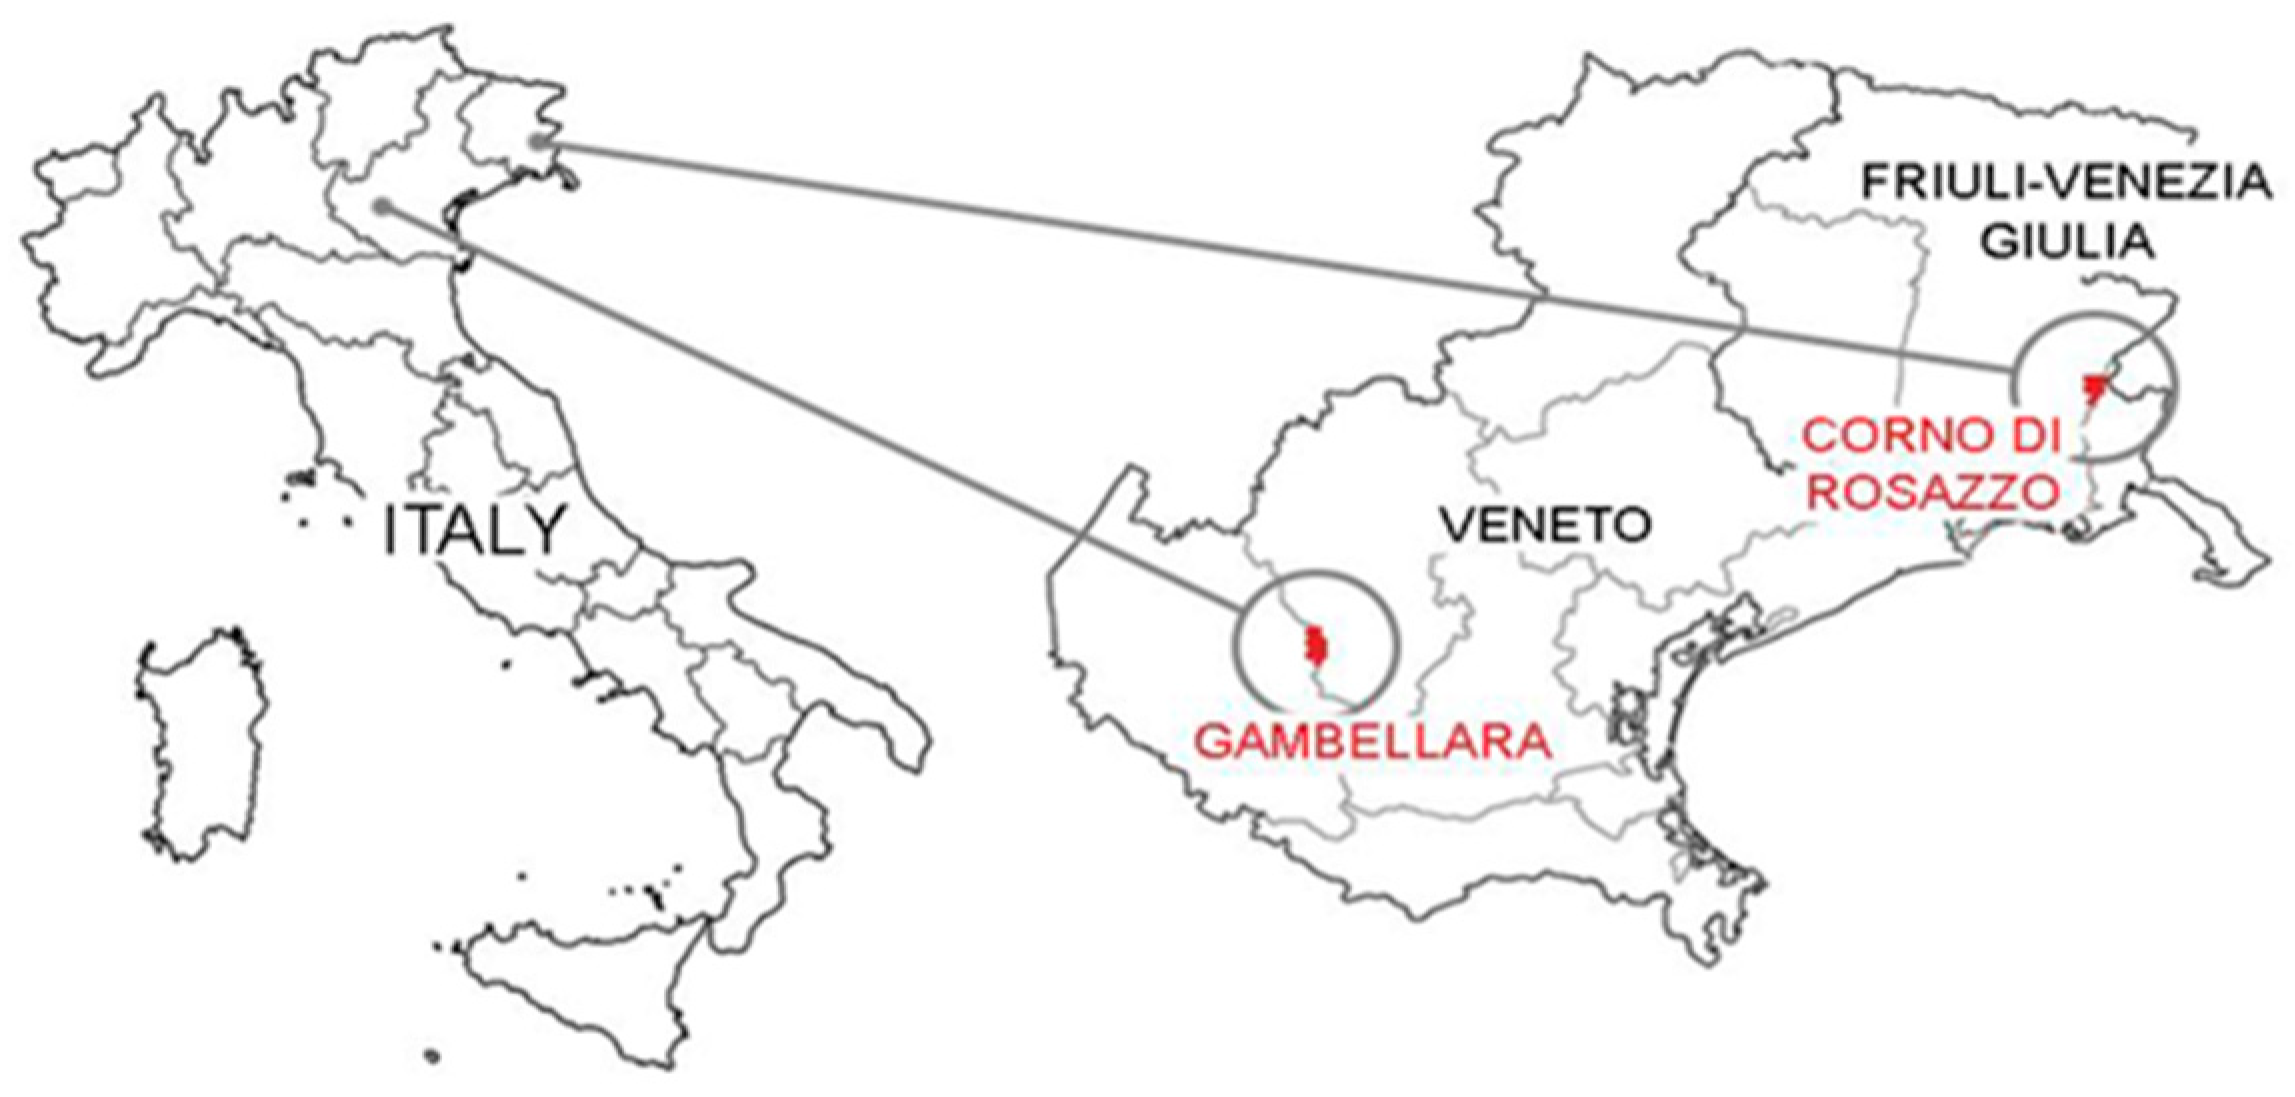
The wineries under study were all located in Northeast Italy, in two different areas: two in Gambellara (Vicenza province) and two in Corno di Rosazzo (Udine province) (Figure 2). The Gambellara territory extends onto both hilly and flat areas, and ranges in altitude from 30 to 360 m a.s.l. [45]. Gambellara sits on volcanic soils that are very fertile and rich in mineral content, and thus particularly suitable for wine-grape cultivation. The two wineries, ORG1 and BD1, are located close to each other with less than 400 m between the two facilities. Both are certified organic, but BD1 also adopts biodynamic farming and winemaking practices. Both are small family-run businesses, growing the traditional Gambellara grape varieties, Garganega and Durella. ORG1 and BD1 cultivate 14 and 7.5 ha of vineyards, respectively, distributed mostly on the volcanic hills of Gambellara. The municipal area of Corno di Rosazzo ranges from 60 to 210 m a.s.l. [45], mostly on a hilly area extremely devoted to viticulture. The two wineries selected in this area, ORG2 and BD2, are also small family-run companies and are located next to one another, with about 600 m between them. They mostly grow local grape varieties, such as Ribolla Gialla, Friulano, Verduzzo, and Malvasia Istriana. ORG2 owns 12 ha of vineyards, while BD2 owns 30 ha. Both wineries are certified organic, with BD2 also being biodynamic.
To perform a better comparison, the same type of wine was selected for wineries within the same location—a sparkling white wine made with 100% Garganega for Gambellara wineries, and a still white wine made with 100% Friulano for Corno di Rosazzo wineries. In addition, it was assumed that the wineries had to be similar in size, production capacity, and product quality (Table 1). Wineries within the same location have analogous types of soil and solar orientation of the vineyards.
2.4. Life-Cycle Inventory
Primary data concerning field operations and the winemaking process were directly collected through the use of a questionnaire, compiled by the four farmers selected for the study, with data referring to 2016 production (Table 2). Secondary data referring to background processes (e.g., provision of glass, fertilizers, metal wire, wooden poles, or electricity production) were taken from the Ecoinvent v3 database provided in SimaPro 8.3.0. [46].
2.4.1. Vineyard Materials
The farmers provided information regarding the structure of their trellis systems, indicating the materials (concrete, wood, steel, etc.) of the components and the number of items (poles, stakes, or extension for the metal wire). The four farms utilized different materials in their vineyards. Concrete poles were entirely used in ORG1 vineyards and wooden poles were present in ORG2 exclusively, while BD1 and BD2 both had concrete and wooden poles in their vineyards. The producers specified that wooden poles were untreated and preservative-free. Specific information regarding physical characteristics of the trellis system components (weight, volume) were obtained from the materials supply companies of the vineyards. Based on this information, the weight of concrete poles was assumed to be 35 kg; the volume of wooden poles, 0.03 m3; the weight of iron stakes, 0.45 kg; and the weight of various metal wires, 0.02 kg/m. As the trellis system is a permanent capital good, an estimation of the lifespan of that component was made as well. Based on information obtained from the wineries, supply companies, and literature, the different materials were assumed to have the lifespans listed below:
- -
- Concrete poles: 30 years
- -
- Wooden poles: 12 years
- -
- Iron wires and iron stakes: 20 years
- -
- Galvanized iron wires: 50 years
- -
- Steel wires: 60 years
- -
- Paper twist ties: 1 year
- -
- Iron twist ties: 2 years
The impact of manufacturing and distributing these materials was allocated to the 2016 vintage by dividing the material quantities by their respective lifespans.
2.4.2. Fertilization and Pest Management
Being either organic or biodynamic, none of the four farms uses synthetic fertilizers; they distributed only organic fertilizers (composed of cattle manure). At the biodynamic farms, preparation 500 (horn manure), which is cattle manure aged in horn for about 6 months, was sprayed (after stirring in water) on the soil in very low concentrations (about 100 g/ha) twice a year. The diesel consumption required for the application of these products was included in the agricultural-machinery-use life-cycle stage. The products applied by the four farms to prevent the formation and diffusion of fungal infections, molds, and pests, such as copper-based compounds, sulfur, and pyrethrin, are all allowed by the organic and biodynamic agriculture standards. The farmers provided data regarding the amount applied and details (name, brand) of the products. The nutrient composition of the products was then obtained from the brand websites and catalogues in order to estimate the net amount of N, P, K, Cu, and S that ended up in the vineyard. Pest-management products were applied with water, which was also considered in this section of the inventory. Data on waste from organic fertilizers and pesticide packaging were also collected.
2.4.3. Agricultural Machinery Use
This stage includes all the agricultural activities performed in the vineyard using machinery that requires fuel combustion, such as mowing, shredding, sowing, drilling, tillage, and the application of fertilizers and pest-controlling agents. It is important to note that, on all the farms, vine prunings were hand-picked, mechanically shredded, and left on the rows. While emissions from the decomposition of the prunings were not considered, as these are gases previously absorbed by the plants, the fuel consumption of the tractor/shredder was included in the study. Similarly, fuel consumption related to mowing was accounted for, while emissions deriving from relative green manure decomposition were excluded. Harvesting was not included as it is performed by hand on all the farms. The amount (liters) of fuel (diesel and gasoline) burned for each activity was provided by the farmers and converted into megajoules (MJ) based on the following fuel conversion factors: 1 L of diesel = 35.8 MJ and 1 L of gasoline = 32.1 MJ.
2.4.4. Transport
The transport phase accounts for the moving of harvested grapes using a tractor with a trailer from the vineyard to the winemaking facility. The amount of fuel consumed depends on the tractor engine efficiency, number of trips (which is related to the vineyard’s yield and trailer capacity), weight of the trailer, and distance between the vineyard and the winery. The transport data were expressed in ton-kilometers (tkm), a unit of measure commonly used to quantify transportation. The choice of using tkm instead of liters of diesel was taken because the four wine producers were not able to provide reliable estimations of the amount of fuel needed for transportation. The farmers also provided data regarding the capacity and weight of their trailers (in kg), number of trips, and distance between the vineyard and the winery, which varied from a minimum of 1 km (BD2) to a maximum of 4 km (ORG2). Three winemakers used trailers with a capacity of 3 tons, while BD1 used a smaller trailer with a capacity of 400 kg. Therefore, BD1 performed the greatest number of trips (29 return trips).
2.4.5. Winemaking
The winemaking stage includes all the activities and processes performed in the winery, from reception of the grape to final bottling and labelling. All processes performed during winemaking, including destemming, pressing, racking, fermentation, pumping, cleaning, refrigeration, and belt conveying, were taken into account, as they all require the use of equipment involving the consumption of electricity. The winemakers provided information regarding the maximum power demand and hours of utilization for each piece of equipment used during the winemaking phase. The actual absorbed power value for each device was assumed to be 80% of the respective maximum power. The electricity consumption (kWh) was then calculated by multiplying the absorbed power (kW) times the hours of use. This general assumption was made as no accurate data on the electricity consumption in kWh were provided. Data regarding the percentage of energy supplied by photovoltaic panels systems, if present, were also provided. The winemaking phase also includes the preservatives and additives used during the process, water for cleaning the equipment, and various packaging wastes produced during operations in the winery
2.4.6. Packaging Materials
The packaging stage considers all materials used in the life cycle, namely the glass bottle, bottle cap, paper label, and aluminum-based polylaminate capsule. Two producers, BD1 and ORG1, adopted a crown cork (2 g of steel) for their sparkling wine, while the other two, ORG2 and BD2, used a conventional cap (6 g of natural cork). The production and transport of the packaging materials were also considered in the study. As well, data regarding waste from packaging material used at the farms were collected. A list of the input data for the inventory of the four farms is reported in Table 2.
3. Results and Discussion
The results of the impact assessment for the four wineries are presented and the processes or life-cycle stages that contributed most to the main impact categories are identified. The impact categories assessed here included climate change (CC), ozone depletion (OD), terrestrial acidification (TA), freshwater eutrophication (FE), marine eutrophication (ME), human toxicity (HT), photochemical oxidant formation (POF), particulate matter formation (PMF), terrestrial ecotoxicity (TET), freshwater ecotoxicity (FET), marine ecotoxicity (MET), ionizing radiation (IR), agricultural land occupation (ALO), urban land occupation (ULO), natural land transformation (NLT), water depletion (WD), mineral resource depletion (MRD), and fossil fuel depletion (FFD). In addition, a comparison of the environmental profiles of the four systems is presented in relation to the impact categories to which they contribute most.
3.1. ORG1
Results obtained for the ORG1 farm (see Table S1) show a disproportionately major contribution to environmental impacts at a few stages of the life cycle. The packaging materials stage constituted the main carrier of environmental impacts, with the relative contribution ranging from 43.5% for MRD to 91.2% for the ULO impact category. On average, the packaging materials stage accounted for 71.3% of the contribution for each impact category. The fertilization and pest-management stage was recognized as the second most relevant source of environmental burden in most categories, with an average contribution value of 15.7%. In particular, the organic fertilization and pest-management stage contributed sensibly, with percentages between 22.5% to 38.7% for all impact categories related to eutrophication, nutrient and chemical leaching, and ecosystem toxicology. The other four life-cycle stages (use of agricultural machinery, vineyard materials, transport and winemaking) showed a scarcely significant percentage contribution to most of the impact categories.
3.2. ORG2
Analogously to ORG1, results for ORG2 farm (see Table S2) show that the packaging materials stage was the main contributor for most of the impact categories, with an average contribution of 55.7%, ranging from a minimum value of 39.3% for HT to a maximum value of 83.6% for ALO. The use of agricultural machinery represented the second most important source of environmental impacts, accounting for an average contribution of 28.8%, with high percentage values for the impact categories related to fossil fuel (diesel and gasoline) production and combustion, such as CC, OD, HT, PMF, POF, ULO, ALO, MRD, and FFD. The fertilization and pest-management life-cycle stage displayed an average contribution that was much lower (9.1%), but with relevant percentage values for the FE (19.5%), HT (23.3%), FET (22.3%), MET (23.4%), WD (15.7%) and MRD (27.1%) impact categories related to the use of chemicals, nutrients, and water. Vineyard materials represented 13.8% of the impacts for HT, while the winemaking phase accounted for 16% of the WD impact category. The transport phase was the least-relevant phase, with relative contributions being negligible for all ReCiPe impact categories.
3.3. BD1
The life-cycle impact assessment (LCIA) results obtained for the BD1 farm (see Table S3) evidenced a disproportionately major contribution of the packaging materials to all ReCiPe impact categories, at even higher levels than in the case ORG1. The packaging materials stage showed percentage values of contributions ranging from 59.7% (MRD) to 95.8% (ULO), with an average of 84.6%. The second most important source of environmental impact was the use of agricultural machinery, which contributed to impact categories related to the production and use of fossil fuels, such as POF, PMF, and MRD for 13.6%, 10.4%, and 19.3% of the impacts, respectively. However, the average contribution of this phase was relatively low, at 8.4%. The fertilization and pest-management stage was the third most relevant for BD1 and represented 12% of the impacts for HT, 10.1% for FET, 10.7% for MET, and 15.2% for MRD with an average contribution of 4.5%. The vineyard materials, transport, and winemaking phases accounted for much smaller contributions for every impact category.
3.4. BD2
LCIA results obtained for the BD2 farm (see Table S4) highlight that the packaging materials stage accounts for an average contribution of 67.3% for the ReCiPe impact categories, ranging from 42.5% (TET) to 87.4% (ALO). Fertilization and pest management were identified as the second most important source of environmental impacts, with an average contribution of 14.2%. This life-cycle stage contributed to 46.1% of the impacts for ME and 56.4% of the impacts for TET. The use of agricultural machinery, associated with the consumption of diesel, contributed mostly to CC (8.6%), OD (8.3%), FE (10.6%), POF (13.8%), PMF (10.5%), ULO (20.7%), and MRD (19.7%). The vineyard materials represented 24% of the impacts related to HT, 11% for POF, and 12.4% for FFD, while the transportation phase had negligible contributions to all impact categories.
3.5. Farm Systems Comparison
The characterization data are presented in Table 3, which summarizes data in the Supplementary Materials. It clearly emerges that the overall environmental impacts were estimated to be higher for ORG1 and ORG2 compared to BD1 and BD2, with BD1 being associated with the lowest environmental impacts in most categories. From the data comparison (see Supplementary Materials), the packaging materials appeared to play a fundamental role in the overall environmental profile of the products in this study, with bottle production being the phase of greatest contribution to almost all impact categories. BD1 and BD2, both associated with lower impacts, used glass bottles weighing 415 g and 400 g, respectively, whereas ORG1 and ORG2 used much heavier glass bottles, weighing 650 g and 550 g, respectively, which inevitably contributed to their greater overall environmental impact. Glass bottle production is indeed a high-energy-demanding industrial process that contributes heavily to the FU total energy use, as well as global warming, HT, and smog-forming and acidifying emissions. The high contribution of glass bottle production to many environmental impacts is confirmed in the literature (see, e.g., [31,32,47]).
Therefore, the main improvement actions adopted by the winemakers to reduce environmental impacts should be focused on minimizing the weight of their glass bottles as much as possible (see BD1 and BD2) and increasing the percentage of recycled glass that the bottles are made of. Previous studies have largely demonstrated the relevance of environmental benefits from the provision of lighter glass bottles [8,29,32,48]. However, although the use of a lighter bottle would represent a reasonable and feasible option that could have important consequences for the reduction of indirect emissions, the choice of the mass of the bottle by producers largely depends on marketing reasons, since a heavier bottle ennobles the perceived quality of the product [49]. At the same time, it is well known that the adoption of glass bottles with increased recycled content leads to lower environmental burdens [27] associated with bottle production, since fewer raw materials are needed. As proposed by some authors [14,32,49,50], another viable way is the use of alternative, less energy-consuming materials, mostly PET, aseptic carton, and bag-in-box. However, the environmental consequences of using other materials are still debated and consumers tend to prefer glass bottles, especially for high-quality wines [49], because glass, by guaranteeing a higher hermeticity, can preserve the quality of wine for a longer time. In addition, glass is perceived as being more sustainable from an environmental point of view with respect to alternative packaging [51].
The agricultural-machinery-use stage and the fertilization and pest-management stage were found to be the second most burdening phases. The former appears to be highly relevant for ORG2, while the latter had a relatively higher impact for ORG1 and BD2. Regarding the agricultural-machinery-use stage, the great impact of ORG2 can be attributed to the high consumption of diesel and gasoline used in many mechanized vineyard operations, such as mowing, shredding, and the application of fertilizers and pesticides. Differences in environmental burden associated with organic fertilization and pest management among the four farm systems were mostly related to the use of organic fertilization products. Indeed, while pest-management products (mostly copper and sulfur) were used by all farms, organic fertilizers were only distributed by ORG1 and BD2.
A notable result coming out from the characterization data is that the winemaking phase was uninfluential to the overall environmental profile of all four wineries. Indeed, this phase had an average contribution for all impact categories of 2.4% for ORG1, 2.9% for ORG2, 0.7% for BD1, and 2.9% for BD2. These results arguably relate to good energy efficiency, as the four wineries declared very low electric energy consumption (ORG1 6.4 kWh/hL, ORG2 5.5 kWh/hL, BD1 1.3 kWh/hL, and BD2 6.6 kWh/hL), while Fuentes-Pila and Luis-Garcia [52] estimated the average electricity consumption in a medium-size winery located in Italy, Spain, France, or Portugal to be equal to 11 kWh per hL.
Furthermore, to verify the environmental performance gap between organic and biodynamic systems—mainly imputable to the weight difference between bottles, regardless of the agricultural practice adopted—a comparison between organic and biodynamic was performed considering only the phases related to the agricultural activities: “fertilization and pest management” and “agricultural machinery use”. Although biodynamic and organic viticulture are based on common principles, the viticulture stage still includes practices that cause differences in the environmental profile. For nutrient management, organic farming relies entirely on organic fertilizers, whereas biodynamic farming uses biodynamic preparations and, in addition, organic fertilizers, if necessary. Regarding pest-management treatments, both organic and biodynamic viticulture rely on the use of non-synthetic fungicides and pesticides, such as copper and sulfur, allowed for viticulture by organic standards.
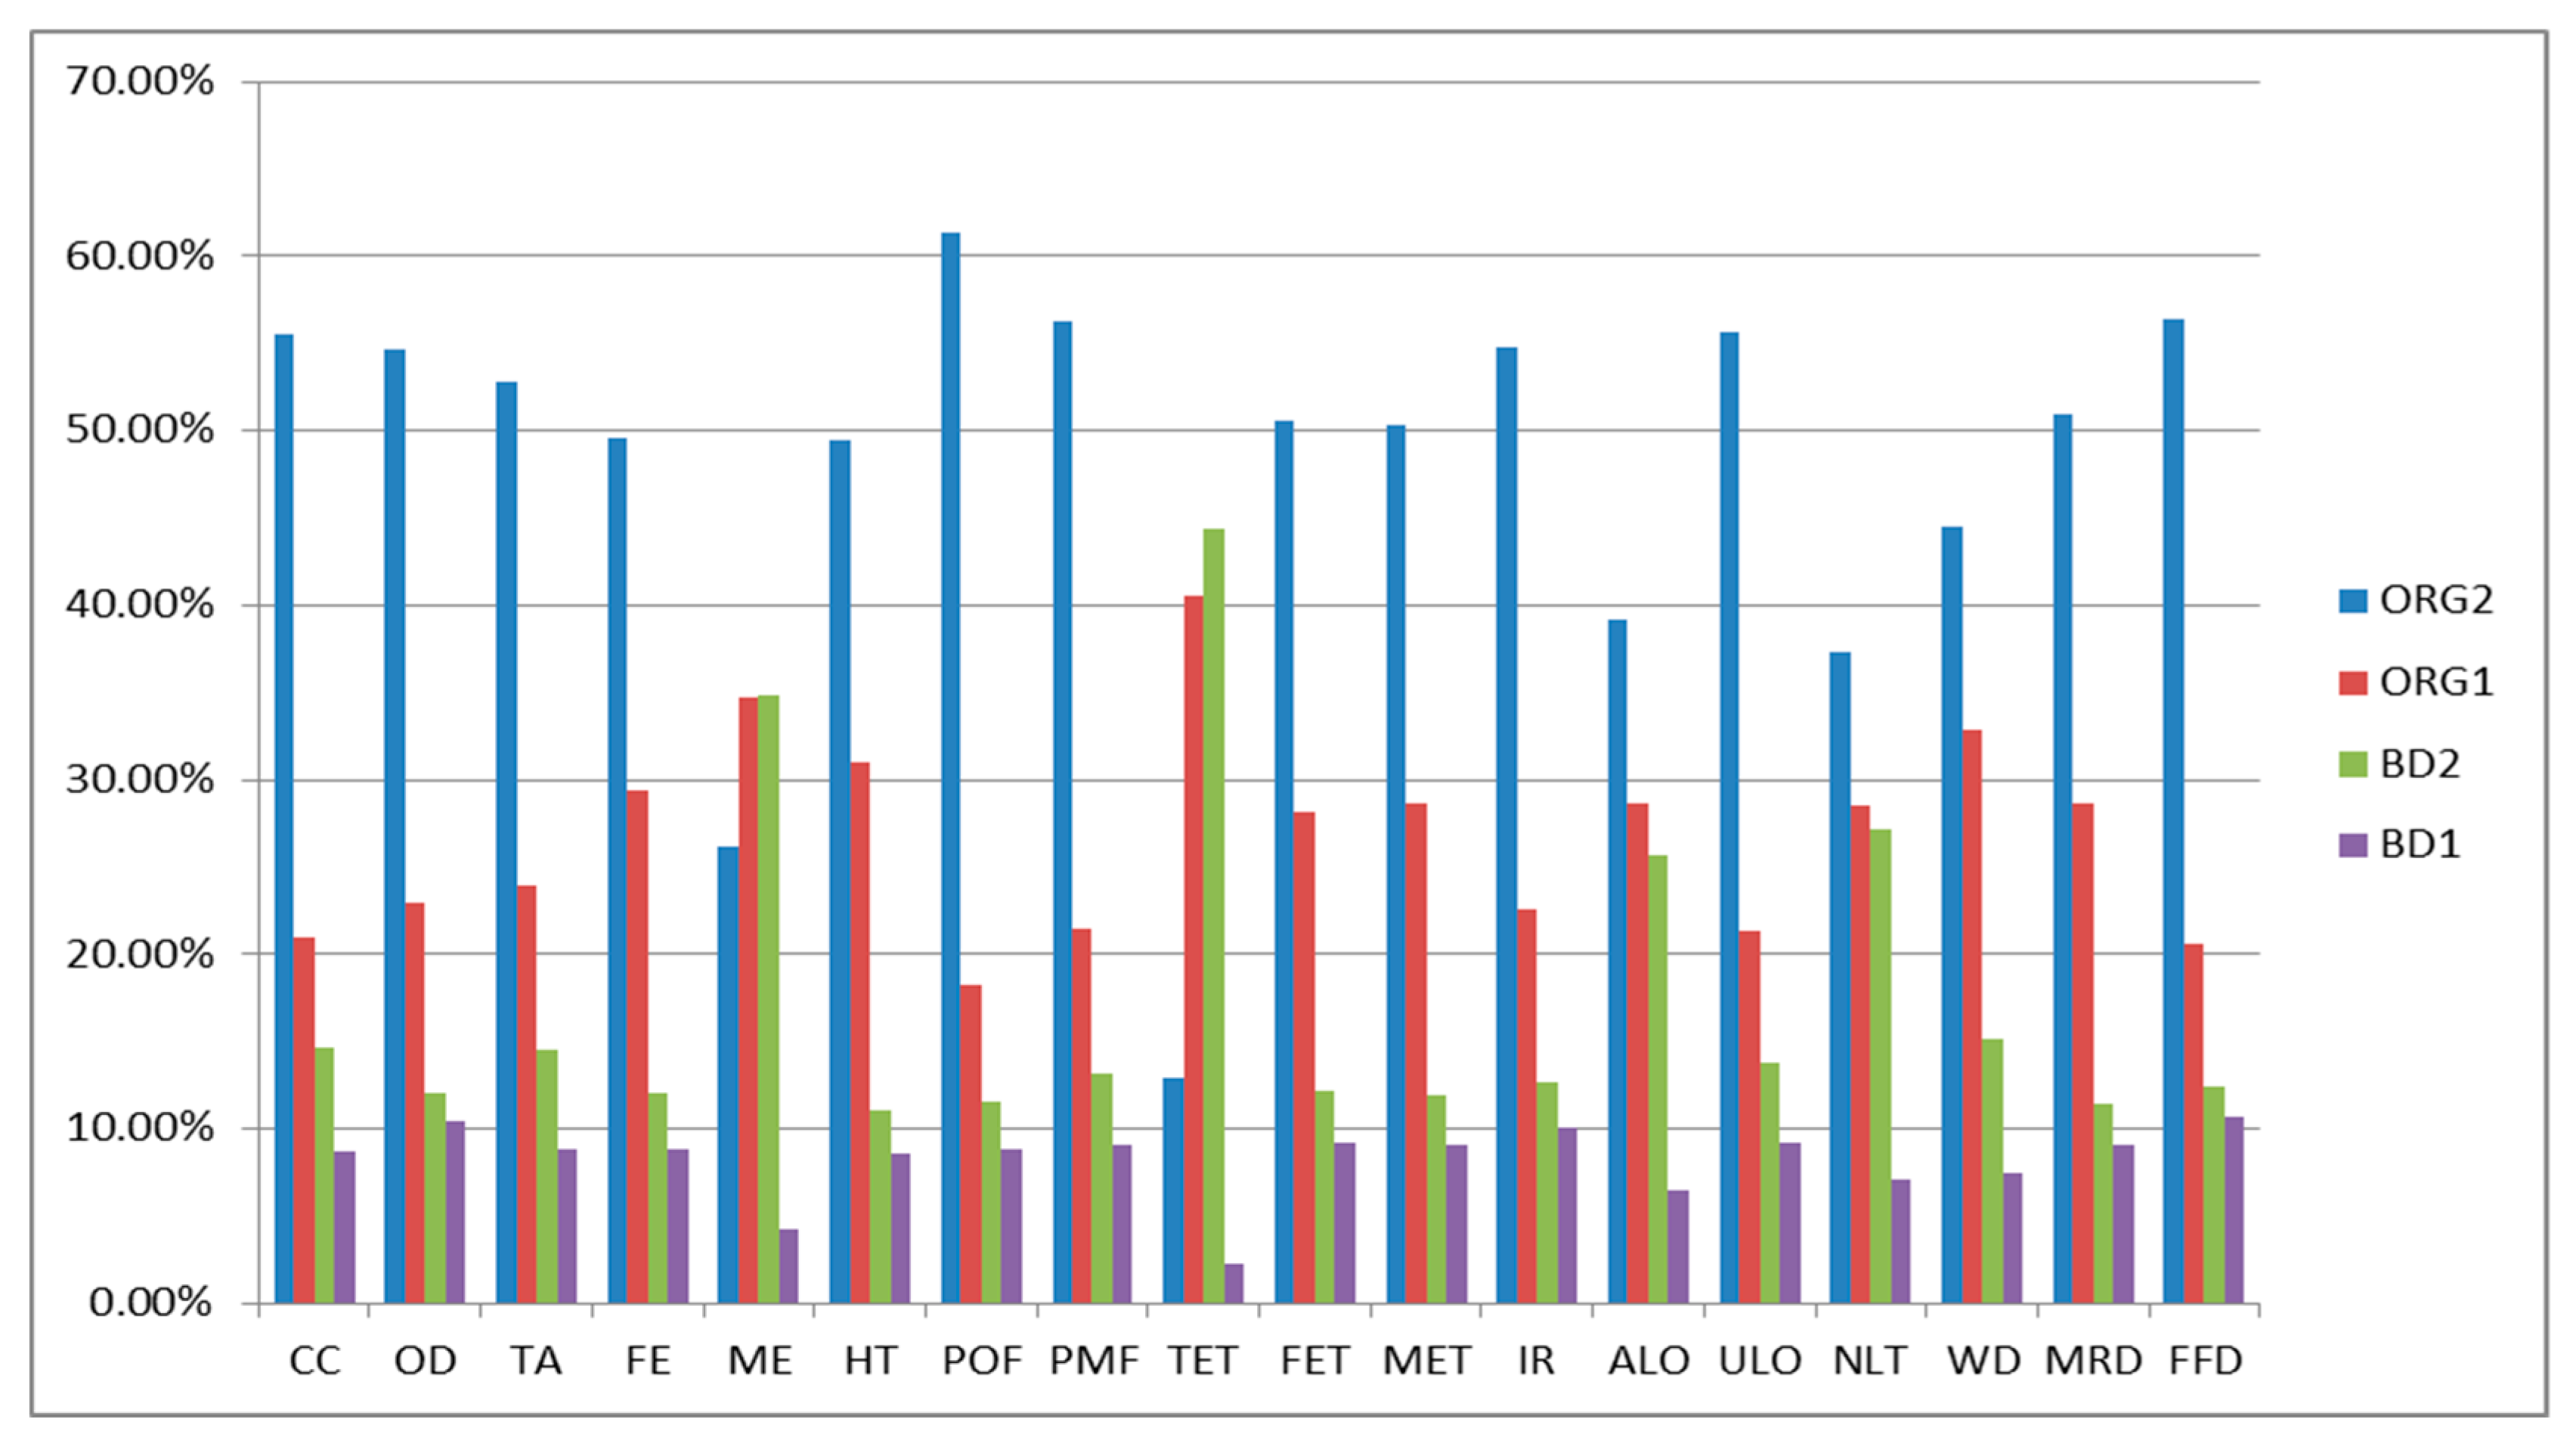
Results obtained considering only the “viticulture stages” suggest that biodynamic production causes less environmental impact than to organic (Figure 3). The main reason for this reduction of potential impacts for biodynamic systems is related to the decrease in diesel consumption and copper-based compounds in the field. The biodynamic systems (BD1 and BD2) were accountable for lower environmental burdens for most impact categories, with the ME and TET categories being the only two exceptions. In these two categories, BD2, while being a biodynamic site, was responsible for potential impacts that were similar to ORG1, and higher than BD1 and ORG2. This anomaly could be due to the use of organic fertilizers (in addition to biodynamic preparations) in BD2′s vineyard. BD1, using only biodynamic preparations (which contain a very small amount of cattle manure), was associated with the lowest impacts in the ME and TET impact categories. In all the other categories, biodynamic systems appeared to be responsible for much lower potential impacts. In Gambellara, during the viticulture phase, BD1 accounted for environmental impacts that were, on average, 66% lower compared to ORG1. Similar results were obtained in Corno di Rosazzo, where BD2 accounted for an impact that was, on average, 46% lower than BD1. This study, which focused only on one organic and one biodynamic winery in each of two locations, did not aim to investigate and compare the agricultural yield of organic and biodynamic viticulture sites. However, yields can have a direct influence on the environmental impacts of agricultural production, since the consumption of land, resources, and materials per FU decreases as yield increases. This consideration could partially explain the environmental performance (see Figure 3) of the BD1 production system having the highest yield among all the considered farmers (15,390 kg/ha). This significant yield is attributable to the location of BD1′s vineyards in plain areas, while the other vineyards are all located on hillsides. On the other hand, BD2, even with being the system that has the lowest yield (7692 kg/ha), still showed lower potential impacts compared to the organic systems, ORG1 and ORG2.
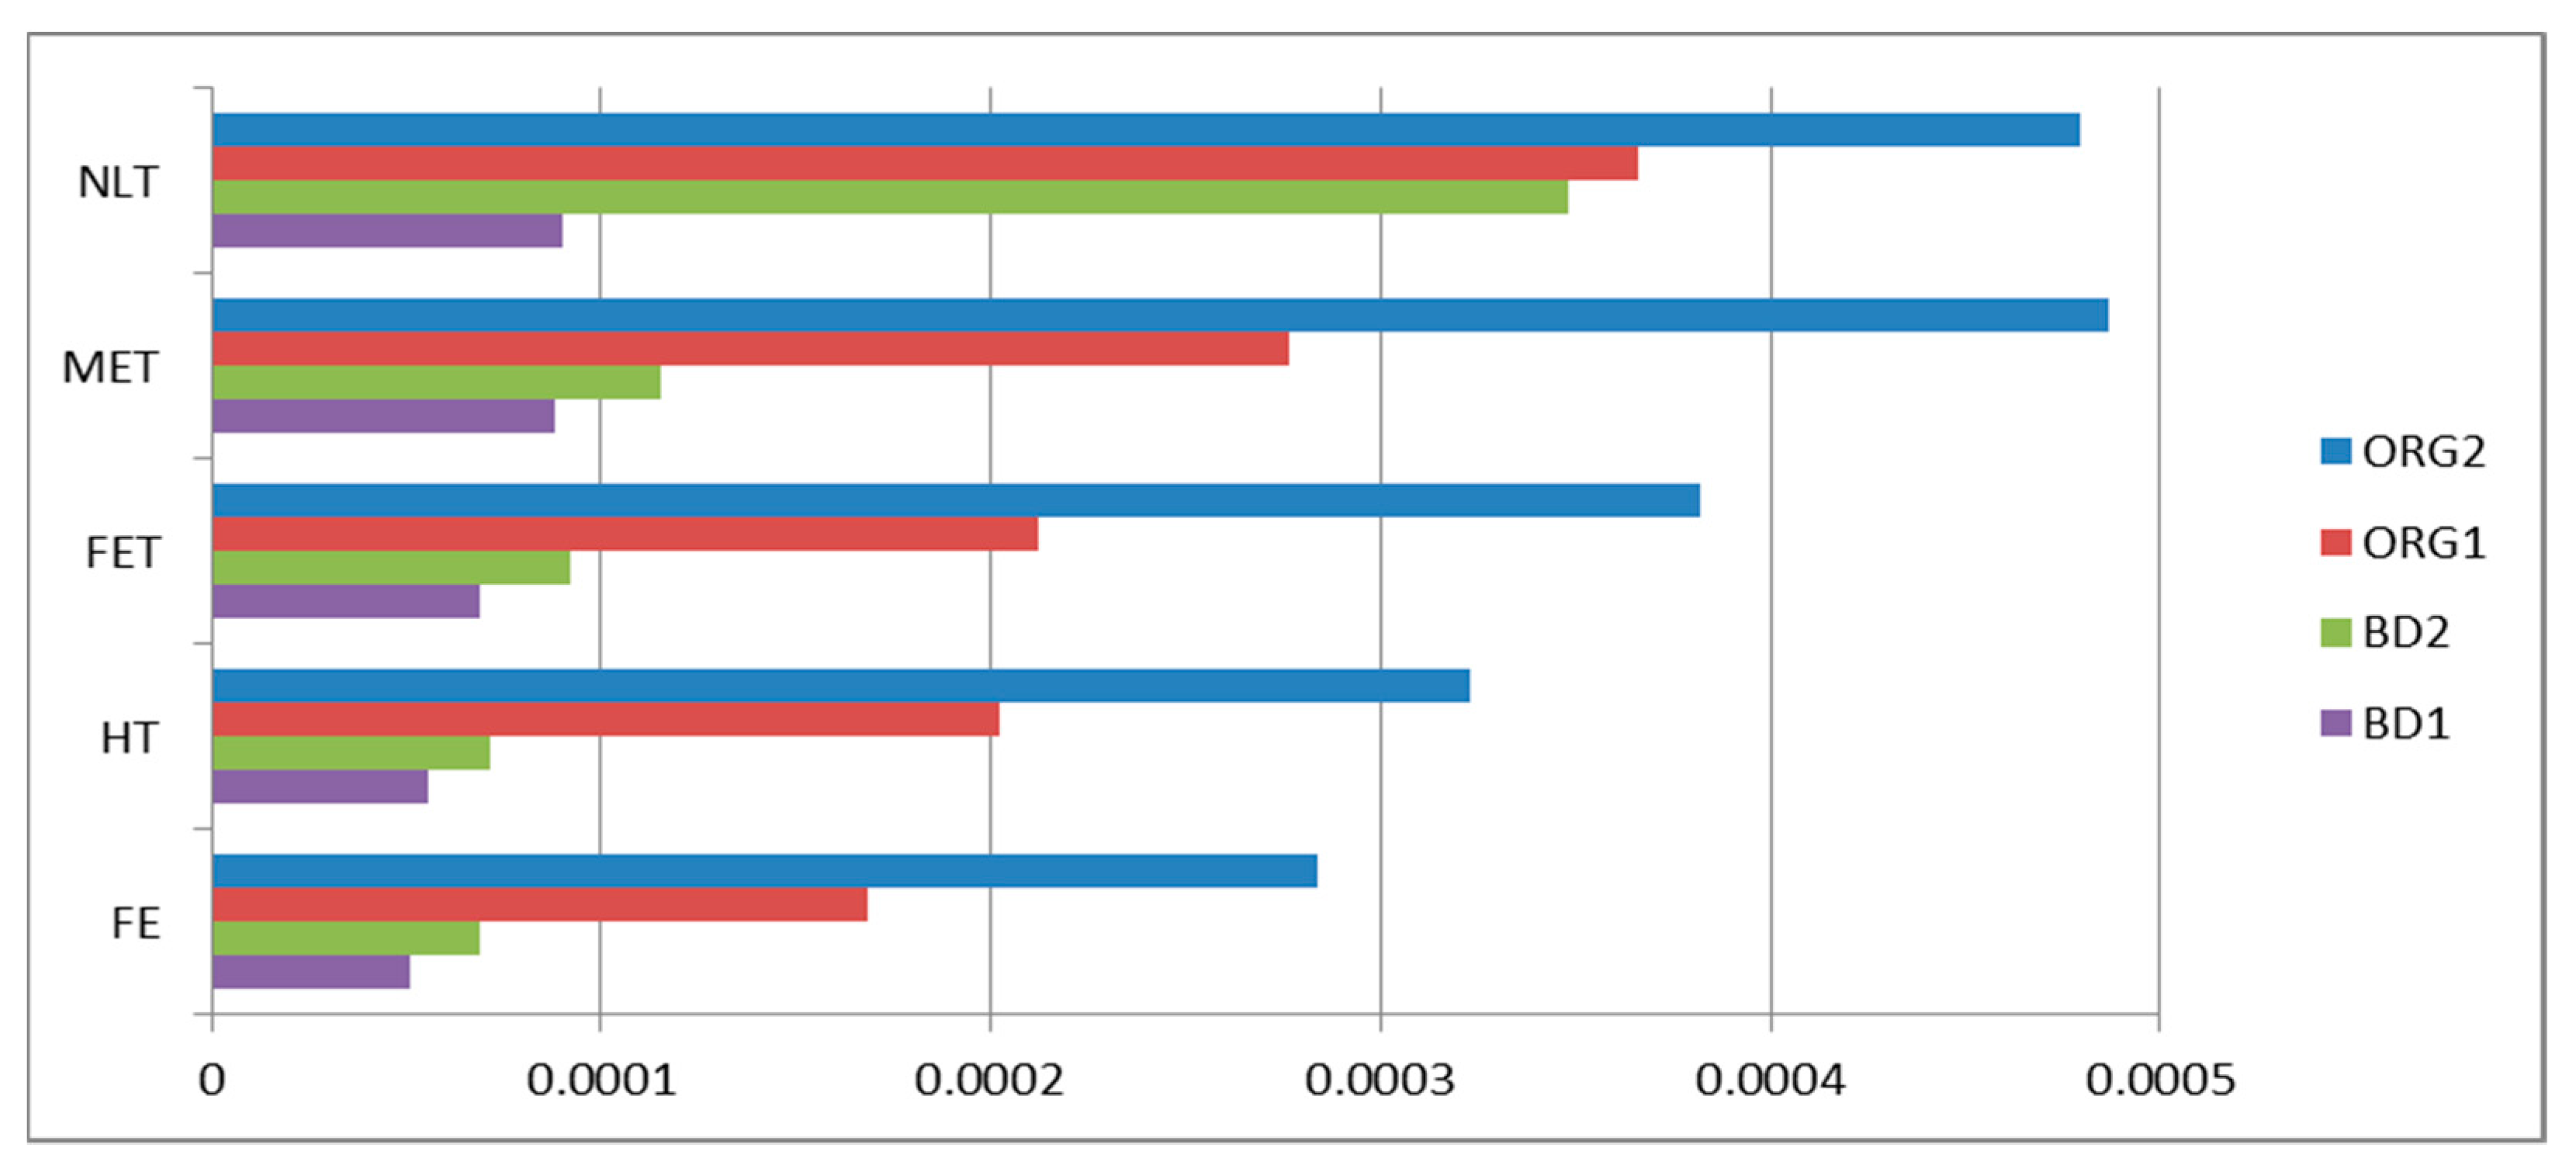
Finally, to evaluate the relevance of the potential impacts associated with the systems under study in the “viticulture stages”, the results of the normalization based on an external approach (the total environmental impacts caused in a year by an average European citizen) were performed. Despite the relevant differences in impact magnitude among the four systems, it is clear that they show the highest contribution values for the same impact categories. In fact, all four products mostly contributed to NLT, MET, FET, HT, and FE (Figure 4). These categories reflect the agricultural component of the study products, as they are related to the production and use of fertilizers (FE, TA, and NLT), the production of pesticides (FET, MET, and NLT), and the production and consumption of fossil fuels (HT, FET, MET, and NLT).
4. Conclusions
The obtained results seem to indicate the ability of the LCA method to identify environmental hotspots and distinguish between the two agricultural practices under investigation from an environmental point of view. On the whole, biodynamic products seem to have a lower impact than organic ones, regardless of the grape variety and geographical area analyzed. Results obtained from taking only the “viticulture stages” into consideration once again suggest biodynamic production causes less environmental impact than organic.
We believe the remarkable development in the biodynamic wine sector that we are witnessing requires further investigation in order to confirm the results obtained in this preliminary study, which considered only four farms and a single vintage. Since several studies have shown that organic farming practices generally have lower impacts on the environment per unit of area, than conventional agriculture (see, e.g., Meier et al. [13], Falcone et al. [35], Tasca et al. [53] and Tuomisto et al. [54] for an extensive review), the ultimate goal should be to evaluate whether biodynamic wine production is really environmentally beneficial per product unit, as opposed to organic (as reflected in this study) and conventional wine production. At the same time, the difficulties we encountered and the assumptions we had to make confirm some of the criticisms currently being raised about the LCA methodology when applied to these types of farming. In particular, the inability to capture some of the functions of these agricultural systems currently represent the fundamental issue that LCA practitioners still need to fully address. Although LCA arguably represents the most reliable tool available to assess the environmental impacts of agri-food production, it is clear that this integrated approach still does not allow for a complete understanding of the environmental performances of wine and all other food we consume. The LCA methodology must be further improved so that it can adequately provide recommendations to stakeholders and support both economic and environmental policies in the future.
Supplementary Materials
The following supporting information can be downloaded at: https://0-www-mdpi-com.brum.beds.ac.uk/article/10.3390/su14106281/s1.
Author Contributions
Conceptualization, M.M., P.B. and P.M.; methodology, P.B., P.M. and M.M.; data acquisition, A.Z., P.B. and M.M.; data curation, A.Z., P.B. and P.M.; writing—original draft preparation, A.Z., P.B. and P.M.; writing—review and editing, M.M., P.B. and P.M.; funding acquisition, M.M. All authors have read and agreed to the published version of the manuscript.
Funding
The research was financially supported by University of Padova BIRD 198379 granted to M.M.
Institutional Review Board Statement
Not applicable.
Informed Consent Statement
Not applicable.
Data Availability Statement
The data presented in this study are available on request from the corresponding author.
Acknowledgments
The authors are grateful to the owners of the four wineries, for their assistance in every stage of the research.
Conflicts of Interest
The authors declare no conflict of interest.
References
- Transforming Our World: The 2030 Agenda for Sustainable Development. In A New Era in Global Health; Rosa, W. (Ed.) Springer Publishing Company: New York, NY, USA, 2017; ISBN 978-0-8261-9011-6. [Google Scholar]
- Notarnicola, B.; Sala, S.; Anton, A.; McLaren, S.J.; Saouter, E.; Sonesson, U. The Role of Life Cycle Assessment in Supporting Sustainable Agri-Food Systems: A Review of the Challenges. J. Clean. Prod. 2017, 140, 399–409. [Google Scholar] [CrossRef]
- Christ, K.L.; Burritt, R.L. Critical Environmental Concerns in Wine Production: An Integrative Review. J. Clean. Prod. 2013, 53, 232–242. [Google Scholar] [CrossRef]
- D’Amico, M.; Di Vita, G.; Monaco, L. Exploring Environmental Consciousness and Consumer Preferences for Organic Wines without Sulfites. J. Clean. Prod. 2016, 120, 64–71. [Google Scholar] [CrossRef]
- Castellini, A.; Mauracher, C.; Troiano, S. An Overview of the Biodynamic Wine Sector. IJWR 2017, 9, 1–11. [Google Scholar] [CrossRef] [Green Version]
- Tait, P.; Saunders, C.; Dalziel, P.; Rutherford, P.; Driver, T.; Guenther, M. Estimating Wine Consumer Preferences for Sustainability Attributes: A Discrete Choice Experiment of Californian Sauvignon Blanc Purchasers. J. Clean. Prod. 2019, 233, 412–420. [Google Scholar] [CrossRef]
- Nassivera, F.; Gallenti, G.; Troiano, S.; Marangon, F.; Cosmina, M.; Bogoni, P.; Campisi, B.; Carzedda, M. Italian Millennials’ Preferences for Wine: An Exploratory Study. Br. Food J. 2020, 122, 2403–2423. [Google Scholar] [CrossRef]
- Rugani, B.; Vázquez-Rowe, I.; Benedetto, G.; Benetto, E. A Comprehensive Review of Carbon Footprint Analysis as an Extended Environmental Indicator in the Wine Sector. J. Clean. Prod. 2013, 54, 61–77. [Google Scholar] [CrossRef]
- Corbo, C.; Lamastra, L.; Capri, E. From Environmental to Sustainability Programs: A Review of Sustainability Initiatives in the Italian Wine Sector. Sustainability 2014, 6, 2133–2159. [Google Scholar] [CrossRef] [Green Version]
- Maicas, S.; Mateo, J.J. Sustainability of Wine Production. Sustainability 2020, 12, 559. [Google Scholar] [CrossRef] [Green Version]
- Varia, F.; Macaluso, D.; Agosta, I.; Spatafora, F.; Guccione, G.D. Transitioning towards Organic Farming: Perspectives for the Future of the Italian Organic Wine Sector. Sustainability 2021, 13, 2815. [Google Scholar] [CrossRef]
- Roy, P.; Nei, D.; Orikasa, T.; Xu, Q.; Okadome, H.; Nakamura, N.; Shiina, T. A Review of Life Cycle Assessment (LCA) on Some Food Products. J. Food Eng. 2009, 90, 1–10. [Google Scholar] [CrossRef]
- Meier, M.S.; Stoessel, F.; Jungbluth, N.; Juraske, R.; Schader, C.; Stolze, M. Environmental Impacts of Organic and Conventional Agricultural Products—Are the Differences Captured by Life Cycle Assessment? J. Environ. Manag. 2015, 149, 193–208. [Google Scholar] [CrossRef] [PubMed]
- Petti, L.; Arzoumanidis, I.; Benedetto, G.; Bosco, S.; Cellura, M.; De Camillis, C.; Fantin, V.; Masotti, P.; Pattara, C.; Raggi, A.; et al. Life Cycle Assessment in the Wine Sector. In Life Cycle Assessment in the Agri-Food Sector: Case Studies, Methodological Issues and Best Practices; Notarnicola, B., Salomone, R., Petti, L., Renzulli, P.A., Roma, R., Cerutti, A.K., Eds.; Springer International Publishing: Cham, Switzerland, 2015; pp. 123–184. ISBN 978-3-319-11940-3. [Google Scholar]
- Steiner, R. Agriculture Course: The Birth of the Biodynamic Method; Rudolf Steiner Press: East Sussex, UK, 2013; ISBN 978-1-85584-353-0. [Google Scholar]
- Chalker-Scott, L. The Science Behind Biodynamic Preparations: A Literature Review. Hort. Technol. 2013, 23, 814–819. [Google Scholar] [CrossRef] [Green Version]
- Brock, C.; Geier, U.; Greiner, R.; Olbrich-Majer, M.; Fritz, J. Research in Biodynamic Food and Farming—A Review. Open Agric. 2019, 4, 743–757. [Google Scholar] [CrossRef]
- Christel, A.; Maron, P.-A.; Ranjard, L. Impact of Farming Systems on Soil Ecological Quality: A Meta-Analysis. Environ. Chem. Lett. 2021, 19, 4603–4625. [Google Scholar] [CrossRef]
- Döring, J.; Collins, C.; Frisch, M.; Kauer, R. Organic and Biodynamic Viticulture Affect Biodiversity and Properties of Vine and Wine: A Systematic Quantitative Review. Am. J. Enol. Vitic. 2019, 70, 221–242. [Google Scholar] [CrossRef]
- Cravero, M.C. Organic and Biodynamic Wines Quality and Characteristics: A Review. Food Chem. 2019, 295, 334–340. [Google Scholar] [CrossRef]
- Picchi, M.; Canuti, V.; Bertuccioli, M.; Zanoni, B. The Influence of Conventional and Biodynamic Winemaking Processes on the Quality of Sangiovese Wine. Int. J. Wine Res. 2020, 12, 1–16. [Google Scholar] [CrossRef] [Green Version]
- Maioli, F.; Picchi, M.; Millarini, V.; Domizio, P.; Scozzafava, G.; Zanoni, B.; Canuti, V. A Methodological Approach to Assess the Effect of Organic, Biodynamic, and Conventional Production Processes on the Intrinsic and Perceived Quality of a Typical Wine: The Case Study of Chianti Docg. Foods 2021, 10, 1894. [Google Scholar] [CrossRef]
- Regulation (EU) 2018/848 of the European Parliament and of the Council of 30 May 2018 on Organic Production and Labelling of Organic Products and Repealing Council Regulation (EC) No 834/2007. 1. Available online: https://eur-lex.europa.eu/eli/reg/2018/848/oj (accessed on 25 March 2022).
- Biodynamic Federation—Demeter International e.V. Production, Processing and Labelling International Standard for the Use and Certification of Demeter, Biodynamic and Related Trademarks (as of: Octomber 2021). Available online: https://demeter.net/certification/standard/ (accessed on 27 January 2022).
- Willer, H.; Trávníček, J.; Meier, C.; Schlatter, B. The World of Organic Agriculture. Statistics and Emerging Trends 2021. Research Institute of Organic Agriculture FiBL, Frick, and IFOAM—Organics International, Bonn (v20210301). 2021. Available online: https://www.organic-world.net/yearbook/yearbook-2021.html/ (accessed on 27 January 2022).
- Biodynamic Federation—Demeter International e.V. Biodynamic Winegrowers International. Available online: https://demeter.net/demeter-products/wine/ (accessed on 27 January 2022).
- Ferrara, C.; De Feo, G. Life Cycle Assessment Application to the Wine Sector: A Critical Review. Sustainability 2018, 10, 395. [Google Scholar] [CrossRef] [Green Version]
- Maesano, G.; Milani, M.; Nicolosi, E.; D’Amico, M.; Chinnici, G. A Network Analysis for Environmental Assessment in Wine Supply Chain. Agronomy 2022, 12, 211. [Google Scholar] [CrossRef]
- Point, E.; Tyedmers, P.; Naugler, C. Life Cycle Environmental Impacts of Wine Production and Consumption in Nova Scotia, Canada. J. Clean. Prod. 2012, 27, 11–20. [Google Scholar] [CrossRef]
- Neto, B.; Dias, A.C.; Machado, M. Life Cycle Assessment of the Supply Chain of a Portuguese Wine: From Viticulture to Distribution. Int. J. Life Cycle Ass. 2013, 18, 590–602. [Google Scholar] [CrossRef]
- Amienyo, D.; Camilleri, C.; Azapagic, A. Environmental Impacts of Consumption of Australian Red Wine in the UK. J. Clean. Prod. 2014, 72, 110–119. [Google Scholar] [CrossRef]
- Fusi, A.; Guidetti, R.; Benedetto, G. Delving into the Environmental Aspect of a Sardinian White Wine: From Partial to Total Life Cycle Assessment. Sci. Total Environ. 2014, 472, 989–1000. [Google Scholar] [CrossRef] [PubMed] [Green Version]
- Villanueva-Rey, P.; Vázquez-Rowe, I.; Moreira, M.T.; Feijoo, G. Comparative Life Cycle Assessment in the Wine Sector: Biodynamic vs. Conventional Viticulture Activities in NW Spain. J. Clean. Prod. 2014, 65, 330–341. [Google Scholar] [CrossRef]
- Abbott, T.; Longbottom, M.; Wilkes, E.; Johnson, D. AWRI: Assessing the Environmental Credentials of Australian Wine. Wine Vitic. J. 2016, 31, 35–37. [Google Scholar] [CrossRef]
- Falcone, G.; De Luca, A.I.; Stillitano, T.; Strano, A.; Romeo, G.; Gulisano, G. Assessment of Environmental and Economic Impacts of Vine-Growing Combining Life Cycle Assessment, Life Cycle Costing and Multicriterial Analysis. Sustainability 2016, 8, 793. [Google Scholar] [CrossRef] [Green Version]
- Iannone, R.; Miranda, S.; Riemma, S.; De Marco, I. Improving Environmental Performances in Wine Production by a Life Cycle Assessment Analysis. J. Clean. Prod. 2016, 111, 172–180. [Google Scholar] [CrossRef]
- Jradi, S.; Chameeva, T.B.; Delhomme, B.; Jaegler, A. Tracking Carbon Footprint in French Vineyards: A DEA Performance Assessment. J. Clean. Prod. 2018, 192, 43–54. [Google Scholar] [CrossRef]
- Martins, A.A.; Araújo, A.R.; Graça, A.; Caetano, N.S.; Mata, T.M. Towards Sustainable Wine: Comparison of Two Portuguese Wines. J. Clean. Prod. 2018, 183, 662–676. [Google Scholar] [CrossRef]
- Dede, D.; Didaskalou, E.; Bersimis, S.; Georgakellos, D. A Statistical Framework for Assessing Environmental Performance of Quality Wine Production. Sustainability 2020, 12, 10246. [Google Scholar] [CrossRef]
- Ncube, A.; Fiorentino, G.; Colella, M.; Ulgiati, S. Upgrading Wineries to Biorefineries within a Circular Economy Perspective: An Italian Case Study. Sci. Total Environ. 2021, 775, 145809. [Google Scholar] [CrossRef] [PubMed]
- Volanti, M.; Cubillas Martínez, C.; Cespi, D.; Lopez-Baeza, E.; Vassura, I.; Passarini, F. Environmental Sustainability Assessment of Organic Vineyard Practices from a Life Cycle Perspective. Int. J. Environ. Sci. Technol. 2021, 19, 4645–4658. [Google Scholar] [CrossRef]
- ISO 14040; Environmental Management—Life Cycle Assessment e Principles and Framework. International Organization for Standardization: Geneva, Switzerland, 2006.
- ISO 14044; Environmental Management—Life Cycle Assessment. International Organization for Standardization: Geneva, Switzerland, 2006.
- PRé Consultants, B.V. SimaPro (Version 8.3.0) [Computer Software]; Pré Sustainability: Amersfoort, The Netherlands, 2017; Available online: https://simapro.com (accessed on 10 March 2022).
- ISTAT. Principali Statistiche Geografiche sui Comuni. Available online: https://www.istat.it/it/archivio/156224 (accessed on 8 February 2022).
- Wernet, G.; Bauer, C.; Steubing, B.; Reinhard, J.; Moreno-Ruiz, E.; Weidema, B. The Ecoinvent Database Version 3 (Part I): Overview and Methodology. Int. J. Life Cycle Ass. 2016, 21, 1218–1230. [Google Scholar] [CrossRef]
- Notarnicola, B.; Tassielli, G.; Nicoletti, G.M. Life Cycle Assessment (LCA) of Wine Production. In Environmentally-Friendly Food Processing; Mattsson, B., Sonesson, U., Eds.; Woodhead Publishing: Sawston, UK, 2003; pp. 306–326. ISBN 978-1-85573-677-1. [Google Scholar]
- Heller, M. Food Product Environmental Footprint Literature Summary: Wine. In Monographic Report by: Center for Sustainable Systems University of Michigan; State of Oregon, Dept Environmental Quality: Portland, OR, USA, 2017; pp. 1–17. [Google Scholar]
- Cooper, J. Briefing: Developing a More Circular Economy Model for Wine Packaging and Delivery. Proc. Inst. Civ. Eng. Waste Resour. Manag. 2019, 172, 40–41. [Google Scholar] [CrossRef]
- Ferrara, C.; De Feo, G. Comparative Life Cycle Assessment of Alternative Systems for Wine Packaging in Italy. J. Clean. Prod. 2020, 259, 120888. [Google Scholar] [CrossRef]
- De Feo, G.; Ferrara, C.; Minichini, F. Comparison between the Perceived and Actual Environmental Sustainability of Beverage Packagings in Glass, Plastic, and Aluminium. J. Clean. Prod. 2022, 333, 130158. [Google Scholar] [CrossRef]
- Fuentes-Pila, J.; Luis-Garcia, J. TESLA (Transfering Energy Save Laid on Agroindustry—EU Project)—Manuale Sull’ Efficienza Energetica Nelle Aziende Vinicole. 2014. Available online: http://teslaproject.chil.me/download-doc/63966 (accessed on 27 January 2022).
- Tasca, A.L.; Nessi, S.; Rigamonti, L. Environmental Sustainability of Agri-Food Supply Chains: An LCA Comparison between Two Alternative Forms of Production and Distribution of Endive in Northern Italy. J. Clean. Prod. 2017, 140, 725–741. [Google Scholar] [CrossRef]
- Tuomisto, H.L.; Hodge, I.D.; Riordan, P.; Macdonald, D.W. Does Organic Farming Reduce Environmental Impacts?—A Meta-Analysis of European Research. J. Environ. Manag. 2012, 112, 309–320. [Google Scholar] [CrossRef]
Figure 1.
System boundary, including the wine’s life-cycle stages considered in the study.

Figure 2.
Geographical location of Gambellara (VI), where ORG1 and BD1 are located, and Corno di Rosazzo (UD), where ORG2 and BD2 are located, in the Veneto and Friuli-Venezia Giulia regions of Northeast Italy, respectively.
Figure 2.
Geographical location of Gambellara (VI), where ORG1 and BD1 are located, and Corno di Rosazzo (UD), where ORG2 and BD2 are located, in the Veneto and Friuli-Venezia Giulia regions of Northeast Italy, respectively.

Figure 3.
Characterization results, considering only the “viticulture stages”. CC, climate change; OD, ozone depletion; TA, terrestrial acidification; FE, freshwater eutrophication; ME, marine eutrophication; HT, human toxicity; POF, photochemical oxidant formation; PMF, particulate matter formation; TET, terrestrial ecotoxicity; FET, freshwater ecotoxicity; MET, marine ecotoxicity; IR, ionizing radiation; ALO, agricultural land occupation; ULO, urban land occupation; NLT, natural land transformation; WD, water depletion; MRD, mineral resource depletion; FFD, fossil fuel depletion.

Figure 4.
Comparative normalization graph with the five most relevant impact categories, considering only the “viticulture stages”. NLT, natural land transformation; MET, marine ecotoxicity; FET, freshwater ecotoxicity; HT, human toxicity; FE, freshwater eutrophication.
Figure 4.
Comparative normalization graph with the five most relevant impact categories, considering only the “viticulture stages”. NLT, natural land transformation; MET, marine ecotoxicity; FET, freshwater ecotoxicity; HT, human toxicity; FE, freshwater eutrophication.


Table 1.
General description of the organic and biodynamic wineries selected in Gambellara and Corno di Rosazzo in 2016. Data on wine type and related land extension, and grape and wine production are limited to the wine selected for the life-cycle assessment.
Table 1.
General description of the organic and biodynamic wineries selected in Gambellara and Corno di Rosazzo in 2016. Data on wine type and related land extension, and grape and wine production are limited to the wine selected for the life-cycle assessment.
| Company | Wine | Vineyard Extension (ha) | Grape Production (kg) | Wine Production (L) | |
|---|---|---|---|---|---|
| Gambellara (VI) | |||||
| ORG1 | Organic | Sparkling white wine, 100% Garganega | 0.87 | 8077 | 5250 |
| BD1 | Biodynamic | Sparkling white wine, 100% Garganega | 0.76 | 11,700 | 9360 |
| Corno di Rosazzo (UD) | |||||
| ORG2 | Organic | Still white wine, 100% Friulano | 0.70 | 6285 | 4400 |
| BD2 | Biodynamic | Still white wine, 100% Friulano | 2.60 | 22,000 | 15,000 |
Table 2.
Inventory of input data for the four systems (data per functional unit (FU): one 0.75 L wine bottle).
Table 2.
Inventory of input data for the four systems (data per functional unit (FU): one 0.75 L wine bottle).
| Inputs | Units | Gambellara (VI) | Corno di Rosazzo (UD) | ||
|---|---|---|---|---|---|
| ORG | BD1 | ORG2 | BD2 | ||
| Vineyard materials (trellis system) | |||||
| Concrete (poles) | g | 169.8 | 63.7 | - | 91.0 |
| Untreated wood (poles) | m3 | - | 6.23 × 10⁻⁶ | 1.81 × 10⁻⁴ | 1.68 × 10⁻⁴ |
| Iron (stakes and twist ties) | g | 0.628 | - | 0.0128 | - |
| Galvanized iron (wire) | g | 1.070 | - | 0.164 | - |
| Steel (wire) | g | - | 0.3190 | - | 0.400 |
| Paper (twist ties) | g | - | - | 0.0426 | - |
| Fertilization and pest management | |||||
| N-fertilizer | g | 2.59 | - | - | 4.16 |
| P-fertilizer (mostly P2O5) | g | 4.31 | - | - | 3.64 |
| K-fertilizer (mostly K2O) | g | 6.04 | - | - | 1.04 |
| Sulfur (mostly SO3) | g | 4.29 | - | - | - |
| Cattle manure | g | - | 0.0219 | - | 0.0315 |
| Silica dust | g | - | - | - | 0.0070 |
| Water | L | - | 0.0077 | - | 0.0156 |
| Wastes | |||||
| Plastic | g | 2.140 | - | - | 0.208 |
| Cardboard and paper | g | - | - | - | 0.067 |
| Pest management | |||||
| Copper-based compounds | g | 0.615 | 0.262 | 1.32 | 0.312 |
| Sulfur | g | 5.742 | 5.729 | 5.547 | 3.580 |
| Pyrethrin | g | - | - | - | 0.091 |
| Water | L | 0.80 | 0.1731 | 1.1083 | 0.0949 |
| Wastes | |||||
| Plastic | g | 0.143 | 0.128 | 0.0511 | 0.005 |
| Cardboard and paper | g | 0.857 | 0.160 | 0.120 | 0.0175 |
| Agricultural Machinery use | |||||
| Energy from fuel combustion (diesel) | MJ | 0.3695 | 0.2057 | 0.8556 | 0.2358 |
| Energy from fuel combustion (gasoline) | MJ | - | - | 0.2332 | - |
| Transport (from vineyard to winery) | |||||
| Transport with agricultural tractor and trailer | tkm | 0.00317 | 0.00383 | 0.01009 | 0.00140 |
| Winemaking | |||||
| Grape | g | 1154 | 940 | 1072 | 1100 |
| Electricity from renewable source (photovoltaic) | kWh | - | 0.00559 | 0.01458 | 0.02775 |
| Electricity from grid | kWh | 0.03831 | 0.00186 | 0.01856 | 0.01189 |
| Water | L | 0.214 | 0.096 | 0.853 | 0.010 |
| SO2 | g | 0.012 | - | 0.056 | 0.064 |
| Citric acid | g | - | - | 0.51 | - |
| Wastes | |||||
| Cardboard and paper | g | - | - | - | 0.0006 |
| Packaging materials | |||||
| Glass, partially (15%) recycled (bottle) | g | 650 | 415 | 550 | 400 |
| Cork | g | - | - | 6.0 | 6.0 |
| Steel (crown cork) | g | 2.0 | 2.0 | - | - |
| Printed paper (label) | g | 2.0 | 2.0 | 2.0 | 2.0 |
| Polylaminate (capsule) | g | 1.0 | 1.0 | 1.0 | 1.0 |
| Wastes | |||||
| Plastic | g | 2.57 | 1.44 | 1.71 | 0.03 |
| Cardboard and paper | g | 2.14 | 1.20 | 2.56 | 1.15 |
Table 3.
Characterization results (data per FU: one 0.75 L wine bottle).
| Impact Category | Unit | ORG1 | ORG2 | BD1 | BD2 |
|---|---|---|---|---|---|
| CC | kg CO2 eq | 0.8293273 | 0.9066404 | 0.5055981 | 0.5481429 |
| OD | kg CFC-11 eq | 9.887 × 10⁻⁸ | 1.128 × 10⁻⁷ | 5.901 × 10⁻⁸ | 6.45 × 10⁻⁸ |
| TA | kg SO2 eq | 0.0059614 | 0.0064259 | 0.0035809 | 0.0039387 |
| FE | kg P eq | 0.0002178 | 0.0002434 | 0.0001131 | 0.0001241 |
| ME | kg N eq | 0.0002908 | 0.0002474 | 0.0001226 | 0.0002373 |
| HT | kg 1,4-DB eq | 0.3462381 | 0.4499326 | 0.1748647 | 0.2422486 |
| POF | kg NMVOC | 0.0036964 | 0.0050868 | 0.0022524 | 0.0025582 |
| PMF | g PM10 eq | 2.2709 | 2.7391 | 1.3713 | 1.5583 |
| TET | g 1,4-DB eq | 0.3012 | 0.1961 | 0.1185 | 0.2517 |
| FET | g 1,4-DB eq | 7.5408 | 8.9651 | 3.9959 | 4.8314 |
| MET | g 1,4-DB eq | 7.3805 | 8.7856 | 3.8645 | 4.6479 |
| IR | kBq 235U eq | 0.0634462 | 0.0640238 | 0.0371092 | 0.038953 |
| ALO | m2a | 0.2210942 | 0.2519762 | 0.1382058 | 0.2170459 |
| ULO | m2a | 0.0430685 | 0.0154729 | 0.0381184 | 0.0074012 |
| NLT | m2 | 0.0002304 | 0.9066404 | 0.0001223 | 0.0001626 |
| WD | m3 | 0.0089306 | 1.128 × 10⁻⁷ | 0.0053702 | 0.0043032 |
| MRD | kg Fe eq | 0.0596891 | 0.0064259 | 0.0254155 | 0.0284801 |
| FFD | kg oil eq | 0.249359 | 0.0002434 | 0.154225 | 0.1749101 |
CC, climate change; OD ozone depletion; TA, terrestrial acidification; FE, freshwater eutrophication; ME, marine eutrophication; HT, human toxicity; POF, photochemical oxidant formation; PMF, particulate matter formation; TET, terrestrial ecotoxicity; FET, freshwater ecotoxicity; MET, marine ecotoxicity; IR, ionizing radiation; ALO, agricultural land occupation; ULO, urban land occupation; NLT natural land transformation; WD, water depletion; MRD, mineral resource depletion; FFD, fossil fuel depletion.
Publisher’s Note: MDPI stays neutral with regard to jurisdictional claims in published maps and institutional affiliations. |
© 2022 by the authors. Licensee MDPI, Basel, Switzerland. This article is an open access article distributed under the terms and conditions of the Creative Commons Attribution (CC BY) license (https://creativecommons.org/licenses/by/4.0/).
Share and Cite
MDPI and ACS Style
Masotti, P.; Zattera, A.; Malagoli, M.; Bogoni, P. Environmental Impacts of Organic and Biodynamic Wine Produced in Northeast Italy. Sustainability 2022, 14, 6281. https://0-doi-org.brum.beds.ac.uk/10.3390/su14106281
AMA Style
Masotti P, Zattera A, Malagoli M, Bogoni P. Environmental Impacts of Organic and Biodynamic Wine Produced in Northeast Italy. Sustainability. 2022; 14(10):6281. https://0-doi-org.brum.beds.ac.uk/10.3390/su14106281
Chicago/Turabian StyleMasotti, Paola, Andrea Zattera, Mario Malagoli, and Paolo Bogoni. 2022. "Environmental Impacts of Organic and Biodynamic Wine Produced in Northeast Italy" Sustainability 14, no. 10: 6281. https://0-doi-org.brum.beds.ac.uk/10.3390/su14106281
Note that from the first issue of 2016, this journal uses article numbers instead of page numbers. See further details here.