
Multi-Technology Driven R&D Cost Improvement Scheme and Application Utility of EESP in Energy-Intensive Manufacturing Industry


1
Internet Research Center, China Tobacco Guangxi Industrial Co., Ltd., Nanning 530001, China
2
School of Innovation and Entrepreneurship, Shandong University, Qingdao 266237, China
*
Authors to whom correspondence should be addressed.
Sustainability 2022, 14(10), 6282; https://0-doi-org.brum.beds.ac.uk/10.3390/su14106282
Submission received: 20 March 2022
/
Revised: 5 May 2022
/
Accepted: 19 May 2022
/
Published: 21 May 2022
(This article belongs to the Special Issue Managing Sustainable Development: Technology, Modelling & Applications)
Abstract
:Facing the sustainable use of electric power resources, many countries in the world focus on the R&D investment and application of electrochemical energy storage projects (i.e., EESP). However, the high R&D cost of EESP has been hindering large-scale industrial promotion in the energy-intensive manufacturing industry represented by the tobacco industry. Reducing and controlling the R&D cost has become an urgent problem to be solved. In this context, this paper innovatively proposes a multi-technology driven R&D cost improvement scheme, which integrates WBS (i.e., Work Breakdown Structure), EVM (i.e., Earned Value Method), BD (i.e., Big Data), and ML (i.e., Machine Learning) methods. Especially, the influence of R&D cost improvement on EESP application performance is discussed through mathematical model analysis. The research indicates that reducing EESP R&D costs can significantly improve the stability of EESP power supply, and ultimately improve the application value of EESP in energy-intensive manufacturing industries. The R&D cost management scheme and technical method proposed in this paper have important theoretical guiding values and practical significance for accelerating the large-scale application of EESP.
1. Introduction
Due to the massive increase in world population and the sharp decrease in the natural energy available on the earth, the development and use of alternative energy directly impacts the survival and continuation of human beings. Energy consumption is constantly increasing, especially large-scale traditional energy, such as coal and oil, which has affected the natural environment and the world climate. It poses a great threat to the goal of human sustainable development. The current situation of excess electricity and the development and use of renewable energy makes the energy storage industry play an increasingly important role.
To achieve the Sustainable Development Goals (SDGs) in terms of energy use, governments around the world have successively introduced supporting policies for the energy storage industry and continuously increased the scale of investment in the energy storage market. In 2020, in addition to China, Japan, and South Korea, the United States, Australia, Germany, and the United Kingdom set off another high tide of development. The US Department of Energy (DOE) issued the Energy Storage Grand Challenge Roadmap and the European Commission issued the BATTERY 2030+ innovation roadmap, both of which systemically advance strategic objectives for the future development of energy storage. According to the statistics from the China Energy Storage Alliance (CNESA), by the end of 2020, the global operational energy storage project capacity totaled 191.1 GW, an increase of 3.4% compared to 2019. The importance of energy storage for energy regulation is self-evident.
Despite the COVID-19 pandemic, 2021 was a record-breaking year for investment in the energy transition and the deployment of renewable power, battery storage, and sustainable transportation, according to the 2022 Sustainable Energy in America Factbook published by BloombergNEF (BNEF) and the Business Council for Sustainable Energy (BCSE) (Available online: https://about.bnef.com/blog/record-2021-investment-demand-highlight-critical-role-sustainable-energy-technologies-play-in-the-u-s-economy/, (accessed on 3 March 2022)). This growth was fueled by strong consumer demand, unprecedented injection of new capital into companies, technologies, and projects, and a wave of supportive new policies. Decarbonizing Europe’s energy system creates a USD 5.3 trillion (EUR 4.9 trillion) investment opportunity in new electricity generating and green hydrogen production capacity, according to BloombergNEF’s European Energy Transition Outlook 2022 (Available online: https://about.bnef.com/blog/europes-path-to-clean-energy-a-5-3-trillion-investment-opportunity/, (accessed on 13 April 2022)). In China, the “14th Five-Year” Development Plan for Emerging Businesses proposes that during the “14th Five-Year Plan” period, in promoting the realization of the carbon peaking and carbon neutrality goals and building a new power system based on new energy resources, the government and companies will explore to promote the construction and operation of new energy storage technologies. The installed capacity of peak and frequency regulation power supply will exceed 15 GW, and the scale of new energy storage technologies will reach 2GW (Available at: http://en.cnesa.org/new-blog/2022/3/23/china-southern-power-grid-issued-the-14th-five-year-development-plan-for-emerging-businesses, (accessed on 23 March 2022)).
From the perspective of energy demand, the electricity consumption of the global manufacturing industry has maintained steady growth every year, and the high-tech and equipment manufacturing industry and the consumer goods manufacturing industry have maintained a leading growth rate of electricity consumption. For example, China’s electricity consumption of the manufacturing industries was 968.6 TWh (January to March 2022), a year-on-year increase of 2.3%, while the electricity consumption of the four energy-intensive industries (namely the high-tech and equipment manufacturing industry, consumer goods manufacturing industry, ferrous metal smelting industry, and building materials industry) totaled 534.1 TWh, increased by 0.5% year-on-year. The electricity consumption of the high-tech and equipment manufacturing industry was 203.3 TWh, an increase of 5.0% year on year; the electricity consumption of the consumer goods manufacturing industry was 123.0 TWh, an increase of 2.9% year-on-year (Data of Electricity Consumption (January to March 2022), issued by China Electricity Council, Available online: https://english.cec.org.cn/detail/index.html?3-1451, (accessed on 22 April 2022)). As a traditional pillar industry, the tobacco industry consumes a large number of electric power resources in the manufacturing process of cigarettes. It is of great significance to research and develop and apply new energy electrochemical energy storage technology to realize effective energy storage and scientific output of electricity, which will effectively promote energy conservation and emission reduction, and significantly reduce the cost of cigarette products [1,2].
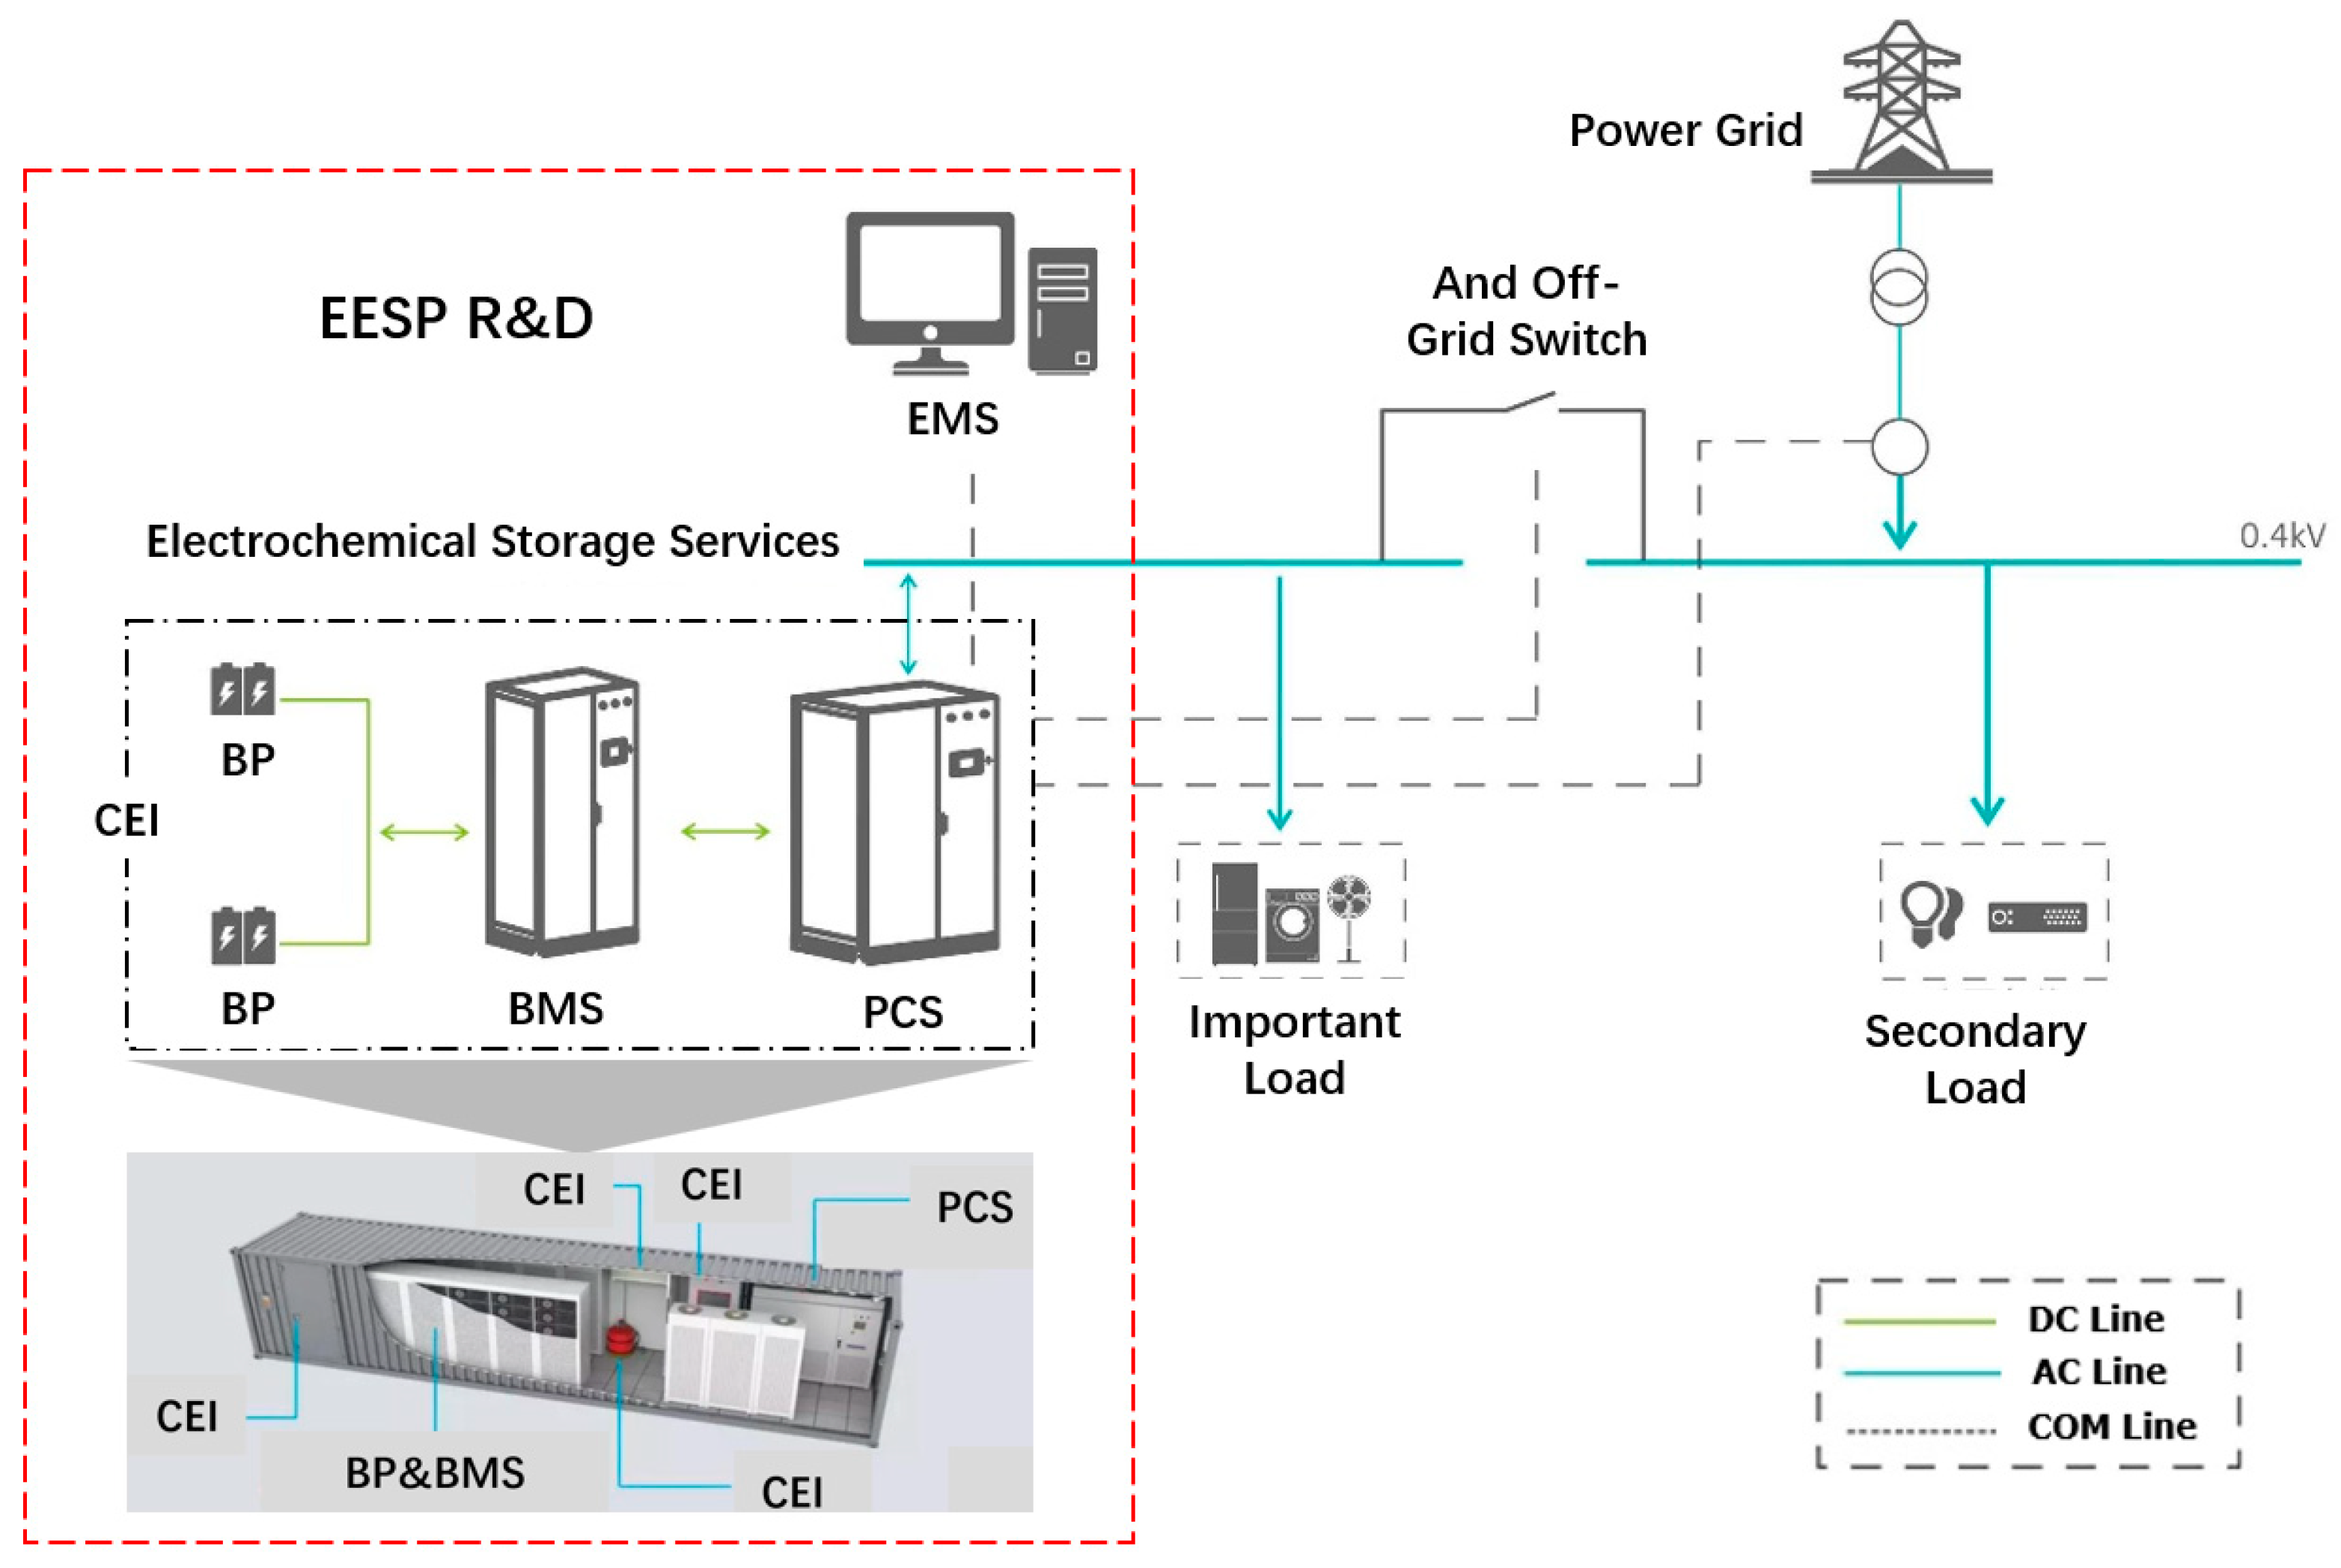
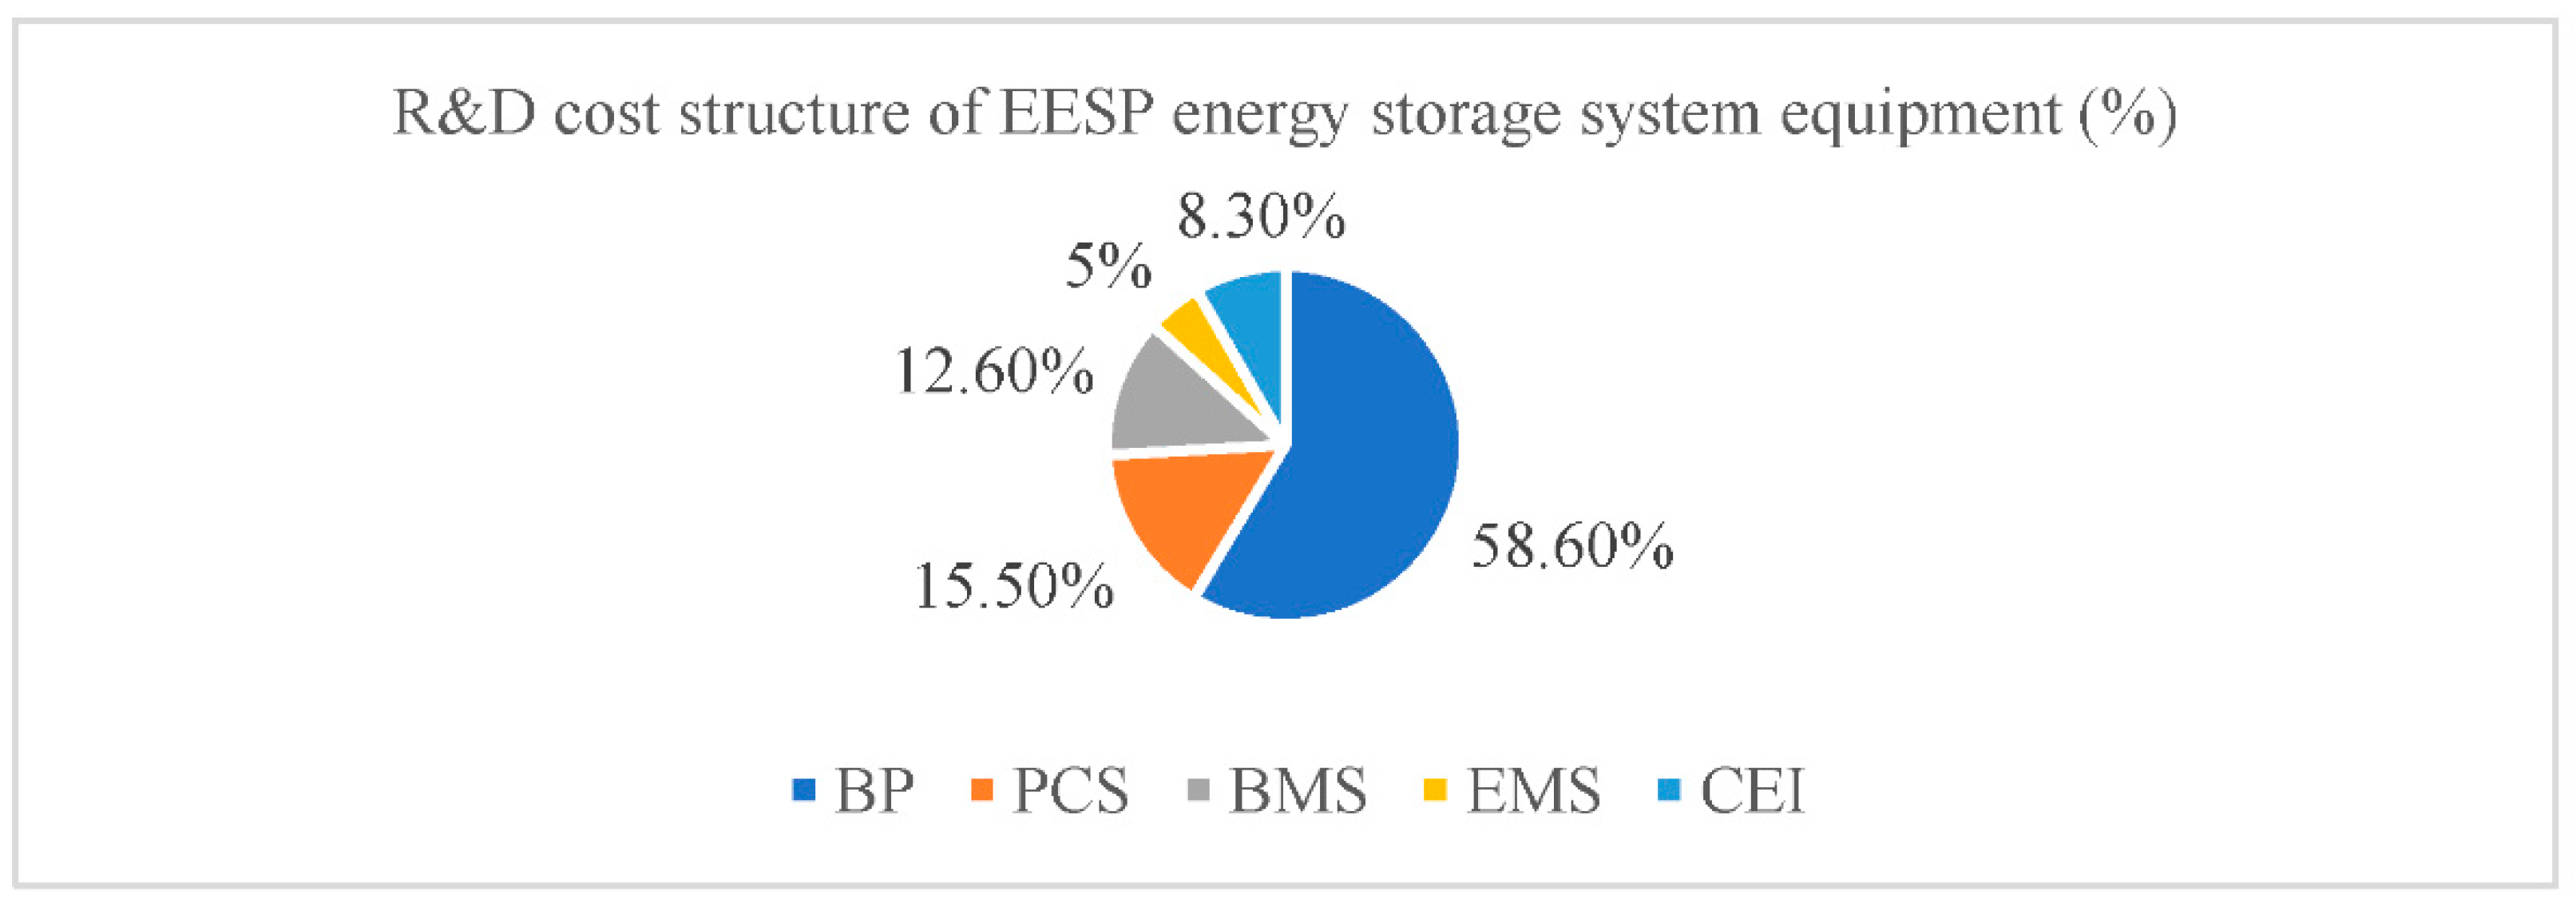
EESP is mainly developed for an energy storage system. The energy storage system consists of Battery Pack (BP), Power Conversion System (PCS), Energy Management System (EMS), Battery Management System (BMS), and Container and Equipment Inside (CEI), see Figure 1. Batteries and PCS account for the highest proportion of value in energy storage systems. As shown in Figure 2, the cost of a battery pack accounts for nearly 60% and PCS accounts for about 15%.
The high R&D cost of electrochemical energy storage projects (i.e., EESP) has been hindering the large-scale industrial promotion in the energy-intensive manufacturing industry represented by the tobacco industry, and reducing and controlling the R&D cost has become an urgent problem to be solved. This reality prompted us to explore a more effective scheme for controlling EESP R&D costs. At the same time, the technology development and performance evaluation issue of energy storage has been attracting the attention of scholars in sustainable development-related research fields. Energy storage technologies (ESTs) enable the ability to cope with intermittency of energy sources by storing excess energy to use when it is needed. Therefore, the evaluation of energy storage alternatives (or technologies) is completely critical and can be exactly considered a multi-criteria decision-making problem [3]. Some scholars proposed the Sustainable Development Goal 7 (SDG7) composite index, hybrid hesitant fuzzy decision-making method, and joint technology performance evaluation approach [4,5,6,7]. Their research provides methodological guidance for the industrial promotion of electrochemical energy storage projects (i.e., EESP), and also provides some references for our study.
Based on EESP practice needs and industry-wide sustainability goals, our paper proposes a multi-technology driven R&D cost improvement scheme, which has important theoretical guiding value and practical significance for accelerating the large-scale application of EESP. Especially, the influence of R&D cost improvement on EESP application performance is discussed through mathematical model analysis. The research indicates that reducing EESP R&D costs can significantly improve the stability of EESP power supply, and ultimately improve the application value of EESP in energy-intensive manufacturing industries.
The innovation of this paper mainly includes the following two points. Firstly, this research comprehensively integrates multi-technology methods and provides a more systematic and effective R&D cost improvement scheme. Secondly, by identifying the characteristics of EESP, this study constructs a mathematical expression function of EESP application utility and analyzes the impact of reducing EESP R&D cost on the application utility of EESP project. The R&D cost management scheme and technical method proposed in this paper have important theoretical guiding value and practical significance for accelerating the large-scale application of EESP.
According to our concerns, this work is divided into six sections. The next section presents the literature review. Section 3 displays the EESP market demand in the energy-intensive industry. Section 4 puts forward the multi-technology-driven EESP R&D cost improvement scheme, involving WBS-driven EESP R&D workflow improvement, big-data-driven EESP data workflow improvement, machine learning-driven EESP cost management workflow improvement, and EVM-driven EESP R&D cost evaluation and improvement. Further, a mathematical model is constructed to study the impact of reducing EESP R&D cost on the application utility of EESP in Section 5 and the main model results are analyzed and discussed. The last section summarizes the whole research results and managerial implications and outlines the limitations and opportunities for future research.
2. Literature Review
The research topics of EESP in existing literature mainly focus on technology innovation, economic life evaluation, and large-scale application of EESP [8,9,10]. Some researchers believe that EESP has technological superiority and can produce considerable economic benefits. In particular, biomass-derived materials have made a breakthrough in electrochemical energy storage and conversion, making the large-scale application of EESP an inevitable trend [11,12]. For example, Sasikala et al. analyzed the R&D status of energy storage systems in South Korea [13]. How do you select the optimal electrochemical energy storage planning program? To answer this question, some scholars discussed the hybrid MCDM method, electrochemistry and control-based idea, and virtual enterprise risk assessment based on a fuzzy analytic hierarchy process [14,15,16]. Due to the complexity of EESP’s R&D engineering, EESP’s R&D management is critical. Using the bibliometrics method, Liu et al. analyzed research hotspots and frontiers of product R&D management under the background of the digital intelligence era [17]. Existing scholars also put forward some questions and made some reflections. How do companies respond to growing research costs: cost control or value creation? To answer this question, scholars have analyzed R&D activities, technology absorption ability, and energy intensity in different countries, such as China, Japan, the EU, and the USA [18,19,20]. How do you leverage the impact of R&D on product innovation? To answer this question, existing studies have discussed the moderating effect of management innovation, dynamic R&D choice, the impact of the firm’s financial strength, and the effect of cost control techniques on organizational performance [21,22,23].
In the current cost management system, project R&D cost control theory has been a crucial component. To a certain extent, driven by social and economic development and advanced production technology, some western developed countries are in a very active leading position in new product research and development. The theories of project R&D cost control in these countries have also developed rapidly, and the cutting-edge theoretical research framework has been established in the first place. Now, in the research of product R&D cost control, after a long amount of time of evolution and improvement, its theoretical system has reached maturity. The existing literature mentions many cost control methods, such as target cost method, activity-based cost method, and value engineering. The relevant theories and methods have been fully demonstrated in actual production activities. Effective control of new product R&D costs is the key to successful project management, and it requires comprehensive consideration of cost minimization and benefit maximization. As for how to control the R&D cost, Lucas designed the Hamilton equation method and found that the optimal R&D fund management decision of the same project has obvious differences under different execution situations [24]. Based on his research, Grossman further improved the Hamilton equation and added some other influencing factors, such as technical uncertainty, into the equation construction process [25]. Given the new product development problem, Anderson and Sedatole used accounting data to design quality into products [26]; Handfield et al. considered the participation of suppliers [27]; Behncke et al., developed an extended model for integrated value engineering [28]. Because of the inseparable relationship between project R&D cost control and project R&D process, some scholars have explored various control methods from the perspective of the project R&D process. For example, Dutta noted that R&D work requires the integration of many activities, and many activities affect each other. They proposed to design a method of R&D cost management and control from the perspective of whole-process management [29]. Activity-based costing (ABC) and target costing have been promoted and applied to different practical fields and industrial operation scenarios. Based on the practice of enterprises, Cooper and Kaplan conducted a case study on the application of activity-based costing to Tektronite and found that activity-based costing had significant practical effects on cost control in the product design stage [30]. Shortly thereafter, other scholars (such as Merz and Hardy) investigated HP that adopted ABC and suggested that ABC should be applied in the development stage of new products, which could help managers to make more correct business decisions [31]. The research of the target cost method emerged in the 1990s and has been widely used in the Japanese manufacturing industry. Hertenstein and Platt proposed in their book that enterprises should learn from and introduce the target cost method when evaluating the performance of new product R&D, to achieve effective control of the new product R&D process [32]. Davila and Wouters compared and analyzed a variety of cost control methods based on new product R&D process management and believed that the target cost method had better application value [33].
After entering the era of the digital economy, many modern technology methods have been widely used in R&D cost management. Currently, the WBS method has been applied to R&D cost management in many different scenarios, involving quantitative similarity assessment of construction projects [34], model development of mobile cloud service [35], quality planning of high rise building architectural works [36], schedule planning in Steel Bridge construction projects [37], pricing management of prefabricated concrete construction project [38], risk evaluation index system construction for power grid engineering cost [39], and multi-dimensional BIM database construction for total construction as-built documentation [40]. By analyzing the studies of existing scholars on EVM, it is found that EVM has been widely used in the supervision and management of engineering cost and schedule [41,42,43,44,45,46], and many engineering practices (such as the construction of the Karanggeneng Nawacita Cs Suspension Bridge [44], goods transportation of coastal enterprises [45], and traditional software projects [46]) prove that it is an effective method to monitor practice and engineering deviation. With the advent of the data era, management innovation driven by big data has been favored by scholars and industry experts [47,48,49]. In the process of project management, a large amount of cost-related data has been accumulated, which provides the foundation and conditions for the research of intelligent project cost management driven by big data. Many scholars have studied the application of big data technology in cost control in project management [50,51,52], especially in construction project management. Blackburn et al. explored the concept of big data and whether, and to what extent, it might affect R&D management in the future [53]. They indicate the rise of big data and big data analytics will have significant implications for R&D and innovation management in the next decade. As we all know, machine learning is the core technology of artificial intelligence. Through data or previous experience, clustering, classification, regression, reinforcement learning, and other algorithms are used to mine hidden rules from massive data, which can serve the accounting, prediction, decision-making, and control of project cost management. The application of interpretable machine learning models can help enterprises to develop intelligent decisions, such as R&D budget [54,55,56,57]. Jang proposes a new decision support framework for allocating an R&D budget. They employed a machine-learning algorithm to accurately estimate future R&D output and demonstrated the effectiveness of the proposed model by applying it to a national R&D program conducted by the Korean government. A machine learning-driven R&D budget allocation plan can achieve an output 13.6% greater than the actual R&D output [57]. Considering the complex characteristics of EESP R&D work, this paper selected and integrated WBS (i.e., Work Breakdown Structure), EVM (i.e., Earned Value Method), BD (i.e., Big Data), and ML (i.e., Machine Learning) and Mathematical Modeling methods to put forward a multi-technology driven EESP R&D cost control and improvement scheme.
In terms of EESP application scenarios, this study focuses on energy-intensive manufacturing industries. This paper specifically addresses the high energy consumption (especially electrical energy) of the tobacco industry. The tobacco industry has been regarded by many researchers as the typical representative of the high energy consumption industry, attracting much attention. For example, Laković et al., conducted the numerical computation and prediction of electricity consumption in the tobacco industry [58]; Liu and Wang conducted case studies of the tobacco industry to design the planning mechanism of energy conservation and emissions reduction and analyze the benefit of electric energy substitution [59,60]; Wang conducted a case study of Chinese cigarette manufacturers to explore the influences of a green industrial building on the energy consumption of industrial enterprises [61]; Thollander et al. systematically studied the industrial energy efficiency issues involving the tobacco industry from the perspectives of energy auditing, energy management, and policy formulation [62].
To sum up, although there is some research on the theories and methods of project cost management, there is still no systematic study on the R&D cost management of EESP projects by integrating multi-technology methods (involving WBS, EVM, BD, ML mentioned above) in the application context of the energy-intensive manufacturing industry. This study complements this field. It can provide an operational approach and technical guidance to decrease the R&D cost and improve the application performance of EESP in energy-intensive enterprises.
3. EESP Market Demand in Energy-Intensive Industry
We take the tobacco industry as an example to show the energy consumption in the production process of tobacco products, thus illustrating the necessity of introducing EESP in the energy-intensive industry to improve energy consumption and shortage.
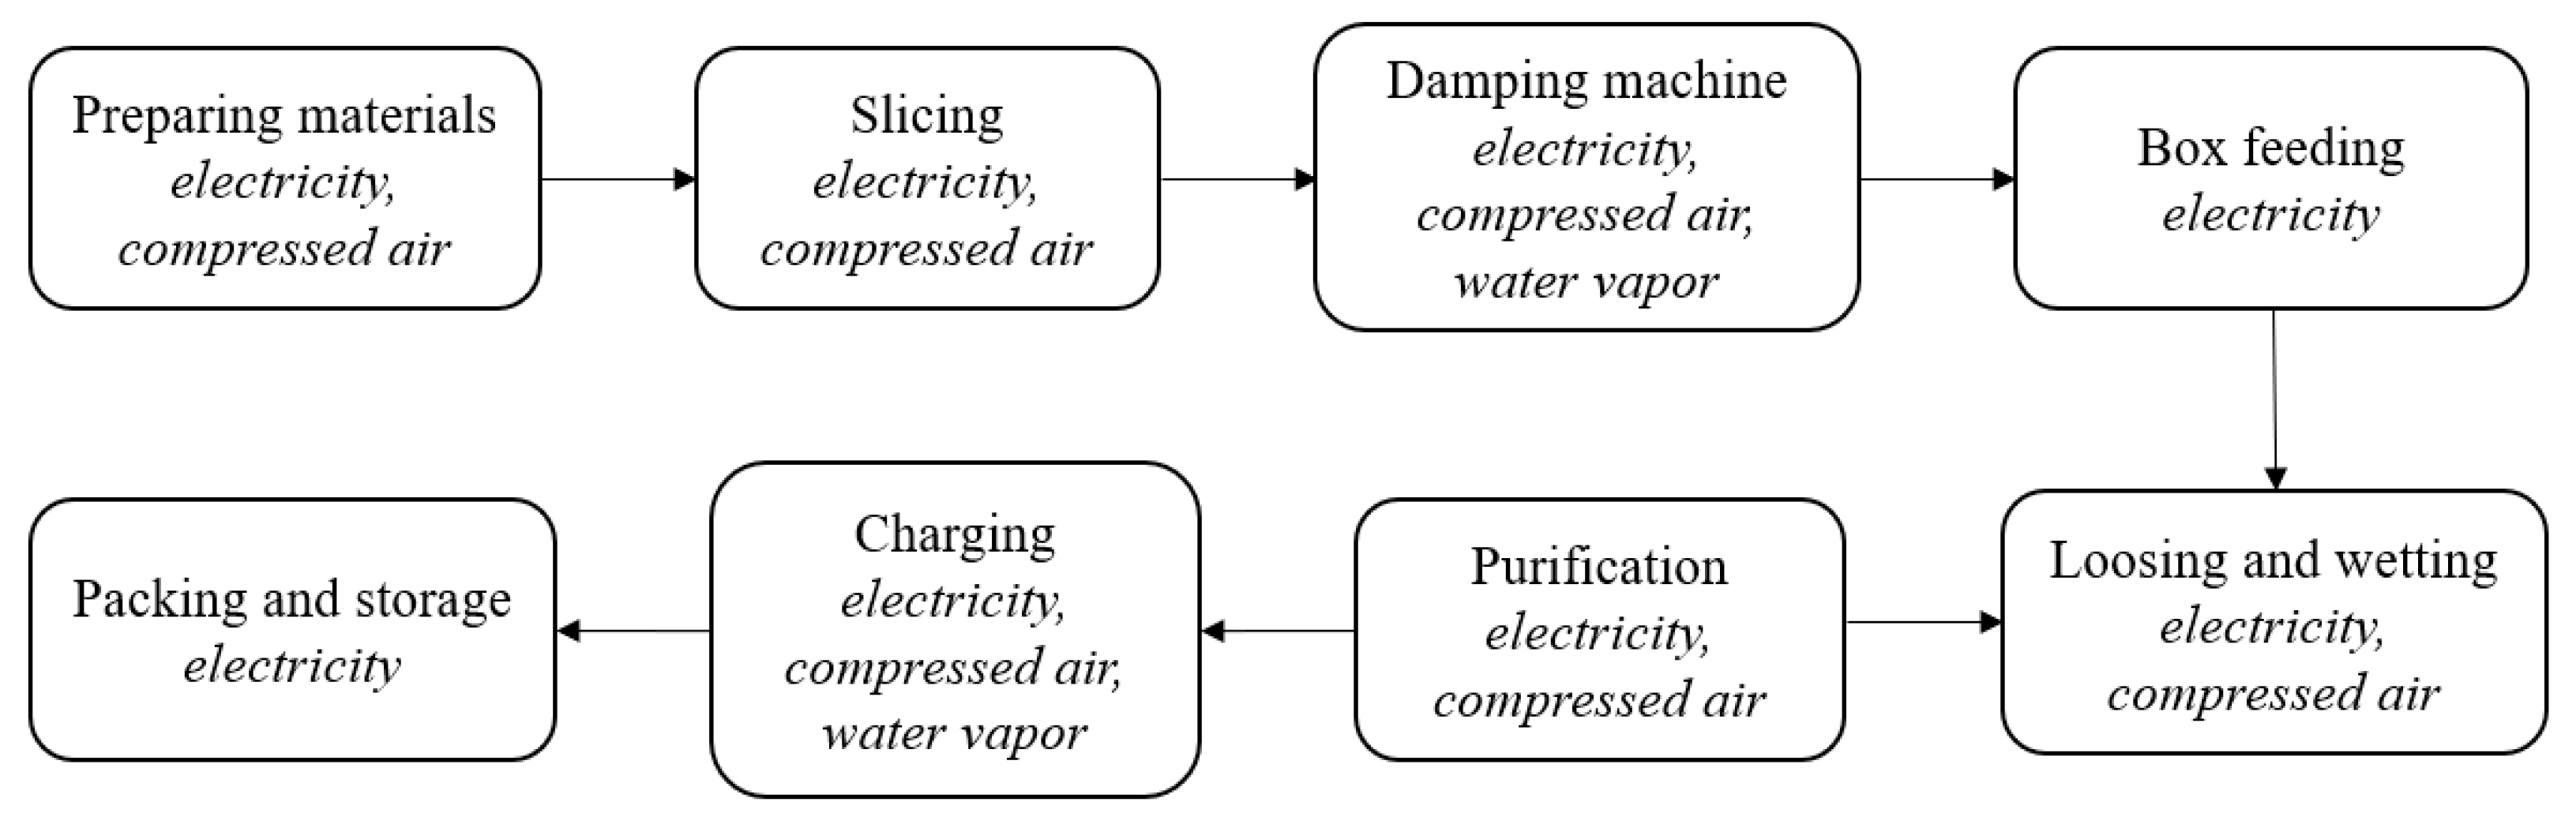
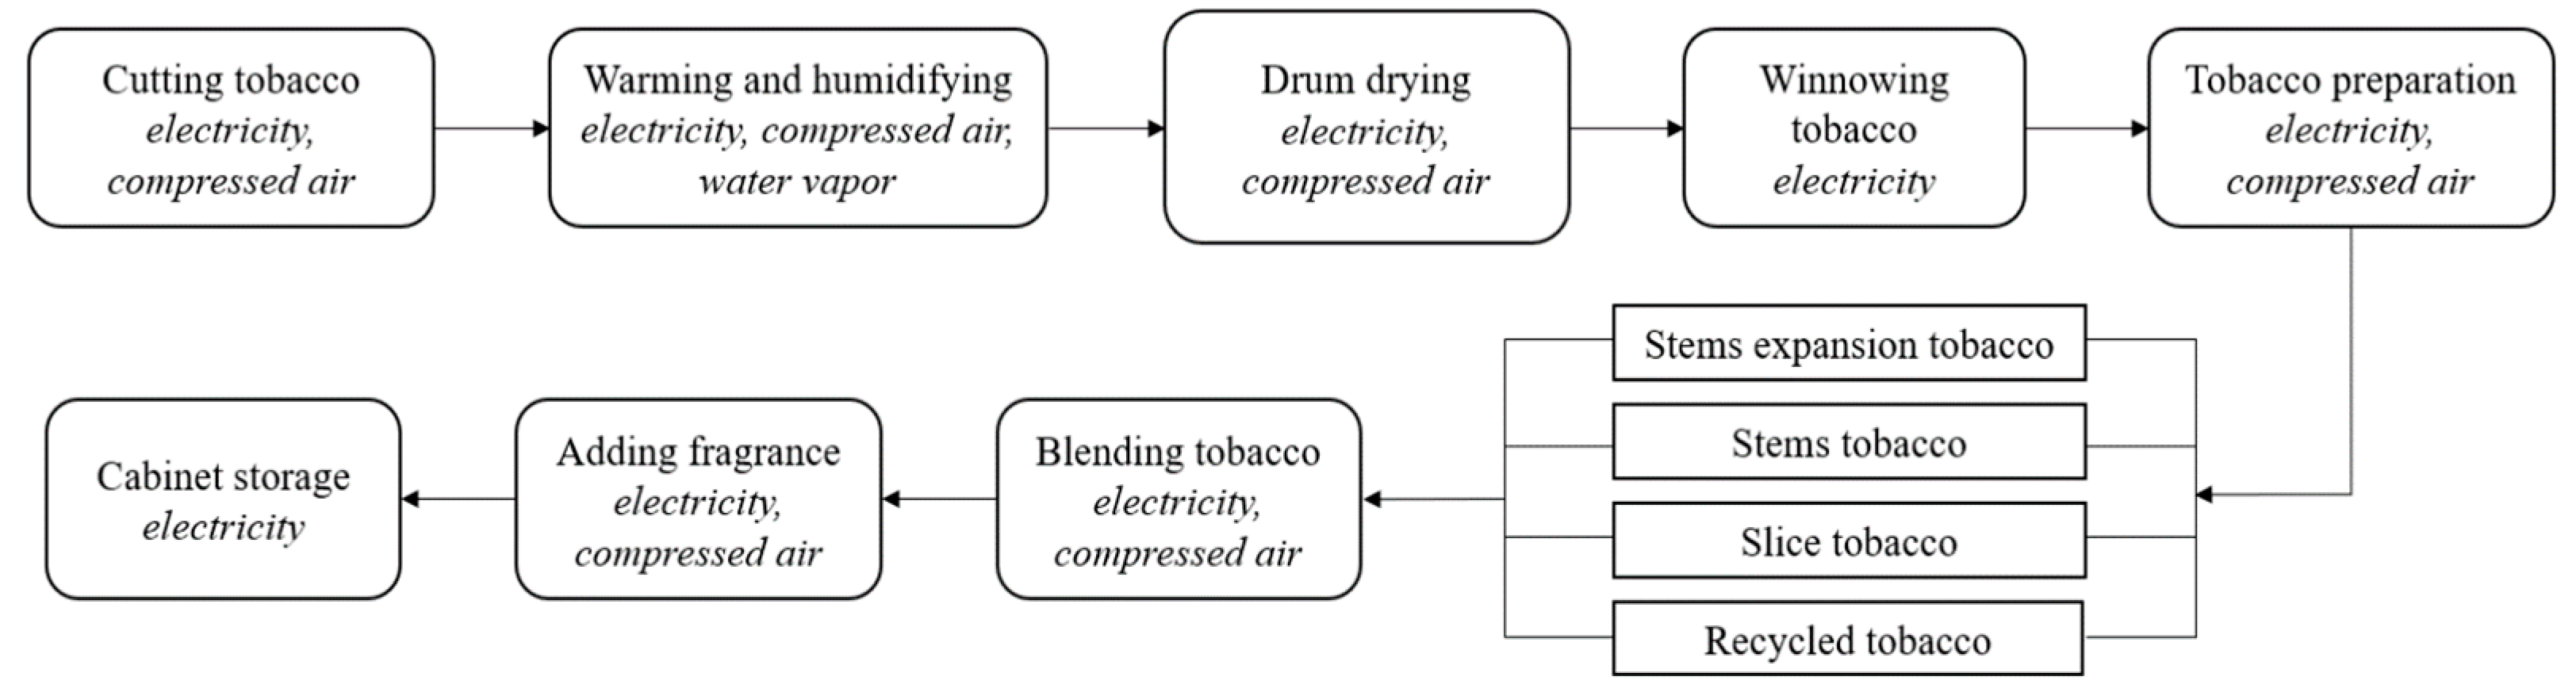
Due to the particularity of tobacco products, there are many working procedures, including not only the primary processing processes, such as field planting, preliminary baking, repeated baking, and fermentation, but also the tobacco production processes, such as leaf selection, cigarette formula, and packaging [1,2]. Cigarette production in tobacco production enterprises can be mainly divided into silk-making and cigarette packaging, and the silk-making process is further refined into the processing stages of leaves, filaments, and stalks [2]. Energy consumption is concentrated in these links, which is the key to management, see Figure 3, Figure 4, Figure 5 and Figure 6.
The above analysis shows that the normal operation of the main links of cigarette production depends on the support of energy, especially when the electric energy occupies a large proportion. Electric energy consumption has also become one of the main sources of cost for tobacco manufacturing enterprises, and the supply of electric energy has a direct impact on product production and production cost.
Electrochemical Energy Storage Projects (EESP) have a huge impact on the energy-intensive industry. EESP has the effect of peak clipping and valley filling, which is conducive to the sustainable use of electricity and helps the energy-intensive industry achieve better benefits. The energy-intensive industry is mainly some large-scale manufacturing industries. Therefore, the development and application of EESP in the tobacco industry have important economic benefits and long-term strategic significance. Electrochemical energy storage uses chemical elements as energy storage media. Electrochemical energy storage technology is not limited by the geographical environment and can directly store and release electric energy, which has aroused widespread concern in emerging markets and scientific research fields.
According to the Energy Storage Industry Research White Paper 2021 released by the China Energy Storage Alliance (CNESA), by the end of 2020, the operational energy storage project capacity in China accounted for 18.6% of total global capacity. EESP accounted for the second-largest portion of installed capacity, at 3269.2 MW, a growth of 91.2% compared to 2019. Among the variety of electrochemical energy storage technologies, lithium-ion batteries comprised the largest portion of installed capacity at 2902.4 MW. In 2020, the newly installed capacity of global EESP reached 4.7 GW, 1.6 times more than that of 2019. China, the United States, and Europe took the leading position in the global electrochemical energy storage market in 2020 and together accounted for 86% of the total scale of newly added EESP in the world, and the scale of newly added electrochemical energy storage operation all reached GW level (Energy Storage Industry White Paper 2021, published by China Energy Storage Alliance (CNESA), Available online: https://static1.squarespace.com/static/55826ab6e4b0a6d2b0f53e3d/t/60d2fff40aec596dc9e5cd65/1624440841870/CNESA+White+Paper+2021-PDF (accessed on 14 April 2021)). The application scenarios of electrochemical energy storage projects are relatively rich. It mainly involves the power generation side, user side, grid side, auxiliary services, centralized renewable energy field, and other fields. Generally, the user side is the largest application scenario of electrochemical energy storage, followed by the auxiliary service field.
4. Multi-Technology Driven EESP R&D Cost Improvement Scheme
The cost management schemes of EESP given by the existing research are all at the strategic level. This paper combines the modern project cost management theory and proposes a multi-technology driven EESP R&D cost improvement model at the operational level, as shown in Figure 7. The new model considers project resource planning, project cost estimation, project cost control, and other links from the tactical operation level according to the cost management characteristics of EESP. Moreover, by optimizing each process of R&D cost management, the EESP cost control standard is promoted to a higher level from the actual point of view, making it more universal.
4.1. WBS-Driven EESP R&D Workflow Improvement
Project decomposition is to use the working principle of WBS to gradually decompose large and complex projects into small and clear units at different levels until the work can no longer be subdivided. To clarify the division of tasks at all levels of EESP, the method of WBS work breakdown structure was used to formulate the project route and the project schedule. The structure tree model of EESP R&D work is shown in Figure 8. The EESP R&D process is divided into five second-level items, from project approval to project product improvement, and each second-level item is transformed into a third-level minor item according to its work tasks.
According to the division of R&D work in the WBS work breakdown structure chart of EESP, the whole project can be divided into 14 work packages according to the specific work content of the project (see Table 1).
4.2. Big Data-Driven EESP Data Workflow Improvement
The traditional EESP data workflow is visible on the surface, mainly represented by data recording and extraction. While the big data driven EESP data workflow is ordered and deeply analyzed, mainly represented by data classification and marking, data law and logic analysis, and two-dimensional or three-dimensional visual display. The improved EESP data workflow using big data mainly consists of four parts, namely data source, data storage and management, data analysis and mining, data visualization, followed by result presentation.
- (1)
- Data source. It mainly involves financial management systems, project management systems, Excel files, and related log, text, and image, and image files. Depending on the source channel of the data, they can be divided into internal data and external data. In the project management system and financial management system, the project category, project content, personnel output value, and other internal data related to project cost can be obtained, such as the project management table, personnel basic information table, personnel output value information table, project output value paper, balance table, and personnel payroll data.
- (2)
- Data storage and management. Firstly, an ETL (i.e., Extract-Transform-Load) tool is used to collect the data related to project cost from the data source. To ensure the reliability and effectiveness of the data, data are cleaned, transformed, and integrated according to the requirements of project cost management. After data processing is completed, the project cost management big data platform based on the Hadoop architecture builds a project cost management data warehouse (Hive), including data marts, such as cost planning, cost estimation, cost budget, cost analysis, and evaluation, and stores it through HDFS distributed files, which can then use machine learning algorithms to achieve project intelligent cost management based on the data warehouse.
- (3)
- Data analysis and mining. Based on the project cost management data warehouse, the corresponding project cost management model is constructed by a machine learning algorithm aiming at various business activities of project cost management. For example, in the project cost forecasting activities, according to the historical data, the ridge regression algorithm is used to analyze the influencing factors of project cost and the degree of influence of each factor on cost, establish the cost forecasting index system, and finally establish the project cost forecasting model based on the ridge regression algorithm.
- (4)
- Data visualization and result display. Visually display the information obtained by the machine learning algorithm, including the result data of cost prediction, cost estimation, cost budget, cost analysis, and evaluation, or form a report and send it to managers. Managers can also master the project cost status through real-time inquiry, and finally realize the digital, intelligent, and scientific management of the project cost.
4.3. Machine Learning-Driven EESP Cost Management Workflow Improvement
Given the similarity between EESP and LAP (Landscape Architecture Project) in the development and design process, the machine learning algorithm mentioned in this study refers to the mature practice of Cheng et al. (2021) in LAP [63].
- (1)
- Cost prediction—based on the RR algorithm
Ridge regression (RR) algorithm is a type of biased estimation regression method specially used for collinear data analysis, which has a smaller mean square error than least square estimation.
The process of using a ridge regression algorithm to forecast the project cost can be divided into two stages. The first stage is to build the cost forecasting index system according to the construction of the project cost; the second stage is cost prediction based on the ridge regression algorithm. This work includes four steps. First, collect the historical data of project cost and preprocess it. Second, based on the index of project cost prediction, feature extraction is carried out on the historical data, and project cost data samples are established, which are divided into the training set and test set. Third, the cost forecasting model and training model are established based on the ridge regression algorithm. Fourth, the cost forecasting model is tested by comparing the fitting degree of training samples and predictive testing samples.
- (2)
- Cost planning—based on the SVM algorithm
The support vector machine (SVM) is a binary classification model and a machine learning algorithm that classifies data sets according to supervised learning. Its basic principle is to find an optimal hyperplane, which can not only divide the two types of sample points correctly but also maximize the geometric distance between the sample points closest to the hyperplane and the plane.
The project target cost calculation process based on SVM is divided into four steps. First, collect the historical cost data of the project, and divide them into labor cost, design cost, and management cost according to the composition characteristics of the planning and design project cost. The cost influencing factors are taken as the index of the target cost measurement, and the project cost is taken as the target to build a case library. Second, based on the attribute reduction of the rough set, the qualitative target cost index is quantified, and the data in the case library are discretized to produce the decision table suitable for the rough set, forming the reduced attribute set of labor cost, design cost, and management cost. Third, build a target cost calculation model based on SVM. Select the sample data similar to the content to be measured from the cost instance database and preprocess the sample data. After constructing the learning sample set as the input and determining the kernel function and parameters, SVM learning is carried out, and then the regression model is established to find the regression function. Fourth, the regression function is used to obtain the target cost of the EESP project, which is summarized to a higher level to obtain the target cost of the whole project.
- (3)
- Cost control—based on the BPNN algorithm
BP neural network (BPNN) is a type of feedforward network with an arbitrary complex pattern classification ability and a good ability for multidimensional function mapping. It is based on the error backpropagation training of the multilayer which aims to determine the mapping relationship between the input and the output of the mathematical equations. Only through their training and learning some rules in a given input value can it be the closest to the desired output results.
The construction of a cost control model based on the BP neural network is divided into three steps. First, the cost control point and cost control system of the project are formed through the decomposition of cost components and identification of cost influencing factors. Second, by pre-processing the project cost data and quantitative evaluation of the project, the project cost control evaluation data sample table is obtained and normalized. Third, a three-layer BP neural network evaluation model of project cost control composed of input layer-hidden layer-output layer is established and tested to verify the effectiveness of the BP neural network for project cost control.
- (4)
- Cost accounting—based on the PCA and HC algorithm
A reasonable selection of cost drivers and an effective combination of cost drivers can avoid consuming a lot of accounting costs based on ensuring cost accuracy. PCA is a feature selection analysis method based on the principle of statistical optimality. Its idea is to reduce the dimension of the data set while preserving as much variance as possible in the data set. The hierarchical clustering (HC) algorithm is a common clustering method. It is a series of division and multi-step classification to produce a nested cluster, which can be divided into condensed hierarchical clustering and split hierarchical clustering according to the order of hierarchical decomposition.
The integration process of project cost drivers based on PCA and HC algorithms is divided into four steps. First, several different EESP projects were selected, and the R&D cost data of each project were collected to form a relative scale of project cost drivers. Second, the correlation coefficient matrix is obtained according to the principal component analysis data, and the number of cost drivers is determined according to the marginal effect of the principal component and contribution rate. Third, the HC analysis of cost drivers is carried out, the two classes with the smallest distance are selected to merge into a new class, and the distance between the new class and other classes is calculated until all the classes are merged into one class. Fourth, by calculating the factor load matrix of cost drivers, the importance of cost drivers in corresponding factors is determined, and the cost drivers are combined with the results of hierarchical cluster analysis. Finally, the errors before and after the cost drivers merge are calculated to verify the feasibility of this method.
4.4. EVM-Driven EESP R&D Cost Evaluation and Improvement
In the R&D process of EESP, we need to supervise the project cost in real-time and effectively control the project R&D cost. The goal of project cost control is to ensure that the actual cost of the project does not exceed the scope of the project budget. If there is any deviation, we shall timely adjust the original project R&D cost budget or take feasible corrective measures to remedy the deviation. Compared with other R&D cost management evaluation methods mentioned in the literature review, Earned Value Method (EVM) is more suitable for EESP because it can analyze the current situation of R&D cost control more directly and quickly [64].
Specific execution steps: first, parameters, such as BCWS (budgeted cost of planned workload), BCWP (budgeted cost of completed workload), ACWP (actual cost of completed workload), CPI (cost performance index), and SPI (schedule performance index), are calculated. Then, the magnitude of the cost deviation and schedule deviation can be determined simply by making a difference or comparison operation. Table 2 shows a cost data sheet provided by the EESP R&D supervisor of H company, China, which was extracted from the sixth month (i.e., the beginning of the prototype trial phase) [64]. Using earned value analysis to carry out simple calculation, we can find the cost performance index CPI = 528000/531731 = 0.099 < 1, progress performance index SPI = 528000/820000 = 0.643 < 1 and the relationship among the cost control indicators is as follows: BCWS > BCWP, BCWP < ACWP. This indicates that the current EESP R&D work is seriously delayed, the project is inefficient, and the project fund is overspent.
5. Influence of R&D Cost Improvement on EESP Application Utility
To further illustrate the necessity of reducing EESP R&D cost, we constructed the following mathematical model to measure and evaluate the impact of reducing EESP R&D cost on the application utility of the EESP project.
5.1. Features of the EESP
This model comprehensively describes the following three specific functions of EESP in the application of utility functions:
- (1)
- Energy Storage, Peak Clipping Utility: On the transmission and distribution side, the problems of peak and frequency regulation, peak clipping and valley filling, intelligent power supply, and distributed energy supply should be solved to improve the multi-energy coupling efficiency and achieve energy saving and emission reduction.
- (2)
- Energy Release, Valley Filling Utility: On the power generation side, it solves the problem of discontinuous and uncontrollable power generation of renewable energy, such as wind and solar energy, and ensures its controllable grid-connection and on-demand transmission and distribution.
- (3)
- Value-added Utility of Electricity Diversification: On the electricity side, support the electrification of the automobile and other energy use terminals to further achieve its low-carbon, intelligent goals.
5.2. Variable Descriptions of the Model
is the expected utility of running EESP. As shown in Formula (1), the objective function consists of three parts, which correspond to the three functional characteristics of the EESP energy supply mentioned above. In our modeling, represents the marginal R&D cost of EESP for designing different power supplies ; is the benefit generated by per unit of EESP power supply during production activities; is the marginal benefit brought by energy storage for backup production when electricity supply is sufficient; and is closely related to , expressed as . Generally, the higher is, the higher is, namely, the better the efficiency and practical value of energy storage. represents the marginal benefit loss caused by the energy released when the electricity supply is insufficient, which is preferentially used for “Valley Filling”. is also closely related to , expressed as . Generally, the higher is, the lower is, that is, the lower the potential cost of supplementary electricity supply. represents the marginal value-added benefit from the diversified use of EESP electricity, and . Key notations are summarized in Table 3.
5.3. Utility Function Construction

As shown in Formula (1), the objective function is divided into four parts, involving three types of utility and one R&D cost. Especially, three kinds of utility, namely marginal energy storage utility, marginal energy release utility, and marginal value-added utility of electricity diversion, correspond to the three functional characteristics of the EESP energy supply mentioned in Section 5.1.
Surprisingly, the form of Formula (1) is similar to the Newsvendor Model under stochastic inventory demand. It can be easily proven that the expected utility function is concave, and the solving formula can obtain the demand distribution function of the optimal design of the EESP power supply ().
5.4. Influence Analysis
- (1)
- Direct influence variables:
In the above mathematical model, the total R&D cost () is a direct variable affecting the application utility of EESP and a key relationship that must be determined before developing an improvement scheme to reduce EESP R&D cost.
Through simple deduction, we can obtain:
Thus, it supports . The relationship reveals that reducing EESP R&D cost can increase the probability of abundant power supply, improve the stability of EESP power supply, and ultimately improve the application value of EESP in energy-intensive manufacturing industries.
In addition, is also a directly influencing variable. Since , the larger we gain, the lower the application utility of EESP, that is to say, excessive pursuit of value-added utility will reduce the whole application value of EESP. Needless to say, electricity diversification can bring users a certain amount of marginal value-added utility. However, this is not the focus of EESP R&D work, and the R&D investment for value-added utility can be appropriately reduced according to the situation.
- (2)
- Indirect influence variables: ,
According to the working principle of the electrochemical energy storage device, we use and to represent the marginal benefit brought by energy storage for backup production and the marginal benefit loss caused by energy released respectively. The former is the positive utility effect parameter, while the latter is the negative utility effect parameter, and . By simple calculation based on Formula (2), we can get:
Thus, the following relationship was found:
Since is true, can be further obtained. This reveals that has a relatively greater impact on the application utility of EESP than , which is also consistent with the actual situation. Although and have a certain offset effect on the application performance of EESP, the overall effect is still positive. We show this result in Table 4 with a colored background section. Therefore, EESP R&D work should be carried out more effectively to achieve better performance, especially greater generation stability, in order to minimize the impact of power supply shortages on the utility of EESP applications.
The influence relationship of variables related to R&D cost is summarized in Table 4.
5.5. Results and Discussion
By using the mathematical modeling method, we found that reducing EESP R&D costs can significantly improve the application value of EESP in energy-intensive manufacturing industries. The conclusion of the above model research provides theoretical support for the implementation of the multi-technology driven R&D cost improvement scheme proposed in this paper. In practice, however, the utility advantages of introducing EESP far outweigh the disadvantages of increased R&D costs, which may discourage companies from pursuing multi-technology-driven R&D management solutions that would better reduce R&D costs. For example, the tobacco industry, which has a recognized high demand for electricity supply, develops and designs its EESP with a large power supply and storage function as the first goal. Once successfully developed, the positive performance of electric energy savings via EESP is significant and far exceeds R&D costs. This is also taken into account in our modeling of applied utility. We assume that the higher can lead to an increase in the efficiency and practical value of energy storage (i.e., the higher ) and decrease the potential cost of supplementary electricity supply (i.e., the lower ). To pursue functional utility, many enterprises choose the maximization of EESP benefit as the goal, rather than the optimization of R&D cost-benefit. In the modeling, we consider the balance of R&D cost and performance and consider three kinds of utility synthetically: marginal energy storage utility, marginal energy release utility, and marginal value-added utility of electricity diversion. The conclusion of our modeling study has theoretical guidance. However, to promote the effective implementation of a multi-technology driven R&D cost improvement scheme, energy-intensive enterprises must change their thinking and implement lean management and R&D cost control during the introduction of EESP to achieve the optimization of R&D cost-benefit.
6. Conclusions
The Sustainable Development Goals (SDGs) set out by the United Nations aim to comprehensively address the social, economic, and environmental dimensions of development from 2015 to 2030. The Sustainable Development Goals refer to “reliable and sustainable modern energy” and “sustainable production methods”, which are closely related to the implementation of electrochemical energy storage projects (EESP) in energy-intensive manufacturing industries. The R&D of EESP for energy-intensive manufacturing industries is of great significance to improve the stability of the power system during production and help achieve sustainable development goals, such as energy conservation and emission reduction. As the main form of new energy storage, electrochemical energy storage is considered one of the most promising energy storage technologies, and its application scale continues to expand in recent years. China’s 2030 Carbon Peak Action Plan calls for more than 30 gigawatts of new energy storage capacity to be installed by 2025. In addition, many sensitive loads are concentrated on the power side at present, including all kinds of precision processing enterprises, high-tech manufacturing, hospitals, and other important departments, which have higher and higher requirements on power quality and power supply reliability. The above background provides an opportunity for the application of EESP in energy-intensive manufacturing industries.
This paper focuses on electrochemical energy storage projects (EESP) and makes an in-depth study on the theory and application of R&D cost management. Our research has made three major contributions. Firstly, considering the current market demand for EESP in energy-intensive manufacturing industries represented by the tobacco industry, this paper identifies the R&D process of EESP, and innovatively proposes a multi-technology driven R&D cost improvement scheme, which comprehensively integrates WBS (i.e., Work Breakdown Structure), EVM (i.e., Earned Value Method), BD (i.e., Big Data) and ML (i.e., Machine Learning) methods. Especially, it involves WBS-driven EESP R&D workflow improvement, big-data-driven EESP data workflow improvement, machine learning-driven EESP cost management workflow improvement, and EVM-driven EESP R&D costs evaluation and improvement. Secondly, the influence of R&D cost improvement on EESP application performance is discussed through mathematical model analysis. Thirdly, the research indicates that reducing EESP R&D costs can significantly improve the stability of EESP power supply and ultimately improve the application value of EESP in energy-intensive manufacturing industries.
This paper draws the following management implications from the study:
- (1)
- With the continuous reduction of traditional energy, emission reduction and energy saving have entered the normal state, and the related fields of new energy themes are developing increasingly vigorously, especially in the field of electrochemical energy storage. Electrochemical energy storage has a variety of application scenarios, mainly involving the power generation side, user side, grid side, auxiliary services, centralized renewable energy field, and other fields, which have broad industry adaptability and research and promotion value.
- (2)
- As an emerging hot field, EESP has prominent problems in R&D cost control, and it is urgent to strengthen project cost control and management. The combination of various advanced technologies will yield surprisingly good results through more comprehensive, detailed, and rigorous management of workflow, data flow, and cost budgeting processes. Meanwhile, the intuitive data are used in the project cost management method to provide a basis for the subsequent reasonable improvement measures.
- (3)
- EESP has a good application prospect in the energy-intensive manufacturing industry represented by the tobacco industry. Its wide application will effectively promote the upgrading of the manufacturing industrial structure and is of great significance to the long-term sustainable development of the manufacturing industry in China and even the world.
The limitations of our study are as follows. First, the scheme we proposed is only a theoretical method guidance framework, and this paper does not provide a specific case analysis of a complete project supported by enterprise operation data. This is because different types of energy-intensive manufacturing industries may have different implementation processes of EESP. In the follow-up, we will carry out practical research on various types of high-energy-consuming manufacturing enterprises, such as high-tech equipment manufacturing enterprises and food manufacturing enterprises. Second, in the design of the objective function of EESP’s application utility, total R&D cost is simply regarded as a linear function of energy supply capacity. In practice, the relationship may be non-linear, and marginal R&D costs may increase and then decrease. In addition, to facilitate the analysis of the relationship between R&D cost and total utility, we also simplified the marginal value-added utility of electricity diversification, which may have a greater impact on total utility. We hope that follow-up researchers can supplement the research content and modeling cases.
In the future, we will focus on practical case studies driven by multi-technology approaches, collect and analyze EESP R&D cost data, and explore the optimal R&D cost optimization scheme and specific project implementation plan for target enterprises. In addition, we will use a machine-learning algorithm to iteratively optimize the design of the objective function and use computer simulation technology to evaluate and predict the impact of R&D cost on application performance.
Author Contributions
Conceptualization, S.N. and F.Q.; methodology, F.Q.; formal analysis, S.N.; investigation, F.Q.; writing—original draft preparation, S.N. and F.Q.; writing—review and editing, Y.X.; funding acquisition, S.N. All authors have read and agreed to the published version of the manuscript.
Funding
This research was funded by National Natural Science Foundation of China, grant number 72002114; Fundamental Research Funds of Shandong University, grant number 2020GN044; 2020 Qingdao Social Science Planning Project, grant number QDSKL2001032; Industry-University-Research Cooperation Project of China Tobacco Guangxi Industrial Co., Ltd., grant number GXZYCX2019E003.
Institutional Review Board Statement
Not applicable.
Informed Consent Statement
Not applicable.
Data Availability Statement
Data is not publicly available. However, the data may be provided by the corresponding author upon reasonable request.
Acknowledgments
The authors wish to express their sincerest thanks to the editors and anonymous referees for their constructive comments and suggestions which greatly improved this paper.
Conflicts of Interest
The authors declare no conflict of interest. Fangyuan Qian is an internal employee of China Tobacco Guangxi Industrial Co., LTD., and the director of the funded Industry-University-Research Cooperation Project (grant number GXZYCX2019E003).The author has no conflict of interest with his employer.
References
- Sun, X. A forecast-prediction model for energy consumption for tobacco production. J. Saf. Environ. 2016, 16, 366–370. [Google Scholar]
- Zhao, S. Design and Implementation of Lean Energy Management Scheme for Tobacco Production Enterprises; Zhongyuan University of Technology: Zhengzhou, China, 2020. [Google Scholar]
- Çolak, M.; Kaya, İ. Multi-criteria evaluation of energy storage technologies based on hesitant fuzzy information: A case study for Turkey. J. Energy Storage 2020, 28, 101211. [Google Scholar] [CrossRef]
- Elavarasan, R.M.; Pugazhendhi, R.; Jamal, T.; Dyduch, J.; Arif, M.; Kumar, N.M.; Shafiullah, G.; Chopra, S.S.; Nadarajah, M. Envisioning the UN sustainable development goals (SDGs) through the lens of energy sustainability (SDG 7) in the post-COVID-19 world. Appl. Energy 2021, 292, 116665. [Google Scholar] [CrossRef]
- Elavarasan, R.M.; Pugazhendhi, R.; Irfan, M.; Mihet-Popa, L.; Campana, P.E.; Khan, I.A. A novel sustainable development goal 7 composite index as the paradigm for energy sustainability assessment: A case study from Europe. Appl. Energy 2022, 307, 118173. [Google Scholar] [CrossRef]
- Aktas, A.; Kabak, M. A hybrid hesitant fuzzy decision-making approach for evaluating solar power plant location sites. Arab. J. Sci. Eng. 2019, 44, 7235–7247. [Google Scholar] [CrossRef]
- Bulut, M.; Özcan, E. A novel approach towards evaluation of joint technology performances of battery energy storage system in a fuzzy environment. J. Energy Storage 2021, 36, 102361. [Google Scholar] [CrossRef]
- Mueller, S.C.; Sandner, P.G.; Welpe, I.M. Monitoring innovation in electrochemical energy storage technologies: A patent-based approach. Appl. Energy 2015, 137, 537–544. [Google Scholar] [CrossRef] [Green Version]
- He, G.; Ciez, R.; Moutis, P.; Kar, S.; Whitacre, J.F. The economic end of life of electrochemical energy storage. Appl. Energy 2020, 273, 115151. [Google Scholar] [CrossRef]
- Xu, S.P.; Li, X.J.; Hui, D. A review of development and demonstration application of large-scale electrochemical energy storage. Electr. Power Constr. 2013, 34, 73–80. [Google Scholar]
- Yu, F.; Li, S.; Chen, W.; Wu, T.; Peng, C. Biomass-derived materials for electrochemical energy storage and conversion: Overview and perspectives. Energy Environ. Mater. 2019, 2, 55–67. [Google Scholar] [CrossRef] [Green Version]
- Zhu, Z.; Xu, Z. The rational design of biomass-derived carbon materials towards next-generation energy storage: A review. Renew. Sustain. Energy Rev. 2020, 134, 110308. [Google Scholar] [CrossRef]
- Sasikala, S.P.; Jeong, G.H.; Yun, T.; Kim, S.O. A perspective on R&D status of energy storage systems in South Korea. Energy Storage Mater. 2019, 23, 154–158. [Google Scholar]
- Li, N.; Zhang, H.; Zhang, X.; Ma, X.; Guo, S. How to select the optimal electrochemical energy storage planning program? A hybrid MCDM method. Energies 2020, 13, 931. [Google Scholar] [CrossRef] [Green Version]
- Onori, S.; Lee, S.B. Optimizing Energy and Cost in Renewable Grid Systems: An Electrochemistry and Control-Based Idea. R&D World. 2019. Available online: https://www.rdworldonline.com/optimizing-energy-and-cost-in-renewable-grid-systems-an-electrochemistry-and-control-based-idea/ (accessed on 18 November 2019).
- Liu, J.; Yin, Y.; Yan, S. Research on clean energy power generation-energy storage-energy using virtual enterprise risk assessment based on fuzzy analytic hierarchy process in China. J. Clean. Prod. 2019, 236, 117471. [Google Scholar] [CrossRef]
- Liu, H.; Luo, Y.; Geng, J.; Yao, P. Research hotspots and frontiers of product R&D management under the background of the digital intelligence era—Bibliometrics based on citespace and histcite. Appl. Sci. 2021, 11, 6759. [Google Scholar]
- Leitner, K.H.; Poti, B.M.; Wintjes, R.J.M.; Youtie, J. How companies respond to growing research costs: Cost control or value creation? Int. J. Technol. Manag. 2020, 82, 1–25. [Google Scholar] [CrossRef]
- Huang, J.; Chen, X. Domestic R&D activities, technology absorption ability, and energy intensity in China. Energy Policy 2020, 138, 111184. [Google Scholar]
- Marinaro, M.; Bresser, D.; Beyer, E.; Faguy, P.; Hosoi, K.; Li, H.; Sakovica, J.; Amine, K.; Wohlfahrt-Mehrens, M.; Passerini, S. Bringing forward the development of battery cells for automotive applications: Perspective of R&D activities in China, Japan, the EU and the USA. J. Power Sources 2020, 459, 228073. [Google Scholar]
- Heij, C.V.; Volberda, H.W.; Van den Bosch, F.A.; Hollen, R.M. How to leverage the impact of R&D on product innovation? The moderating effect of management innovation. RD Manag. 2020, 50, 277–294. [Google Scholar]
- Peters, B.; Roberts, M.J.; Vuong, V.A. Dynamic R&D choice and the impact of the firm’s financial strength. Econ. Innov. New Technol. 2017, 26, 134–149. [Google Scholar]
- Akeem, L.B. Effect of cost control and cost reduction techniques in organizational performance. Int. Bus. Manag. 2017, 14, 19–26. [Google Scholar]
- Lucas, C. Integrated cost and schedule control in project management. J. Proj. Manag. 2002, 24, 56–72. [Google Scholar]
- Grossman, S. A study on project cost control with the method of Hamilton Equation. Proj. Manag. J. 1998, 5, 25–36. [Google Scholar]
- Anderson, S.W.; Sedatole, K. Designing quality into products: The use of accounting data in new product development. Account. Horiz. 1998, 12, 213. [Google Scholar]
- Handfield, R.B.; Ragatz, G.L.; Petersen, K.J.; Monczka, R.M. Involving suppliers in new product development. Calif. Manag. Rev. 1999, 42, 59–82. [Google Scholar] [CrossRef]
- Behncke, F.G.H.; Maisenbacher, S.; Maurer, M. Extended model for integrated value engineering. Procedia Comput. Sci. 2014, 28, 781–788. [Google Scholar] [CrossRef] [Green Version]
- Datta, S.; Mukherjee, S.K. Developing a risk management matrix for effective project planning-an empirical study. Proj. Manag. J. 2001, 32, 45–57. [Google Scholar] [CrossRef]
- Cooper, R.; Kaplan, R.S. The design of cost management systems: Text, cases, and readings. Prentice Hall 1991, 132–145. [Google Scholar]
- Merz, C.M.; Hardy, A. ABC puts accountants on design team at HP. Strateg. Financ. 1993, 75, 22. [Google Scholar]
- Hertenstein, J.H.; Platt, M.B. Performance measures and management control in new product development. Account. Horiz. 2000, 14, 303–323. [Google Scholar] [CrossRef]
- Davila, A.; Wouters, M. Designing cost-competitive technology products through cost management. Account. Horiz. 2004, 18, 13–26. [Google Scholar] [CrossRef]
- Torkanfar, N.; Azar, E.R. Quantitative similarity assessment of construction projects using WBS-based metrics. Adv. Eng. Inform. 2020, 46, 101179. [Google Scholar] [CrossRef]
- Zhu, M.; Wang, S.; Zhang, L.; Zhang, Y. Research on mobile cloud service model based on WBS. MATEC Web of Conferences. EDP Sci. 2020, 309, 02013. [Google Scholar]
- Rianty, M.; Latief, Y.; Riantini, L.S. Development of risk-based standardized WBS (Work Breakdown Structure) for quality planning of high rise building architectural works. MATEC Web of Conferences. EDP Sci. 2018, 159, 01019. [Google Scholar]
- Al Farizi, S.; Latief, Y. Development of standardized WBS (Work Breakdown Structure) for planning the schedule based on risk in Steel Bridge construction projects. In Proceedings of the International Conference on Industrial Engineering and Operations Management, Bandung, Indonesia, 6–8 March 2018; pp. 757–762. [Google Scholar]
- Su, J.; Zheng, X. Application of WBS in pricing management of prefabricated concrete construction project. In IOP Conference Series: Earth and Environmental Science; IOP Publishing: Bristol, UK, 2021; Volume 719, p. 032014. [Google Scholar]
- Wang, J. Construction of risk evaluation index system for power grid engineering cost by applying WBS-RBS and membership degree methods. Math. Probl. Eng. 2020, 2020, 6217872. [Google Scholar] [CrossRef]
- Park, J.; Cai, H. WBS-based dynamic multi-dimensional BIM database for total construction as-built documentation. Autom. Constr. 2017, 77, 15–23. [Google Scholar] [CrossRef]
- Hasan, R.; Chowdhury, S.A.; Akter, J. Construction project monitoring: The cost and schedule control by Earned Value Method (EVM). J. Technol. Manag. Bus. 2021, 8, 1–9. [Google Scholar]
- Przywara, D.; Rak, A. Monitoring of time and cost variances of schedule using simple earned value method indicators. Appl. Sci. 2021, 11, 1357. [Google Scholar] [CrossRef]
- Stasinos, C.; Panas, A.; Pantouvakis, J.P.; Ralli, P.; Karagiannakidis, D. Investigation of the Earned Value Method (EVM) applicability for construction operations affected. In The 10th International Conference on Engineering, Project, and Production Management; Springer: Singapore, 2020; pp. 241–252. [Google Scholar]
- Damara, B. Cost performance analysis and time development construction project Bridge Chain Karanggeneng Nawacita Cs using the Earned Value Method. UKaRsT 2020, 4, 177–191. [Google Scholar] [CrossRef]
- Gao, S. Cost control method for goods transportation of coastal enterprises based on Earned Value Method. J. Coast. Res. 2020, 103, 674–677. [Google Scholar] [CrossRef]
- Tyagi, M.K.; Sikandar, A.; Tyagi, D.K.; Kumar, D.; Singh, P.; Munisamy, S.; Reddy, L.S.S. State space modeling of Earned Value Method for iterative enhancement based traditional software projects tracking. In International Advanced Computing Conference; Springer: Singapore, 2020; pp. 336–354. [Google Scholar]
- McAfee, A.; Brynjolfsson, E.; Davenport, T.H. Big data: The management revolution. Harv. Bus. Rev. 2012, 90, 60–68. [Google Scholar] [PubMed]
- Storey, V.C.; Song, I.Y. Big data technologies and management: What conceptual modeling can do. Data Knowl. Eng. 2017, 108, 50–67. [Google Scholar] [CrossRef]
- Noh, K.S.; Park, S. An exploratory study on application plan of big data to manufacturing execution system. J. Digit. Converg. 2014, 12, 305–311. [Google Scholar] [CrossRef] [Green Version]
- Cho, D.; Lee, M.; Shin, J. Development of cost and schedule data integration algorithm based on big data technology. Appl. Sci. 2020, 10, 8917. [Google Scholar] [CrossRef]
- Long, H.; Ma, Y.; Mao, X. Research on the development of project cost informatization in the era of big data. J. Big Data 2020, 2, 63. [Google Scholar] [CrossRef]
- Chen, L.; Dai, H. Application of big data technology in cost management and control in construction project. J. Phys. Conf. Ser. 2021, 1881, 022036. [Google Scholar] [CrossRef]
- Blackburn, M.; Alexander, J.; Legan, J.D.; Klabjan, D. Big data and the future of R&D management: The rise of big data and big data analytics will have significant implications for R&D and innovation management in the next decade. Res. Technol. Manag. 2017, 60, 43–51. [Google Scholar]
- Ruchi, S.; Srinath, P. Big data platform for enterprise project management digitization using machine learning. In Proceedings of the 2018 Second International Conference on Electronics, Communication and Aerospace Technology (ICECA), Coimbatore, India, 29–31 March 2018; pp. 1479–1484. [Google Scholar]
- Li, Y.; Yang, L.; Yang, B.; Wang, N.; Wu, T. Application of interpretable machine learning models for the intelligent decision. Neurocomputing 2019, 333, 273–283. [Google Scholar] [CrossRef]
- Jun, S.P.; Yoo, H.S.; Hwang, J. A hybrid recommendation model for successful R&D collaboration: Mixing machine learning and discriminant analysis. Technol. Forecast. Soc. Chang. 2021, 170, 120871. [Google Scholar]
- Jang, H. A decision support framework for robust R&D budget allocation using machine learning and optimization. Decis. Support Syst. 2019, 121, 1–12. [Google Scholar]
- Laković, M.; Pavlović, I.; Banjac, M.; Jović, M.; Mančić, M. Numerical computation and prediction of electricity consumption in tobacco industry. Facta Univ. Ser. Mech. Eng. 2017, 15, 457–465. [Google Scholar] [CrossRef] [Green Version]
- Liu, K.; Wang, Q.; Luo, Z.; Zhao, X.; Su, S.; Zhang, X. Planning mechanism design and benefit analysis of electric energy substitution: A case study of tobacco industry in Yunnan province, China. IEEE Access 2020, 8, 12867–12883. [Google Scholar] [CrossRef]
- Wang, Q.; Han, R.; Huang, Q.; Hao, J.; Lv, N.; Li, T.; Tang, B. Research on energy conservation and emissions reduction based on AHP-fuzzy synthetic evaluation model: A case study of tobacco enterprises. J. Clean. Prod. 2018, 201, 88–97. [Google Scholar] [CrossRef]
- Wang, Q.; Hu, Y.J.; Hao, J.; Lv, N.; Li, T.; Tang, B. Exploring the influences of green industrial building on the energy consumption of industrial enterprises: A case study of Chinese cigarette manufactures. J. Clean. Prod. 2019, 231, 370–385. [Google Scholar] [CrossRef]
- Thollander, P.; Karlsson, M.; Rohdin, P.; Johan, W.; Rosenqvist, J. Introduction to Industrial Energy Efficiency: Energy Auditing, Energy Management, and Policy Issues; Academic Press: Cambridge, MA, USA, 2020. [Google Scholar]
- Cheng, P.; Peng, L.; Gu, R. Research on intelligent cost management of projects based on machine learning under big data: A case study of planning and design projects of a landscape architecture planning research institute. J. Financ. Account. Newsl. 2021, 10, 112–115. [Google Scholar]
- Zhuo, H. Research on R&D Cost Control of New Energy Electrochemical Energy Storage Project of H Company; Beijing University of Chemical Technology: Beijing, China, 2020. [Google Scholar]
Figure 1.
Composition of the electrochemical energy storage system.

Figure 2.
The R&D cost structure of EESP energy storage system equipment.

Figure 3.
Processing process and energy consumption type of tobacco leaves.

Figure 4.
Processing process and energy consumption type of cut tobacco.

Figure 5.
Processing process and energy consumption type of tobacco peduncle.

Figure 6.
Packaging process and energy consumption type.

Figure 7.
Multi-technology driven EESP R&D cost improvement model.

Figure 8.
The structure tree model of EESP R&D work.


Table 1.
Work package detailed breakdown form.
| Work Number | Work Stage | WBS Code | Work Package | Data Footprint | |
|---|---|---|---|---|---|
| Data Sources | Data Records | ||||
| 1 | Project Approval | 1.1 | Demand Analysis | ◎ | ◆ |
| 1.2 | Product Research | ●◎ | ★◆ | ||
| 2 | Concept Planning | 2.1 | Product Development Plan | ● | ★◆ |
| 2.2 | Overall Scheme Design | ● | ◆ | ||
| 3 | Detailed Product Design | 3.1 | Electrical Design | ● | ◆ |
| 3.2 | Structure Design | ● | ◆ | ||
| 3.3 | Software Design | ● | ◆ | ||
| 3.4 | Design Review | ●◎ | ◆ | ||
| 4 | Trial-produce Experiment | 4.1 | Material Purchasing | ●◎ | ★◆ |
| 4.2 | Prototype Test Assembly | ●◎ | ◆ | ||
| 4.3 | Prototype Debugging | ●◎ | ◆ | ||
| 4.4 | Prototype Production | ● | ★◆ | ||
| 5 | Product Improvement | 5.1 | Electrical Assembly Improvement | ● | ◆ |
| 5.2 | Structural Component Improvement | ● | ◆ | ||
Note: ●—Internal data, ◎—External data, ★—Financial management system, ◆—Project management system.
Table 2.
A research case of EESP R&D cost data [64].
Table 2.
A research case of EESP R&D cost data [64].
| Work Stage | Work Package | Budgeted Cost (CNY) | Completion Ratio (%) | Budgeted Cost to Complete the Work | Actual Cost (CNY) |
|---|---|---|---|---|---|
| Project Approval | Demand Analysis | 36,000 | 100 | 36,000 | 36,825 |
| Product Research | 48,000 | 100 | 48,000 | 47,615 | |
| Concept Planning | Product Development Plan | 72,000 | 100 | 72,000 | 72,350 |
| Overall Scheme Design | 90,000 | 100 | 90,000 | 91,158 | |
| Detailed Product Design | Electrical Design | 90,000 | 100 | 90,000 | 89,056 |
| Structure Design | 60,000 | 100 | 60,000 | 62,197 | |
| Software Design | 75,000 | 90 | 67,500 | 65,050 | |
| Design Review | 45,000 | 90 | 40,500 | 45,480 | |
| Trial-produce Experiment | Material Purchasing | 30,000 | 80 | 24,000 | 22,000 |
| Prototype Test Assembly | 50,000 | 0 | 0 | 0 | |
| Prototype Debugging | 40,000 | 0 | 0 | 0 | |
| Prototype Production | 40,000 | 0 | 0 | 0 | |
| Product Improvement | Electrical Assembly Improvement | 48,000 | 0 | 0 | 0 |
| Structural Component Improvement | 96,000 | 0 | 0 | 0 | |
| Budgeted Cost for Work Scheduled (BCWS) | 820,000 | ||||
| Budgeted Cost for Work Performed (BCWP) | 528,000 | ||||
| Actual Cost for Work Performed (ACWP) | 531,731 | ||||
Table 3.
Decision variables and related parameters.
| Attribute | Symbol | Description |
|---|---|---|
| Decision variables | The capacity of EESP power supplies. | |
| The marginal R&D cost of EESP for designing different power supplies . | ||
| Related parameters | The expected utility of running EESP. | |
| The benefit of each unit of EESP power supply in production activity. | ||
| The marginal benefit brought by energy storage for backup production when electricity supply is sufficient. | ||
| The marginal benefit loss caused by the energy released when the electricity supply is insufficient. | ||
| The marginal value-added benefit from the diversified use of EESP electricity |
Table 4.
Mathematical model analysis of application value of EESP.
| EESP Performance Indicators | Direct Variable | Indirect Variable | Change in Demand | Application Value of EESP |
|---|---|---|---|---|
| Total R&D Cost | ||||
| Marginal Energy Storage Utility | ||||
| Marginal Energy Release Utility | ||||
| Marginal Value-added Utility of Electricity Diversification |
Although and have a certain offset effect on the application performance of EESP, the overall effect is still positive. We show this result in Table 4 with a colored background section.
Publisher’s Note: MDPI stays neutral with regard to jurisdictional claims in published maps and institutional affiliations. |
© 2022 by the authors. Licensee MDPI, Basel, Switzerland. This article is an open access article distributed under the terms and conditions of the Creative Commons Attribution (CC BY) license (https://creativecommons.org/licenses/by/4.0/).
Share and Cite
MDPI and ACS Style
Qian, F.; Niu, S.; Xi, Y. Multi-Technology Driven R&D Cost Improvement Scheme and Application Utility of EESP in Energy-Intensive Manufacturing Industry. Sustainability 2022, 14, 6282. https://0-doi-org.brum.beds.ac.uk/10.3390/su14106282
AMA Style
Qian F, Niu S, Xi Y. Multi-Technology Driven R&D Cost Improvement Scheme and Application Utility of EESP in Energy-Intensive Manufacturing Industry. Sustainability. 2022; 14(10):6282. https://0-doi-org.brum.beds.ac.uk/10.3390/su14106282
Chicago/Turabian StyleQian, Fangyuan, Shuiye Niu, and Yujuan Xi. 2022. "Multi-Technology Driven R&D Cost Improvement Scheme and Application Utility of EESP in Energy-Intensive Manufacturing Industry" Sustainability 14, no. 10: 6282. https://0-doi-org.brum.beds.ac.uk/10.3390/su14106282
Note that from the first issue of 2016, this journal uses article numbers instead of page numbers. See further details here.