
Impact of Policy Instruments in the Implementation of Renewable Sources of Energy in Selected European Countries


Abstract
:1. Introduction
2. Legal Framework
2.1. Electricity
2.1.1. Premium Tariff
2.1.2. Feed-In Tariff
2.1.3. Net-Metering
2.1.4. Loan (Climate Change Special Programme)
2.1.5. Sliding Feed-In Premium
2.1.6. Subsidies
2.1.7. Tax Regulation Mechanisms
2.1.8. Tenders
2.2. Heating and Cooling System
2.2.1. Premium Tariff
2.2.2. Feed-In Tariff
2.2.3. Subsidies
2.2.4. Tax Regulation Mechanisms
2.2.5. Loan
2.3. Transport
2.3.1. Biofuel Quotas
2.3.2. Premium Tariff
2.3.3. Tax Regulation Mechanisms
2.3.4. Subsidies
3. Materials and Methods
3.1. Data Collection
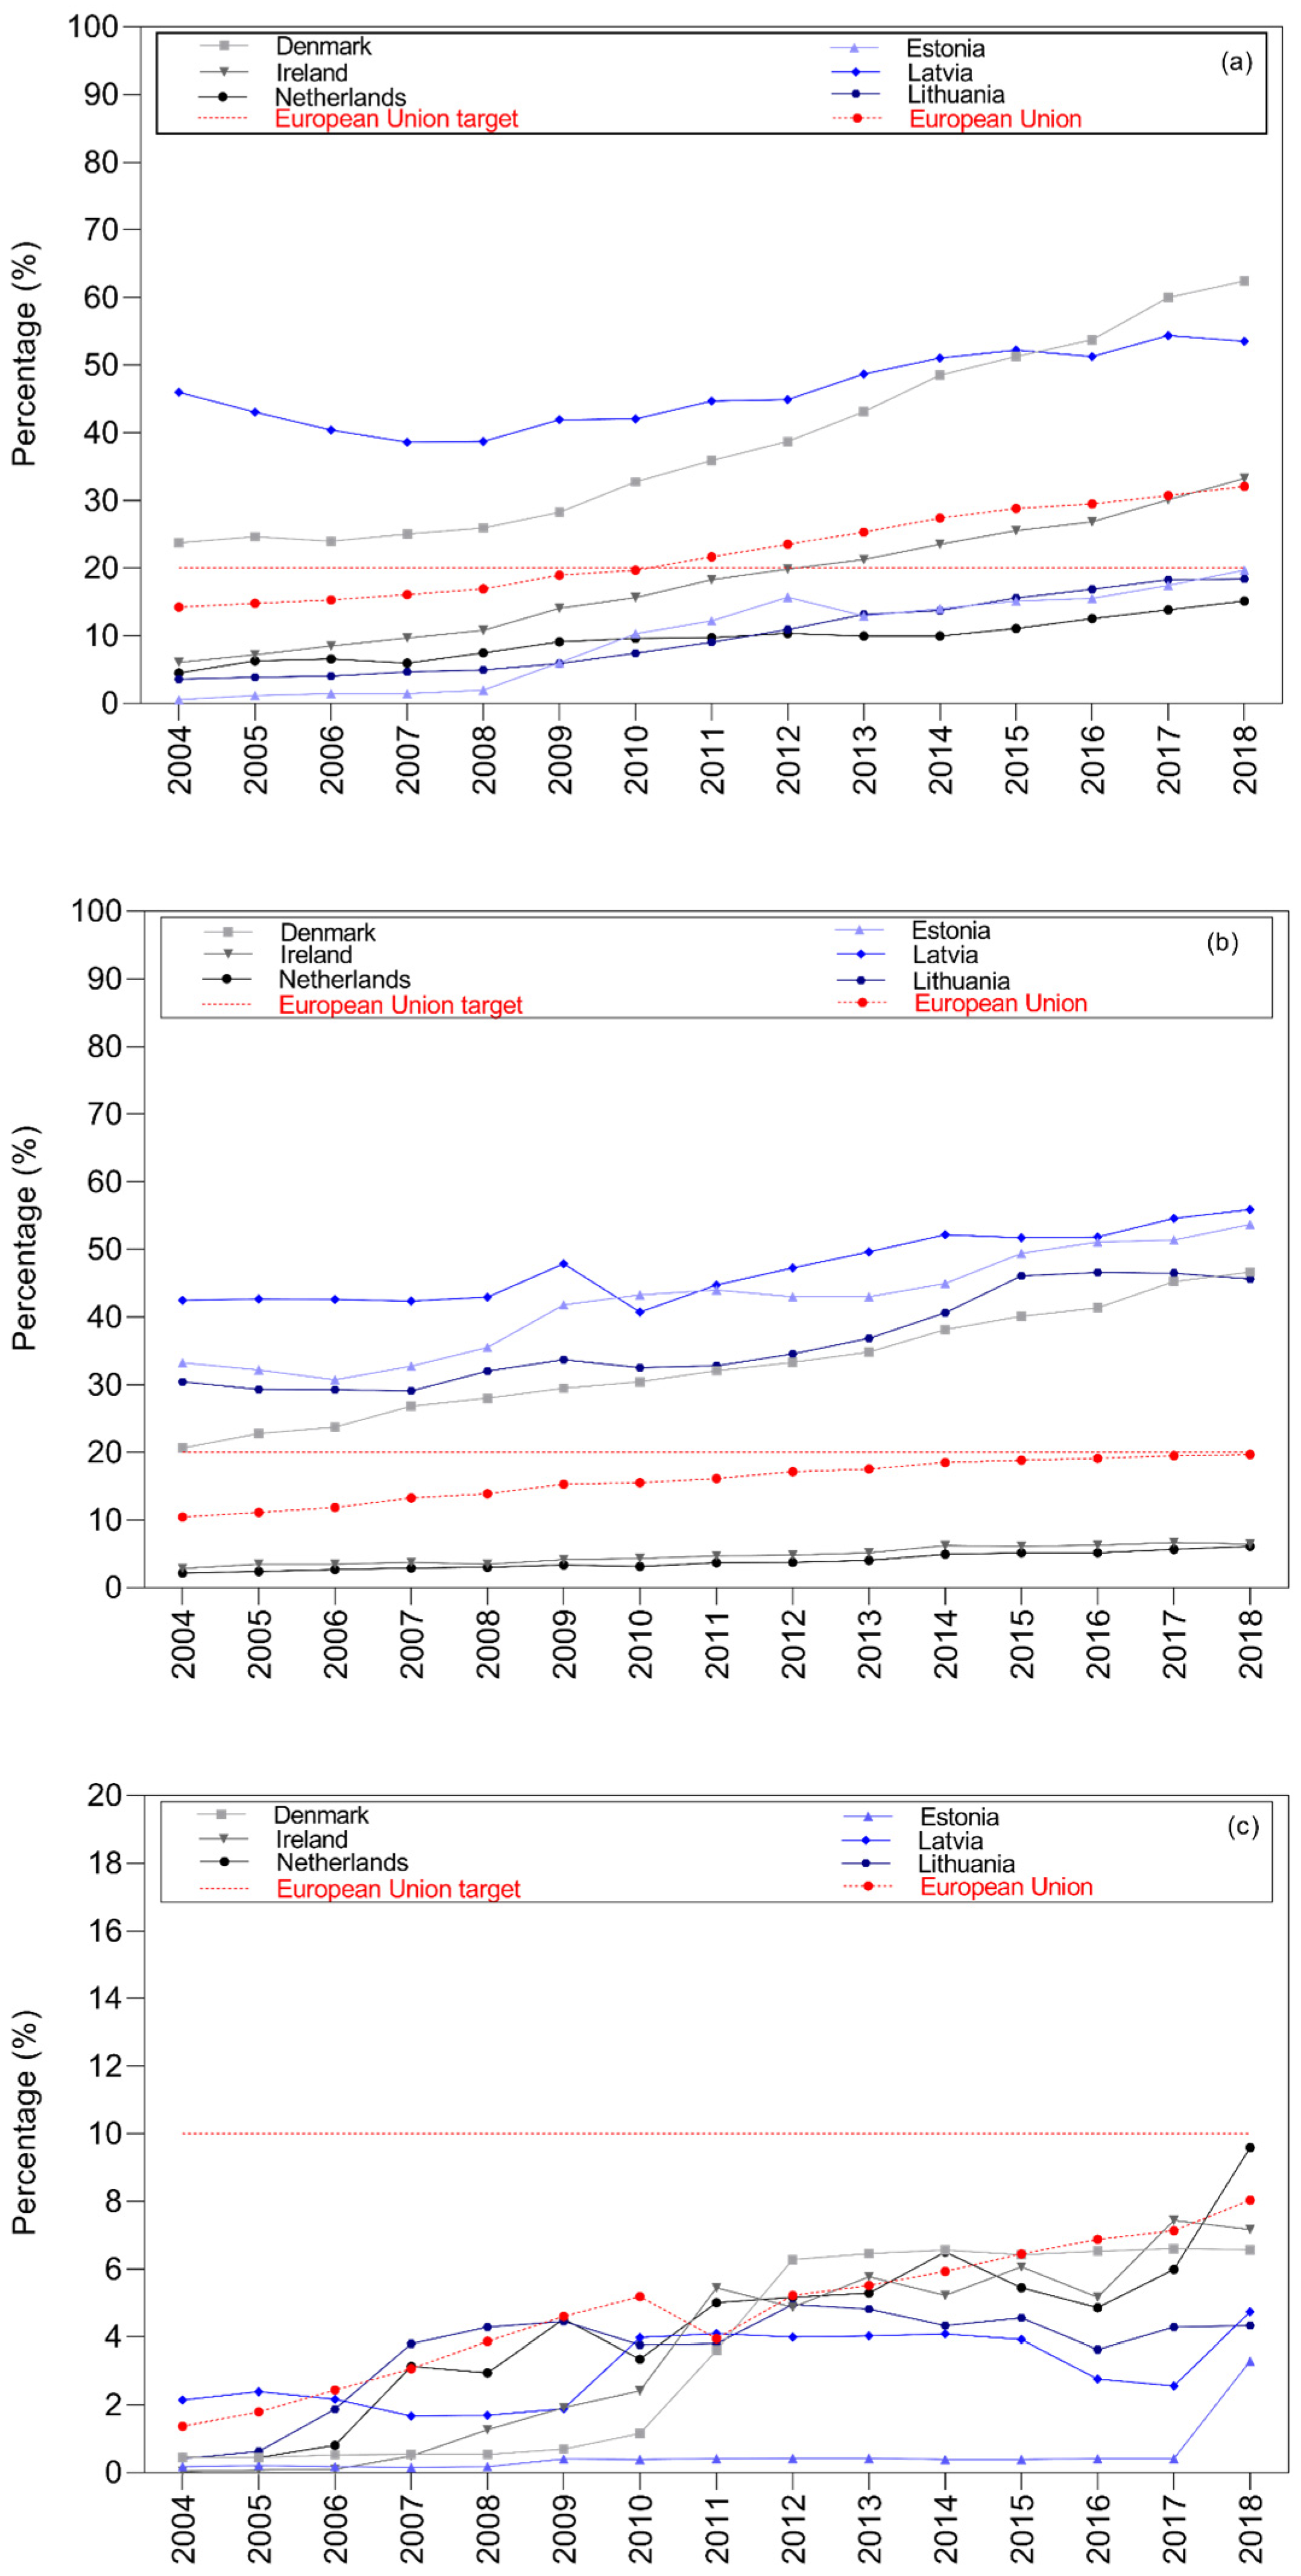
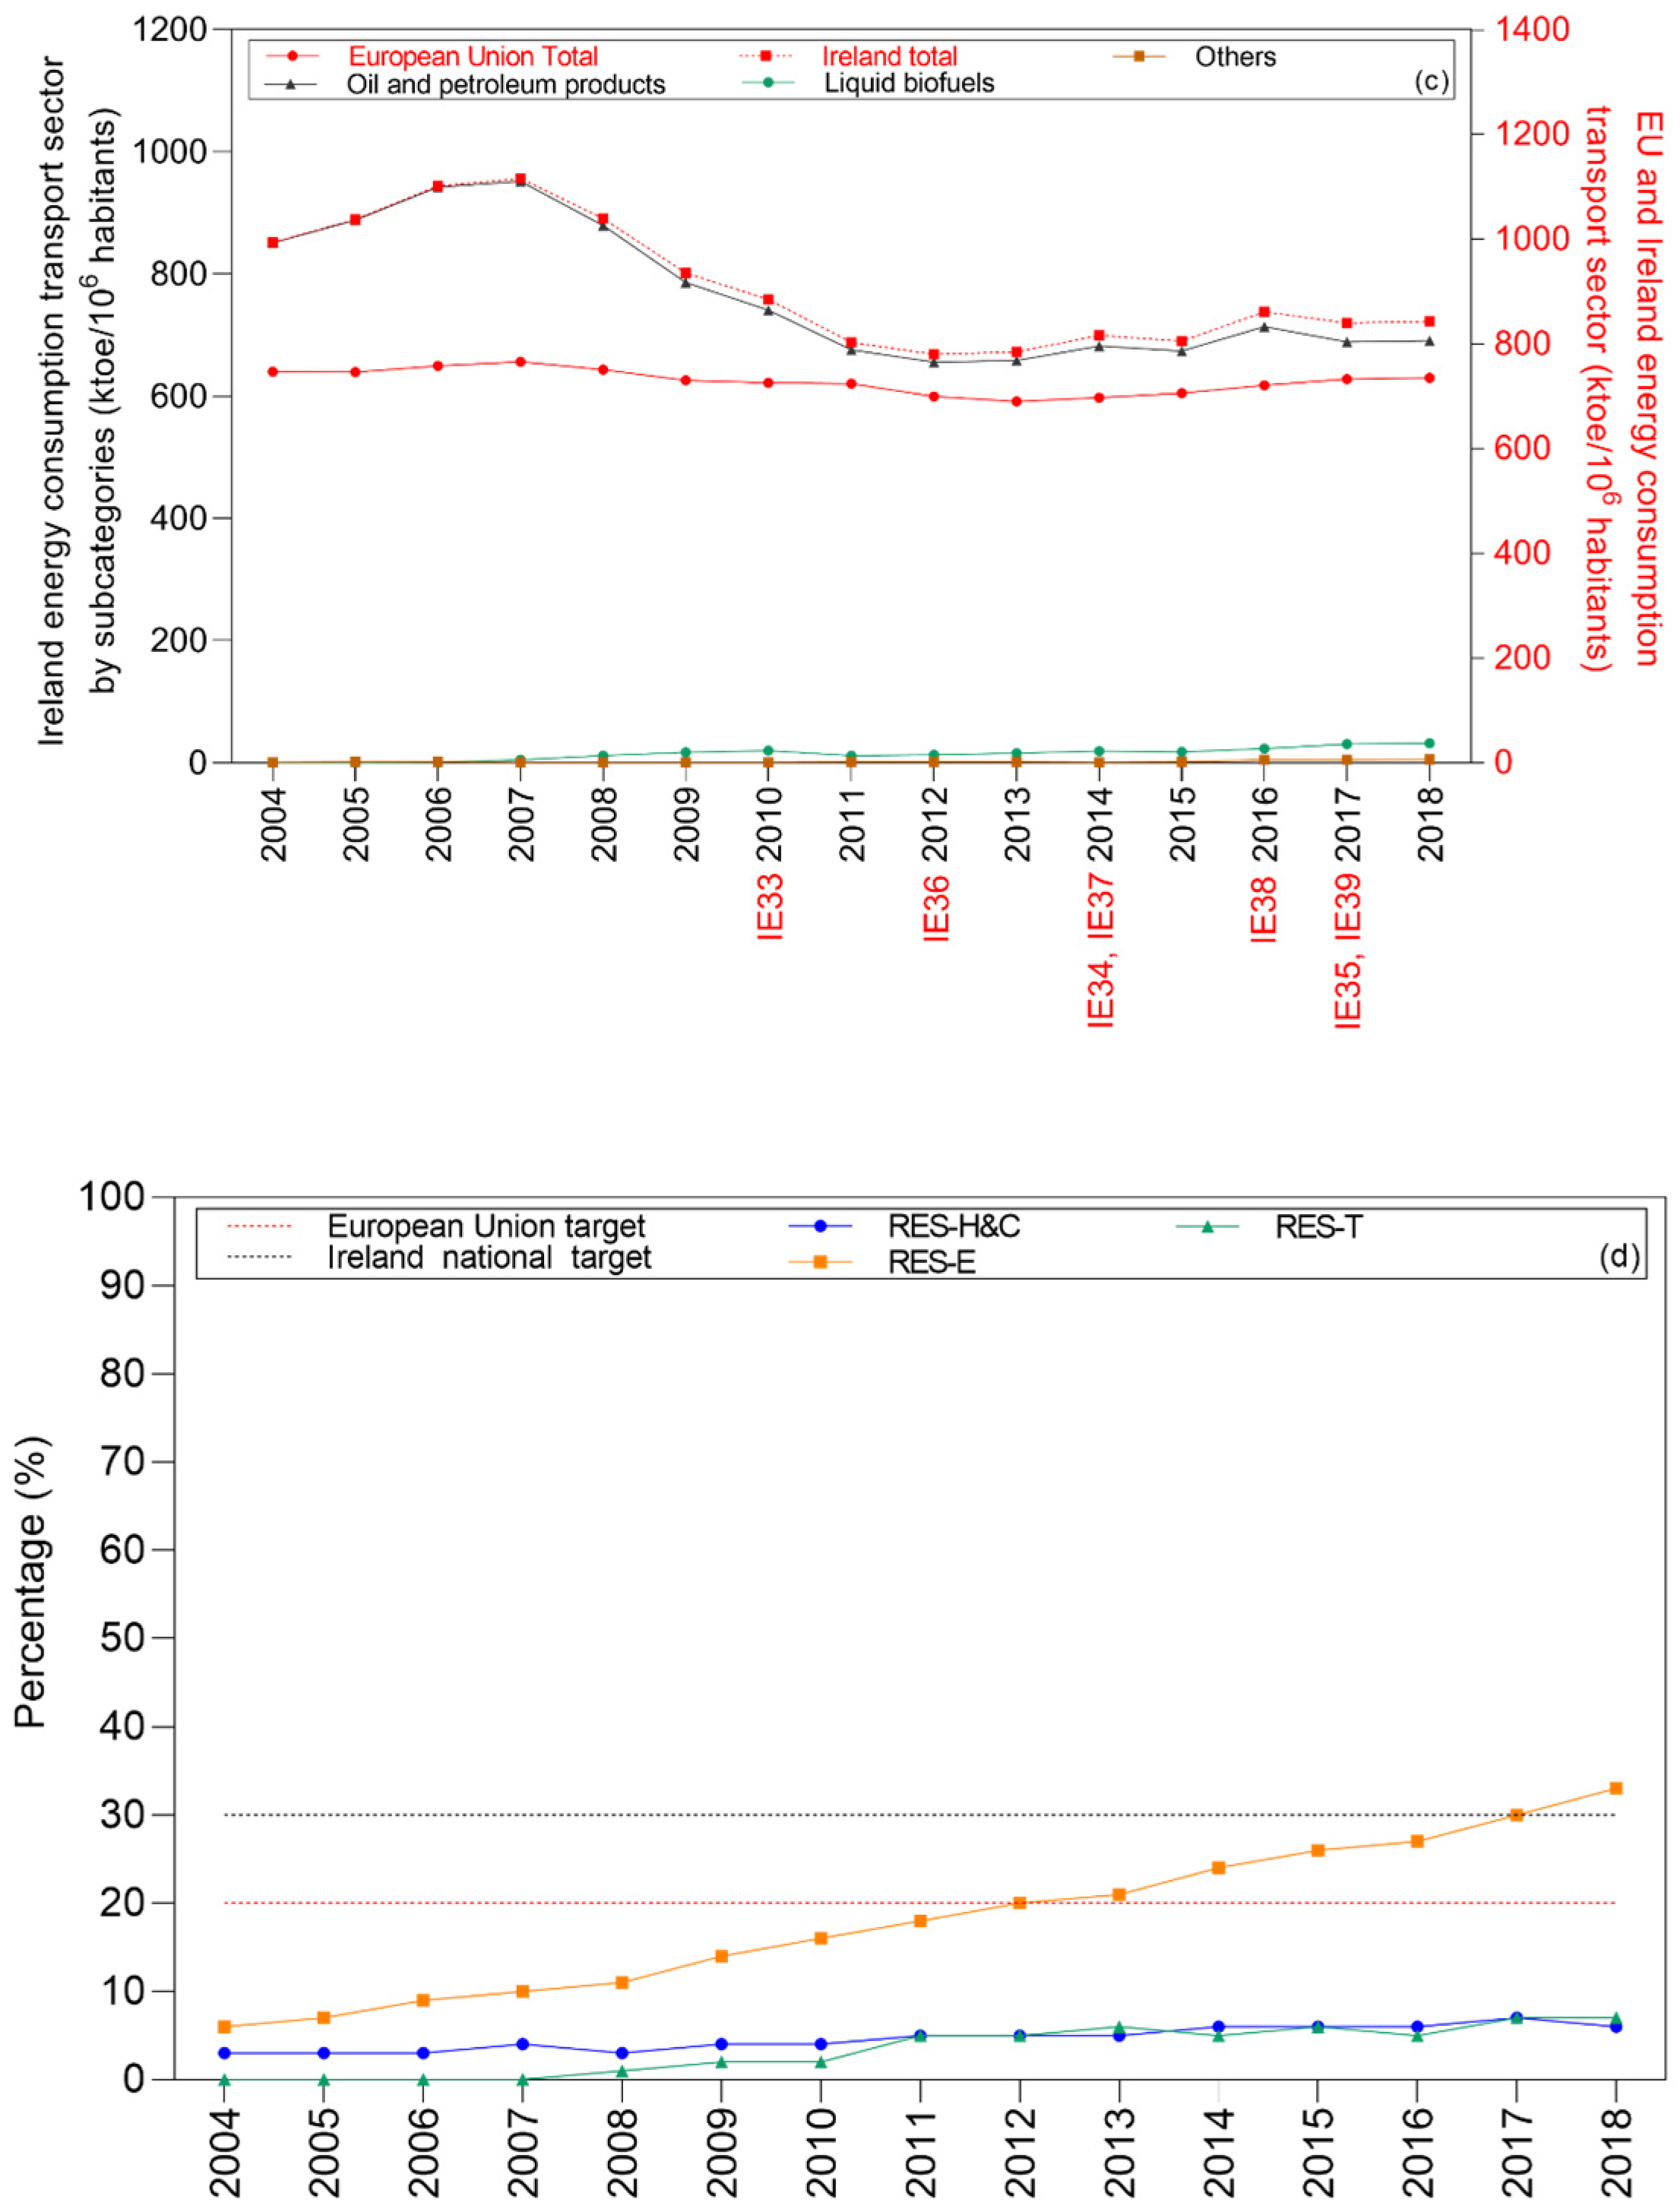
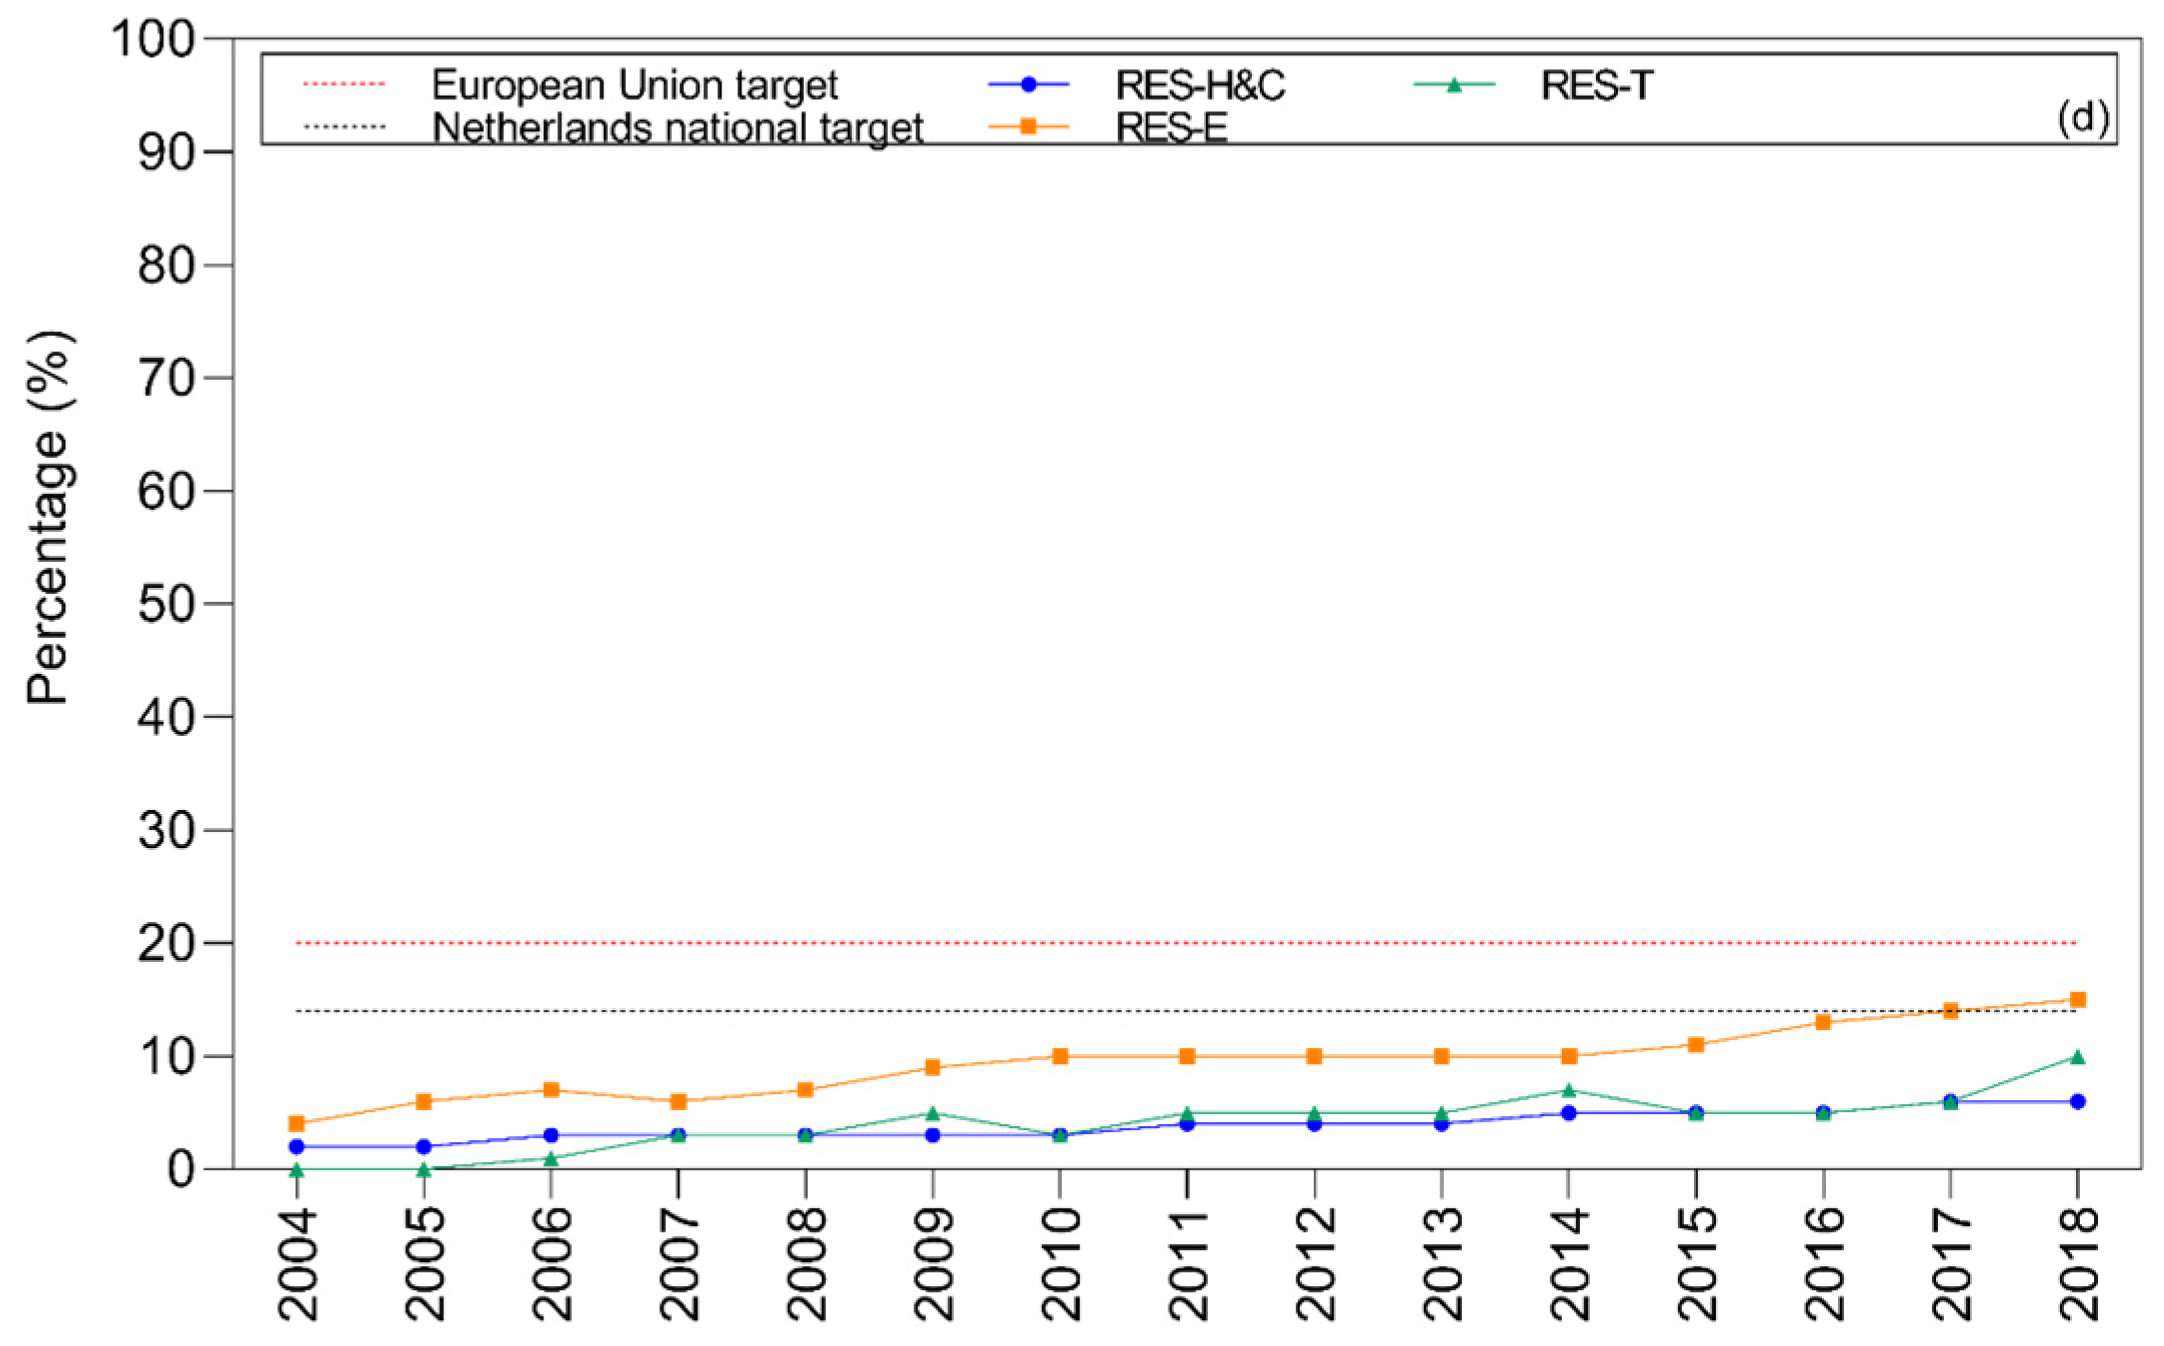
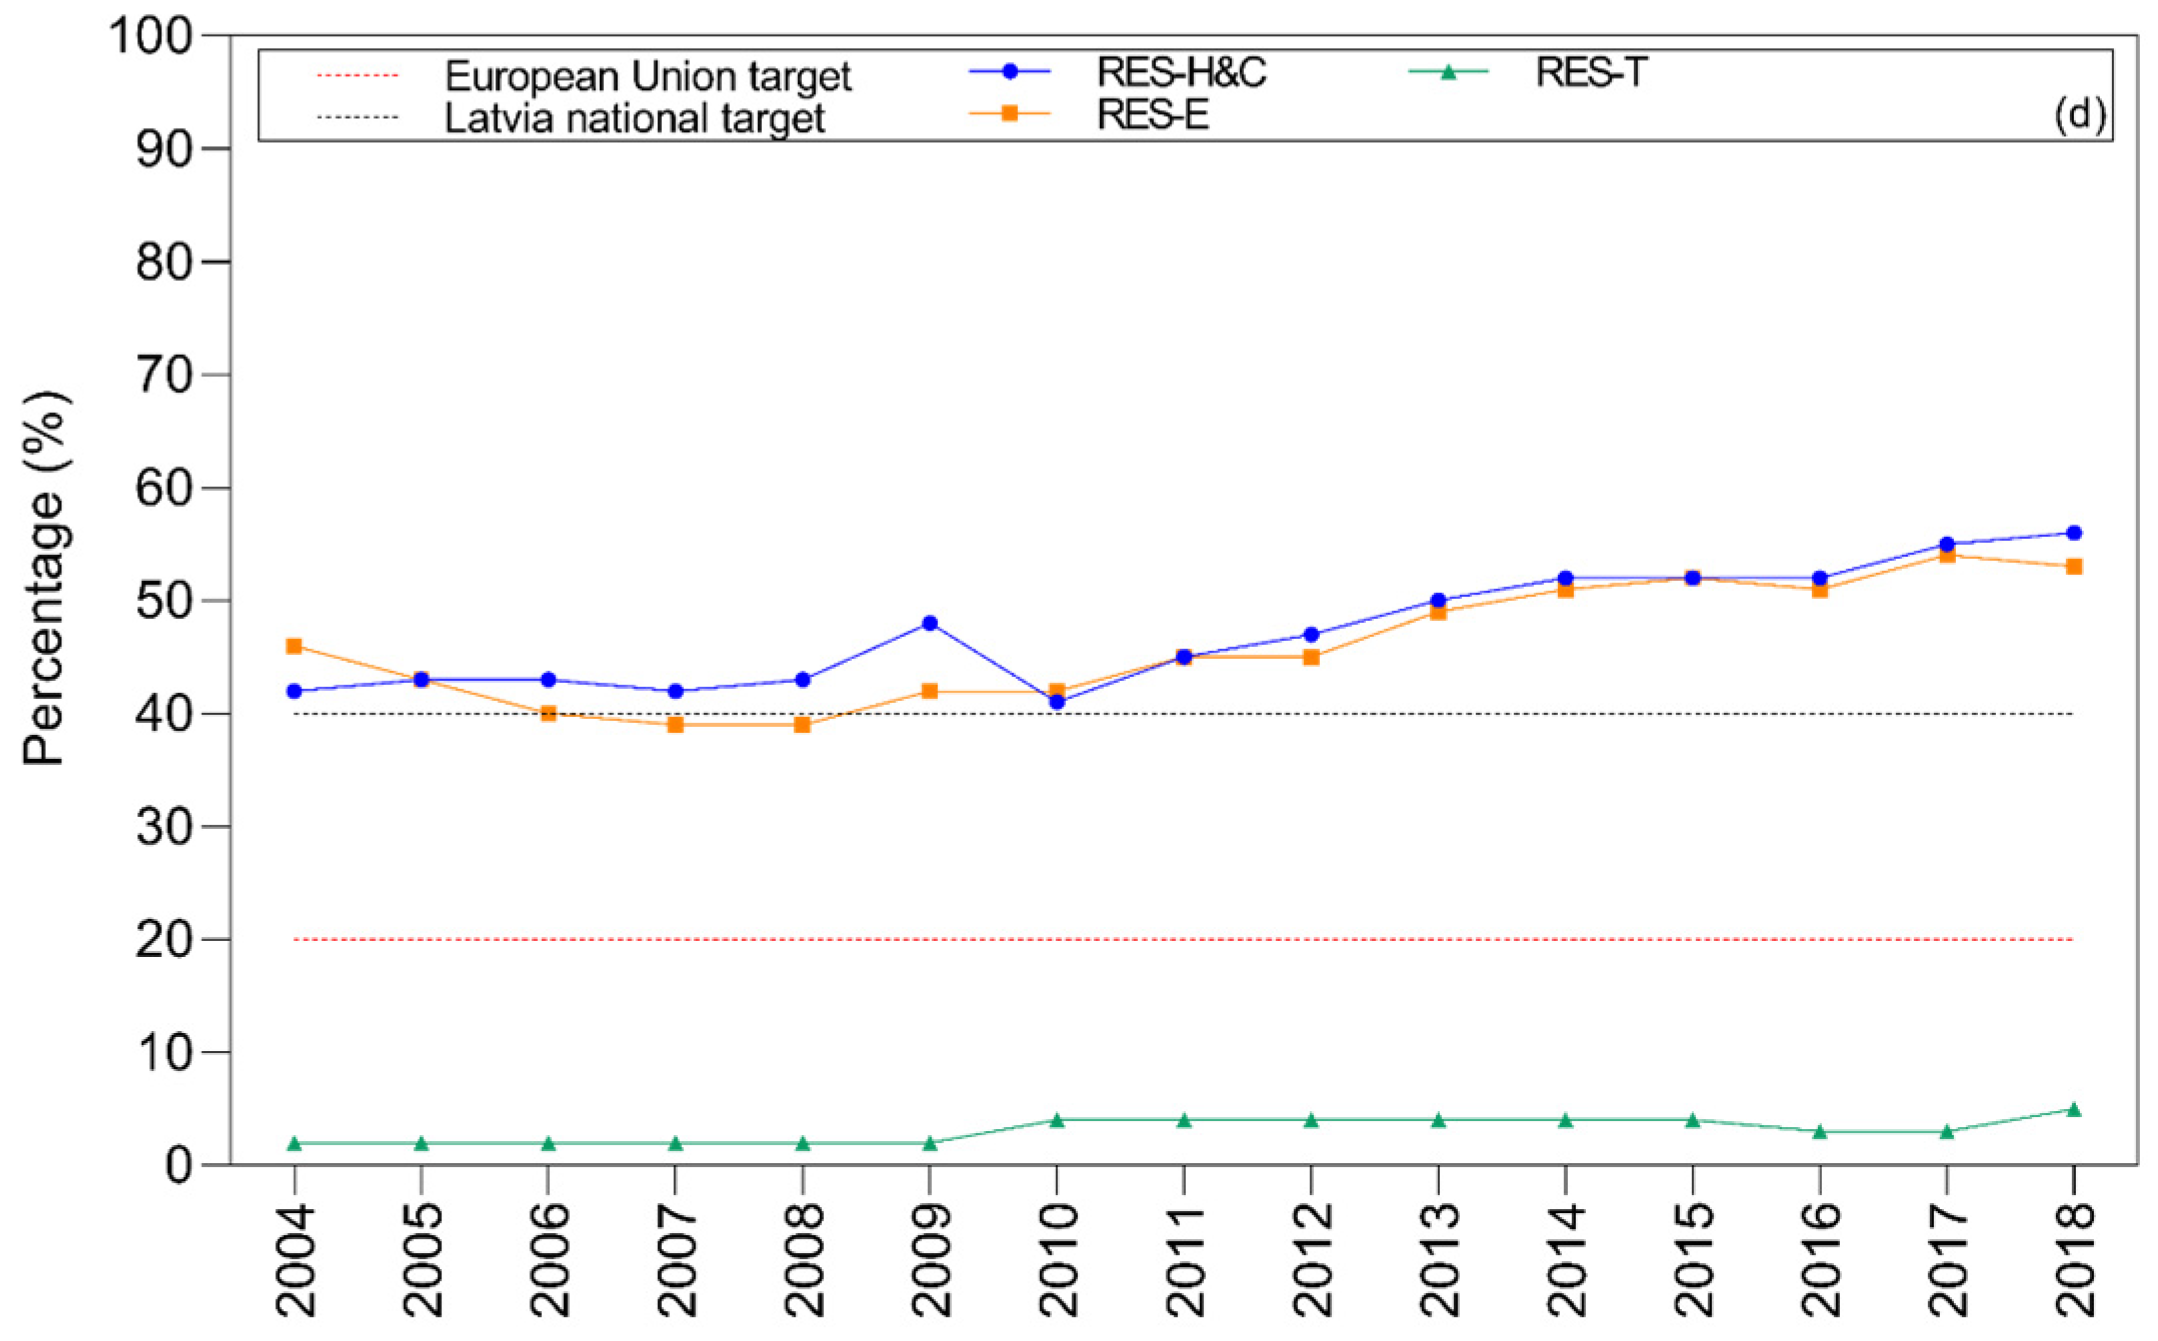
- Share of energy from renewable sources in transport, in the European Union, Estonia, Latvia, and Lithuania, Denmark, Ireland, and Netherlands, between 2004–2018 (%)
- Share of energy from renewable sources in gross electricity consumption, in the European Union, Estonia, Latvia, and Lithuania, Denmark, Ireland, and Netherlands, between 2004–2018 (%)
- Share of energy from renewable sources for heating and cooling, in the European Union, Estonia, Latvia, and Lithuania, Denmark, Ireland, and Netherlands, between 2004–2018 (%)
- Total RES, in the European Union, Estonia, Latvia, and Lithuania, Denmark, Ireland, and Netherlands, between 2004–2018 (%)
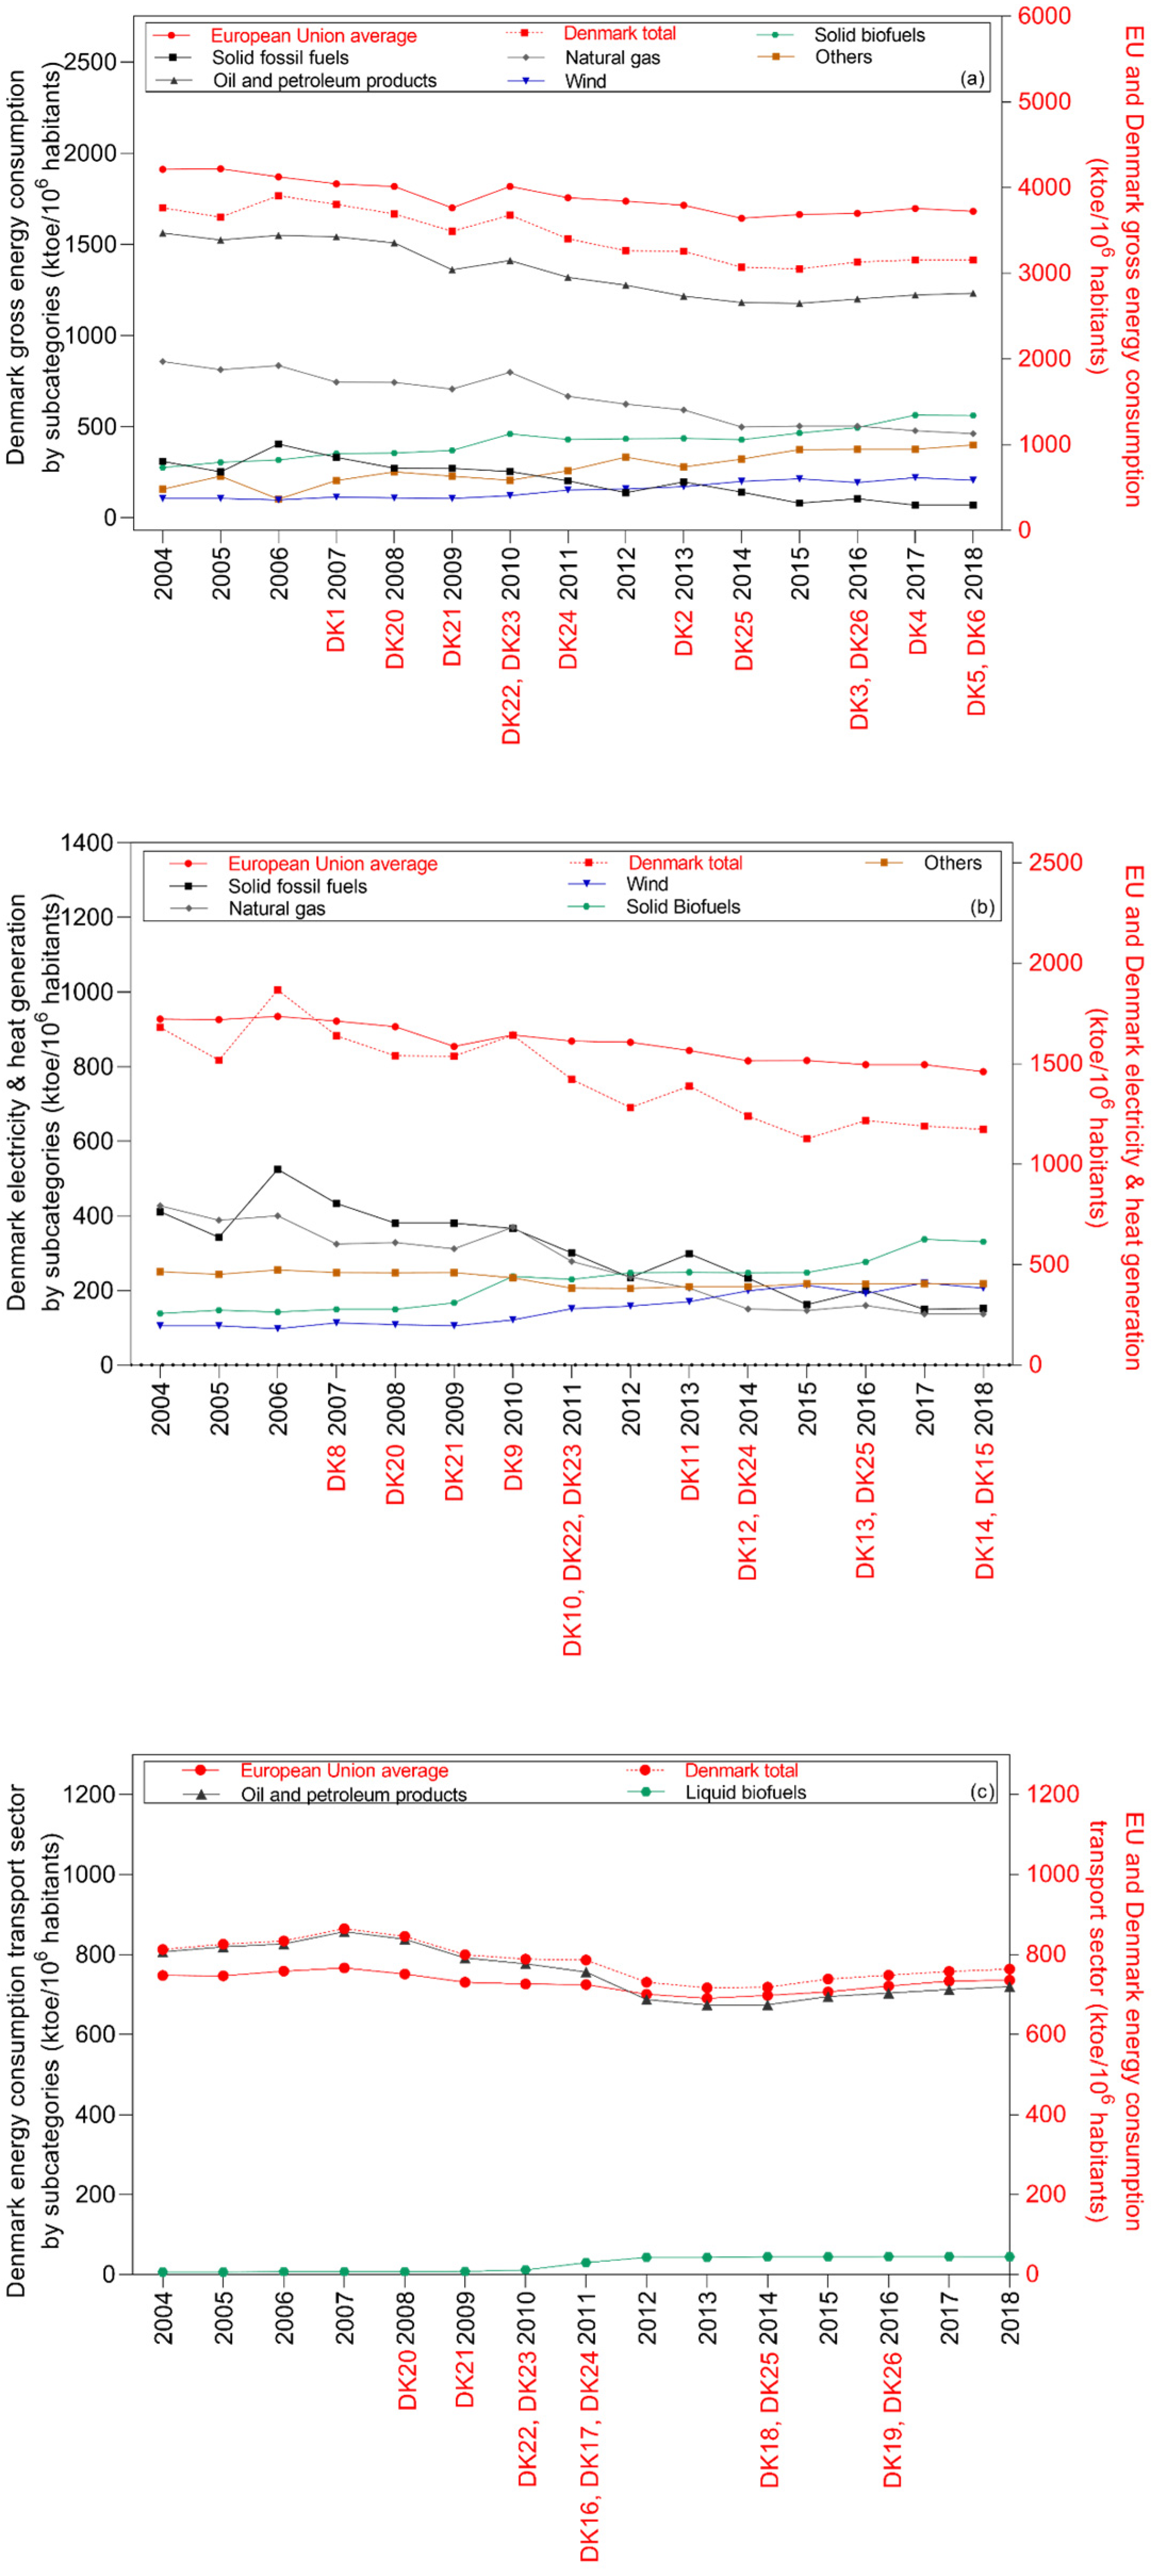
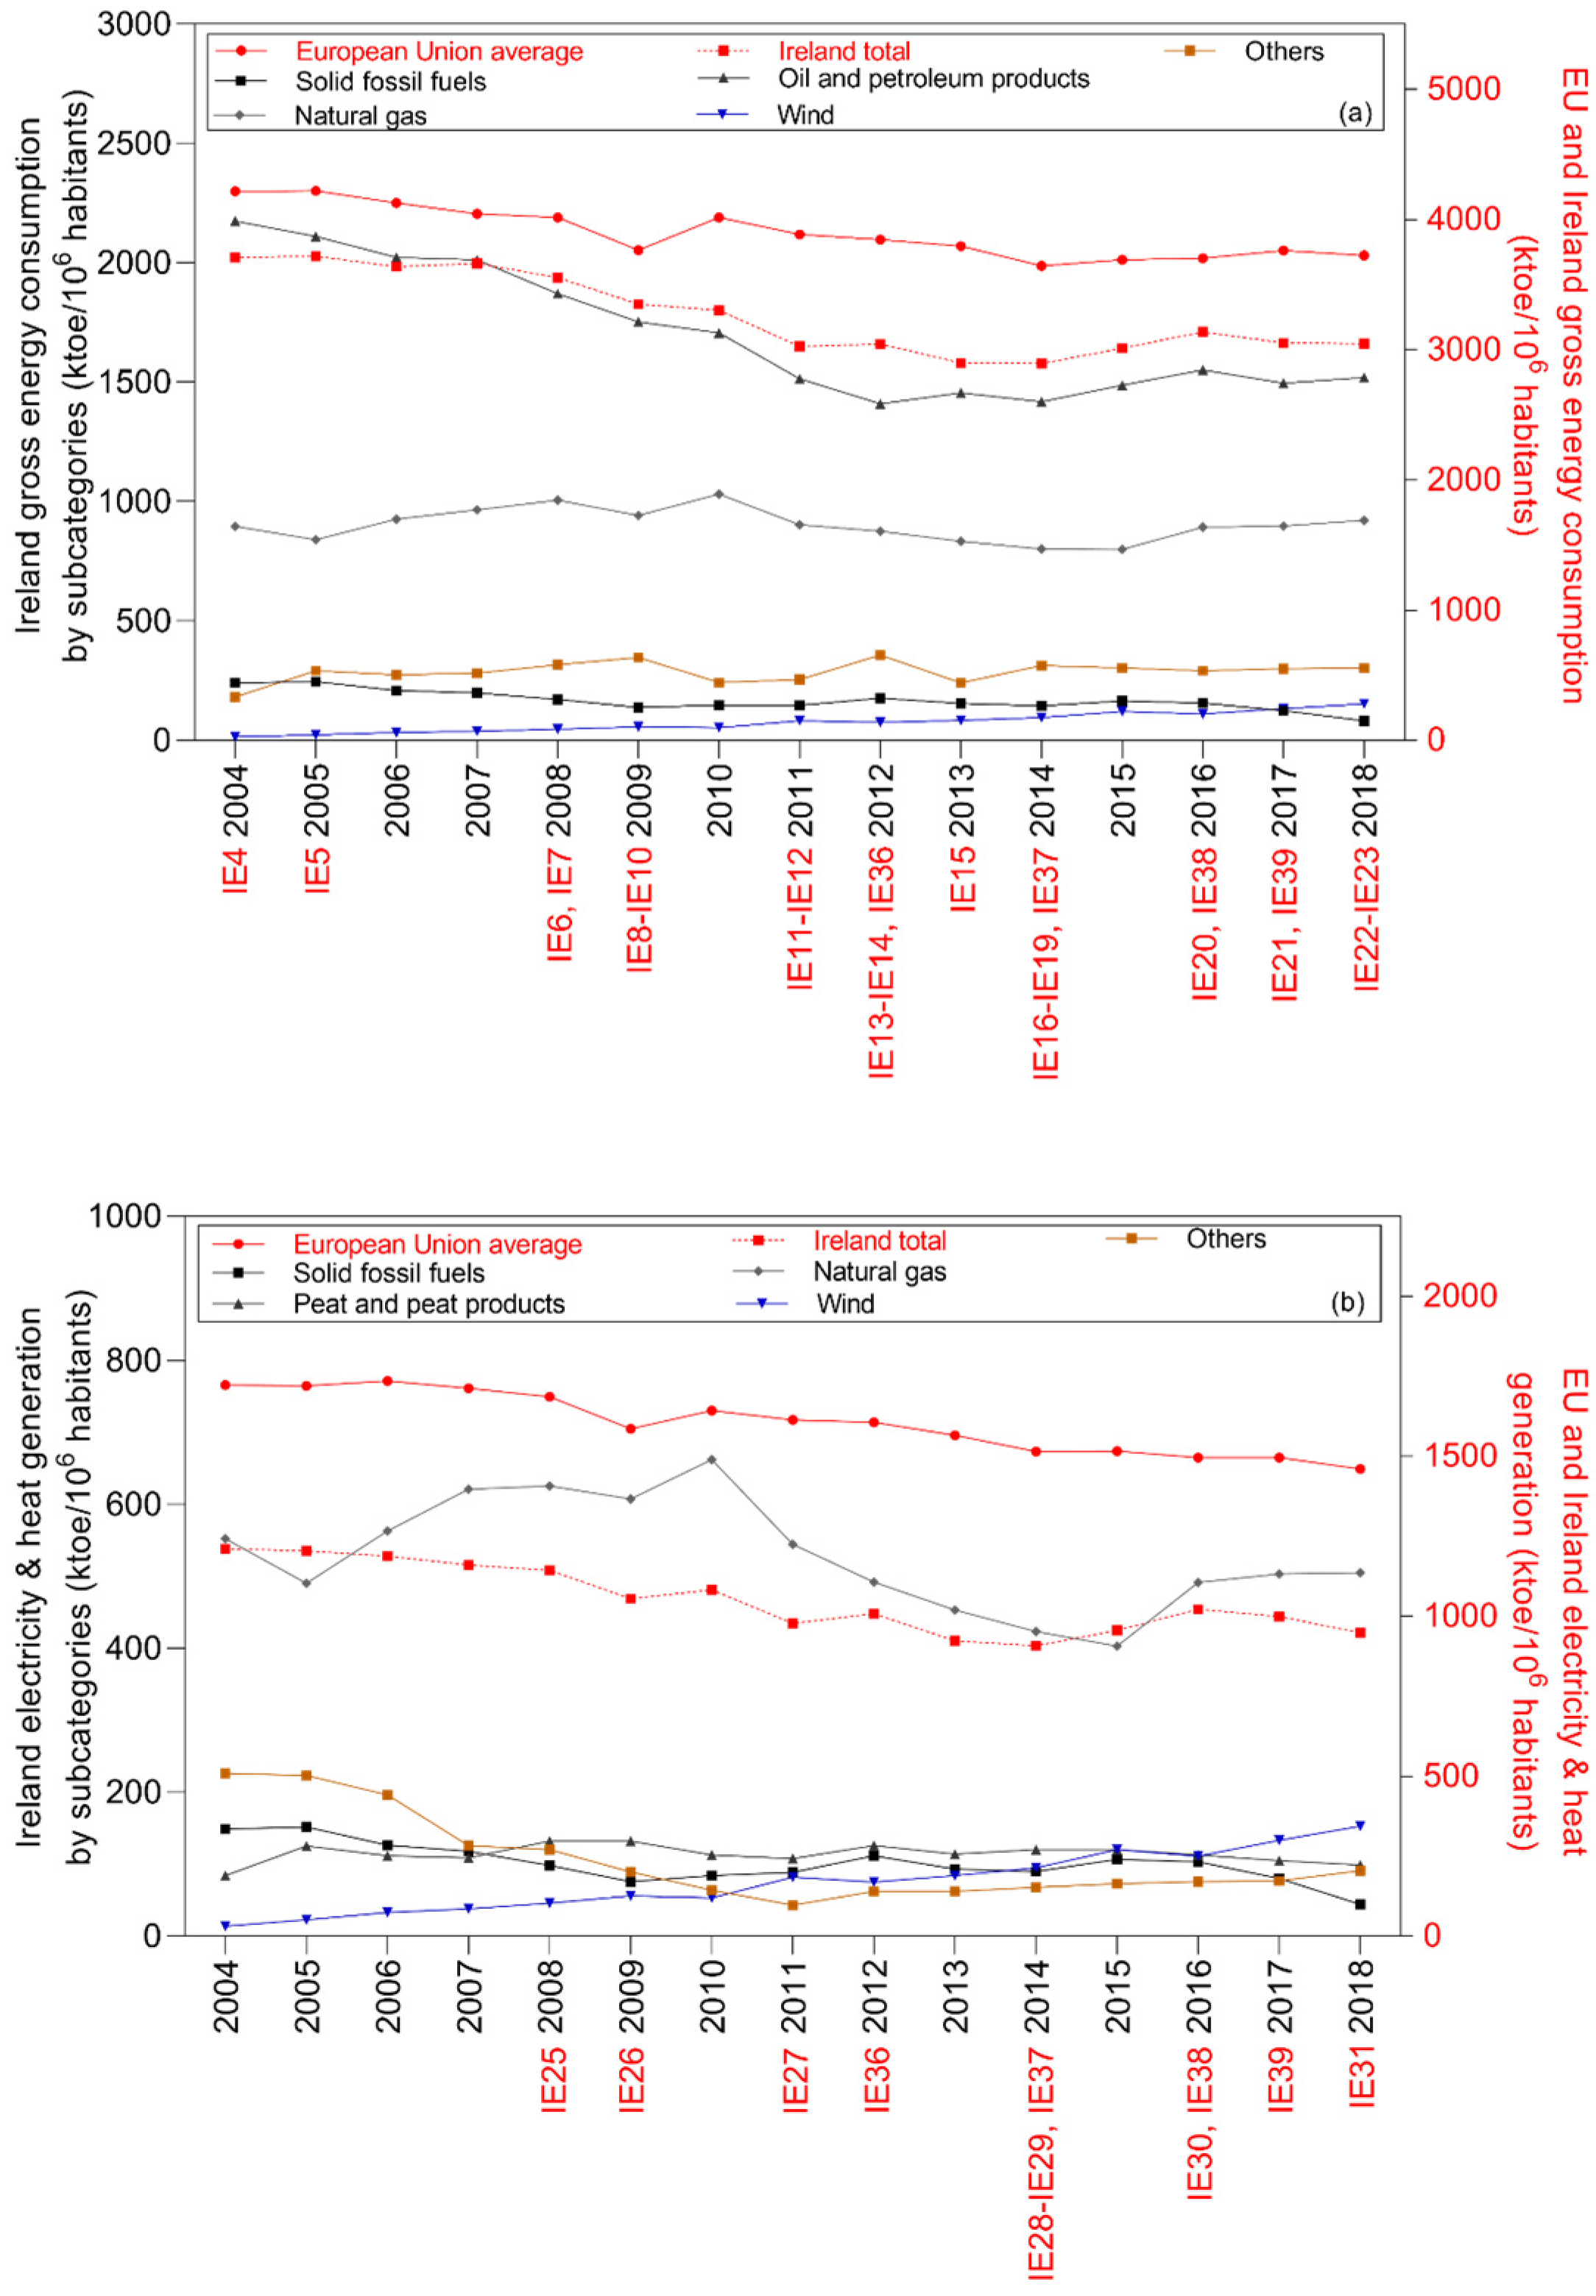
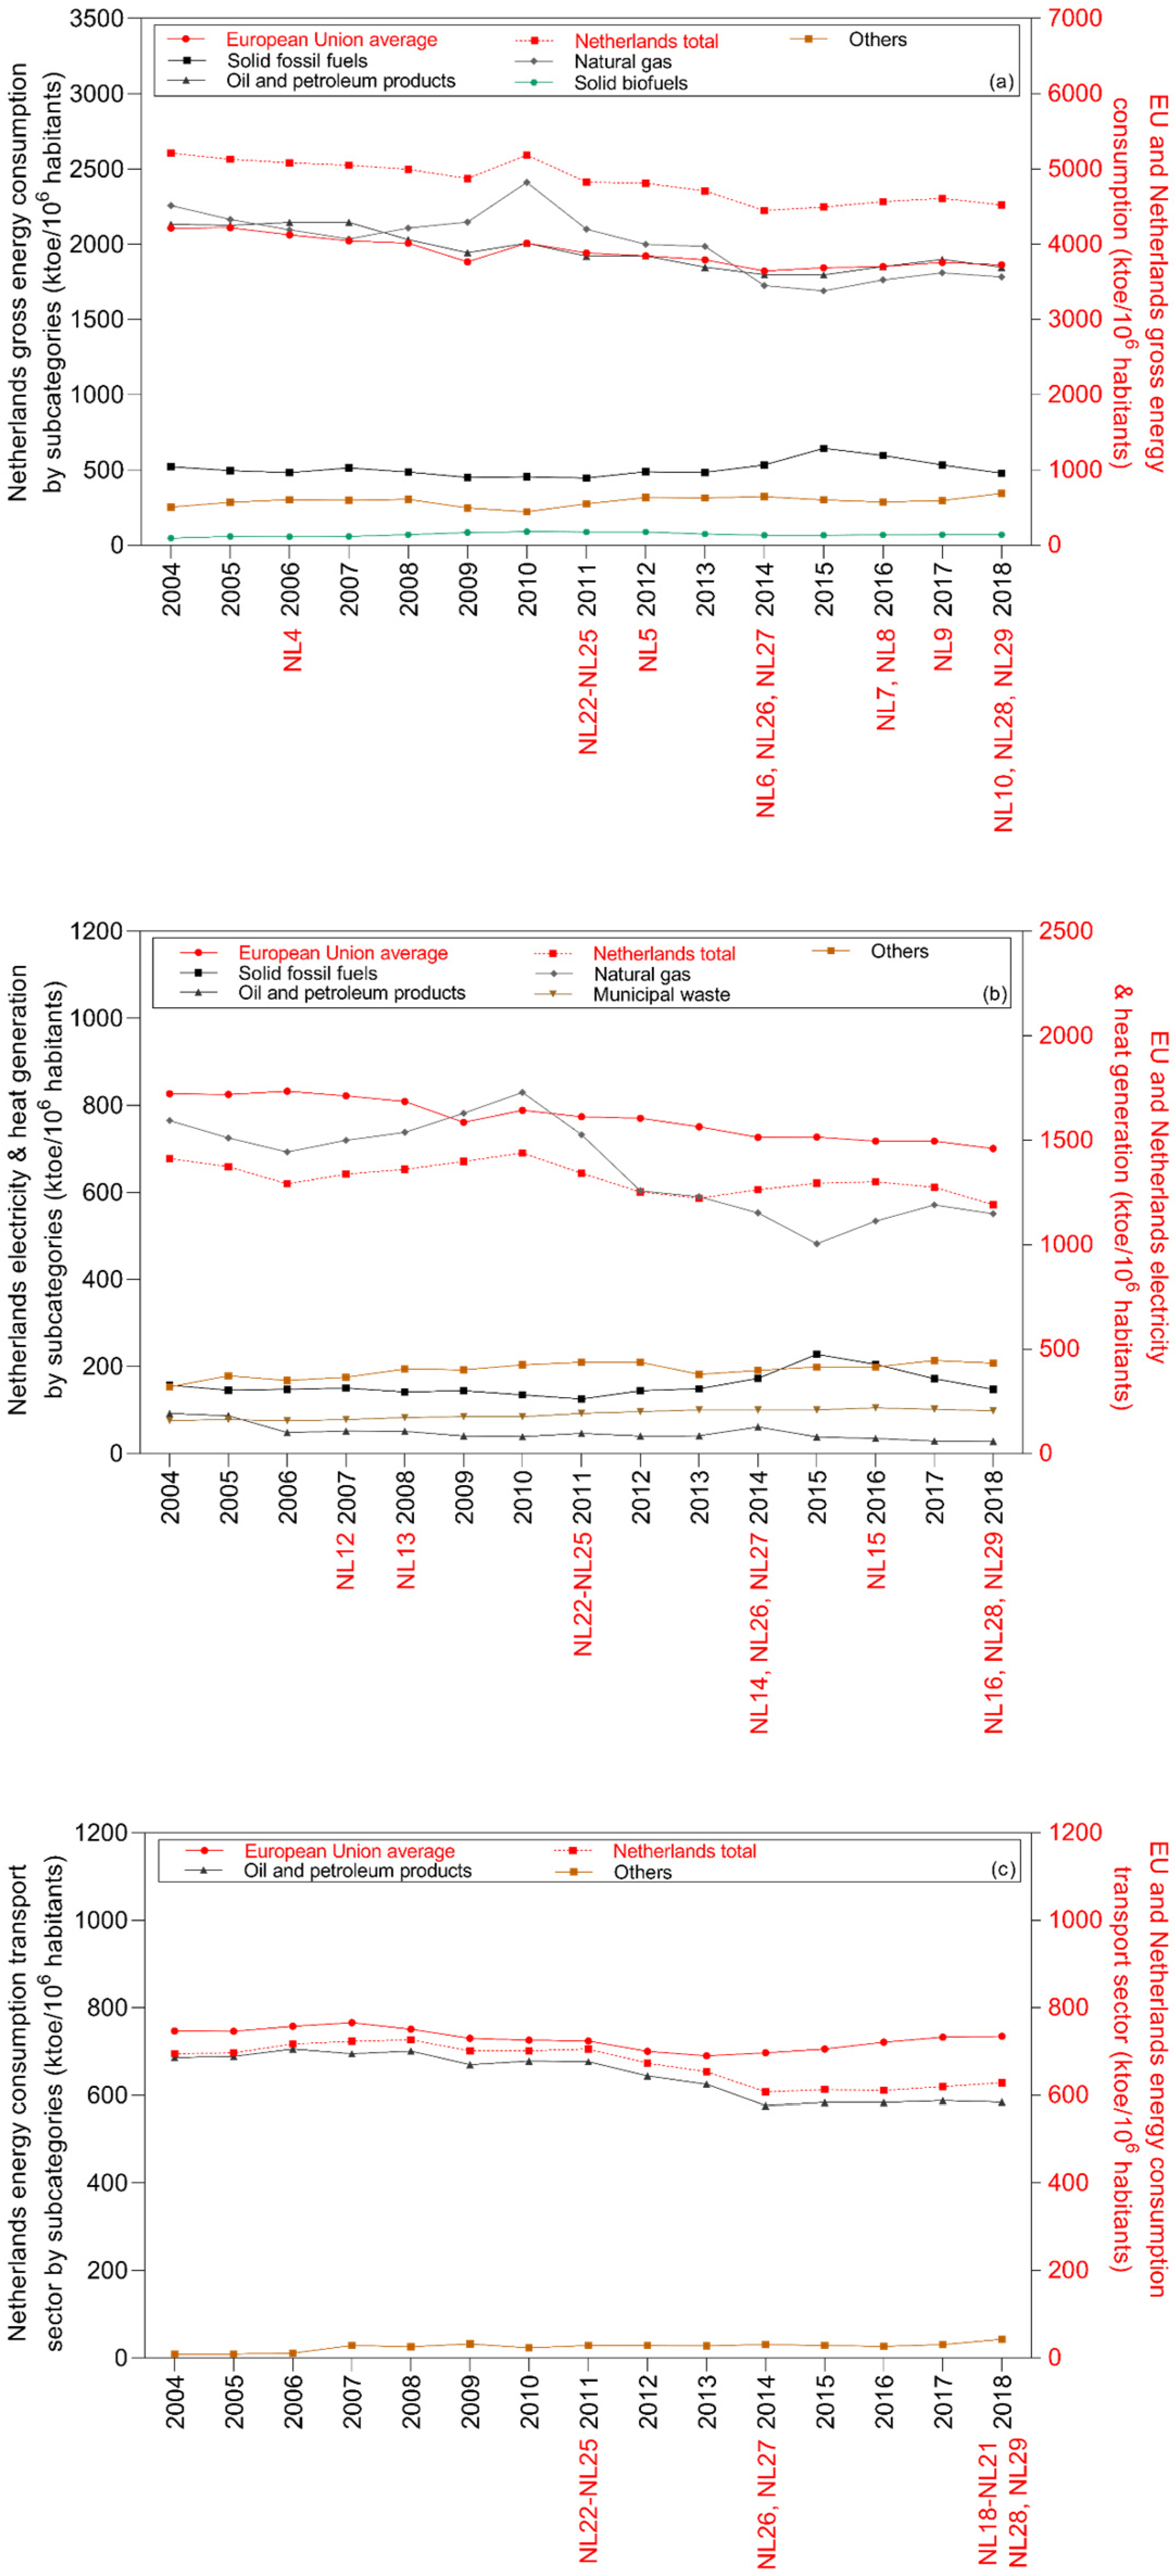
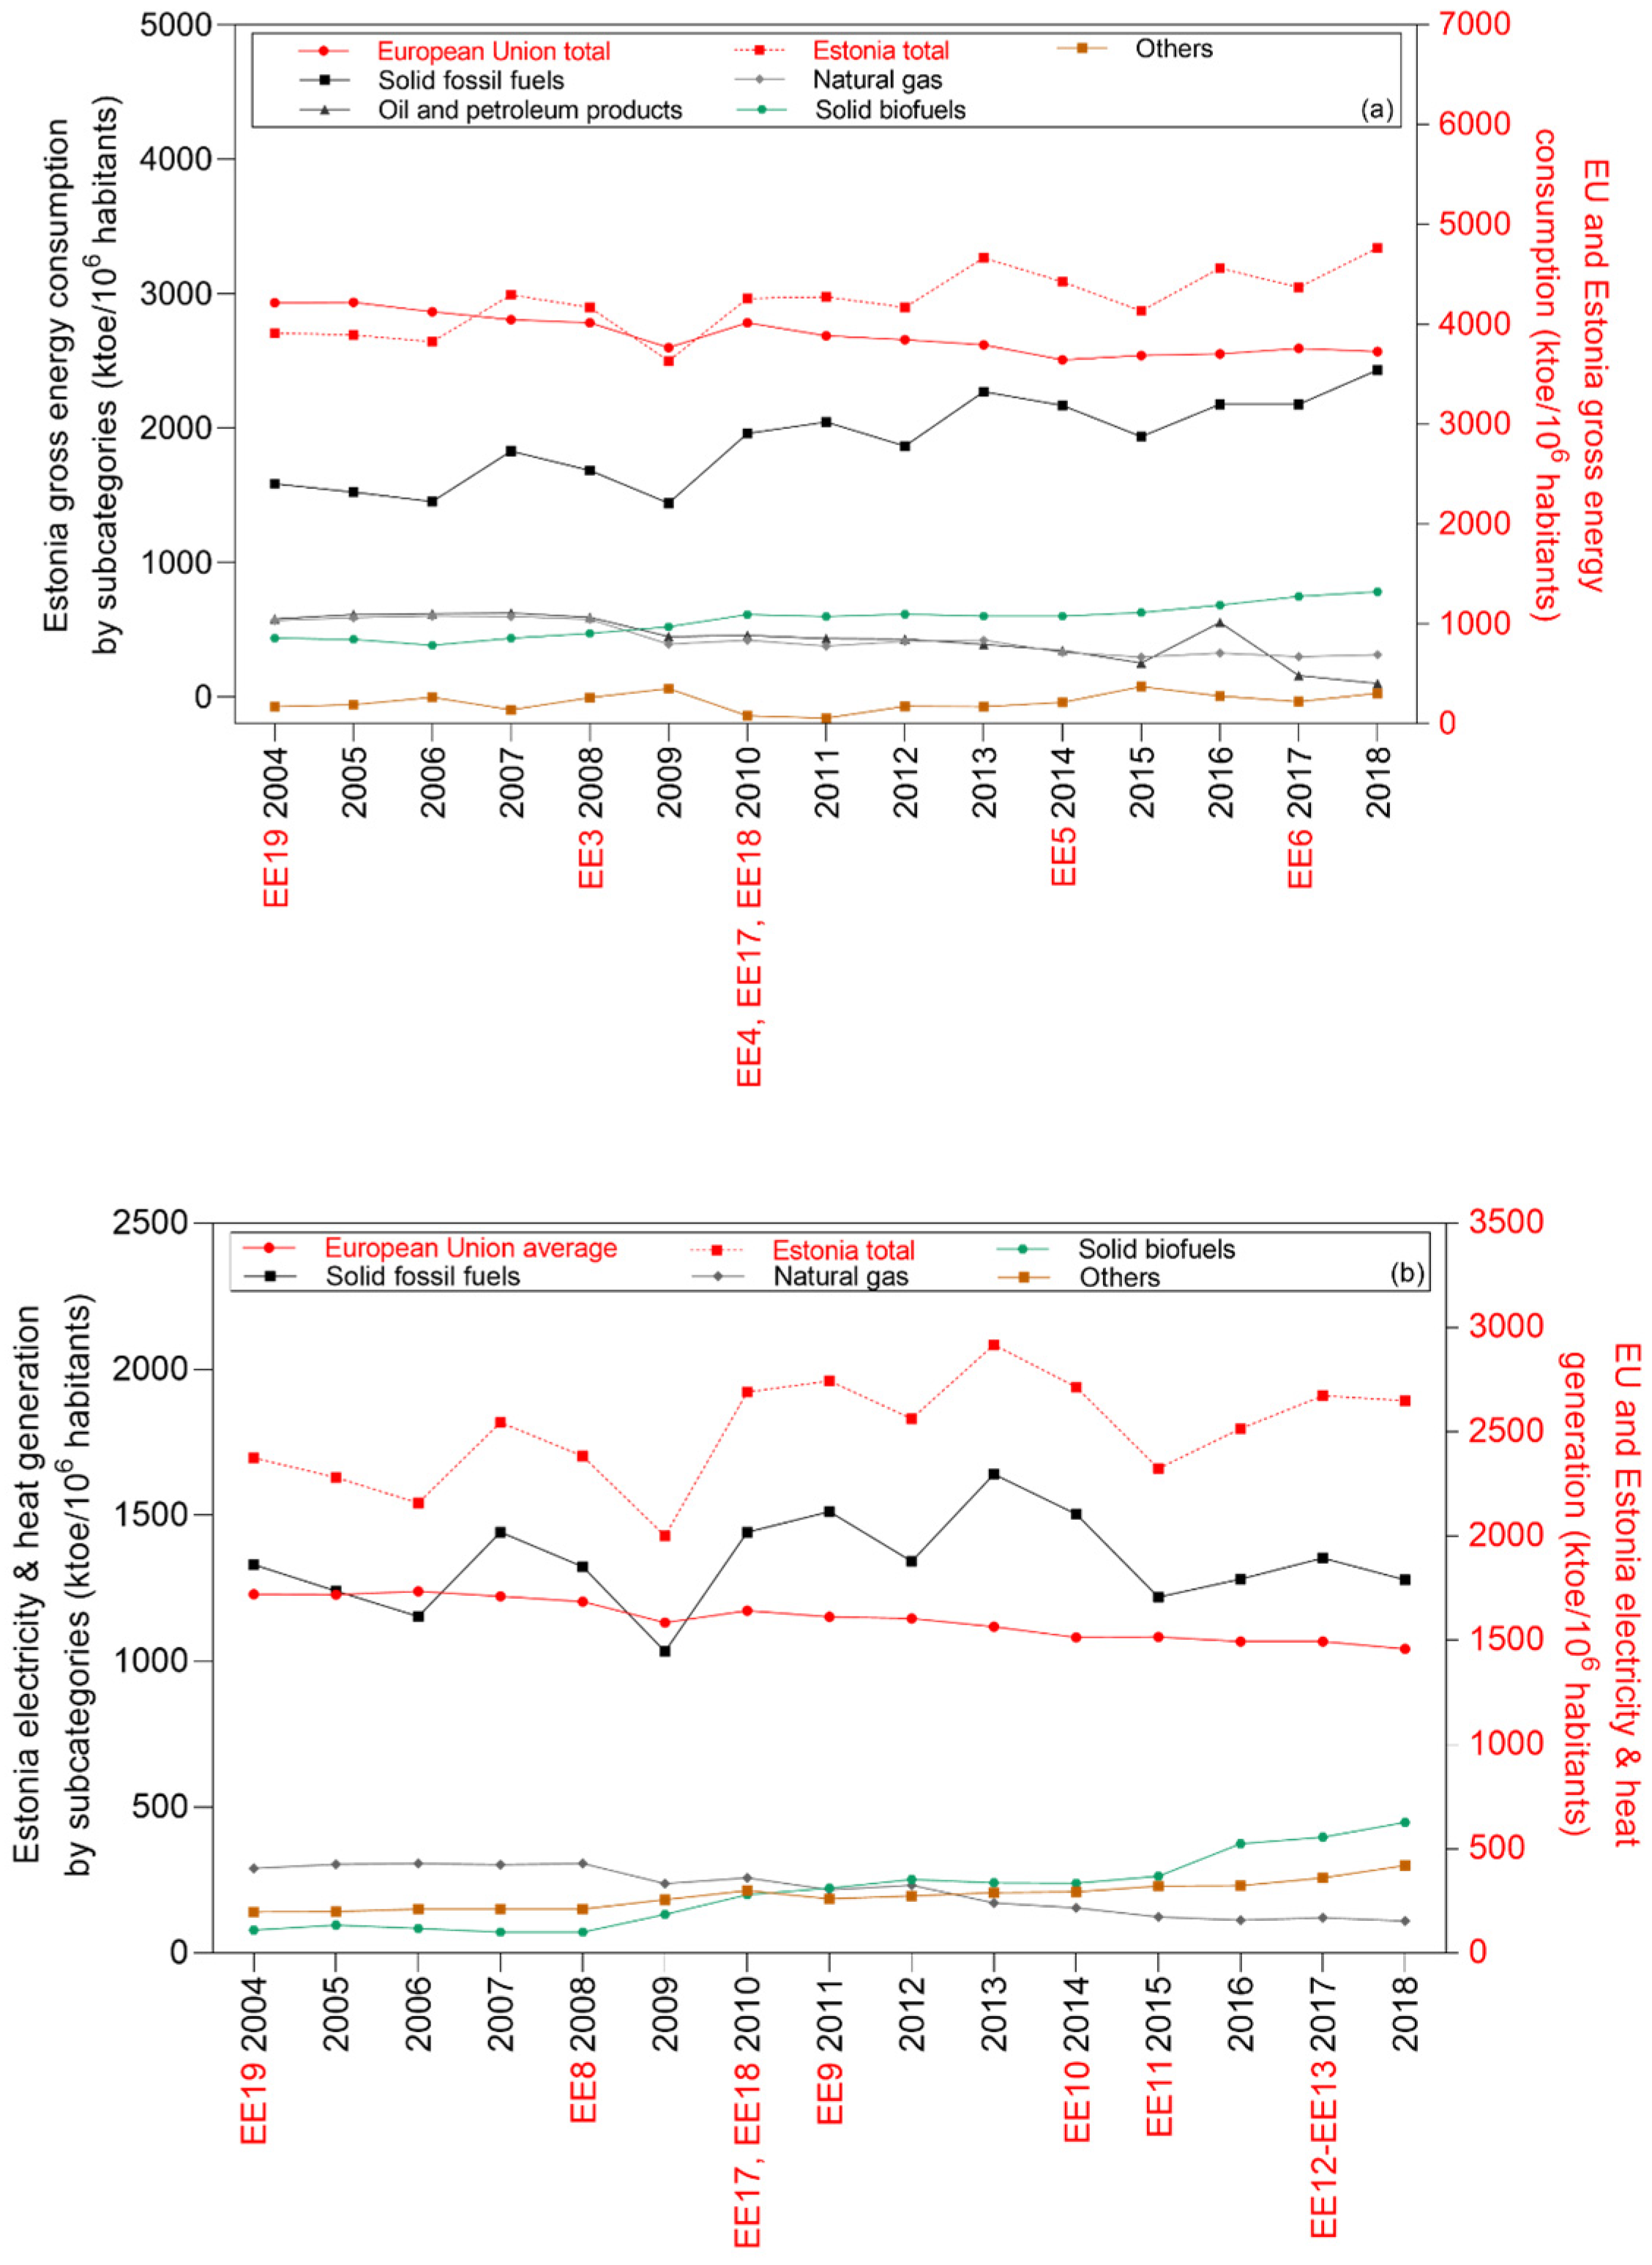
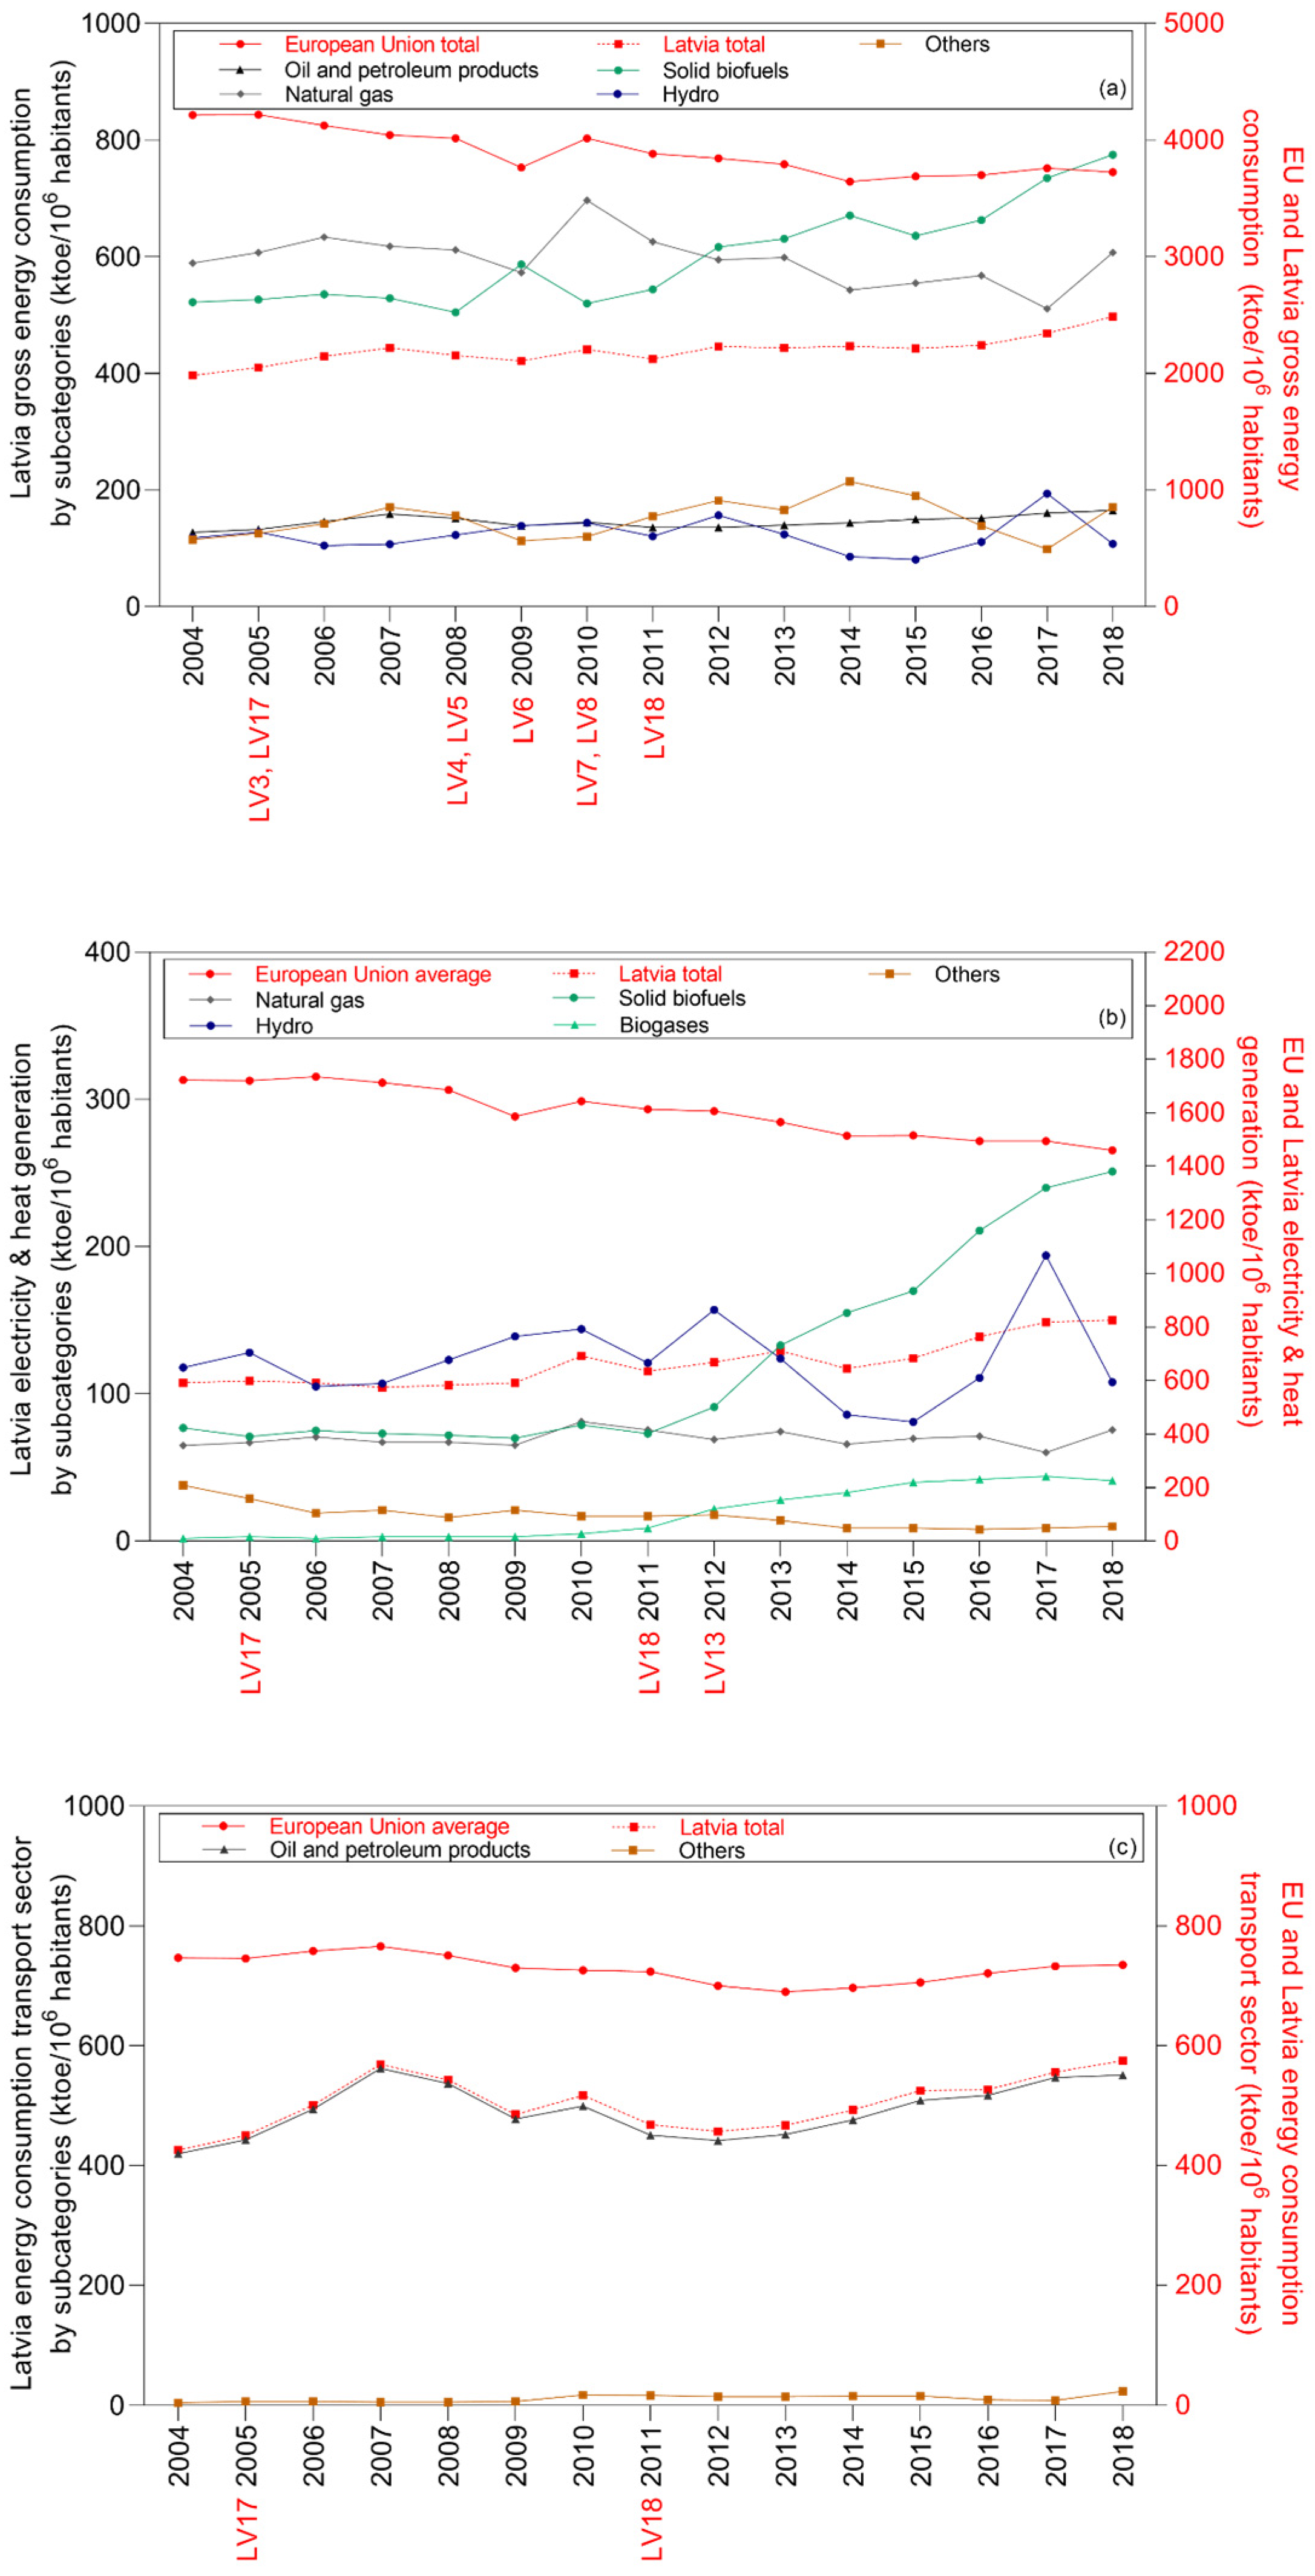
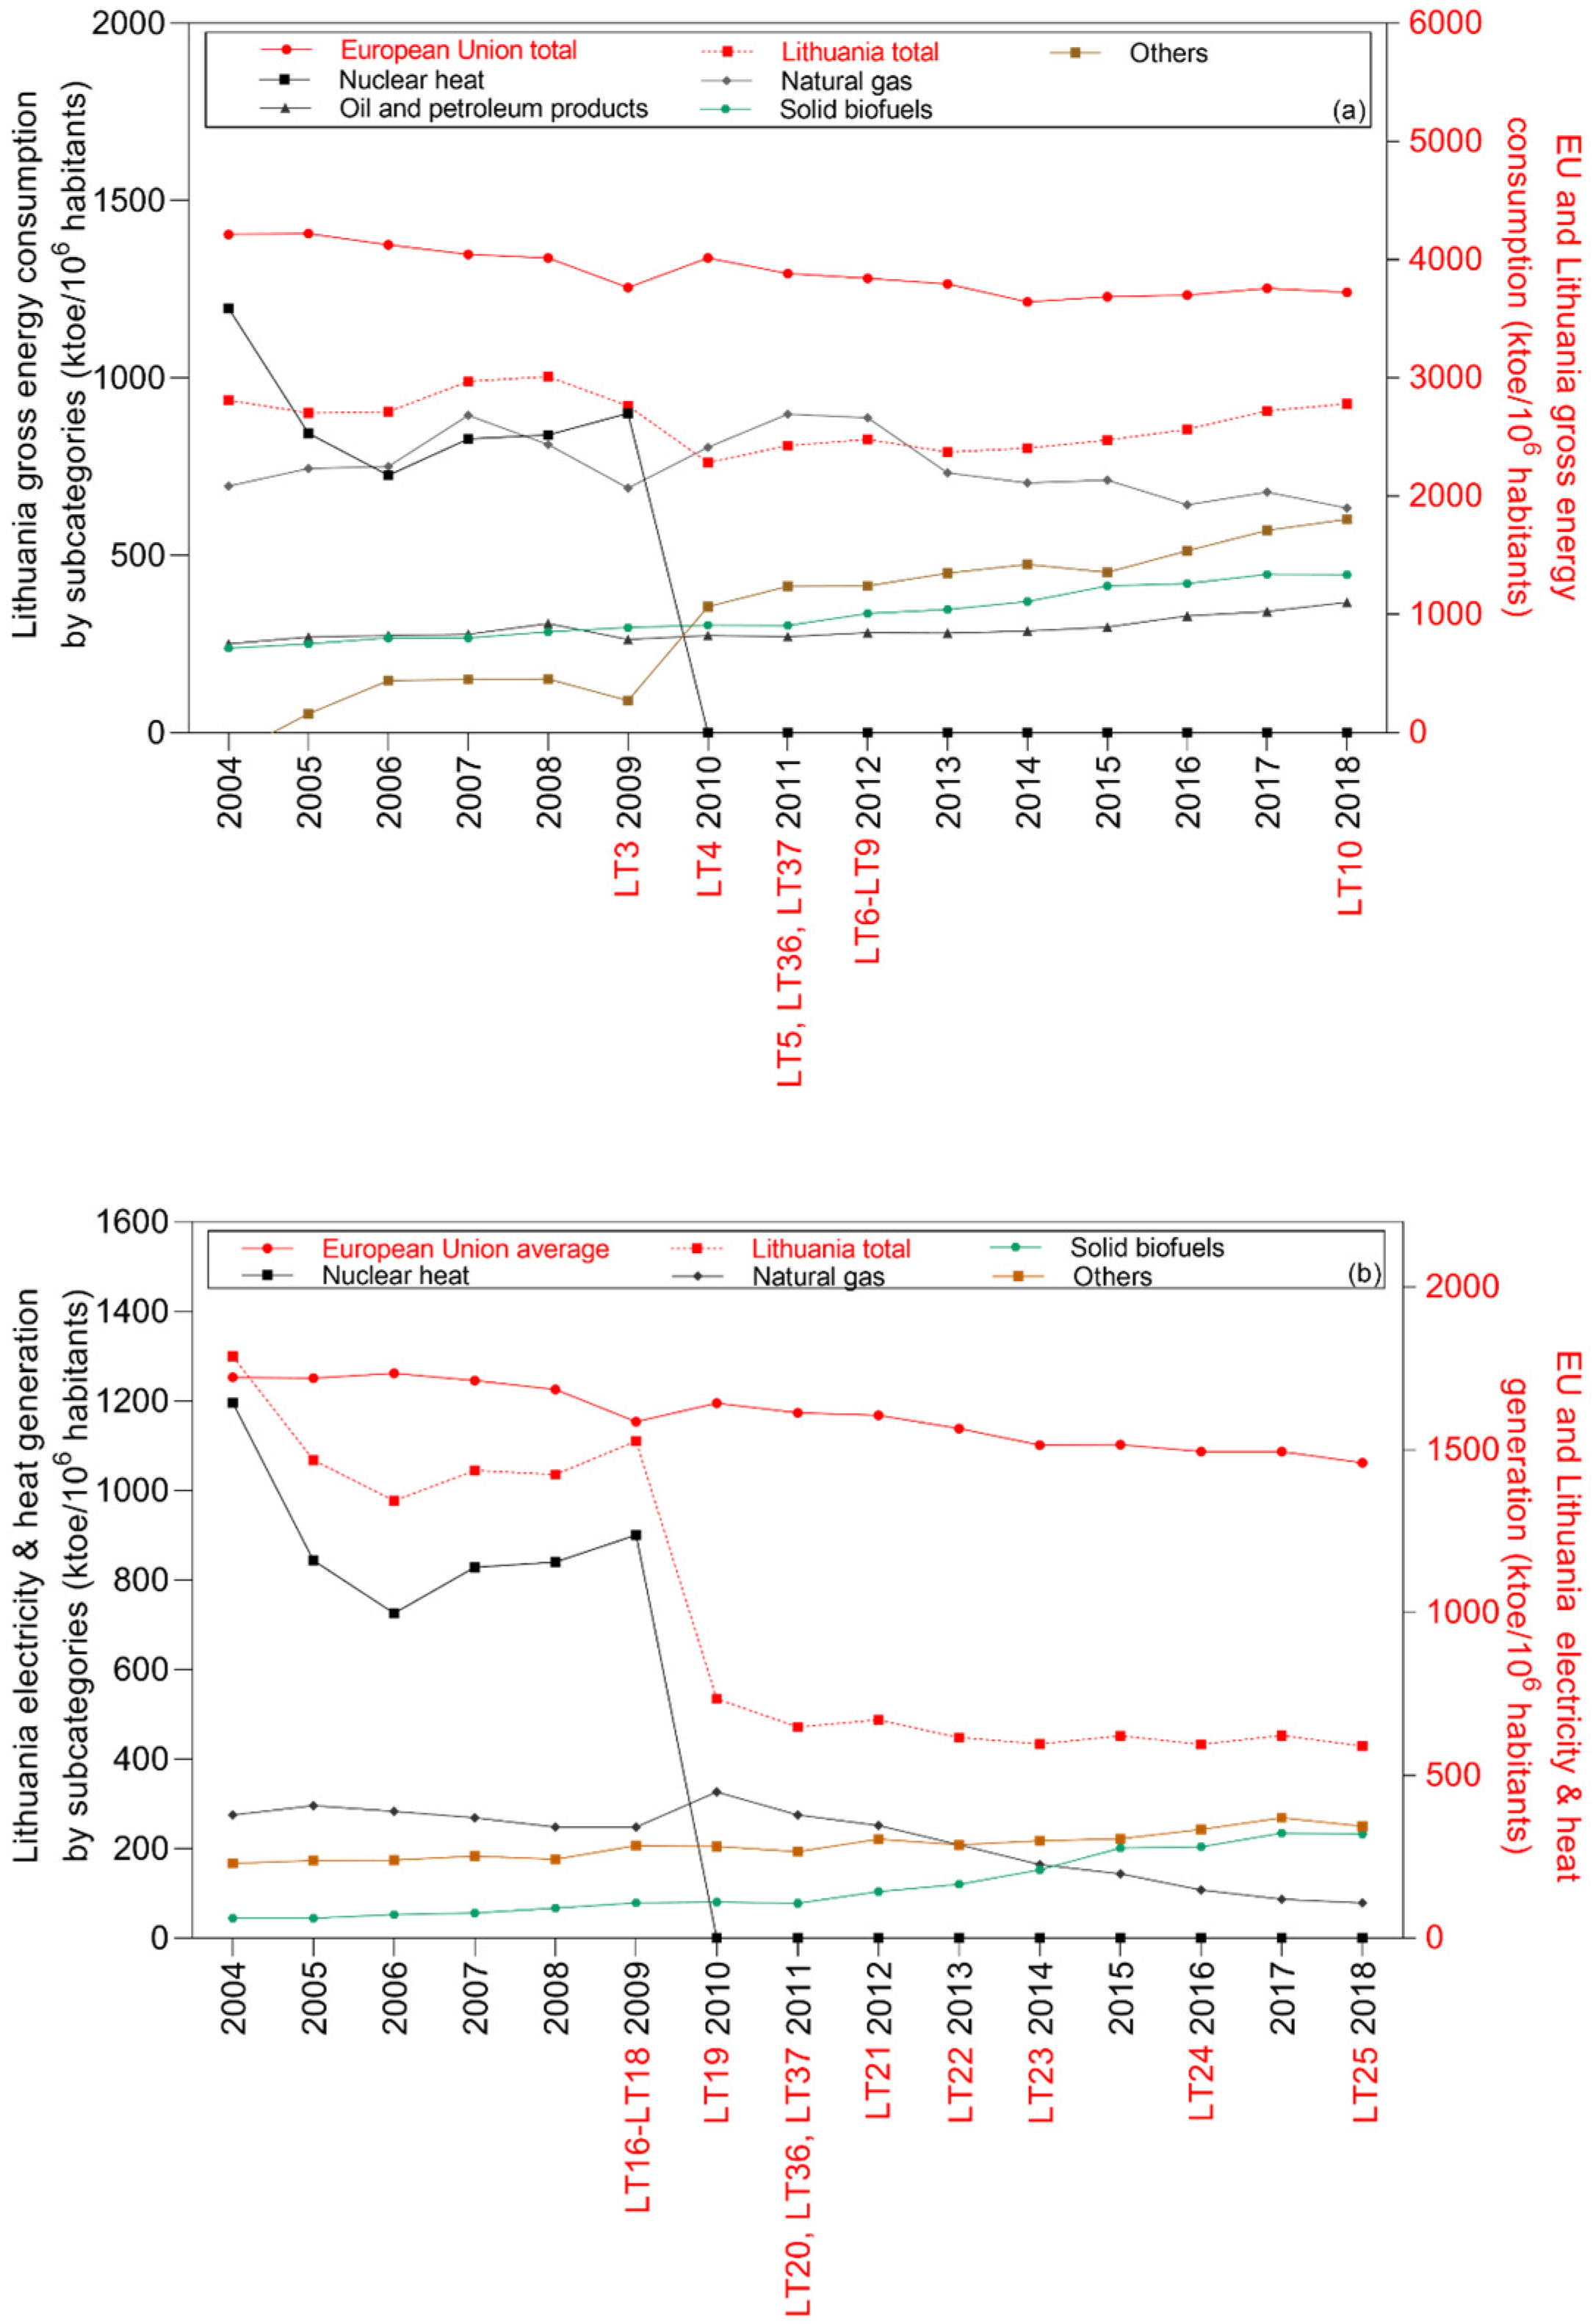
- Gross energy consumption in Estonia, Latvia, and Lithuania, Denmark, Ireland, and Netherlands by category (total, solid fossil fuels, oil and petroleum products, natural gas, hydro, solid biofuels, and others) (KTOE/106)
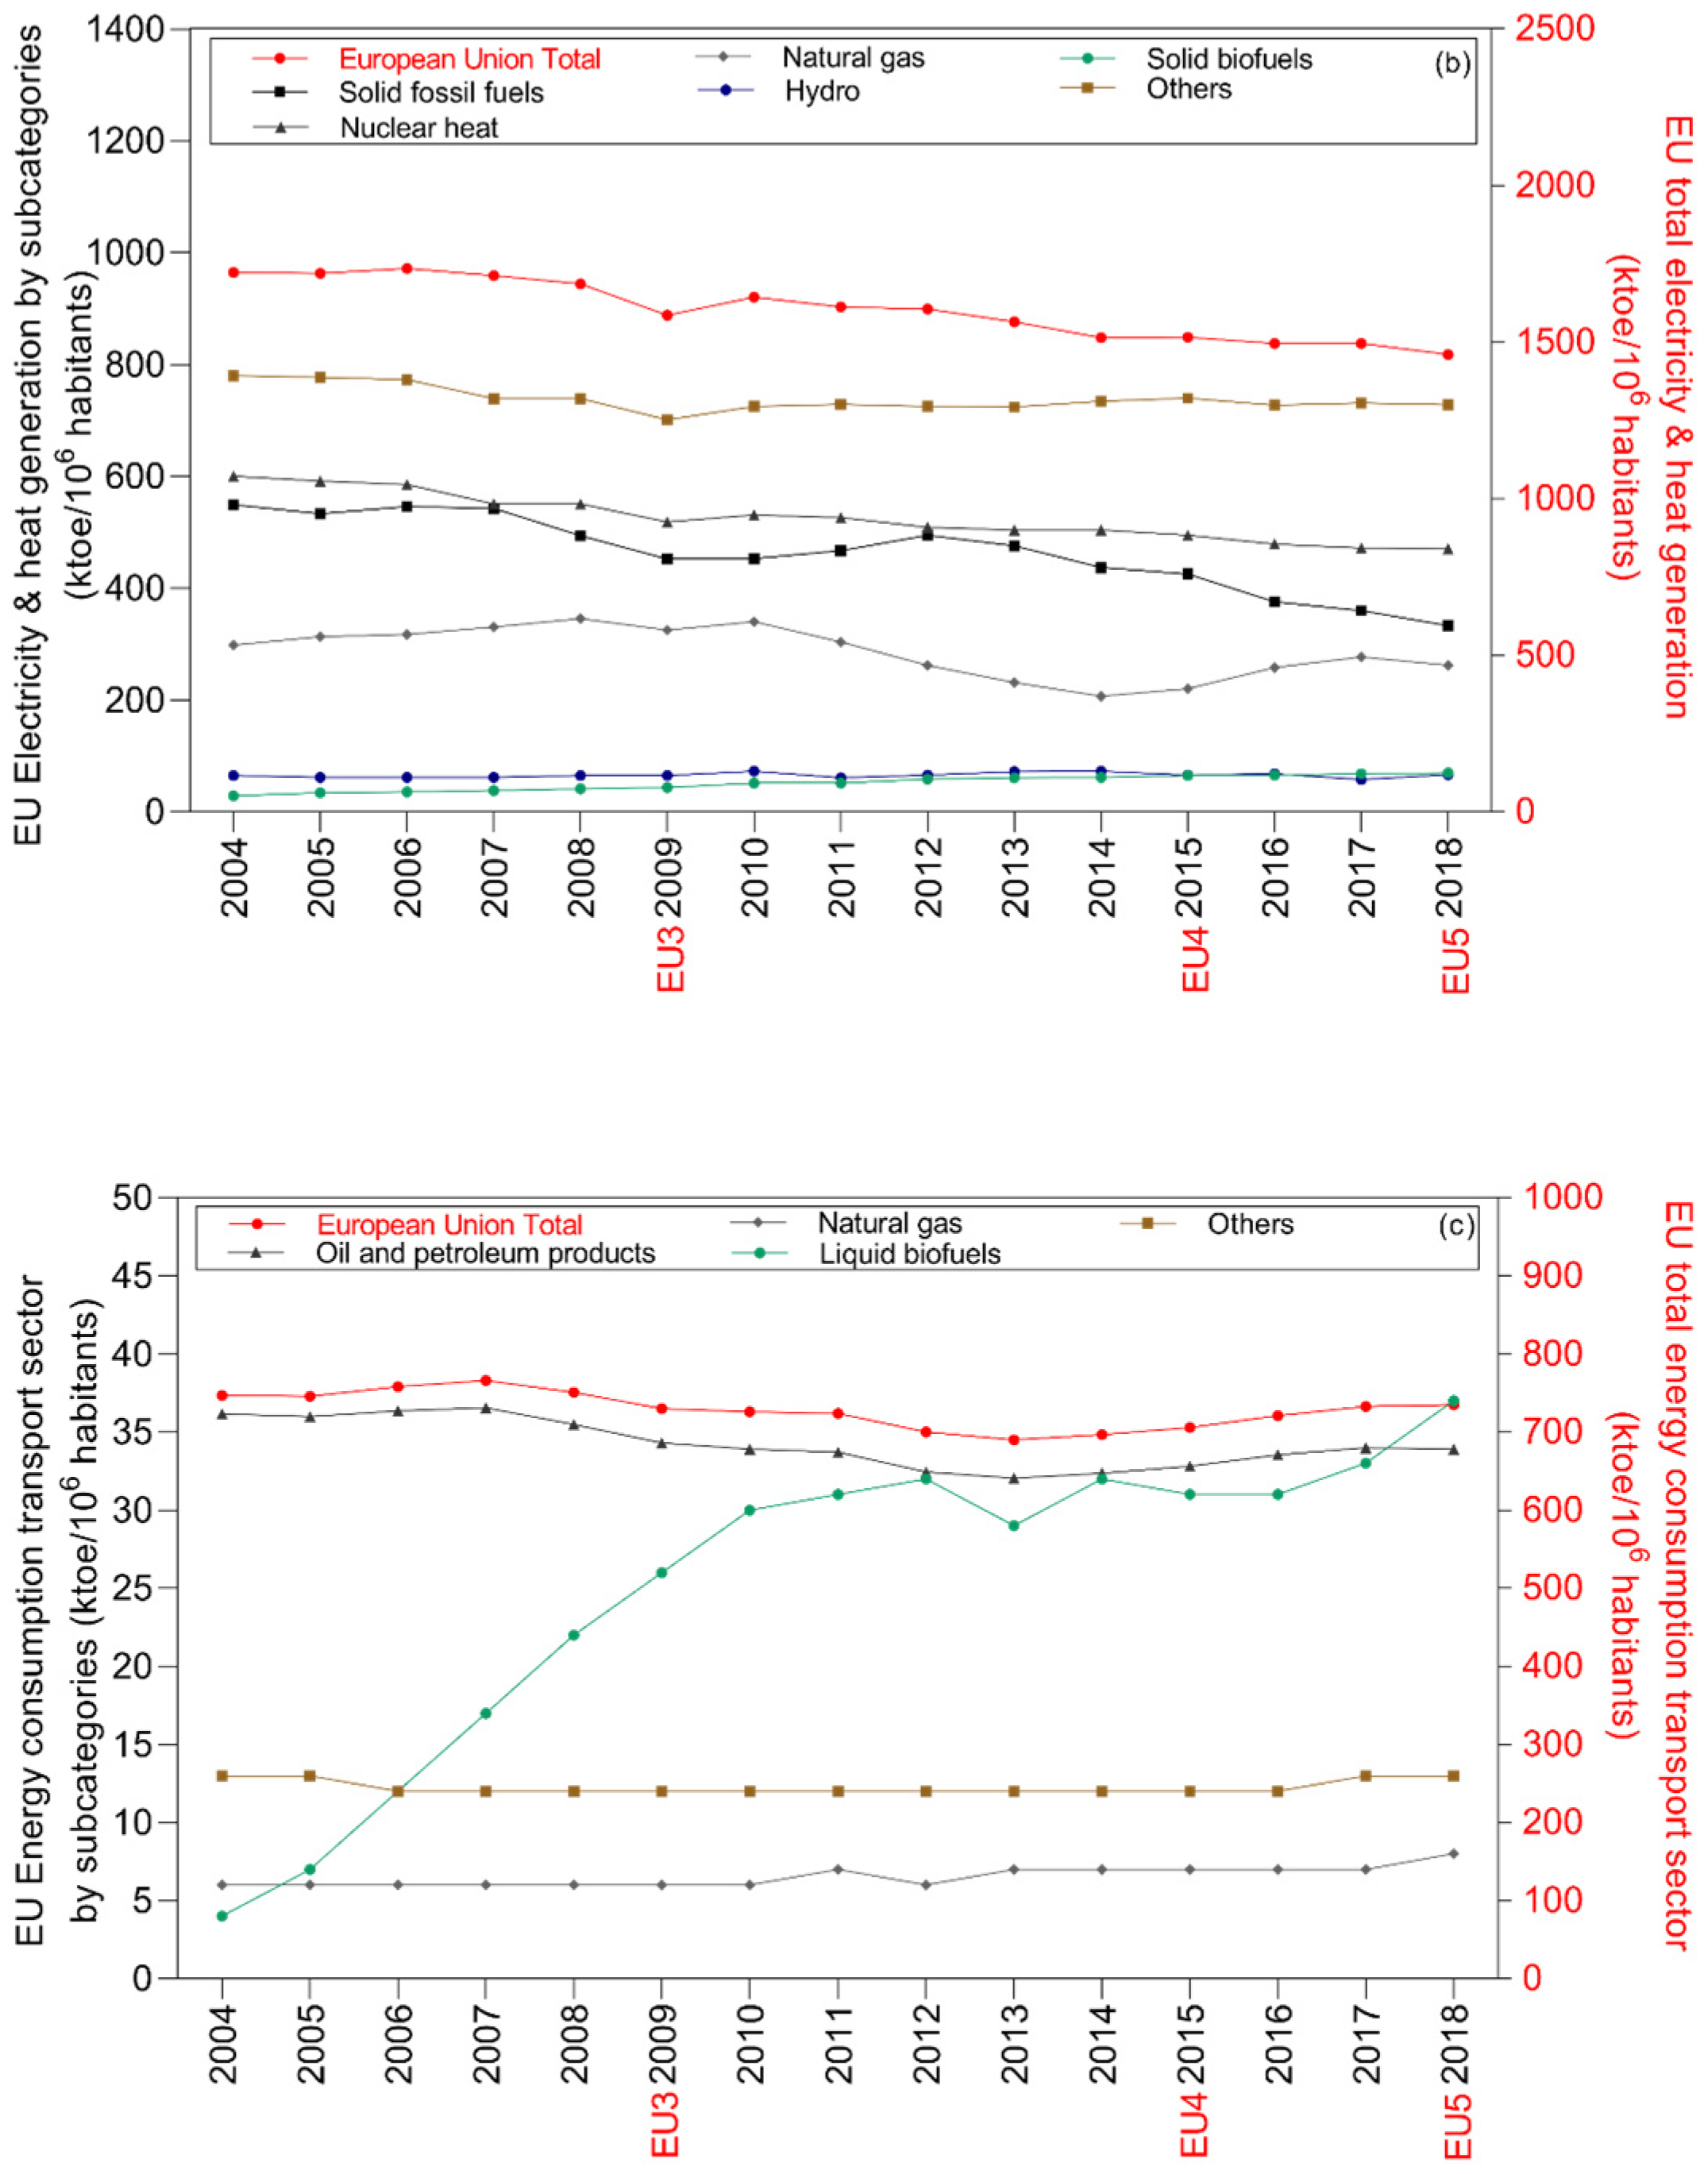
- Total energy supply in the electricity & heat sector in Estonia, Latvia, and Lithuania, Denmark, Ireland, and Netherlands by category (total, solid fossil fuels, natural gas, hydro, solid biofuels, nuclear heat, and others) (KTOE/106)
- Final energy consumption in the transport sector in Estonia, Latvia, and Lithuania, Denmark, Ireland, and Netherlands by category (total, oil and petroleum products, liquid biofuels, and others) (KTOE/106)
3.2. Data Analysis
4. Results and Discussion
4.1. European Union
4.2. Western Europe and Baltic Countries
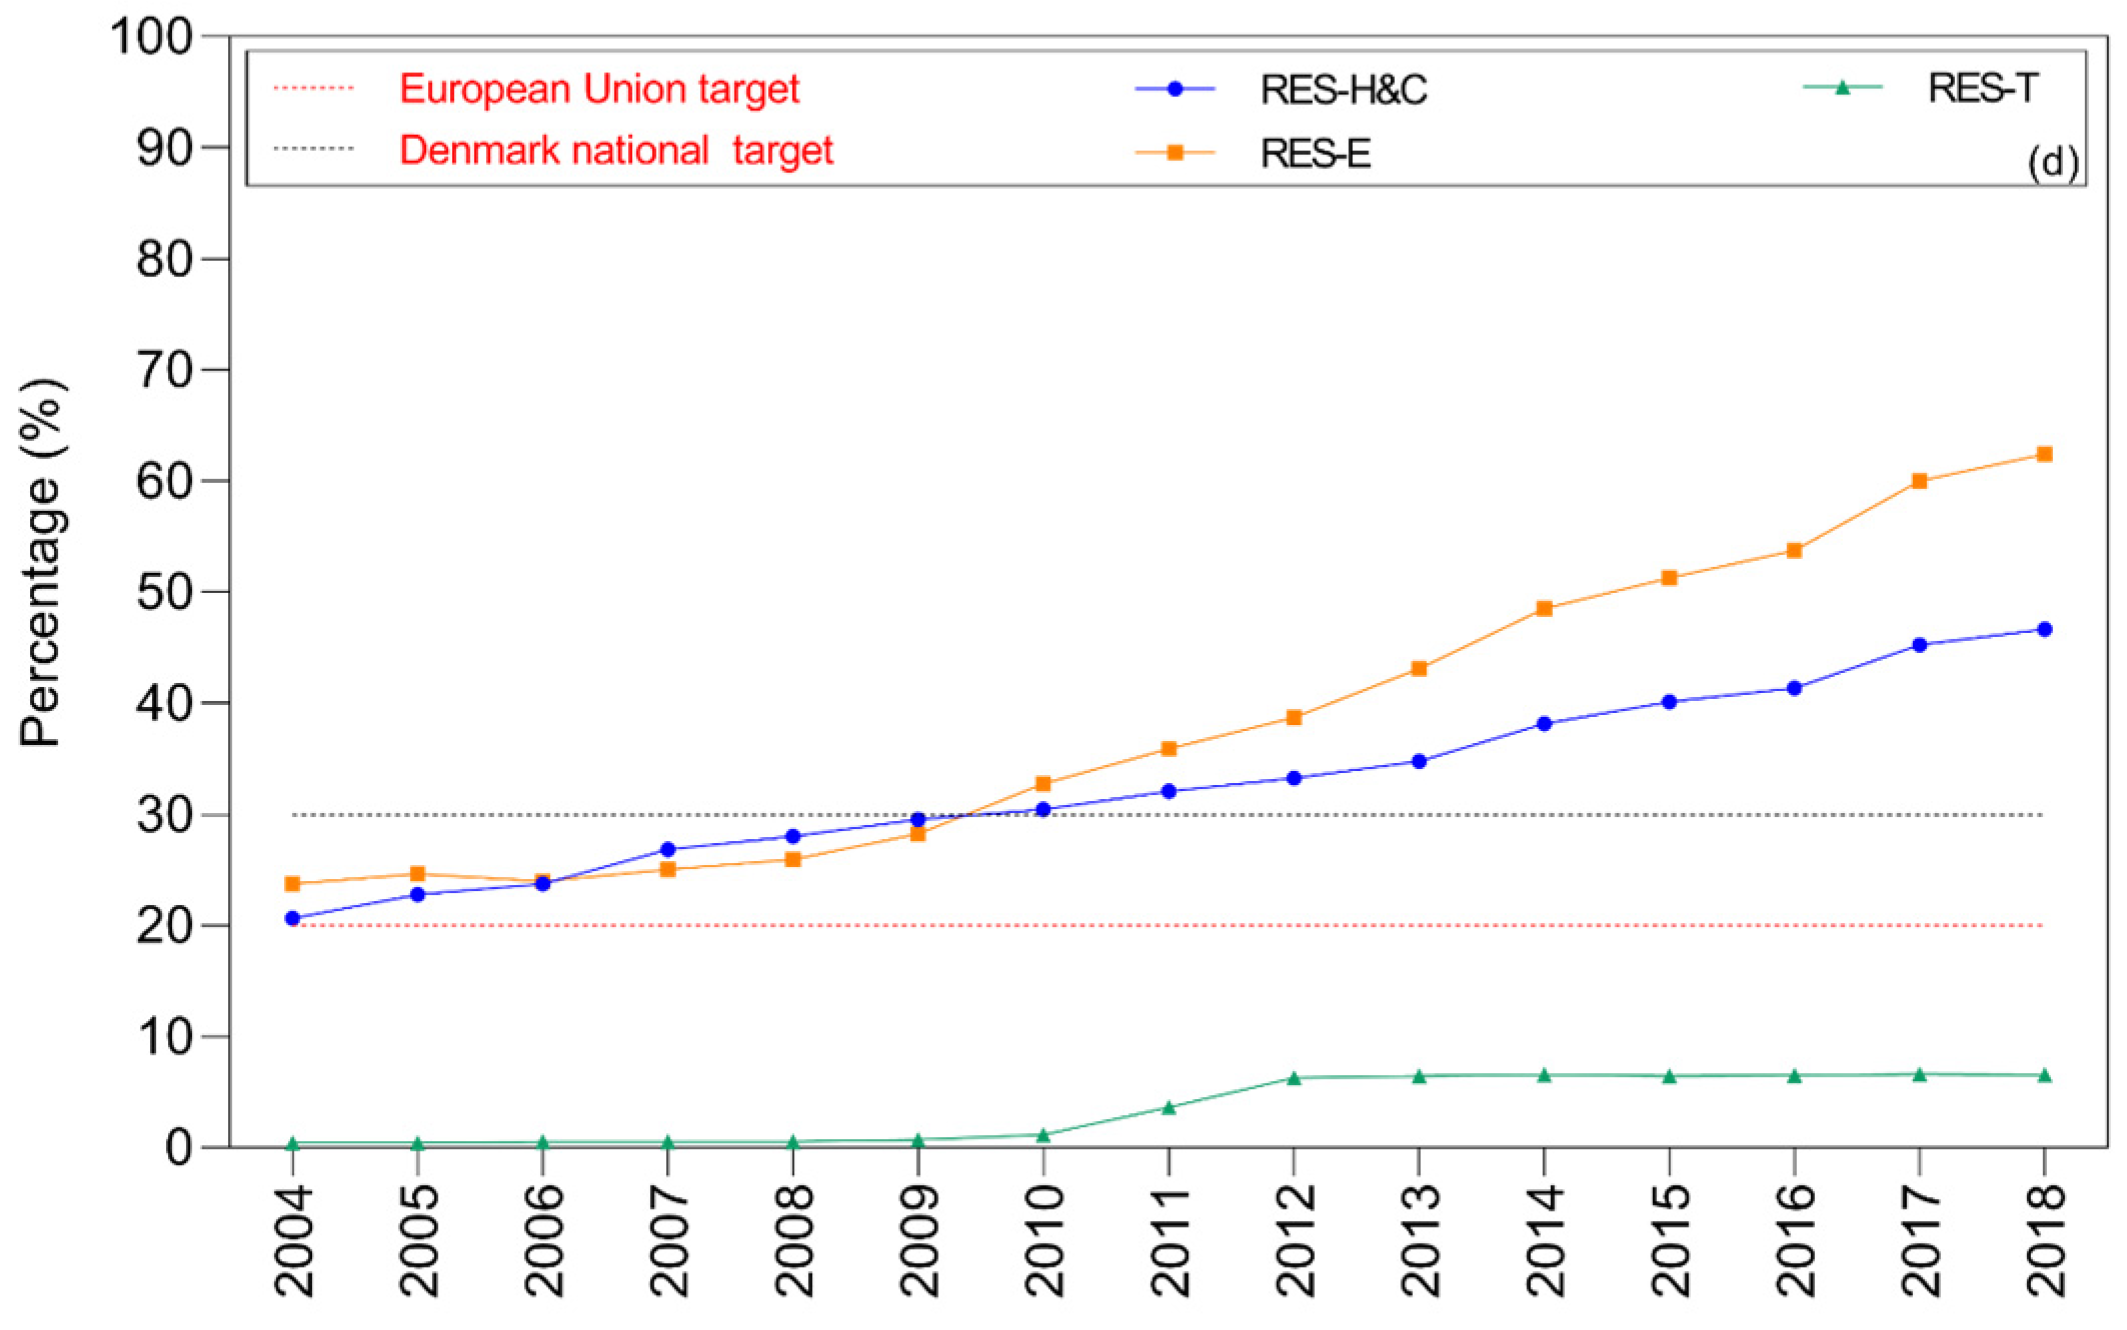
4.2.1. Denmark
4.2.2. Ireland
4.2.3. Netherlands
4.2.4. Estonia
4.2.5. Latvia
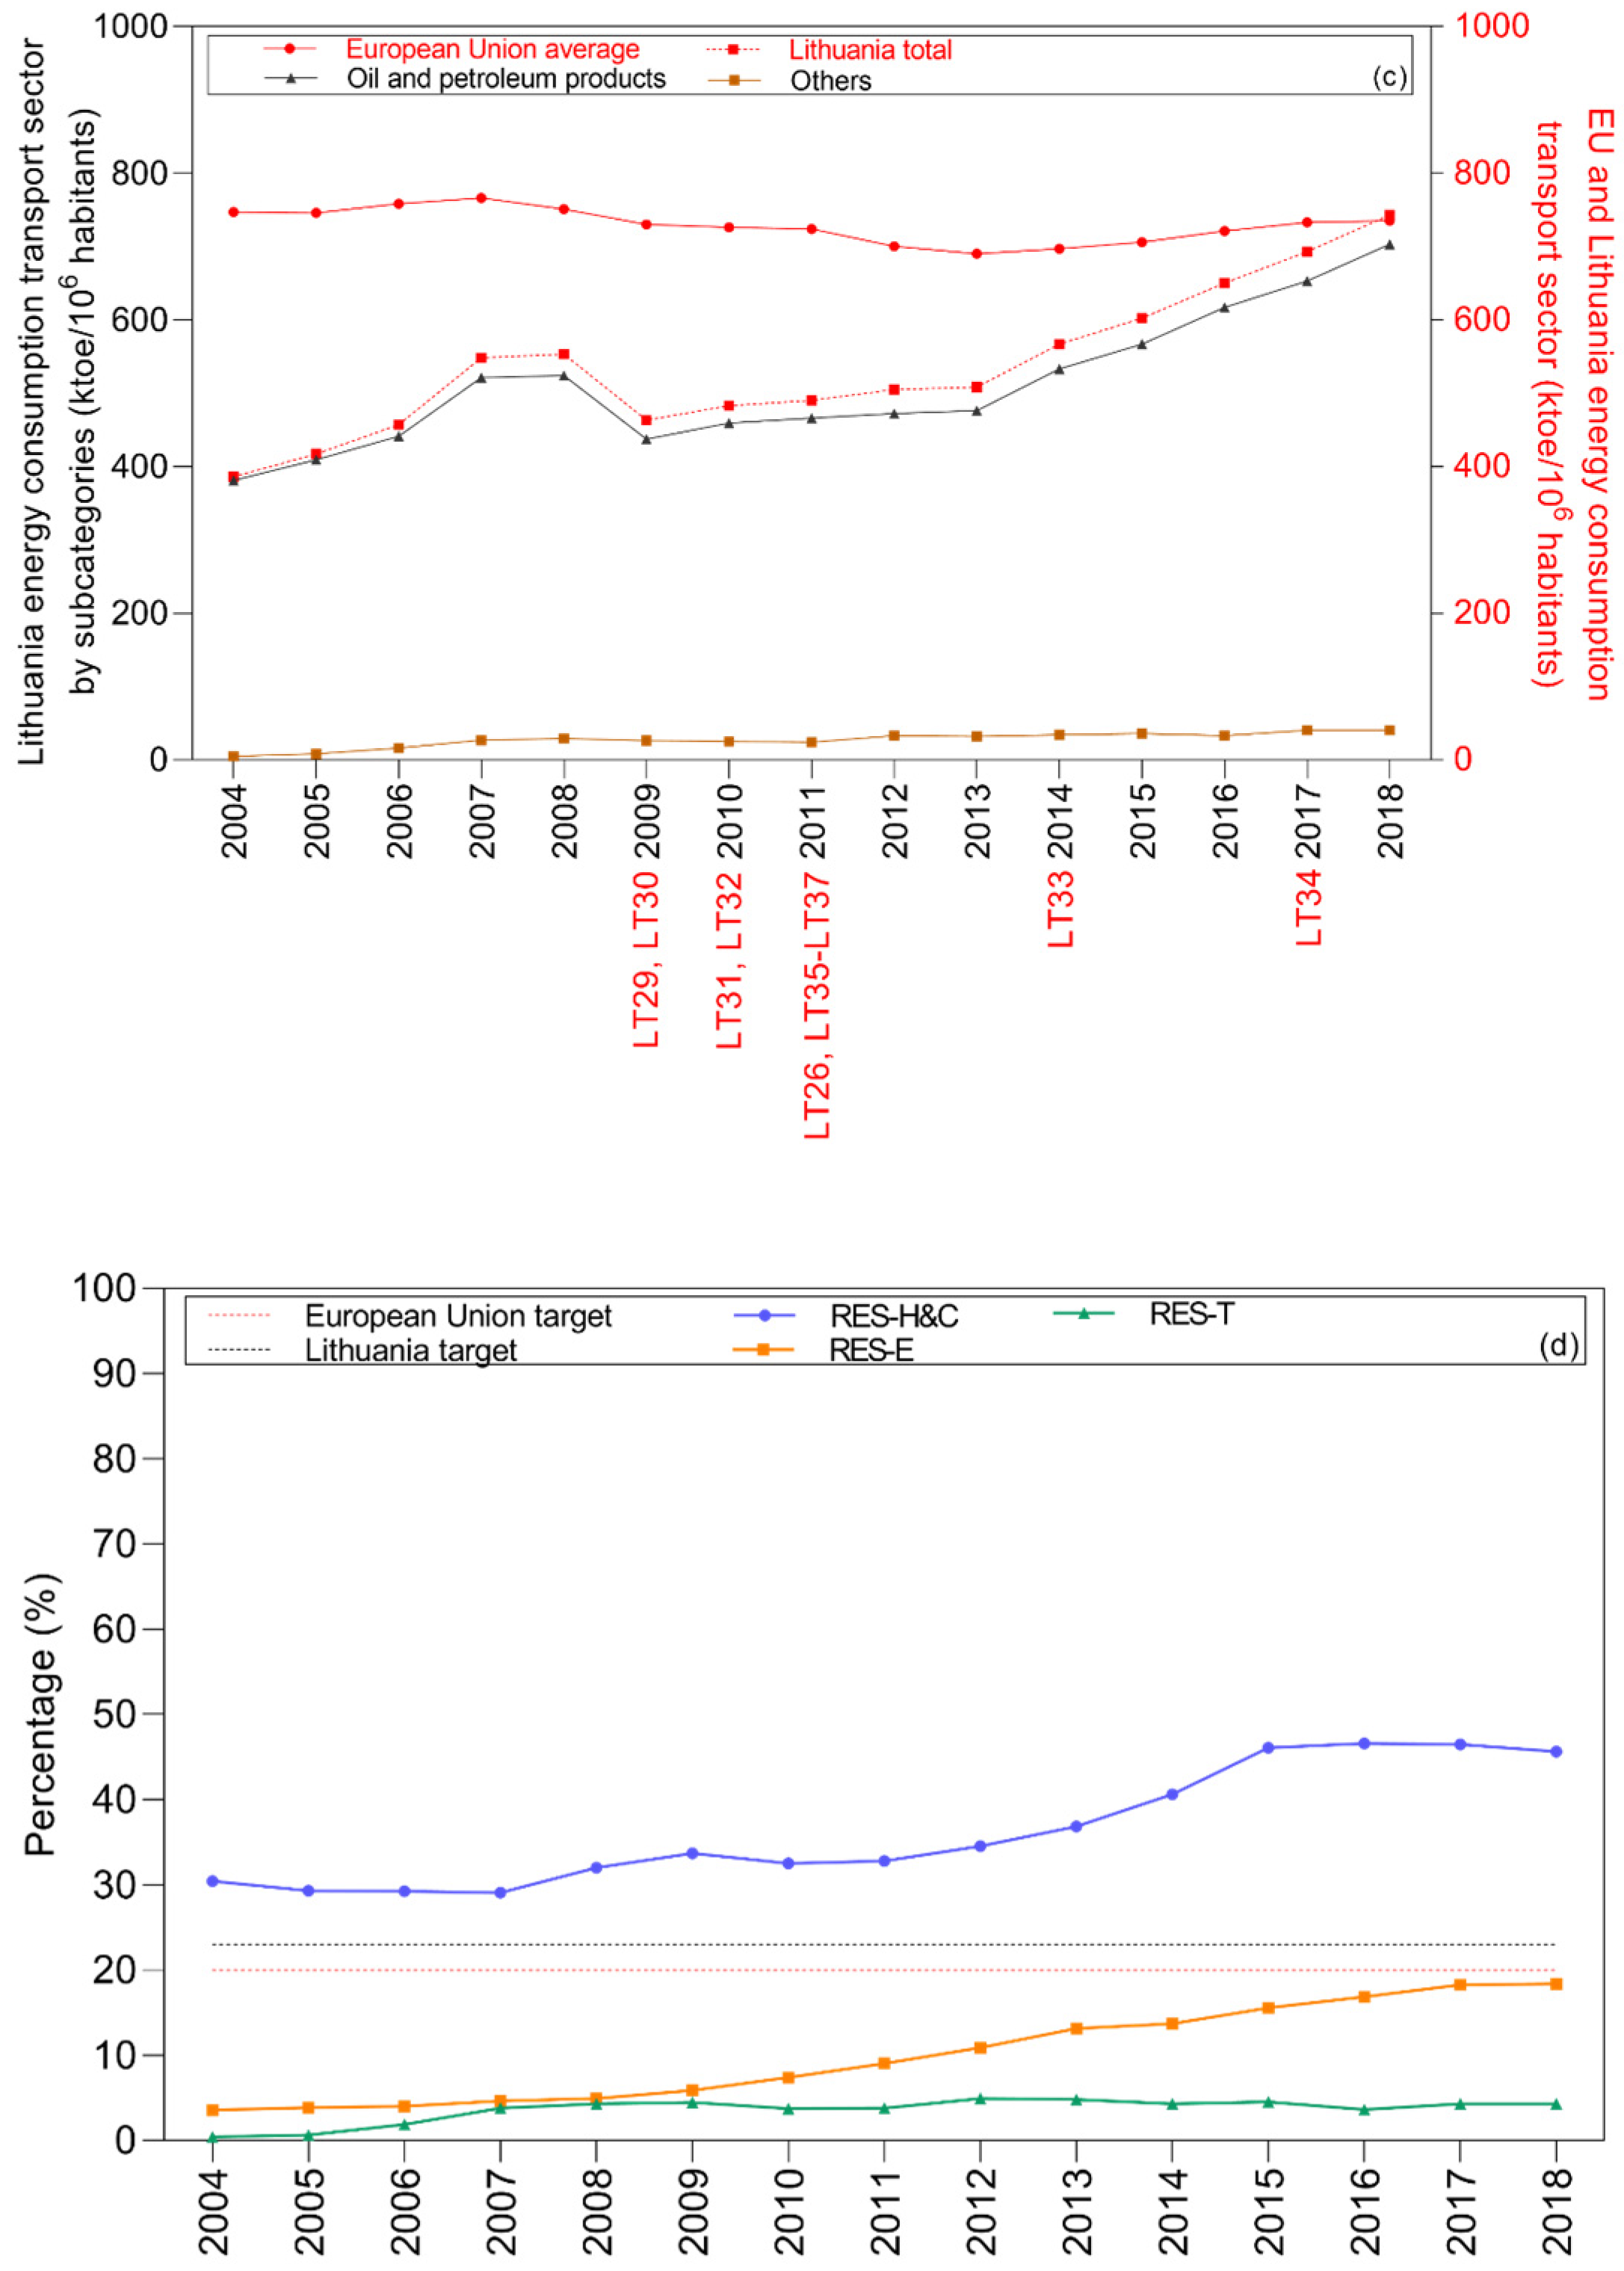
4.2.6. Lithuania
4.3. Overview
5. Conclusions and Policy Implications
Supplementary Materials
Author Contributions
Funding
Institutional Review Board Statement
Informed Consent Statement
Data Availability Statement
Acknowledgments

Conflicts of Interest
List of Abbreviations
| EES | European Energy System |
| EU | European Union |
| FQD | Fuel Quality Directive (2009/30/EC) |
| GHG | Greenhouse Gas |
| ILUC | Indirect Land Use Change |
| RE | Renewable Energy |
| RED | Renewable Energy Directive |
| RES | Renewable Energy Source |
| RES-E | Renewable Energy Source for electricity |
| RES-H&C | Renewable Energy Source for heating and cooling |
| RES-T | Renewable Energy Source for transport |
References
- OECD/IEA. Medium-Term Renewable Energy Market Report 2016: Market Analysis and Forecasts to 2021; International Energy Agency: Paris, France, 2016. [Google Scholar]
- OECD/IEA. Renewables 2017: Analysis and Forecasts to 2022; International Energy Agency: Paris, France, 2017. [Google Scholar]
- Sovacool, B.K. How long will it take? Conceptualizing the temporal dynamics of energy transitions. Energy Res. Soc. Sci. 2016, 13, 202–215. [Google Scholar] [CrossRef]
- Hisschemöller, M.; Sioziou, I. Boundary organisations for resource mobilisation: Enhancing citizens’ involvement in the Dutch energy transition. Environ. Politics 2013, 22, 792–810. [Google Scholar] [CrossRef]
- REN21. Renewables 2018 Global Status Report; REN21 Secretariat: Paris, France, 2018. [Google Scholar]
- Ruotsalainen, J.; Karjalainen, J.; Child, M.; Heinonen, S. Culture, values, lifestyles, and power in energy futures: A critical peer-to-peer vision for renewable energy. Energy Res. Soc. Sci. 2017, 34, 231–239. [Google Scholar] [CrossRef]
- Gui, E.M.; MacGill, I. Typology of future clean energy communities: An exploratory structure, opportunities, and challenges. Energy Res. Soc. Sci. 2018, 35, 94–107. [Google Scholar] [CrossRef]
- Gürtler, K.; Postpischil, R.; Quitzow, R. The dismantling of renewable energy policies: The cases of Spain and the Czech Republic. Energy Policy 2019, 133, 110881. [Google Scholar] [CrossRef]
- European Union. The Future of Road Transport; Publications Office of the European Union: Luxembourg, 2019. [Google Scholar]
- European Commission. Biofuels; European Commission: Brussels, Belgium, 2020; Available online: https://ec.europa.eu/energy/topics/renewable-energy/biofuels/overview_en (accessed on 18 July 2021).
- European Commission. Communication from the Commission to the European Parliament, the European Council, the Council, the European Economic and Social Committee, the Committee of the Regions and the European Investment Bank COM/2018/773 A Clean Planet for All a European Strategic Long-Term Vision for a Prosperous, Modern, Competitive and Climate Neutral Economy; European Commission: Brussels, Belgium, 2019. [Google Scholar]
- International Renewable Energy Agency. Advanced Biofuels. What Holds Them Back? International Renewable Energy Agency: Abu Dhabi, United Arab Emirates, 2019. [Google Scholar]
- Bórawski, P.; Bełdycka-Bórawska, A.; Szymańska, E.J.; Jankowski, K.J.; Dubis, B.; Dunn, J.W. Development of renewable energy sources market and biofuels in The European Union. J. Clean. Prod. 2019, 228, 467–484. [Google Scholar] [CrossRef]
- Marques, A.C.; Fuinhas, J.A. Are public policies towards renewables successful? Evidence from European countries. Renew. Energy 2012, 44, 109–118. [Google Scholar] [CrossRef]
- Papież, M.; Śmiech, S.; Frodyma, K. Determinants of renewable energy development in the EU countries. A 20-year perspective. Renew. Sustain. Energy Rev. 2018, 91, 918–934. [Google Scholar] [CrossRef]
- Tutak, M.; Brodny, J. Renewable energy consumption in economic sectors in the EU-27. The impact on economics, environment and conventional energy sources. A 20-year perspective. J. Clean. Prod. 2022, 345, 131076. [Google Scholar] [CrossRef]
- Brodny, J.; Tutak, M.; Bindzár, P. Assessing the Level of Renewable Energy Development in the European Union Member States. A 10-Year Perspective. Energies 2021, 14, 3765. [Google Scholar] [CrossRef]
- Asha, S.; Thomas, C.; Calliope, P. Policy review for biomass value chains in the European bioeconomy. Glob. Transit. 2021, 3, 13–42. [Google Scholar] [CrossRef]
- Calliope, P.; Sonja, G.; Paraskevi, K.; Stavros, P.; Yuri, K.; Michal, W.; Kyriakos, M.; Philippe, M.; Ingvar, L. Advanced biofuels to decarbonise European transport by 2030: Markets, challenges, and policies that impact their successful market uptake. Energy Strategy Rev. 2021, 34, 100633. [Google Scholar] [CrossRef]
- Mai-Moulin, T.; Hoefnagels, R.; Grundmann, P.; Junginger, M. Effective sustainability criteria for bioenergy: Towards the implementation of the european renewable directive II. Renew. Sustain. Energy Rev. 2021, 138, 110645. [Google Scholar] [CrossRef]
- Eurostat. EU’s Energy Import Dependency Decreased in 2020; Eurostat: Luxembourg, 2022. Available online: https://ec.europa.eu/eurostat/web/products-eurostat-news/-/EDN-20220209-1 (accessed on 20 January 2022).
- John Matthew, C.; John, C.; Brian, Ó.G. Modelling national policy making to promote bioenergy in heat, transport and electricity to 2030–Interactions, impacts and conflicts. Energy Policy 2018, 123, 579–593. [Google Scholar] [CrossRef]
- Cotella, G.; Crivello, S.; Karatayev, M. Chapter 2-European Union Energy Policy Evolutionary Patterns. In Low-Carbon Energy Security from a European Perspective; Academic Press: Cambridge, MA, USA, 2016; pp. 13–42. [Google Scholar] [CrossRef]
- Danyel, R.; Mischa, B. Policy differences in the promotion of renewable energies in the EU member states. Energy Policy 2004, 32, 843–849. [Google Scholar] [CrossRef]
- European Commission. Communication from the Commission Energy for the Future Renewable Sources of Energy-White Paper for a Community Strategy and Action Plan COM(97)599; European Commission: Brussels, Belgium, 1997. [Google Scholar]
- Haas, R.; Eichhammer, W.; Huber, C.; Langniss, O.; Lorenzoni, A.; Madlener, R.; Menanteau, P.; Morthorst, P.E.; Martins, A.; Oniszk, A.; et al. How to promote renewable energy systems successfully and effectively. Energy Policy 2004, 32, 833–839. [Google Scholar] [CrossRef]
- Jefferson, M. Chapter 12. Energy Policies for Sustainable Development. In World Energy Assessment: Energy and the Challenge of Sustainability; United Nations Development Programme: New York, NY, USA, 2000. [Google Scholar]
- Mitchell, C. The Political Economy of Sustainable Energy. In Energy, Climate and the Environment; Elliott, D., Wood, G., Eds.; Palgrave Macmillan UK: London, UK, 2008. [Google Scholar]
- United Nations Development Programme. Promotion of Wind Energy: Lessons Learned from International Experience and UNDP-GEF Projects; United Nations Development Programme: New York, NY, USA, 2008. [Google Scholar]
- European Commission. Commision Decision of 30 June 2009 Establishing a Template for National Renewable Energy Action Plans under Directive 2009/28/EC of the European Parliament and of the Council; European Commission: Brussels, Belgium, 2009. [Google Scholar]
- European Commission. Knowledge Centre for Bioeconomy; European Commission: Brussels, Belgium, 2020; Available online: https://knowledge4policy.ec.europa.eu/bioeconomy_en (accessed on 9 September 2021).
- European Parliament and of the Council. Directive 2009/28/EC of 23 April 2009 on the promotion of the use of energy from renewable sources and amending and subsequently repealing Directives 2001/77/EC and 2003/30/EC. Off. J. Eur. Union 2009, 140, 16–47. [Google Scholar]
- European Parliament and of the Council. Directive (EU) 2015/1513 of 9 September 2015 amending Directive 98/70/EC relating to the quality of petrol and diesel fuels and amending Directive 2009/28/EC on the promotion of the use of energy from renewable sources. Off. J. Eur. Union 2015, 239, 1–29. [Google Scholar]
- European Parliament and of the Council. Directive (EU) 2018/2001 of 11 December 2018 on the promotion of the use of energy from renewable sources. Off. J. Eur. Union 2018, 328, 82–209. [Google Scholar]
- Elena, L.; Isabella, D.O.; Alessia, P.; Linda, T.; Martina, P.; Polo López, C.; Giulia, G. Photovoltaic technologies in historic buildings and protected areas: Comprehensive legislative framework in Italy and Switzerland. Energy Policy 2022, 161, 112772. [Google Scholar] [CrossRef]
- European Parliament and of the Council. Commission Implementing Regulation (EU) 2020/1294 of 15 September 2020 on the Union renewable energy financing mechanism. Off. J. Eur. Union 2020, 303, 1–17. [Google Scholar]
- European Commission. Denmark: Overall Summary; European Commission: Brussels, Belgium, 2012; Available online: http://www.res-legal.eu/search-by-country/denmark/ (accessed on 17 August 2021).
- Danish Energy Agency. Denmark’s Energy and Climate Outlook 2019-Baseline Scenario Projection Towards 2030 With Existing Measures (Frozen Policy); Danish Energy Agency: Copenhagen, Denmark, 2019; pp. 1–87.
- The Danish Energy Agency. The Danish Energy Model Innovative, Efficient and Sustainable; The Danish Energy Agency: Copenhagen, Denmark, 2021.
- OECD. Renewable Energy (Indicator); OECD: Paris, France, 2021. [Google Scholar]
- European Commission. Ireland: Overall Summary; European Commission: Brussels, Belgium, 2012; Available online: http://www.res-legal.eu/en/search-by-country/ireland/ (accessed on 17 August 2021).
- Energy Institute. Our Energy History; Energy Institute: London, UK, 2021. [Google Scholar]
- OECD/IEA. Energy Policies of EIA Countries-Ireland 2019 Review; European Commission: Brussels, Belgium, 2019. [Google Scholar]
- European Commission. Netherlands: Overall Summary; European Commission: Brussels, Belgium, 2012; Available online: http://www.res-legal.eu/en/search-by-country/netherlands/ (accessed on 17 August 2021).
- OECD/IEA. The Netherlands 2020-Energy Policy Review; European Commission: Brussels, Belgium, 2020. [Google Scholar]
- European Commission. Estonia: Overall Summary; European Commission: Brussels, Belgium, 2012; Available online: http://www.res-legal.eu/search-by-country/estonia/summary/ (accessed on 17 August 2021).
- OECD/IEA. Energy Policies of EIA Countries-Estonia 2019 Review; OECD: Paris, France, 2019. [Google Scholar]
- European Commission. Latvia: Overall Summary; European Commission: Brussels, Belgium, 2012; Available online: http://www.res-legal.eu/search-by-country/latvia/ (accessed on 17 August 2021).
- European Commission. Lithuania: Overall Summary; European Commission: Brussels, Belgium, 2012; Available online: http://www.res-legal.eu/search-by-country/lithuania/ (accessed on 17 August 2021).


| Review of Policies/Support Schemes Electricity | Review of Policies/Support Schemes: Heating and Cooling | Review of Policies/Support Schemes: Transport | Effect of the Policies in the Energy Consumption and Supply | Source |
|---|---|---|---|---|
| √ Premium tariff, feed-in tariff, net-metering, loan, sliding feed-in premium, subsidies, tax regulation mechanisms, tenders | √ Premium tariff, feed-in tariff, subsidies, tax regulation mechanisms, loan | √ Biofuel quotas, premium tariff, tax regulation, mechanisms, subsidies | √ Share of energy from renewable sources, share of energy from renewable sources in gross electricity consumption, share of energy from renewable sources for heating and cooling, total RES, gross energy consumption total energy supply in the electricity & heat sector, final energy consumption in the transport sector | This study |
| − | − | √/✕ Loans, premium tariff, tax regulation, mechanisms, subsidies | - | [19] |
| - | - | - | √/✕ Share of energy from renewable sources, share of energy from renewable sources for heating and cooling, final energy consumption in the transport sector | [22] |
| - | - | - | √/✕ Share of energy from renewable sources in gross energy consumption, national energy efficiency targets, energy efficiency progress | [23] |
| Sector | Support Scheme | Denmark | Ireland | Netherlands | Estonia | Latvia | Lithuania |
|---|---|---|---|---|---|---|---|
| Electricity | Premium tariff | Yes | - | Yes | Yes | - | - |
| Feed-in tariff | - | Yes | - | - | Yes | Yes | |
| Net-metering | Yes | - | Yes | - | Yes | Yes | |
| Loan | Yes | - | Yes | - | - | Yes | |
| Sliding feed-in premium | - | - | - | - | - | - | |
| Subsidy | - | Yes | - | - | - | Yes | |
| Tax regulation mechanisms | - | - | Yes | - | - | Yes | |
| Tenders | Yes | - | Yes | Yes | - | Yes | |
| Heating and cooling | Premium tariff | Yes | - | Yes | - | - | Yes |
| Feed-in tariff | - | - | - | - | - | Yes | |
| Subsidy | - | Yes | Yes | Yes | - | Yes | |
| Loan | - | - | Yes | - | - | Yes | |
| Tax regulation mechanisms | Yes | Yes | Yes | - | Yes | Yes | |
| Transport | Biofuel quota | Yes | Yes | Yes | - | Yes | Yes |
| Premium tariff | Yes | - | - | - | - | - | |
| Tax regulation mechanisms | Yes | - | Yes | - | Yes | Yes | |
| Subsidy | - | - | - | Yes | - | Yes | |
| Total amount of schemes | 9 | 5 | 11 | 4 | 5 | 14 |
| Country | Legal Source Online | Website |
|---|---|---|
| Denmark | Retsinformation—State legal information system | https://www.retsinformation.dk/ (accessed on 8 June 2020) |
| Ireland | Electronic Irish Statute Book (eISB)—Government of Ireland | http://www.irishstatutebook.ie/ (accessed on 8 June 2020) |
| Netherlands | Overheid—Ministry of the Interior | https://wetten.overheid.nl/zoeken (accessed on 8 June 2020) |
| Estonia | Riigi Teataja—State Chancellery, Ministry of Justice | https://www.riigiteataja.ee/ (accessed on 8 June 20280) |
| Latvia | Latvijas Vēstnesis—Official Gazette of the Republic of Latvia | https://www.vestnesis.lv/ (accessed on 8 June 2020) |
| Lithuania | Teisės Aktų Registras—Office of the Seimas of the Republic of Lithuania | https://www.e-tar.lt/ (accessed on 8 June 2020) |
| Country | Electricity | Heating and Cooling | Transport | Number of Sectors with Achieved Targets |
|---|---|---|---|---|
| Denmark | Yes | Yes | No | 2 out of 3 |
| Ireland | Yes | No | No | 1 out of 3 |
| Netherlands | Yes | No | No | 1 out of 3 |
| Estonia | No | Yes | No | 1 out of 3 |
| Latvia | Yes | Yes | No | 2 out of 3 |
| Lithuania | No | Yes | No | 1 out of 3 |
Publisher’s Note: MDPI stays neutral with regard to jurisdictional claims in published maps and institutional affiliations. |
© 2022 by the authors. Licensee MDPI, Basel, Switzerland. This article is an open access article distributed under the terms and conditions of the Creative Commons Attribution (CC BY) license (https://creativecommons.org/licenses/by/4.0/).
Share and Cite
Nasiri, E.; Rocha-Meneses, L.; Inayat, A.; Kikas, T. Impact of Policy Instruments in the Implementation of Renewable Sources of Energy in Selected European Countries. Sustainability 2022, 14, 6314. https://0-doi-org.brum.beds.ac.uk/10.3390/su14106314
Nasiri E, Rocha-Meneses L, Inayat A, Kikas T. Impact of Policy Instruments in the Implementation of Renewable Sources of Energy in Selected European Countries. Sustainability. 2022; 14(10):6314. https://0-doi-org.brum.beds.ac.uk/10.3390/su14106314
Chicago/Turabian StyleNasiri, Elnaz, Lisandra Rocha-Meneses, Abrar Inayat, and Timo Kikas. 2022. "Impact of Policy Instruments in the Implementation of Renewable Sources of Energy in Selected European Countries" Sustainability 14, no. 10: 6314. https://0-doi-org.brum.beds.ac.uk/10.3390/su14106314