Article

The Impact of a City on Its Environment: The Prism of Demography and Selected Environmental and Technical Aspects Based on the Case of Major Lower Silesian Cities

by
Alina Kulczyk-Dynowska
* and
Agnieszka Stacherzak
Department of Spatial Economy, Wrocław University of Environmental and Life Sciences, Grunwaldzka 53, 50-357 Wrocław, Poland
*
Author to whom correspondence should be addressed.
Sustainability 2022, 14(11), 6393; https://0-doi-org.brum.beds.ac.uk/10.3390/su14116393
Submission received: 31 March 2022 / Revised: 17 May 2022 / Accepted: 21 May 2022 / Published: 24 May 2022
(This article belongs to the Special Issue Urban Economics, City Development and Future Social Challenges)

Abstract

:
This article discusses the problem of the impact exerted by cities on the surrounding space. As an example, the Lower Silesia region was selected, characterized by agricultural, industrial and natural areas present in its close proximity. Four major cities and the surrounding municipalities (30 objects in total) were covered by the observation. The research was carried out in the period of 1995–2020 and was based on the data provided by Statistics Poland—Local Date Bank. Statistical tools were used which allowed for obtaining the results, enabling inference and the formulation of recommendations. An analytical method was applied which included the linear ordering method and synthetic development of measures. This resulted in preparing rankings of the analyzed objects (municipalities) and making the respective comparisons. The obtained results indicate that a continuously deepening imbalance in the distribution of the demographic potential is observed in the analyzed region. Although the capital city maintained the number of residents at a constant level, the population of the other analyzed cities decreased. Depopulation affected almost half of the 30 analyzed municipalities, and it is a serious problem in striving for the sustainable development of the region. The problem was exacerbated by the absence of a correlation between the demographic potential growth and the increase in the synthetic development measure value which characterized the water and sewage system. This means that the infrastructure preventing anthropopressure and providing basic services directly influencing the quality of life is developing at a different pace than the increase in the number of residents. The above indicates the need for the immediate development of a conscious settlement policy for the region of Lower Silesia. The obtained results constitute a warning addressed to those responsible for the development of spatial policy covering the cities and the surrounding areas, including rural areas.

1. Introduction

The Lower Silesia region, located in southwestern Poland and bordering the Czech Republic and the Federal Republic of Germany, is geographically almost identical to the Lower Silesian Voivodship. The artificial administrative delimitation of the region, designating 1 of the 16 Polish voivodships, therefore coincides with the division, resulting from natural features. One metropolis can be indicated in the Lower Silesian Voivodship: Wrocław, the capital of the region, and three cities of supra-local importance. They are Jelenia Góra, Legnica and Wałbrzych.
It should be explained that in Poland, despite the 16 existing voivodships, there are 18 voivodship capital cities. In the Kujawsko-Pomorskie and Lubuskie Voivodships, there is a specific situation of two voivodship cities which is connected with the separation of the Voivodship Head and the Voivodship Parliament seats. The administration reform implemented in 1999 reduced the number of voivodship capital cities significantly, which was previously 49, introducing simultaneously a 3-tier administrative division: voivodships, poviats (including municipalities with poviat rights) and municipalities. The method described in the source literature was not used in selecting the group of analyzed Lower Silesian cities. The choice derived from the effects of the aforementioned reform, as a result of which Jelenia Góra, Wałbrzych and Legnica became the cities with poviat rights, and in the area of the Jelenia Góra, Wałbrzych, Legnica and Wrocław Voivodships, which functioned in the years 1975–1998, the Lower Silesia Voivodship was established with the capital in Wrocław.
Lower Silesia is characterized by diversified natural conditions. Morphologically, Lower Silesia covers mountainous, upland and lowland areas as well as inter-mountain valleys. Two national parks have been established in this area: Karkonosze National Park and Stołowe Mountains National Park [1]. It is worth emphasizing that the significant areas of the region are characterized by conditions favorable for agriculture. Numerous industrial centers are also located here. At the end of the 20th century, these centers still had a very negative impact on the environment, including the soil. Traditionally, there are five areas of ecological threat in the discussed region. Four of them are related to major cities in the region (i.e., the areas of Wrocław, Legnica, Wałbrzych and Jelenia Góra). The fifth area, Turoszów, is characterized by a different specificity and will not be included in this research [2].
Due to the nature of the Lower Silesian space, Wrocław University of Environmental and Life Sciences and the Marshal’s Office of the Lower Silesian Voivodship adopted the program “Lower Silesia. Green Valley of Food and Health” in 2016. This initiative covers activities in the following areas: science, education, business and society. It also adopts that the regional potential offers the possibility of turning it into the most competitive producer of functional food, dietary supplements, nutraceuticals and high-quality food on a global scale [3].
It is also worth noting that the content of the “CEE Investment Report: Thriving Metropolitan Cities”, published by Skanska, Colliers International and Dentons, confirms that Wrocław is an urban center worth attention. The city came third in the ranking of the most dynamically developing European cities. Only Dublin and Prague were classified higher than the capital of Lower Silesia [4].
The above points to the values and problems embedded in the voivodship, simultaneously imposing the need for performing a deliberately designed spatial management strategy. The anthropopressure associated with the above-mentioned areas of ecological threat enhances the need for examining the main urban centers located in the analyzed area.
Managing both local and regional development is not a simple process [5]. The knowledge of demographic phenomena and the available technical infrastructure come as a significant facilitation in this respect. Thus, the research goal is twofold. First, efforts were made to characterize the population changes of the major Lower Silesian cities (along with their environment). Next, an attempt was made to characterize the features reflecting the selected environmental and technical aspects related to the functioning of cities and their environment. The focuses were the water and sewage systems and the generation of solid waste. The authors have emphasized already at the beginning that the goal of the research was not to assess the efficiency of the water and sewage systems and the connected sewage treatment plants. Therefore, the commonly used measure of sewage treatment plant efficiency were not used. A detailed description of the research procedure is included in the latter part of the study.
Additionally, the following research question was formulated: does the growth rate of the analyzed systems correspond to the increase in population?
Due to the fact that the focus was on providing a comprehensive description of the cities’ functioning, the surrounding municipalities were also included in the study. This decision was dictated by the desire to analyze the areas located in the influence zone of the phenomenon called “urban sprawl”. As a result, the research area covered 30 municipalities, which included 4 urban municipalities of the major cities and 26 municipalities which surround them. Due to the specificity of the research problem, a long-term observation period was covered; thus, the years 1995–2020 were selected. The data from Statistics Poland were used [6].

2. Balancing the Development of a City and Its Environment

The need to balance the development process is indisputable and concerns all aspects of development, including local development [7] and the development of urban policy [8,9,10,11]. Climate change is observed all over the world and, for this important reason at least, the awareness of taking advantage of space remains the duty of every society [12,13,14].
The source literature offers a great abundance of studies addressing the problem of anthropopressure exerted on the natural environment. Efforts have been made to recognize thoroughly both the historical aspects [15] and the current problems [16]. Professionals know that the research analyzing humans’ impact on the environment cannot be limited to the areas presenting high natural value alone or to covering these problems in an even narrower way by focusing exclusively on the areas under legal protection. Indeed, the anthropopressure in naturally valuable areas poses an extensive burden for the environment. However, this does not mean that the ability to experience anthropopressure is restricted only to, for example, national parks [17,18,19]. Cities perform various functions, such as administrative, industrial, commercial, transport, tourist, cultural and educational ones [20]. Therefore, they become a cluster of people aggregating pressure on the environment. For this reason, it is necessary to emphasize clearly and, at the same time, to disseminate information among the local communities that anthropopressure significantly affects the functioning conditions of both non-urban and urban areas [21].
The uncontrolled development of cities observed in the suburbs or the adjacent rural areas results in many different negative consequences. It not only causes an irreversible loss of agricultural production capacity but also degrades the rural landscape and exposes municipalities affected by the phenomenon of “urban sprawl” to their technical infrastructure overload and, as a consequence, brings about the need to spend funds on their expansion. The final effect of poor spatial management and uncontrolled urbanization is always reflected in the lower life quality of the residents. Ultimately, it is them who feel the excessive—and yet self-induced—anthropopressure [22].
Urban sprawl is a global problem [23]. Having in mind that the greater part of the world population already lives in urban areas [24] and that the phenomenon of population increase will continue intensifying [25], the interest in the development of the areas surrounding the region’s major cities seems natural. As it is known that in Europe, the greatest problem with urban sprawl occurs in the densely populated, intensively developing areas characterized by the fast pace of economic growth [26,27], Lower Silesia, being one of the leaders of the Polish regions, was selected as the research area.
Striving for sustainable development requires the adoption of a deliberately designed ecological policy, which is based on diagnosing the essential ecological problems characteristic for a given territory. The technical infrastructure indispensable to servicing new residents, who immediately report their demand for the services required in everyday existence, appears to be the absolute basis for preventing anthropopressure resulting from population growth.
It is worth noting that among the Sustainable Development Goals, clean water and sanitation is listed at position six [28].

3. Methodological Remarks

The first stage of the conducted research was devoted to the library query. The research procedure began with the identification of the municipalities surrounding the major cities of the Lower Silesian Voivodship. The focus was on the first suburban zone. Although this research path is obvious for smaller urban centers, it requires explanation in the case of Wrocław. Wrocław (like Kraków, Poznań and Gdańsk) has a limited catchment area [29]. Taking the above into account, the first circle principle was also applied in the case of the analyzed metropolis, which allowed applying the same research model for all four cities.
Based on the data provided by Statistics Poland, analysis of the number of inhabitants residing in the studied municipalities covering the period of 1995–2020 was performed. The research findings were presented graphically, being separate for each of the examined cities (the program ARCGIS was used). For the distinguished municipalities, the method of participant observation and the method of direct unstructured and a very short interview with the municipal official responsible for spatial management were applied (A question was asked about the connection of the new residents with agricultural activities).
The adopted delimitation criterion of the aforementioned group of municipalities was simultaneously a rural status and over 10% population growth during the studied period.
The dynamics indices, using a constant and chain base method, were calculated. The population growth ranking was prepared (which was also used in the next stage to compare the municipal positions obtained based on the SDM). The ranking adopted that the municipalities with the highest population growth received the highest positions (i.e., they presented the most favorable situation). It should be noted that for the purposes of the population increase ranking and the synthetic development measure (SDM) calculated at a later stage of the research, it was assumed that the examined municipalities formed one cluster made up of 30 objects.
The environmental and technical aspects of a city’s functioning are related to the concept of “technical infrastructure” [30]. In light of the complexity of the aforementioned concept, the principle of limiting the research was adopted, applying the criterion of the statistical data of long-term availability and the significance of the technical infrastructure components aimed at environmental protection. As a result, the research was focused on water supply and sewage systems. In the case of both systems, the research period covered the years 1995–2020. Due to the specificity of the analyzed area, the authors focused on the extension issue of the connection system.
When justifying the selection of indicators, it should be emphasized that the source literature highlights the fact that the condition of the sewage systems in Polish rural areas is far from satisfactory [31,32,33].
“The processes of development and spatial management in rural areas, covering wide surroundings of urban agglomerations and even beyond them, despite many formal regulations take the form of spontaneous building up of scattered constructions, frequently spreading over open areas, also valuable in ecological and landscape terms” [34]. In addition, investors searching for cheap land predominantly choose the midfield locations. What is most concerning is the fact that only 37% of sewage is properly managed in Polish rural areas, and moreover, 17% of households still do not have access to safe drinking water [35]. Having the above in mind, it can be concluded that the sewage system is inadequate based on its length. If the length is not increased (i.e., new investments allowing the connection of new (chosen by the newly arrived residents not related to agriculture) and often scattered buildings have not been made), in light of many years of negligence, it is difficult to expect that the investments in water and sewage infrastructure in rural areas will be ahead of constructing residential buildings. It actually happens to be the other way around.
In the described settlement units, the problem is the lack of connections resulting from the absence of a system covering the newly developed buildings, which are very often located in areas distant from developed land [36]. Such a location is obviously unfavorable from the perspective of infrastructure costs and the municipality responsible for it. However, it is favorable from the investor’s viewpoint, who takes a short-term perspective and evaluates positively the low price of undeveloped land.
In order to highlight the pressure exerted by the inhabitants, this study was supplemented by the aspect of solid waste. Due to the limited availability of data, this research stage covered only the period of 2017–2020 and was not included in the SDM. The reason for paying attention to waste results from the fact that the demand for its collection is reported at the place of its generation (and thus the actual place of residence). Polish legislation imposes the obligation to register residence. However, in practice, many people do not abide by it. (Polish citizens are not penalized for failure to comply with the obligation to register a residence.) Therefore, it should be borne in mind that some residents of the analyzed municipalities were not included in the official data provided by Statistics Poland (based on the place of residence and resulting from its registration obligation).
Statistical tools were used which allowed for obtaining the results, enabling inference and the formulation of recommendations. An analytical method was applied which included the linear ordering method and synthetic development measures.
The SDM is a statistical tool that allows including many explanatory variables into one synthetic value. The use of SDM made it possible to construct rankings of the examined objects (municipalities) and make comparisons.
The SDM of a water supply and sewage system was constructed. (It should be emphasized that the measure does not aspire to represent a substitute indicator describing all the components of the sustainable development process). As already mentioned above, it was decided that all the examined municipalities constituted one cluster of objects.
The construction of the SDM began with defining the variables which were subject to the process of unitarization performed simultaneously for the entire research period [37]. The desire to perform observations in a long-term perspective was adopted as a priority. This decision forced some concessions regarding the construction of the applied measure. The limited availability of statistical data at the level of municipalities naturally and indisputably limited the research possibilities but did not make them impossible (the authors are aware of certain imperfections).
Using the standardized sums method, the SDM was constructed with the system of weights (a common development pattern was adopted for the entire period under study). The above allowed for determining the ranking positions of the municipalities regarding the SDM in each analyzed year and making comparisons of changes in the positions taken by the particular municipalities.
For the purpose of determining the SDM, the following characteristics were defined:
1.
The sewage system spatial availability ratio (SAsewage):
SAsewage = length   of   the   sewage   system   in   km area   of   the   municipality   in   km 2
2.
The sewerage system demographic burden ratio (Lsevage):
Osewage = length   of   the   sewage   system   in   km population   of   the   municipality × 100
3.
The water supply system spatial availability ratio (SAwater):
SAwater = length   of   the   water   supply   system   in   km area   of   the   municipality   in   km 2
4.
The water supply system demographic burden ratio (Lwater):
Lwater = length   of   the   water   supply   system   in   km population   of   the   municipality
The aforementioned ratios were calculated based on the data provided by Statistics Poland. The nature of the indicators allowed for considering them as stimulants without a veto threshold (i.e., the municipalities with high ratio values received the highest-ranking positions). After calculating the ratio values, unitarization was performed according to the following formula:
Z jit = X jit minX jit maxX jit minX jit
where X is the feature value, j is the variable j (where j = (1, …, p)), i is the object (municipality) where i = (1, …., N), N = 30, and t is the time (year) where t = (1995, 1996, …, 2020).
As a result of unitarization, the values in the range [0.1] were obtained. Since all the variables took the form of stimulants, their preference function was not standardized. It was decided to choose the standardized sum method as the basis for the SDM [38]. Consequently, Equation (6) was used:
SDM it = 1 p j = 1 p z jit ( 1 = 1 , , N )   ( t = 1995 , , 2020 )
where SDM is the value of the non-model synthetic measure in an object (municipality) and p is the number of features.
In the resulting SDM, the highest value is synonymous with the best position. Ultimately, the analyzed municipalities received positions, which allowed for the subsequent comparisons between them (in the SDM ranking) and with the ranking created in terms of the population percentage increase.
The tables presented in the text cover only the first and last year of the study. This decision resulted from the need to maintain the clarity of the tables. The Spearman’s correlation [39] between the positions, resulting from the SDM ranking and the level of population growth, was also calculated. This stage required applying Equation (7):
rs = 1 6 i = 1 N d i 2 N ( N 2 1 )
where di determines the differences between the ranks (positions) of the corresponding SDM values and the ranks (positions) resulting from the population growth and N = 30.
The results were interpreted as follows:
  • |0.00–0.3| = weak correlation;
  • |0.31–0.6| = moderate correlation;
  • |0.61–1.0| = strong correlation.

4. Results

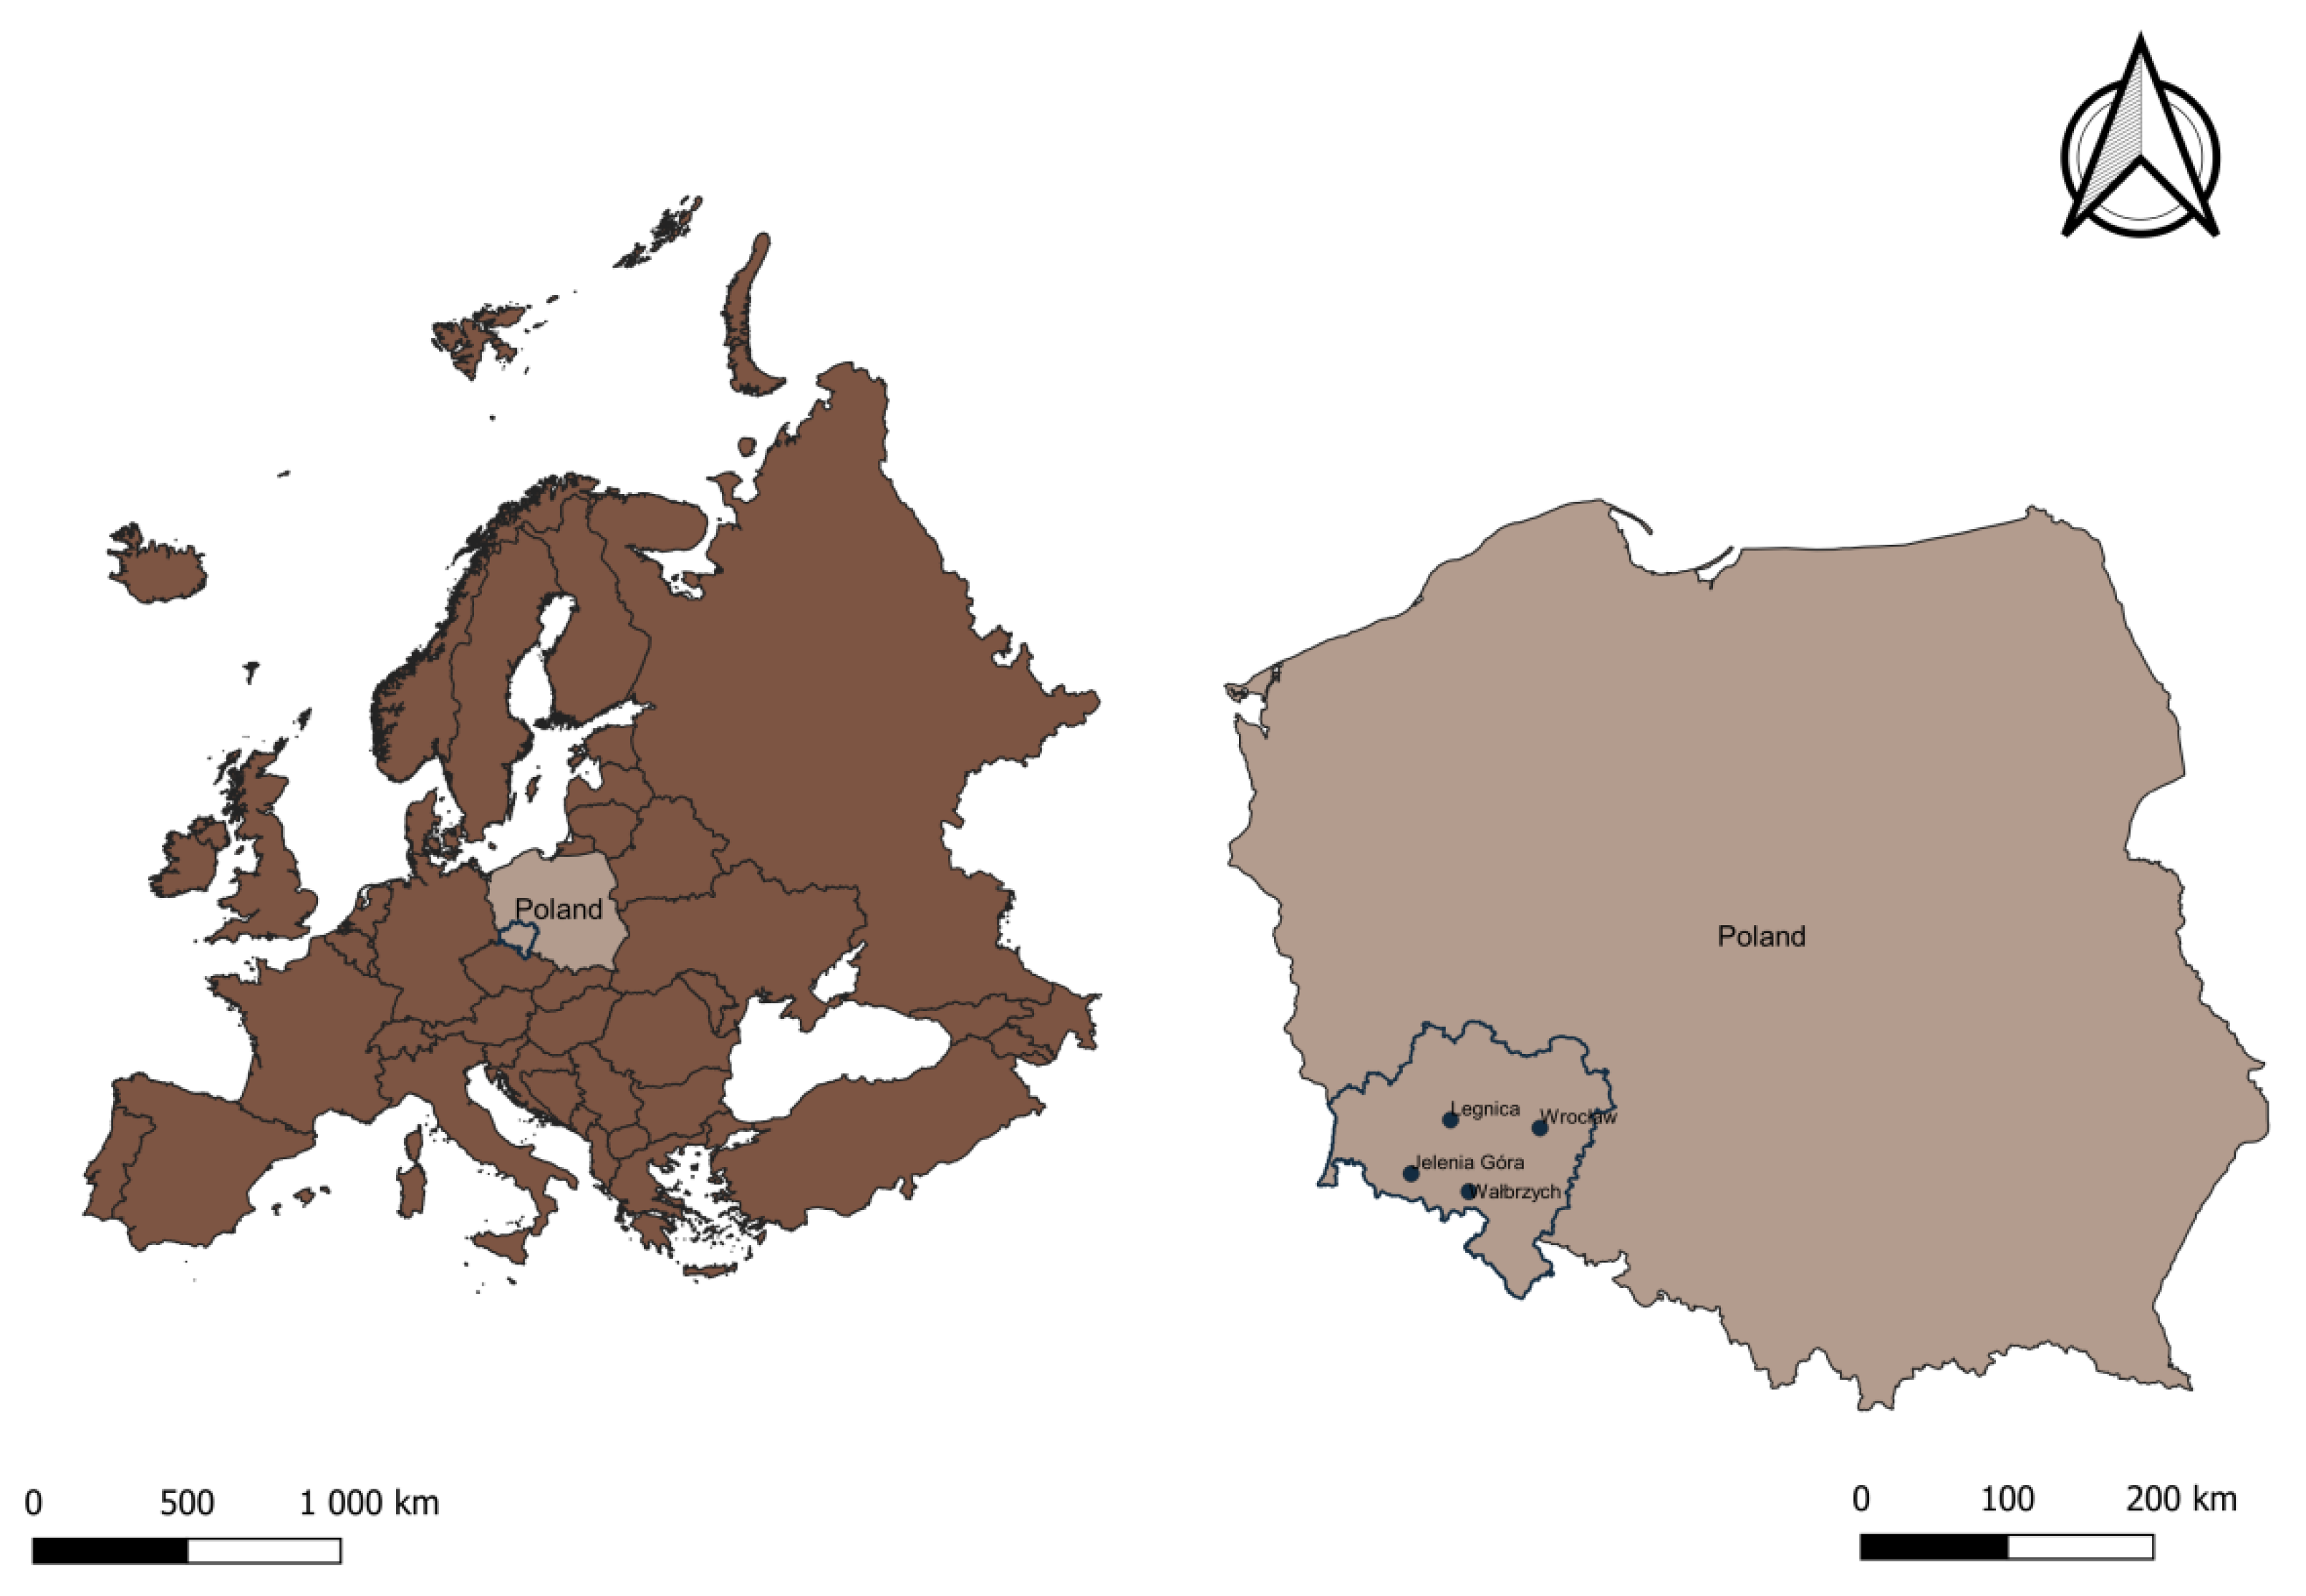
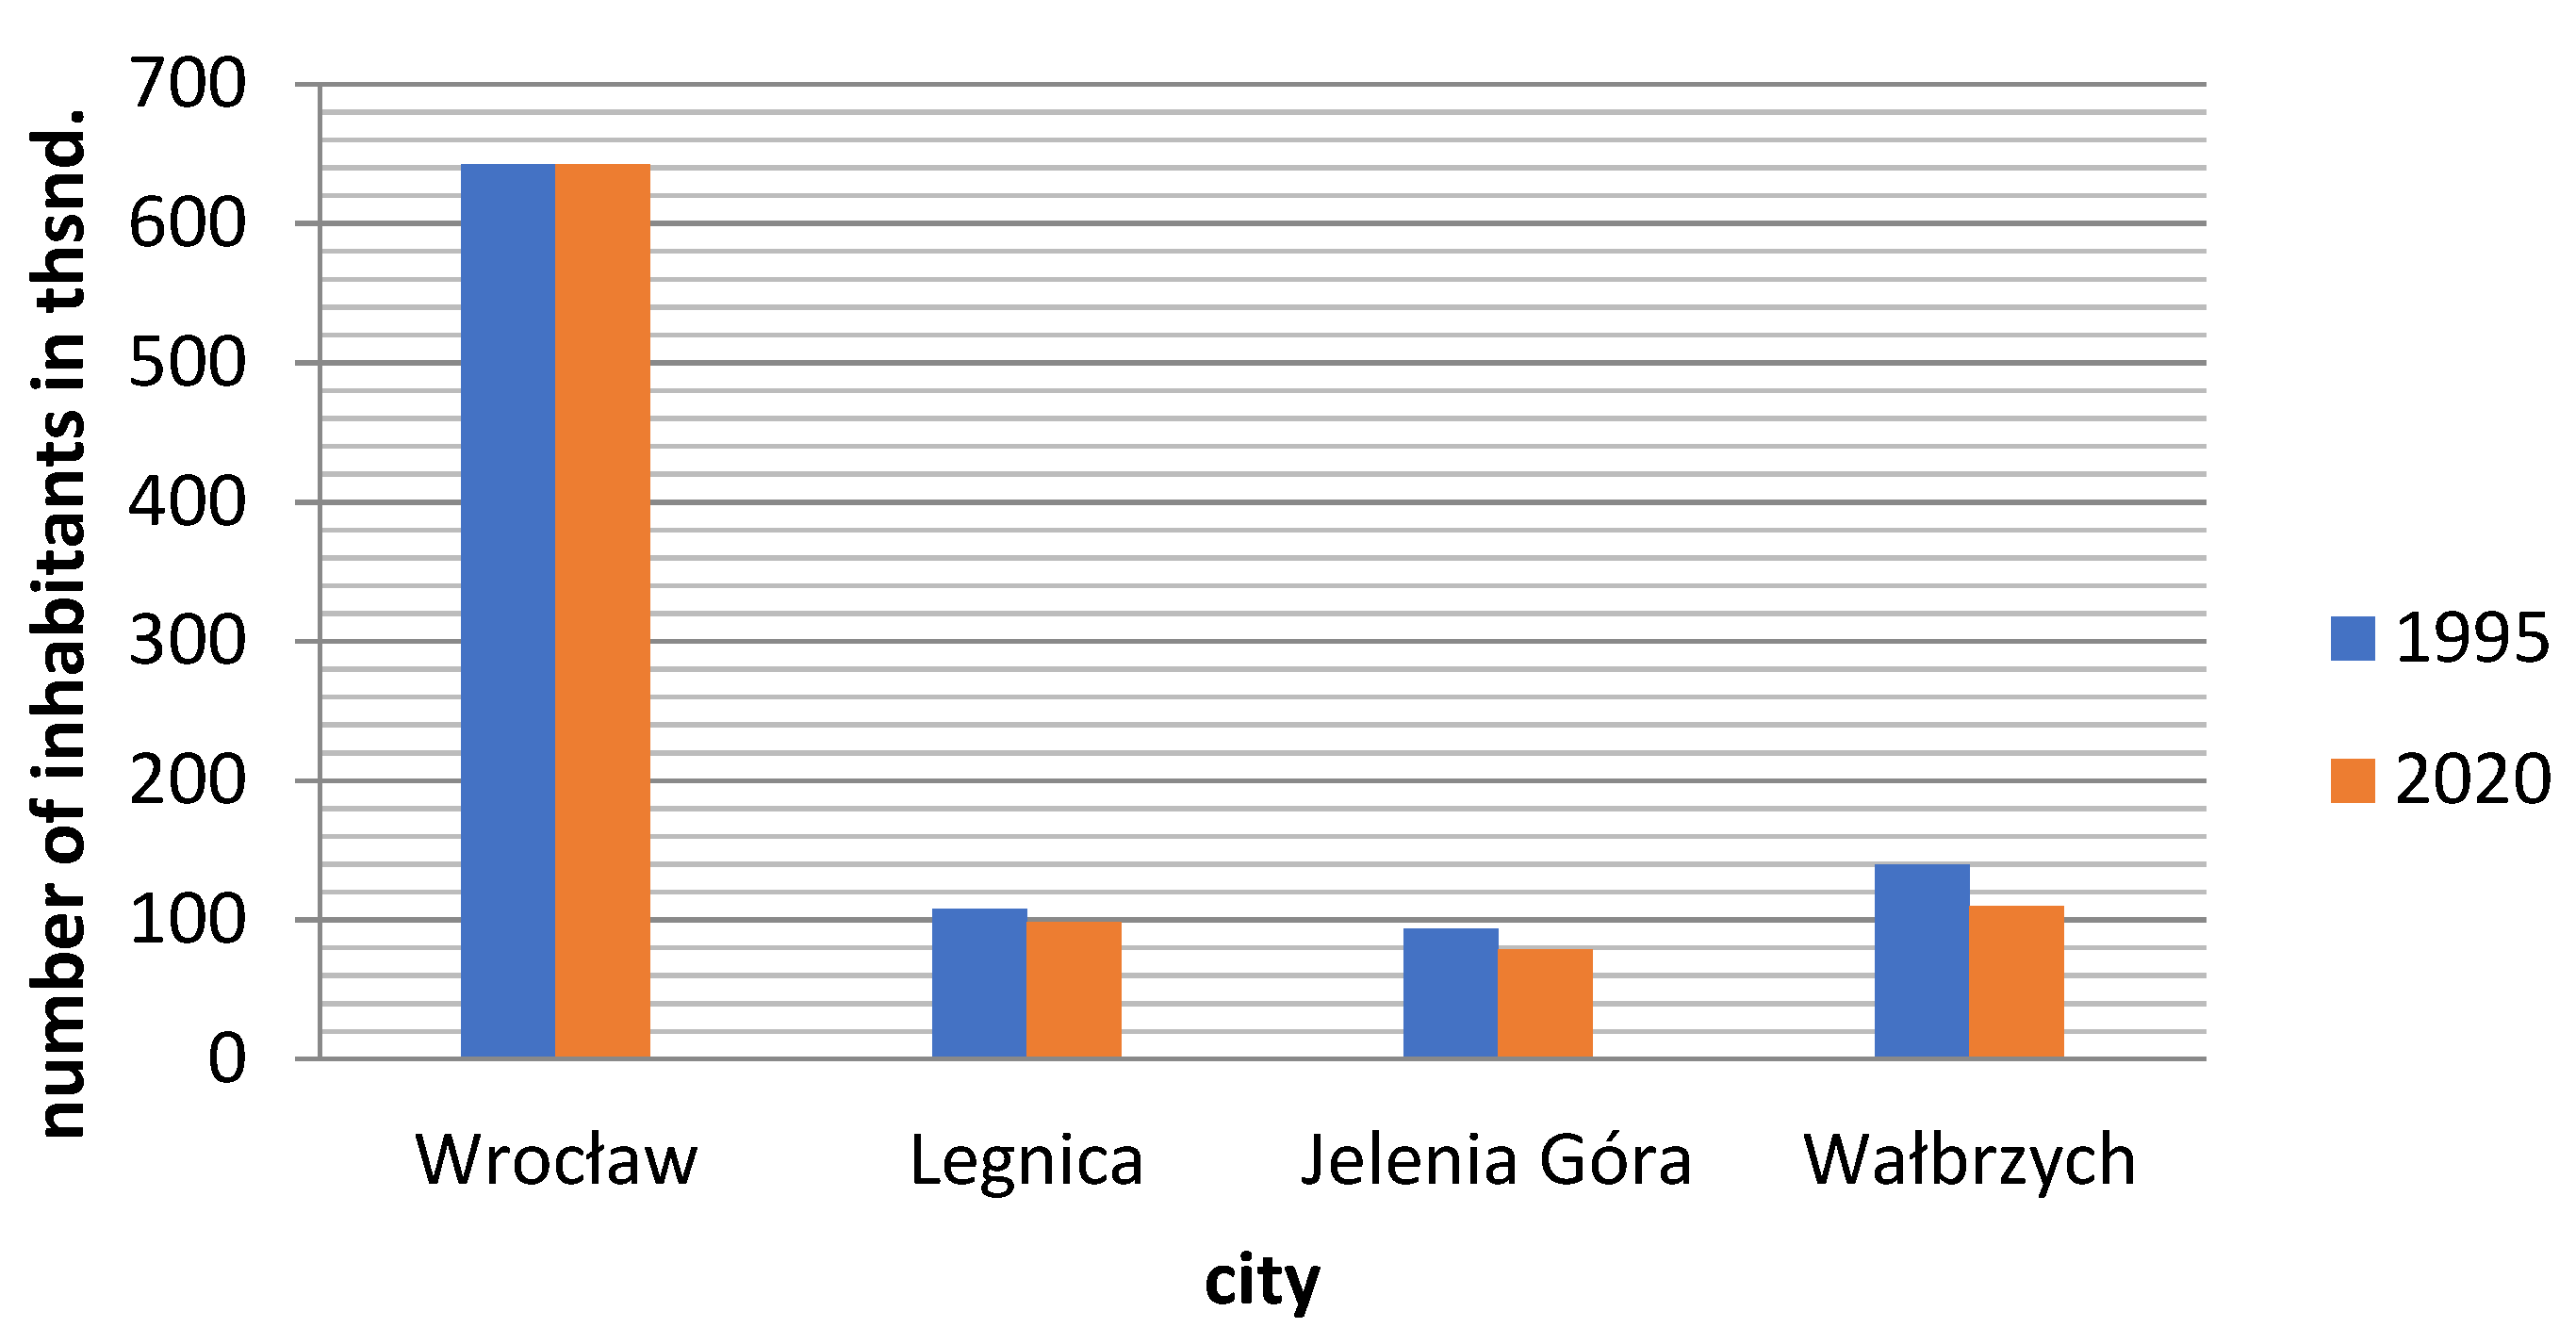
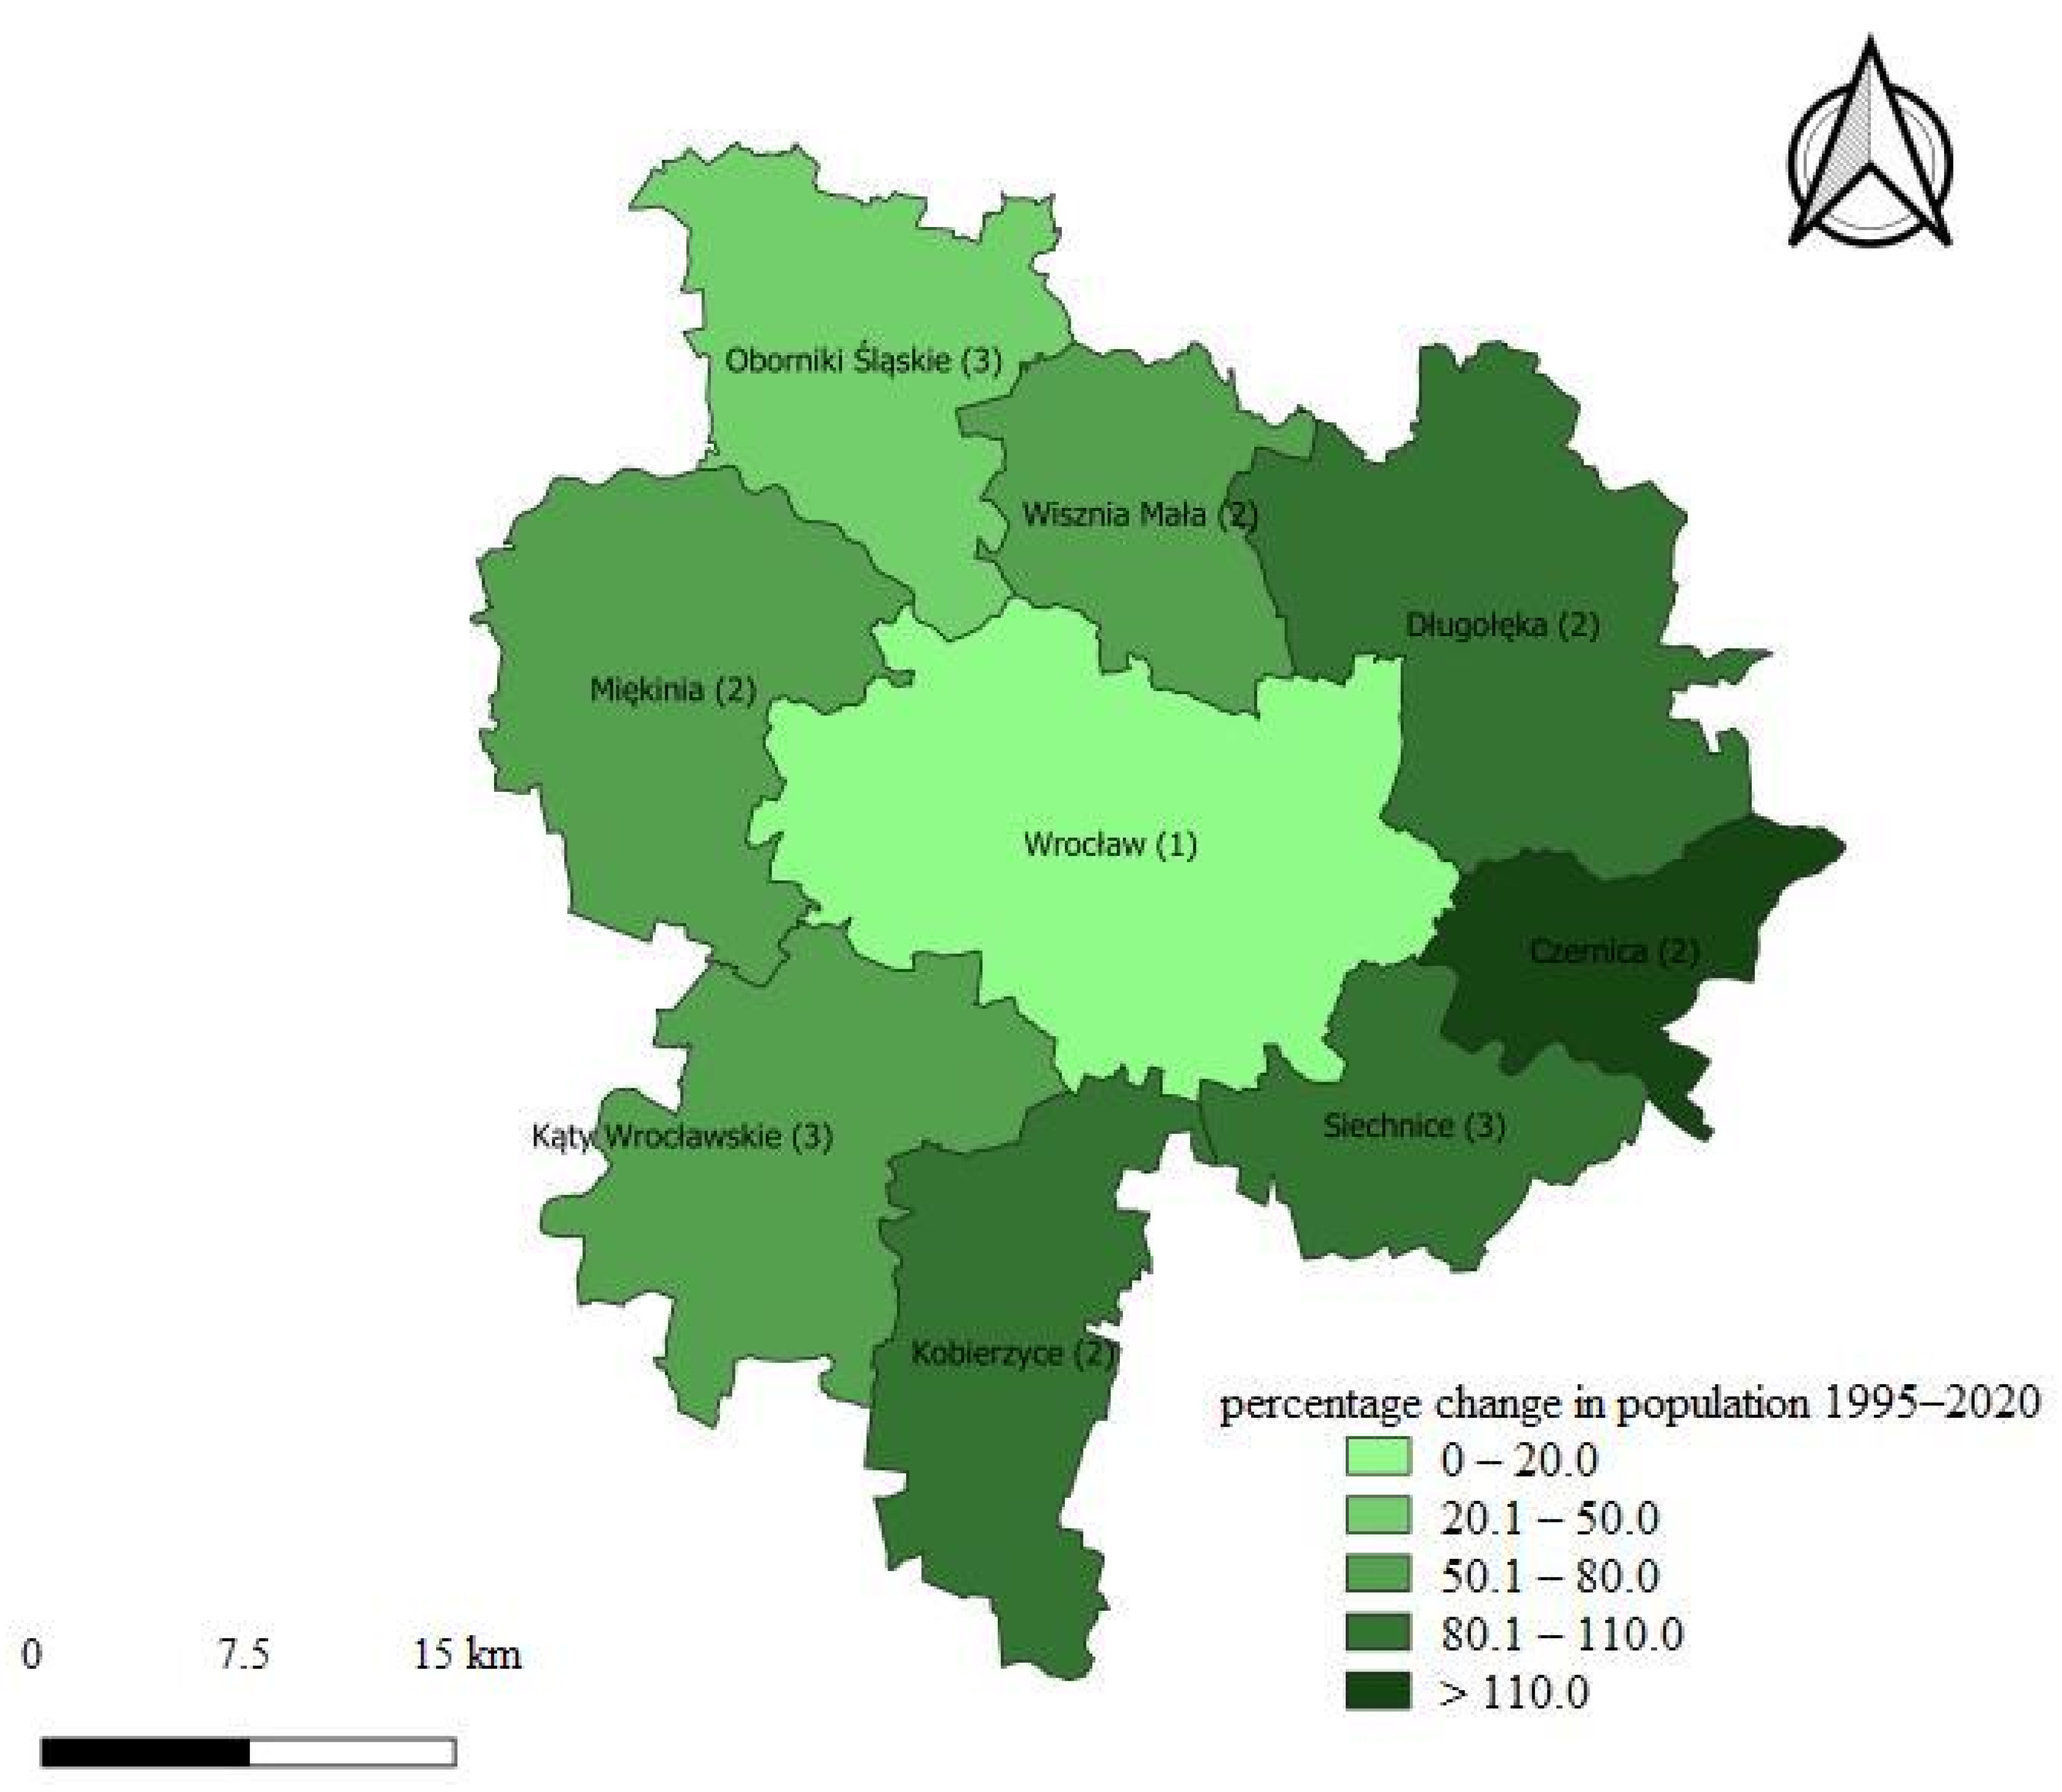
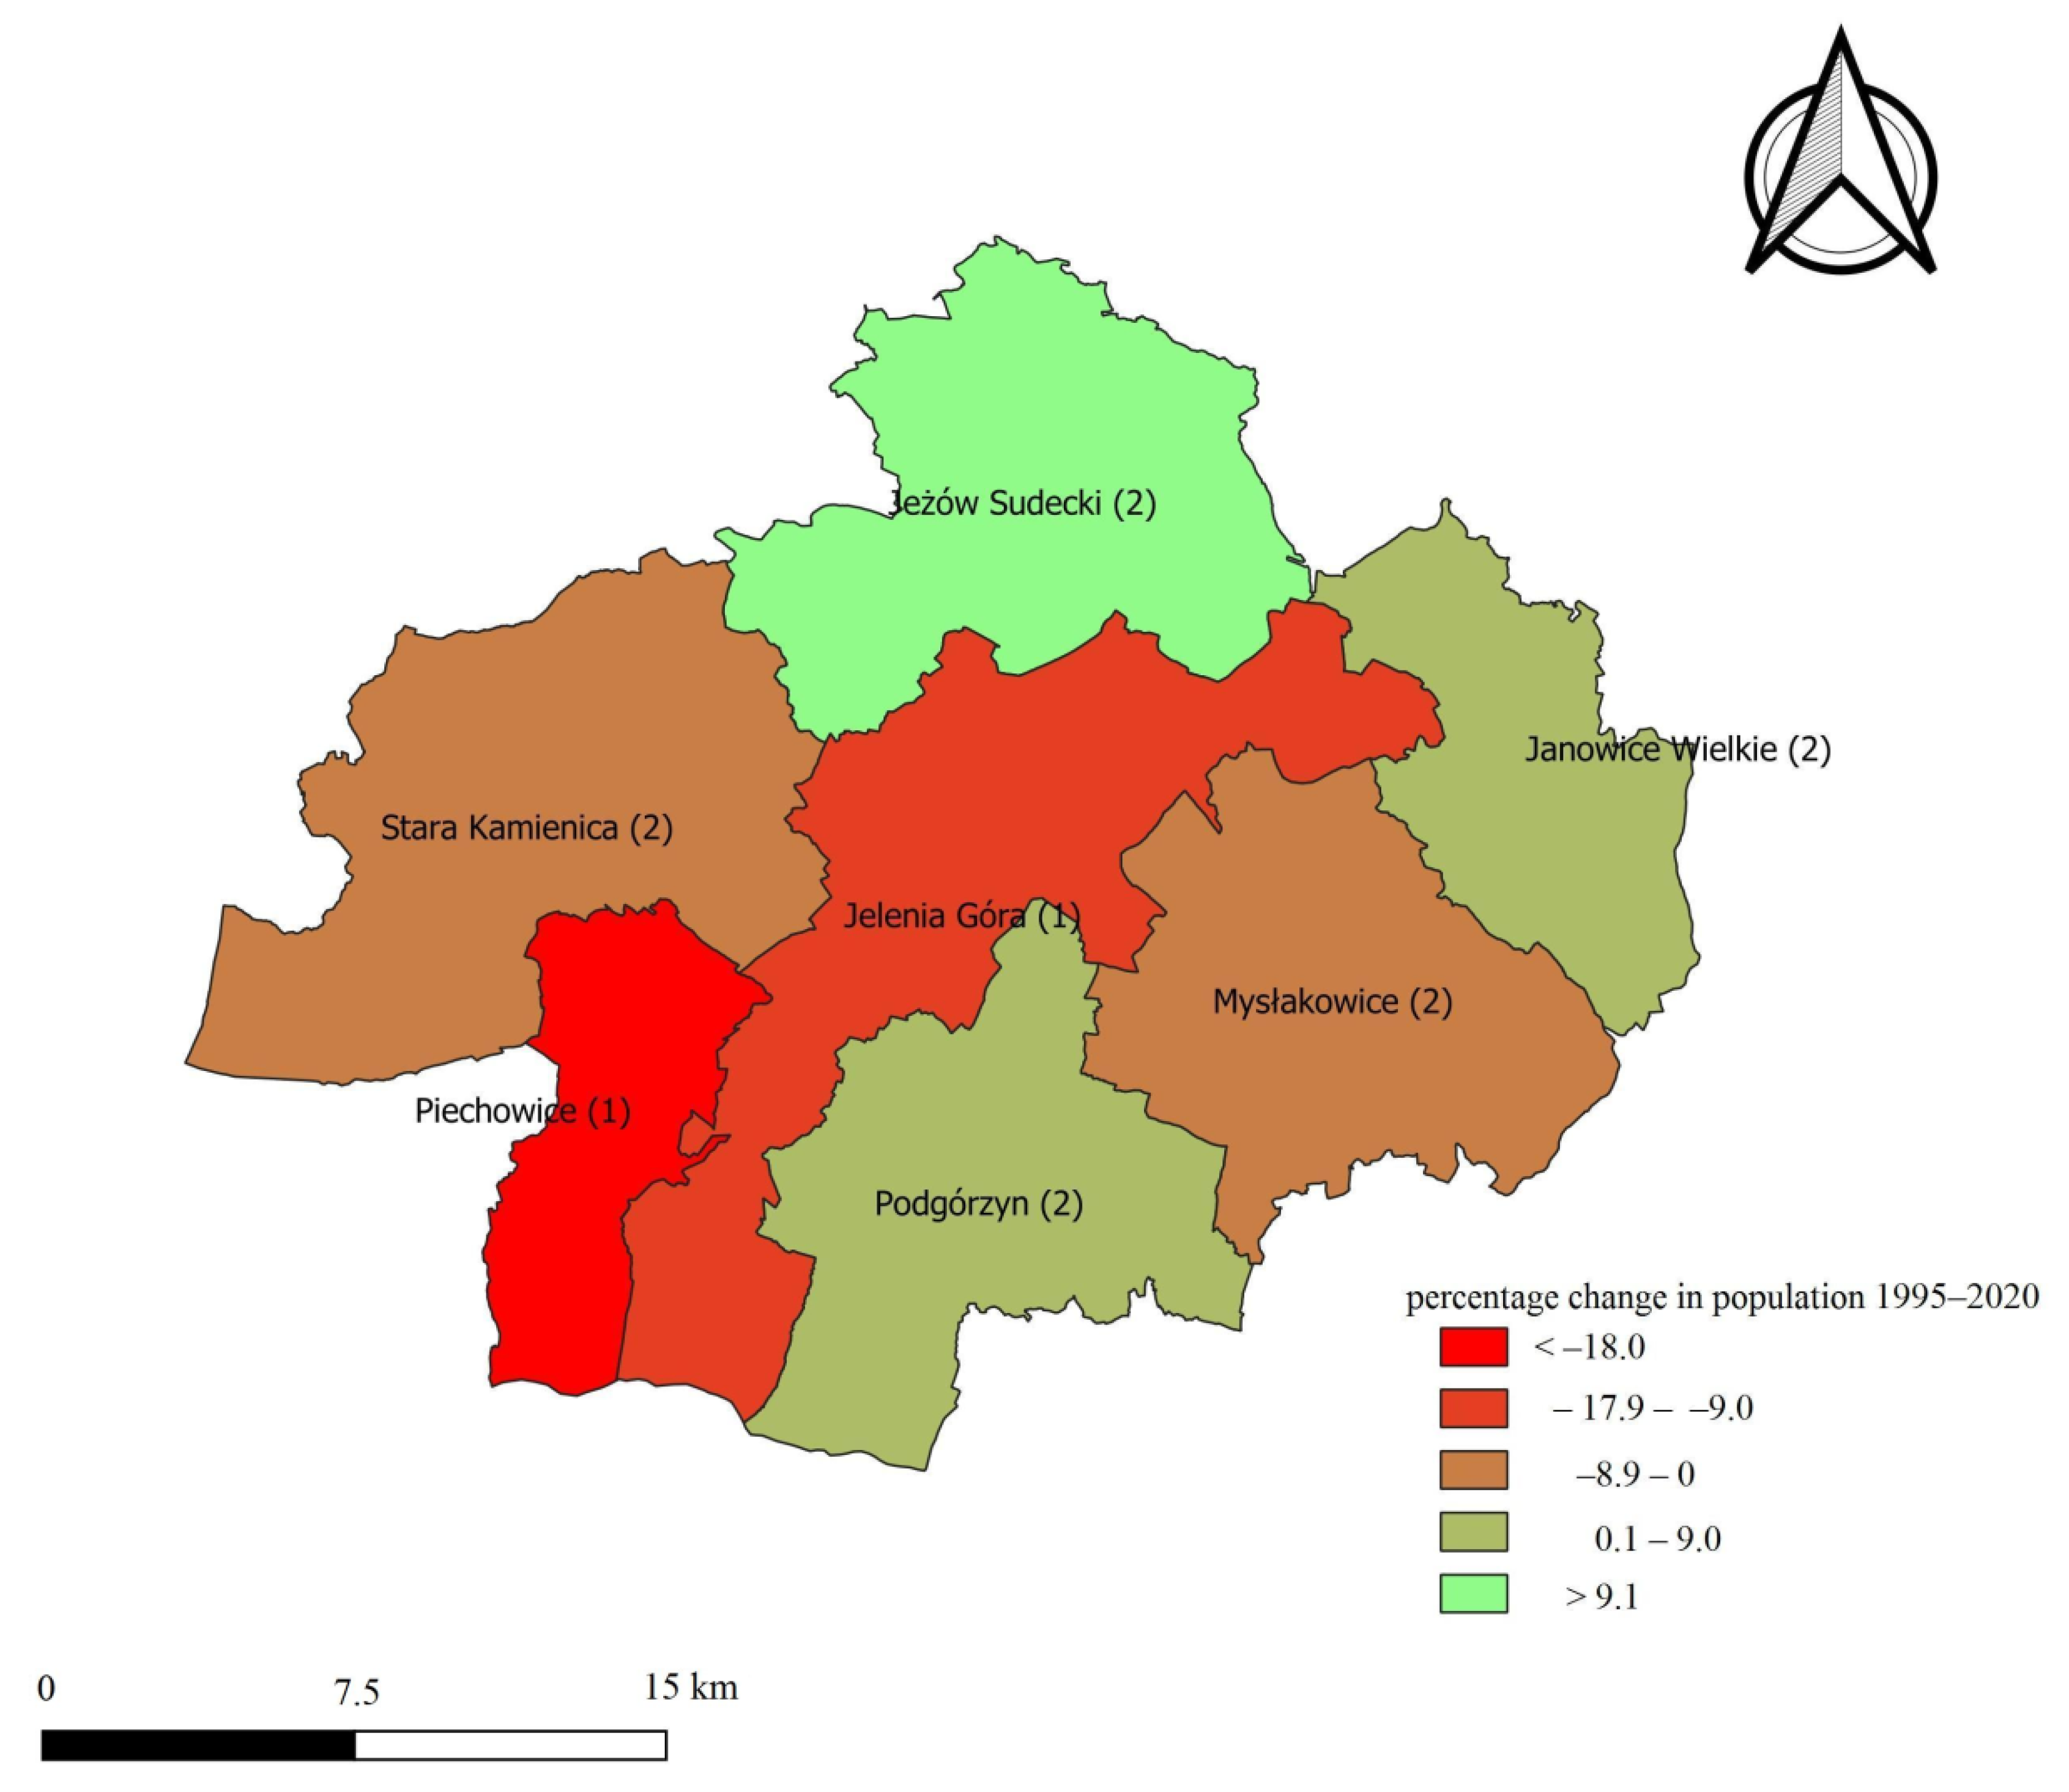
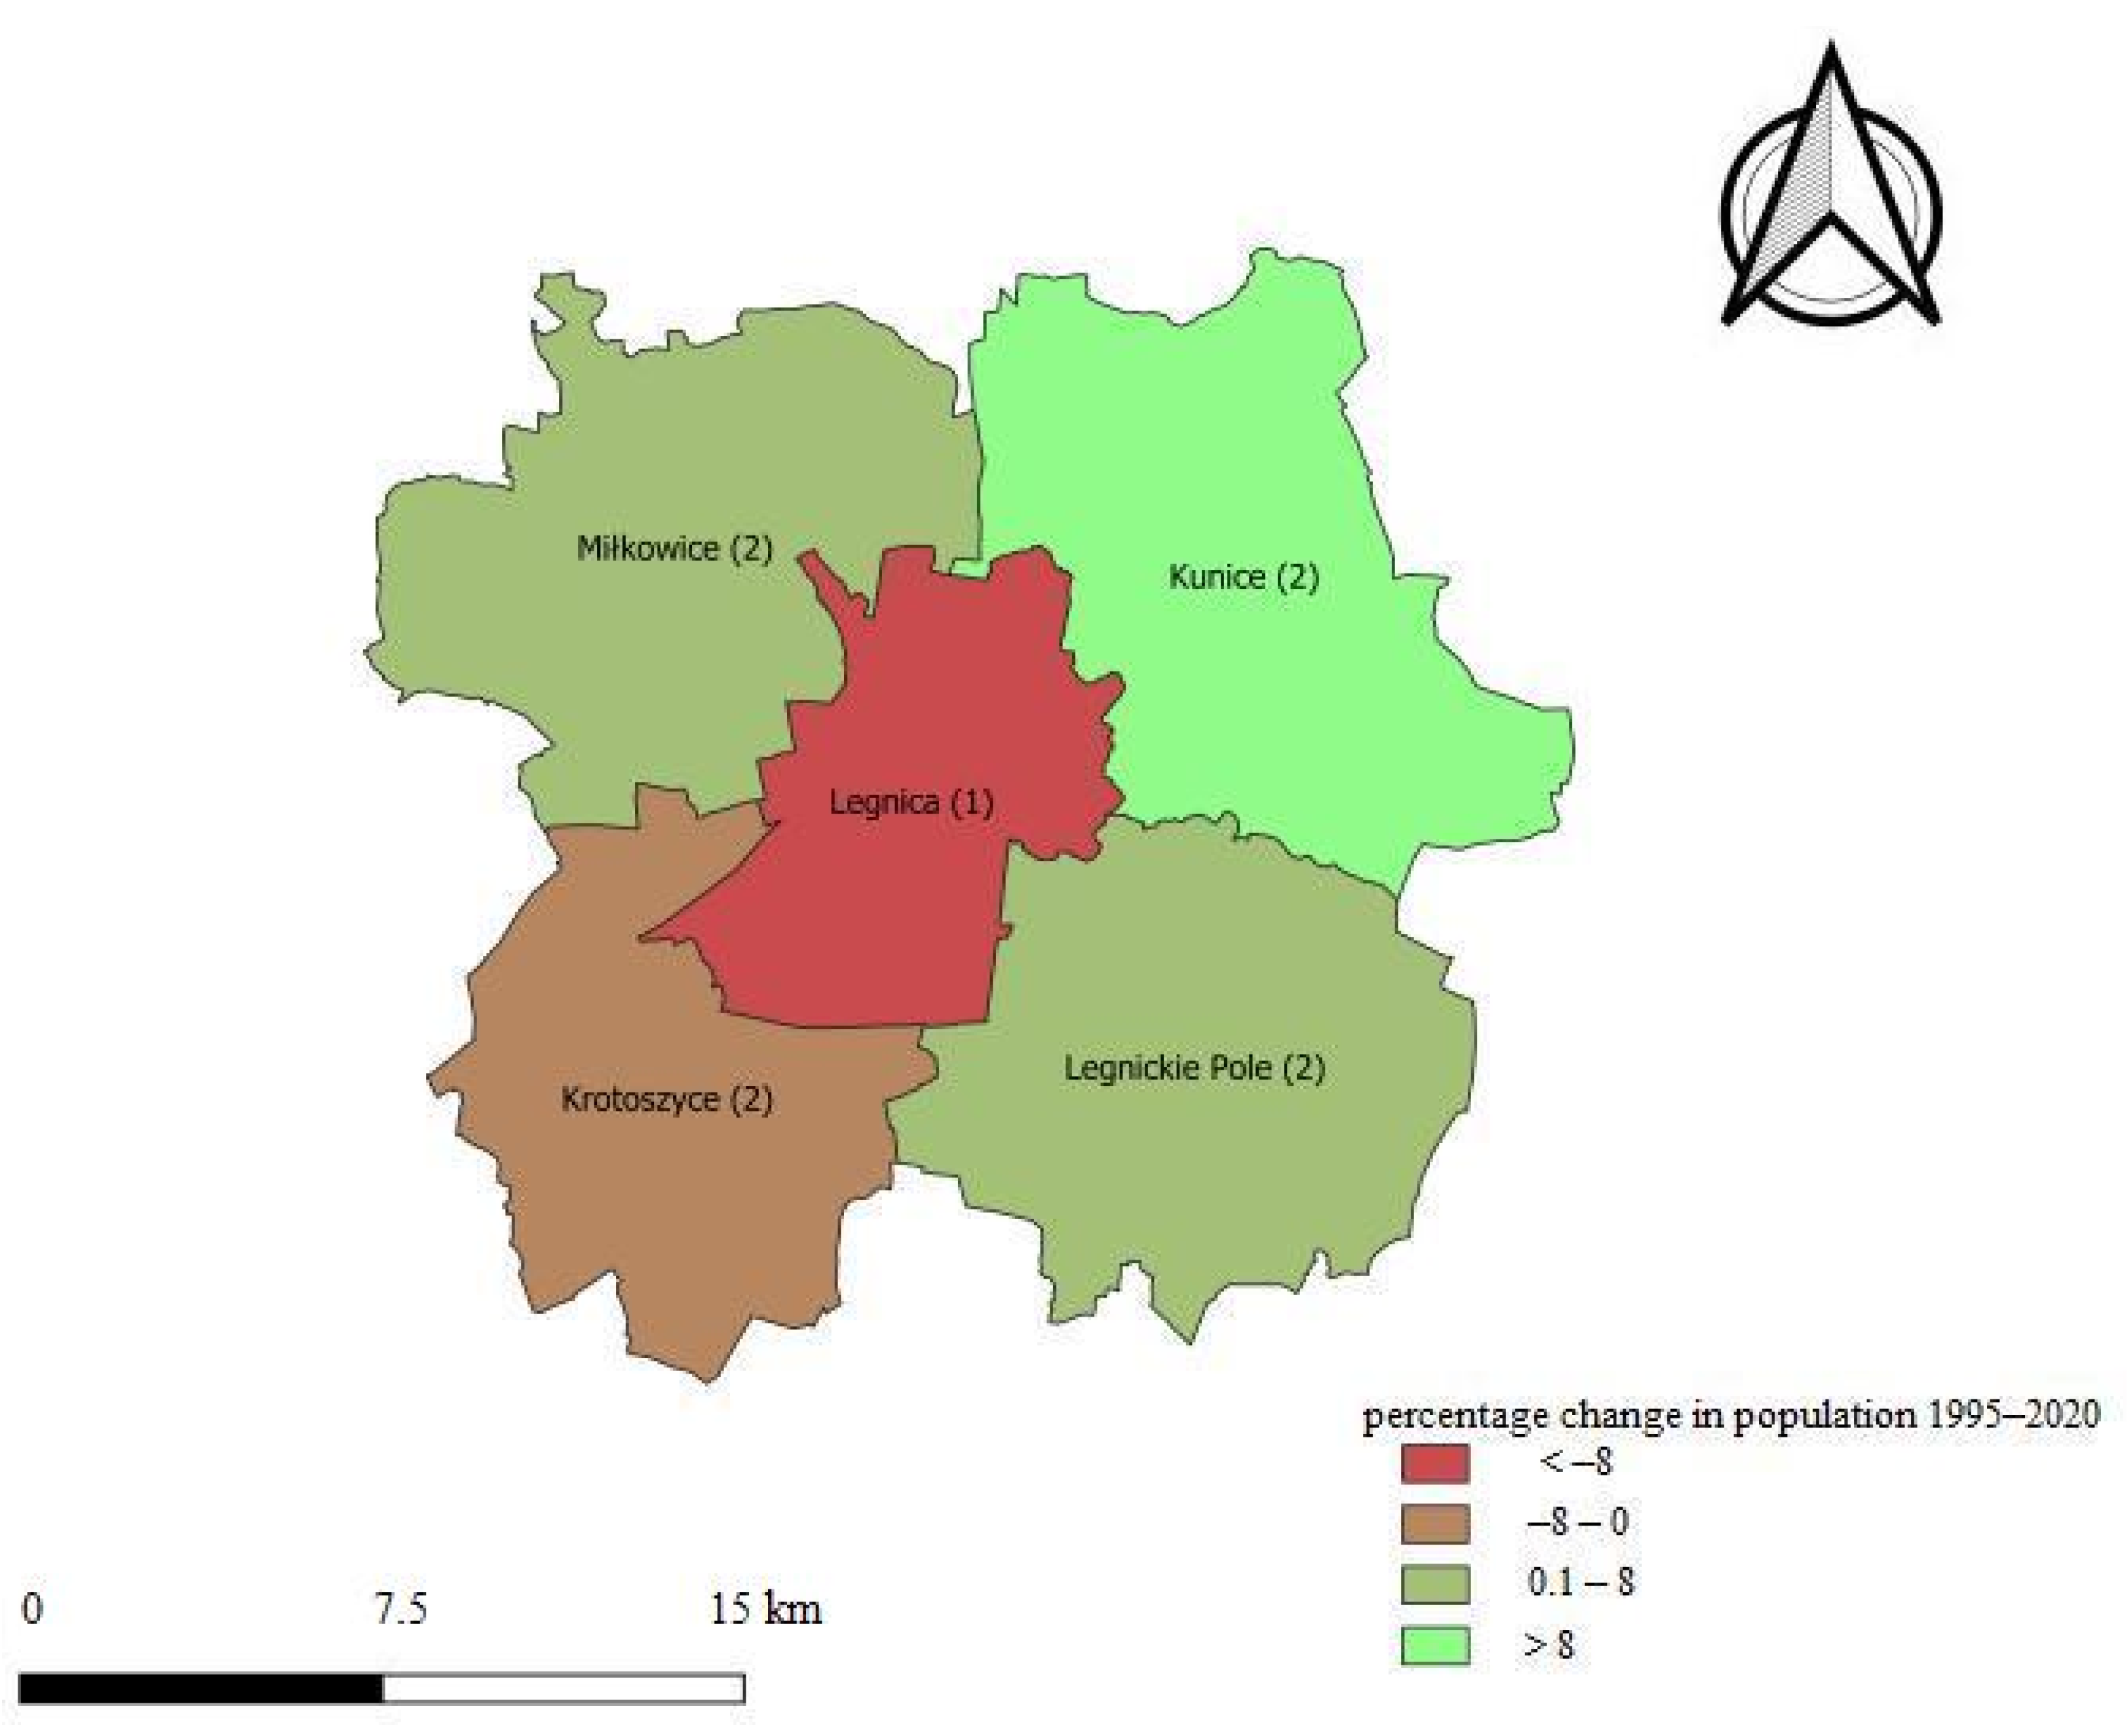
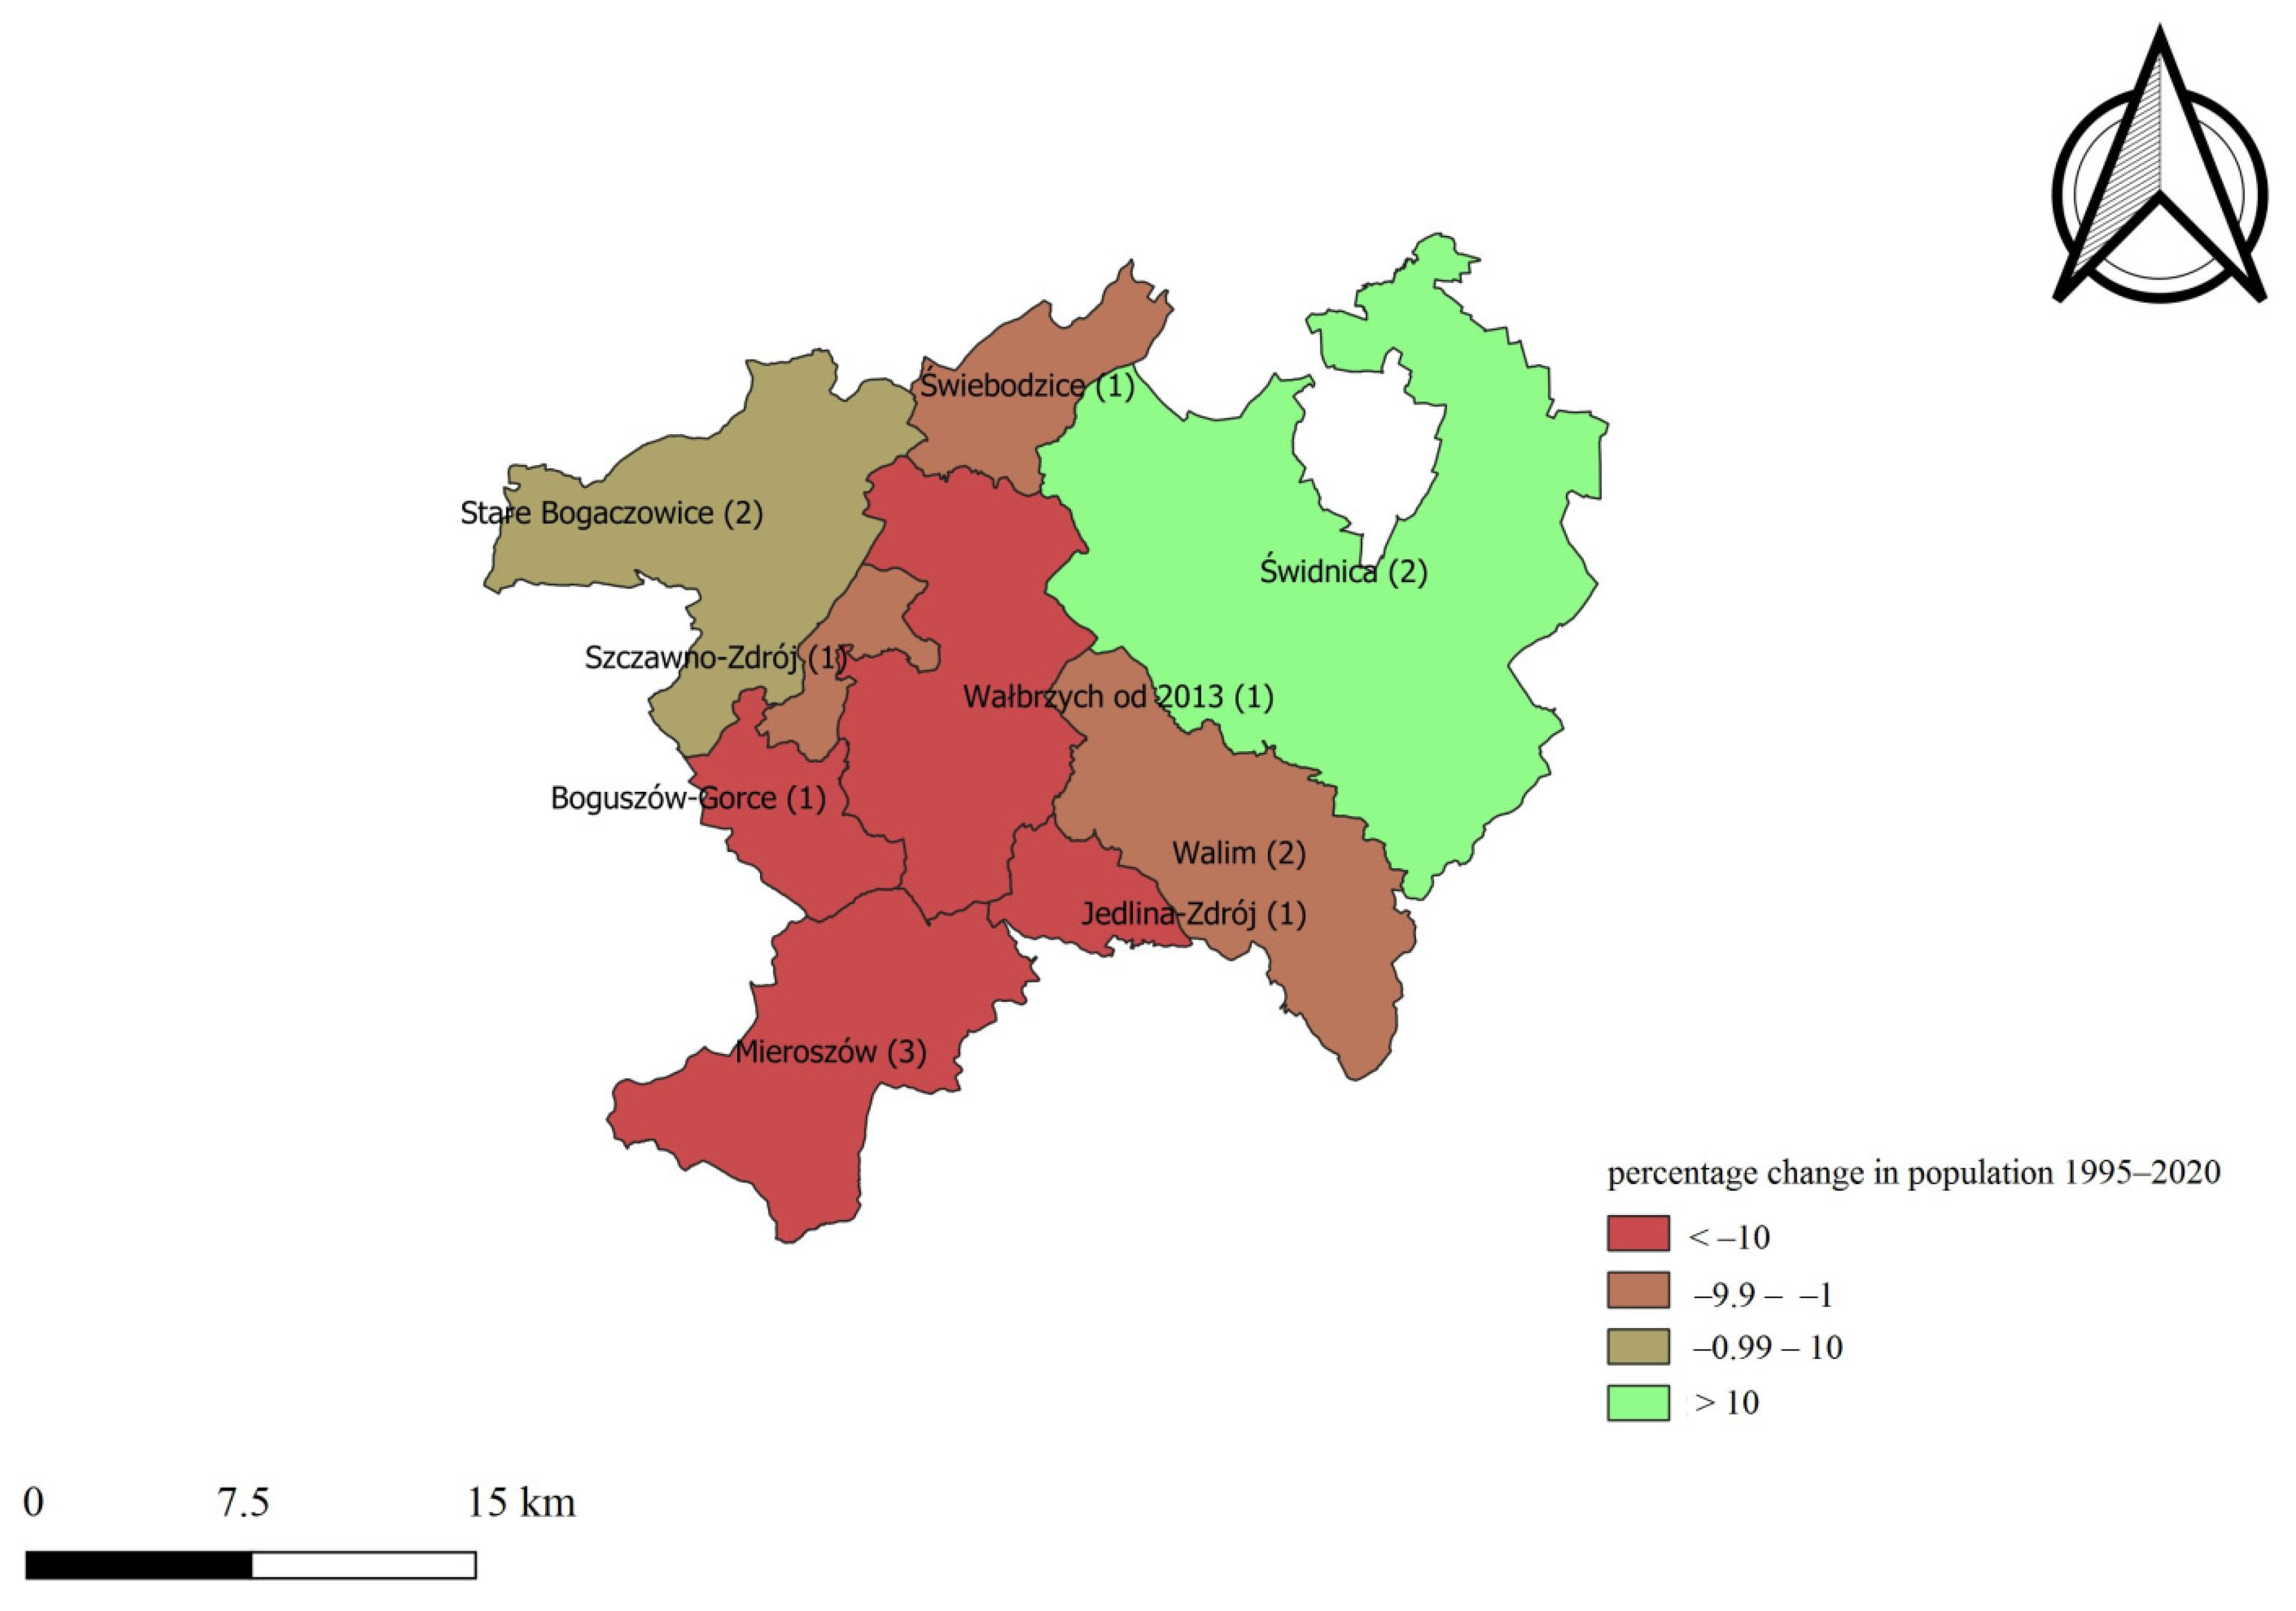
4.1. The Populations of Major Lower Silesian Cities and the Surrounding Municipalities

In the voivodship under study, four important urban centers can be distinguished: Wrocław, Jelenia Góra, Wałbrzych and Legnica (Figure 1).
Wrocław, as the capital of the region, is naturally of major importance. The Wrocław metropolis is recognized internationally. In 2016, Wrocław was awarded the title of the European Capital of Culture. The remaining three cities share two common features: the loss of voivodship status as a result of the administrative reform in 1999 and the continuously declining number of inhabitants, which has been steadily progressing over the last 25 years. The huge and long-term difference in the demographic potential of the analyzed cities is a striking feature (see Figure 2).
The data provided by Statistics Poland show that in the period of 1995–2020, the sum of the inhabitants residing in Legnica, Jelenia Góra and Wałbrzych was always significantly lower than the number of Wrocław inhabitants. Moreover, an increasing difference between the demographic potential of the voivodship capital and other cities should be noted. In 1995, the sum of the inhabitants in the three above-mentioned cities accounted for 58% of the number of Wrocław residents, and in the following year, it decreased to 53%, whereas in the last analyzed period (i.e., in 2020), it was only 45%.
Wrocław is adjacent to eight municipalities (see Figure 3). Kąty Wrocławskie, Siechnice and Oborniki Śląskie have the urban-rural status. The remaining municipalities under study are the rural ones (i.e., Kobierzyce, Czernica, Długołęka, Wisznia Mała, and Miękinia). The municipality of Siechnice requires clarification; on 1 January 2010, the name of the municipality was changed (previously Święta Katarzyna).
A comparison of the Wrocław population in the first and last years of the study showed a difference of 46 people. With the population at the level of 650,000 inhabitants, this is an insignificant difference, allowing the above-mentioned value to be considered constant. A considerable increase in the population was observed in all municipalities surrounding Wrocław. The ranking of municipalities according to the percentage increase in the number of inhabitants is as follows: Oborniki Śląskie (22%), Wisznia Mała (52%), Kąty Wrocławskie (52%), Miękinia (62%), Kobierzyce (95%), Siechnice (98%), Długołęka (108%) and Czernica (146%).
Jelenia Góra is surrounded by six municipalities (see Figure 4), of which only the Piechowice municipality presents the status of an urban one; the remaining municipalities (i.e., Stara Kamienica, Jeżów Sudecki, Janowice Wielkie, Mysłakowice and Podgórzyn) have the rural status.
The city of Jelenia Góra is struggling with depopulation. In the analyzed period, the population went down by 16%. A similar trend was observed in Piechowice, where the population decline was slightly higher, amounting to 18%. Stara Kamienica and Mysłakowice were affected by minimal depopulation, as in both of these municipalities, the number of inhabitants in 2020 was 1% lower compared with the values recorded in 1995. An increase in population was observed in Janowice Wielkie (1%), Podgórzyn (3%) and Jeżów Sudecki (30%).
Legnica borders four rural municipalities: Krotoszyce, Miłkowice, Kunice and Legnickie Pole (see Figure 5).
In the analyzed period, the community of Legnica declined by 9%. Two of the surrounding municipalities maintained an almost unchanged number of inhabitants; Krotoszyce recorded a slight decrease, whereas the Legnickie Pole municipality saw a slight increase in the number of inhabitants. In both of the above-mentioned cases, the difference was 1%. In two municipalities, an increase in the population was observed, specifically in the Miłkowice municipality by 8% and also in the Kunice municipality by as much as 66% compared with the base year value.
The surroundings of Wałbrzych are the most diversified in terms of the municipal status. The city is adjacent to eight municipalities, four of which represent urban municipalities (Szczawno-Zdrój, Boguszów-Gorce, Jedlina-Zdrój and Świebodzice) and three have the status of a rural municipality (Walim, Stare Bogaczowice and Świdnica), while Mieroszów is an urban-rural municipality (see Figure 6).
In the case of the last of the examined cities, the demographic situation should be assessed as the most unfavorable, since the number of inhabitants in the analyzed period decreased by 21%. Six municipalities surrounding Wałbrzych were also affected by depopulation. The ranking of municipalities according to the percentage of decline in the number of inhabitants was as follows: Mieroszów (19%), Boguszów-Gorce (18%), Jedlina-Zdrój (14%), Walim (9%), Świebodzice (9%) and Szczawno-Zdrój (7%). The opposite phenomenon was recorded only in the rural municipality of Świdnica; in 2020, the number of inhabitants was 16% higher compared with the data for 1995. In the municipality of Stare Bogaczowice, the size of the local community did not change.
To sum up, it can be stated that the phenomenon of depopulation concerns almost half of the analyzed municipalities, including the three cities important to the region. The growing disproportion in the demographic potential of Wrocław and the group of former voivodship cities is noteworthy. Although the capital of the region maintains its population number at a constant level, the municipalities of Jelenia Góra, Legnica and Wałbrzych are shrinking.
The Wrocław metropolis is surrounded by municipalities characterized by increasing populations. The scale of the changes is significant, as only in the case of the Oborniki Śląskie municipality was the increase in population in the analyzed period lower than 50% compared with the base period value. In the case of Jelenia Góra, the municipality of Jeżów Sudecki stands out, and in the case of Legnica, it refers to the municipality of Kunice, where the increase in population amounted to 30% and 66%, respectively. Wałbrzych and its surroundings are affected by depopulation, which was not recorded in only two municipalities: the municipality of Stare Bogaczowice, which maintained an unchanged number of inhabitants, and the rural municipality of Świdnica, recording an increase in the analyzed value of 16%.
The ranking of the population growth in the analyzed municipalities was prepared by adopting that the research year was the end of the research period (i.e., 2020), whereas the base year of 1995 shows that only the municipalities adjacent to Wrocław were listed among the top three (see Table 1).
The range of the obtained results is striking. First place was taken by the Czernica municipality, whose population increased by almost 150%. The ranking is closed by the Wałbrzych municipality, which lost over one fifth of its inhabitants.
In order to capture the pace of the changes, the information regarding the year-to-year changes in the population number was used (the indexes were calculated using a chain base method). This allowed the indication that in 2010, an increase in the number of inhabitants exceeding 5% was observed in 9 municipalities. It should be added that in 2010, a maximum value of the population growth in the year-to-year format for the entire study period was recorded. This was registered in the Jeżów Sudecki municipality and amounted to 10.61%. Basically, it should be adopted that in annual periods, the population of the analyzed municipalities did not change rapidly. There were only 21 cases (out of 750 observations) of a change exceeding 5% (17 cases of an increase and 4 of a decrease in the number of inhabitants).
This allows for concluding that the process of changes in the population of the local societies in the analyzed municipalities presents an evolutionary nature and should be observed over a long period of time.

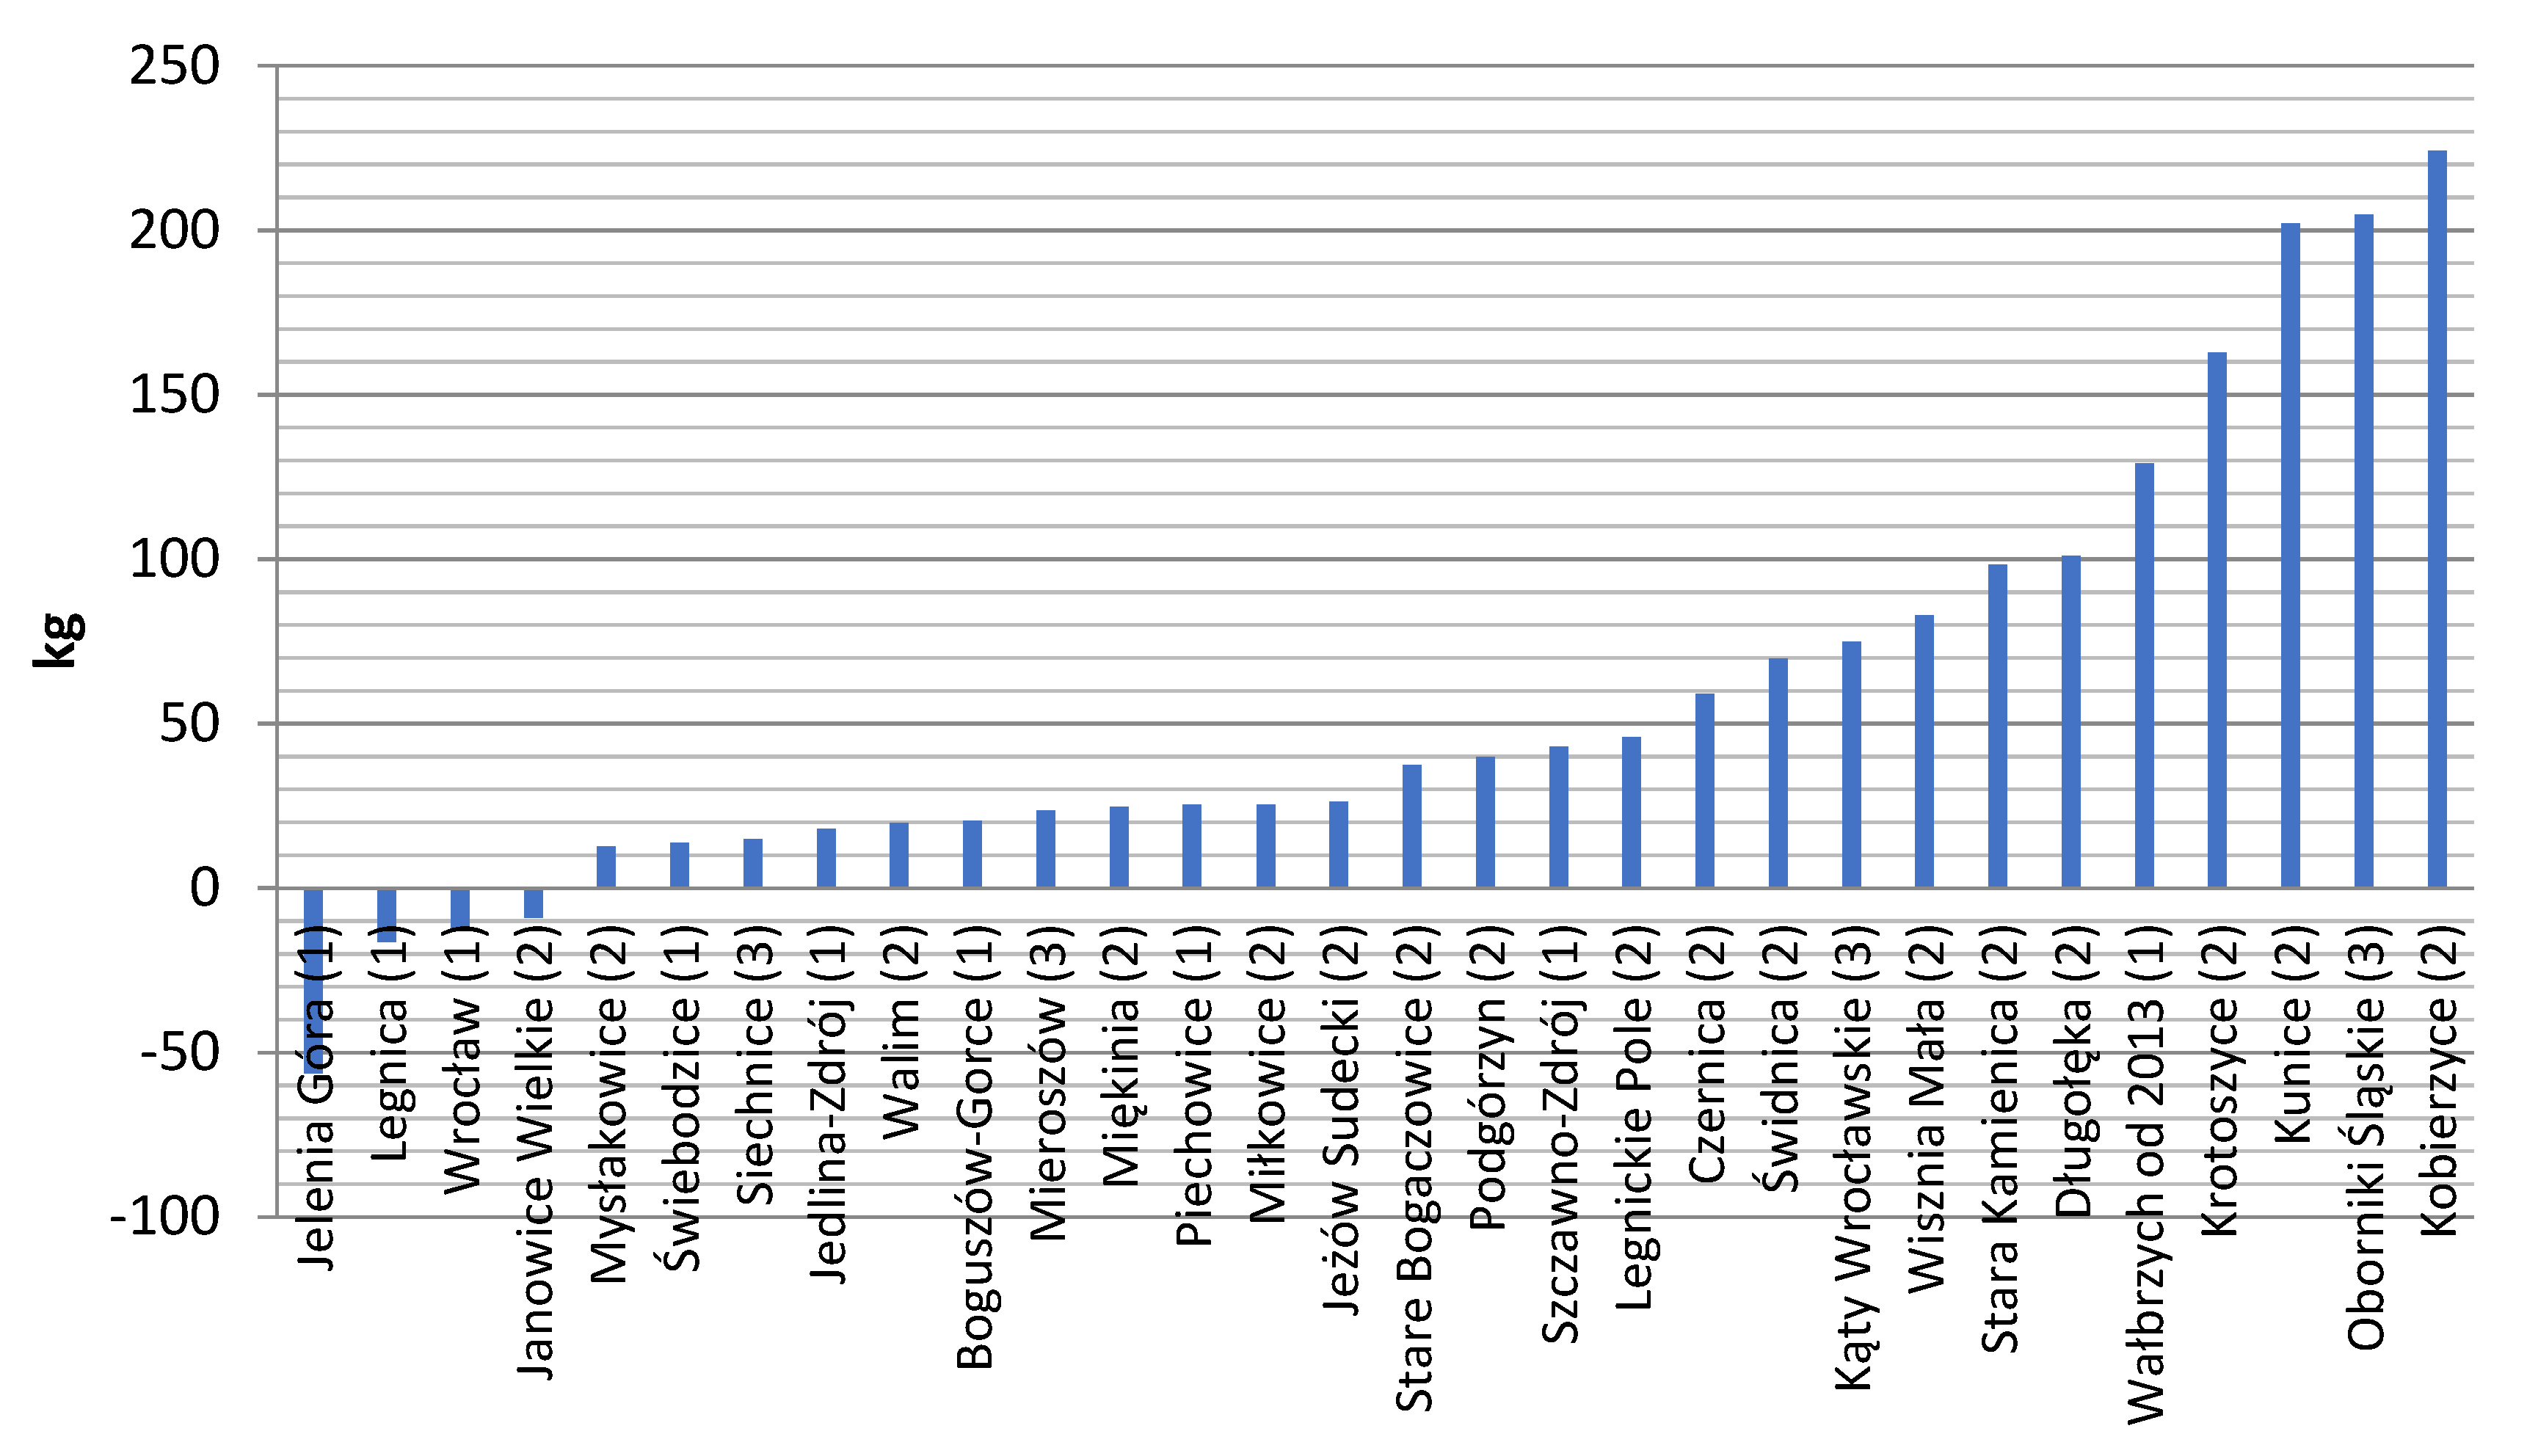
4.2. Water and Sewage Infrastructure of the Analyzed Municipalities and the Generation of Solid Waste

The analysis of the synthetic development measure (SDM), calculated in accordance with the methodological remarks presented in Section 3, shows that in all analyzed municipalities, the absolute increase in the SDM value, calculated as the difference between the value of the SDM in 2020 (analyzed year) and 1995 (base year), was recorded. There are, however, huge differences in both the pace of the above-mentioned increase and the level of the SDM values in individual municipalities (see Table 2).
The highest absolute increase in the SDM occurred in the Stara Kamienica municipality (it exceeded 5000% of the measured value for 1995), whereas the lowest was recorded in the Piechowice municipality (11% of the measured value for 1995). The seemingly impressive result of the Stara Kamienica municipality is the effect of no sewage system and a short (only 1.5 km long) water supply system in the first analyzed year (It is worth noting that the development of the sewage system was only carried out in 2007). The characteristic feature, resulting from the urbanization level and the related water and sewage infrastructure already present in the base year, is that in three major cities in the region, the absolute increase in the SDM was one of the lowest and amounted to the following results: Wałbrzych (35%), Legnica (38%) and Wrocław (44%). The situation was slightly different in Jelenia Góra, where the increase reached 111%.
Analysis of the rankings prepared based on the SDM values for the years 1995–2020 indicates the same level of values among the leaders. The top three include the following municipalities: Kunice (21 years), Miłkowice (16 years), Wrocław (15 years), Czernica (15 years), Legnica (10 years) and incidentally Wałbrzych (1 year) (The number of years in which the municipality was included among the top three ranking leaders is given in parentheses). It is worth paying attention to the territorial concentration of three municipalities (i.e., the municipalities of Kunice, Miłkowice and Legnica). This suggests growing competition against Wrocław and the municipalities surrounding Wrocław. The remaining municipalities frequently changed their ranking positions. The largest amplitude of fluctuations was observed for the Piechowice municipality, ranging from position 8 in 1998 to position 28 in 2014–2020. Twelve municipalities recorded ranking fluctuations at the single-digit level, while the remaining municipalities were ranked at positions presenting two-digit differences.
The SDM values indicate huge differences between the analyzed objects. The maximum span of the measure observed in the course of the study occurred in 2002 and had a range of (0–0.599). The Kunice municipality was the leader at that time, and the Stara Kamienica municipality presented a zero value for the SDM (the 1.5-km long water supply system was not used).
In order to capture the increase rate in the SDM value, information regarding changes in the year-to-year value of the measure was used (chain indexes were calculated). The analysis showed that out of 740 observations, in 168 cases, the recorded value was negative. Taking into account the SDM construction, this fact suggests that in the case of 23% of observations, the denominator of the two indicators (population number) was growing faster than the lengths of the analyzed systems. Rapid increases in the SDM value (over 99% of the measured value in the previous year) were observed in only three cases in the following municipalities: Kunice (1996), Mysłakowice (2010) and Stara Kamienica (2012). Increases of over 50% in the measured value in the previous year were recorded 15 times. Differences below 10% of the measured value in the previous year were predominant.
Analysis of the amount of solid waste collected in the municipalities in the period of 2017–2020 showed that only in four cases was a decline in the analyzed value observed. Having adopted 2017 as the base year and 2020 as the analyzed year, a decrease expressed as a percentage was recorded in the following municipalities: Jelenia Góra (−17%), Legnica (−6%), Janowice Wielkie (−4%) and Wrocław (−2%). In other words, this means that in 26 out of the 30 analyzed municipalities, an increase in the amount of collected solid waste was recorded. Concerns should be raised by the fact that in only 9 cases did the increase not exceed 10% of the base year value. This was the case in the following municipalities: Mieroszów, Mysłakowice, Walim, Świebodzice, Boguszów-Gorce, Piechowice, Jedlina-Zdrój, Legnickie Pole and Szczawno-Zdrój. Unfortunately, in as many as 17 municipalities, this increase was larger and amounted to the following values: Jeżów Sudecki (11%), Miłkowice (12%), Podgórzyn (12%), Stare Bogaczowice (13%), Siechnice (19%), Miękinia (21%), Świdnica (25%), Kąty Wrocławskie (27%), Wałbrzych (30%), Wisznia Mała (32%), Czernica (37%), Oborniki Śląskie (39%), Długołęka (40%), Stara Kamienica (67%), Kunice (89%), Krotoszyce (94%) and Kobierzyce (124%).
Converting the kilograms of waste per capita and comparing the values at the beginning and end of the research period (i.e., 2017 and 2020, respectively) indicated that in the analyzed municipalities, an increase in the amount of waste per capita was dominant, with a simultaneous highly diversified growth rate of the analyzed phenomenon (see Figure 7). The infamous first position was taken by the Kobierzyce municipality. In this municipality, during the analyzed period (i.e., only 4 years), the statistical resident increased waste generation by 224 kg per year.
No penalties for failure to register permanent residence (explanation in the methodological section), along with the observed situation, allowed for a reasonable suspicion that the actual number of new residents in the analyzed municipalities (and thus the new users of water and sewage systems) was higher than the results from the data provided by the Statistics Poland, referring to the population. This should unquestionably be assessed in a negative way.

5. Discussion

The research findings presented in Section 4 indicate that the number of inhabitants went up in as many as 12 rural municipalities in the vicinity of the analyzed cities. It should be emphasized that all rural municipalities adjacent to the capital of the region increased their demographic potential. Direct interviews carried out with the employees of the municipality offices in the municipalities of Kobierzyce, Czernica, Długołęka, Wisznia Mała and Miękinia clearly show that the majority of the newly settled residents did not conduct agricultural activity but only resided in a rural area professionally connected with the neighboring town.
The results of the observations regarding the remaining cities in the region—Jelenia Góra, Legnica and Wałbrzych—require discussion and comments. These cities are characterized on the one hand by depopulation and on the other by their neighborhoods, with a rural municipality distinguished by the growth of the local community.
The municipality of Jeżów Sudecki, recording the highest population growth, borders the densely populated part of Jelenia Góra (i.e., Zabobrze). Direct observation showed that the above-mentioned border between the rural area and the city is purely formal at present. The buildings sprawled into rural areas, permanently displacing agriculture and, at the same time, functionally connecting part of the Jeżów Sudecki area with the city.
In the case of the Kunice municipality and the city of Legnica, there is a natural buffer in the form of the Wierzbiak riverbed and green areas (in the floodplain parts, not intended for development). However, rural areas are in fact under pressure by the city. For the residents, the municipal bus transport connecting Legnica and Kunice is the symbol of border blurring.
The rural municipality of Świdnica, territorially connected with Wałbrzych, is adjacent to the urban municipality of the same name. Therefore, it is difficult to distinguish the influence of Wałbrzych and the city of Świdnica on the population of the rural municipality of Świdnica, as both urban centers affect the neighboring rural area.
Similarly, as in the case of the rural municipalities bordering Wrocław, the interviews with employees of the municipal offices in the Jeżów Sudecki, Kunice and Świdnica municipalities showed the absence or relationship between new residents and agricultural activity.
Unfortunately, the research showed no correlation between the growth of the demographic potential and the increase in the SDM value. Only in the three analyzed periods (in the years 2002, 2004 and 2016) was a moderate correlation observed between the positions taken by the municipalities in both rankings.
In the aforementioned years, the correlation was 0.394 in 2002, 0.369 in 2004 and 0.389 in 2016.
In the remaining periods, the relationship was weak (in the range of 0.0–0.3). This means that the infrastructure is developing at a different pace than the increase in the number of residents. Therefore, the answer to the research question is negative. This raises concerns since it implies a lack of infrastructure preparation in the area for the burden caused by new residents.
When assessing the volume of waste per capita, doubts can be raised regarding the correct identification of the actual inhabitants residing in a given area. The example of Kobierzyce suggests the possibility of a situation where a person has moved to a new place of residence, reports the demand for waste collection service there and, at the same time, has not checked out from the previous place of residence (in this case from Wrocław, where a decrease in the described value was observed).

6. Conclusions

The research findings indicate the need for urgent development of a conscious settlement policy for the region of Lower Silesia. The observed domination of one center (the capital of the region) and the depopulation of other major cities, with the simultaneous vicinity of a rural area (at least one municipality) with an increasing number of residents, confirm the lower attractiveness of residing in Jelenia Góra, Legnica and Wałbrzych.
Essentially, the increase in the number of inhabitants in the municipality should not be assessed as a negative phenomenon in itself. On the contrary, depopulation is usually perceived in negative terms. This does not mean, however, that increasing the number of residents (in particular, people not related to agriculture but choosing rural areas) has only positive side effects. This process requires conscious space management and investments (e.g., into infrastructure and cooperation between urban and rural municipalities) [40].
The absence of correlation between the increase in the number of inhabitants in rural areas adjacent to a city and the development of the infrastructure necessary to protect the environment and ensure a high quality of life sheds new light on the results of the report published by the Supreme Audit Office in 2017. It stated that the functioning system of spatial planning and development does not ensure rational management of space as a public good [41].
Importantly, it can be assumed that the problems of spatial management in rural areas surrounding the major Lower Silesian cities will be intensifying. Currently, the pressure on the development of suburban areas is observed in Poland, partly due to the pandemic period. Experts note that the remote work imposed by COVID-19 has shown the public that there is no need to commute to offices every day. The second factor is the declining creditworthiness, as clients are forced to become interested in cheaper offers, and such proposals are located outside the city center [42].
It seems that the only way to prevent urban sprawl is improving the quality of life in the city, as well as through the implementation of the EU’s co-founded projects. For many years, EU projects have been implemented in the studied cities [43,44,45,46]. The projects aimed at revitalizing cities and improving air quality are highlighted in the media. The open question remains for whether the resulting benefits will overcome the behavior of the space consumers which causes urban sprawl.
Finally, it is worth indicating that the GDP per capita of the analyzed region exceeded the national average, and the region is considered to be well-developed [47]. Therefore, it does not qualify for the intervention connected with the EU cohesion policy. The observed unfavorable phenomena have to be resolved locally at the level of spatial management in the municipalities.

Author Contributions

Conceptualization, A.K.-D.; methodology, A.K.-D.; validation, A.K.-D.; formal analysis, A.K.-D.; investigation, A.K.-D.; resources, A.K.-D.; data curation, A.K.-D. and A.S.; writing—original draft preparation, A.K.-D. and A.S.; writing—review and editing, A.K.-D.; visualization, A.S.; supervision, A.K.-D. All authors have read and agreed to the published version of the manuscript.

Funding

The APC is financed by Wrocław University of Environmental and Life Sciences (no external funding).

Institutional Review Board Statement

Not applicable.

Informed Consent Statement

Not applicable.

Data Availability Statement

Statistics Poland—Local Data Bank.

Conflicts of Interest

The authors declare no conflict of interest.

References

  1. Kulczyk-Dynowska, A. Parki Narodowe a Funkcje Turystyczne i Gospodarcze Gmin Terytorialnie Powiązanych; Uniwersytet Przyrodniczy: Wrocław, Poland, 2018; pp. 205–221. [Google Scholar]
  2. Szerszen, L.; Chodak, T.; Borkowski, J.; Bogda, A.; Karczewska, A. Stan srodowiska glebowego Dolnego Slaska. Zesz. Probl. Postępów Nauk. Rol. 1995, 418, 61–74. [Google Scholar]
  3. Zielona Dolina. Available online: https://zielonadolina.biz/ (accessed on 7 February 2022).
  4. Available online: https://www.skanska.pl/oferta/biura/raporty-i-standardy/cee-investment-report-2019/ (accessed on 12 March 2022).
  5. Hełdak, M.; Raszka, B. Evaluation of the Local Spatial Policy in Poland with Regard to Sustainable Development. Pol. J. Environ. Study 2013, 22, 395–402. [Google Scholar]
  6. Central Statistical Office. Local Data Bank. Available online: https://bdl.stat.gov.pl/BDL/start (accessed on 10 February 2022).
  7. Malecki, E.J. Cities and regions competing in the global economy: Knowledge and local development policies. Environ. Plan. C Gov. Policy 2007, 25, 638–654. [Google Scholar] [CrossRef]
  8. Szewrański, S.Z.; Kazak, J. Socio-environmental vulnerability assessment for sustainable management. Sustainability 2020, 12, 7906. [Google Scholar] [CrossRef]
  9. Jędruch, M.; Furmankiewicz, M.; Kaczmarek, I. Spatial Analysis of Asymmetry in the Development of Tourism Infrastructure in the Borderlands: The Case of the Bystrzyckie and Orlickie Mountains. ISPRS Int. J. Geo-Inf. 2020, 9, 470. [Google Scholar] [CrossRef]
  10. Ioppolo, G.; Cucurachi, S.; Salomone, R.; Saija, G.; Shi, L. Sustainable local development and environmental governance: A strategic planning experience. Sustainability 2016, 8, 180. [Google Scholar] [CrossRef] [Green Version]
  11. Perrings, C.; Ansuategi, A. Sustainability, growth and development. J. Econ. Stud. 2000, 27, 19–54. [Google Scholar] [CrossRef] [Green Version]
  12. Furmankiewicz, M.; Hewitt, R.J.; Kapusta, A.; Solecka, I. Climate Change Challenges and Community-Led Development Strategies: Do They Fit together in Fisheries Regions? Energies 2021, 14, 6614. [Google Scholar] [CrossRef]
  13. Furmankiewicz, M.; Bochenkiewicz, M. Renewable Energy and Community-Led Local Development in Poland: Do Rural Communities Take Measures to Combat Climate Change? In Sustainable Development Goals 2030: Challenges for South and Eastern European Countries and the Black Sea Region, Proceedings of the 15th International Conference of ASECU, Sofia, Bulgaria, 26–27 September 2019; Goev, V., Zarotiadis, G., Eds.; UNWE Publishing Complex: Sofia, Bulgaria, 2019; pp. 212–221. [Google Scholar]
  14. Climate Change and Heritage Working Group. The Future of Our Pasts: Engaging Cultural Heritage in Climate Action Outline of Climate Change and Cultural Heritage; International Council on Monuments and Sites-ICOMOS: Paris, France, 2019. [Google Scholar]
  15. Kittel, P. Slope deposits as an indicator of anthropopressure in the light of research in Central Poland. Quat. Int. 2014, 324, 34–55. [Google Scholar] [CrossRef]
  16. Kistowski, M. Przegląd wybranych podejść metodycznych w zakresie analizy i oceny wpływu człowieka na środowisko przyrodnicze. Probl. Ekol. Kraj. 2014, 17, 60–70. [Google Scholar]
  17. Moswete, N.; Brijesh, T.; Darley, W. Local communities’ attitudes and support towards the Kgalagadi Transfrontier Park in southwest Botswana. Sustainability 2020, 12, 1524. [Google Scholar] [CrossRef] [Green Version]
  18. Maciejko, A.; Wojtyszyn, B. Tourism Infrastructure Providing Access to Areas of Protected Landscape and Nature in Poland. Selected Examples. IOP Conf. Ser. Mater. Sci. Eng. 2019, 603, 042049. [Google Scholar] [CrossRef] [Green Version]
  19. Zawilińska, B.; Brańka, P.; Majewski, K.; Semczuk, M. National Parks—Areas of Economic Development or Stagnation? Evidence from Poland. Sustainability 2021, 13, 11351. [Google Scholar] [CrossRef]
  20. Przybyła, K.; Kachniarz, M.; Kulczyk-Dynowska, A.; Ramsey, D. The impact of changes in administrative status on the tourist functions of cities: A case study from Poland. Econ. Res.-Ekon. Istraživanja 2019, 32, 578–603. [Google Scholar] [CrossRef]
  21. CIDA (Canadian International Development Agency). Indicators for Sustainability: How Cities Are Monitoring and Evaluating Their Success. 2012. Available online: http://sustainablecities.net/wp-content/uploads/2015/10/indicators-for-sustainability-intl-case-studies-final.pdf (accessed on 12 November 2018).
  22. Solecka, I.; Krajewski, P.; Krzyżanek, A.; Garczyńska, A. Citizens’ Perceptions of Landscape Changes and Their Driving Forces: Evidence from Poland. Int. J. Environ. Res. Public Health 2022, 19, 1688. [Google Scholar] [CrossRef] [PubMed]
  23. Restrepo, C.P.; Cineas, G.; Quintero, L.E.; Zhukova, S. Cities in Eastern Europe and Central Asia: A Story of Urban Growth and Decline; Report No. AUS12288; The World Bank: Washington, DC, USA, 2017. [Google Scholar]
  24. Watson, V. The planned city sweeps the poor away…. Urban planning and 21st century urbanisation. Prog. Plan. 2009, 72, 151–193. [Google Scholar] [CrossRef]
  25. Cohen, B. Urbanization in developing countries. Current trends, future projections, and key challenges for sustainability. Technol. Soc. 2006, 28, 63–80. [Google Scholar] [CrossRef]
  26. EEA—European Environment Agency. Urban Sprawl in Europe. EEA Report No. 11/2016. Available online: https://www.eea.europa.eu/publications/urban-sprawl-in-europe (accessed on 18 April 2022).
  27. Hennig, E.I.; Schwickb, C.; Soukupc, T.; Orlitovác, E.; Kienastb, F.; Jaegera, J.A.G. Multi-scale analysis of urban sprawl in Europe: Towards a European de-sprawling strategy. Land Use Policy 2015, 49, 483–498. [Google Scholar] [CrossRef] [Green Version]
  28. Available online: https://www.undp.org/sustainable-development-goals (accessed on 30 April 2022).
  29. Zborowski, A.; Soja, M.; Łobodzińska, A. Population trends in Polish cities—Stagnation, depopulation or shrinkage? Pract. Geogr. 2012, 130, 7–28. [Google Scholar] [CrossRef]
  30. Kulczyk-Dynowska, A.; Stacherzak, A. Selected elements of technical infrastructure in municipalities territorially connected with national parks. Sustainability 2020, 12, 4015. [Google Scholar] [CrossRef]
  31. Heidrich, Z. Kierunki rozwiązań systemów kanalizacyjnych na obszarach wiejskich. Przegląd Nauk. Inżynieria Kształtowanie Sr. 2005, 14, 147–152. [Google Scholar]
  32. Jóźwiakowski, K.; Pytka, A. Rozwój gospodarki wodno-ściekowej na terenach wiejskich w Polsce w latach 1990–2008. In Gospodarka Odpadami Komunalnymi; Monografia Komitetu Chemii Analitycznej PAN: Warszawa, Poland, 2010; Volume 6, pp. 31–39. [Google Scholar]
  33. Błażejewski, R.; Murat-Błażejewska, S. Gospodarka ściekowa na terenach wiejskich. In Ocena Gospodarki Ściekowo-Osadowej w Polsce; Bień, J., Gromiec, M., Pawłowski, L., Eds.; Monografia No. 166; Polska Akademia Nauk: Lublin, Poland, 2020; pp. 77–86. [Google Scholar]
  34. Heffner, K. Zmiany przestrzenne na obszarach wiejskich w Polsce w okresie transformacji i po wejściu do Unii Europejskiej. Studia KPZK 2016, 167, 12–27. [Google Scholar]
  35. Available online: https://samorzad.pap.pl/kategoria/aktualnosci/swietalski-o-projektach-kanalizacyjnych-rzadu-takich-srodkow-tereny-wiejskie (accessed on 16 May 2022).
  36. Wiśniewska, M. Ekspansja zabudowy na tereny wiejskie. Architectura 2008, 7, 55–61. [Google Scholar]
  37. Kukuła, K. Zero unitarisation method as a tool in ranking research. Econ. Sci. Rural Dev. 2014, 36, 95–100. [Google Scholar]
  38. Kowalewski, G. Metody porządkowania liniowego. In Ekonometria; Dziechciarz, J., Ed.; Akademia Ekonomiczna: Wrocław, Poland, 2002; pp. 287–304. [Google Scholar]
  39. Sobczyk, M. Statystyka Opisowa; C.H. Beck: Warszawa, Poland, 2010; pp. 117–118. [Google Scholar]
  40. Furmankiewicz, M.; Campbell, A. From Single-Use Community Facilities Support to Integrated Sustainable Development: The Aims of Inter-Municipal Cooperation in Poland, 1990–2018. Sustainability 2019, 11, 5890. [Google Scholar] [CrossRef] [Green Version]
  41. System Gospodarowania Przestrzenią Jako Dobrem Publicznym, Nr Ewid. 193/2016/KIN. Available online: https://www.nik.gov.pl/aktualnosci/nik-o-systemie-gospodarowania-przestrzenia-gmin.html (accessed on 12 March 2022).
  42. Gawrońska, A. Klient na peryferiach. Rzeczpospolita 2020, 125, N1. [Google Scholar]
  43. Available online: https://bip.um.wroc.pl/artykuly/307/projekty-unijne (accessed on 19 April 2022).
  44. Available online: https://miasto.jeleniagora.pl/grupa/fundusze-ue (accessed on 19 April 2022).
  45. Available online: https://portal.legnica.eu/fundusze-unijne-3-1181/ (accessed on 19 April 2022).
  46. Available online: https://um.walbrzych.pl/projekty_ue/ (accessed on 19 April 2022).
  47. Available online: https://rpo.dolnyslask.pl/o-projekcie/rpo-wd-2021-2027/dokumenty-programowe/ (accessed on 18 April 2022).
Figure 1. Location of the analyzed cities. Source: own study.
Sustainability 14 06393 g001
Figure 2. The populations of Wrocław, Legnica, Jelenia Góra and Wałbrzych in 1995 and 2020. Source: authors’ compilation based on the data provided by Statistics Poland.
Sustainability 14 06393 g002
Figure 3. Change in the Wrocław population and its adjacent municipalities, with a comparison of the data for 1995 and 2020. Source: authors’ compilation based on the data provided by Statistics Poland. Legend: (1) urban municipality, (2) rural municipality and (3) urban-rural municipality.
Sustainability 14 06393 g003
Figure 4. Change in the Jelenia Góra population and its adjacent municipalities, with a comparison of the data for 1995 and 2020. Source: authors’ compilation based on the data provided by Statistics Poland. Legend: (1) urban municipality, (2) rural municipality and (3) urban-rural municipality.
Sustainability 14 06393 g004
Figure 5. Change in the Legnica population and its adjacent municipalities, with a comparison of the data for 1995 and 2020. Source: authors’ compilation based on the data provided by Statistics Poland. Legend: (1) urban municipality, (2) rural municipality and (3) urban-rural municipality.
Sustainability 14 06393 g005
Figure 6. Change in the Wałbrzych population and its adjacent municipalities, with a comparison of the data for 1995 and 2020. Source: authors’ compilation based on the data provided by Statistics Poland. Legend: (1) urban municipality, (2) rural municipality and (3) urban-rural municipality.
Sustainability 14 06393 g006
Figure 7. Change in the volume of waste per resident in 2020 (analyzed year) against 2017 (base year): (1) urban municipality, (2) rural municipality and (3) urban-rural municipality. Source: authors’ compilation based on the data provided by Statistics Poland.
Sustainability 14 06393 g007
Table 1. Ranking of the population increases in the analyzed municipalities for the base year 1995 and analyzed year 2020.
No.Municipality NameIncrease or Decrease in Percentage * of PopulationRanking Position
1Boguszów-Gorce (1)−18.4027
2Czernica (2)146.271
3Długołęka (2)108.052
4Janowice Wielkie (2)1.4714
5Jedlina-Zdrój (1)−13.8425
6Jelenia Góra (1)−16.1826
7Jeżów Sudecki (2)30.219
8Kąty Wrocławskie (3)52.007
9Kobierzyce (2)94.834
10Krotoszyce (2)−1.2919
11Kunice (2)65.965
12Legnica (1)−8.8024
13Legnickie Pole (2)1.0215
14Mieroszów (3)−18.5329
15Miękinia (2)62.026
16Miłkowice (2)7.9812
17Mysłakowice (2)−0.9218
18Oborniki Śląskie (3)22.3710
19Piechowice (1)−18.4428
20Podgórzyn (2)3.2913
21Siechnice (3)97.693
22Stara Kamienica (2)−1.4320
23Stare Bogaczowice (2)−0.2817
24Szczawno-Zdrój (1)−7.4321
25Świdnica (2)15.5711
26Świebodzice (1)−8.7622
27Walim (2)−8.7623
28Wałbrzych (1)−21.0130
29Wisznia Mała (2)51.928
30Wrocław (1)−0.0116
Legend: (1) urban municipality, (2) rural municipality and (3) urban-rural municipality. * A negative value means a decrease and a positive value means an increase in the population number. Source: authors’ compilation based on the data provided by Statistics Poland.
Table 2. SDM of water and sewage systems in the analyzed municipalities using data for 1995 and 2020.
Municipality Name19952020SDM Increase
SDMLSDML%
1Boguszów-Gorce (1)0.130140.31519141
2Czernica (2)0.22740.5543144
3Długołęka (2)0.064260.35016451
4Janowice Wielkie (2)0.067250.42712541
5Jedlina-Zdrój (1)0.159110.36813132
6Jelenia Góra (1)0.20960.44110111
7Jeżów Sudecki (2)0.063270.24727292
8Kąty Wrocławskie (3)0.102190.35515248
9Kobierzyce (2)0.21050.4817130
10Krotoszyce (2)0.077230.4759518
11Kunice (2)0.133130.5164288
12Legnica (1)0.35920.495538
13Legnickie Pole (2)0.090210.43711388
14Mieroszów (3)0.090220.26223192
15Miękinia (2)0.096200.27822189
16Miłkowice (2)0.20670.6211201
17Mysłakowice (2)0.058280.34918499
18Oborniki Śląskie (3)0.122160.2182978
19Piechowice (1)0.20090.2222811
20Podgórzyn (2)0.128150.4758270
21Siechnice (3)0.122170.29120139
22Stara Kamienica (2)0.005300.254245466
23Stare Bogaczowice (2)0.046290.28621521
24Szczawno-Zdrój (1)0.160100.2532558
25Świdnica (2)0.117180.25126114
26Świebodzice (1)0.20180.4906144
27Walim (2)0.069240.15930130
28Wałbrzych (1)0.26430.3561435
29Wisznia Mała (2)0.137120.34917156
30Wrocław (1)0.39910.575244
Legend: L = position based on SDM, (1) urban municipality, (2) rural municipality and (3) urban-rural municipality. Source: authors’ compilation based on the data provided by Statistics Poland.
Publisher’s Note: MDPI stays neutral with regard to jurisdictional claims in published maps and institutional affiliations.

