
Risk Assessment of Soil Erosion Using a GIS-Based SEMMA in Post-Fire and Managed Watershed


1
Institute for Disaster Prevention, Gangneung-Wonju National University, Gangneung 25457, Korea
2
Department of Civil Engineering, Gangneung-Wonju National University, Gangneung 25457, Korea
*
Author to whom correspondence should be addressed.
Sustainability 2022, 14(12), 7339; https://0-doi-org.brum.beds.ac.uk/10.3390/su14127339
Submission received: 14 April 2022
/
Revised: 5 June 2022
/
Accepted: 13 June 2022
/
Published: 15 June 2022
(This article belongs to the Special Issue Soil Erosion and Water and Soil Conservation)
Abstract
:A large wildfire occurred due to strong winds and dry climates in the Gangwon province of South Korea. Thereafter, floods and sediment damage were caused by Typhoon Mitag in the burned areas. This study was an attempt to quantitatively evaluate the risk of soil erosion in wildfire areas using the Soil Erosion Model for Mountain Areas (SEMMA) based on GIS, which was developed in South Korea. The model required the integration of maps of the main factors involved, i.e., rainfall erosivity, vegetation index, soil erodibility, and slope length and steepness. According to the model simulation results, high erosion rates of over 100 t/ha were concentrated within the wildfire areas. Sediment yields from the study watershed, including the wildfire areas, were estimated to be 40.33 t/ha for the 30-year frequency of rainfall, which is similar to those of the typhoon. The high risk of erosion was predominantly observed in the upper mountains, which are characterized by steep slopes, silt loam, and shallow soil depths within the wildfire areas. Urgent and excessive logging of burned trees further increased the risk of erosion. However, various treatment strategies were implemented to control soil erosion and sediment transport from the post-fire watershed. This study confirmed that temporal and spatial BMPs should be selected and enforced to reduce sediment disasters in wildfire areas.
1. Introduction
In recent years, large-scale wildfires have frequently occurred due to an increase in the average temperature and the number of dry days, prolonged droughts, and strong winds associated with climate change in Korea [1,2,3,4,5]. They have also been noted and expected to increase in various countries around the world, such as Australia, the USA, and Europe [6,7,8,9,10,11,12,13,14]. In wildfire areas that have burned vegetation and litter layers, rainfall enhanced by climate variability can accelerate floods and sediment damages [15,16,17,18]. Raindrops directly impact the topsoil, and surface runoff greatly increases as the infiltration rate is reduced by strong, water-repellent soil and the loss of ground cover and organic matter [19,20,21,22,23,24,25,26]. The peak discharge in post-fire regions dominated by short-duration and high-intensity rainfall increases the risk of floods and sediment damage [27,28,29,30,31]. Studies on wildfire areas suggest that runoff increases to a certain degree, but soil erosion increases several dozen times under natural or artificial rainfall conditions [32,33,34,35,36].
The Revised Universal Soil Loss Equation (RUSLE), which is an improved version of the Universal Soil Loss Equation (USLE) for evaluating soil erosion on agricultural land [37,38], can be applied to developed land and forested areas [39]. The application range of RUSLE using the GIS and remote sensing techniques has been expanded [40,41,42,43,44,45,46,47]. The Water Erosion Prediction Project (WEPP), a physics-based hydrological soil erosion model, simulates soil erosion and runoff from small slopes to medium-scale watersheds in arable land, grazing land, and forest land [48]. Renschler [49] presented GeoWEPP, which performs spatial analyses on the Geographic Information System (GIS). This model has been used to evaluate runoff and sediment runoff in domestic watersheds [50,51]. Kim et al. [52] confirmed that the GeoWEPP simulates the observed values more accurately than USLE as a result of evaluating the sediment yield for non-fire watersheds.
The Soil Erosion Model for Mountain Areas (SEMMA) model, which is based on the RUSLE, is an empirical model developed for mountain areas in South Korea to overcome local heterogeneity of parameters such as rainfall, soil, morphology, and vegetation [53]. Domestic application results from the SEMMA for burned hillslopes showed a higher simulation efficiency as compared to those of RUSLE and WEPP, which have long been improved in various applications [54]. The RUSLE and WEPP were under-predicted the actual erosion when the vegetation cover was small and the rainfall was large. This is because these models did not reflect the effects of the water-repellent fine soil particles being exposed to rainfall impact and surface runoff immediately after the fire. Detailed calibrations of their major parameters are still necessary for applications in domestic wildfire areas. The cover factor of the SEMMA, which considers the structure and distribution of vegetation, is difficult to estimate for large-scale areas. To expand to the catchment scale, the SEMMA was improved by using the Normalized Difference Vegetation Index (NDVI) from the satellite image and the Digital Elevation Model (DEM) from the digital topographic map [55]. The method has been validated on a small-scale post-fire watershed, but it has never been applied to large-scale areas. As the acquisition of high-resolution satellite images has become easier, the use of the NDVI for calculating the index factor C of the RUSLE has continuously increased [43,44,45,46,47]. Studies on vegetation index calculations for large-scale wildfire areas have become more common with the development of remote sensing technology [56,57,58,59,60]. Furthermore, the use of NDVI has been expanded by models that combine the GIS environment to evaluate the risk of soil erosion in wildfire areas [13,61,62].
A large wildfire in April 2019 occurred in an eastern mountainous area of South Korea. The farmland, rivers, and infrastructures within the wildfire areas were secondarily damaged by floods and sediments due to Typhoon Mitag in the same year. This study aimed to quantitatively evaluate the risk of soil erosion in wildfire areas based on the GIS using the SEMMA developed for mountainous areas in South Korea and to suggest the directions for best management practices by confirming the change in the erosion rate according to ground conditions after the wildfires and associated management.
2. Methods
2.1. Study Area
2.1.1. Area Description
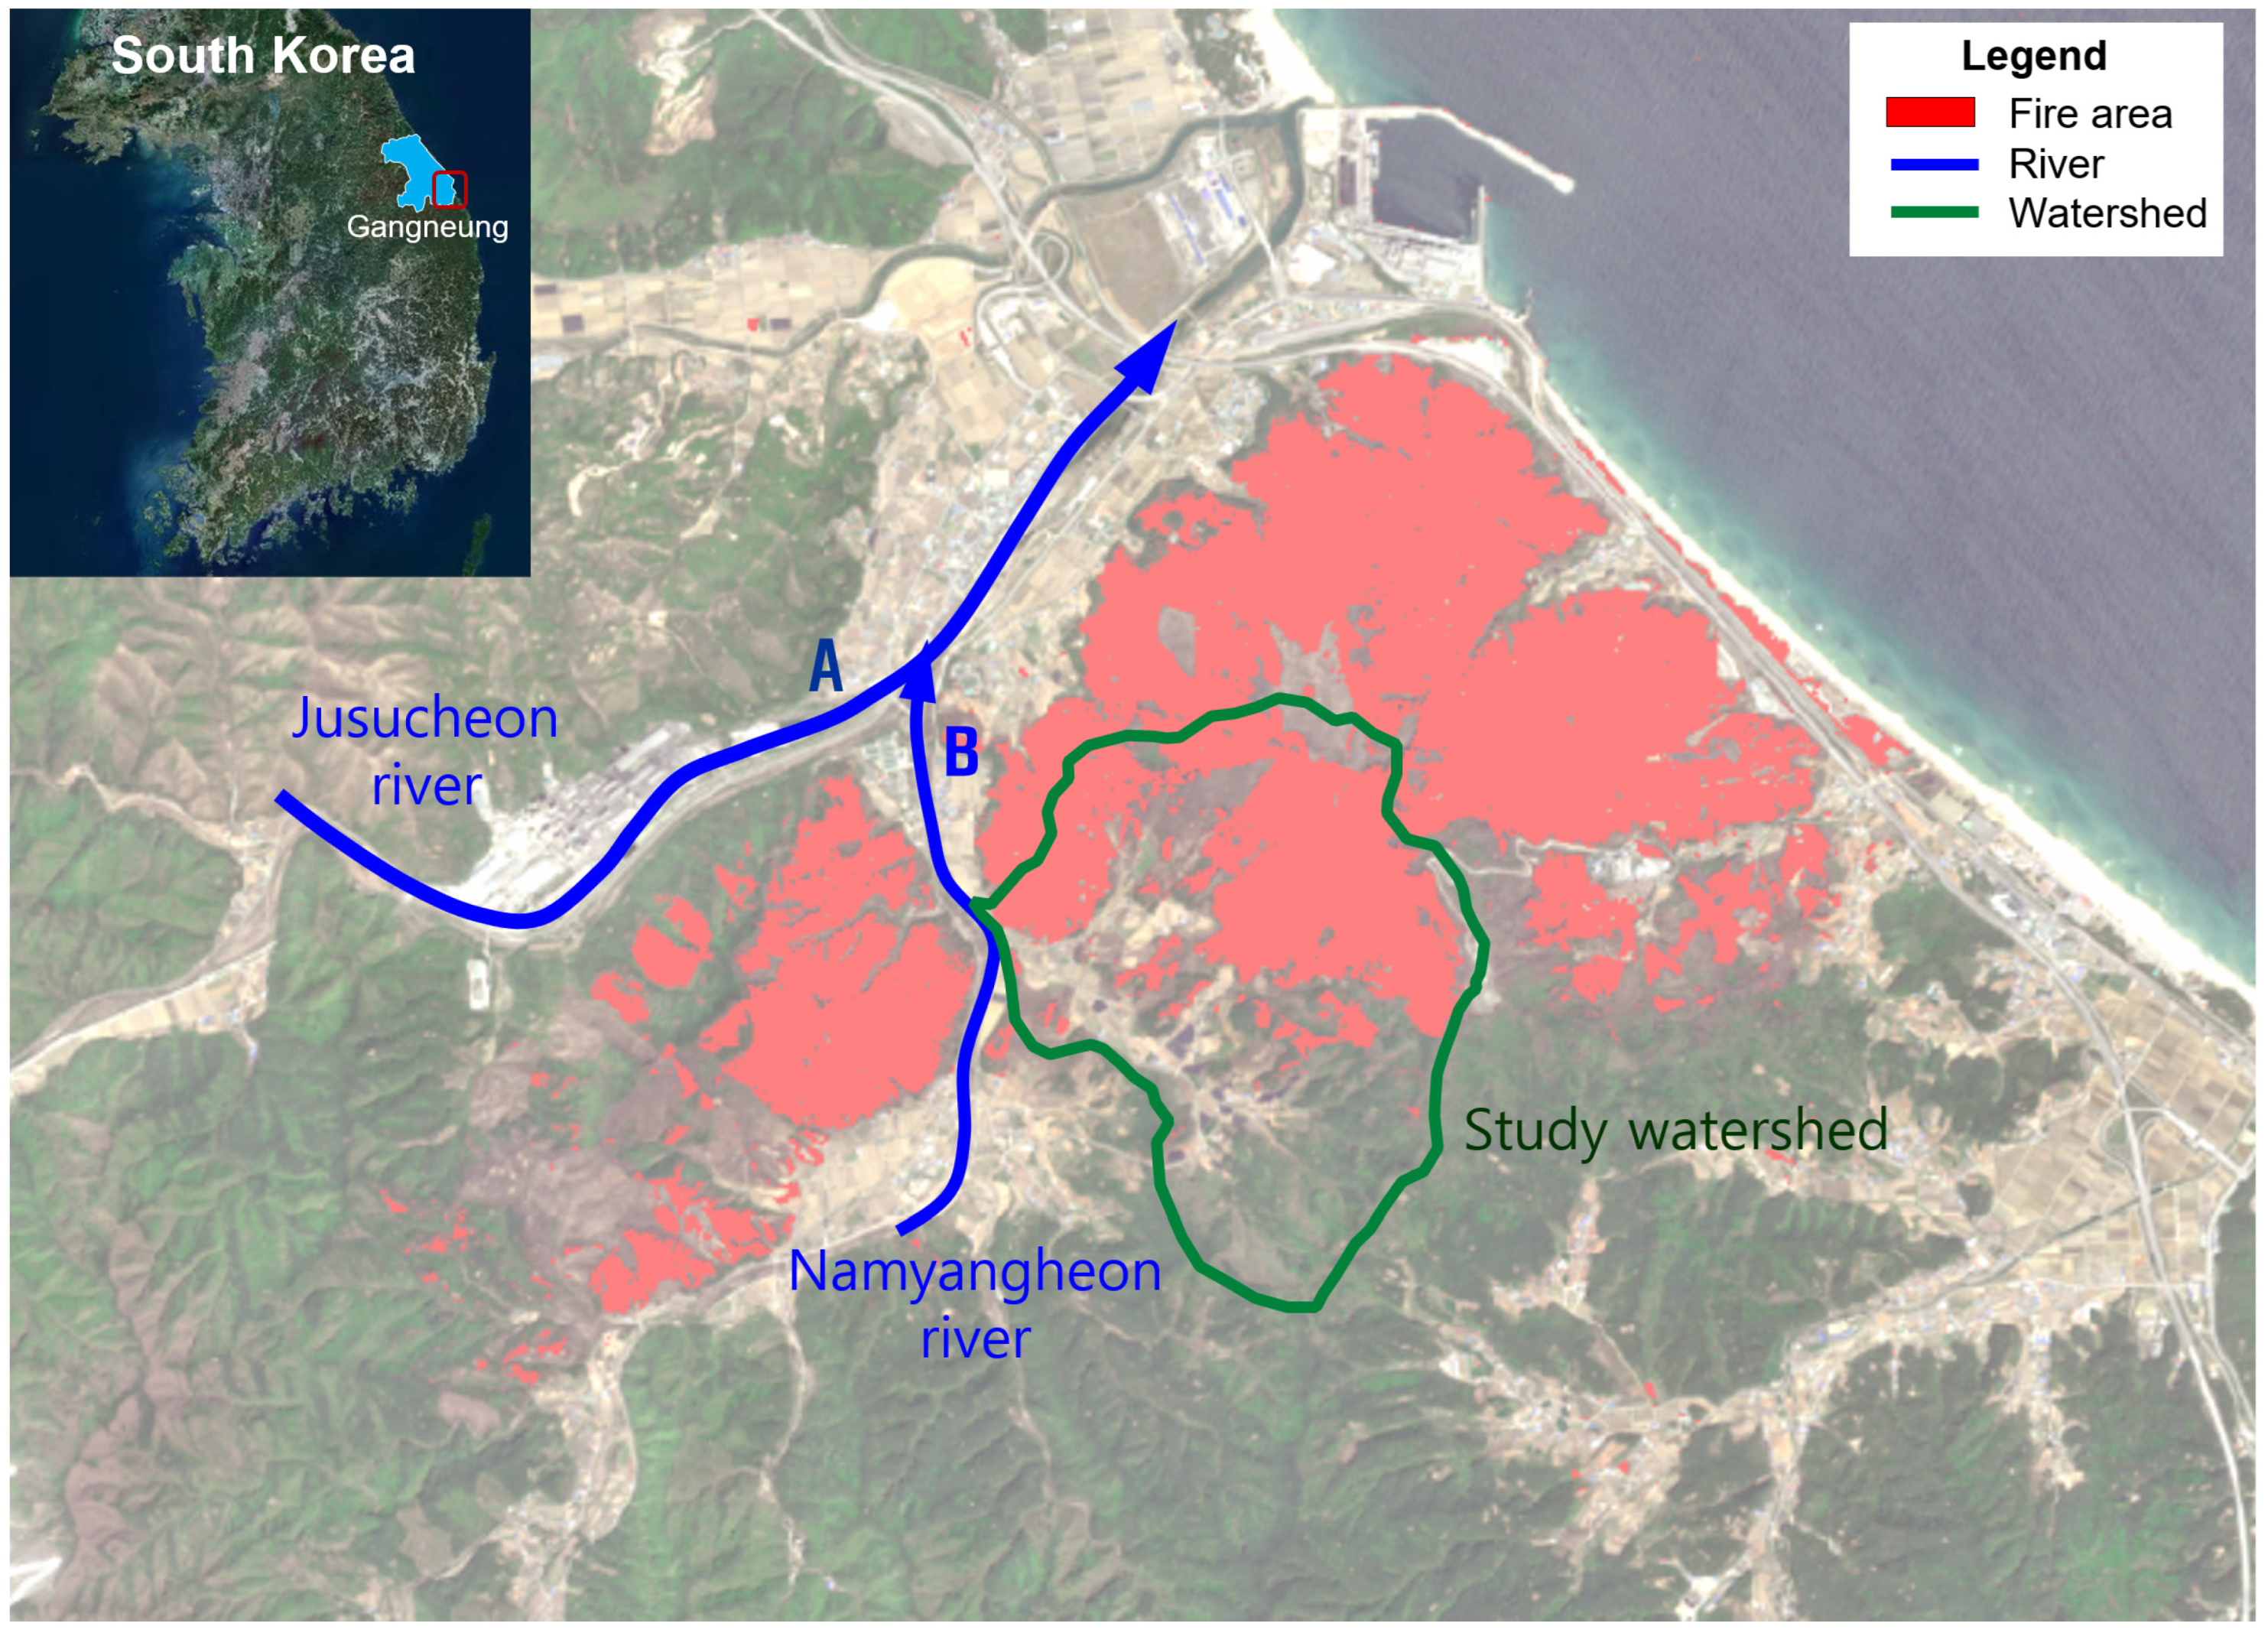
Okgye, the wildfire area, is located in the eastern part of the Taebaek Mountains in South Korea (37°57′–62′ N and 129°00′–08′). A large wildfire in April 2019 occurred in the hills of Okgye, Gangneung, and spread to the nearby East Sea beach as a result of the strong and dry winds. The area damaged by the wildfire was over 1260 ha. The soil textures of the surface layer in the fire area were loam and silt loam, in which the parent rocks of the region are the Paleozoic metamorphic sedimentary rock [63]. According to the USDA soil taxonomy [64], the soil was Inceptisol, which has altered horizons that have lost bases or iron and aluminum but retain some weatherable minerals. The suborder was Cambisol, a soil at the beginning of soil formation, in which the horizon differentiation is weak [65]. The dominant vegetation species combusted by wildfire was Pinus densiflora, inhabiting during monsoon climate [66].
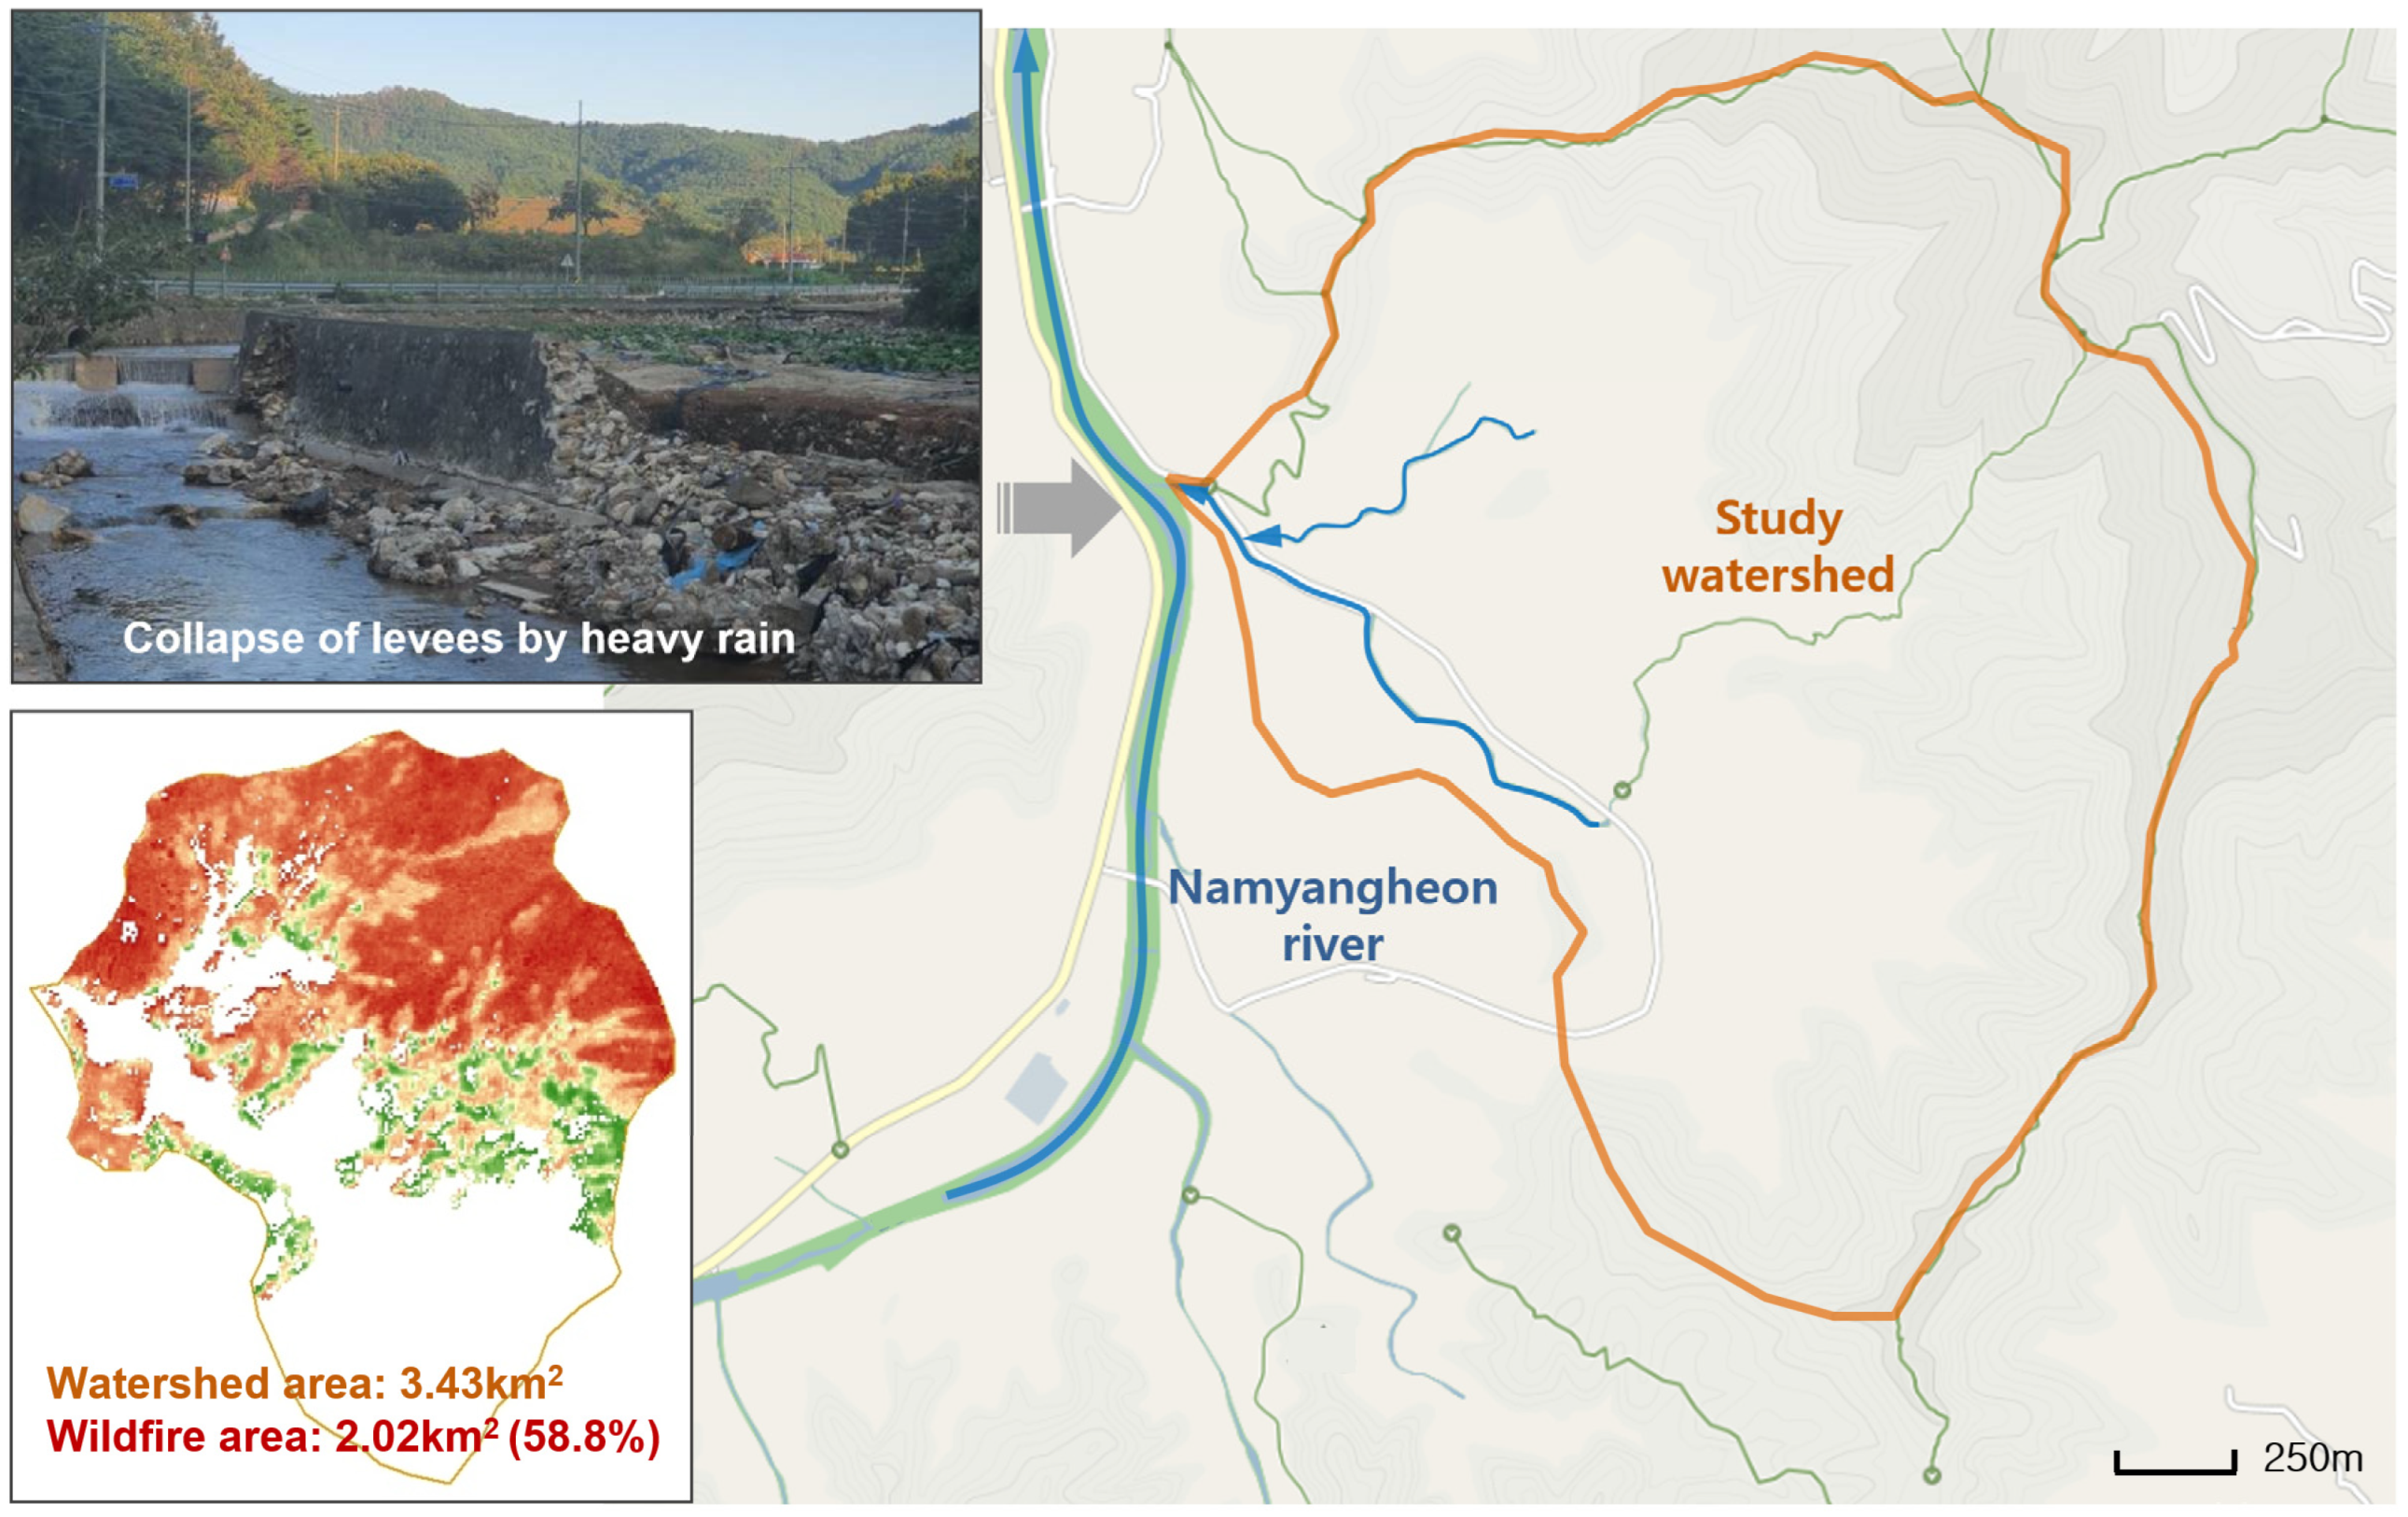
The Okgye wildfire area is located to the south of the Jusucheon river, a small river that has a total length of 15.5 km, passing through Okgye-myeon (Figure 1). Jusucheon river forms a gorge as it passes through high mountains upstream of the basin and has a meandering flow. As it flows downstream, it joins other small rivers, such as the Namyangcheon and Nakpungcheon rivers, and reaches the East Sea. The Namyangcheon river is the first tributary of the Jusucheon river and has a length of the stream is 11.5 km and a watershed area is 34.15 km2. The downstream section of the Namyangcheon river before its confluence with the Jusucheon river corresponds to the area affected by wildfires. Over half of the area of the study watershed located downstream of the Namyangcheon river was damaged by wildfires.
2.1.2. Rainfall Characteristics
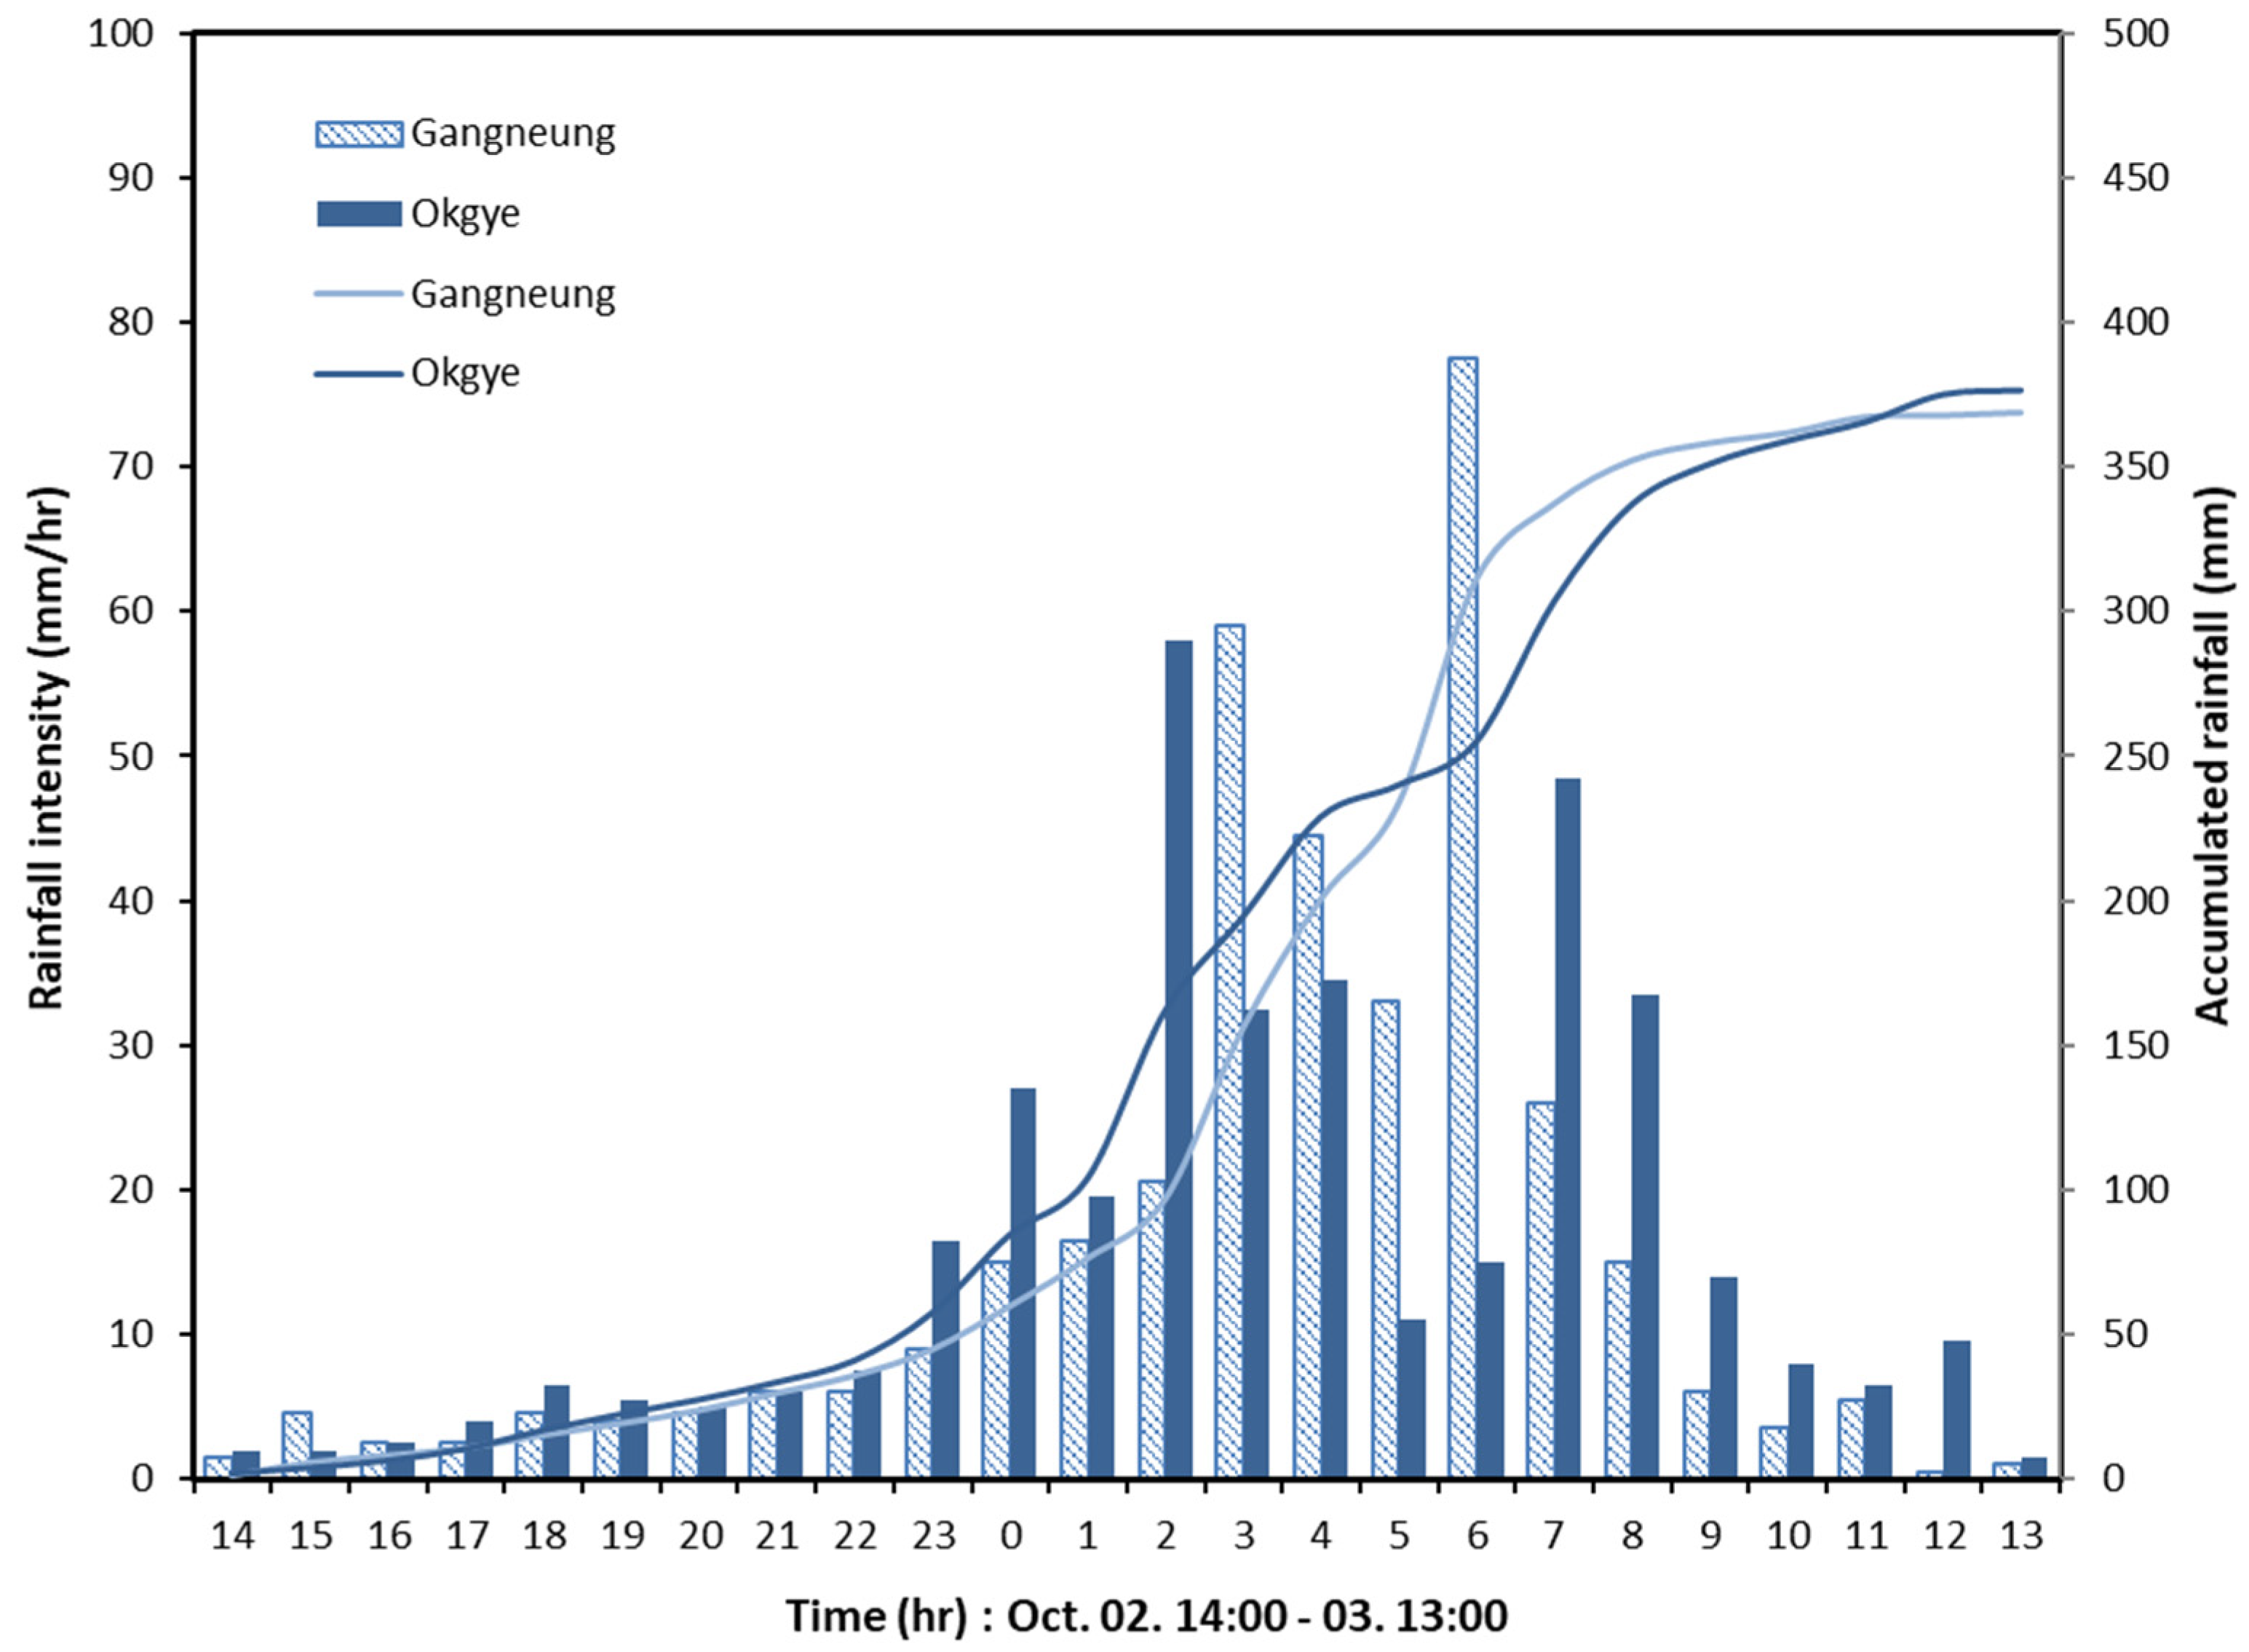
The Gangneung area, where the wildfire occurred, had an average temperature of 13.5 °C and annual precipitation of 1444.9 mm from 1991 to 2020. In the year of the wildfire, all rainfall events were less than 200 mm per day during the rainy season from July to September. Heavy rain, i.e., more than 300 mm/day, was caused by Typhoon Mitag, which occurred on 2–3 October. The rainfalls in Gangneung and Okgye were 369 mm/day and 375 mm/day, respectively. A rainfall hyetograph to compare the distribution of rainfall intensity in those locations is shown in Figure 2. The maximum rainfall intensities in Gangneung and Okgye observed by the Korea Meteorological Administration (KMA) were 77.5 mm/h and 64.5 mm/h, respectively. As shown in Table 1, the probabilistic rainfalls of gamma distribution for rainfall data (1971–2020) in Gangneung using the Regional Frequency Analysis for Hydrological Data Software [67] were compared with the observed rainfalls. The maximum rainfall for 24 h in Gangneung was close to the 30-year frequency, but the maximum rainfall for 1 h was more than the 50-year frequency. For the Okgye area, the maximum rainfalls for 24 h and 1 h were similar to those of the 30-year frequency.
2.1.3. Damage after Wildfire and Heavy Rain
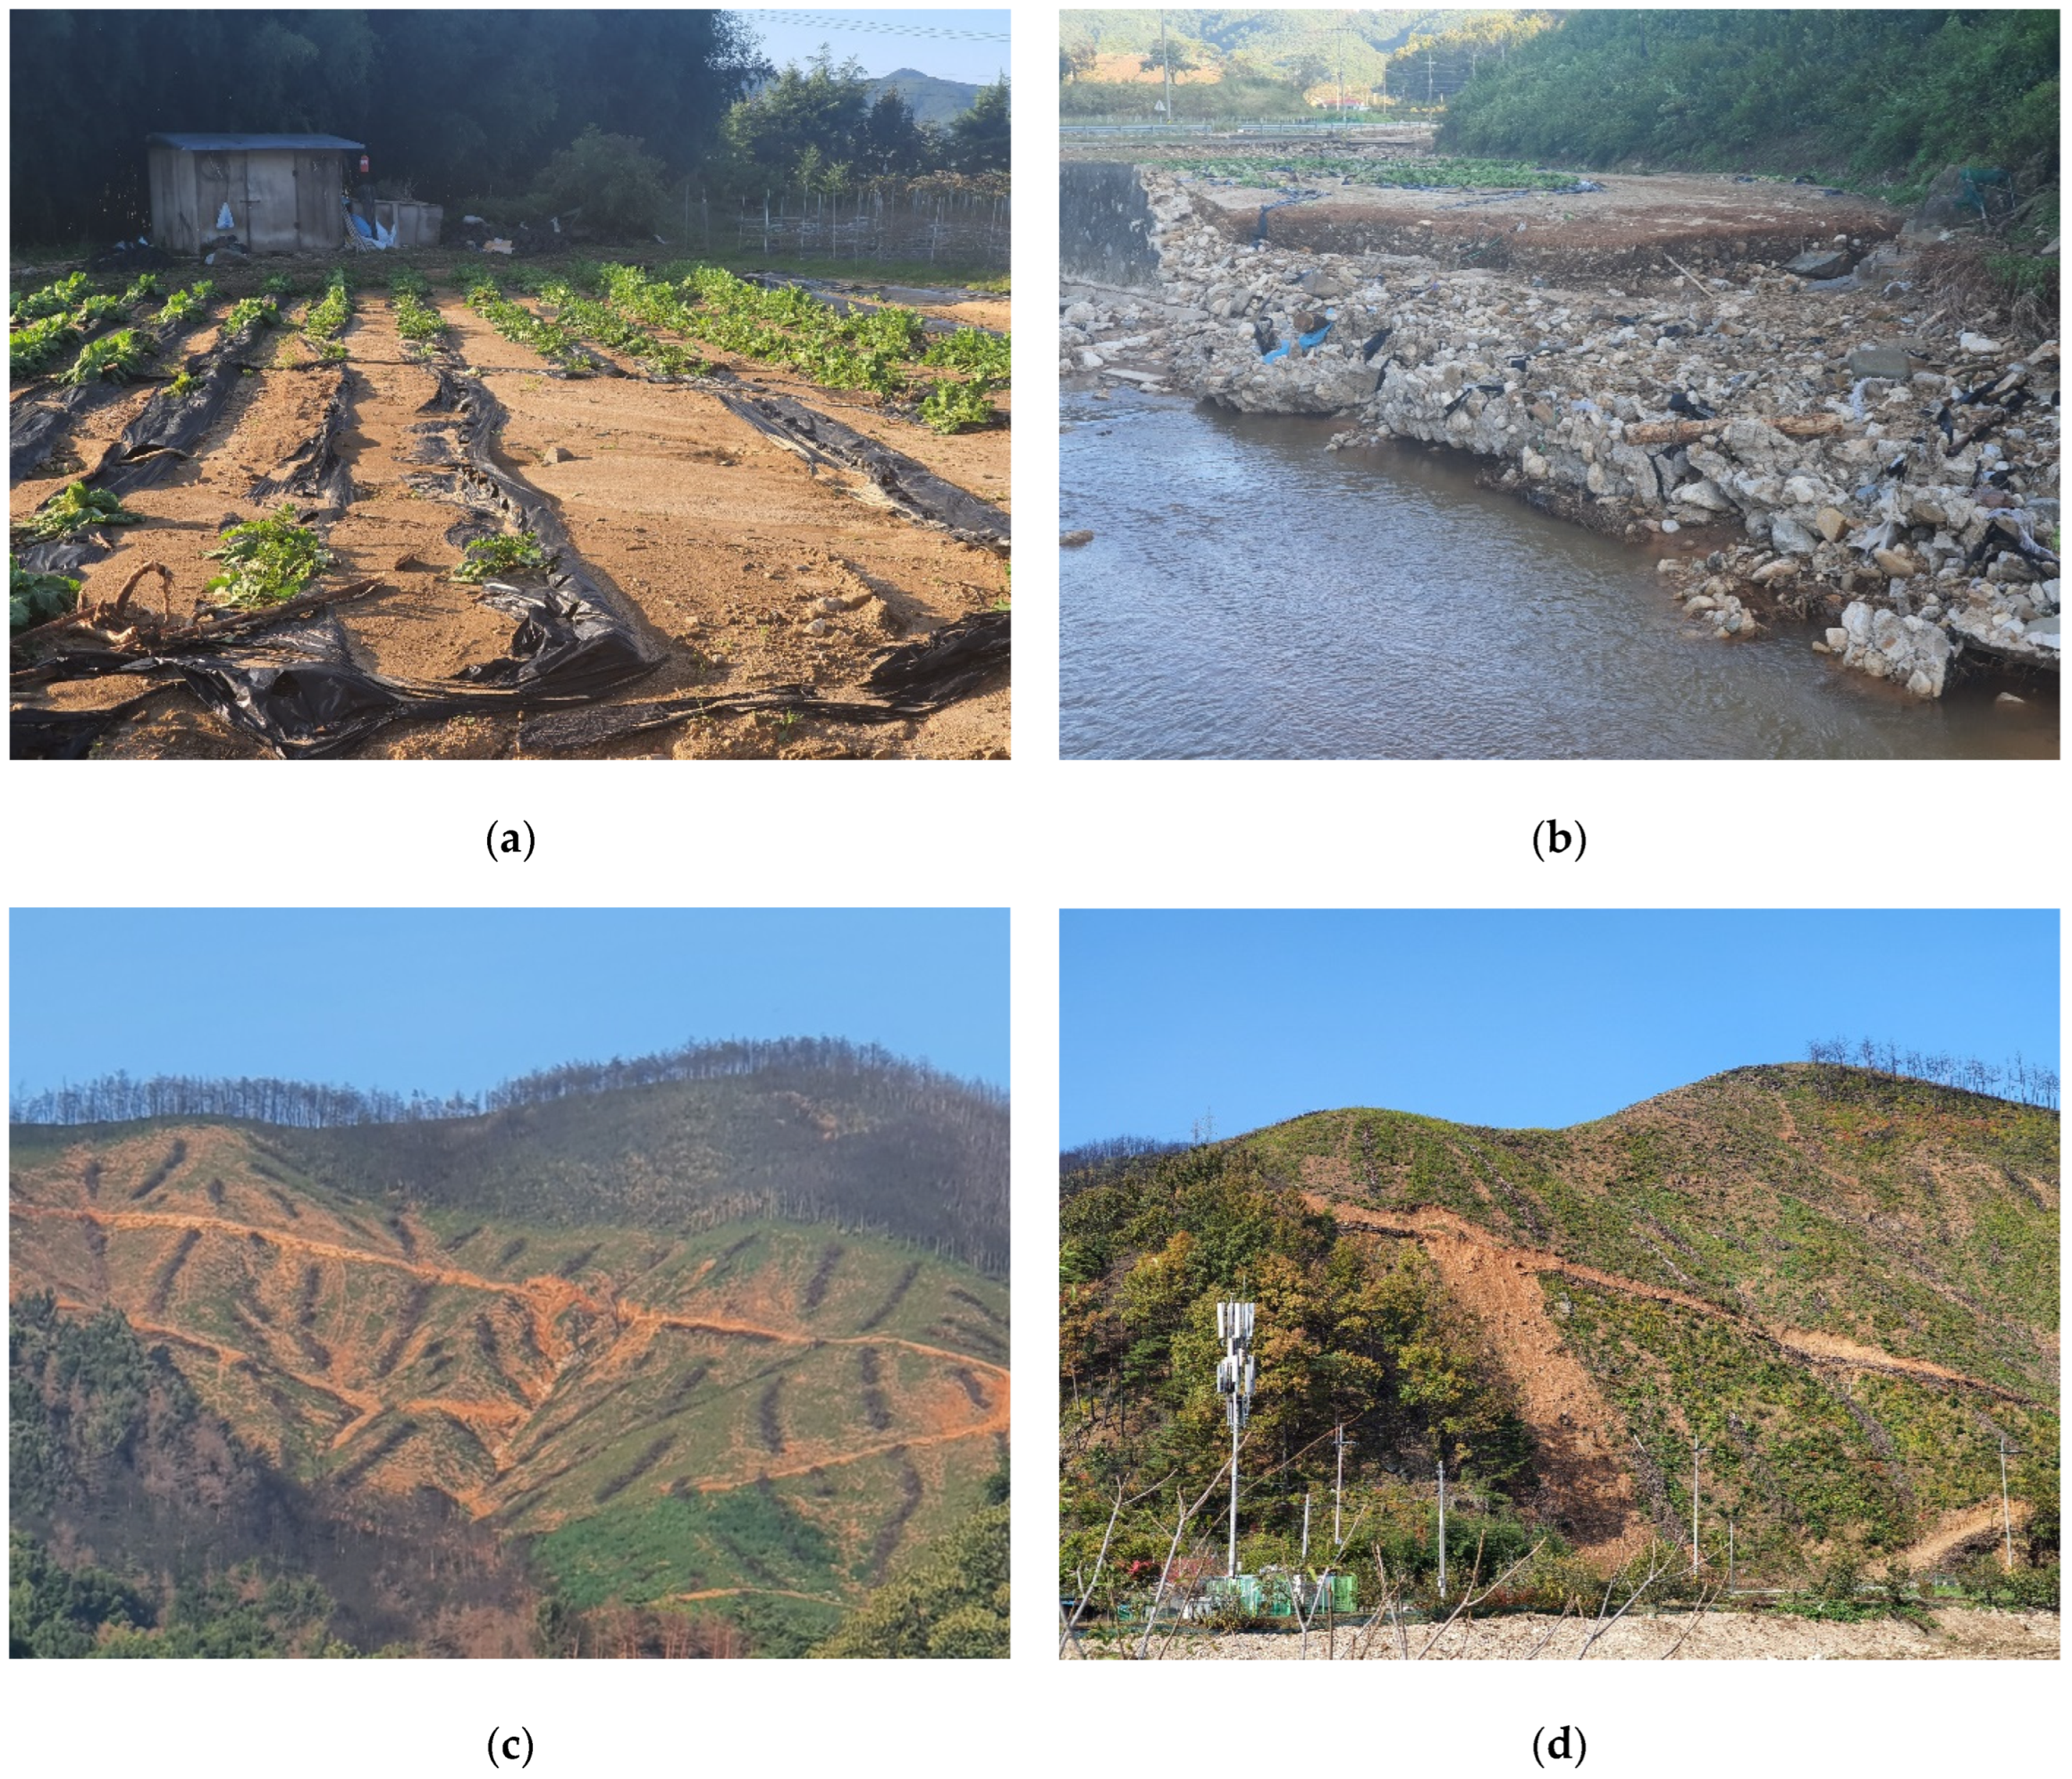
The heavy rain from Typhoon Mitag created flood and sediment damage in the Okgye wildfire area (Figure 3). As the surface vegetation and litter residues were lost due to the strong fire, the overland flow increased, the rivers overflowed, and roads, bridges, and banks collapsed. Landslides occurred on hillslopes that had been weakened by road construction, allowing heavy equipment after fire damage. Additionally, the erosion of gullies and valleys was severe in areas disturbed by wildfire and logging. As much sediment transported into rivers was deposited onto river beds, the risk of flooding increased due to the lack of discharge capacity.
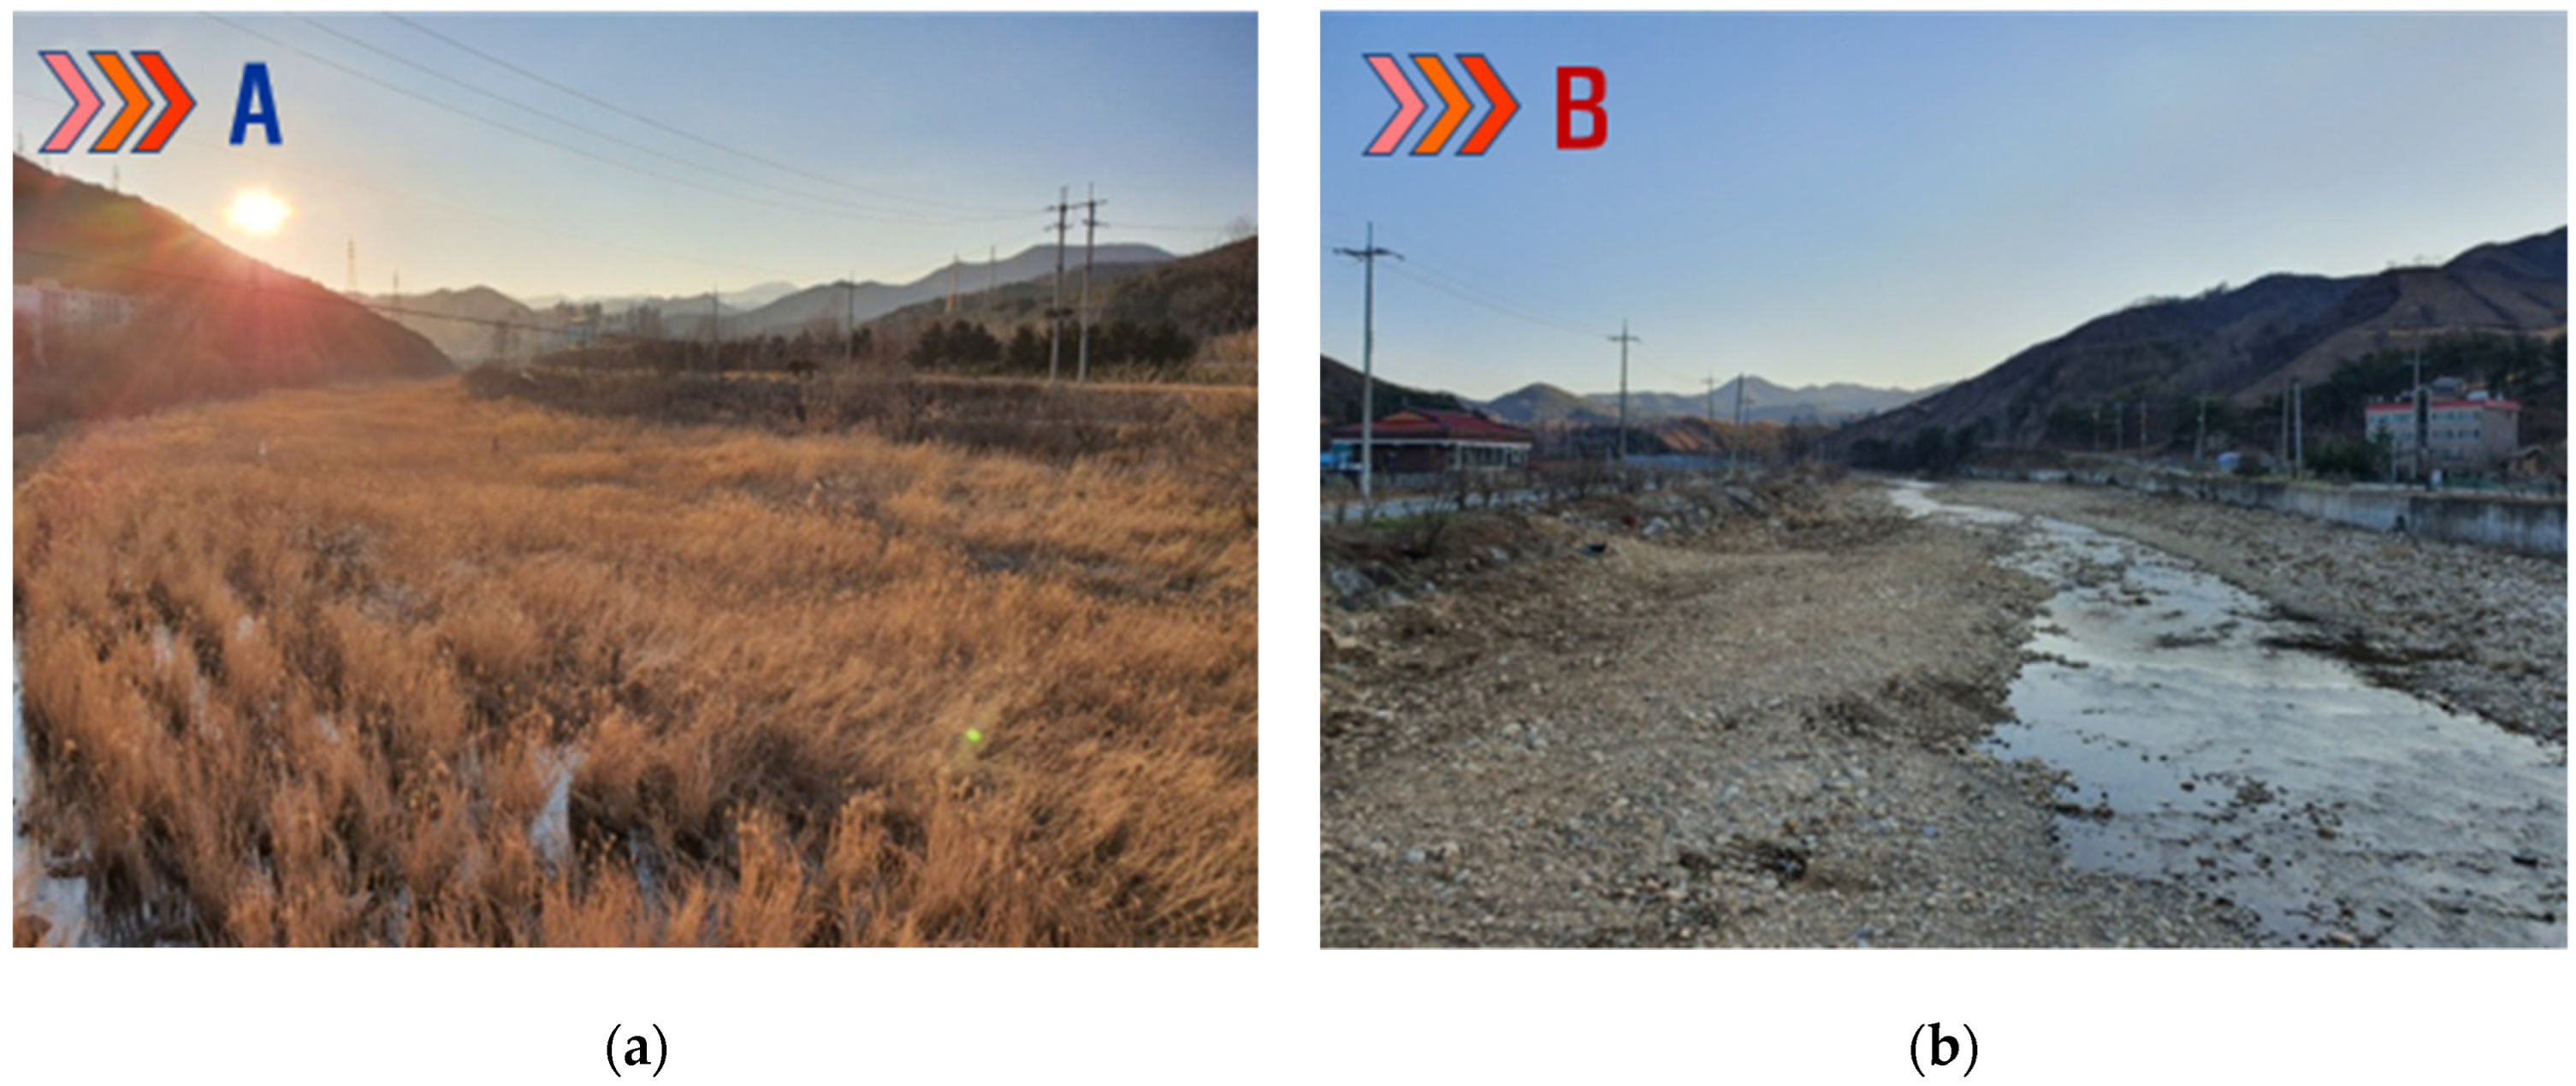
Although the 24 h rainfall in Okgye was 375.0 mm, which is close to the 30-year frequency of rainfall, there was no major damage in the Jusucheon river located in the non-wildfire area. However, the Namyangcheon river, located in the wildfire area, exhibited completely different river conditions (Figure 4). Despite the same rainfall occurring in the adjacent distance (Figure 1), the existing riparian plants in the Jusucheon river were preserved, while the Namyangcheon river was composed of gravel beds due to the deposition of huge sediments flowing from upstream. This means that the prosperous plants on the river beds and banks before the heavy rain were buried by transported sediments. This is definite evidence that the heavy rains in wildfire areas increased the sediment and flood damage.
2.1.4. Selection of the Study Watershed
The small watershed connected to the Namyangcheon river was selected as the study watershed in order to evaluate the sediment yield after wildfire and management (Figure 5). A watershed is a place where damage, including burial of agricultural land, flooding, and collapse of levees, occurs due to excessive surface runoff and sediment yield from the heavy rain. The watershed area was 3.427 km2, and an area of 2.015 km2 representing 58.8% of the total area, was damaged by wildfire. The northern part of the watershed is a wildfire area, and the southern part is a forest region dominated by pine trees. The Babbong (323.1 m) and Mangunsan (301.0 m) mountains are located on the east side of the basin, and small streams flow from east to west. Steep hillslopes are formed along the ridge of the mountain peak, and the hillslopes are gradually gentler toward the exit of the basin. Thus, it is a basin in which agricultural land and villages have been built up around the streams.
2.2. Data Analysis
2.2.1. Soil Erosion Model
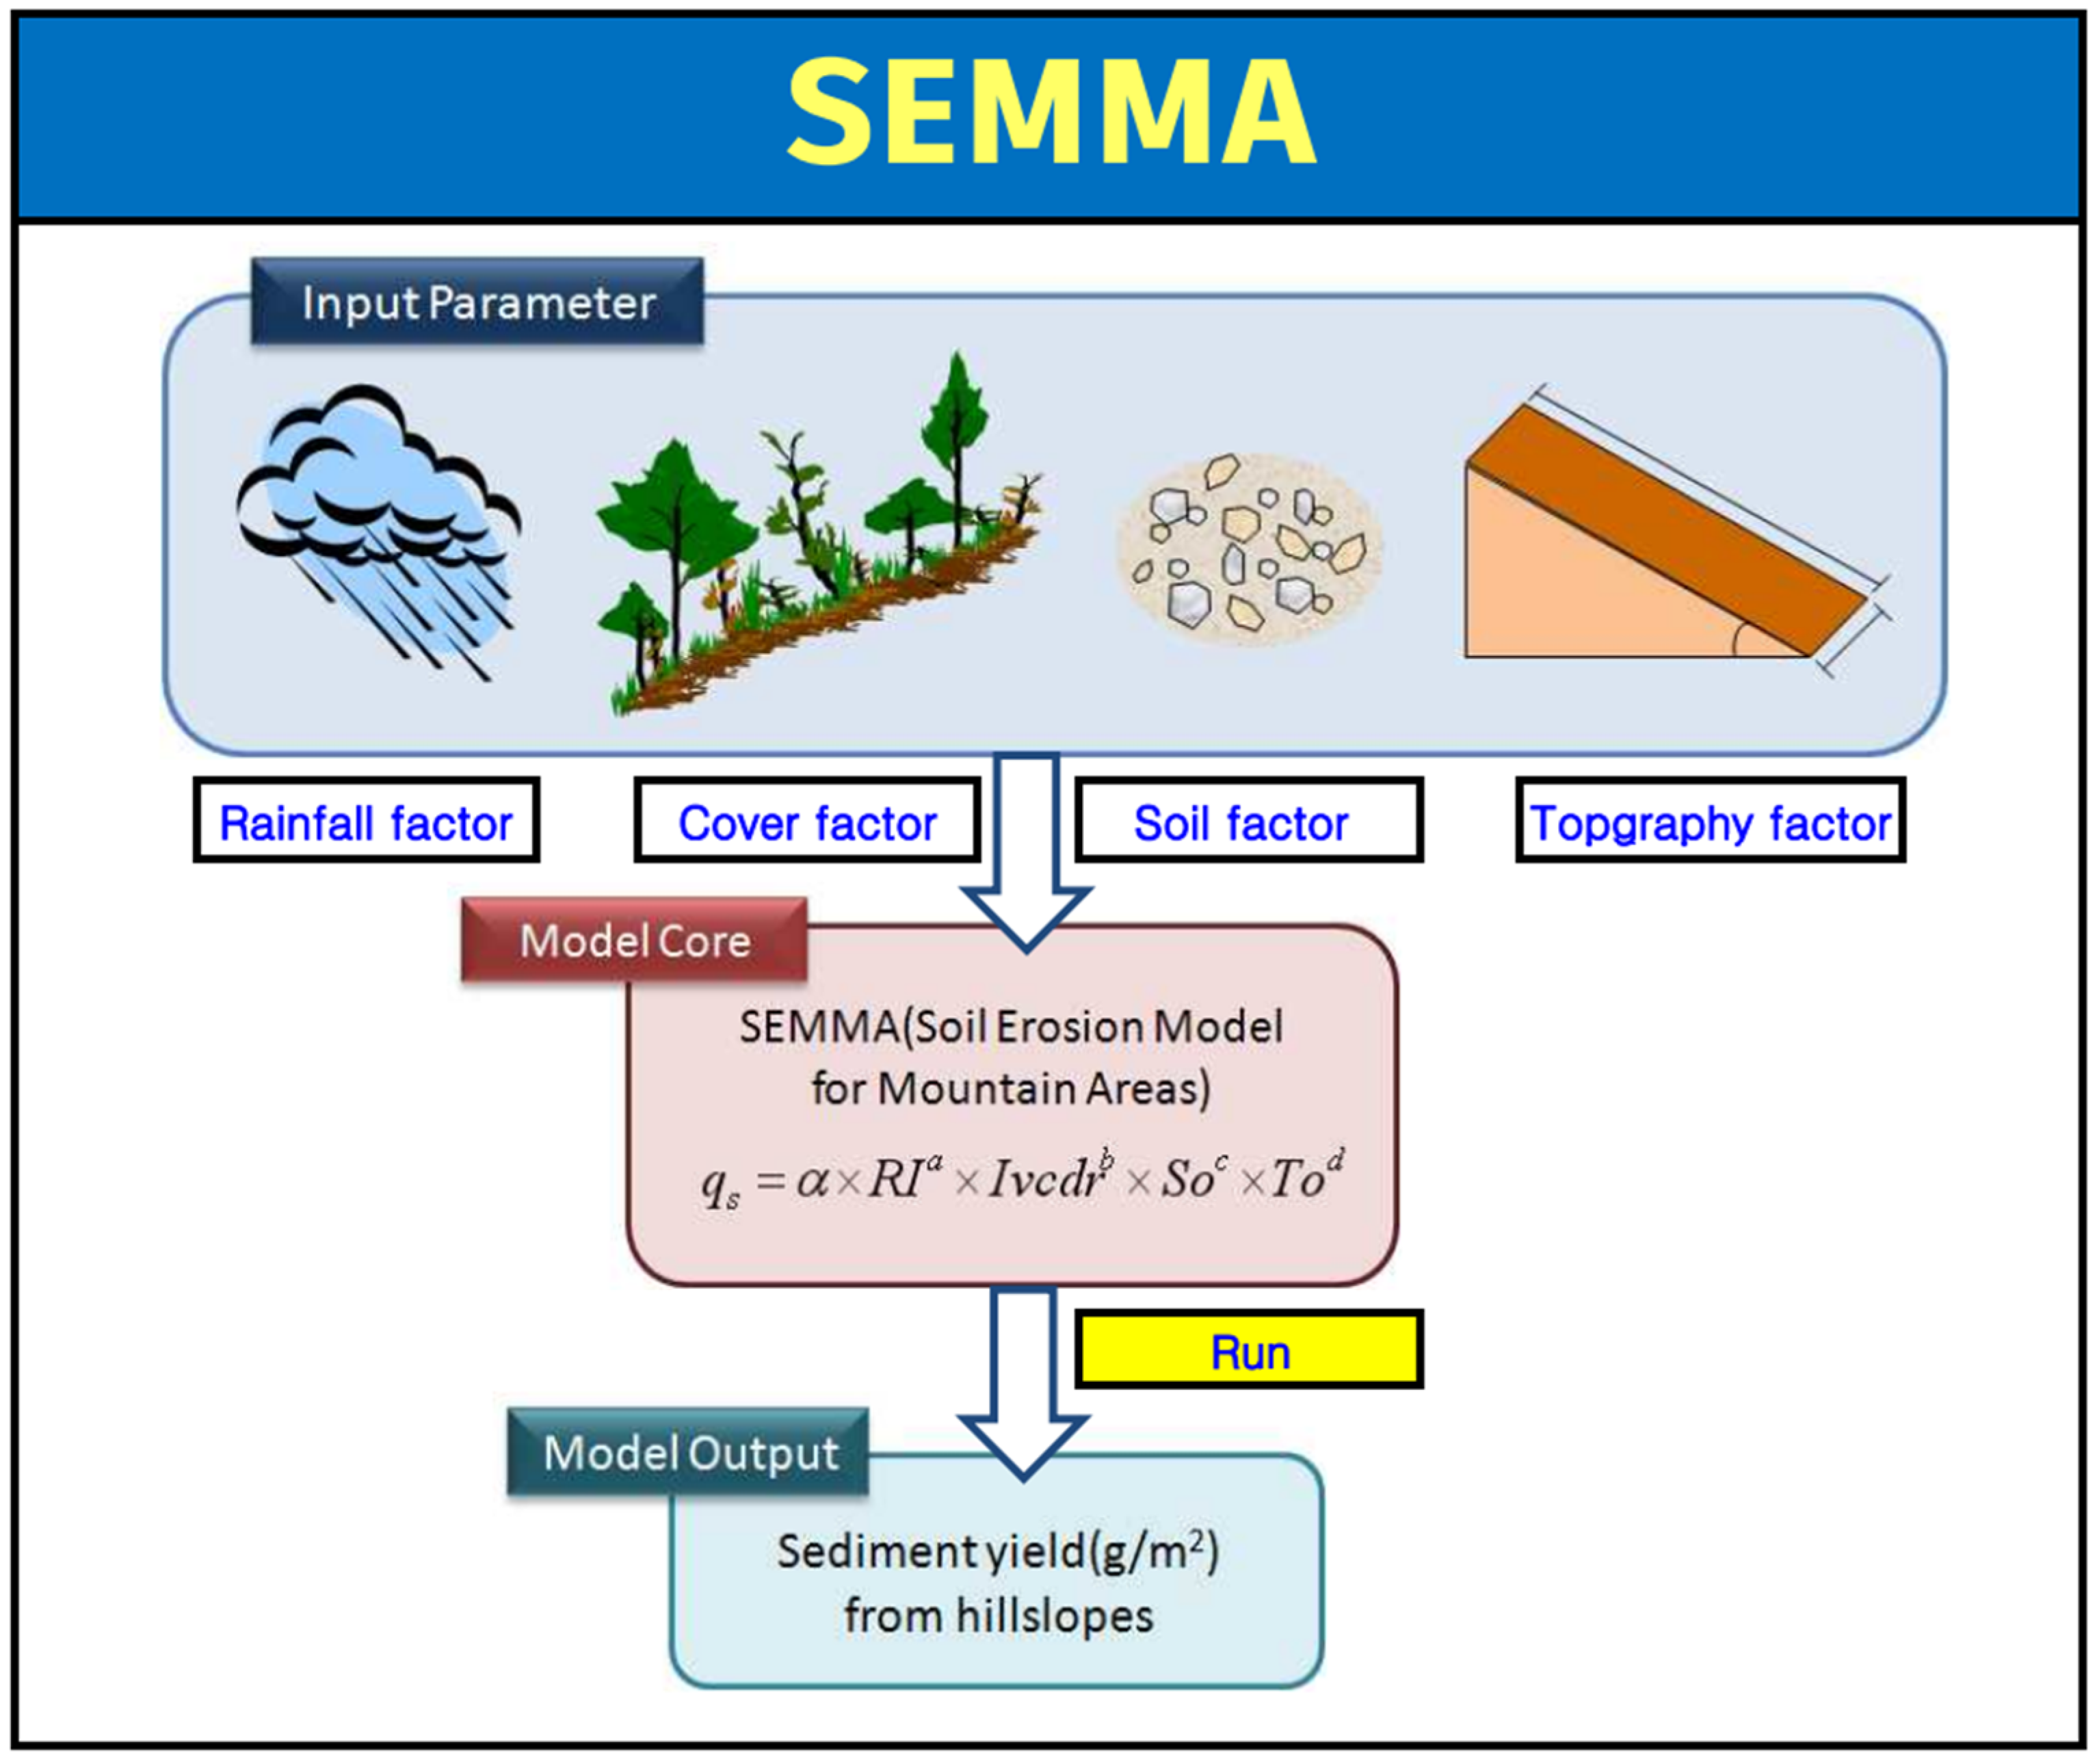
The Soil Erosion Model for Mountain Areas (SEMMA), developed in South Korea, is an empirical model for predicting soil loss from mountain slopes caused by a single rainfall event [57]. This model can be applied to both natural mountain areas and areas that are subject to rapid changes in the mountainous environment, resulting from events such as wildfires, logging, landslides, and slope management. The basic SEMMA equation based on the RUSLE [39] is as follows.
where is the sediment yield (g/m2) from hillslopes, is the rainfall factor consisting of rainfall energy and the maximum rainfall intensity for 30 min, is the vegetation structure index considering vegetation and litter layers covering the surface soil and the fine root ratio, is the soil factor composed of organic content, soil depth, gravel ratio, and soil texture, is the topography factor, is the coefficient, and are the exponents.
SEMMA is based on the statistical validity of parameters dominant in soil erosion and consists of multiple regression equations using regression analysis. The rainfall erosivity and topography factors of SEMMA are similar to those of the RUSLE. However, the soil and cover factors used representative parameters for a mountainous environment, such as gravel content, soil depth, vegetation and litter layers, fine root, etc. [54]. This model encompasses interrill erosion by sheet flow interacting with raindrop splashes and rill erosion by the concentrated flow of surface runoff. Soil erosion in mountain areas is particularly influenced by the rainfall scale and vegetation distribution according to the sensitivity analysis [54]. The initial model was a single equation that overestimates when soil erosion is small and underestimates it in many cases. In order to increase the simulation efficiency, the model was subdivided according to the ranges of rainfall and vegetation coverage, considering the hydrological and physical processes of erosion [36,54]. A SEMMA program based on Excel was presented to estimate the sediment yield from hillslopes, as shown in Figure 6. The application of the model is limited to slopes of agricultural land or development areas that do not share the hydrological and environmental characteristics of mountains.
In order to use SEMMA in large mountain basins, it is more practical to use the DEM data indirectly from digital maps of satellite images rather than directly measuring factors. A method for calculating cover and topographical factors using satellite images and the DEM of the target watershed was proposed for practical user convenience [55]. SEMMA-Ic, improved for large-scale area applications, uses the total vegetation coverage index instead of the complex vegetation structure factor, which is complicated in terms of data acquisition and calculation. The significance and correlation coefficients of the original SEMMA and improved SEMMA-Ic did not change significantly, but the correlation coefficient for cover factors decreased slightly [55]. Table 2 shows multiple regression models of the SEMMA-Ic used when the rainfall was 380 mm or more. Soil erosion of the model equations has a proportional relationship with the rainfall, soil, and topography factors and has an inverse relationship with the vegetation factor.
2.2.2. Main Factors
- (1)
- Rainfall erosivity factor (RI)
Rainfall kinetic energy depends on the drop size, drop velocity, drop volume, and the drop-size distribution (DSD) of rain. The relationships between the rainfall kinetic energy and the rainfall intensity based on the data of drop-size and drop-velocity measurements have been proposed as an empirical expression of logarithmic, exponential, linear, and power-law functions [68,69,70,71,72,73,74,75,76,77,78,79]. A general exponential equation based on published data for the relationship between rainfall intensity and kinetic energy was presented by Van Dijk et al. [80]. Recently, Shin et al. [81] proposed a universal power-law equation based on the rainfall power theory under an ideal assumption and from the empirical equations. Early soil erosion models such as USLE [37] and EUROSEM [82] used logarithmic functions presented by Wishchmeier and Smith [69] and Brandt [74]. Since the exponential function reflects the convergence of rainfall kinetic energy to the upper limit value, its utility is greater than the logarithmic function. The RUSLE [39] uses an exponential function developed by Brown and Foster [73]. To minimize local heterogeneity, SEMMA [54] adopted the exponential equation integrated by Van Dijk et al. [80] as in Equation (2):
where is the rainfall energy in J/m2, is the average intensity of the storm in mm/h, and is the rainfall depth in mm.
SEMMA uses the following rainfall index as a rainfall erosivity factor.
where is the maximum rainfall intensity for 30 min in mm/h, and the rainfall index is the rainfall erosivity factor (J h/m).
The rainfall indices for the probabilistic rainfall in Gangneung [67] were calculated, as shown in Table 3. The 50-year frequency of rainfall was 1.097 times greater than that of the 30-year frequency, but the rainfall index increased to 1.219 times. Soil erosion depends especially on the maximum 30 min rainfall intensity rather than on the rainfall depth or the maximum rainfall intensity [54]. The erosivity factor, which considers the surface runoff factor as well as rainfall factors, has been consistently shown to improve the limits of the empirical erosivity factor [83,84]. Recently, physical erosivity factors based on energy and power theory have continuously been studied to improve SEMMA [81,85,86].
- (2)
- Vegetation factor (Ic)
The post-fire recovery of vegetation has been parameterized to evaluate soil erosion and the plant-ecology status. The species and structures of vegetation exhibit different recovery patterns in each zone depending on the climate, topography, soil, and pre-fire environment. The original SEMMA uses the vegetation index (, which considers canopy cover, ground cover, fine root rate, litter, and the residue layer [54]. In the RUSLE, cover factors for disturbed forests and woodlands are estimated by equations using bare soil, fine root mat, soil reconsolidation, canopy, steps, depression storage, and contour tillage [87]. Although the cover factor in a small-scale area can be specifically estimated, in a large-scale area, it is limited in terms of quantitative evaluation. Multispectral remote sensing data such as the Normalized Difference Vegetation Index (NDVI), the Enhanced Vegetation Index (EVI), and the Normalized Burn Ratio (NBR) are practically useful for practically assessing fire intensity and vegetation recovery over wide areas [13,57,58,59,60,61,88,89]. The NDVI has been continuously used as a cover factor for the GIS-based models to evaluate soil erosion in wildfire areas [13,61,62]. The SEMMA-Ic [55] also obtains the cover factor from the relationship between the vegetation index and the NDVI. The vegetation index is a ratio of vegetation coverage and is expressed as in Equation (4):
where is vegetation coverage (%).
The NDVI is an index for evaluating the vitality of vegetation using the property that the leaves of plants reflect more near-infrared rays than the soil [90]. Using the Red (620–700 μm) and Near-Infrared Red (750–3000 μm) regions of the electromagnetic spectrum, the NDVI can be calculated as in Equation (5):
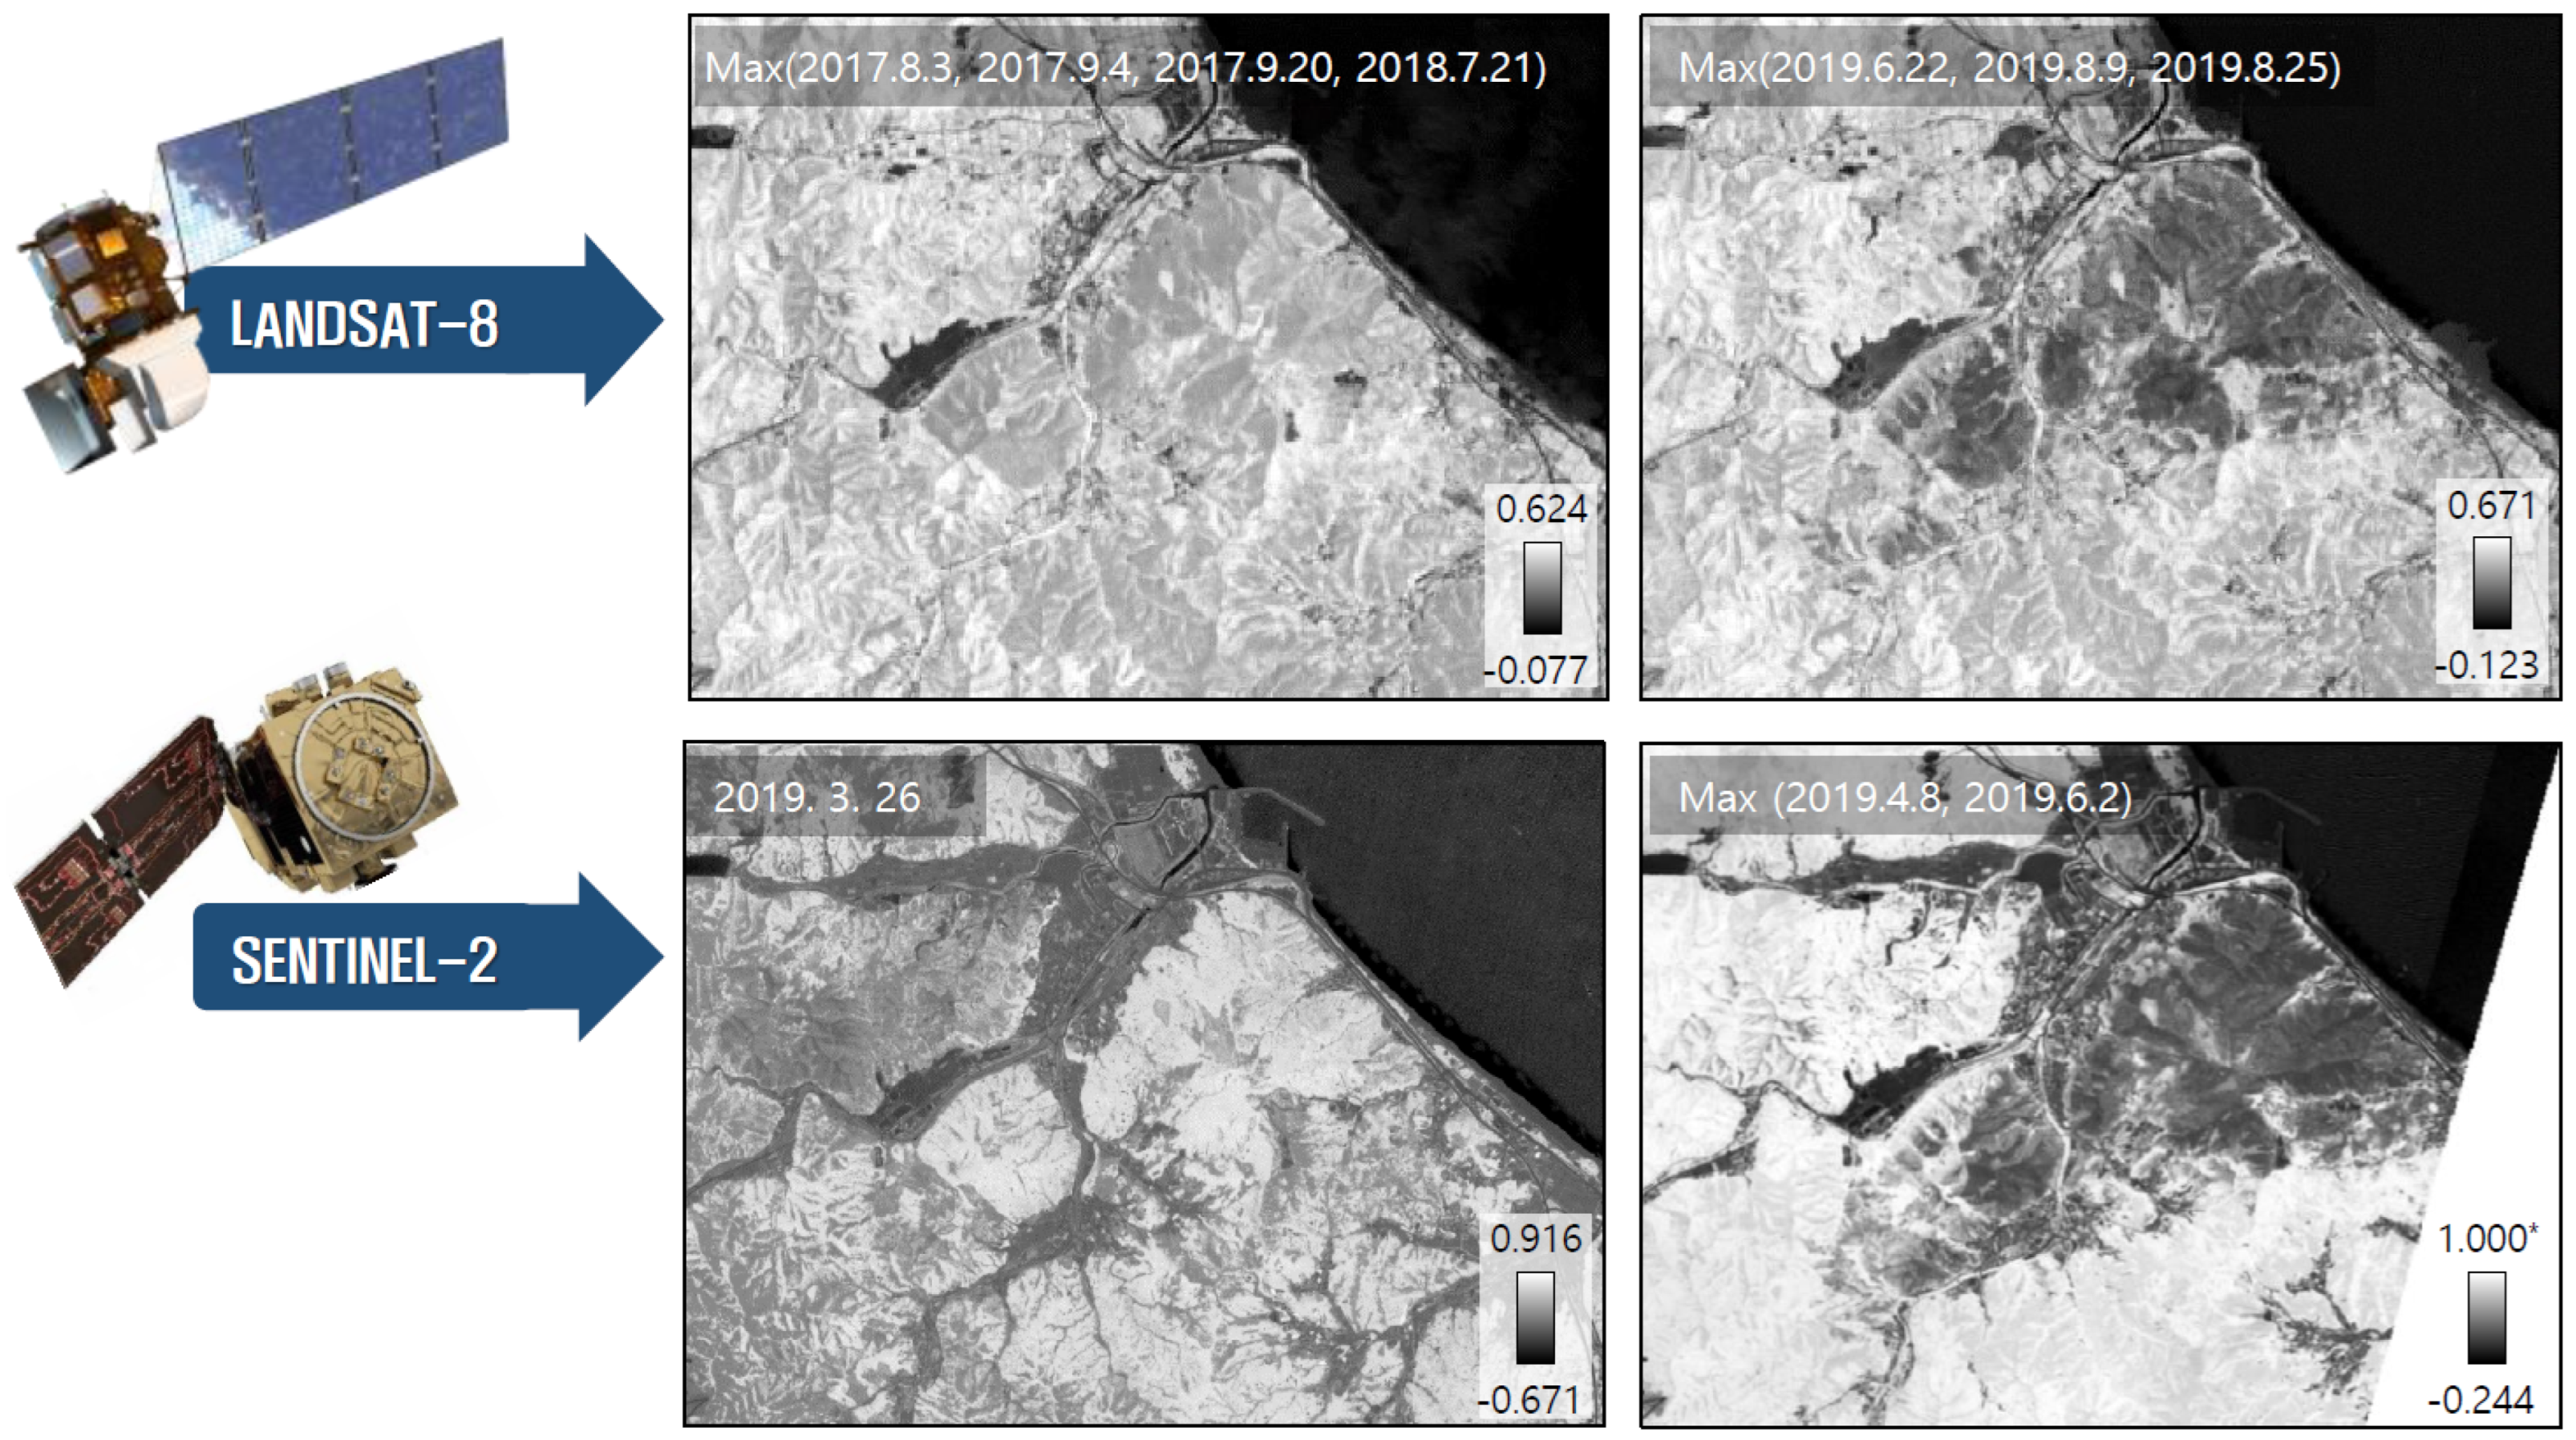
According to the NDVI distribution from satellite images of Landsat-8 and Sentinel-2 before and after wildfires (Figure 7), wildfire areas exhibit lower values due to destroyed vegetation. NDVI images were calculated from band 4 (red) and band 5 (near-infrared) data from Landsat-8 images and band 4 (red) and band 8 (near-infrared) data from Sentinel-2 images. Maximum values were used from NDVI images of multiple days to remove clouds.
The areas with a rapid reduction in the NDVI have suffered wildfire damage, and this can be used to detect wildfire areas. The ground resolution of Sentinel-2 images and Landsat-8 images is 10 m and 30 m, respectively. Therefore, in this study, Sentinel-2 images were used considering the resolution. The relation between Ic and NDVI is expressed in Equations (6) and (7), using a contrast stretching method:
- (3)
- Soil factor (So)
The erodibility of the soil increases with the content of silt and fine sand, as opposed to clay, which has high adhesion and chemical bonding [91,92]. The critical shear stress, which influences the detachment and transport of soil particles, increases with a particle size of >0.2 mm in diameter [93,94]. In particular, mountain areas contain a lot of coarse gravel, which is different from the soil textures of agricultural lands [95]. The coarse gravel, which has a high shear resistance and protects fine soil, reduces soil erosion. The ratio of coarse soil to fine soil was defined as the soil ratio index [54]:
where is the soil ratio index, is the percentage of soil particles less than 2 mm (%), and is the percentage of soil particles larger than 2 mm (%). If the gravel ratio is high, the critical shear velocity should be increased to detach and transport soil particles.
The organic and chemical components influencing aggregate stability contribute to reducing soil erosion [96,97]. Organic matter from herbs, twigs, and leaves of trees on forest land is converted to ashes in burnt hillslopes. The deep depth of permeable soil on the mountain may increase the infiltration and subsurface flow. Still, most post-fire mountains are set with shallow soil overlying impermeable bedrock due to the loss of litter layers and organic matter. Ultimately, this results in a decrease in seepage water and an increase in surface runoff and soil erosion. Therefore, soil erosion has a proportional relationship with the mean size of the soil and the soil ratio index and an inverse relationship with the organic content and soil depth. The soil factor in SEMMA [54] was determined using Equation (9):
where is a dimensionless variable because is the mean size of the surface soil (mm), is the soil ratio index, is the content of the organic matter (%), and is the soil depth (m).
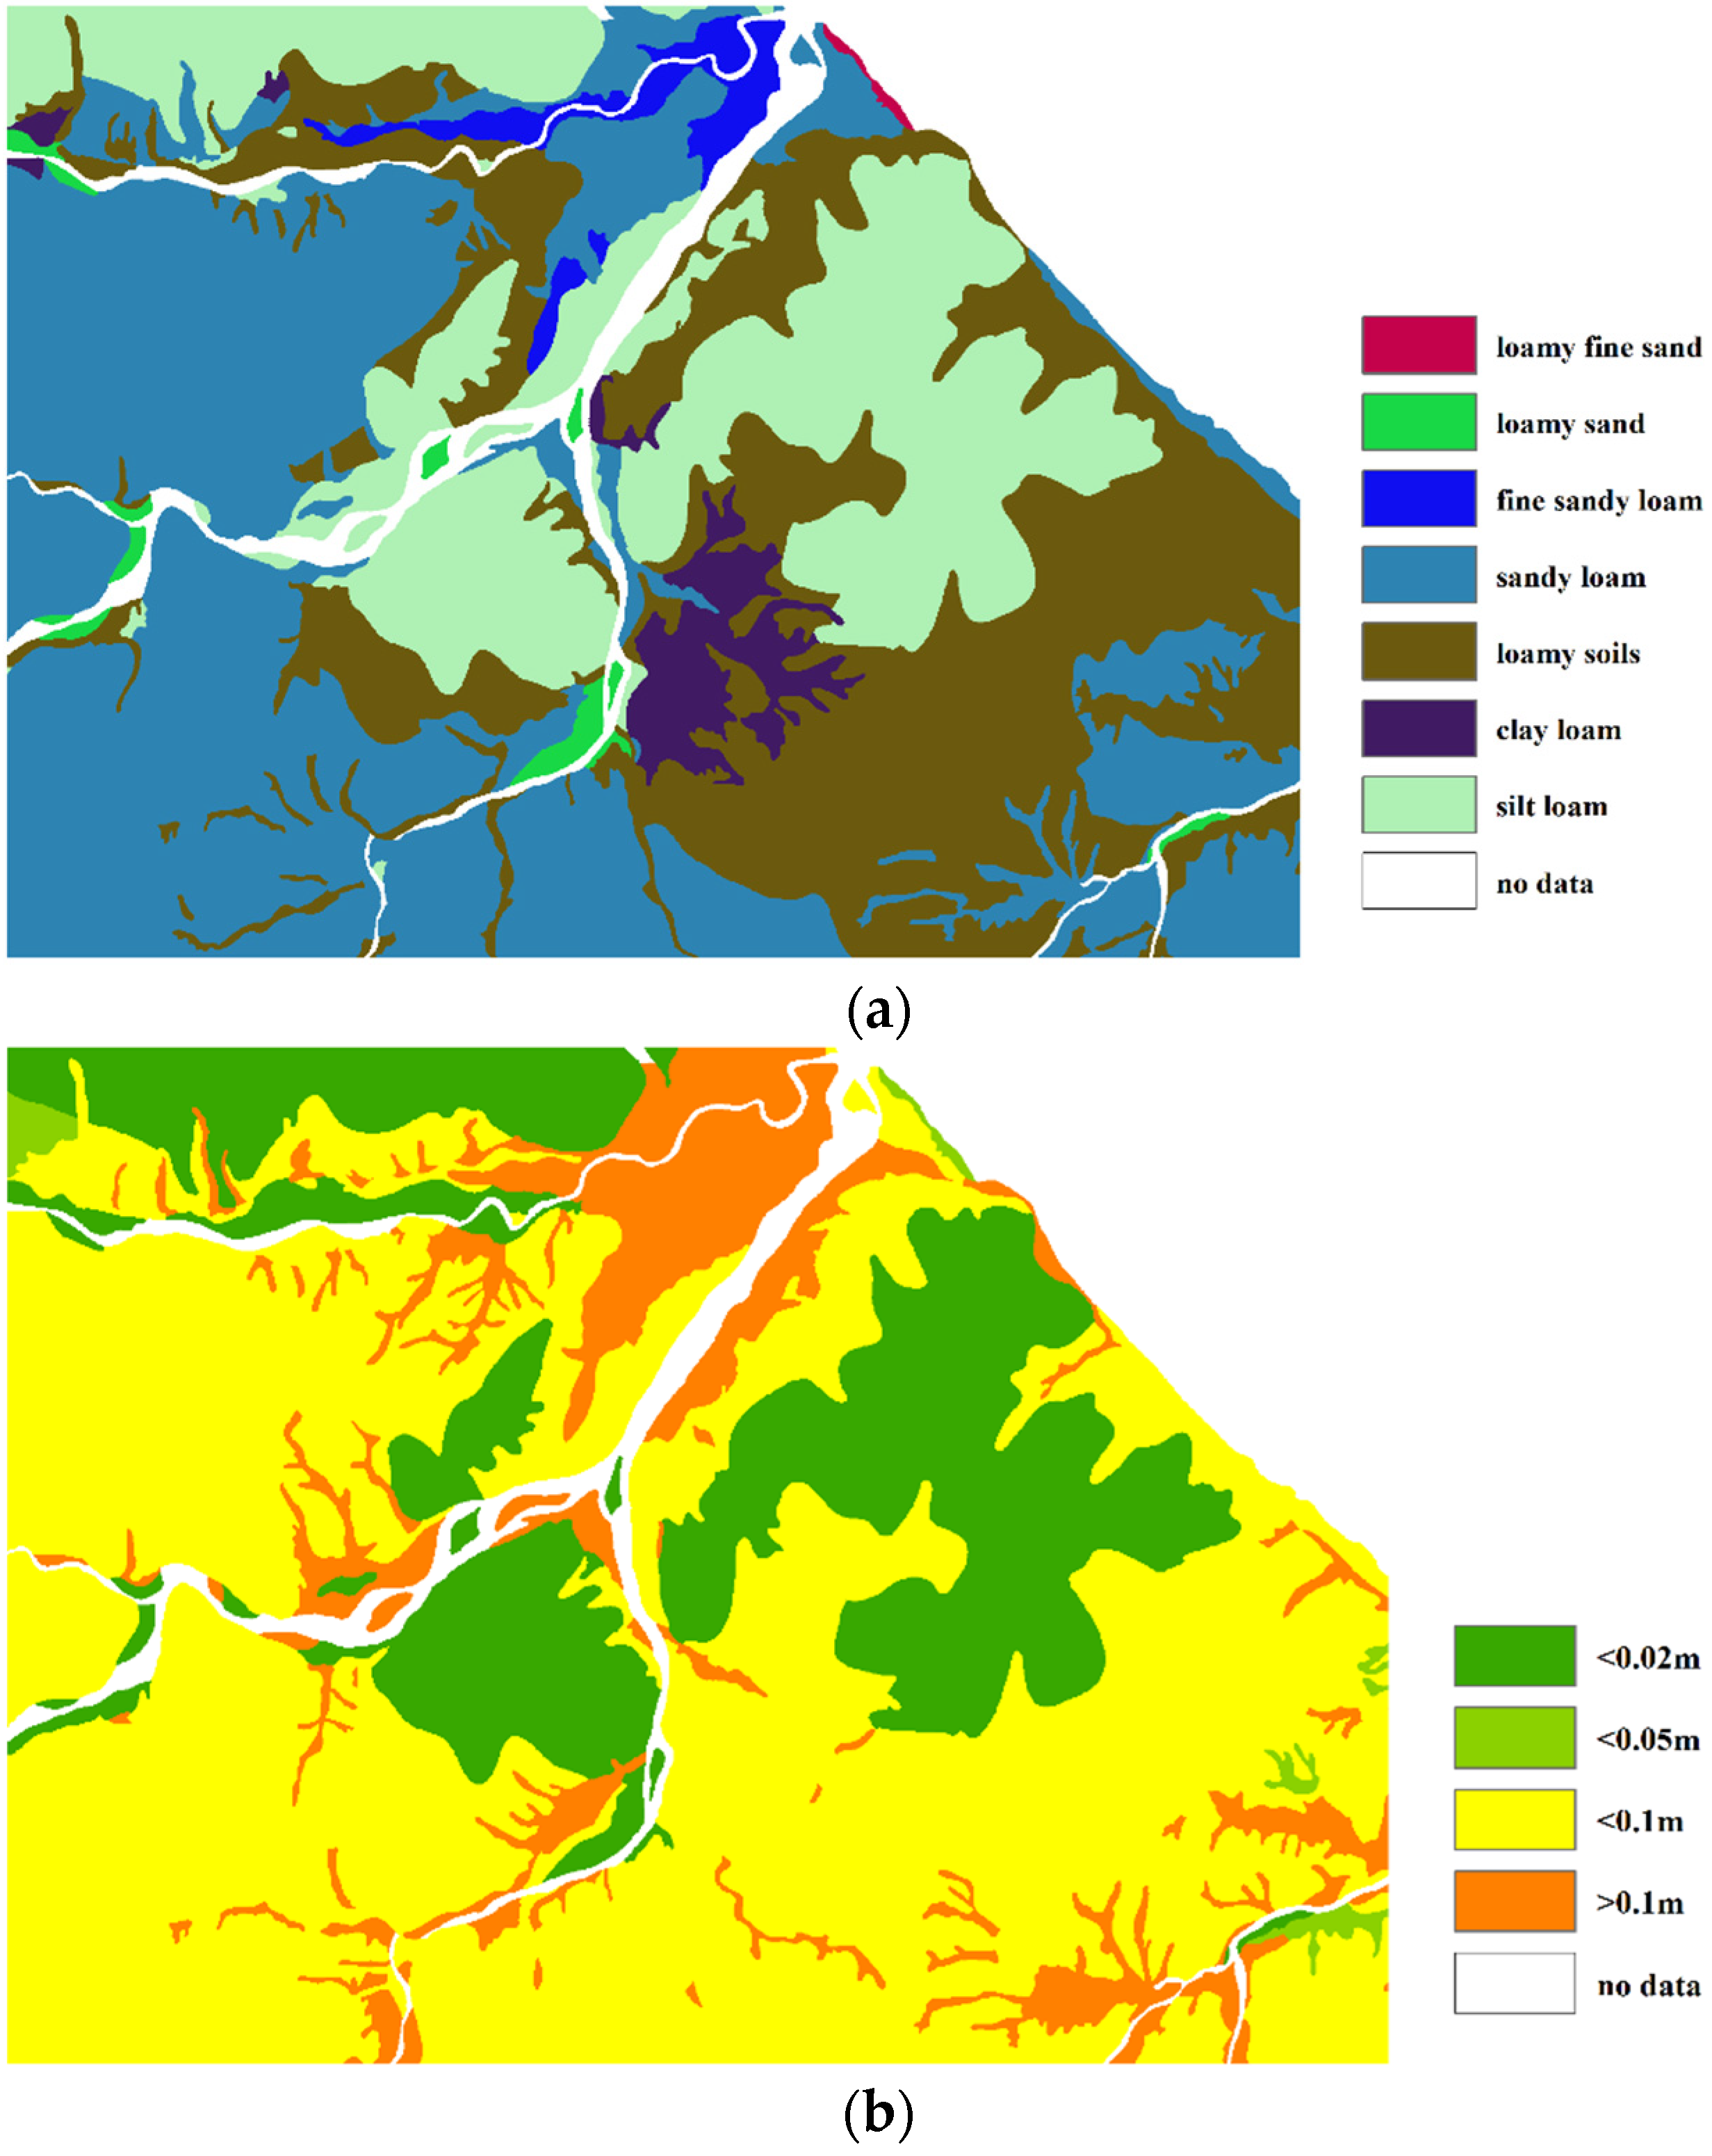
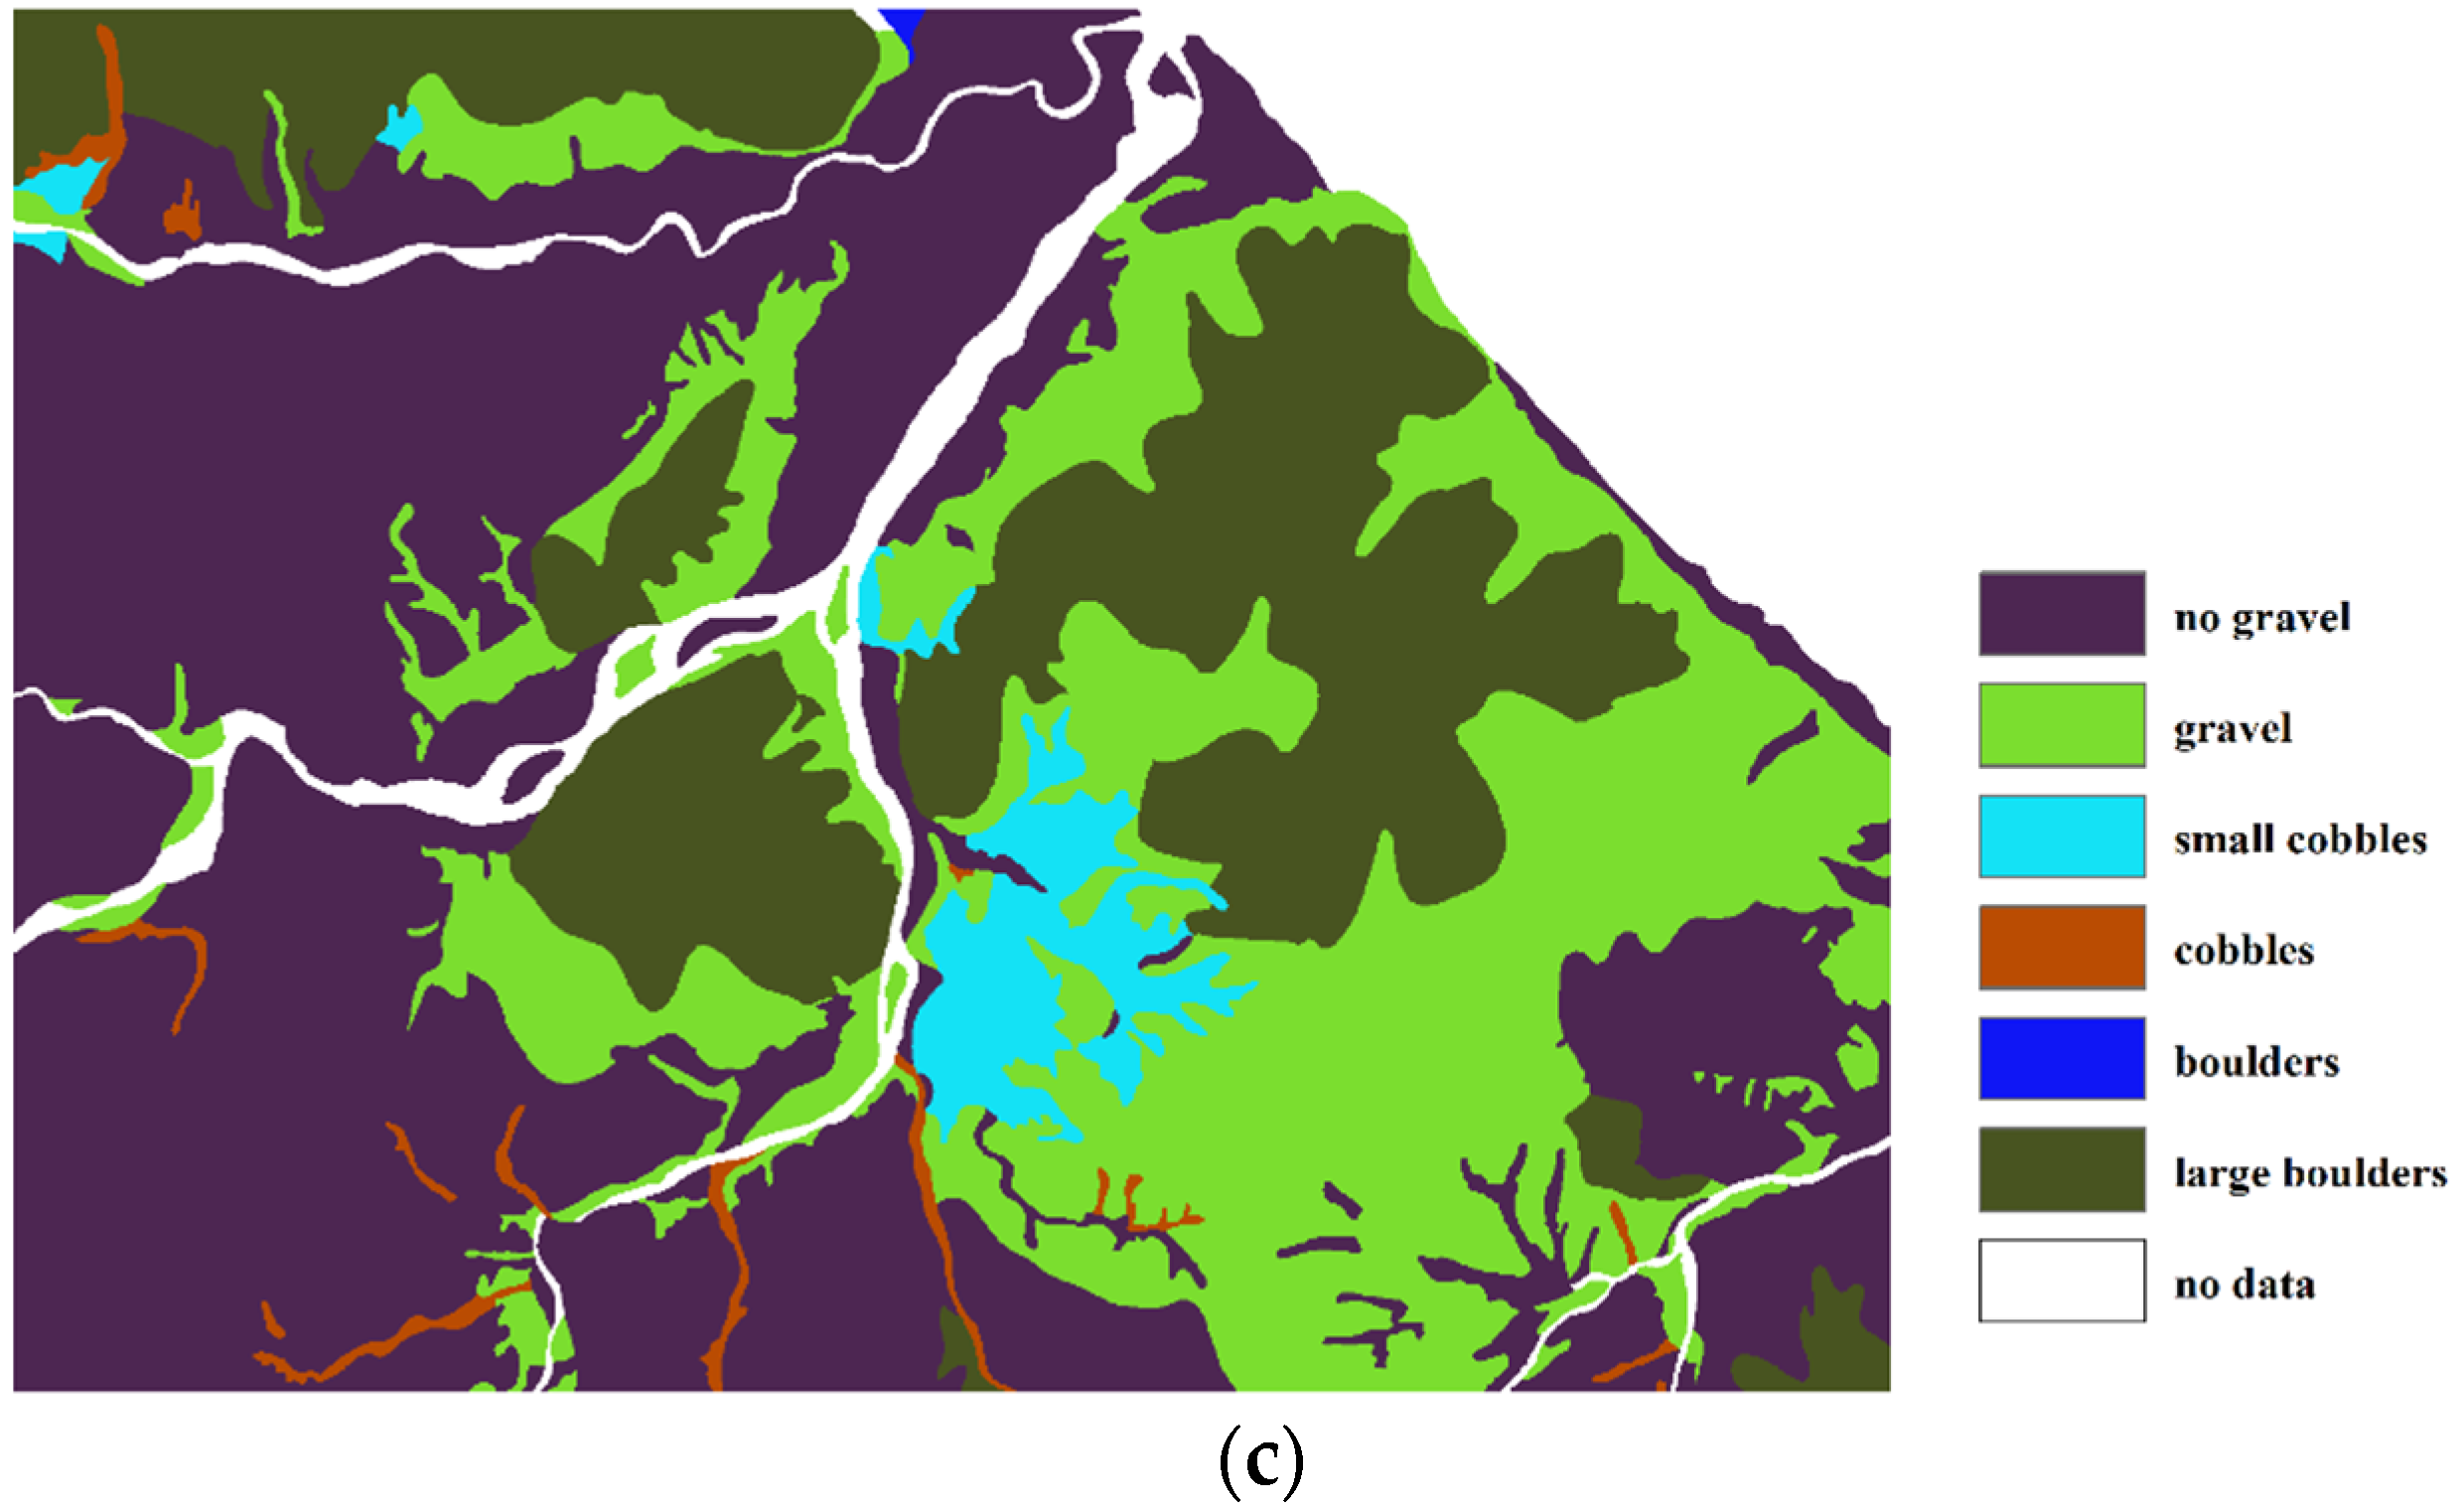
For the calculation of soil subfactors, this study used soil maps (1:25,000) provided by the National Institute of Agricultural Sciences and Rural Development Administration [65]. The surface soil in wildfire areas consists of silt loam on most mountain ridges, loam on lower hillslopes, and clay loam in deposition areas around valleys, as shown in Figure 8. The soil depth increased from 0.1 m to 1.0 m with a decreasing altitude. The ridge part of the mountain showed a gravel content of >35%, including boulders and cobbles. The gravel content of the lower hillslopes was in the range between 15% and 30%. The organic matter was calculated from the regression equation with the soil depth presented by Shin et al. [55].
- (4)
- Topography factor (To)
The topography factor in SEMMA was calculated by slope and length factors from the USLE. The slope factor from the USLE was modified by McCool et al. [98,99] after extensive evaluation of the original database as in the following equations:
where is the slope angle, which is based on an evaluation of data from disturbed lands with slopes of up to 84%. McIssac et al. [100] developed an equation similar to Equations (10) and (11) with exponents in the same range, and McCool et al. [99] stated that Equations (10) and (11) can also be used for disturbed lands.
The slope length factor developed by McCool et al. [99,101] was augmented with theoretical considerations. The factor in SEMMA [54] was transformed by considering the length of the experimental field plots as in Equation (12):
where is the slope length (m), the denominator 10 is the average length of the standard plots, and is a variable slope length exponent. The slope length is the horizontal projection of the plot length, not the length measured along the slope. The difference in horizontal projections and slope lengths becomes important on steeper slopes. The slope length exponent is related to the ratio of rill to interrill erosion [99,101,102]. This model considers the exponents for rangeland and pasture, where the ratio of rill to interrill erosion is low [39].
To distinguish it from in the USLE, the topography index in the SEMMA [54] was expressed as in Equation (13):
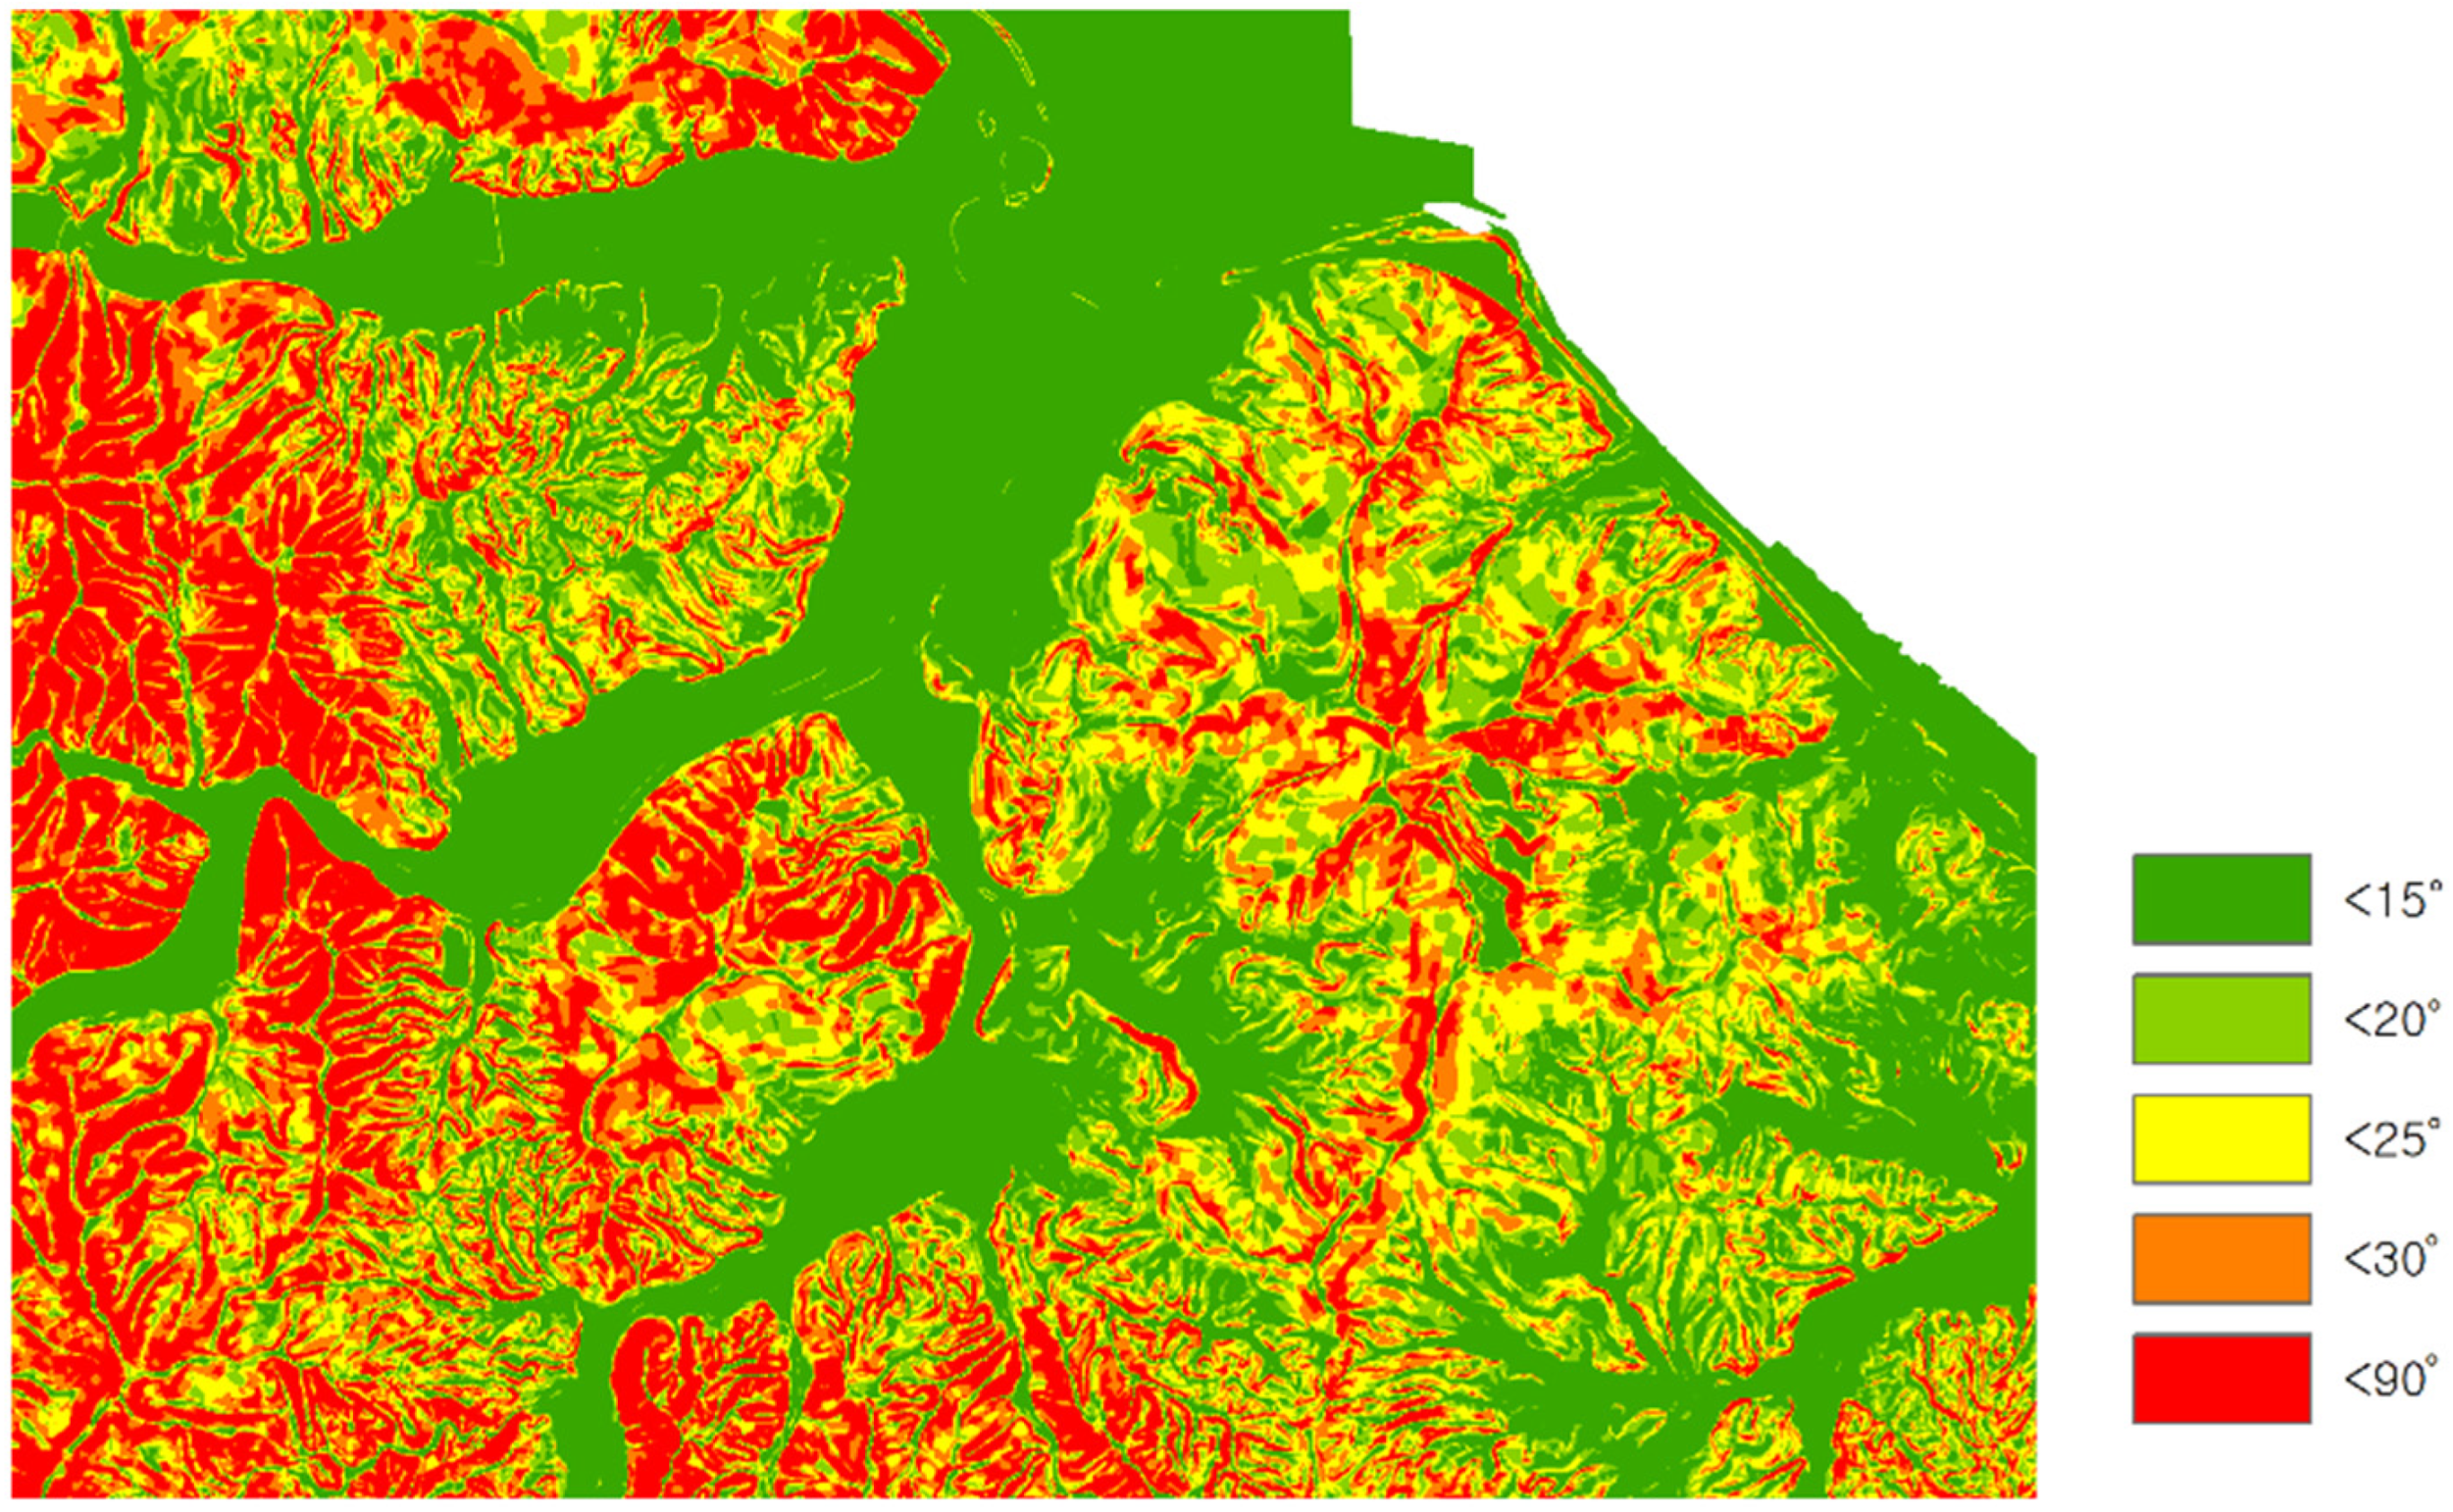
The erosion rate in disturbed and agricultural lands generally increased with an increase in the slope steepness and slope length [99,100,101,102,103]. However, in natural hillslopes, it was frequently found that soil erosion decreases with an increase in the slope steepness and slope length because of the increasing depression storage and roughness factor, infiltration, and subsurface flow [54,104,105,106,107]. Multiple regression models of SEMMA and SEMMA-Ic showed an inverse relationship between soil erosion and the slope-length factor within the range of general rainfall except for heavy rainfall [54,55]. The LS factor in a DEM elevation dataset of the RUSLE is considered the upslope contributing area because of an increase in the stream power by flow accumulation [103,108,109]. The topography index in SEMMA of inexperienced GIS applications follows the concept used in the primary version of the RUSLE, in which the irregular hillslopes are divided into equal-length segments of the uniform slope, and the total soil loss depends on the number of segments [39]. In this study, digital topographic maps (1:5000) provided by the National Geographic Information Institute were used to generate a 10 m grid Digital Elevation Model (DEM). Slope angles extracted from the DEM of the target area were used to produce the slope-length factor, as shown in Figure 9. Therefore, the segment length of a cell is equal to the standard plot length.
3. Results and Discussion
3.1. Soil Erosion Estimation using SEMMA
3.1.1. The Risk Map of Soil Erosion
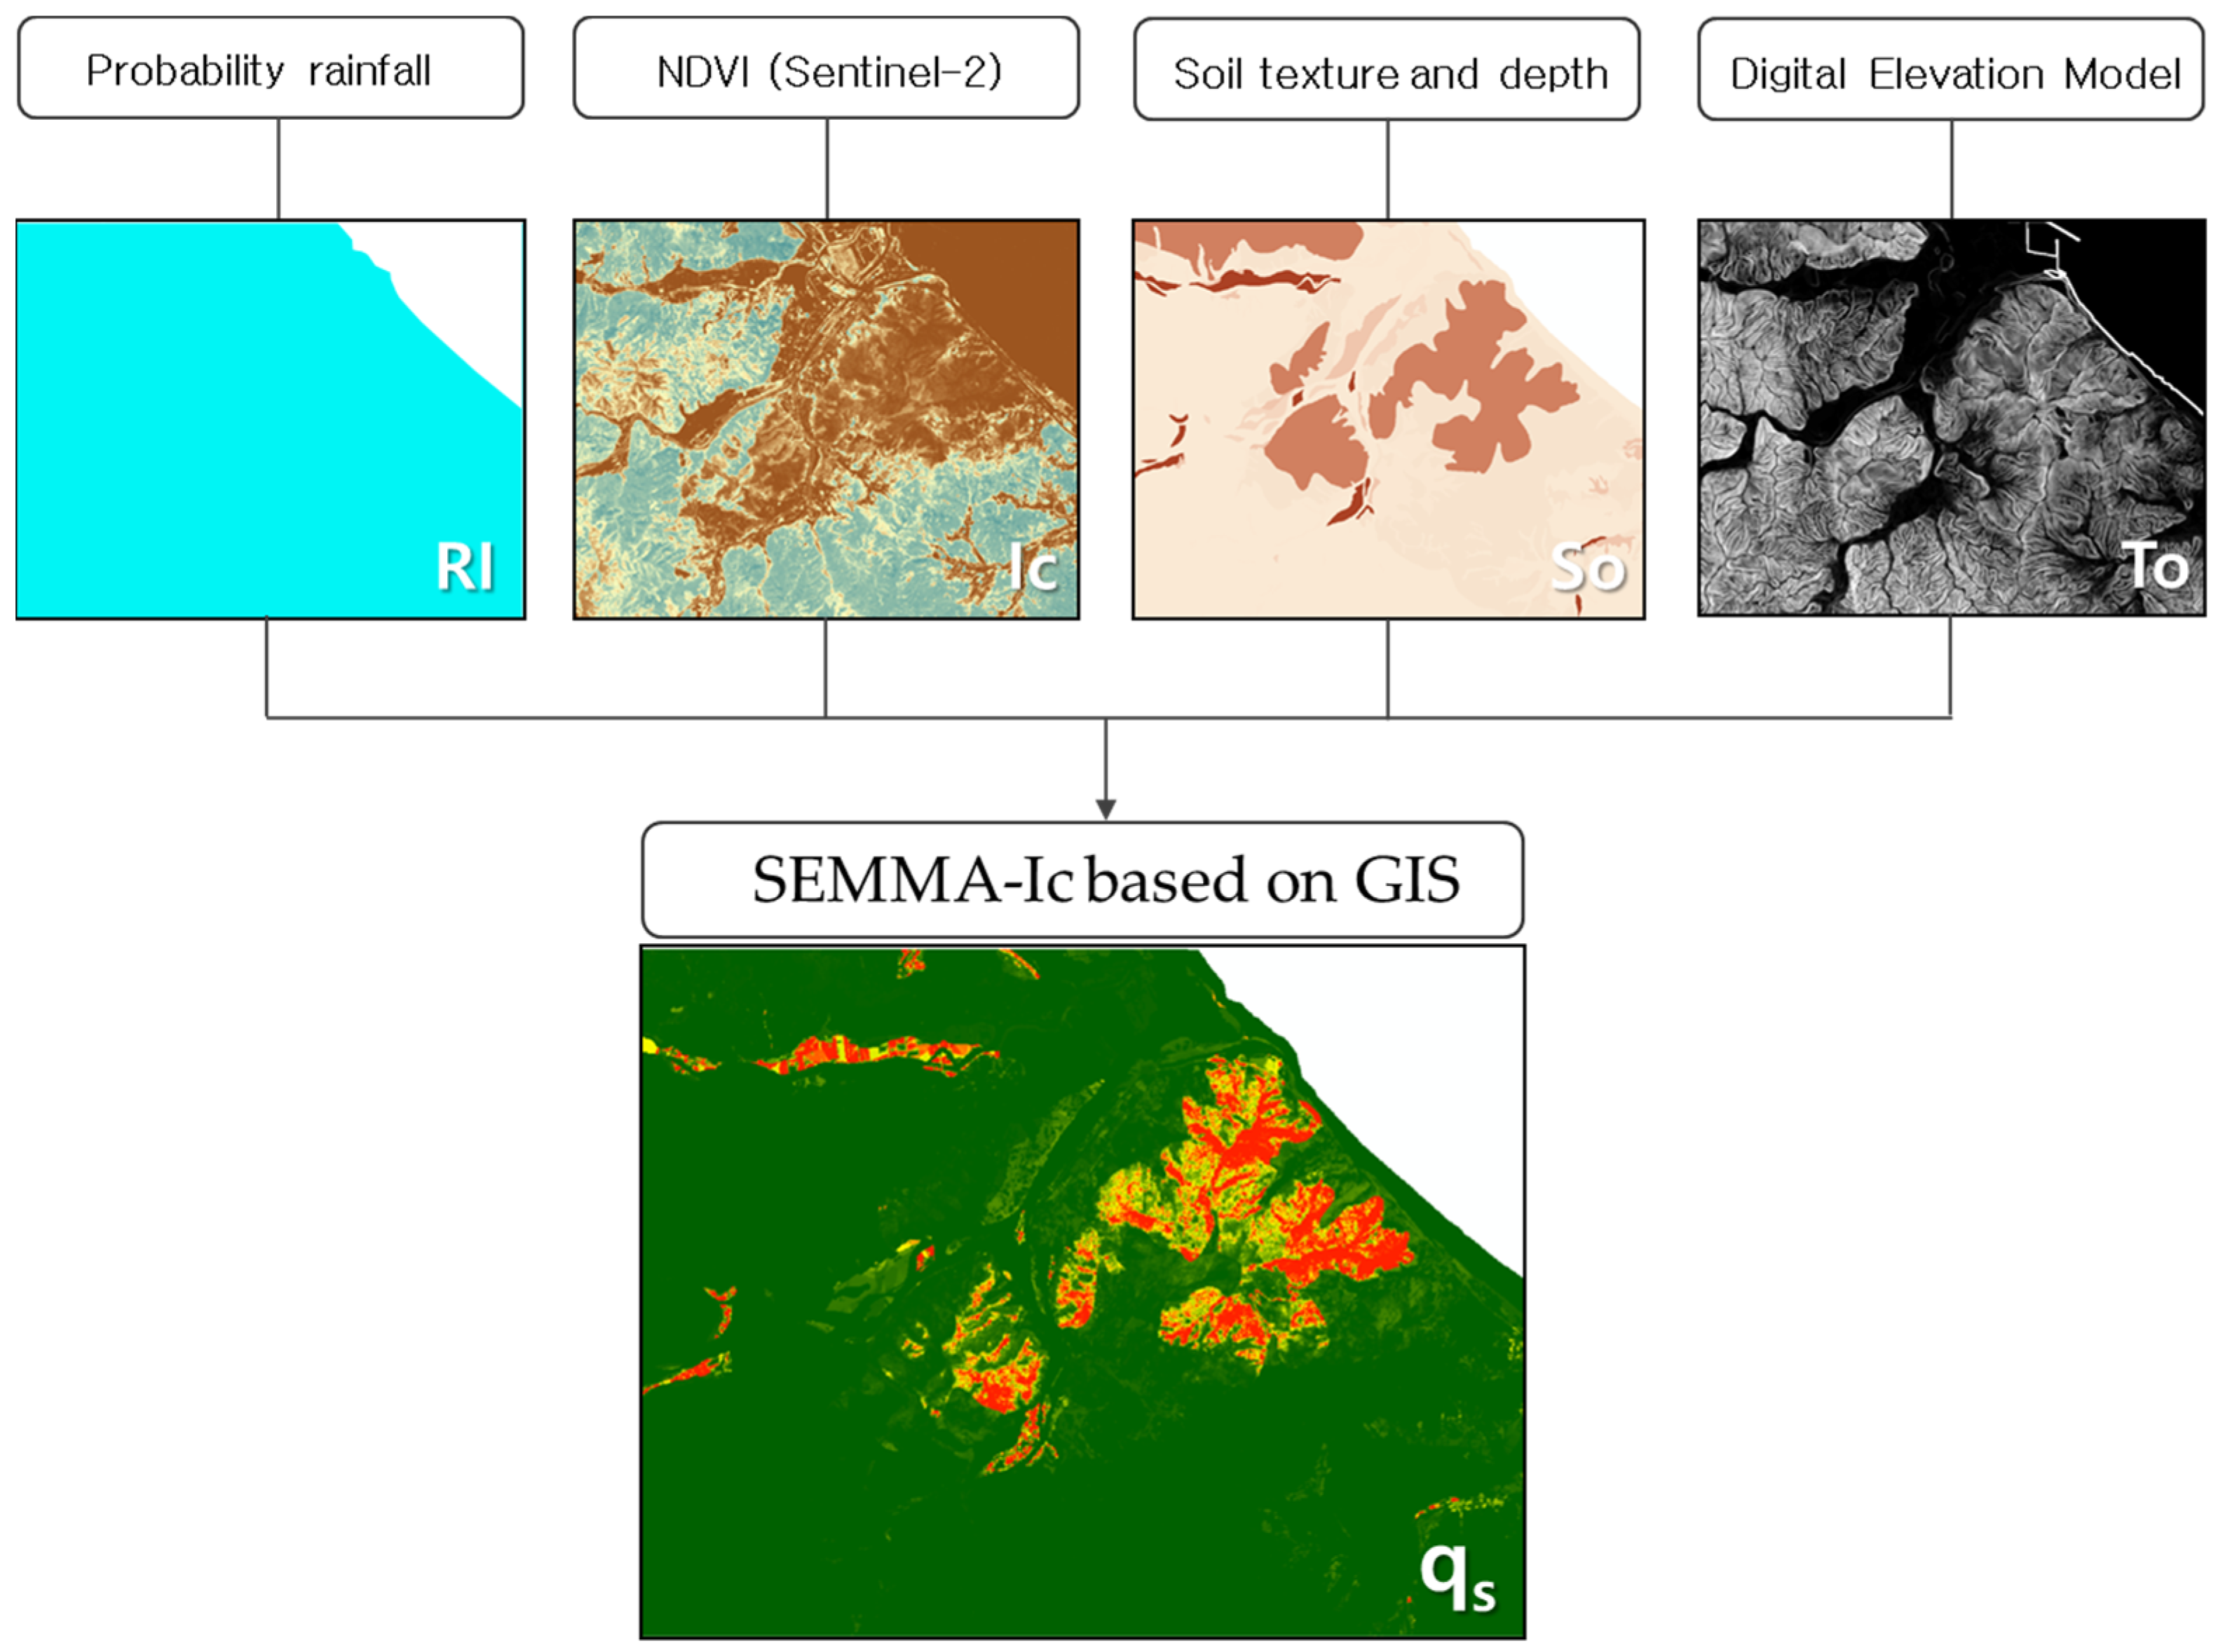
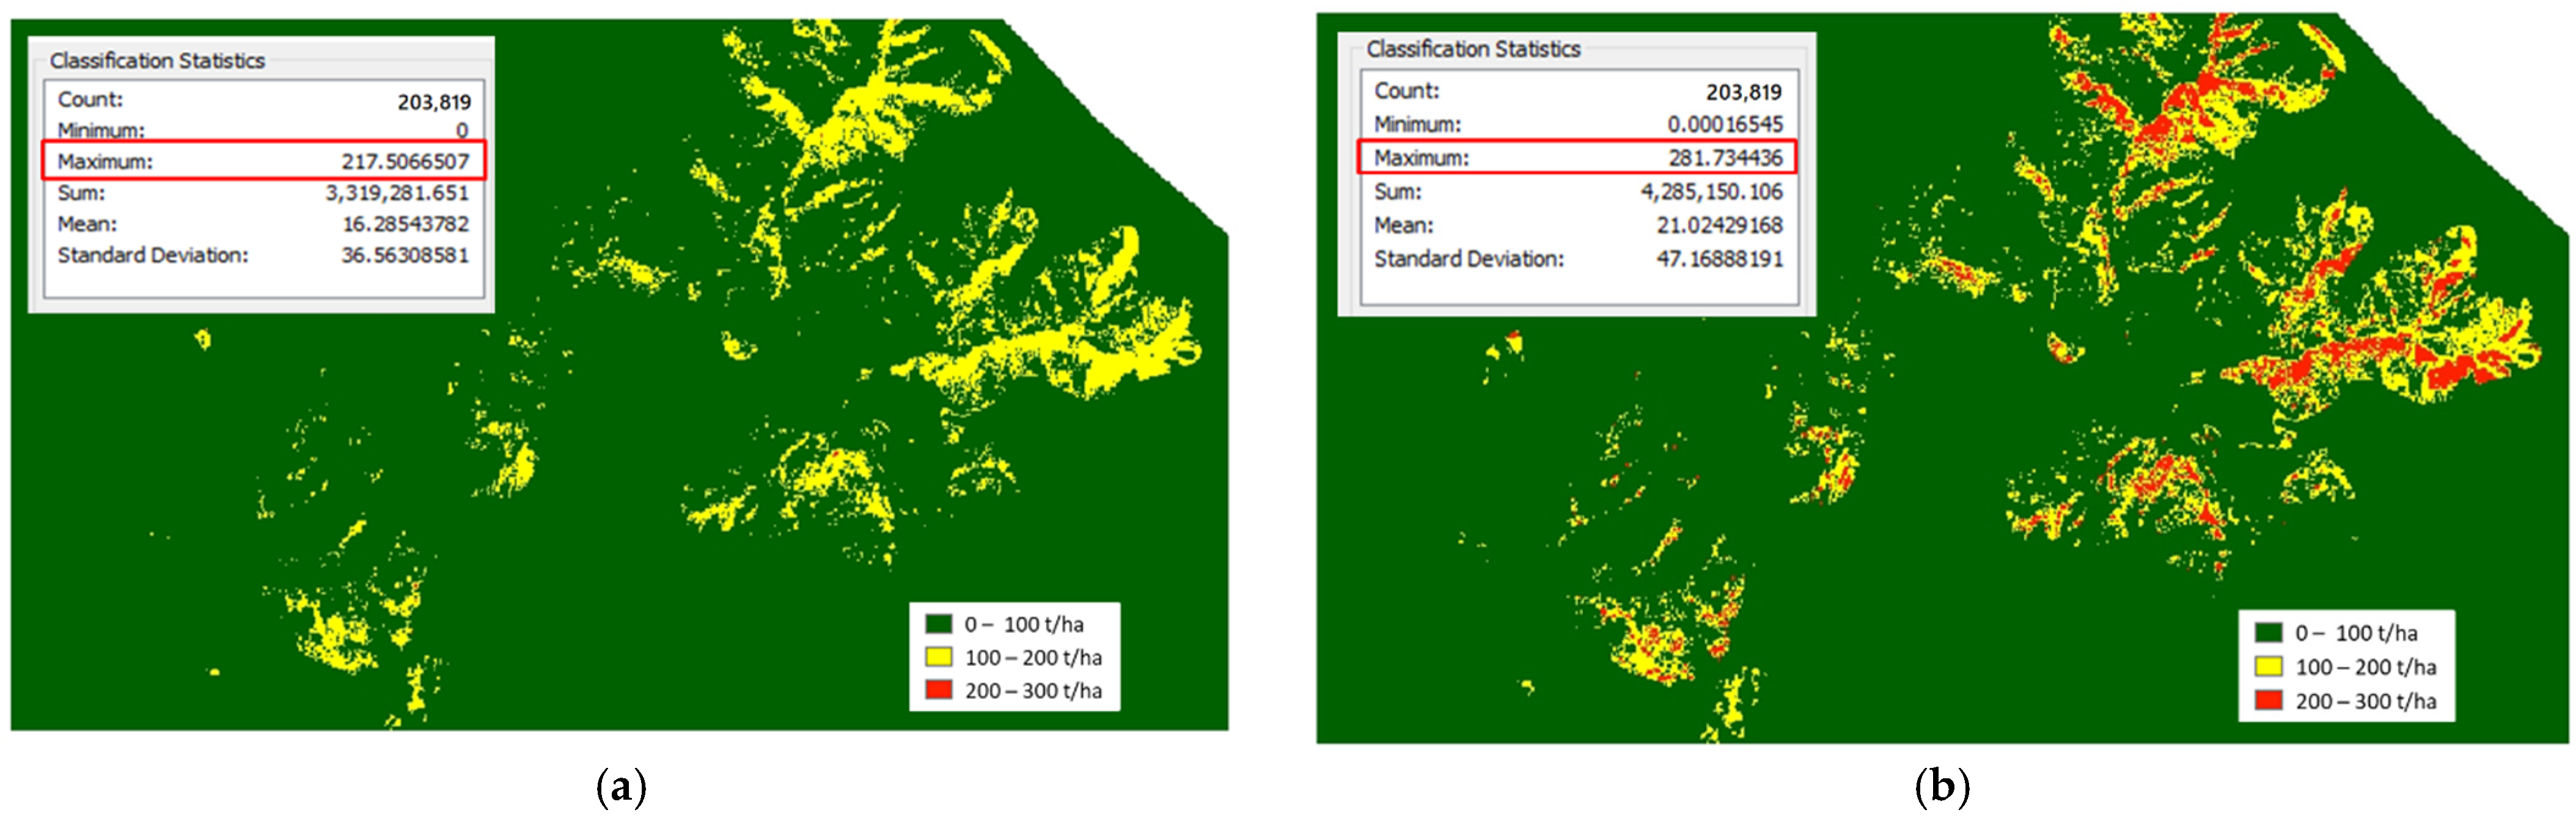
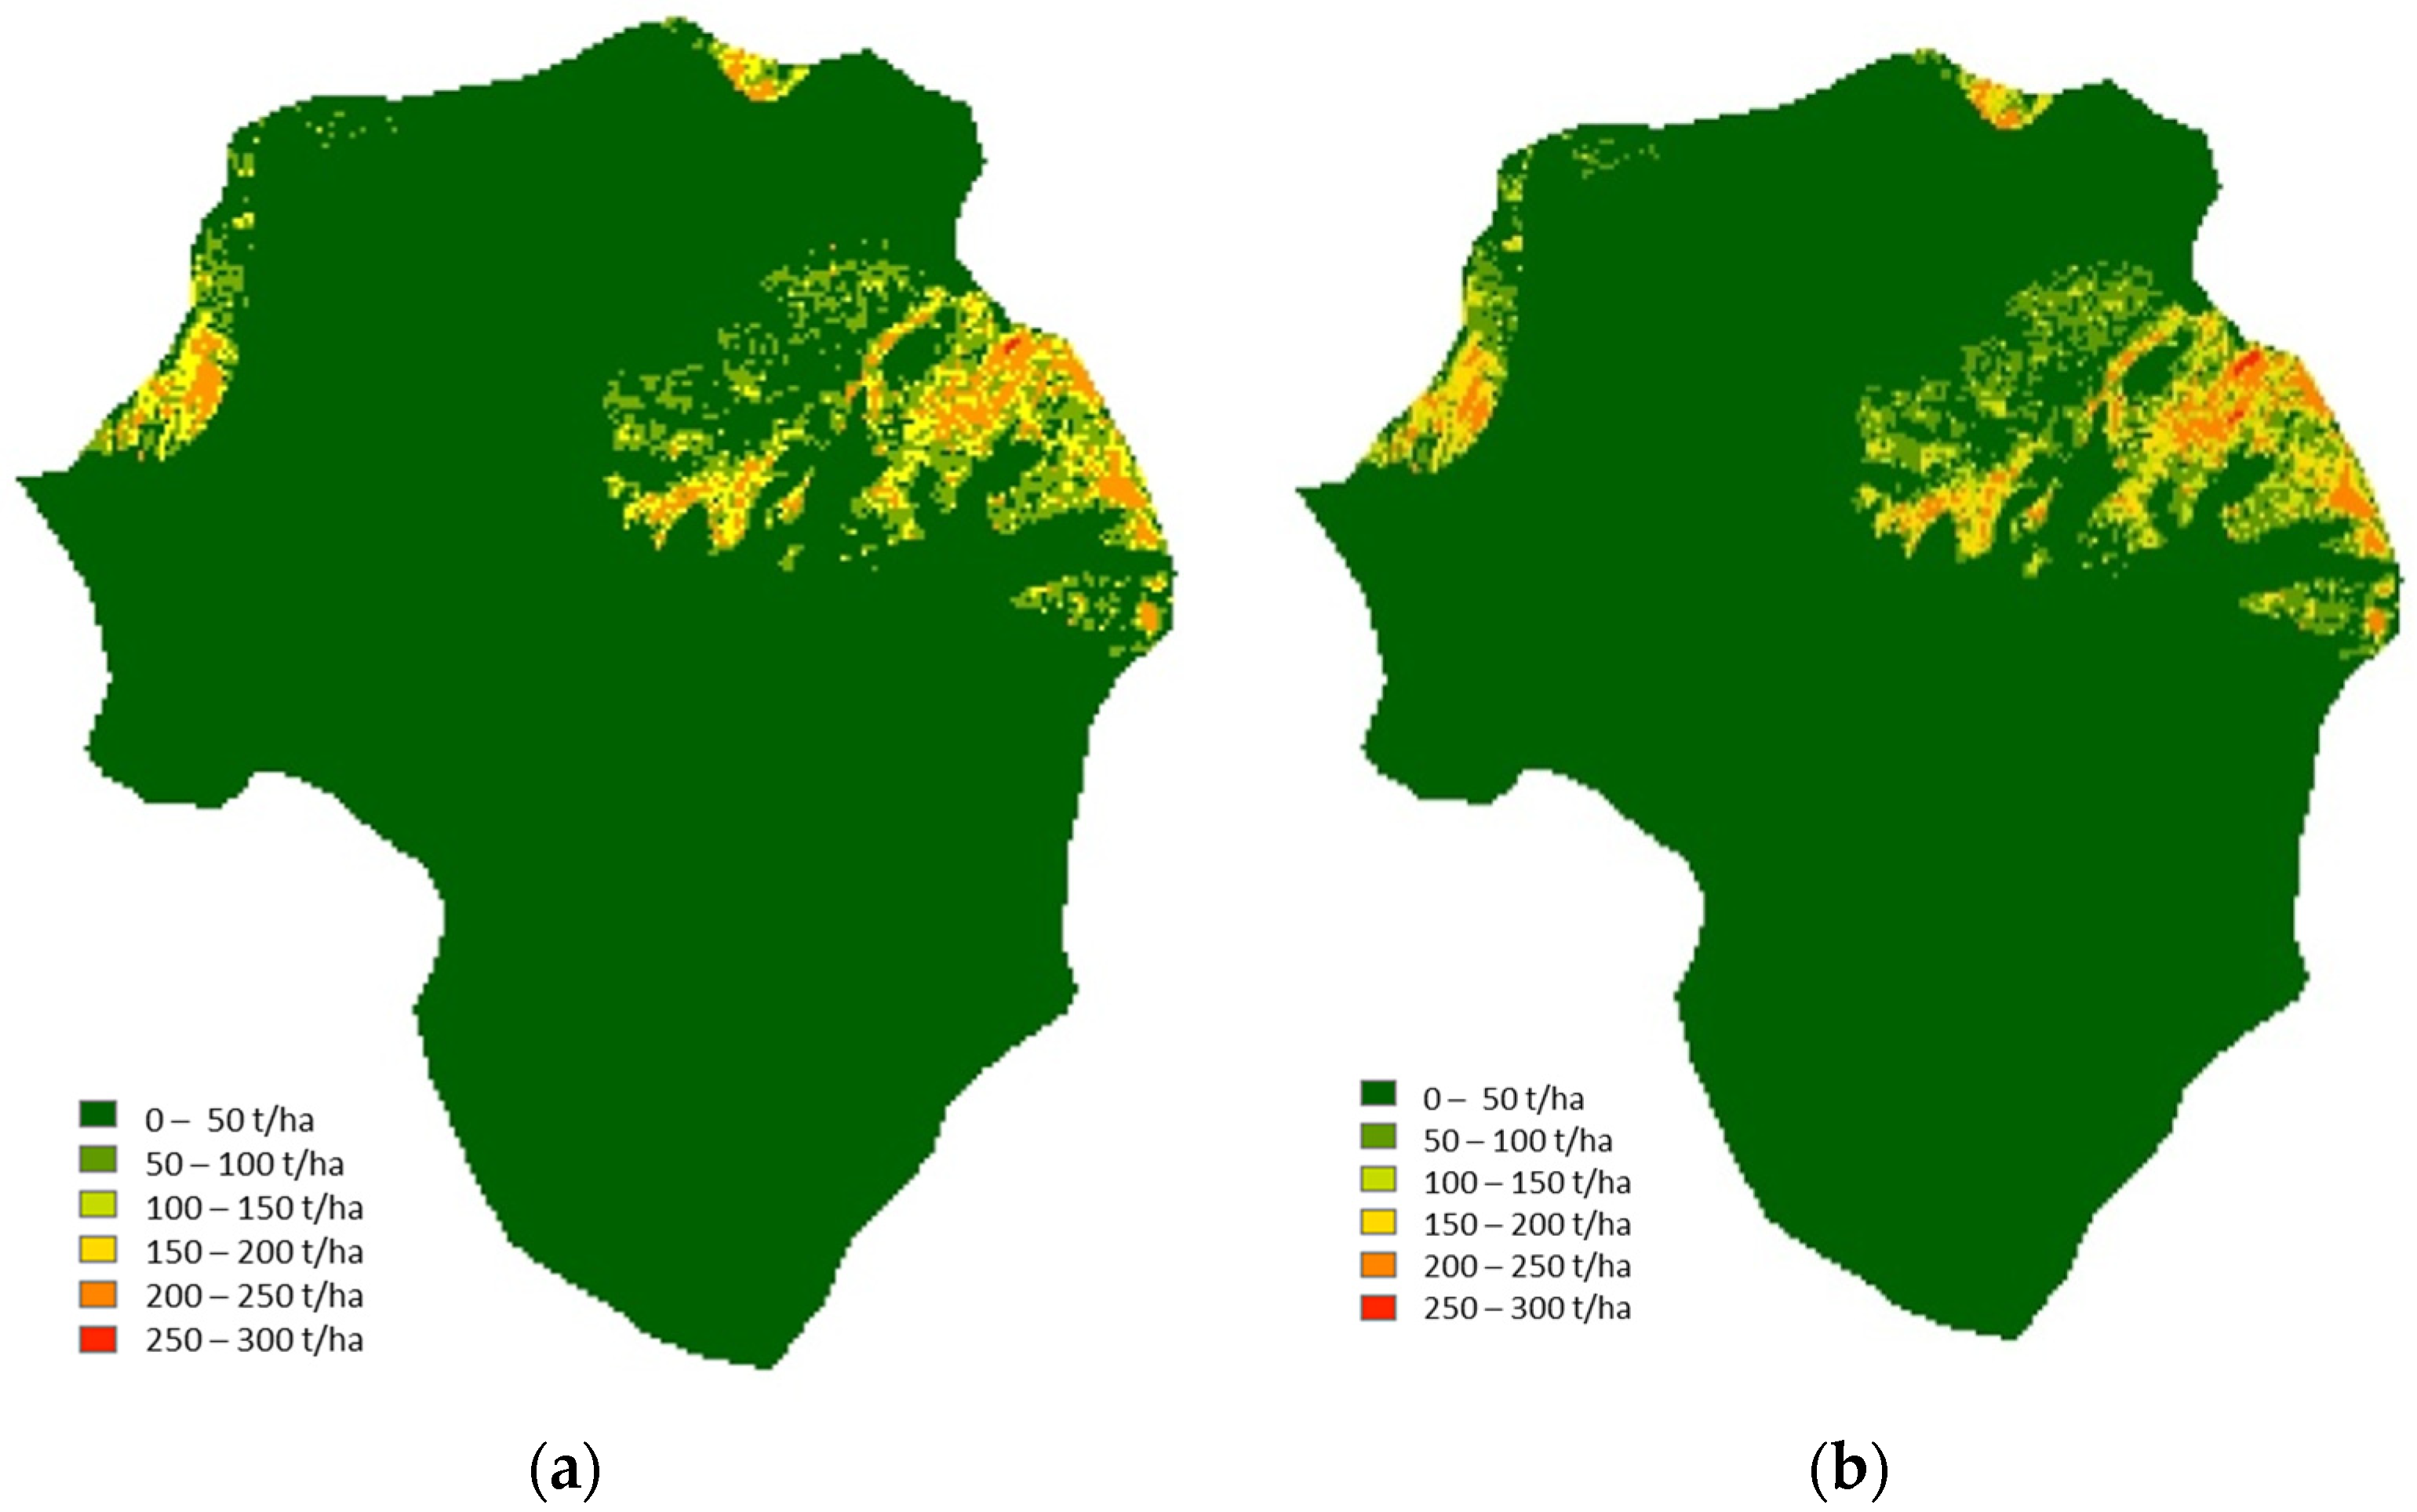
Soil erosion was simulated through spatial analysis. The calculation of the rainfall factor layer, the vegetation index layer, the soil factor layer, and the topographic factor layer were the main parameters of SEMMA-Ic extracted from geospatial information of ArcGIS. Figure 10 shows the spatial distribution of the main factors and the simulation process of SEMMA-Ic using ArcGIS. The estimated soil erosion for the 30-year and 50-year frequency of rainfall is presented in Figure 11. The areas with high erosion rates were concentrated in the areas damaged by wildfires, as shown in Figure 1. In the case of the 30-year frequency of rainfall, the maximum soil erosion was 217.5 t/ha, and the 50-year frequency of rainfall increased by 30% to a maximum of 281.7 t/ha. The distribution of yellow representing high erosion of 100–200 t/ha [110] occupied a large area in the 30-year frequency of rainfall, whereas the red areas representing severe erosion of 200–300 t/ha [110] increased significantly in the 50-year frequency. These data confirmed that the risk of soil erosion also increased significantly as the frequency of rainfall increased.
3.1.2. Sediment Yield after Wildfire
To evaluate the sediment yield from the watershed, the study watershed was extracted from soil erosion maps simulated by SEMMA-Ic (Figure 12). Soil erosion within the watershed was mainly generated on the mountain ridges, which were characterized as having a shallow soil depth of silt loam in fire-damaged areas. The maximum erosion rates increased from 202.5 t/ha to 261.3 t/ha as the 30-year probability of rainfall increased to the 50-year frequency. The soil loss was less than the range (300–600 t/ha) for developed areas as suggested by the unit load method [111].
Soil erosion rates in the study watershed were estimated to be 40.33 t/ha for the 30-year frequency of rainfall and 52.04 t/ha for the 50-year frequency. Sediment yield from the study watershed of 3.43 km2 was calculated to be 13,821 tons for probabilistic rainfall of 382.3 mm during 24 h. The total sediment yield that flowed into the Namyangcheon river from the watershed from Typhoon Mitag was estimated to be approximately 13,800 tons. According to a field survey by Shin et al. [31] for post-fire hillslopes and watersheds, the sediment yield by one extreme-rainfall event accounted for 93% of the total sediment yield surveyed for five years. Heavy rainfall of a certain duration was a more important factor than annual rainfall in evaluating the risk of erosion. Sediment yields from a small brunt watershed of sandy loam in Gangneung, South Korea, were 4.29 t/ha for rainfall of 550 mm in the post-fire first year and 71.65 t/ha for rainfall of 1512 mm in the post-fire second year, respectively, during a three-month investigation. The maximum sediment yield from the watershed was 71.16 t/ha from rainfall of 958 mm during 42 h and rainfall intensity of 113.5 mm/h. On the plot scales of bare soil, the maximum sediment yields were 21.27 t/ha for rainfall of 546 mm in the post-fire first year and 125.05 t/ha for the total rainfall of 1498 mm in the post-fire second year, respectively. Soil losses in small burnt areas of Galicia, Spain, where the annual rainfall was 1400 mm and the soil texture was loam-sandy, and loam were 15–170 t/ha in the year of the wildfire [112]. In the Águeda Basin, Portugal, the erosion rate under natural rainfall of 1155 mm was 45 t/ha over nine months as a result of the effect of a wildfire [23]. Shakesby [113] reported that soil losses in the year of the wildfire were similar to or lower than those from agricultural, bare, and range land in the Mediterranean. The sediment yields simulated by SEMMA-Ic were reasonable values in wildfire areas, as is the case in the literature.
3.1.3. Sediment Yield from Logging Watershed
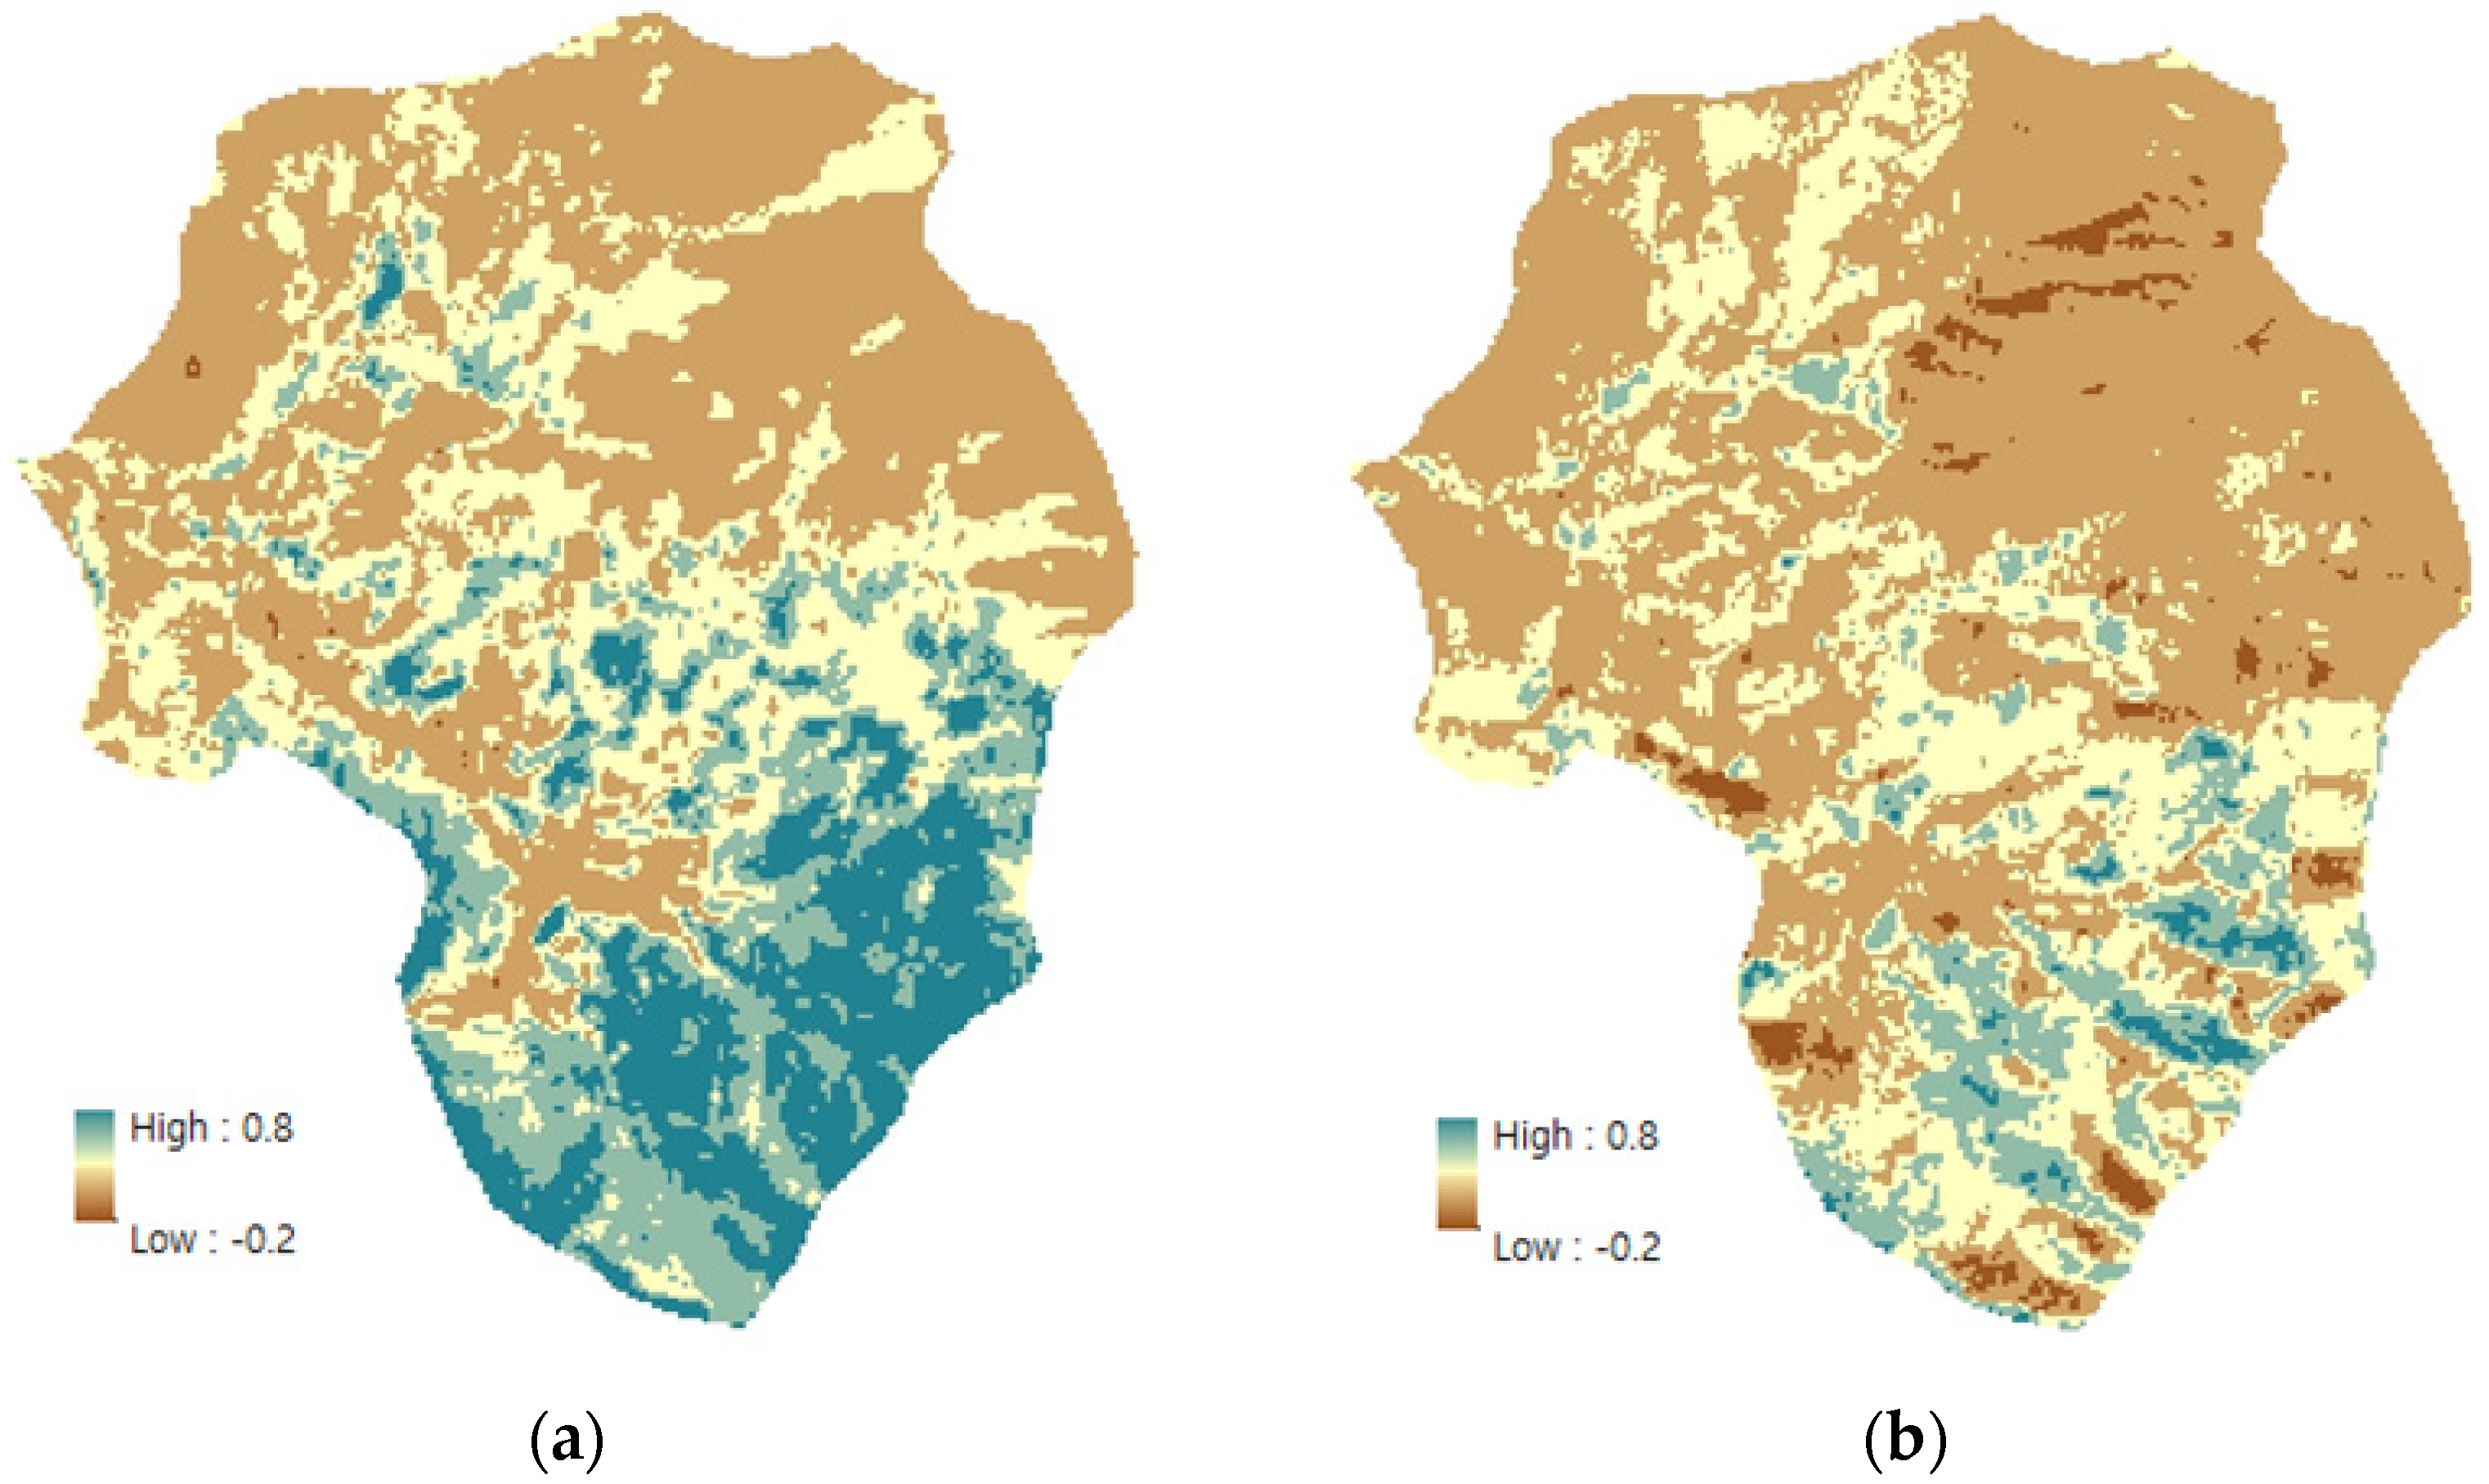
In the post-fire watershed, erosion control works were implemented to reduce the risk of soil erosion and sediment runoff. Logging of burned trees was carried out simultaneously for wood productivity. These artificial works, including the logging of burnt woods, the movement of heavy equipment, and the construction of forest roads, have re-disturbed the topsoil. The NDVI was extracted again from images of Sentinel-2 to quantitatively confirm the surface conditions after logging. Figure 13a and b show the change in the NDVI after wildfires and after logging. After logging, the range of high NDVI (the blue color) was reduced, and the range of low NDVI (the brown color) was expanded. They show that the vegetation loss after logging was more severe than after wildfires. Since the image after logging corresponds to January when the vegetation vitality is low, the NDVI value may have been underestimated. Even in April, when there was a wildfire, the vitality of vegetation was not high. Furthermore, as the dominant species in this watershed is an evergreen pine, we judged there to be no significant difference.
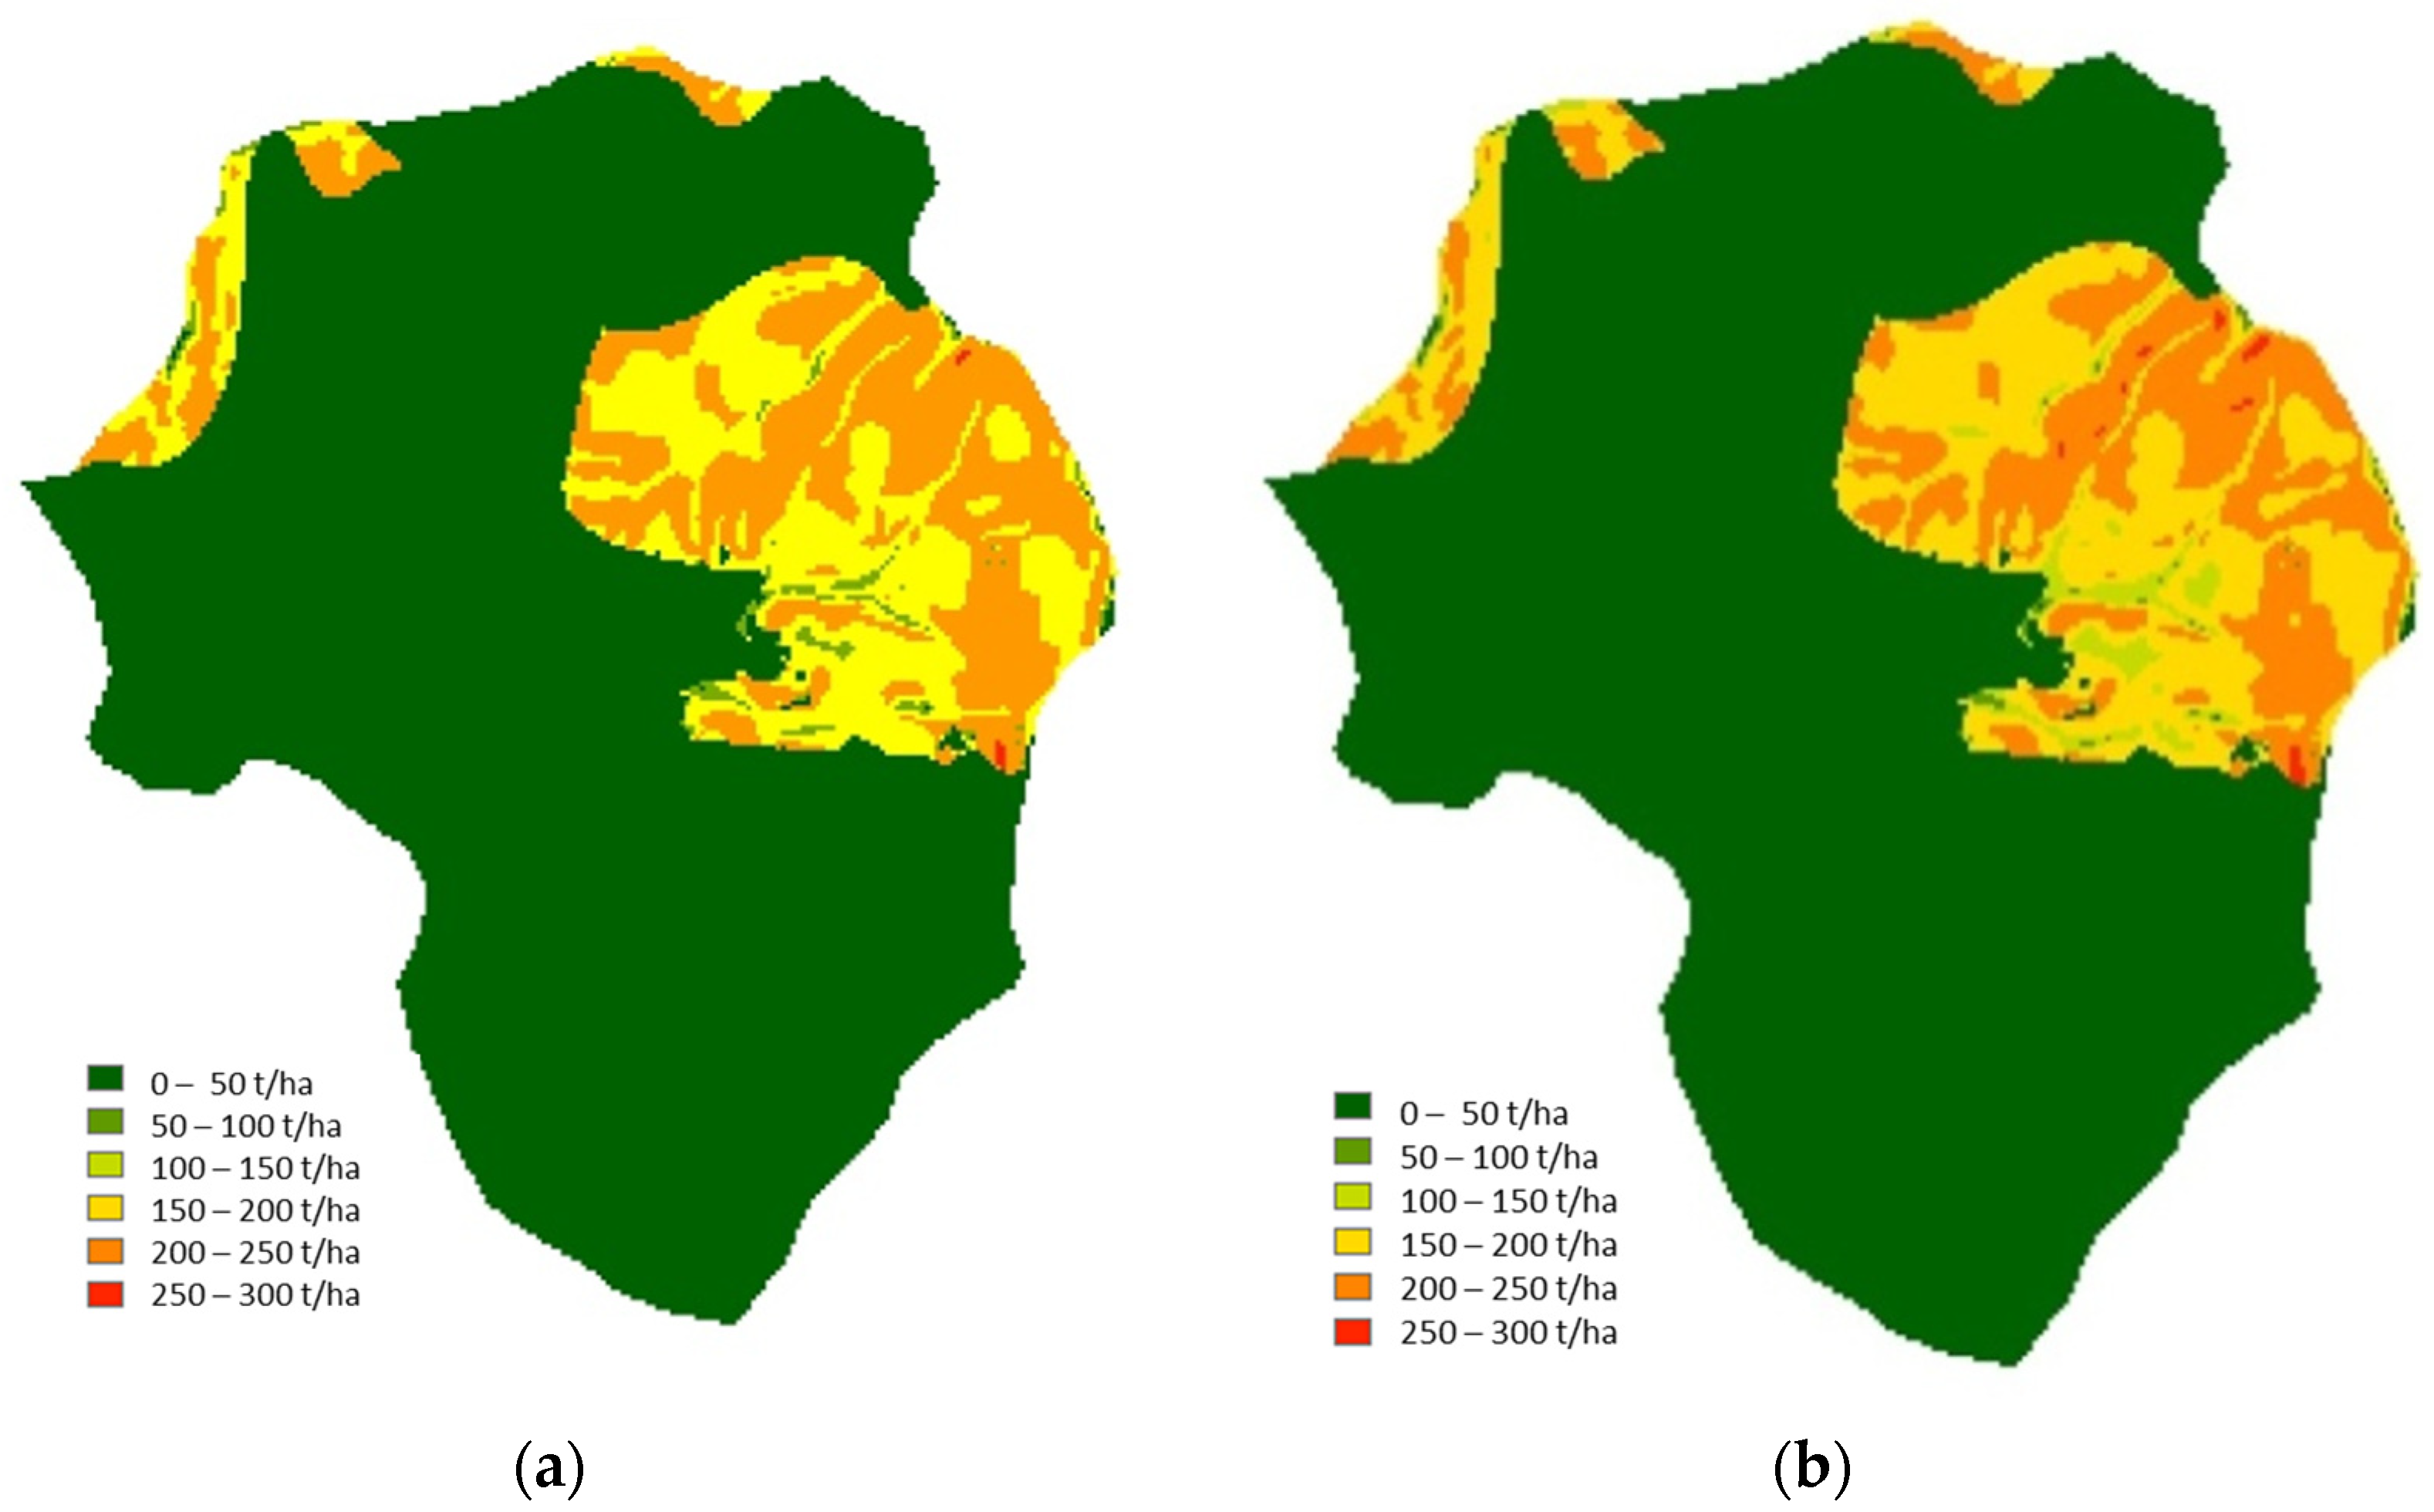
The NDVI values after logging were used to estimate soil erosion using SEMMA-Ic. Among regions with topography and soil characteristics vulnerable to erosion, the risk of soil erosion increased significantly in areas with a low NDVI index due to wildfires and logging. The high erosion range where soil erosion occurs at values of more than 200 t/ha [110] was greatly expanded. Sediment yields from the study watershed after logging were estimated to be 142.38 t/ha and 183.70 t/ha for 30-year and 50-year frequency of rainfall, respectively (Figure 14). The risk of soil erosion after logging was 3.5 times higher than after wildfires (Table 4). The results confirmed that human intervention rather than wildfires is a stronger factor in increasing soil erosion.
According to the results simulated by the RUSLE for watersheds in Eastern Attica, Greece [13], post-fire erosion rates were notably higher throughout the study area (4.53–5.98 t/ha/yr). In particular, the wildland-urban interface zone disturbed by development exhibited a higher erosion rate (3.75–18.58 t/ha/yr). Sediment yields from small brunt watersheds in South Korea were greatly increased because of additional disturbance from terrace-sodding, cutting of burnt trees, pine planting, and mechanical practices after wildfires [31]. Excessive implementation of post-fire treatment works should be avoided as it causes serious erosion. The pictures in Figure 3 are proof that control works and logging in wildfire areas significantly increase erosion.
3.1.4. Applicability of SEMMA
SEMMA is a model that simulates the soil erosion rate generated on mountainous hillslopes. Sediment yield tends to be high at small scales of bounded plots and slope transects. Still, it is comparatively lower at catchment scales [114,115] because the storage capacity of sediment increases with the catchment area [111]. In particular, stream-head hollows where surface flows from hillslopes converge [116,117] are susceptible to surface runoff following heavy rain [118] but have the function of deposition storage that can reduce sediment yield from the catchment for general rainfall events [31,119].
RUSLE, which is based on bare lands, considers the sediment delivery ratio (SDR) as the watershed area increases. SEMMA, which was developed from plot data of mountainous hillslopes, does not consider the SDR because the detailed model equations reflect the decrease in soil erosion as the slope length increases. However, the erosion rate under heavy rain conditions has a proportional relationship to the topographical factor. The application of SEMMA-Ic in a post-fire watershed [55] demonstrated that the evaluation might be underestimated because this model does not reflect the additional erosion of gullies and valleys expanded by an increasingly concentrated flow under a heavy rain of over 380 mm/day. Research on the LS factor using a DEM elevation dataset should be additionally conducted for watershed application of SEMMA. SEMMA should be improved using physical and hydrological models such as WEPP [48] and RHEM [120]. The development of automated workflows is required for the estimation of erosion based on well-known erosion prediction models [121,122].
3.2. Management Strategies
3.2.1. Treatment Methods
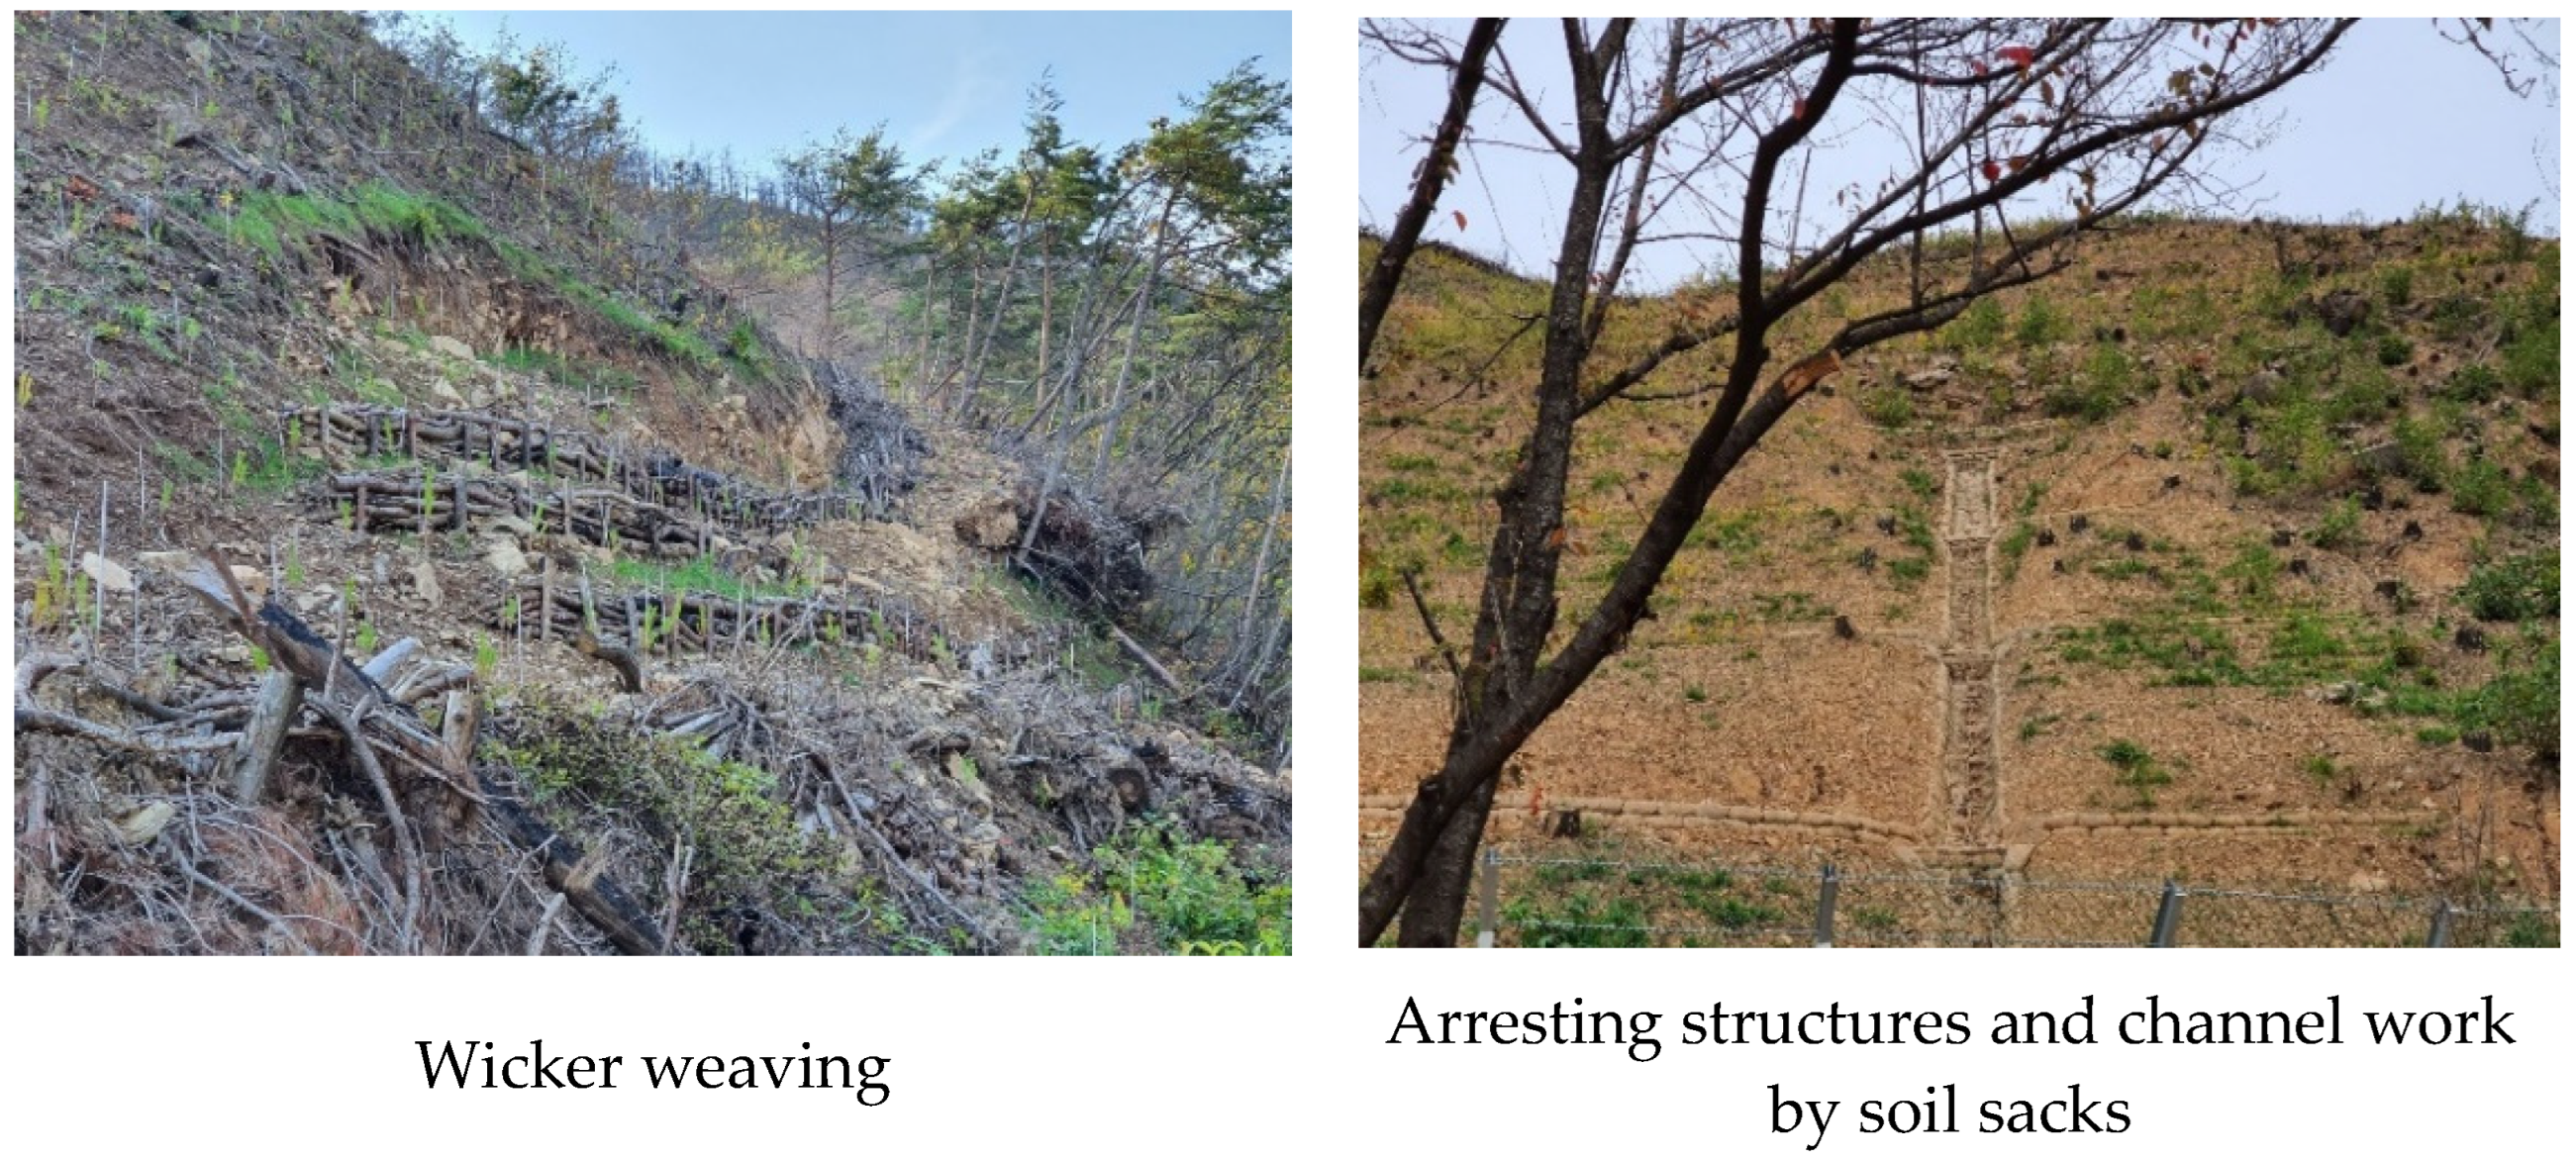
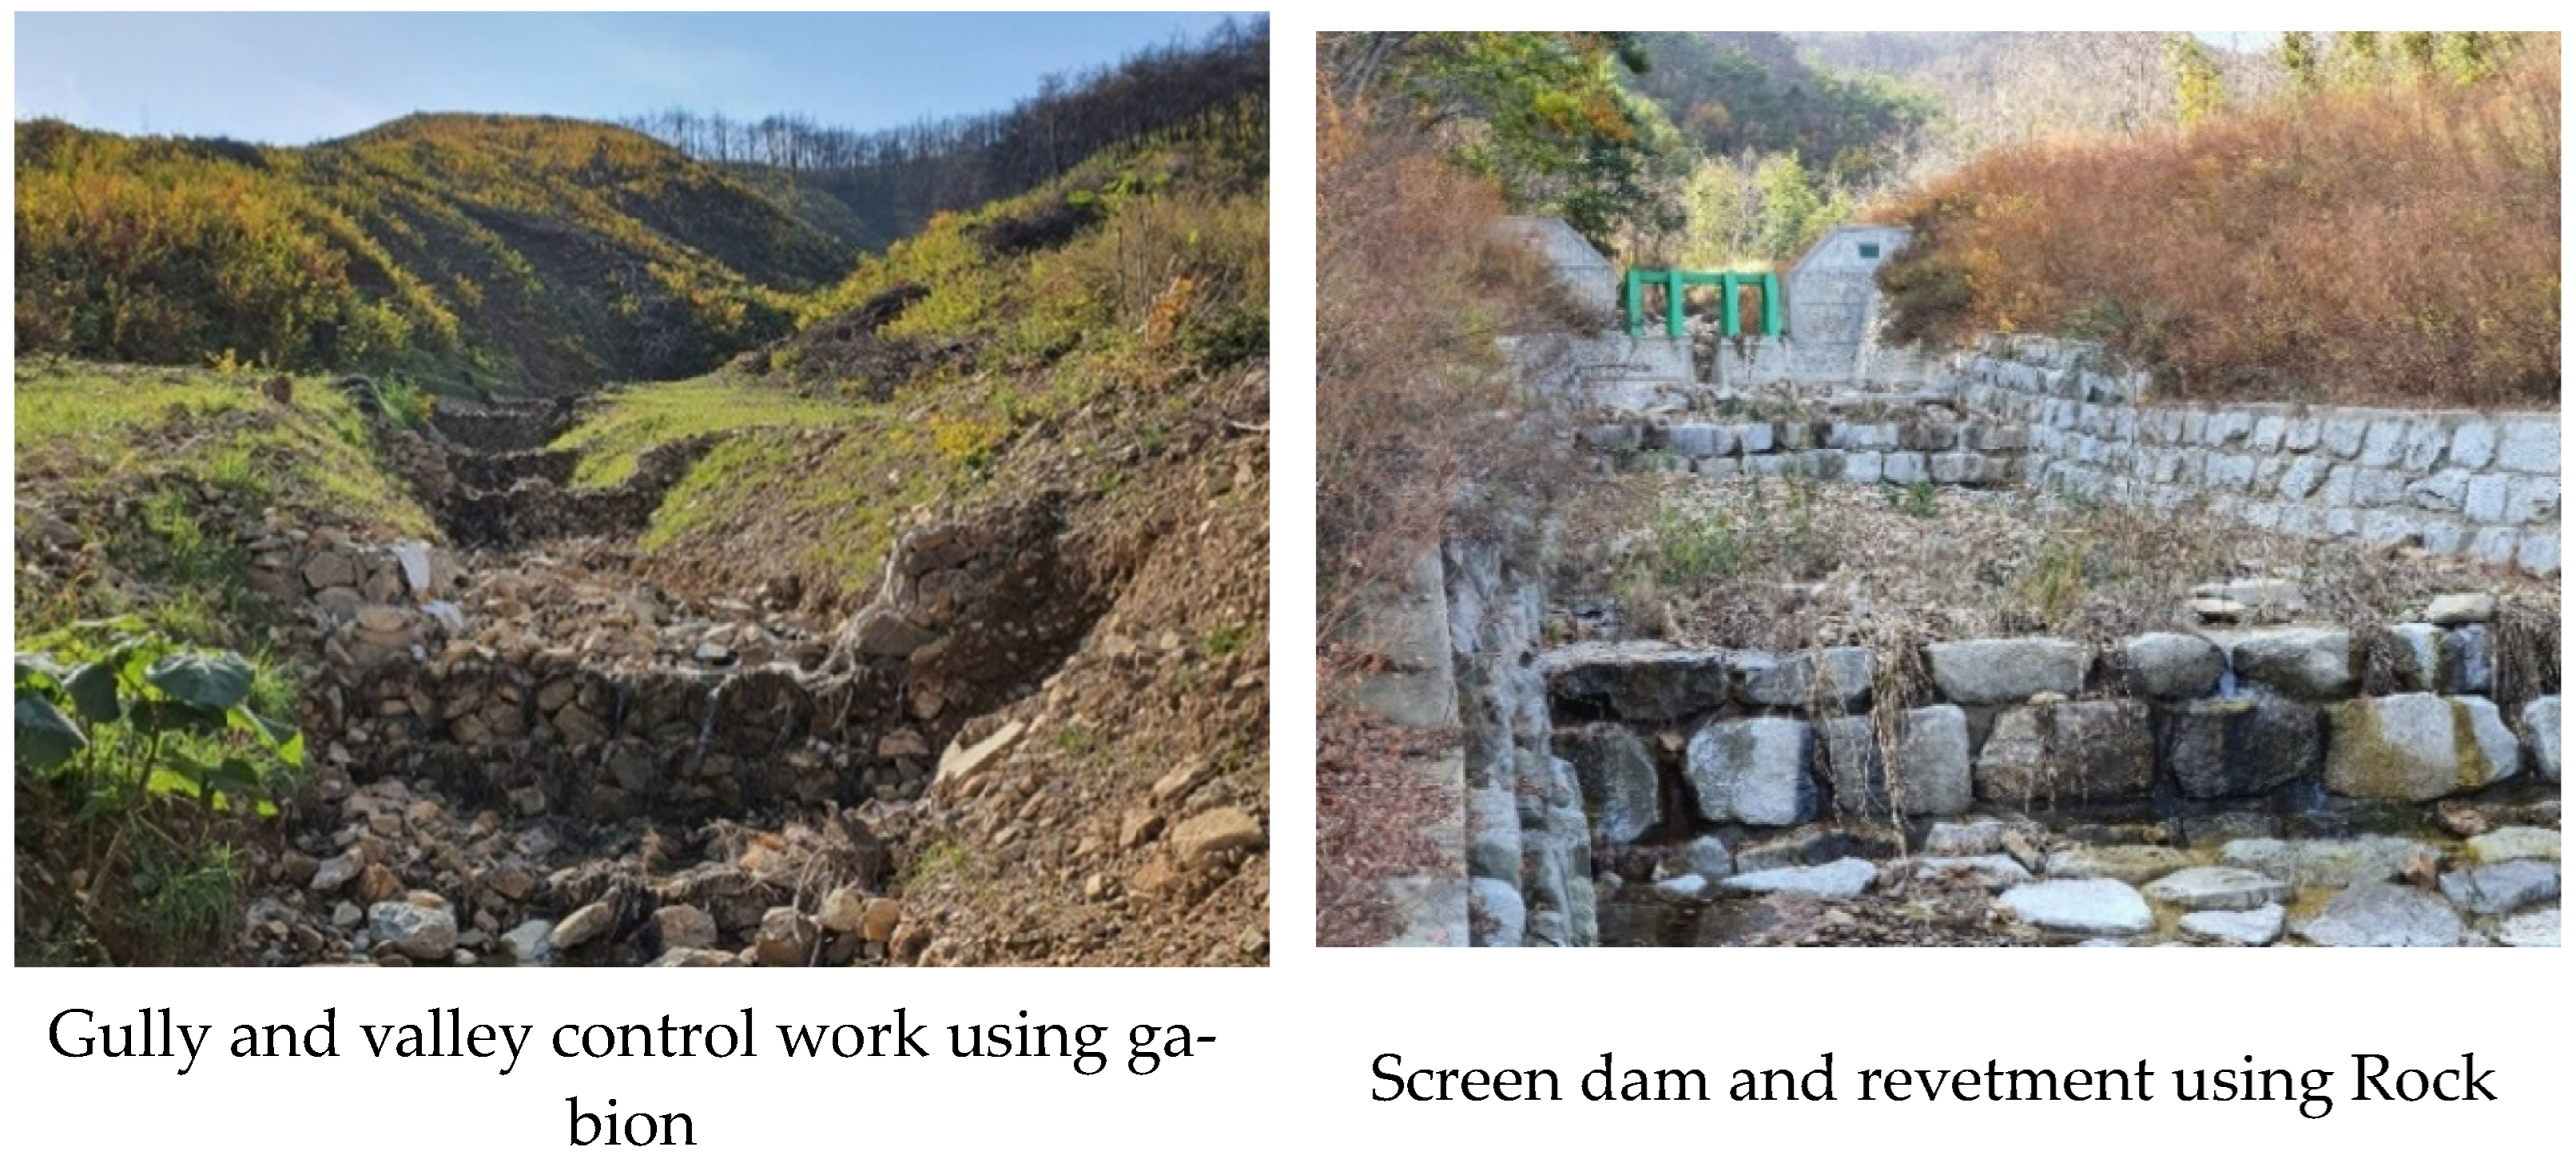
Various treatment works to reduce soil erosion and recover plants were applied in wildfire areas. Following the guideline of the Korea Forest Service [123], soil control works were carried out more actively as floods and sediment yields occurred after heavy rainfall. In order to reduce soil erosion on hillsides, treatment methods were applied, including wicker weaving, reforestation of pine trees reforestation, soil arresting structures using soil sacks, and channel works (Figure 15). Torrent-erosion control works, including revetments with gabions and a rock and screen dam, were implemented to reduce sediment transport, prevent scour, and control debris flows in gullies and valleys (Figure 16).
Fifield [124] presented a field manual for methods to control erosion, such as slope drains, erosion control blankets, sediment traps, straw bale barriers, silt fencing, gravel filters, and rock check structures. Treatments for post-fire rehabilitation of the Hayman Fire were addressed with mulch, hydromulch, scarification, seeding, contour-felled logs, polyacrylamide (PAM) for hillslopes, silt fences, and straw bale check dams designed for use in ephemeral or small-order channels [28,125,126]. While contour-felled logs were effective in terms of protecting the immediate watershed, seeding had a low probability of reducing erosion during the post-fire first year. In the wildfire areas of South Korea, Kim et al. [127] showed that wood chip mulching rather than seeding and log erosion barriers greatly reduced runoff and sediment yields. Check dams with sediment-storage functions should be used less frequently than hillslope treatments for efficiency and economy. Dams using tree branches have been proposed as a biotechnical method to protect hillslopes and control erosion [128].
3.2.2. Logging
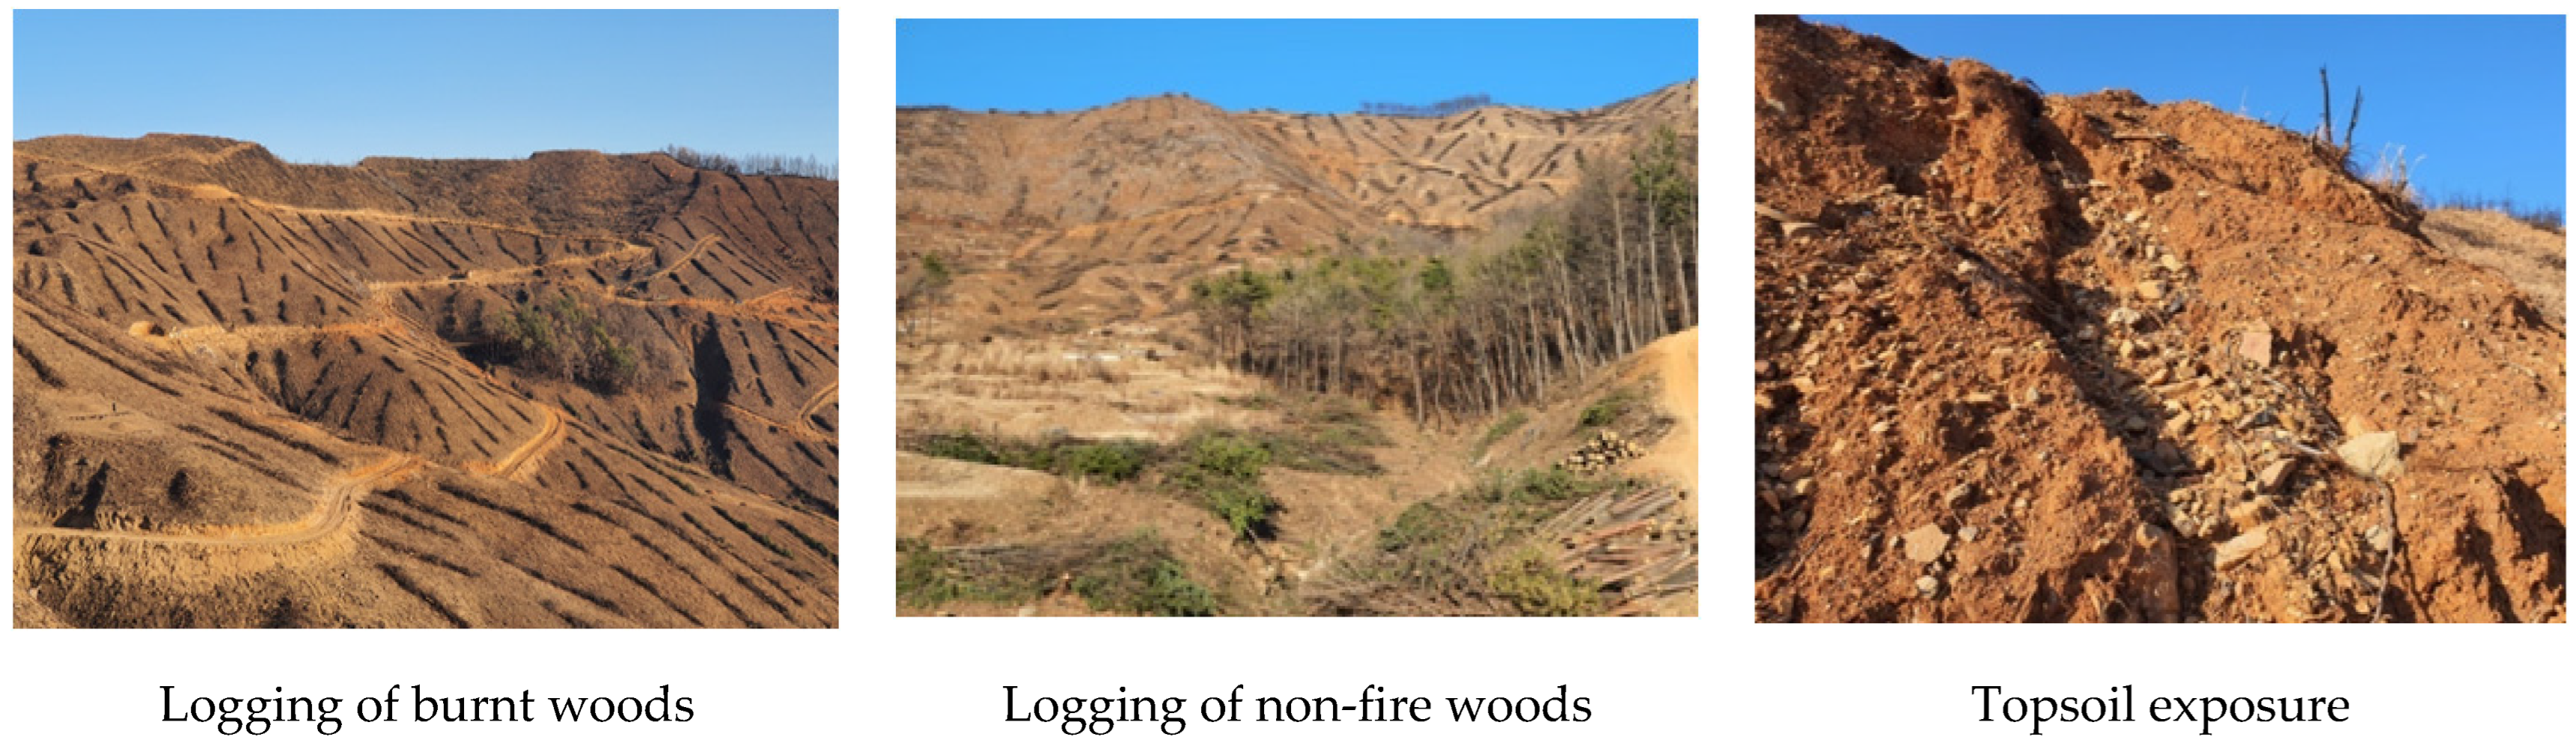
Most of the burnt wood in the wildfire-damaged area was felled for the implementation of control methods according to the landowner’s request and the Korea Forest Service’s manual [123,129], as shown in Figure 17. Extensive logging for owners affected by wildfire has been observed not only in areas with steep slopes where there is a risk of landslides but also in areas with low fire damage. The logging of burnt wood, the movement of heavy equipment, and the construction of forest roads further disturbed the topsoil. In a simple wildfire area, rill and gully erosion do not generally occur as often as on agricultural land and other disturbed lands [130,131,132,133]. However, they were frequently observed in regions where the topsoil is severely exposed and vulnerable to soil erosion. Artificial surface disturbance for restoration and prevention temporarily increases the risk of soil erosion as compared to the loss of surface vegetation and residues from wildfires. Although it was timely to carry out logging during the dry period with low rainfall, the intensity and range were excessive.
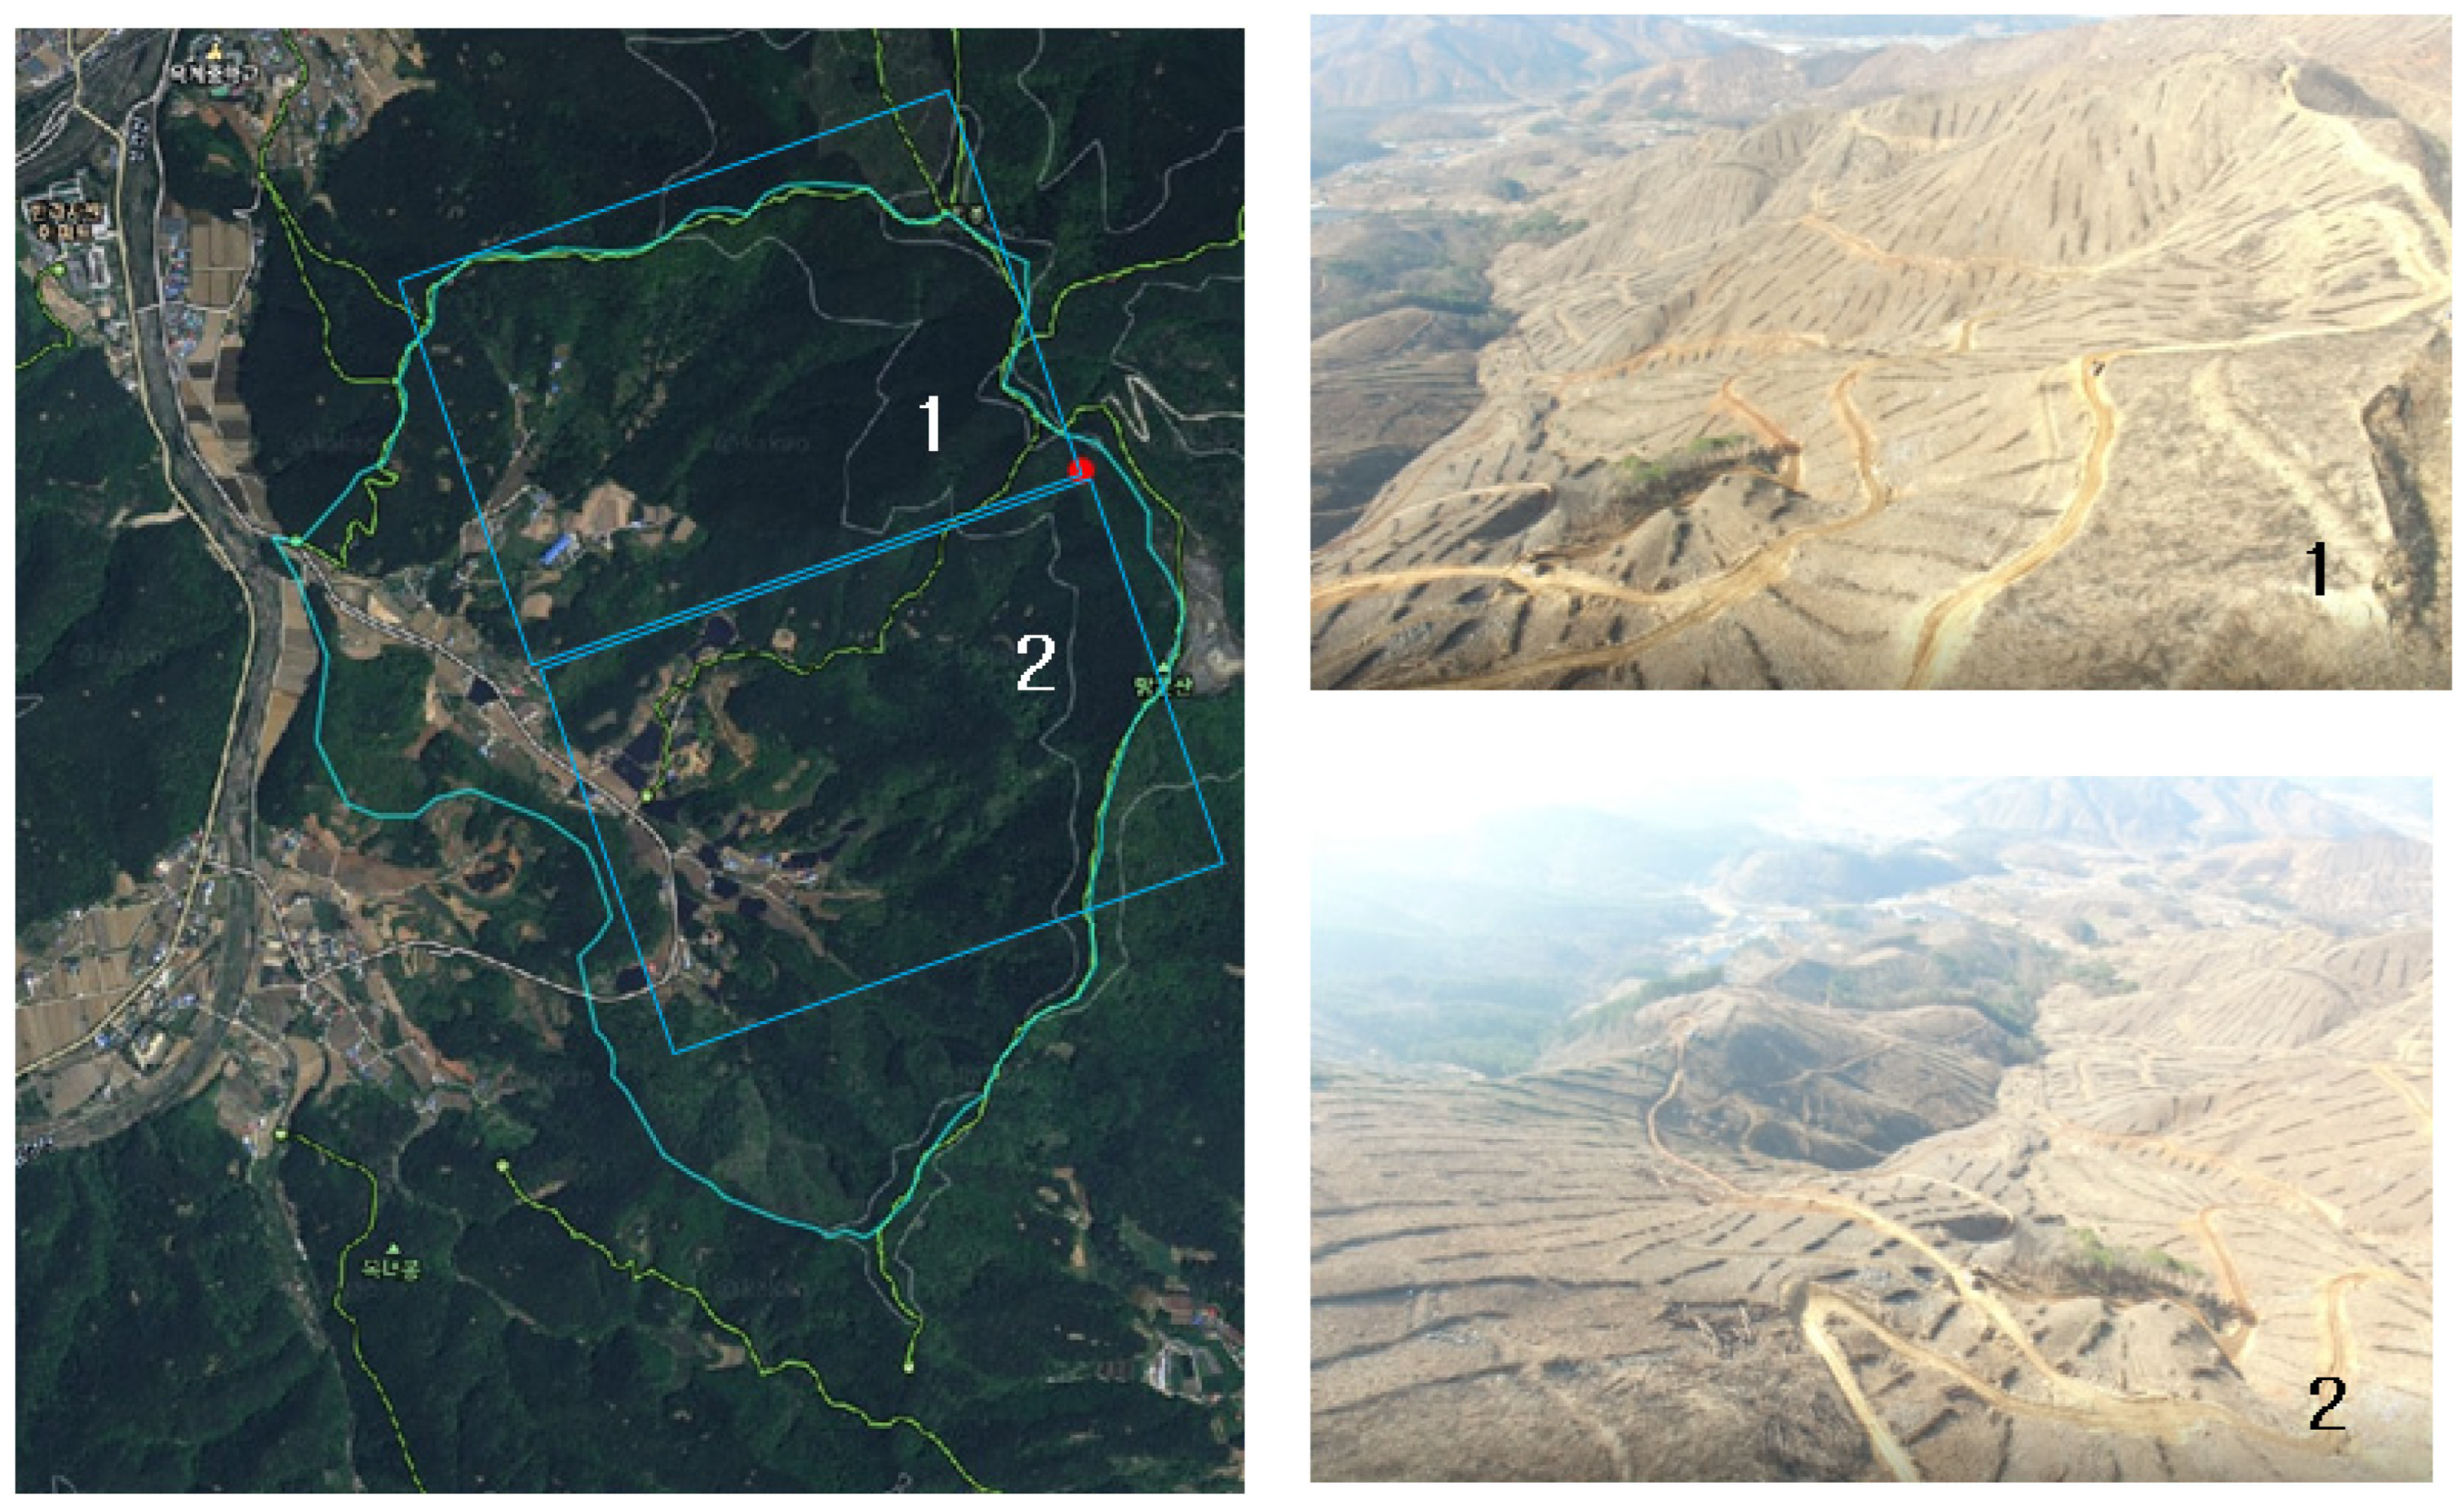
Drone images were acquired to confirm the situation and range of burnt-wood logging in the study watershed for the risk assessment of soil erosion (Figure 18). According to the images taken from the mountain ridge, the range of the logging included a partial non-damaged area as well as most of the fire-damaged area. The steep slope near the ridge was significantly exposed to the risk of soil erosion due to the logging and disturbance.
3.2.3. Best Management Practices
The actual post-fire areas showed different vegetation recovery rates depending on the fire intensity and the regeneration ability [36,127]. Sediment response rates significantly decreased with the vegetation indices and elapsed years due to vegetation regeneration and soil stabilization [31]. According to monitoring data covering eleven years after the wildfires, it took seven years for plots to recover to a low and intermediate degree and only three years to recover to a high degree for soil loss to stabilize [66]. Therefore, an accurate assessment of post-fire sediment yield is essential to establish integrated management and sequential strategies, and appropriate spatial-temporal appropriate treatment methods should be enforced to reduce the accelerated sediment yield until the regeneration of natural vegetation and soil stabilization.
The principle of establishment of restoration plans [126] is connected with the forest function, and it is necessary to promote natural restoration and artificial restoration harmoniously according to location and vegetation conditions. The direction of restoration is carried out in terms of maximizing the income of the residents by collecting the opinions of the owners. The establishment of a plan, standards, and methods for restoring a healthy forest have been suggested according to the degree of damage and locational conditions of the wildfire-affected area. Many state and federal Best Management Practices (BMPs) in the USA are used to provide protection to soil and water resources while minimizing adverse societal effects, including support for fire-based ecosystem management and specific guidelines for fire management practices [134]. The United States Forest Service provides relevant national wildfire BMPs to protect soil and water and avoid unnecessary ground disturbances [135]. Nationally based BMPs should provide specific guidelines for fire management practices to allow for specific national, regional, and local needs and requirements to be met.
4. Conclusions
The frequency and intensity of wildfires and heavy rains have increased worldwide due to climate change. An eastern mountainous area of South Korea was damaged by floods and sediments due to a typhoon after a wildfire. This study evaluated the risk of soil erosion in wildfire areas using the SEMMA based on ArcGIS. The NDVI extracted from Sentinel-2 images, which was used as the model’s cover factor, decreased significantly after the wildfires. The GIS data layers for the rainfall factor, vegetation index, soil factor, and topographic factor, which are the main parameters of SEMMA-Ic, were calculated to simulate the model.
According to simulation results, high erosion rates were observed in the areas damaged by wildfires. Erosion increased by 30% as the probability frequency of rainfall increased from 30 years to 50 years. Soil loss from wildfire areas was estimated to be less than that in developed areas. Sediment yields from the study watershed were estimated to be 40.33 t/ha and 52.04 t/ha for the 30-year and 50-year frequency of rainfall, respectively. Among wildfire areas, the mountain ridges with a shallow soil depth of silt loam were shown to be at a high risk of erosion. The results simulated by SEMMA-Ic demonstrated a reasonable range that can occur in wildfire areas, which is in accordance with the literature. After the wildfire, the topsoil was excessively exposed to artificial disturbances, such as the logging of burnt woods, the movement of heavy equipment, and the construction of forest roads. The NDVI distribution after logging exhibited a lower range than after wildfires. The sediment yields, which were additionally evaluated by SEMMA-Ic, intensively increased in regions with a low NDVI due to wildfires and logging. Sediment yields from the study watershed after logging were estimated to be 142.38 t/ha and 183.70 t/ha for the 30-year and 50-year frequency of rainfall, respectively. The risk of soil erosion was 3.5 times higher than after a wildfire.
After wildfires, erosion control methods are implemented to reduce the risk of soil erosion and sediment runoff. Management methods to reduce soil erosion from hillsides include wicker weaving, pine trees reforestation, soil arresting structures using soil sacks, and channel work. Channel control works of revetment using gabions and screen dams were installed to reduce sediment runoff and prevent erosion in the gullies and valleys. The majority of the burnt wood was felled within the study watershed at the landowner’s request and in accordance with the Korea Forest Service’s manual. Despite the implementation of various management strategies to reduce soil erosion, urgent and excessive logging further increased the risk of soil erosion in wildfire areas. Best management practices should be enforced because excessive emergency restoration after a wildfire can increase sediment disaster.
Author Contributions
Conceptualization, supervision, S.D.P.; validation, investigation, writing—original draft preparation, S.S.S.; methodology, data curation, S.S.S. and G.K.; writing—review and editing, S.D.P. and G.K.; funding acquisition, S.D.P. and S.S.S. All authors have read and agreed to the published version of the manuscript.
Funding
This research was supported by Basic Science Research Program through the National Research Foundation of Korea (NRF) funded by the Ministry of Science and ICT (No. 2019R1A2C1009285) and the Ministry of Education (No. 2021R1A6A1A03044326).
Institutional Review Board Statement
Not applicable.
Informed Consent Statement
Not applicable.
Data Availability Statement
The data presented in this study are available upon request from the corresponding author.
Conflicts of Interest
The authors declare no conflict of interest.
References
- Lee, S.Y.; Lee, H.P. Analysis of forest fire occurrence in Korea. Fire Sci. Eng. 2006, 20, 54–63. [Google Scholar]
- Sung, M.K.; Lim, G.H.; Choi, E.H.; Lee, Y.Y.; Won, M.S.; Koo, K.S. Climate change over Korea and its relation to the forest fire occurrence. Atmos. Korean Meteorol. Soc. 2010, 20, 27–35. [Google Scholar]
- Pelletier, J.D.; Murray, A.B.; Pierce, J.L.; Bierman, P.; Breshears, D.D.; Crosby, B.T.; Ellis, M.A.; Foufoula-Georgiou, E.; Heimsath, A.M.; Houser, C.; et al. Forecasting the response of Earth’s surface to future climatic and land use changes: A review of methods and research needs. Earth’s Future 2015, 3, 220–251. [Google Scholar] [CrossRef] [Green Version]
- Jeon, B.R.; Chae, H.M. A study of analysis on relationship between Korea forest fire occurrence and weather factor. J. Korean Soc. Hazard Mitig. 2017, 17, 197–206. [Google Scholar] [CrossRef]
- Korea Meteorological Administration. Open Weather Data Portal. Available online: https://data.kma.go.kr/cmmn/main.do (accessed on 19 June 2019).
- FAO. Global Forest Fire Assessment 1990–2000. In Forest Resources Assessment Programme; Working Paper No. 55; FAO: Rome, Italy, 2001; Available online: http://www.fao.org/forestry/fo/fra/docs/Wp55eng.pdf (accessed on 14 April 2009).
- Pausas, J.G.; Bradstock, R.A.; Keith, D.A.; Keeley, J.E. GTCE (Global Change of Terrestrial Ecosystems) Fire Network. Plant Functional Traits in Relation to Fire in Crown-Fire Ecosystems. Ecology 2004, 85, 1085–1100. [Google Scholar] [CrossRef] [Green Version]
- Littell, J.S.; McKenzie, D.; Peterson, D.L.; Westerling, A.L. Climate and wildfire area burned in western U.S. ecoprovinces, 1916–2003. Ecol. Appl. 2009, 19, 1003–1021. [Google Scholar] [CrossRef]
- Dennison, P.E.; Brewer, S.C.; Arnold, J.D.; Moritz, M.A. Large wildfire trends in the western United States, 1984–2011. Geophys. Res. Lett. 2014, 41, 2928–2933. [Google Scholar] [CrossRef]
- Nyman, P.; Sheridan, G.J. Erosion in Burned Catchments of Australia: Regional Synthesis and Guidelines for Evaluating Risk. In Report for AFAC and the Bushfire CRC, Forest and Ecosystem Science; The University of Melbourne: Melbourne, VIC, Australia, 2014. [Google Scholar]
- Sankey, J.B.; Kreitler, J.; Hawbaker, T.J.; McVay, J.L.; Miller, M.E.; Mueller, E.R.; Vaillant, N.M.; Lowe, S.E.; Sankey, T.T. Climate, wildfire, and erosion ensemble foretells more sediment in western USA watersheds. Geophys. Res. Lett. 2017, 44, 8884–8892. [Google Scholar] [CrossRef] [Green Version]
- European Commission. Forest Fires: Sparking Firesmart Policies in the EU. Directorate-General for Research and Innovation; European Commission: Brussels, Belgium, 2018. [Google Scholar]
- Efthimiou, N.; Psomiadis, E.; Panagos, P. Fire severity and soil erosion susceptibility mapping using multi-temporal Earth Observation data: The case of Mati fatal wildfire in Eastern Attica, Greece. CATENA 2020, 187, 104320. [Google Scholar] [CrossRef]
- Heidari, H.H.; Arabi, M.; Warziniack, T. Effects of Climate Change on Natural-Caused Fire Activity in Western U.S. National Forests. Atmosphere 2021, 12, 981. [Google Scholar] [CrossRef]
- Kang, M.W.; Kim, D.J.; Lim, K.; Lee, S.S. Rainfall erosivity factor of Korean soils estimated by using USLE under climate change. Korean J. Soil Sci. Fert. 2021, 54, 265–275. [Google Scholar] [CrossRef]
- Stefanidis, S.; Alexandridis, V.; Chatzichristaki, C.; Stefanidis, P. Assessing soil loss by water erosion in a typical Mediterranean ecosystem of northern Greece under current and future rainfall erosivity. Water 2021, 13, 2002. [Google Scholar] [CrossRef]
- Panagos, P.; Ballabio, C.; Himics, M.; Scarpa, S.; Matthews, F.; Bogonos, M.; Poesen, J.; Borrelli, P. Projections of soil loss by water erosion in Europe by 2050. Environ. Sci. Policy 2021, 124, 380–392. [Google Scholar] [CrossRef]
- Coscarelli, R.; Aguilar, E.; Petrucci, O.; Vicente-Serrano, S.M.; Zimbo, F. The Potential Role of Climate Indices to Explain Floods, Mass-Movement Events and Wildfires in Southern Italy. Climate 2021, 9, 156. [Google Scholar] [CrossRef]
- Emmerich, W.E.; Cox, J.R. Changes in Surface Runoff and Sediment Production after Repeated Rangeland Burns. Soil Sci. Soc. Am. J. 1994, 58, 199–203. [Google Scholar] [CrossRef]
- Morgan, R.P.C. Soil Erosion and Conservation; Longman Group Limited: London, UK, 1995. [Google Scholar]
- Johansen, M.P.; Hakonson, T.E.; Breshears, D.D. Post-fire runoff and erosion from rainfall simulation: Contrasting forests with shrublands and grasslands. Hydrol. Process. 2001, 15, 2953–2965. [Google Scholar] [CrossRef]
- Shakesby, R.A.; Coelho, C.O.A.; Ferreira, A.J.D.; Walsh, R.P.D. Ground-level changes after wildfire and ploughing in eucalyptus and pine forests, Portugal: Implications for soil microtopographical development and soil longevity. Land Degrad. Dev. 2002, 13, 111–127. [Google Scholar] [CrossRef]
- Smith, H.; Dragovich, D. Post-fire hillslope erosion response in a sub-alpine environment, south-eastern Australia. CATENA 2008, 73, 274–285. [Google Scholar] [CrossRef]
- Nyman, P.; Sheridan, G.; Lane, P.N.J. Synergistic effects of water repellency and macropore flow on the hydraulic conductivity of a burned forest soil, south-east Australia. Hydrol. Process. 2010, 24, 2871–2887. [Google Scholar] [CrossRef]
- Robichaud, P.R.; Wagenbrenner, J.W.; Pierson, F.B.; Spaeth, K.E.; Ashmun, L.E.; Moffet, C.A. Infiltration and interrill erosion rates after a wildfire in western Montana, USA. CATENA 2016, 142, 77–88. [Google Scholar] [CrossRef] [Green Version]
- Lucas-Borja, M.E.; Bombino, G.; Carrà, B.G.; D’Agostino, D.; Denisi, P.; Labate, A.; Plaza-Alvarez, P.A.; Zema, D.A. Modeling the Soil Response to Rainstorms after Wildfire and Prescribed Fire in Mediterranean Forests. Climate 2020, 8, 150. [Google Scholar] [CrossRef]
- Scott, D. The hydrological effects of fire in South African mountain catchments. J. Hydrol. 1993, 150, 409–432. [Google Scholar] [CrossRef] [Green Version]
- Robichaud, P.R.; Beyers, J.L.; Neary, D.G. Evaluating the Effectiveness of Postfire Rehabilitation Treatments; U.S. Department of Agriculture, Forest Service: Fort Collins, CO, USA, 2000. [Google Scholar] [CrossRef] [Green Version]
- Mayor, A.G.; Bautista, S.; Llovert, J.; Bellot, J. Post-fire hydrological and erosional responses of a Mediterranean landscape: Seven years of catchment-scale dynamics. CATENA 2007, 71, 68–75. [Google Scholar] [CrossRef]
- Smith, H.G.; Sheridan, G.J.; Lane, P.N.J.; Bren, L. Wildfire and salvage harvesting effects on runoff generation and sediment exports from eucalypt and radiata pine forest catchments, south-eastern Australia. For. Ecol. Manag. 2011, 261, 570–581. [Google Scholar] [CrossRef]
- Shin, S.S.; Park, S.D.; Lee, K.S. Sediment and hydrological response to vegetation recovery following wildfire on hillslopes and the hollow of a small watershed. J. Hydrol. 2013, 499, 154–166. [Google Scholar] [CrossRef]
- Soto, B.; Díaz-Fierros, F. Runoff and soil erosion from areas of burnt scrub: Comparison of experimental results with those predicted by the WEPP model. CATENA 1998, 31, 257–270. [Google Scholar] [CrossRef]
- Pierson, F.B.; Robichaud, P.R.; Moffet, C.A.; Spaeth, K.E.; Hardegree, S.P.; Clark, P.E.; Williams, C.J. Fire effects on rangeland hydrology and erosion in a steep sagebrush-dominated landscape. Hydrol. Process. 2008, 22, 2916–2929. [Google Scholar] [CrossRef]
- Pierson, F.B.; Robichaud, P.R.; Spaeth, K.E. Spatial and temporal effects of wildfire on the hydrology of a steep rangeland watershed. Hydrol. Process. 2001, 15, 2905–2916. [Google Scholar] [CrossRef]
- Moffet, C.A.; Pierson, F.B.; Robichaud, P.R.; Spaeth, K.E.; Hardegree, S.P. Modeling soil erosion on steep sagebrush rangeland before and after prescribed fire. CATENA 2007, 71, 218–228. [Google Scholar] [CrossRef]
- Shin, S.S.; Park, S.D.; Cho, J.W.; Lee, K.S. Effect of vegetation recovery for surface runoff and soil erosion in burned mountains, Yangyang. KSCE J. Civ. Environ. Eng. Res. 2008, 28, 393–403. [Google Scholar]
- Wischmeier, W.H.; Smith, D.D. Predicting Rainfall Erosion Losses from Cropland East of the Rocky Mountains. In Agriculture Hand Book 282; US Department of Agriculture: Washington, DC, USA, 1965. [Google Scholar]
- Wischmeier, W.H.; Smith, D.D. Predicting Rainfall Erosion Losses–A Guide to Conservation Planning. In Agriculture Handbook 537; US Department of Agriculture-Science and Education Administration: Washington, DC, USA, 1978. [Google Scholar]
- Renard, K.G.; Foster, G.R.; Weesies, G.A.; McCool, D.K.; Yoder, D.C. Predicting Soil Erosion by Water: A Guide to Conservation Planning with the Revised Universal Soil Loss Equation (RUSLE). In US Department of Agriculture Handbook 703; US Department of Agriculture-Agricultural Search Service: Washington, DC, USA, 1997. [Google Scholar]
- De Jong, S.M. Applications of Reflective Remote Sensing for Land Degradation Studies in a Mediterranean Environment. Ph.D. Thesis, Utrecht University, Utrecht, The Netherlands, 1994. [Google Scholar]
- Drake, N.A.; Zhang, X.; Berkhout, E.; Bonifacio, R.; Grimes, D.; Wainwright, J.; Mulligan, M. Modeling soil erosion at global and regional scales using remote sensing and GIS techniques. In Spatial Analysis for Remote Sensing and GIS; Atkinson, P., Ed.; CRC Press: Boca Raton, FL, USA, 1997; pp. 241–261. [Google Scholar]
- Van der Knijff, J.M.; Jones, R.J.A.; Montanarella, L. Soil Erosion Risk in Italy; EUR 19022 EN; Office for Official Publications of the European Communities: Luxembourg, 1999. [Google Scholar]
- De Asis, A.M.; Omasa, K. Estimation of vegetation parameter for modeling soil erosion using linear Spectral Mixture Analysis of Landsat ETM data. ISPRS J. Photogramm. Remote Sens. 2007, 62, 309–324. [Google Scholar] [CrossRef]
- Lim, K.J.; Sagong, M.; Engel, B.A.; Tang, Z.; Choi, J.; Kim, K.S. GIS-based sediment assessment tool. CATENA 2005, 64, 61–80. [Google Scholar] [CrossRef]
- Ban, J.K.; Yu, I.; Jeong, S. Estimation of Soil Erosion Using RUSLE Model and GIS Techniques for Conservation Planning from Kulekhani Reservoir Catchment, Nepal. J. Korean Soc. Hazard Mitig. 2016, 16, 323–330. [Google Scholar] [CrossRef] [Green Version]
- Gelagay, H.S.; Minale, A.S. Soil loss estimation using GIS and Remote sensing techniques: A case of Koga watershed, Northwestern Ethiopia. Int. Soil Water Conserv. Res. 2016, 4, 126–136. [Google Scholar] [CrossRef] [Green Version]
- El Jazouli, A.; Barakat, A.; Ghafiri, A.; El Moutaki, S.; Ettaqy, A.; Khellouk, R. Soil erosion modeled with USLE, GIS, and remote sensing: A case study of Ikkour watershed in Middle Atlas (Morocco). Geosci. Lett. 2017, 4, 25. [Google Scholar] [CrossRef] [Green Version]
- Flanagan, D.C.; Nearing, M.A. (Eds.) USDA-Water Erosion Prediction Project (WEPP) Version 95.7, Hillslope Profile and Watershed Model Documentation. In National Soil Erosion Research Laboratory Report 10; US Department of Agriculture-Agricultural Search Service: West Lafayette, IN, USA, 1995. [Google Scholar]
- Renschler, C.S. Designing geo-spatial interfaces to scale process models: The GeoWEPP approach. Hydrol. Process. 2003, 17, 1005–1017. [Google Scholar] [CrossRef]
- Lee, T. Analyzing the effectiveness of a best management practice on sediment yields using a spatially distributed model. J. Korean Geogr. Soc. 2017, 52, 15–24. [Google Scholar]
- Choi, J.; Shin, M.H.; Cheon, S.U.; Shin, D.; Lee, S.J.; Moon, S.J.; Ryu, J.C.; Lim, K.J. Evaluation of runoff prediction from a coniferous forest watersheds and runoff estimation under various cover degree scenarios using GeoWEPP watershed model. J. Korean Soc. Water Qual. 2011, 27, 425–432. [Google Scholar]
- Kim, M.S.; Kim, J.K.; Yang, D.Y. Application and Comparison of GeoWEPP model and USLE model to Natural Small Catchment-A Case Study in Danwol-dong, Icheon-si. Econ. Environ. Geol. 2007, 40, 103–113. [Google Scholar]
- Park, S.D.; Shin, S.S. Evaluation for Application of Soil Erosion Models in Burnt Hillslopes-RUSLE, WEPP, and SEMMA. KSCE J. Civ. Environ. Eng. Res. 2011, 31, 221–232. [Google Scholar]
- Park, S.D.; Lee, K.S.; Shin, S.S. Statistical Soil Erosion Model for Burnt Mountain Areas in Korea—RUSLE Approach. J. Hydrol. Eng. 2012, 17, 292–304. [Google Scholar] [CrossRef]
- Shin, S.S.; Park, S.D.; Lee, J.S.; Lee, K.S. SEMMA Revision to Evaluate Soil Erosion on Mountainous Watershed of Large Scale. J. Korea Water Resour. Assoc. 2013, 46, 885–896. [Google Scholar] [CrossRef] [Green Version]
- Cuomo, V.; Lasaponara, R.; Tramutoli, V. Evaluation of a new satellite-based method for forest fire detection. Int. J. Remote Sens. 2001, 22, 1799–1826. [Google Scholar] [CrossRef]
- Chéret, V.; Denux, J.P. Mapping wildfire danger at regional scale with an index model integrating coarse spatial resolution remote sensing data. J. Geophys. Res. Earth Surf. 2007, 112, G02006. [Google Scholar] [CrossRef] [Green Version]
- Chen, X.; Vogelmann, J.; Rollins, M.; Ohlen, D.; Key, C.H.; Yang, L.; Huang, C.; Shi, H. Detecting post-fire burn severity and vegetation recovery using multitemporal remote sensing spectral indices and field-collected composite burn index data in a ponderosa pine forest. Int. J. Remote Sens. 2011, 32, 7905–7927. [Google Scholar] [CrossRef]
- Leon, J.R.R.; Van Leeuwen, W.J.; Casady, G.M. Using MODIS-NDVI for the Modeling of Post-Wildfire Vegetation Response as a Function of Environmental Conditions and Pre-Fire Restoration Treatments. Remote Sens. 2012, 4, 598–621. [Google Scholar] [CrossRef] [Green Version]
- Dindaroglu, T.; Babur, E.; Yakupoglu, T.; Rodrigo-Comino, J.; Cerdà, A. Evaluation of geomorphometric characteristics and soil properties after a wildfire using Sentinel-2 MSI imagery for future fire-safe forest. Fire Saf. J. 2021, 122, 103318. [Google Scholar] [CrossRef]
- Sánchez, Y.S.; Graña, A.M.; Francés, F.S. Remote Sensing Calculation of the Influence of Wildfire on Erosion in High Mountain Areas. Agronomy 2021, 11, 1459. [Google Scholar] [CrossRef]
- Argentiero, I.; Ricci, G.F.; Elia, M.; D’Este, M.; Giannico, V.; Ronco, F.V.; Gentile, F.; Sanesi, G. Combining Methods to Estimate Post-Fire Soil Erosion Using Remote Sensing Data. Forests 2021, 12, 1105. [Google Scholar] [CrossRef]
- Kim, J.C.; Koh, H.J.; Lee, S.R.; Lee, C.B.; Choi, S.J.; Park, G.H. Explanatory Note of the Gangneung-Sokcho Sheet; Korea Institute of Geoscience and Mineral Resources: Daejeon, Korean, 2001. [Google Scholar]
- U.S. Department of Agriculture. Soil Taxonomy: A Basic System of Soil Classification for Making and Interpreting Soil Surveys. In Agriculture Handbook 436; U.S. Department of Agriculture: Washington, DC, USA, 1975. [Google Scholar]
- National Institute of Agricultural Sciences, RDA. Korean Soil Information System. 2016. Available online: http://soil.rda.go.kr/geoweb/soilmain.do (accessed on 13 April 2022).
- Kim, Y.; Kim, C.G.; Lee, K.S.; Choung, Y. Effects of Post-Fire Vegetation Recovery on Soil Erosion in Vulnerable Montane Regions in a Monsoon Climate: A Decade of Monitoring. J. Plant Biol. 2021, 64, 123–133. [Google Scholar] [CrossRef]
- Ministry of Environment. Development of Program for Rainfall Frequency Analysis. In Report of Republic Korea; Ministry of Environment: Sejong, Korea, 2020. [Google Scholar]
- Blanchard, D.C. Raindrop Size-Distribution in Hawaiian Rains. J. Meteorol. 1953, 10, 457–473. [Google Scholar] [CrossRef] [Green Version]
- Wischmeier, W.H.; Smith, D.D. Rainfall energy and its relationship to soil loss. Trans. Am. Geophys. Union 1958, 39, 285–291. [Google Scholar] [CrossRef]
- Zanchi, C.; Torri, D. Evaluation of rainfall energy in central Italy. In Assessment of Erosion; De Boodt, M., Gabriels, D., Eds.; Wiley: Toronto, TO, Canada, 1980; pp. 133–142. [Google Scholar]
- Kinnell, P. Rainfall Intensity-Kinetic Energy Relationships for Soil Loss Prediction1. Soil Sci. Soc. Am. J. 1981, 45, 153–155. [Google Scholar] [CrossRef]
- Rosewell, C.J. Rainfall Kinetic Energy in Eastern Australia. J. Clim. Appl. Meteorol. 1986, 25, 1695–1701. [Google Scholar] [CrossRef] [Green Version]
- Brown, L.C.; Foster, G.R. Storm Erosivity Using Idealized Intensity Distributions. Trans. ASAE 1987, 30, 379–386. [Google Scholar] [CrossRef]
- Brandt, C.J. Simulation of the size distribution and erosivity of raindrops and throughfall drops. Earth Surf. Process. Landf. 1990, 15, 687–698. [Google Scholar] [CrossRef]
- McIsaac, G.F. Apparent geographic and atmospheric influences on raindrop sizes and rainfall kinetic energy. J. Soil Water Conserv. 1990, 45, 663–666. [Google Scholar]
- Smith, J.A.; De Veaux, R.D. The temporal and spatial variability of rainfall power. Environmetrics 1992, 3, 29–53. [Google Scholar] [CrossRef]
- Uijlenhoet, R.; Stricker, J. A consistent rainfall parameterization based on the exponential raindrop size distribution. J. Hydrol. 1999, 218, 101–127. [Google Scholar] [CrossRef]
- Fornis, R.L.; Vermeulen, H.R.; Nieuwenhuis, J.D. Kinetic energy-rainfall intensity relationship for Central Cebu, Philippines for soil erosion studies. J. Hydrol. 2005, 300, 20–32. [Google Scholar] [CrossRef]
- Lee, J.S.; Won, J.Y. Analysis of the Characteristic of Monthly Rainfall Erosivity in Korea with Derivation of Rainfall Energy Equation. J. Korean Soc. Hazard Mitig. 2013, 13, 177–184. [Google Scholar] [CrossRef] [Green Version]
- Van Dijk, A.I.J.M.; Bruijnzeel, L.A.; Rosewell, C.J. Rainfall intensity-kinetic energy relationships. J. Hydrol. 2002, 261, 1–23. [Google Scholar] [CrossRef]
- Shin, S.S.; Park, S.D.; Choi, B.K. Universal Power Law for Relationship between Rainfall Kinetic Energy and Rainfall Intensity. Adv. Meteorol. 2016, 2016, 2494681. [Google Scholar] [CrossRef] [Green Version]
- Morgan, R.P.C.; Quinton, J.N.; Smith, R.E.; Govers, G.; Poesen, J.W.A.; Auerswald, K.; Chisci, G.; Torri, D.; Styczen, M.E. The European soil erosion model (EUROSEM): A dynamic approach for predicting sediment transport from fields and small catchments. Earth Surf. Process. Landf. 1998, 23, 527–544. [Google Scholar] [CrossRef]
- Kinnell, P. Interrill erodibilities based on the rainfall intensity flow discharge erosivity factor. Soil Res. 1993, 31, 319–332. [Google Scholar] [CrossRef]
- Wei, H.; Nearing, M.; Stone, J.; Guertin, D.; Spaeth, K.; Pierson, F.; Nichols, M.; Moffet, C. A New Splash and Sheet Erosion Equation for Rangelands. Soil Sci. Soc. Am. J. 2009, 73, 1386–1392. [Google Scholar] [CrossRef]
- Shin, S.S.; Park, S.D. Effective power for interrill erosion by rainfall-induced sheet flow. J. Korea Water Resour. Assoc. 2018, 51, 665–676. [Google Scholar]
- Shin, S.S.; Park, S.D.; Pierson, F.B.; Williams, C.J. Evaluation of physical erosivity factor for interrill erosion on steep vegetated hillslopes. J. Hydrol. 2019, 571, 559–572. [Google Scholar] [CrossRef]
- Dissmeyer, G.E.; Foster, G.R. A Guide for Prediction Sheet and Rill Erosion on Forest Land. Forest Service Technical Publication RA-TP6; United States Department of Agriculture: Washington, DC, USA, 1984. [Google Scholar]
- Sulistyo, B.; Gunawan, T.; Harjo, H.; Danoedoro, P.; Listyaningrum, N. Absolute Accuracy of the Erosion Model of DEM-NDVI and Its Modification. Int. J. Geoinform. 2017, 13, 23–34. [Google Scholar]
- Ryu, J.H.; Han, K.S.; Hong, S.; Park, N.W.; Lee, Y.W.; Cho, J. Satellite-Based Evaluation of the Post-Fire Recovery Process from the Worst Forest Fire Case in South Korea. Remote Sens. 2018, 10, 918. [Google Scholar] [CrossRef] [Green Version]
- Rouse, J.W.; Haas, R.H.; Schell, J.A.; Deering, D.W. Monitoring vegetation systems in the Great Plains with ERTS. In Proceedings of the Third ERTS Symposium, NASA SP-351, Washington, DC, USA, 10–14 December 1973; p. 1008. [Google Scholar]
- Yariv, S. Comments on the mechanism of soil detachment by rainfall. Geoderma 1976, 15, 393–399. [Google Scholar] [CrossRef]
- Poesen, J. Rainwash experiments on the erodibility of loose sediments. Earth Surf. Process. Landf. 1981, 6, 285–307. [Google Scholar] [CrossRef]
- Savat, J. Common an uncommon selectivity in the process of fluid transportation: Field observations and laboratory experiments on bare surfaces. CATENA Suppl. 1982, 1, 139–160. [Google Scholar]
- Everaert, W. Empirical relations for the sediment transport capacity of interrill flow. Earth Surf. Process. Landf. 1991, 16, 513–532. [Google Scholar] [CrossRef]
- Luce, C.H. Forests and wetlands. In Environmental Hydrology; Ward, A.D., Elliot, W.J., Eds.; Lewis Publishers: Boca Raton, FL, USA, 1995; pp. 253–283. [Google Scholar]
- Voroney, R.P.; Van Veen, J.A.; Paul, E.A. Organic C Dynamics in Grassland Soils. 2. Model Validation and Simulation of the Long-Term Effects of Cultivation and Rainfall Erosion. Can. J. Soil Sci. 1981, 61, 211–224. [Google Scholar] [CrossRef] [Green Version]
- Ekwue, E.; Ohu, J. A model equation to describe soil detachment by rainfall. Soil Tillage Res. 1990, 16, 299–306. [Google Scholar] [CrossRef]
- McCool, D.K.; Brown, L.C.; Foster, G.R.; Mutchler, C.K.; Meyer, L.D. Revised Slope Steepness Factor for the Universal Soil Loss Equation. Trans. ASAE 1987, 30, 1387–1396. [Google Scholar] [CrossRef]
- McCool, D.K.; Foster, G.R.; Weesies, G.A. Slope length and steepness factor. In Predicting Soil Erosion by Water-A Guide to Conservation Planning with the Revised Universal Soil Loss Equation(RUSLE); Renard, K.G., Foster, G.R., Weesies, G.A., McCool, D.K., Yoder, D.C., Eds.; Coordinators Chapter 4, USDA-ARS Special Publication; USDA: Washington, DC, USA, 1993. [Google Scholar]
- McIssac, G.F.; Mitchell, J.F.; Hirschi, M.C. Slope steepness effects on soil loss form disturbed lands. Trans. Am. Soc. Agric. Eng. 1987, 30, 1005–1013. [Google Scholar]
- McCool, D.K.; Foster, G.R.; Mutchler, C.K.; Meyer, L.D. Revised Slope Length Factor for the Universal Soil Loss Equation. Trans. ASAE 1989, 32, 1571–1576. [Google Scholar] [CrossRef]
- Foster, G.R.; Meyer, L.D.; Onstad, C.A. A Runoff Erosivity Factor and Variable Slope Length Exponents for Soil Loss Estimates. Trans. ASAE 1977, 20, 0683–0687. [Google Scholar] [CrossRef]
- Moore, I.D.; Burch, G.J. Physical Basis of the Length-slope Factor in the Universal Soil Loss Equation. Soil Sci. Soc. Am. J. 1986, 50, 1294–1298. [Google Scholar] [CrossRef]
- Quinn, N.W.; Morgan, R.P.C.; Smith, A.J. Simulation of soil erosion induced by human trampling. J. Environ. Manag. 1980, 10, 155–165. [Google Scholar]
- Poesen, J. The influence of slope angle on infiltration rate and Hortonian overland flow volume. Z. Für Geomeorphologie Supplementband. 1984, 49, 117–131. [Google Scholar]
- Gilley, J.E.; Woolhiser, D.A.; McWhorter, D.B. Interrill Soil Erosion, Part II: Testing and Use of Model Equations. Trans. ASAE 1985, 28, 154–159. [Google Scholar] [CrossRef]
- Odemerho, F.O. Variation in Erosion-Slope Relationship on Cut-Slopes along a Tropical Highway. Singap. J. Trop. Geogr. 1986, 7, 98–107. [Google Scholar] [CrossRef]
- Desmet, P.J.J.; Govers, G. A GIS procedure for automatically calculating the USLE LS factor on topographically complex landscape units. J. Soil Water Conserv. 1996, 51, 427–433. [Google Scholar]
- Van Remortel, R.D.; Hamilton, M.E.; Hickey, R.J. Estimating the LS Factor for RUSLE through Iterative Slope Length Processing of Digital Elevation Data within Arclnfo Grid. Cartography 2001, 30, 27–35. [Google Scholar] [CrossRef]
- Gupta, H.S. Terrain Evaluation for Eco-Restoration using Remote Sensing and GIS. 2001, pp. 424–434. Available online: http://agile.lsegi.unl.pt/conference/Brno2001/RemoteSensing.pdf (accessed on 13 April 2022).
- Musgrave, G.W. The quantitative evaluation of factors in water erosion-a first approximation. J. Soil Water Conserv. 1947, 2, 133–138. [Google Scholar]
- Diaz-Fierros, V.F.; Rueda, E.B.; Moreira, R.P. Evaluation of the U.S.L.E. for the prediction of erosion in burnt forest areas in Galicia (N.W. Spain). CATENA 1987, 14, 189–199. [Google Scholar] [CrossRef]
- Shakesby, R.A. Post-wildfire soil erosion in the Mediterranean: Review and future research directions. Earth-Sci. Rev. 2006, 105, 71–100. [Google Scholar] [CrossRef]
- Ferreira, A.; Coelho, C.; Shakesby, R.; Walsh, R. Sediment and solute yield in forest ecosystems affected by fire and rip-ploughing techniques, central portugal: A plot and catchment analysis approach. Phys. Chem. Earth 1997, 22, 309–314. [Google Scholar] [CrossRef]
- Prosser, I.P.; Williams, L. The effect of wildfire on runoff and erosion in native Eucalyptus forest. Hydrol. Process. 1998, 12, 251–265. [Google Scholar] [CrossRef]
- Kirkby, M.J.; Chorley, R.J. Throughflow, Overland Flow and Erosion. Int. Assoc. Sci. Hydrol. Bull. 1967, 12, 5–21. [Google Scholar] [CrossRef]
- Dunne, T.; Black, R.D. An Experimental Investigation of Runoff Production in Permeable Soils. Water Resour. Res. 1970, 6, 478–490. [Google Scholar] [CrossRef]
- Hack, J.T.; Goodlett, J.C. Geomorphology and Forest Ecology of a Mountain Region in the Central Appalachians; US Geological Survey Professor Paper; United States Government Printing Office: Washington, DC, USA, 1960. [Google Scholar] [CrossRef]
- Kirkby, M.J. Thresholds and instability in stream head hollows: A model of magnitude and frequency for wash. In Process Models and Theoretical Geomorphology; Kirkby, M.J., Ed.; John Wiley & Sons: Chichester, UK, 1994; pp. 295–314. [Google Scholar]
- Nearing, M.A.; Wei, H.; Stone, J.J.; Pierson, F.B.; Spaeth, K.E.; Weltz, M.A.; Flanagan, D.; Hernandez, M. A Rangeland Hydrology and Erosion Model. Trans. ASABE 2011, 54, 901–908. [Google Scholar] [CrossRef]
- Dominici, R.; Larosa, S.; Viscomi, A.; Mao, L.; De Rosa, R.; Cianflone, G. Yield erosion sediment (YES): A PyQGIS plug-in for the sediments production calculation based on the erosion potential method. Geosciences 2020, 10, 324. [Google Scholar] [CrossRef]
- Stefanidis, S.; Chatzichristaki, C.; Stefanidis, P. An ArcGIS toolbox for estimation and mapping soil erosion. Environ. Prot. Ecol. 2021, 22, 689–696. [Google Scholar]
- Korea Forest Service. Revised Handbook for Erosion Control Engineering; Korea Forest Service: Daejeon, Korea, 2014. [Google Scholar]
- Fifield, J.S. Field Manual for Effective Sediment and Erosion Control Methods; ForesterPress: Santa Barbara, CA, USA, 2001. [Google Scholar]
- Robichaud, P.R.; Brown, R.E. Silt Fences: An Economical Technique for Measuring Hillslope Soil Erosion; United States Department of Agriculture: Washington, DC, USA, 2002; Volume 94. [Google Scholar] [CrossRef]
- Robichaud, P.; MacDonald, L.; Freeouf, J.; Neary, D.; Martin, D.; Ashmun, D. Postfire Rehabilitation of the Hayman Fire. In USDA Forest Service General Technical Reports RMRS-GTR-114; U.S. Department of Agriculture, Forest Service: Washington, DC, USA, 2003. [Google Scholar]
- Kim, C.G.; Shin, K.; Joo, K.Y.; Lee, K.S.; Shin, S.S.; Choung, Y. Effects of soil conservation measures in a partially vegetated area after forest fires. Sci. Total Environ. 2008, 399, 158–164. [Google Scholar] [CrossRef]
- Gray, D.H.; Leiser, A.T. Biotechnical Slope Protection and Erosion Control; Van Nostrand Reinhold Company Inc.: New York, NY, USA, 1989; p. 271. [Google Scholar]
- Korea Forest Service (KFS); Korea Forest Research Institute. Manual for Restoration of Areas Damaged by Wildfires; KFS: Seoul, Korea, 2016; 11p. [Google Scholar]
- Vega, J.A.; Díaz-Fierros, F. Wildfire effects on soil erosion. Ecol. Mediterr. 1987, 13, 119–125. [Google Scholar] [CrossRef]
- Scott, D.F.; Van Wyk, D.B. The effects of wildfire on soil wettability and hydrological behaviour of an afforested catchment. J. Hydrol. 1990, 121, 239–256. [Google Scholar] [CrossRef]
- Cerdà, A.; Flanagan, D.C.; Le Bissonnais, Y.; Boardman, J. Soil erosion and agriculture. Soil Tillage Res. 2009, 106, 107–108. [Google Scholar] [CrossRef]
- Seutloali, K.E.; Beckedahl, H.R. Understanding the factors influencing rill erosion on roadcuts in the south eastern region of South Africa. Solid Earth 2015, 6, 633–641. [Google Scholar] [CrossRef] [Green Version]
- Arkansas Forestry Commission. Arkansas Forestry Best Management Practices for Water Quality Protection. Available online: http://forestry.arkansas.go (accessed on 13 October 2014).
- U.S. Department of Agriculture (USDA) Forest Service. National Best Management Practices for Water Quality Management on National Forest System Lands. In FS990a. National Core BMP Technical Guide; U.S. Department of Agriculture, Forest Service: Washington, DC, USA, 2012; Volume 1, p. 164. [Google Scholar]
Figure 1.
Location of the study area.

Figure 2.
Hyetograph of rainfall from Typhoon Mitag observed in Gangneung and Okgye.

Figure 3.
Cases of damage caused by floods and sediment yields in wildfire areas (8 October 2019). (a) Overflow of agricultural land; (b) Collapse of roads and levees; (c) Gully and valley erosion in disturbed areas; (d) Landslides on road constructions.
Figure 3.
Cases of damage caused by floods and sediment yields in wildfire areas (8 October 2019). (a) Overflow of agricultural land; (b) Collapse of roads and levees; (c) Gully and valley erosion in disturbed areas; (d) Landslides on road constructions.

Figure 4.
Comparison of Jusucheon river (non-fire area) and Namyangcheon river (fire area) on 4 January 2020. (a) View from point A in Figure 1; (b) View from point B in Figure 1.

Figure 5.
Map of the study watershed selected to evaluate sediment yield after wildfire and management.
Figure 5.
Map of the study watershed selected to evaluate sediment yield after wildfire and management.

Figure 6.
SEMMA program.

Figure 7.
Changes in distribution of NDVIs using Landsat-8 and Sentinel-2 satellite images before and after wildfire.
Figure 7.
Changes in distribution of NDVIs using Landsat-8 and Sentinel-2 satellite images before and after wildfire.

Figure 8.
Soil maps for soil texture, soil depth, and gravel content. (a) Soil texture; (b) Soil depth; (c) Gravel content.
Figure 8.
Soil maps for soil texture, soil depth, and gravel content. (a) Soil texture; (b) Soil depth; (c) Gravel content.


Figure 9.
Distribution of slope angle.

Figure 10.
Simulation process and the spatial distribution for the main factors and soil erosion of SEMMA-Ic using ArcGIS.
Figure 10.
Simulation process and the spatial distribution for the main factors and soil erosion of SEMMA-Ic using ArcGIS.

Figure 11.
The risk map of soil erosion estimated by SEMMA in wildfire areas. (a) 30-year frequency of rainfall; (b) 50-year frequency of rainfall.
Figure 11.
The risk map of soil erosion estimated by SEMMA in wildfire areas. (a) 30-year frequency of rainfall; (b) 50-year frequency of rainfall.

Figure 12.
Distribution of soil erosion rates (ton/ha) estimated by SEMMA-Ic in the study watershed after wildfire. (a) 30-year frequency of rainfall; (b) 50-year frequency of rainfall.
Figure 12.
Distribution of soil erosion rates (ton/ha) estimated by SEMMA-Ic in the study watershed after wildfire. (a) 30-year frequency of rainfall; (b) 50-year frequency of rainfall.

Figure 13.
NDVI changes after wildfire and logging. (a) NDVI after wildfire (April 2019); (b) NDVI after logging (January 2020).
Figure 13.
NDVI changes after wildfire and logging. (a) NDVI after wildfire (April 2019); (b) NDVI after logging (January 2020).

Figure 14.
Distribution of soil erosion estimated by SEMMA-Ic in the study watershed after logging. (a) 30-year frequency of rainfall; (b) 50-year frequency of rainfall.
Figure 14.
Distribution of soil erosion estimated by SEMMA-Ic in the study watershed after logging. (a) 30-year frequency of rainfall; (b) 50-year frequency of rainfall.

Figure 15.
Erosion control methods implemented on the wildfire hillslopes (November 2019).

Figure 16.
Erosion control methods implemented on gully and valley (November 2019).

Figure 17.
Logging situation in wildfire areas (January 2020).

Figure 18.
Drone images after logging on wildfire areas (January 2020).


Table 1.
Comparison of probabilistic rainfalls and rainfalls measured by the Korea Meteorological Administration in Gangneung and Okgye.
Table 1.
Comparison of probabilistic rainfalls and rainfalls measured by the Korea Meteorological Administration in Gangneung and Okgye.
| Duration | 30-year Frequency in Gangneung | 50-year Frequency in Gangneung | Rainfall by KMA in Gangneung | Rainfall by KMA in Okgye |
|---|---|---|---|---|
| 24 h Max | 382.3 | 419.3 | 369.0 | 375.0 |
| 1 h Max | 65.3 | 71.0 | 77.5 | 64.5 |
| 30 min Max | 42.2 | 45.6 | 45.5 | 36.0 |
Table 2.
Model equations of SEMMA-Ic revised to apply to wide mountain areas.
| Rainfall Depth (mm) | Vegetation Index | Multiple Regression Model |
|---|---|---|
| R > 380 | Ic ≤ 0.7 | |
| Ic > 0.7 |
Table 3.
Calculation of the rainfall erosivity factor according to probability frequency of rainfall.
Table 3.
Calculation of the rainfall erosivity factor according to probability frequency of rainfall.
| Probability Frequency (yr) | R (mm) | I (mm/h) | T (h) | I30 (mm/h) | Iave (mm/h) | RE (J/m2) | RI (J/m/h) |
|---|---|---|---|---|---|---|---|
| 30 | 382.3 | 65.3 | 24 | 81.6 | 15.9 | 7937 | 647.9 |
| 50 | 419.3 | 71.0 | 24 | 88.7 | 17.5 | 8903 | 789.6 |
Table 4.
Comparison of sediment yields from the study watershed after wildfire and after logging according to probability frequency of rainfall.
Table 4.
Comparison of sediment yields from the study watershed after wildfire and after logging according to probability frequency of rainfall.
| Probability Frequency (year) of Rainfall | Sediment Yield (t/ha) after Wildfire | Sediment Yield (t/ha) after Logging | Rate of Increase for Sediment Yield | |
|---|---|---|---|---|
| 30 | Max. | 202.5 | 207.5 | 1.02 |
| Ave. | 40.3 | 142.4 | 3.53 | |
| 50 | Max. | 261.3 | 268.7 | 1.03 |
| Ave. | 52.4 | 183.7 | 3.51 |
Publisher’s Note: MDPI stays neutral with regard to jurisdictional claims in published maps and institutional affiliations. |
© 2022 by the authors. Licensee MDPI, Basel, Switzerland. This article is an open access article distributed under the terms and conditions of the Creative Commons Attribution (CC BY) license (https://creativecommons.org/licenses/by/4.0/).
Share and Cite
MDPI and ACS Style
Shin, S.S.; Park, S.D.; Kim, G. Risk Assessment of Soil Erosion Using a GIS-Based SEMMA in Post-Fire and Managed Watershed. Sustainability 2022, 14, 7339. https://0-doi-org.brum.beds.ac.uk/10.3390/su14127339
AMA Style
Shin SS, Park SD, Kim G. Risk Assessment of Soil Erosion Using a GIS-Based SEMMA in Post-Fire and Managed Watershed. Sustainability. 2022; 14(12):7339. https://0-doi-org.brum.beds.ac.uk/10.3390/su14127339
Chicago/Turabian StyleShin, Seung Sook, Sang Deog Park, and Gihong Kim. 2022. "Risk Assessment of Soil Erosion Using a GIS-Based SEMMA in Post-Fire and Managed Watershed" Sustainability 14, no. 12: 7339. https://0-doi-org.brum.beds.ac.uk/10.3390/su14127339
Note that from the first issue of 2016, this journal uses article numbers instead of page numbers. See further details here.