Article

Deriving Land Management Practices for Reduced Nutrient Movement from an Agricultural Watershed Using the AGNPS Model

by
Venkatachalam Kasthuri Thilagam
,
Sandrasekaran Manivannan
* and
Om Pal Singh Khola
ICAR-Indian Institute of Soil and Water Conservation, Research Centre, Ooty 643004, Tamil Nadu, India
*
Author to whom correspondence should be addressed.
Sustainability 2023, 15(5), 4001; https://0-doi-org.brum.beds.ac.uk/10.3390/su15054001
Submission received: 20 October 2022 / Revised: 13 February 2023 / Accepted: 16 February 2023 / Published: 22 February 2023
(This article belongs to the Special Issue Soil Erosion and Water and Soil Conservation)

Abstract

:
The effect of nutrient management practices and the land-use system on nutrient enrichment in water resources of a hilly watershed was assessed with an event-based agricultural non-point source (AGNPS) model. The model intended to assess the runoff, sediment and nutrient loads in a typical hilly agricultural watershed. The model was calibrated, evaluated and applied in integration with GIS to predict the soil and nutrient loss. Two nutrient management scenarios were simulated with 25 and 50% reductions in the nutrient application from the present nutrient application. The third scenario was simulated by converting 25% of the agricultural land-use to tea plantations. A total of 15 simulations were run for the different rainfall intensities of the year 2017. The existing land-use scenario simulated the maximum soil loss and Nitrogen and phosphorus load of 8.23 t ha−1, 22.8 and 5.0 kg ha−1. The 50% nutrient reduction scenario reduced 48 and 36% of the Nitrogen and phosphorus load compared to the existing farmers’ practice. The same nutrient dose was compared with the STCR equation, developed for major crops such as potato and carrot in Nilgiris soil, and confirmed the sufficient nutrient supply to produce a sustainable yield. The conversion of 25% of the agricultural land-use to tea plantations reduced the soil loss by 10% from the current land-use. The Nitrogen and phosphorus load was reduced to 56 and 48%, respectively. Hence, the farmers may convert 25% of the land area to tea plantations and reduce 50% of the present fertilizer dose for the major vegetable crops with INM to reduce the nutrient enrichment in the surface water bodies. This study demonstrated the applicability of the AGNPS model in similar watersheds for deriving possible management strategies to reduce soil loss and nutrient movement. Further, the hydrological models can provide valuable insights for promptly prioritizing and making policy decisions in ungauged/data-scarce watersheds.

1. Introduction

Surface water resources are one of the most productive natural resources on Earth. Despite the enormous water volume on the planet, only 2.47% constitutes fresh water available for domestic, irrigation and other uses. In the present situation, water pollution is becoming one of the most challenging environmental problems worldwide. The nutrient level of surface water bodies has increased dramatically over the last 50 years. Chemical inputs, particularly fertilizers, are the prime factor contributing to global food security security [1,2]. However, nutrient enrichment due to indiscriminate agricultural inputs and the disposal of untreated effluents from industries and urban wastes into water resources are the leading causes of water pollution [3]. In agricultural land-use, tillage and other intercultural operations disturb the soil particles and make them vulnerable to erosion. In high rainfall regions, this problem is intensified when excessive rainfall causes runoff, and the soil from agricultural lands washes into the water bodies. Similarly, in hilly areas, the transport of soil, nutrients and other agricultural chemicals by soil erosion and runoff is eased by the natural topography, and this influx directly influences the water quality [4]. Considerable amounts of nitrate, phosphate, potassium and other nutrients contribute to this from cultivated soils through runoff and erosion, which is recognized as a threat to agricultural productivity and surface water quality [5]. Watersheds located in hilly areas are more susceptible to the Non-Point Source (NPS) pollution of agricultural inputs. The soil erosion rate is accelerated by converting forest to agricultural land in moderate and steep sloppy regions [6]. However, the deterioration of natural resources due to land-use changes dates to the pre-historic era, when agriculture first started during human civilization [7]. Land-use changes, including forest, agriculture, habitat [8] and intensive agriculture in hill watersheds, has increased fertilizers usage [9]. Human activities in agriculture without any soil and water conservation measures further worsen the situation. As agriculture not only supports food and other basic needs, but also the economic development and social prosperity of a nation, this issue must be handled scientifically [10]. With the enhancement of people’s environmental concerns, increasing attention has been paid to conserving natural resources and environmental issues, such as land degradation and soil and water pollution caused by unscientific soil management [11]. Climate change also alters the meteorological parameters, affecting an agricultural watershed’s nutrient dynamics. Hence, dealing with this issue has become the policymakers’ prime target [12]. However, the precise assessment of the impact of sediment and nutrient losses from agricultural fields on surface water quality is always challenging for scientists [13].
Quantifying nutrient losses from the agricultural fields and their causes is essential to accurately estimating nutrient enrichment in water resources and deriving suitable management strategies [14]. Field level monitoring will accurately predict nutrient movement. However, it requires more manpower, time and money. Due to the scarcity of data, the methods will become ineffective on a larger scale [15]. The complexity and expensive nature of laboratory and field observations has necessitated the application of models in predicting the hydrology and nutrient movement at the watershed level [16]. Watershed models capture the dynamic hydrological processes and clearly understand the association between land, water and management practices in a watershed [17]. The most recently developed models are freely available, efficient in time, explicit, comprehensive and user-friendly in simulating nutrients and sediment. Non-point source pollution models are widely used to assess pollutant loads, simulate runoff and soil loss and learn better management practices to address non-point source pollution [18]. Many hydrological models have proved their efficiency at the watershed scale for the prediction of non-point source pollution. The models can also predict the impact of land-use changes on watershed hydrology and nutrient movements [19].
The Agricultural Non-Point Sources Pollution (AGNPS) model is a mathematical model based on the functional relationships between the influential factors in the watershed. This model predicts the surface runoff, sediment and nutrient transport in agricultural watersheds [20]. Many hydrologists and environmentalists have employed the AGNPS model to quantify the runoff, erosion and nutrient movement in the watershed [21,22]. The impact of land-use changes [23,24] and input usages, such as fertilizers and pesticides, can also be assessed in agriculture dominated watersheds. The AGNPS is a suitable and convenient model to design and recommend the best land-use and crop management practices to reduce the sediment and nutrient loading of agricultural watersheds [25]. The Nilgiri district, a high rainfall and hilly region, serves as a significant water source for agricultural and domestic uses in the Nilgiris, Coimbatore, Erode and Tirupur districts of Tamil Nadu. In recent days, the water has become more than an economic good in Nilgiris as the water bodies of Nilgiris have become polluted at an alarming rate. The increasing population pressure was the main reason for extending agriculture into the steeper hill slopes of dense forests during 1950s. This intensification of agriculture has resulted in a significant increase in organic and inorganic fertilizer usage since the early 1960s, leading to the enrichment of nutrients in surface water resources and water quality degradation. The fragile ecosystem of the Nilgiris is highly prone to soil erosion, and a soil loss of more than 40 t ha–1yr–1 [26] has been reported in some places, which is much higher than the average soil loss (16.4 t ha–1yr–1) in India [27]. This high soil erosion rate threatens the agricultural production and surface water quality of the hill regions. Sloppy arable lands with frequent heavy rainfall aggravate the Nitrogen and phosphorus movement through runoff and soil, ultimately affecting the water quality of the region’s water resources [28]. The undulating topography and high rainfall favor natural erosion and runoff in this region, and farmers compensate for the nutrients removed from the soil through the excessive use of fertilizers. This unbalanced fertilization is the prime source of non-point source pollution in the surface water of hilly watersheds [29,30]. Proper land management practices to control erosion and runoff by farmers will reduce the soil erosion and sedimentation in water resources by 20 to 90% in agricultural lands [31]. Erosion control measures and agricultural best management practices can reduce nutrient loading and water pollution. Despite the wealth of information on degraded water quality available elsewhere, studies on nutrient movement from the agricultural watershed are scarce and limited in the Nilgiris. In this study, we employed the AGNPS model to predict the runoff, soil loss and nutrient load. Further, for the first time, in order to derive a nutrient management strategy, we employed STCR equations developed for the major crops of the region. The land-use management strategy is also derived considering the possibility of farmers converting the land to plantations. The results are expected to assess the present situation and project the future nutrient movement scenario and their management measures for sustaining the natural resources at the watershed level.

2. Materials and Methods

2.1. Description of the Model

Modelling is essential to assess the runoff, soil and nutrient loss from an ungauged watershed in less time. Models also predict the efficiency of various management practices to reduce losses. Hydrological models, such as CREAMS, ANSWERS, AGNPS, WEPP, AnnAGNPS, BASINS and SWAT, are widely employed by many researchers for simulating runoff, soil loss and nutrient loads [32]. Depending on the need and data availability, these models can be used for larger basins and small watershed scales. The AGricultural Non-Point Source Pollution (AGNPS) model was used to predict the surface runoff, soil loss and nutrient load from the studied watershed [33]. This model has three components: the hydrology component to calculate the runoff volume and peak flow rate; the sediment transport component to estimate the soil loss; the chemical transport component to assess the Nitrogen (N) and phosphorus (P) load from the watershed.
The model uses the soil conservation service (SCS) runoff curve method, a modified version of the universal soil loss equation (RUSLE) and CREAMS model for predicting runoff, sediment yield and nutrient load, respectively. The primary pollutants in runoff, soluble Nitrogen and phosphorus, are affected by rainfall, fertilizer dose and leaching from the soil. The nutrient load from the sediment is calculated using the total sediment yield from each cell in the CREAMS model. The model is distributed, event-based and operates on a cell basis, where the cells are uniform square areas sub-dividing the watershed. The runoff, sediment and nutrient transport are routed through cells to the watershed’s outlet step-wise so that the flow at any point between cells can be predicted [34]. The digital elevation model (DEM), watershed boundary, soil type and land-use are the essential inputs for the AGNPS model to derive all 22 input parameters for each cell. The DEM is used to extract the watershed parameters, such as the watershed boundary, slope parameters, drainage networks, aspects etc., to run the model. Map Window, an open source GIS software, is used to run the model. The watershed was divided into a 1 × 1 km grid and the other input data, including the crops, land management and fertilizer usage data, were collected through a survey from the watershed farmers. The required climatic data were collected from the meteorological observatory of IISWC, RC, Udhagamandalam.

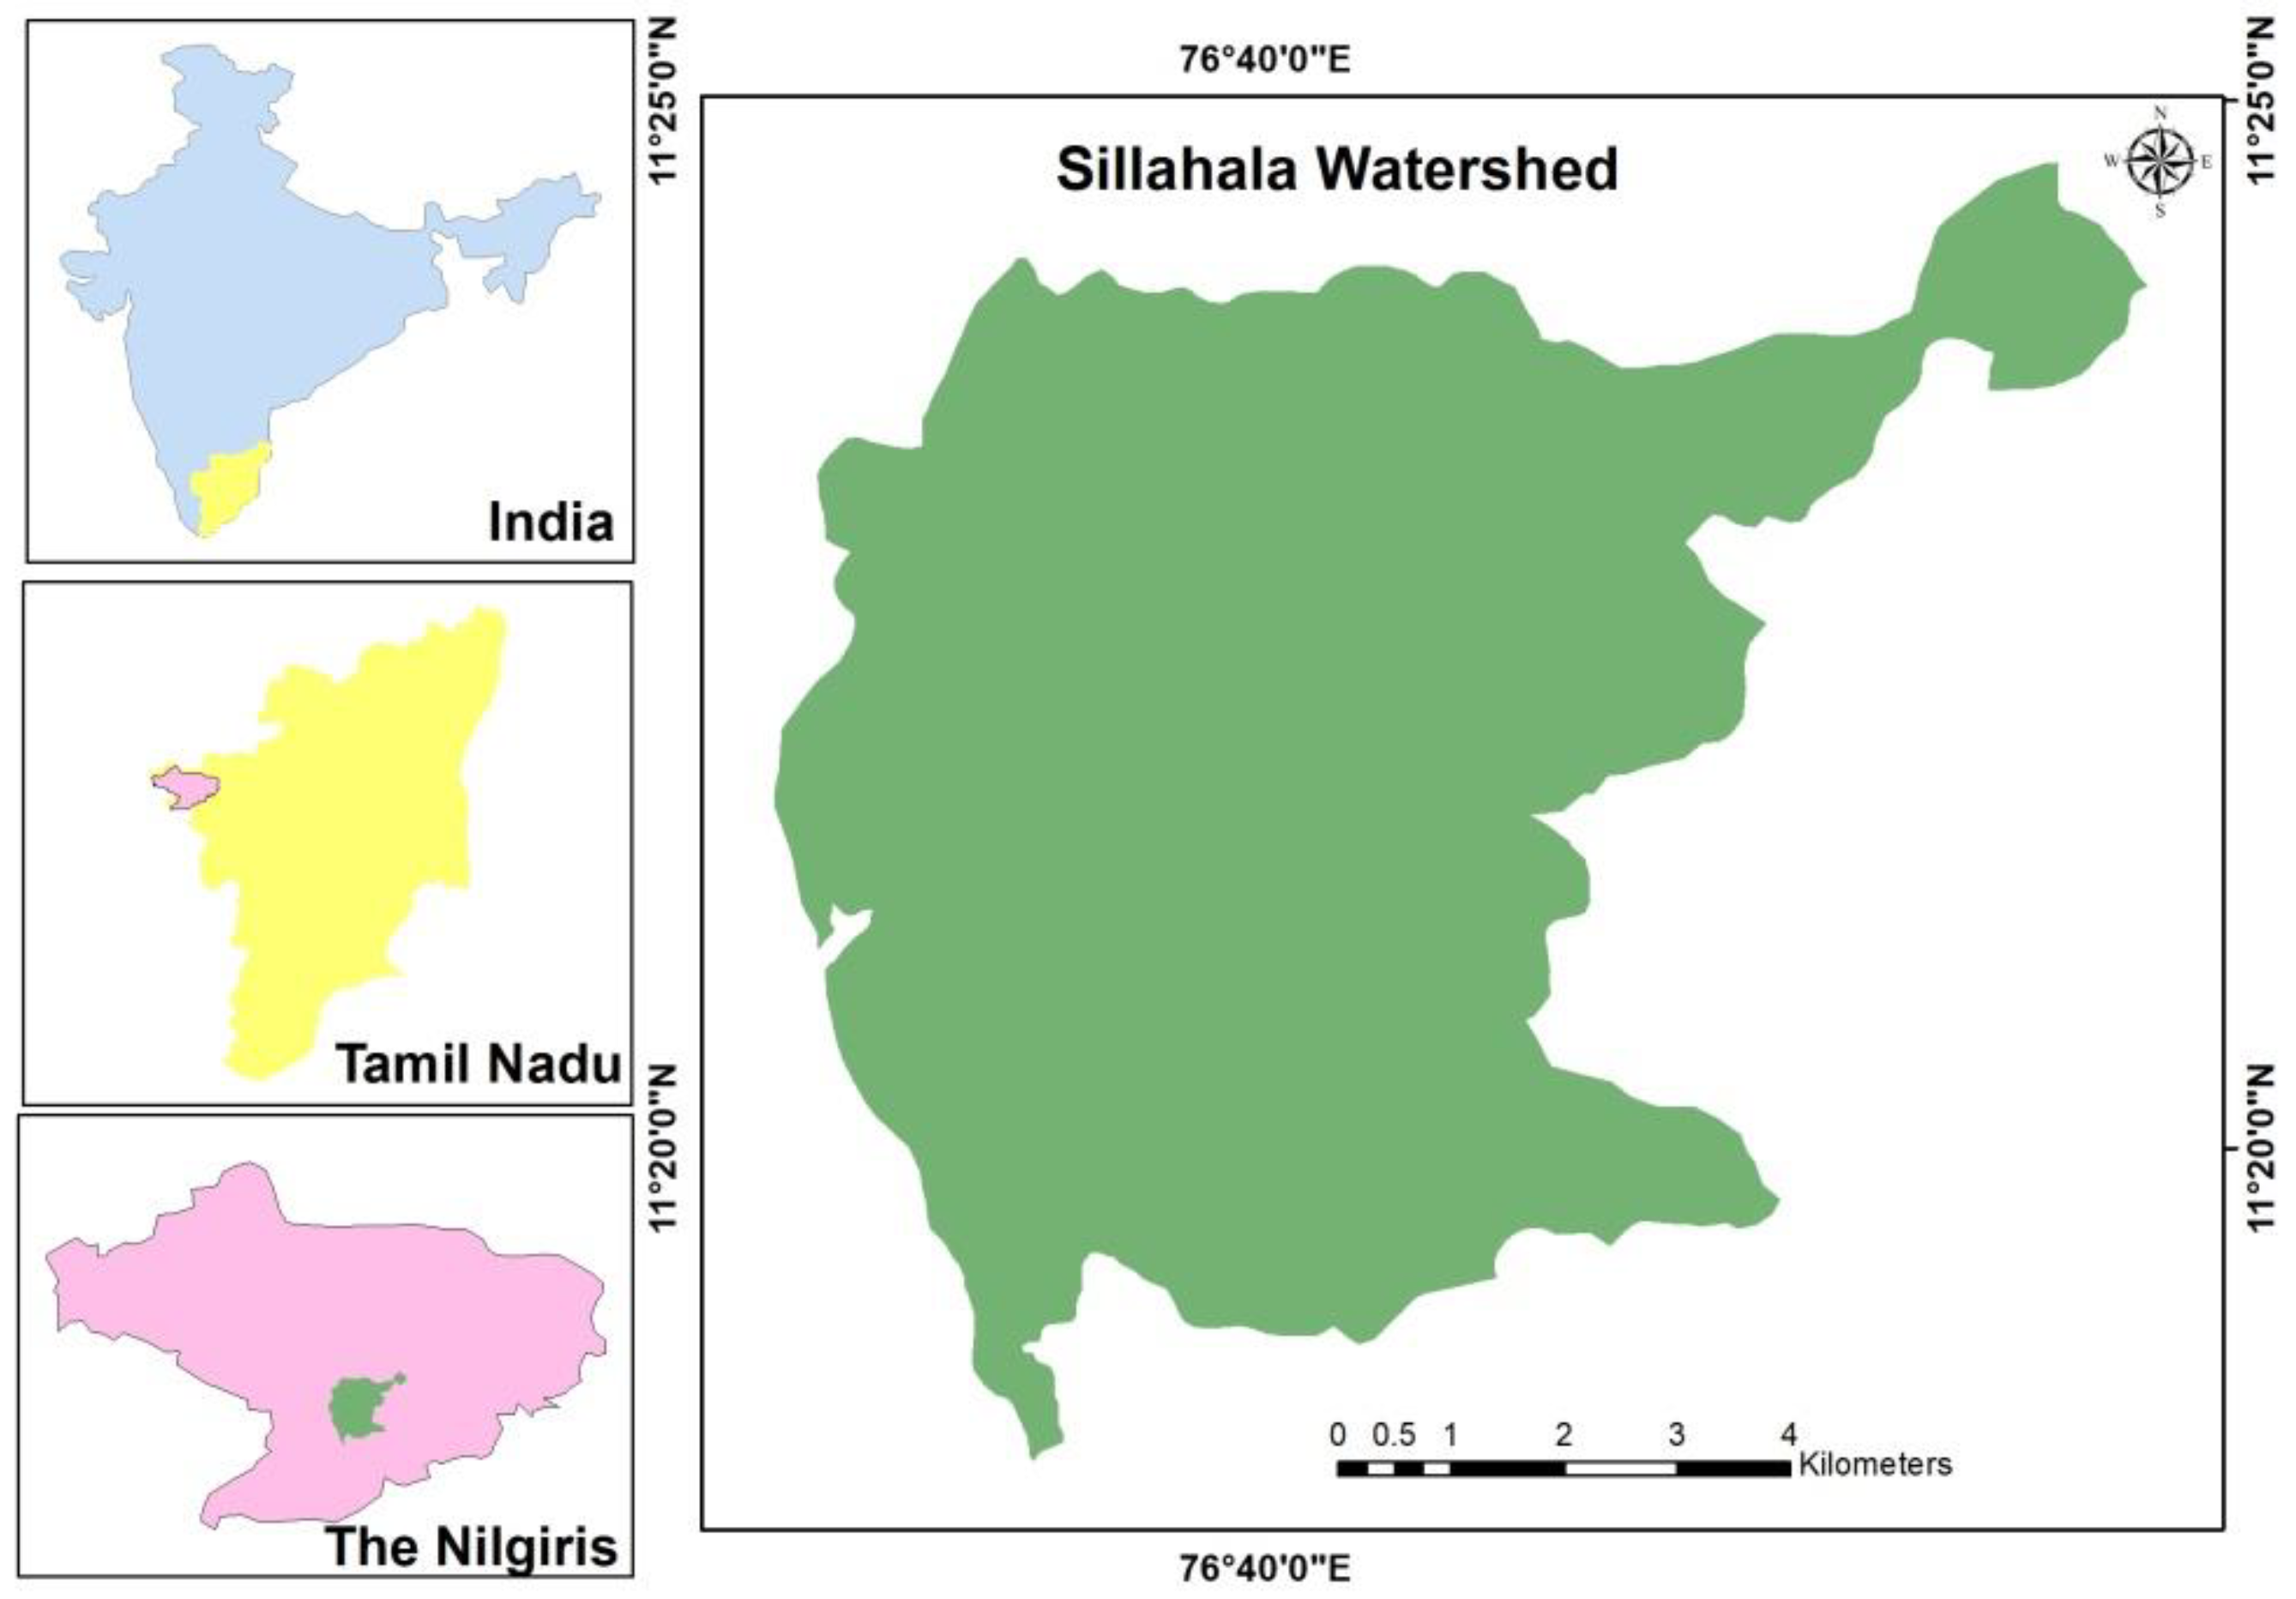
2.2. Watershed Description

The watershed chosen for the present study was the Sillahalla watershed, located in the Nilgiris district of Tamil Nadu (Figure 1), and lies between the latitudes of 11°19′0″ N and 11°25′0″ N and longitudes of 76°38′0″ E and 76°44′0″ E. The total area of the watershed is 6523 ha, with the maximum area under agricultural lands. The watershed elevation varies between 1869 and 2630 m above the mean sea level. The mean annual rainfall of the watershed area varies between 1300–1400 mm. The slope of the watershed ranges between 2 and 16% in the valleys and foothills to about 50% on the hillsides. The soils of the watershed are predominantly sandy clay loam texture followed by sandy clay. The other soil textures, such as clay, clay loam and loamy sand, are also found in very small patches. The watershed was selected based on the land-use and data availability for the model’s calibration. Agriculture in sloppy land is the most common in the hilly watershed with highly fragmented land holdings.

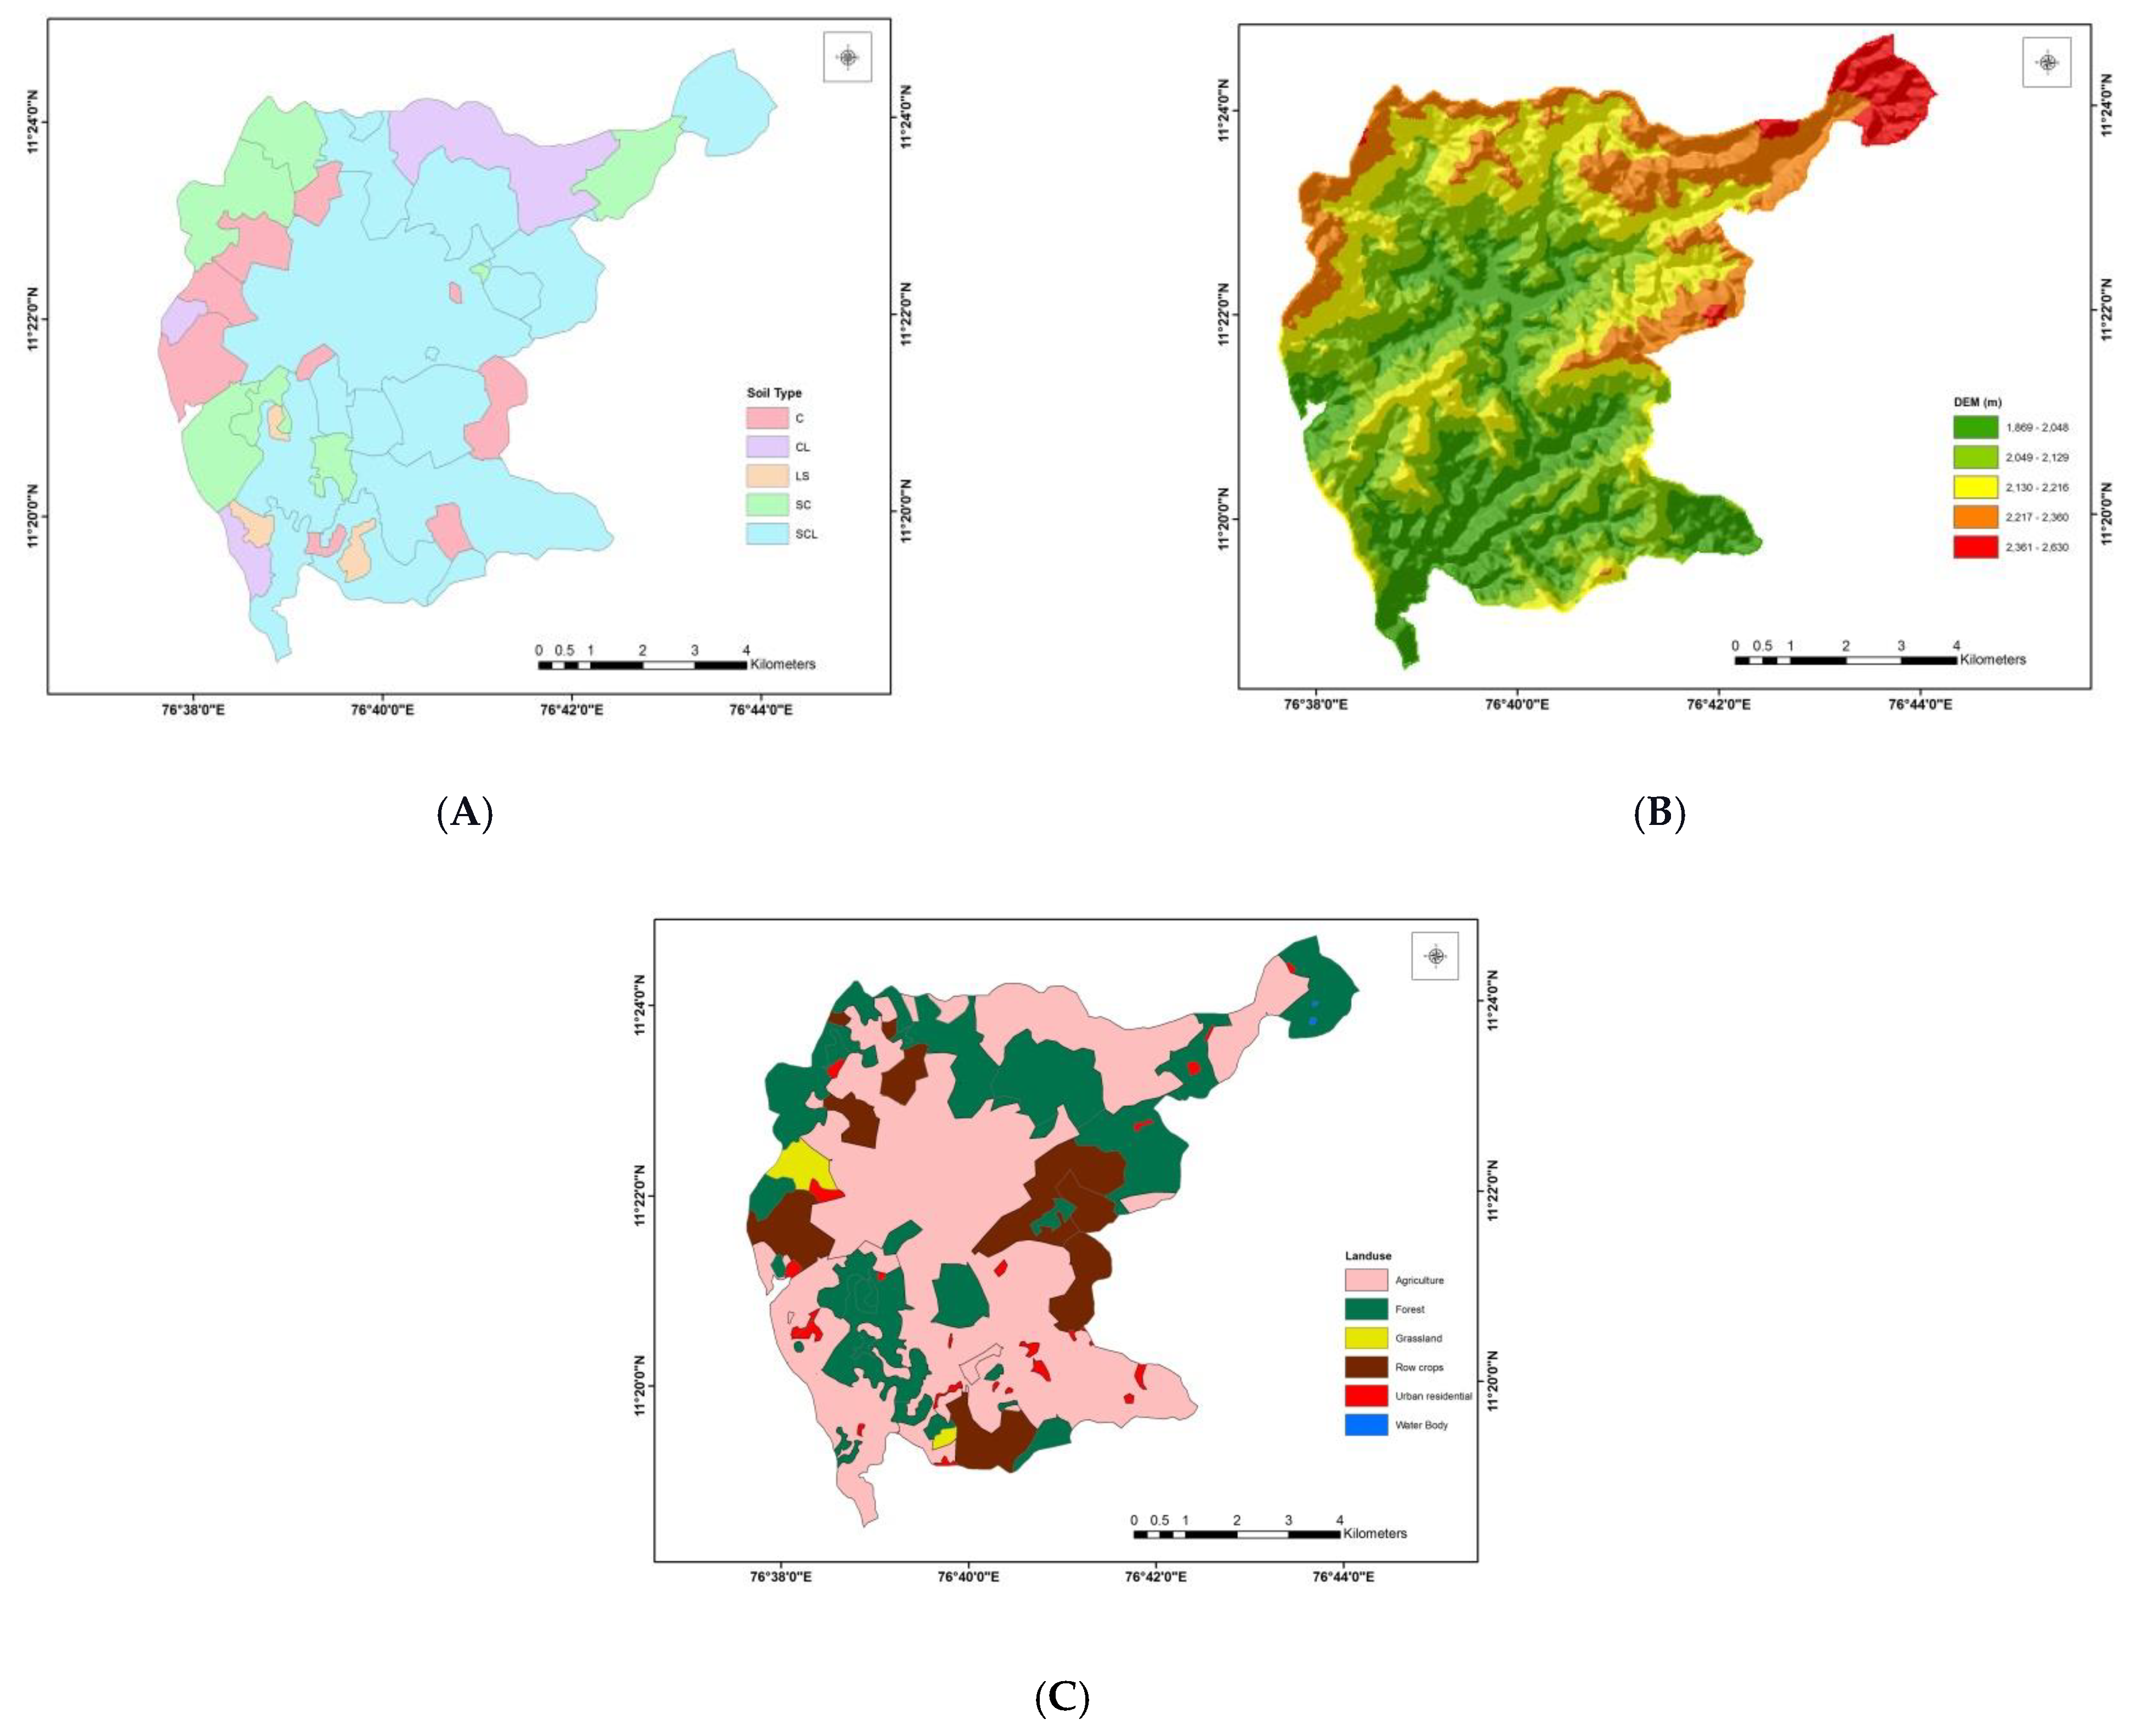
2.3. Input Data Preparation

The freely available SRTM DEM with 30 X 30 m resolution was downloaded from the website earthexplorer.usgs.gov and used for the study. The elevations of the watershed ranged between 1869 and 2630 m above the mean sea level. This DEM is used to delineate the watershed and to find all the slope parameters used in the model with the help of Mapwindow GIS. Soil samples were collected from the watershed and analyzed for their texture, bulk density and other nutrient status, such as organic carbon, Nitrogen, phosphorus and potassium. With the analyzed data, a soil map was prepared for the watershed. The land-use map was prepared from the google earth data, as well as the survey at the ground level. It is predominantly an agricultural watershed with 82.49% of the area under annual vegetable crops and tea plantations. The forest is covered by 13% land area, 2.53% settlement and 1.15% grassland. Potato, carrot, cabbage, cauliflower, beans and other cole vegetable crops are the major annual crops cultivated in the watershed. The input maps prepared are shown in Figure 2. Nutrient management practices were collected for the major vegetable crops from the watershed farmers. Most farmers cultivate in the sloppy lands, which leads to increased soil erosion, and to compensate for the nutrient loss, farmers are applying nearly 30–40% more fertilizer.
We collected the runoff and soil loss data from the gauging station and calibrated the model for the selected representative rainfall events in the past. The nutrient load is not calibrated due to the lack of available data.

2.4. Simulation with Varying Fertilizer Dose and Land Use Change Scenarios

To evaluate the impact of fertilizer application on the nutrient movement from agricultural lands, we tried two simulation scenarios with varying fertilizer doses (25% and 50% reduction in fertilizer dose from the farmers’ practice). The nutrient management scenarios were created based on the data collected from the watershed farmers. We recorded the current fertilizer application rate for the major crops and compared it with the blanket recommendation of the state agricultural university. The soil nutrient status of the watershed was also recorded simultaneously. Based on the data, we could understand that the watershed farmers are applying almost double the fertilizer dose than the crop requirement. Hence, two scenarios were simulated with reduced fertilizer doses. The percentage reduction was decided based on the Soil Test crop Response (STCR) equation developed for the Nilgiris soils. The third scenario was created by converting 25% of the agricultural land into a tea plantation. The aim of increasing the area under plantation and decreasing the land under agriculture is to simulate the effect of a plantation in reducing soil erosion and nutrient movement from the watershed.

3. Results

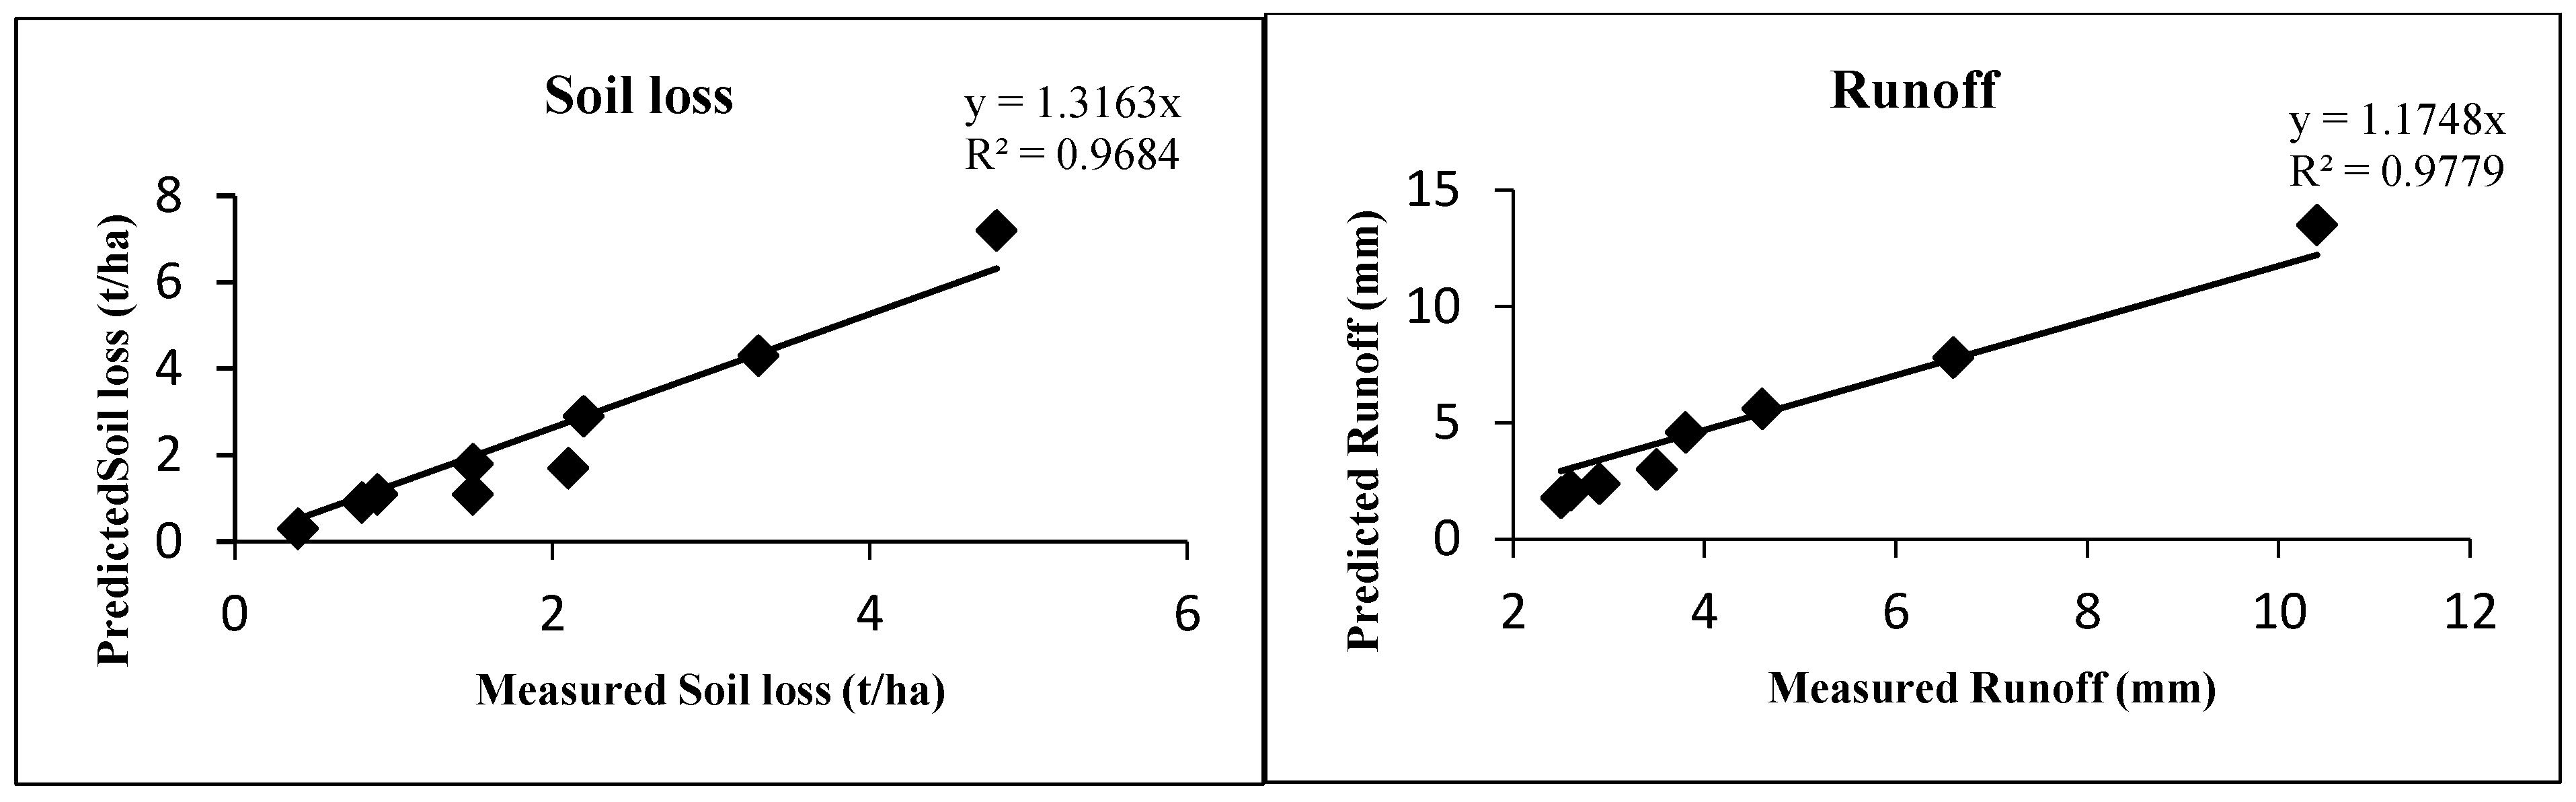
3.1. Calibration and Validation of the Model

We calibrated the model for nine selected rainfall events of the year 2003 for runoff and soil loss. Rainfall events of the year 2004 were used for validating the model. The Nash–Sutcliffe efficiency (NSE) [35,36] and correlation coefficient (R2) were used to predict the accuracy of the model (Table 1). The results showed that the measured and predicted runoff was linearly correlated with the correlation coefficient of 0.94 for runoff and was found to be significant. The model overpredicted the runoff by only 8.5% and this satisfactory result shows the excellent calibration of the model. Many other researchers have also confirmed the accurate prediction of runoff by the AGNPS model [37]. Similarly, the correlation coefficient of soil loss was 0.93, which showed a significant linear relationship between the measured and predicted soil loss values (Figure 3). Comparing the mean measured and predicted values showed that the model overpredicted the soil loss by 21.7%. However, the overprediction of the soil loss was observed for the high rainfall events (Table 2). Rode and Frede [38] reported a similar overprediction of sediment yield due to the effective transport capacity of the runoff. The NSE ranges between negative infinity and 1 and the value of the Nash–Sutcliffe model efficiency >0.7 indicates that the model efficiency is satisfactory for the prediction. The calibration and validation results for the runoff showed the satisfactory performance of the model with an NSE value of 0.73 for calibration and 0.74 for validation. Similarly, the soil loss was also predicted well with an NSE value of 0.79 and 0.72 for calibration and validation, respectively. Hence, we used the model to predict the runoff, soil loss and nutrient loss for the studied watershed.

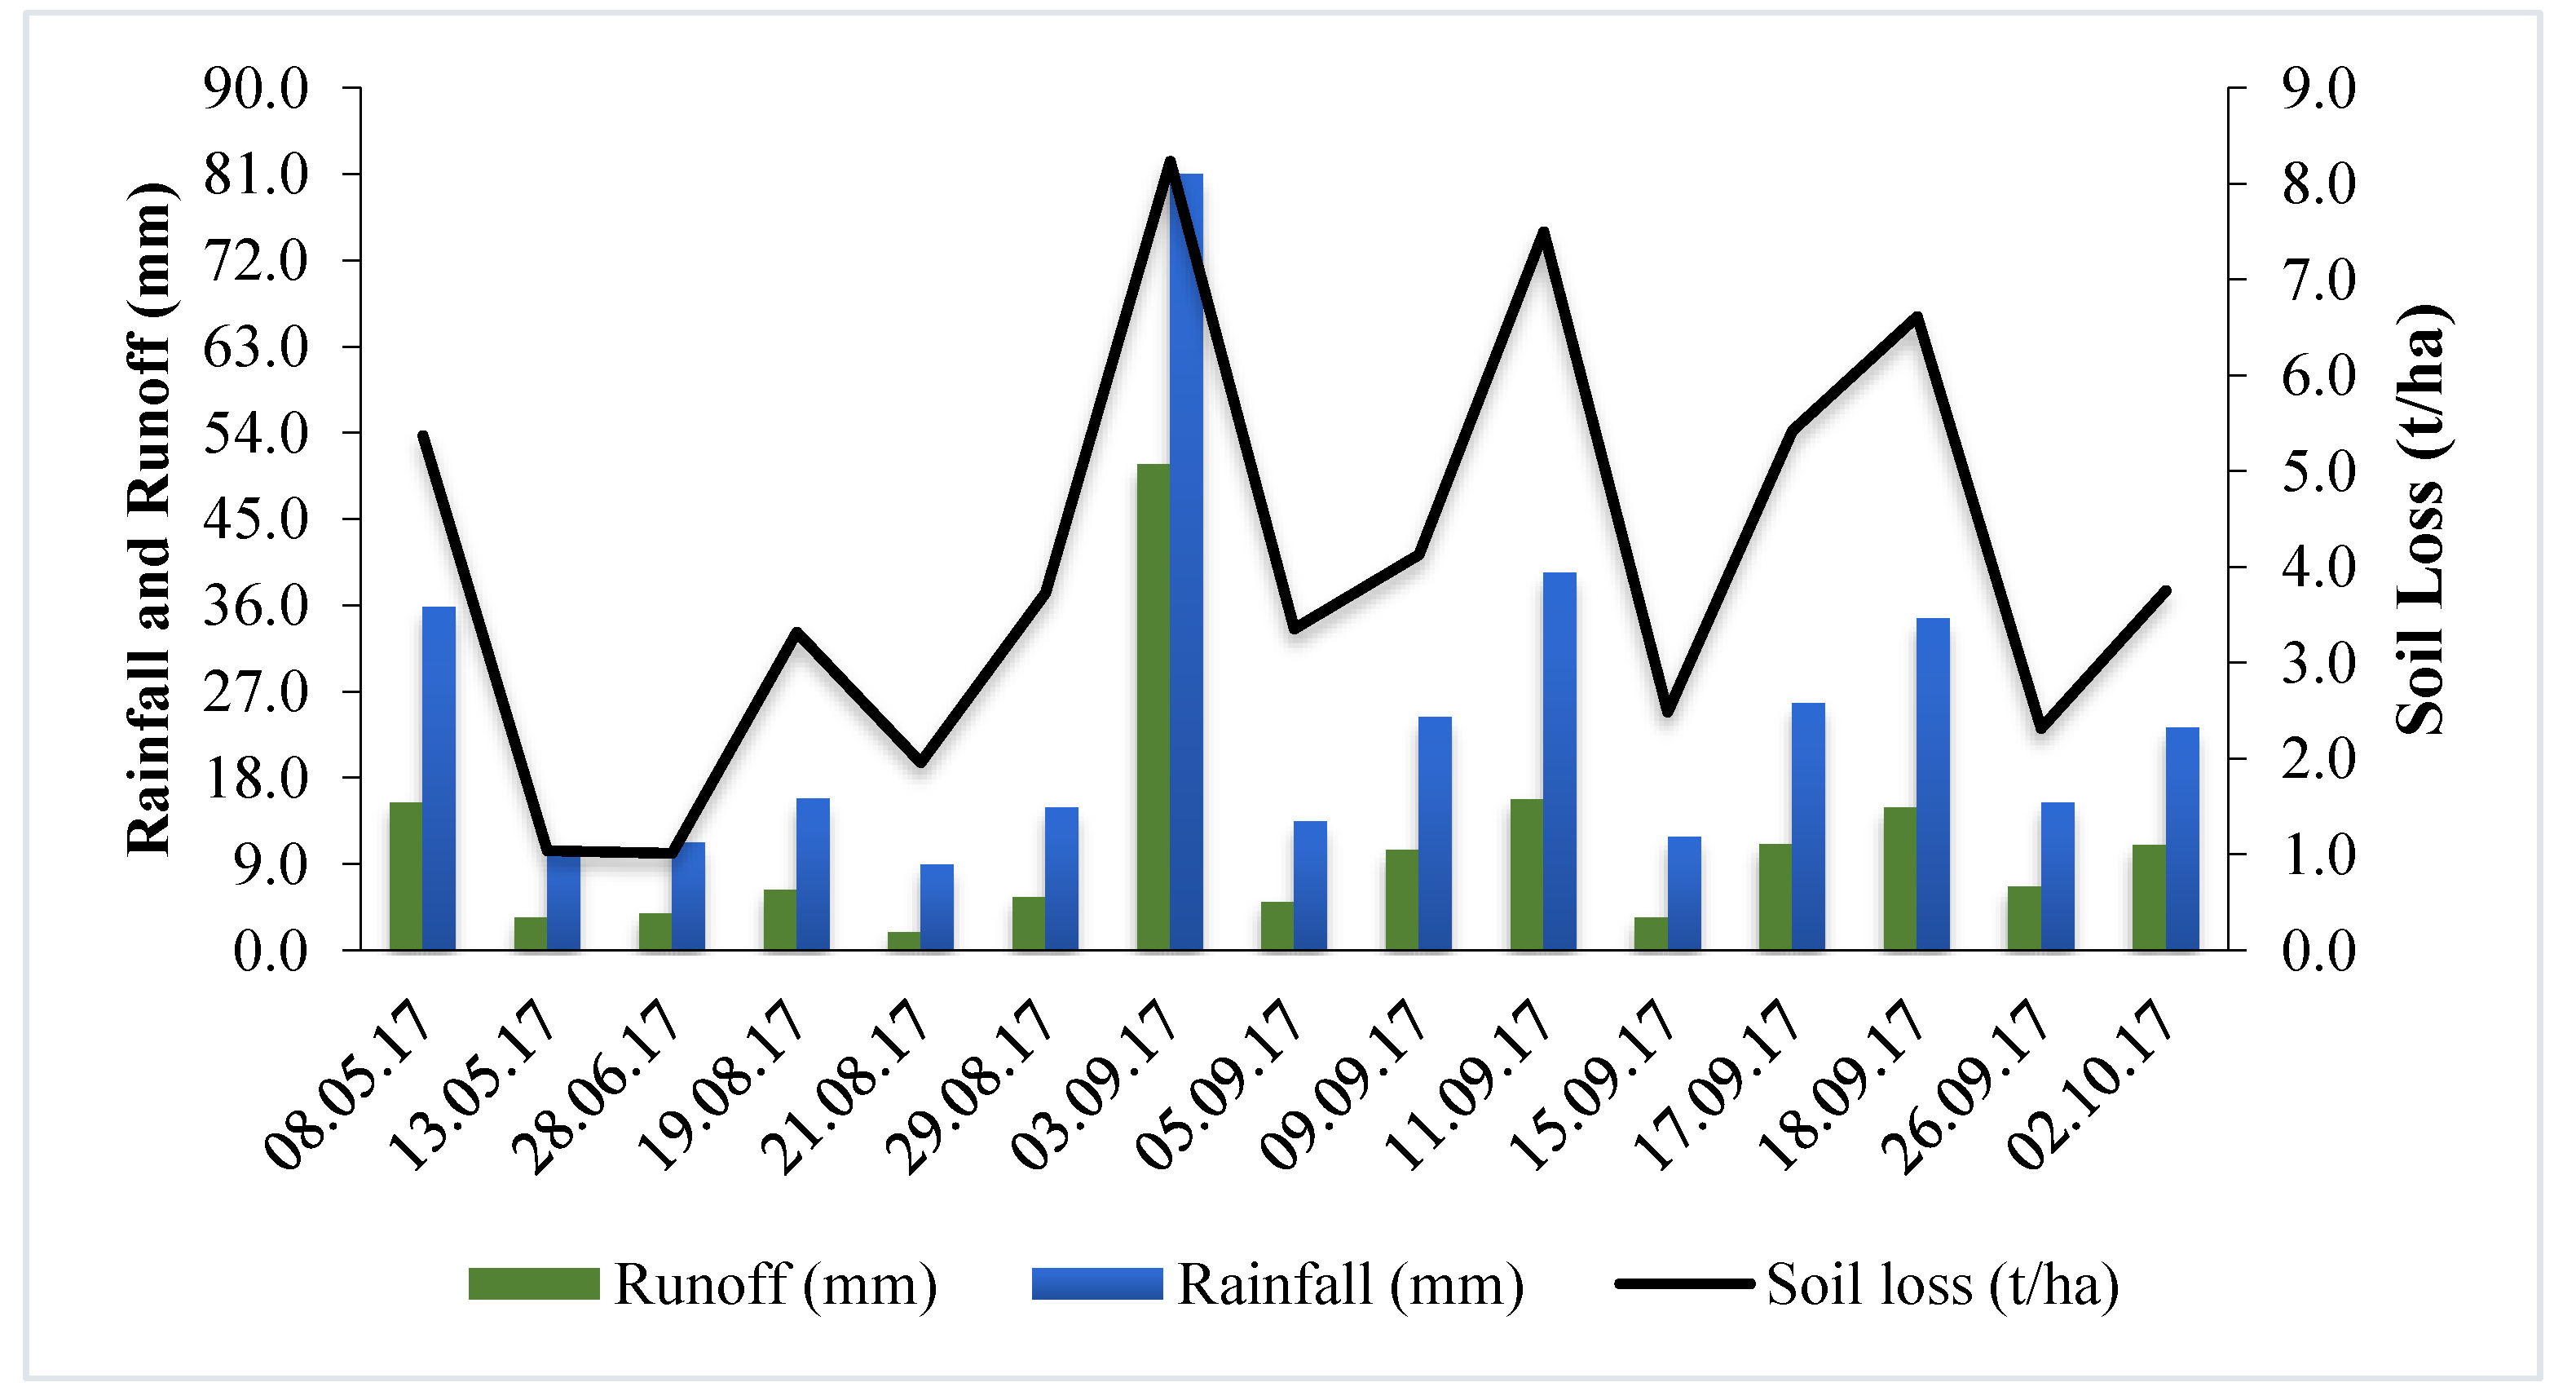
3.2. Simulation of Runoff and Soil Loss

The runoff and soil loss for the selected rainfall events during the rainy season of 2017 was simulated with the AGNPS model. As the model is event-based, we selected 15 rainfall events to represent various amounts of rainfall during the simulation year. The runoff in the hilly region is positively correlated with the rainfall and, in all the events, the soil loss followed the rate of runoff. A maximum runoff of 50.75 mm and soil loss of 8.23 t ha−1 was simulated from the watershed for the rainfall of 81 mm in the existing land-use scenario (Figure 4). Due to the fact that agricultural lands dominate the study watershed with human interventions, the soil erosion is also high during the high rainfall period. The increased amount of soil loss in the agricultural land may be due to less vegetation [39] and a lack of soil and water conservation measures [40]. A similar overprediction of the sediment yield for high intensity rainfall was observed in a hilly watershed [41]. Watersheds with high human interventions will annually lose more than 5 t ha−1 of soil [42]. Due to the presence of less or no vegetation in particular seasons, agricultural lands are generally affected by splash and sheet erosion, further intensifying the problem in rainy seasons. Bench terracing in agricultural lands may be an effective soil and water conservation practice for reducing soil erosion on the higher slope [43].

3.3. Simulation of Nitrogen and Phosphorus Load

Nutrient losses take place through runoff and soil; further, the quantity of loss depends on the slope length and the land-use of the watershed. The Nitrogen and phosphorus loads were estimated from the model for the selected rainfall events (Table 3). The Nitrogen loading in the runoff and sediment from the studied watershed ranged between 2.5 and a maximum of 22.8 kg ha−1. The simulation is realistic with the soil-available Nitrogen status and the nutrient management practices of the watershed. The watershed survey also confirmed that the farmers apply more Nitrogenous fertilizer than the recommended dose. However, the phosphorus loading of the study watershed ranges between 1.2 and 5.0 kg ha−1 under the farmer’s nutrient management practice. Many hydrological studies also confirmed that agriculture is a significant source of nutrient pollution in surface water resources [44,45].

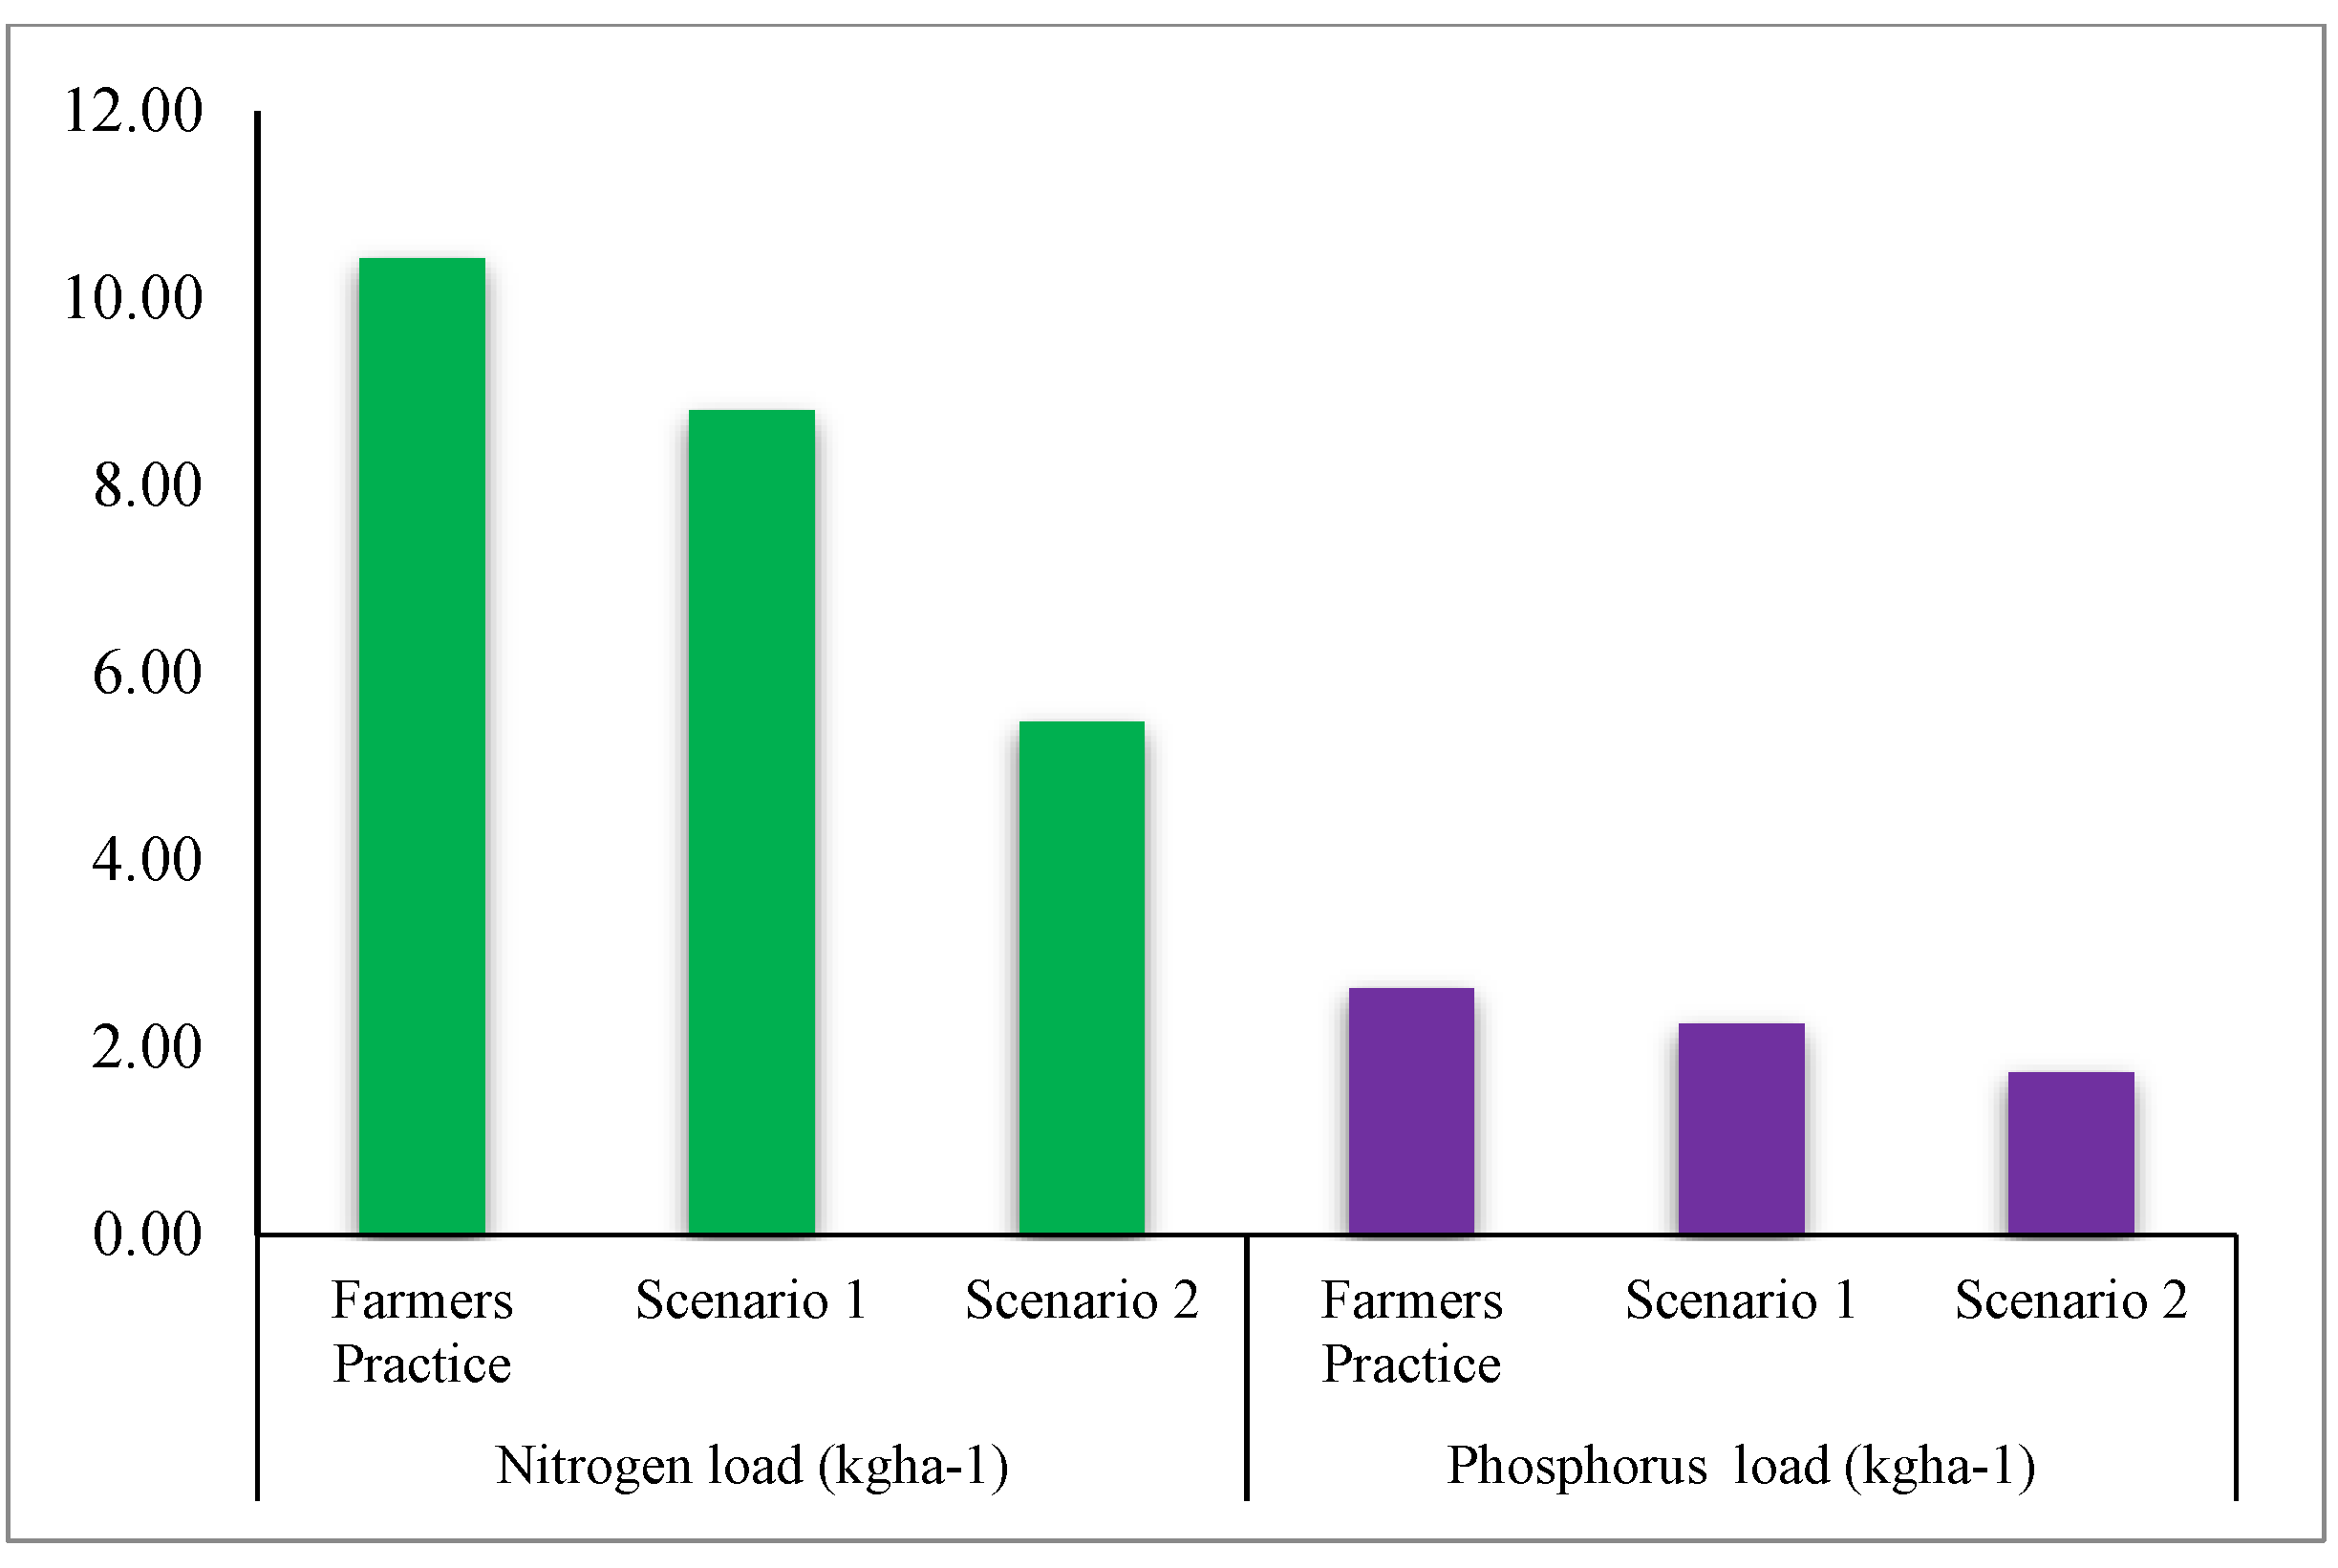
3.4. Response to Alternate Nutrient Management Strategies

In the present study, efforts were taken to study the effectiveness of different nutrient management practices to reduce the nutrient enrichment of the surface water bodies. With the focus on reducing the nutrient load, two different nutrient management scenarios were simulated in the model.
Scenario 1: Reduction of 25% in the nutrient dose (N and P) from the farmer’s practice
Scenario 2: Reduction of 50% in the nutrient dose (N and P) from the farmer’s practice
The assumption used in the scenario is:
The average rate of nutrient application by the farmer was 100% (Framers Practice). Based on this assumption, the scenarios were run for major vegetable crops, such as potato and carrot, to reduce the nutrient movement from the agricultural lands. The results of both scenarios showed reduced nutrient loads (Figure 5); however, a 25% nutrient reduction with INM practices significantly reduced, on average, 17 and 16% of the Nitrogen and phosphorus load. Scenario 2, with a 50% nutrient reduction, showed 48 and 36% reductions in the Nitrogen and phosphorus load from the watershed compared to the existing farmer’s practice. This indicates that fertilizer application for crop production plays a critical role in nutrient enrichment in water resources. Although the effect of fertilizer management practices on the nutrient load seems to be less, we cannot ignore its long term effects on the water quality. This reduces input costs and yields better results in a reasonably short time when executed scientifically [46].

3.5. Response to Alternative Land Management Strategy

Land-use is a key factor in deciding the soil and nutrient loss in the hilly watersheds. Ploughing, unsuitable management practices and deforestation for agriculture are the leading causes of human-induced soil erosion [47,48]. The expansion of agricultural lands through forests increases the intensity of soil erosion [49].
Considering this fact, the AGNPS model was run with the alternative land management scenario, scenario 3, assuming that 25% of the agricultural land is converted to tea plantations with a 50% reduced fertilizer dose (Table 4). The simulation results showed a decrease in the soil erosion and nutrient movement. In this scenario, on average, 10% of the soil loss was reduced. This may result from a reduction in soil disturbance for agricultural practices and the higher vegetation coverage of tea plantations. The Nitrogen and phosphorus loads were reduced to 56 and 48% under scenario three. The reduced land area under agriculture and fertilizer application for crops might contribute to reduced nutrient loss from the watershed.

4. Discussion

Quantifying the soil and nutrient loss from the watershed in terms of nutrient management practices, land-use changes and climate change projections is crucial for holistic watershed development [50,51]. Many researchers have also confirmed the accurate prediction of runoff by the AGNPS model [37]. As the error between the measured and predicted values is less than 25%, we used the model to predict the runoff, soil loss and nutrient loss for the studied watershed.
As agricultural lands dominate the studied watershed with human interventions, soil erosion is also high during the high rainfall period. Rainfall, soil type and management factors in sloppy lands significantly affect the runoff generation from agricultural lands, resulting in the enrichment of Nitrogen and phosphorus into surface water bodies [52]. The impacts from agricultural activities on surface water and groundwater can be minimized by using management practices adapted to the local conditions. Bench terracing in agricultural lands reduces soil erosion on the higher slope [39]. The Nitrogen loading in the runoff and sediment from the studied watershed ranged between 2.5 and a maximum of 22.8 kg ha−1, which is realistic with the soil-available Nitrogen status and the nutrient management practices of the watershed. However, the phosphorus loading of the studied watershed ranged between 1.2 and 5.0 kg ha−1 under the farmer’s nutrient management practice.
The AGNPS model has been successfully used for planning and managing the agricultural watersheds of hilly regions [53]. Two nutrient management scenarios were applied to reduce the nutrient movement from the watershed. To verify the present study’s 50% nutrient reduction scenario, we compared the nutrient dose derived from the Soil Test crop Response (STCR) equation developed for the soils and major crops of the study region. The STCR equation considers the soil nutrient status and the crop’s nutrient requirement. Hence, the 50% reduced fertilizer dose for carrot and potato crops was compared with the following STCR with the INM [54,55] equations developed by the Tamil Nadu Agricultural University for Nilgiri soils.
The STCR equation for carrot with INM:
FN = 0.48 T − 0.17 SN − 0.33 ON
FP2O5 = 1.11 T − 1.17 SP − 0.31 OP
The STCR equation for potato with INM:
FN = 0.71 T − 0.24 SN − 0.41 ON
FP2O5 = 1.40 T − 0.55 SP − 0.95 OP
where FN = Fertilizer Nitrogen (kg ha−1); FP2O5 = Fertilizer Phosphorus (kg ha−1); T = Yield target in (q ha−1); SN = Available soil N (kg ha−1); SP = Available soil N (kg ha−1); ON and OP are the quantities of N and P supplied through organic manures (kg ha−1).
These equations were tested based on the watershed’s average soil-available Nitrogen (356 kg ha−1) and phosphorus (180 kg ha−1) content. The yield target of 200 q ha−1 for potato and 300 q ha−1 for carrot was assumed based on the survey conducted from the watershed farmers. The derived fertilizer dose also confirmed that the farmers of this watershed could reduce 50% of the Nitrogen and phosphorus fertilizers with FYM and other organic manures as the INM based on the soil test to obtain the maximum yield of vegetable crops. As the STCR-based fertilizer recommendations calculate the precise quantity of nutrients for the crops based on soil nutrients [56], it will reduce the nutrient load from the agricultural land. The Nitrogen and phosphorus loads from the watershed are significantly related to land-use changes [3]. Several studies have suggested that agricultural management practices alter the nutrient load to water resources in small watersheds [57]. To combat nutrient losses from agricultural fields, farmers can implement nutrient management measures that help maintain high yields and save money on fertilizers.
The annual crop cultivation accelerates soil erosion, resulting in nutrient enrichment in water resources due to the accumulation of transported soil sediments. In contrast, the soil and nutrient loss under other land-uses, such as plantation and forest areas, are negligible [58,59,60]. Steeper slopes are always associated with high runoff, soil erosion and nutrient loss, and the hill watershed’s topography also favors the situation coupled with soil disturbance in agricultural operations [61]. Our study demonstrated that converting agricultural land to tea plantations reduces runoff, soil loss and nutrient loads. This result can be explained as no additional nutrients have been available through fertilizer application in the soil during rainfall events. A decrease in soil erosion was also recorded in the Coonoor watershed due to the expansion of orchards [62]. Horticultural tree plantation and growing grass in terraces have significantly decreased soil loss in the Rani Khola watershed in the eastern Himalayas [40]. Land-use scenario simulations with increased agricultural land by adjusting the forest land showed a significant total Nitrogen and phosphorus accumulation, affecting the water quality of the Old Woman Creek Watershed, Ohio [63]. The farmers in this watershed can convert 25% of the agricultural land on higher slopes to tea plantations without affecting the agricultural income. As all the farmers have their own established tea plantations, there is a high possibility of expanding tea plantations in this watershed. The hydrological models are cost-effective and time-saving tools for evaluating non-point pollution for developing sustainable land-use management strategies at the watershed level [64].

5. Conclusions

Sustainable soil and water management measures include a comprehensive approach to land-use and nutrient management practices at a watershed level. The assessment of soil erosion and nutrient enrichment in water resources are worth studying for resource conservation planning, especially in data scarce regions. In this study, an open source version of the AGNPS model was used for the prediction of runoff, soil loss and Nitrogen and phosphorus movement from the agricultural watershed. The model was calibrated and validated with the available data and was found to be efficient. The AGNPS model was used for the simulation of runoff, soil loss and nutrient loads for the selected events of 2017. A maximum runoff of 50.75 mm and soil loss of 8.23 t ha−1 was simulated for the rainfall of 81 mm. The nutrient loss is at the maximum in high and continuous rainfall. Nutrient management and alternate land-use scenarios were identified and simulated for the studied watershed. A reduction of 50% in the nutrient application for the major vegetable crops with INM reduced the Nitrogen and phosphorus load by 48 and 36%, respectively. The fertilizer recommendation is derived from the STCR equations developed based on the soil test values. The model also runs with an alternate land-use scenario by converting the agricultural land-uses to tea plantations. The root crops, potato and carrot, are cultivated in a larger area that disturbs the topsoil during harvest and causes accelerated soil erosion. Hence, converting 25% of the agricultural land to tea plantations reduced the runoff, soil loss and nutrient loads. We would like to conclude that the farmers can use 25% of the land area with higher slopes for tea plantation and apply 50% of the present fertilizer dose for the major vegetable crops, such as potato and carrot, with INM to reduce the nutrient enrichment in surface water bodies. The study demonstrated that in any watershed management program with limited funds, models are cost-effective for estimating soil erosion and nutrient loads. They are also helpful in deriving management strategies that minimize soil erosion and contain water pollution.

Author Contributions

Conceptualization, V.K.T. and S.M.; methodology, V.K.T. and S.M.; software, V.K.T. and S.M.; formal analysis, V.K.T. and S.M.; data curation, S.M.; writing—original draft preparation, S.M. and V.K.T.; writing—review and editing, V.K.T., S.M. and O.P.S.K.; visualization, S.M.; proofreading, S.M.; supervision, S.M. and O.P.S.K.; project administration, V.K.T. All authors have read and agreed to the published version of the manuscript.

Funding

This research received no external funding.

Informed Consent Statement

Not applicable.

Data Availability Statement

Not applicable.

Conflicts of Interest

The authors declare no conflict of interest.

References

  1. Gourevitch, J.D.; Keeler, B.L.; Ricketts, T.H. Determining Socially Optimal Rates of Nitrogen Fertilizer Application. Agric. Ecosyst. Environ. 2018, 254, 292–299. [Google Scholar] [CrossRef]
  2. Kopittke, P.M.; Menzies, N.W.; Wang, P.; McKenna, B.A.; Lombi, E. Soil and the Intensification of Agriculture for Global Food Security. Environ. Int. 2019, 132, 105078. [Google Scholar] [CrossRef] [PubMed]
  3. Silva, D.M.; Souza, M.F.; Silva, F.; Paula, F.C.; Moraes, M.E.; Strenzel, G.M. Land use effects on nutrient concentration in a small watershed in northeast brazil. Braz. J. Aquat. Sci. Technol. 2015, 19, 102–111. [Google Scholar]
  4. Nazari-Sharabian, M.; Taheriyoun, M.; Ahmad, S.; Karakouzian, M.; Ahmadi, A. Water Quality Modeling of Mahabad Dam Watershed–Reservoir System under Climate Change Conditions, Using SWAT and System Dynamics. Water 2019, 11, 394. [Google Scholar] [CrossRef] [Green Version]
  5. Ma, L.; Bu, Z.H.; Wu, Y.H.; Kerr, P.G.; Garre, S.; Xia, L.Z.; Yang, L.Z. An Integrated Quantitative Method to Simultaneously Monitor Soil Erosion and Non-Point Source Pollution in an Intensive Agricultural Area. Pedosphere 2014, 24, 674–682. [Google Scholar] [CrossRef]
  6. Pimentel, D.; Burgess, M. Soil erosion threatens food production. Agriculture 2013, 3, 443–463. [Google Scholar] [CrossRef] [Green Version]
  7. Kaplan, J.O.; Krumhardt, K.M.; Zimmermann, N. The prehistoric and preindustrial deforestation of Europe. Quat. Sci. Rev. 2009, 28, 27–28. [Google Scholar] [CrossRef]
  8. Germer, S.; Neill, C.; Vetter, T.; Chaves, J.; Krusche, A.V.; Elsenbeer, H. Implications of long-term land-use change for the hydrology and solute budgets of small catchments in Amazonia. J. Hydrol. 2009, 364, 349–363. [Google Scholar] [CrossRef]
  9. Bhateria, R.; Jain, D. Water quality assessment of lake water: A review. Sustain. Water Resour. Manag. 2016, 2, 161–173. [Google Scholar] [CrossRef] [Green Version]
  10. Gillespie, S.; Harris, J.; Kadiyala, S. The agriculture-nutrition disconnect in India: What do we know? Gates Open Res. 2019, 3, 1115. [Google Scholar]
  11. Guo, Y.; Wang, J. Spatiotemporal Changes of Chemical Fertilizer Application and Its Environmental Risks in China from 2000 to 2019. Int. J. Environ. Res. Public Health 2021, 18, 11911. [Google Scholar] [CrossRef] [PubMed]
  12. Xu, L.; Zhou, Z.; Du, J. An evolutionary game model for the multi-agent Co-governance of agricultural non-point source pollution control under intensive management pattern in China. Int. J. Environ. Res. Public Health 2020, 7, 2472. [Google Scholar] [CrossRef] [Green Version]
  13. Amin, M.G.M.; Veith, T.L.; Collick, A.S.; Karsten, H.D.; Buda, A.R. Simulating hydrological and non-point source pollution processes in a karst watershed: A variable source area hydrology model evaluation. Agr. Water Manag. 2017, 180, 212–223. [Google Scholar] [CrossRef] [Green Version]
  14. Zeng, F.; Zuo, Z.; Mo, J.; Chen, C.; Yang, X.; Wang, J.; Wang, Y.; Zhao, Z.; Chen, T.; Li, Y.; et al. Runoff Losses in Nitrogen and Phosphorus From Paddy and Maize Cropping Systems: A Field Study in Dongjiang Basin, South China. Front. Plant Sci. 2021, 12, 1593. [Google Scholar] [CrossRef] [PubMed]
  15. Peng, J.; Jin, C.; Wu, Y.; Hou, Z.; Gao, S.; Chu, Z.; Zheng, B. Modeling Non-Point Source Nutrient Loads with Different Cropping Systems in an Agricultural Lake Watershed in Southwestern China: From Field to Watershed Scale. Mathematics 2022, 10, 4047. [Google Scholar] [CrossRef]
  16. Aksoy, H.; Kavvas, M.L. A review of hillslope and watershed scale erosion and sediment transport models. Catena 2005, 64, 247–271. [Google Scholar] [CrossRef]
  17. Mishra, H.; Denis, D.M.; Suryavanshi, S.; Kumar, M.; Srivastava, S.K.; Denis, A.F.; Kumar, R. Hydrological simulation of a small ungauged agricultural watershed Semrakalwana of Northern India. Appl. Water Sci. 2017, 7, 2803–2815. [Google Scholar] [CrossRef] [Green Version]
  18. Wu, S.S.; Usery, E.L.; Finn, M.P.; Bosch, D.D. An assessment of the effects of cell size on AGNPS modeling of watershed runoff. Cartogr. Geogr. Inf. Sci. 2008, 35, 265–278. [Google Scholar] [CrossRef]
  19. Haverkamp, S.; Fohrer, N.; Frede, H.G. Assessment of the effect of land-use patterns on hydrologic landscape functions: A comprehensive GIS-based tool to minimize model uncertainty resulting from spatial aggregation. Hydro Process. 2005, 19, 715–727. [Google Scholar] [CrossRef]
  20. Young, R.A.; Onstad, C.A.; Bosch, D.D.; Anderson, W.P. Agricultural Non-Point Source Pollution Model. AGNPS User’s Guide, Version 4.03; US Geological Survey: Washington, DC, USA, 1994. [Google Scholar]
  21. Panjabi, K.; Rudra, R.; Goel, P.; Daggupati, P.; Shrestha, N.K.; Shukla, R.; Zhang, B.; Allataifeh, N. Mapping runoff generating areas using AGNPS-VSA model. Hydrol. Sci. J. 2020, 65, 2224–2232. [Google Scholar] [CrossRef]
  22. Chowdary, V.M.; Yatindranath, K.S.; Adiga, S. Modelling of non-point source pollution in a watershed using remote sensing and GIS. J. Indian Soc. Remote Sens. 2004, 32, 59–73. [Google Scholar] [CrossRef]
  23. Zhou, T.; Wu, J.; Peng, S. Assessing the effects of landscape pattern on river water quality at multiple scales: A case study of the Dongjiang River watershed, China. Ecol. Indic. 2012, 23, 166–175. [Google Scholar] [CrossRef]
  24. Assfaw, A.T. Modeling Impact of Land Use Dynamics on Hydrology and Sedimentation of Megech Dam Watershed, Ethiopia. Sci. World J. 2020, 6530278. [Google Scholar] [CrossRef] [PubMed]
  25. León, L.F.; Booty, W.G.; Bowen, G.S.; Lam, D.C.L. Validation of an agricultural non-point source model in a watershed in southern Ontario. Agr. Water Manage. 2004, 65, 59–75. [Google Scholar] [CrossRef]
  26. Sekar, C.; Ramasamy, C. Economics of soil conservation structures in the Nilgiris. Indian J. Agric. Econ. 1998, 53, 614–626. [Google Scholar]
  27. Bhattacharyya, R.; Ghosh, B.N.; Mishra, P.K.; Mandal, B.; Rao, C.S.; Sarkar, D.; Das, K.; Anil, K.S.; Lalitha, M.; Hati, K.M.; et al. Soil degradation in india: Challenges and potential solutions. Sustainability 2015, 7, 3528–3570. [Google Scholar] [CrossRef] [Green Version]
  28. Ma, L.; Ni, J.; Fleskens, L.; Wang, H.; Xuan, Y. Modelling Fertilizer Use in Relation to Farmers’ Household Characteristics in Three Gorges Reservoir Area, China. Agriculture 2021, 11, 472. [Google Scholar] [CrossRef]
  29. Vitousek, P.M.; Naylor, R.; Crews, T.; David, M.B.; Drinkwater, L.E.; Holland, E.; Johnes, P.J.; Katzenberger, J.; Martinelli, L.A.; Matson, P.A.; et al. Nutrient imbalances in agricultural development. Science 2009, 324, 1519–1520. [Google Scholar] [CrossRef]
  30. Zhou, L.; Han, T.; Wu, L.; Ke, M.; Zhang, H.; Li, X.; Ao, T. Water quality assessment and control countermeasures of rural non-point source pollution: A case study on Xichong River. Modeling and Computation in Engineering III. In Proceedings of the 3rd International Conference on Modeling and Computation in Engineering, CMCE, Wuxi, China, 28–29 June 2014; pp. 111–116. [Google Scholar]
  31. Environment Protection Agency (EPA). Protecting Water Quality from Agricultural Runoff EPA 841-F-05-001. Available online: https://www.epa.gov/nps (accessed on 20 December 2022).
  32. Yuan, X.; Jun, Z. Water Resource Risk Assessment Based on Non-Point Source Pollution. Water 2021, 13, 13141907. [Google Scholar] [CrossRef]
  33. Young, R.A.; Onstand, C.A.; Bosch, D.D.; Anderson, W.P. AGNPS. A non-point source pollution model for evaluating agricultural watersheds. J. Soil Water Conserv. 1989, 44, 168–173. [Google Scholar]
  34. Young, R.A.; Onstad, C.A.; Bosch, D.D.; Anderson, W.P. Agricultural Non-Point Source Pollution Model (AGNPS). 1987 A Watershed Analysis Tool; USDA Conservation Research Report 35; Agricultural Research Service: Albany, CA, USA.
  35. AgriMetSoft (2019). Online Calculators. Available online: https://agrimetsoft.com (accessed on 13 December 2022).
  36. Nash, J.E.; Sutcliffe, J.V. River flow forecasting through conceptual models, Part-1: A discussion of principles. J. Hydrol. 1970, 10, 282–290. [Google Scholar] [CrossRef]
  37. Mohammed, H.; Yohannes, F.; Zeleke, G. Validation of agricultural non-point source (AGNPS) pollution model in Kori watershed, South Wollo, Ethiopia. Int. J. Appl. Earth. Obs. 2004, 6, 97–109. [Google Scholar] [CrossRef]
  38. Rode, M.; Frede, H.G. Modification of AGNPS for agricultural land and climate conditions in Central Germany. J. Environ. Qual. 1997, 26, 165–173. [Google Scholar] [CrossRef]
  39. Chalise, D.; Kumar, L.; Shriwastav, C.P.; Lamichhane, S. Spatial assessment of soil erosion in a hilly watershed of Western Nepal. Environ. Earth Sci. 2018, 77, 1–11. [Google Scholar] [CrossRef]
  40. Mishra, P.K.; Rai, A.; Abdelrahman, K.; Rai, S.C.; Tiwari, A. Land Degradation, Overland Flow, Soil Erosion, and Nutrient Loss in the Eastern Himalayas, India. Land 2022, 11, 179. [Google Scholar] [CrossRef]
  41. Singh., R.; Tiwari, K.N.; Mal, B.C. Hydrological studies for small watershed in India using the ANSWERS model. J. Hydrol. 2006, 318, 184–199. [Google Scholar] [CrossRef]
  42. Prasannakumar, V.; Vijith, H.; Abinod, S.; Geetha, N. Estimation of soil erosion risk within a small mountainous sub-watershed in Kerala, India, using Revised Universal Soil Loss Equation (RUSLE) and geo-information technology. Geosci. Front. 2012, 3, 209–215. [Google Scholar] [CrossRef] [Green Version]
  43. Emmett, W.W. The Hydraulics of Overland Flow on Hillslopes; USGS (United States Geological Survey): Washington, DC, USA, 1970; Volume 662A, p. 68. [Google Scholar]
  44. Chen, X.; Liu, X.; Peng, W.; Dong, F.; Huang, Z.; Wang, R. Non-Point Source Nitrogen and Phosphorus Assessment and Management Plan with an Improved Method in Data-Poor Regions. Water 2018, 10, 17. [Google Scholar] [CrossRef] [Green Version]
  45. Li, Z.; Dai, J.; Li, Z.; Liu, Y.; Xu, J.; Zhang, Z.; Xu, B. Simulation Study on the Effect of Non-Point Source Pollution on Water Quality in the Upper Reaches of the Lijiang River. Water 2022, 14, 3995. [Google Scholar] [CrossRef]
  46. Khare, Y.P.; Paudel, R.; Wiederholt, R.; Abiy, A.Z.; Van Lent, T.; Davis, S.E.; Her, Y. Watershed Response to Legacy Phosphorus and Best Management Practices in an Impacted Agricultural Watershed in Florida, U.S.A. Land 2021, 10, 977. [Google Scholar] [CrossRef]
  47. FAO; ITPS. The Status of the World’s Soil Resources (Main Report); FAO: Rome, Italy, 2015. [Google Scholar]
  48. Montgomery, D.R. Soil erosion and agricultural sustainability. Proc. Natl. Acad. Sci. USA 2007, 104, 13268–13272. [Google Scholar] [CrossRef] [PubMed] [Green Version]
  49. Kidane, M.; Bezie, A.; Kesete, N.; Tolessa, T. The impact of land use and land cover (LULC) dynamics on soil erosion and sediment yield in Ethiopia. Heliyon 2019, 5, e02981. [Google Scholar] [CrossRef] [PubMed] [Green Version]
  50. Chen, D.J.; Hu, M.P.; Guo, Y.; Dahlgren, R.A. Influence of legacy phosphorus, land use and climate change on anthropogenic phosphorus inputs and riverine export dynamics. Biogeochemistry 2015, 123, 99–116. [Google Scholar] [CrossRef]
  51. Haygarth, P.M.; Jarvie, H.P.; Powers, S.M.; Sharpley, A.N.; Elser, J.J.; Shen, J.B.; Peterson, H.M.; Chan, N.I.; Howden, N.J.K.; Burt, T.; et al. Sustainable Phosphorus Management and the Need for a Long-Term Perspective: The Legacy Hypothesis. Environ. Sci. Technol. 2014, 48, 8417–8419. [Google Scholar] [CrossRef]
  52. Venishetty, V.; Parajuli, P.B. Assessment of BMPs by Estimating Hydrologic and Water Quality Outputs Using SWAT in Yazoo River Watershed. Agriculture 2022, 12, 477. [Google Scholar] [CrossRef]
  53. Haregeweyn, N.; Yohannes, F. Testing and evaluation of the agricultural non-point source pollution model (AGNPS) on Augucho catchment, western Hararghe, Ethiopia. Agric. Ecosyst. Environ. 2003, 99, 201–212. [Google Scholar] [CrossRef]
  54. Gayathri, A.; Vadivel, A.; Santhi, R.; Boopathi, P.M.; Natesan, R. Soil Test Based Fertilizer Recommendation Under Integrated Plant Nutrition System for Potato (Solanum Tuberosum. L) in Hilly Tracts of Nilgiris District. Indian J. Agr. Res. 2009, 43, 52–56. [Google Scholar]
  55. STCR–IPNS Technology for Various Crops and Soils of Tamil Nadu. Available online: https://tnau.ac.in/nrmgt/dept-of-soil-science-and-agricultural-chemistry-technologies-developed (accessed on 12 December 2022).
  56. Kasthuri Thilagam, V.; Natesan, R. Fertilizer prescription equations for desired yield targets of cauliflower under integrated plant nutrient system based on targeted yield model. Agric. Sci. Digest 2009, 29, 250–253. [Google Scholar]
  57. Gravelle, J.A.; Ice, G.; Link, T.E.; Cook, D.L. Nutrient concentration dynamics in an inland Pacific Northwest watershed before and after timber harvest. For. Ecol. Manag. 2009, 257, 1663–1675. [Google Scholar] [CrossRef]
  58. Yusof, F.M.; Jamil, N.R.; Aini, N.; Manaf, L.A. Land use change and soil loss risk assessment by using geographical information system (GIS): A case study of lower part of Perak River. In Proceedings of the IOP Conference Series: Earth and Environmental Science, Ancona, Italy, 1–2 October 2018; IOP Publishing LTD: Bristol, UK, 2019. [Google Scholar]
  59. Patric, J.H. Soil erosion in the eastern forest. J. For. 1976, 74, 671–677. [Google Scholar]
  60. Rai, S.C.; Sharma, E. Comparative assessment of runoff characteristics under different land-use pattern within a Himalayan watershed. Hydrol. Process 1998, 12, 2235–2248. [Google Scholar] [CrossRef]
  61. Cheng, X.; Chen, L.D.; Sun, R.H. Modeling the non-point source pollution risks by combing pollutant sources, precipitation, and landscape structure. Environ. Sci. Pollut. Res. 2019, 26, 11856–11863. [Google Scholar] [CrossRef] [PubMed]
  62. Saravanan, S.; Jacinth, J.J.; Singh, L.; Saranya, T.; Sivaranjani, S. Impact of land-use change on soil erosion in the Coonoor Watershed, Nilgiris Mountain Range, Tamil Nadu, India. In Proceedings of the 1st Springer Conference Arabian Journal of Geosciences, Hammamet, Tunisia, 12–15 November 2018; pp. 109–111. [Google Scholar]
  63. Olaoye, I.A.; Confesor, R.B., Jr.; Ortiz, J.D. Impact of Agricultural Practices on Water Quality of Old Woman Creek Watershed, Ohio. Agriculture 2021, 11, 426. [Google Scholar] [CrossRef]
  64. Shrestha, S.; Babel, M.S.; Gupta, A.D.; Kazama, F. Evaluation of annualized agricultural non-point source model for a watershed in the Siwalik Hills of Nepal. Environ. Model. Softw. 2006, 21, 961–975. [Google Scholar] [CrossRef]
Figure 1. Location map of study watershed.
Sustainability 15 04001 g001
Figure 2. Input maps of study watershed (A) DEM map; (B) Soil map; (C) Land-use map.
Sustainability 15 04001 g002
Figure 3. Measured and predicted values for runoff and soil loss.
Sustainability 15 04001 g003
Figure 4. Estimated runoff and soil loss from study watershed.
Sustainability 15 04001 g004
Figure 5. Effect of nutrient management scenarios on average N and P load from the watershed.
Sustainability 15 04001 g005
Table 1. Correlation coefficient and NSE for the calibration and validation results.
ProcessAccuracy testedRunoffSoil loss
CalibrationR20.940.93
NSE0.730.79
ValidationR20.890.87
NSE0.750.72
Table 2. Calibration of predicted runoff and soil loss values for selected events during the year 2003.
DateRainfall (mm)Runoff (mm)Soil Loss (tha−1)
MeasuredPredictedMeasuredPredicted
20 June 200317.86.67.82.22.9
20 June 200324.210.413.54.87.2
4 July 200310.43.532.11.7
5 July 200312.43.84.63.34.3
16 July 200310.92.92.41.51.1
17 July 200310.82.51.80.40.3
31 July 200315.84.65.61.51.8
12 August 200317.62.62.10.80.9
23 August 200311.72.92.40.91.1
Sum 39.843.217.521.3
Mean 4.44.81.92.4
Table 3. Estimated nutrient movement from the study watershed under the present nutrient management (Farmers practice).
DateRainfall
(mm)
Nitrogen
(kg ha−1)
Phosphorus
(kg ha−1)
8 May 2017 35.816.304.2
13 May 201710.47.651.2
28 June 201711.28.001.3
19 August 201715.87.901.6
21 August 20178.92.502.0
29 August 201714.93.654.0
3 September 2017 81.022.805.0
5 September 201713.410.352.4
9 September 201724.311.252.0
11 September 201739.416.404.2
15 September 201711.810.052.0
17 September 201725.810.152.0
18 September 201734.611.053.8
26 September 201715.49.152.0
2 October 201723.27.801.8
Table 4. Effect of alternate land management scenario on soil loss, N and P load from the watershed.
Rainfall mmSoil Loss
(t ha−1)
Nitrogen Load
(kg ha−1)
Phosphorus Load
(kg ha−1)
Farmers PracticeScenario 3Farmers PracticeScenario 3Farmers PracticeScenario 3
35.85.374.7316.307.664.22.0
10.41.040.927.653.601.20.4
11.21.010.898.003.761.30.6
15.83.322.928.103.711.60.6
8.91.961.722.700.502.01.2
14.93.733.284.681.724.02.8
818.237.3822.8010.715.03.4
13.43.352.9510.354.862.41.2
24.34.133.6311.285.292.01.0
39.47.56.616.407.704.22.0
11.82.482.1810.054.722.01.0
25.85.424.7710.154.772.01.0
34.66.616.711.095.193.82.8
15.42.312.039.104.302.01.0
23.23.753.37.803.671.80.8
Disclaimer/Publisher’s Note: The statements, opinions and data contained in all publications are solely those of the individual author(s) and contributor(s) and not of MDPI and/or the editor(s). MDPI and/or the editor(s) disclaim responsibility for any injury to people or property resulting from any ideas, methods, instructions or products referred to in the content.

