Article

The Monetary Value of Corporate Social Responsibility: The Impact of Tea Trees Growing Project between Corporates and Taiwan’s Aboriginal Farmers on Consumers

1
Promotion Department, Hsinchu County Farmers’ Association, Hsinchu 30471, Taiwan
2
Department of Agricultural Economics, National Taiwan University, Taipei 10617, Taiwan
3
The Center for Green Economy, Chung-Hua Institution for Economic Research, Taipei 10672, Taiwan
4
Department of Logistics Management, National Kaohsiung University of Science and Technology, Kaohsiung 82454, Taiwan
*
Author to whom correspondence should be addressed.
Sustainability 2022, 14(13), 8145; https://0-doi-org.brum.beds.ac.uk/10.3390/su14138145
Submission received: 13 June 2022 / Revised: 30 June 2022 / Accepted: 1 July 2022 / Published: 4 July 2022

Abstract

:
The first hypothesis of this study is to dissect the factors that impact consumers’ preference toward a specific corporate social responsibility (CSR) project via the framework of the theory of planned behaviour (TPB). The second hypothesis is to evaluate a monetary value for CSR among consumers through their WTP. The willingness to pay (WTP) in relation to those influential factors is used to represent the monetary value of CSR for the tea tree growing project implemented by corporates among indigenous tribal farmers in Taiwan. The components of CSR covered in this study are product safety, economic security for contractual farmers, the protection of the environment, and the conservation of ecology. Such efforts encompass the economic, legal, ethical, and philanthropic responsibilities of CSR. The corresponding highest and lowest monetary values of CSR per hectare of tea trees are USD 92,232 and USD 141,762, respectively. The overall average monetary value of CSR per hectare is USD 118,035. These values represent the specific amounts that a corporation can potentially contribute to society when it contracts tea production to aboriginal farmers.

1. Introduction

Most agricultural activities in Taiwan are located on the plains on the western side of the island and in the rift valley in the east. Society rarely pays attention to the tribal agricultural activities of aboriginal people. Most agricultural products grown by aboriginal people are vegetables and fruits, such as marrow, cabbage, persimmon, or honey peach, and so on. These products are perishable and not easy to store. During the summer and autumn seasons, the infrastructure in the mountain areas is not infrequently devastated by typhoons. It normally takes weeks to transport these fruits and vegetables to the wholesale or retail markets due to transportation disruptions. These perishable vegetables and fruits result in financial losses for farmers among the aboriginal tribes.
Some farmers have switched to other agricultural products with high economic value, with tea being one of the selections. However, the way in which the tea is planted, the field management, and the mode of cultivation of tea trees are totally different from the way that vegetables and fruits are grown. The most difficult parts are the processing and marketing. The tea corporations are not interested in tea from the emerging tea farms because they lack a sufficiently good reputation, and the quality of the tea is a major concern. Processing and marketing the tea becomes an increasingly important and urgent task when farmers start growing tea trees among the aboriginal tribes.
Such a task provides opportunities for businesses and large enterprises in Taiwan in terms of offering assistance to aboriginal farmers in several respects. Support could take the form of job offers, financial aid for purchasing agricultural machinery and equipment, and assistance with roasting the tea leaves, which differs from that for other agricultural products. This is in order to ensure incomes for farmers among the aboriginal tribes since there is a contractual relationship between the corporates and farmers. Moreover, because society pays much attention to environmental protection and the conservation of natural resources, the contractual farming between corporates and farmers for tea tree plantations in the aboriginal tribal areas is expected to operate under such norms. That is, friendly forms of agriculture are promoted through the use of organic fertilizer and liquid nutrients.
All these actions, in a certain way, coincide with the concept of corporate social responsibility (CSR), which originated in the 1950s [1]. The exact definition of CSR provided by [1] is: “It (CSR) refers to the obligation of businessmen to pursue those policies, to make those decisions, or to follow those lines of action which are desirable in terms of objectives and values of our society”. Although there are pros and cons for this definition, this was the first time, however, to call the attention of businesses to those operating targets and objectives other than profit maximization. Carroll then went a step further to clearly define the components of CSR [2,3]. The major elements include discretionary responsibility, also known as philanthropic responsibility, ethical responsibility, legal responsibility, and economic responsibility.
Since then, the practices of CSR have been taken up by all kinds of corporates and in various ways. The practices of CSR can be found in the agricultural reform programmes proposed by corporates in South Africa to effectively communicate with farmers for technological assistance [4]. CSR activities have a persistent impact on the environmental ecology and the identification of consumers. An example of a large impact on the environment in Pakistan was found based on a study conducted by [5]. The practices of CSR by manufacturers subsequently direct their focus towards the improvement of the environment. When consumers face the challenge of food security in the middle- and low-income cities of West Africa, such as the contamination by microorganisms and pesticide residues, the implementation of CSR for security authentication is one method used to reduce the risks of agricultural production [6]. It is found that the practice of CSR not only increases the reputation of a specific product, but also has a positive relationship with the value of a corporate [7].
Furthermore, PepsiCo Inc. grows potatoes with healthy seeds and blight detection on a regular basis to ensure quality products in India [8]. Some non-governmental organizations and corporates assist farmers in growing organic coconuts and then marketing them. The establishment of farmers’ schools in Sri Lanka serves to offer more knowledge and skills to coconut farmers and to change their attitudes toward management concepts, while offering promotion programs for coconut production [9]. The diverse and complicated upstream and downstream services in the agricultural sector normally mean that it is difficult to determine whether a specific practice is a regular agricultural activity or has to do with the implementation of CSR in the agricultural sector.
It can be found that the existing literature focuses more on the selection and implementation of a specific type of CSR. To the best of our knowledge, although there are few studies that explore the consumer’s awareness of CSR, evaluate the willingness to pay (WTP) for specific foods or for the food industry as a whole, and/or identify different aspects of the factors influencing WTP, such information is not sufficient to target a specific group of consumers in order to provide suitable CSR food [10,11,12,13]. Furthermore, without such information, there is no criterion for selecting the most appropriate type of CSR or for deciding the extent to which the targeting of a suitable level of CSR should be implemented. From the viewpoint of a corporate, the budget is required to implement a particular CSR practice, since the value of the CSR and especially the monetary value of the CSR are more persuasive and objective when it comes to determining the contribution from carrying out a typical type of CSR.
It is not only the economic component that has value, but each of the other three components, i.e., legal, ethical, and philanthropic, also have value based on a rational standpoint. Moreover, a corporate might concurrently implement multiple CSRs. The monetary value of each form of CSR can be utilized by a corporate to prioritize the implementation of all planned CSRs. As many CSRs start out with the production of a specific product, this will then end up being associated with all types of consumers. Thus, it is certainly essential for corporates to control factors that affect consumer preferences towards a product that originated from a typical type of CSR. Most importantly of all, the consumer’s willingness to pay (WTP) for a product from a particular type of CSR is an appropriate measurement of the monetary value for that typical CSR.
To comprehend the factors that affect consumers’ preferences and further determine the consumer’s WTP for a CSR-related product, the theory of planned behaviour (TPB) provides an appropriate framework. There is no systematic examination of the factors related to the consumer’s attitude, subjective norms, and perceived behavioural control in regard to the CSR product. No study has so far been conducted that evaluates the consumer’s potential purchasing behaviour through the consumer’s WTP. Such an outcome will then be the monetary value of the typical CSR of concern. The CSR of concern here has to do with the tea tree growing project implemented by corporates among the aboriginal tribes in Taiwan. Thus, the novelty of this study is to combine the TPB and the concept of CRS to examine two hypotheses. The first hypothesis is to dissect the factors that impact consumers’ preferences toward a specific CSR project via the framework of TPB. The second hypothesis is to evaluate a monetary value for CSR among consumers through their WTP. The corresponding methods involved in factor examinations and the evaluation of the monetary value of CSR are respectively by the ordered probit model and the quantile regression model (QR).

2. The Framework for CSR and the TPB

2.1. The Concept of CSR

The major mission of a corporate is to pursue profit. Each scale of corporation can also assist in benefiting the public through environmental protection and natural resource conservation within society. It then plays the role of sustainable development and extends to the concept of CSR. The improvement of society is basically deemed to be the responsibility of the government. Although the expansion of enterprises gives rise to more social problems, society, however, is of the opinion that the burdens and expenditures need to be shared between the government and corporates in resolving these problems [14]. It then extends the responsibility of corporates. The corporates with related responsibilities will not only increase the desired image but will also attract the attention of society. CSR will then generate goals other than profit seeking [1].
The concept of CSR was pioneered by Bowen [1]. However, the idea was extended only to business management in the 1960s. It was not until the 1970s that the CSR concept was expanded to charitable activities engaged in by businesses in addition to its major enterprise substance [15]. Empirical research was conducted from the 1980s onwards to examine the performance of all types of CSR practises [8,16,17]. The components of CSR were then clearly defined by [3], including discretionary responsibility, also known as philanthropic responsibility, ethical responsibility, legal responsibility, and economic responsibility [2,3]. Among these, corporates generate profit through the implementation of their economic responsibility, and it can be implemented by all corporates.
The scope of such responsibilities, as shown in Figure 1 (left), indicates that it forms the basis for the corporates. Legal responsibility involves the execution of a contract and follows the rules set by laws. A corporate forming a committee for product security is one such case. The scope of legal responsibility is smaller than that of economic responsibility. As with ethical responsibility, a corporate performs under the expectations of society. If the behaviour or activity is not regulated by law, its scope is smaller than that of legal responsibility. Production resulting in a safe product for a corporate is the presence of ethical responsibility. Taking action related to discretionary responsibilities is purely voluntary. This does not include actions that a corporate is mandated to take as being more ethical to take, and its scope is the smallest among the four components. Charitable donations by corporates constitute one such action.
Under globalization, non-governmental organisations in many countries take a stand to protect the environment and human rights issues. This then causes society to redefine its social responsibility [3], which in turn results in all four CSR components exhibiting a pyramid relationship, as shown in Figure 1 (right) developed by [3]. The pyramid shape displays different responsibilities in terms of a progressive relationship instead of different sizes of rectangles moving from the foundation of economic actions to eminent discretionary actions. The pyramid structure also indicates the importance that has been attached to discretionary responsibility and ethical responsibility. In 1999, the World Trade Organization (WTO) extended CSR for private businesses and international organisations to encompass human rights, working conditions, and the environment for global operations. Carroll has further reviewed the definitions, content, and evolution of CSR since the 1950s and has indicated that the economy includes employment opportunities and products in addition to economic growth [18]. The social value has changed due to the growth of the economy. It might be expected to include the protection of natural resources, harmony between labour and management, fair trade between businesses and their customers, and making available the information of businesses to customers and the general public.
Through the implementation of CSR, many corporates have noticed that it is essential to incorporate economic, social, and environmental factors in business management. To reduce the risks for business and promote the efficiency of employees, increasing the reputation of the corporate, strengthening the loyalty of customers, and developing its contribution to society are all significant areas regarding the scope of CSR for a corporate. The exercise of CSR in terms of intensifying the faith of the consumer and enhancing corporate ethics through the protection of the environment and maintenance of product quality will increase the competitiveness of the corporates and then differentiate among them [19]. As such, the implementation of CSR should not only give consideration to the interests of the related stakeholders but should also earn support from society [20,21,22].

2.2. The Implementation of CSR in the Agricultural Sector in the World and in Taiwan

The economic foundation of the agricultural sector not only generates profits for farmers but also brings about food safety and food security. The production of agricultural products mainly relies on the utilisation of the natural resources of land and water. Society will be impacted according to whether these natural resources are efficiently and properly used. The supply chain of a specific agricultural product affects every link “from farm to fork”. All these links are structured from the basic element of economic actions to prominent philanthropic actions. Thus, production activities within a specific agricultural sector involve various upstream and downstream services. They are much more diverse and complicated in the implementation of CSR in the agricultural sector.
The image of farmers and farm operations is significantly improved through the exercise of CSR via the implementation of friendly agriculture and the development of sustainable agriculture in Europe [17,23]. The seeds and transportation costs of sugarcane farmers are subsidised by corporates to maintain the farmers’ incomes and mitigate poverty in Kenya [24]. Less pesticide use is an important part of olive growing in Italy. This could be deemed to be a regular practise in olive growing. It could also be regarded as one of the best CSR practices. Less pesticide use passes on to customers the impression that farmers are voluntarily protecting the ecology and the environment [25]. Although the implementation of CSR for a corporate might not have a direct positive impact on the corporate’s profit, it is, however, the value of CSR that lives up to its improvement of the economy in rural areas [26].
The implementation of CSR in Taiwan is just like that in other countries. Taiwan’s CommonWealth magazine first brought up the concept of CSR in 1994. It was later followed by the corporate commitment, social participation, environmental development, corporate governance, and various international indicators that resulted in the CSR award in 2007 [27]. A CSR report has been formally required by the Taiwan Stock Exchange since 2014 for those corporations with capital of more than TWD 1 billion, equivalent to USD 0.34 billion at the USD to TWD exchange rate of 1 to 30 [28]. Since then, both the listed companies and small and medium-sized enterprises have paid much attention to CSR and have focused largely on charity or public welfare. The main activities employed by all types of corporates are related to economic prosperity, social services, and sustainable environments [29]. Examples can be found in the economic development by Hitachi Appliances, the development of energy-saving, low-carbon consumption by Nanya Technology Corporation, and the educational learning platform provided by FarEasTone Telecommunications Corporation in Taiwan.

2.3. The Implementation of CSR in the Agricultural Sector in the World and in Taiwan

To comprehend the factors that affect consumers’ preferences and further determine the consumer’s WTP for CSR products, the TPB is an appropriate framework, which originated from the theory of reasoned action (TRA). The use of attitude and subjective norms in the TRA to predict personal behaviour does not mean that it does not account for factors beyond personal inclination. Thus, the factor of perceived behavioural control is brought into the TPB. Since then, the TPB has been widely used in all kinds of decision-making to explore the relationships among motivations originating from subjective norms and objective conditions, intention, and behaviour. Ajzen then laid out the relationship among these factors as shown in Figure 2 [30]. In the TPB, the factors of attitude, subjective norms, and perceived behavioural control will directly or indirectly influence the behavioural intention and/or the final behaviour.
Attitude has to do with whether a person likes or dislikes a specific object. There is a strong tendency to exhibit a specific behaviour when a person demonstrates a positive attitude towards a particular object. Because excessive putting of land out for pasture will cause environmental problems, chemical fertilisers are used on farmlands to increase the foodstuffs for cattle compared to using only natural grass. An analysis conducted by [31] in Brazil found that the more positive farmers’ attitudes were towards the use of foodstuffs on grassland, the higher the behavioural intention would be in relation to the amount of animal husbandry. The diversification of agricultural production is important to the development of rural areas. Senger et al. [32] discovered that part of the farmers’ diversification information was disseminated among families and friends in rural communities, and this, in turn, induced a stronger interest in extension programs. This, then, has become the driving force behind the diversification of agricultural production in Brazil.
A subjective norm refers to the pressure that an individual senses or experiences from other people and the surrounding environment. Other people might include parents, a spouse, relatives, colleagues, or peers, and the surrounding environment could refer to social impressions or public opinion. Such pressure will lead the individual to perform a specific action as expected. The stronger the subjective norm is, the greater the willingness to exhibit the specific behaviour. Wang et al. discovered that the subjective norm and attitude are essential factors in determining the willingness to purchase organic products in Kenya and in Tanzania [33].
Yanakittkul and Aungvaravong compared organic cultivation and traditional farming for rice in Thailand and found that the factors influencing the adoption of organic cultivation were mainly centred around the extension programmes promoted by the government, especially the reduction in environmental pollution and promotion of human health from organic cultivation [34]. A study by [35] explored the intention to change to organic farming in Ireland and found that it was mainly influenced by the other farmers. The financial subsidies provided by the government and technical assistance did not have any impact on such an intention. As for the perceived behavioural control, this was related to an individual’s cognition of whether an action could be successfully completed. The stronger the perceived behavioural control was, the greater the power of implementation would be.
The behavioural intention in deciding to exhibit a specific behaviour might be influenced by the factors of attitude, the subjective norm, and perceived behavioural control. The more likely and more positive the behavioural intention is, the higher the probability that a specific action or behaviour will be exhibited. The factors of attitude, the subjective norm, and perceived behavioural control will have an effect on the behaviour directly, and they can also influence each other before impacting the behaviour indirectly. A study conducted by [36] in six agricultural ecological zones located in Austria, France, Belgium, and Italy found that experts’ opinions have a significant impact on the farmers’ positive attitude toward organic farming in relation to the improvement of the natural environment and a reduction in soil erosion. This interrelationship was in turn found to have a positive effect on the adoption of organic farming.

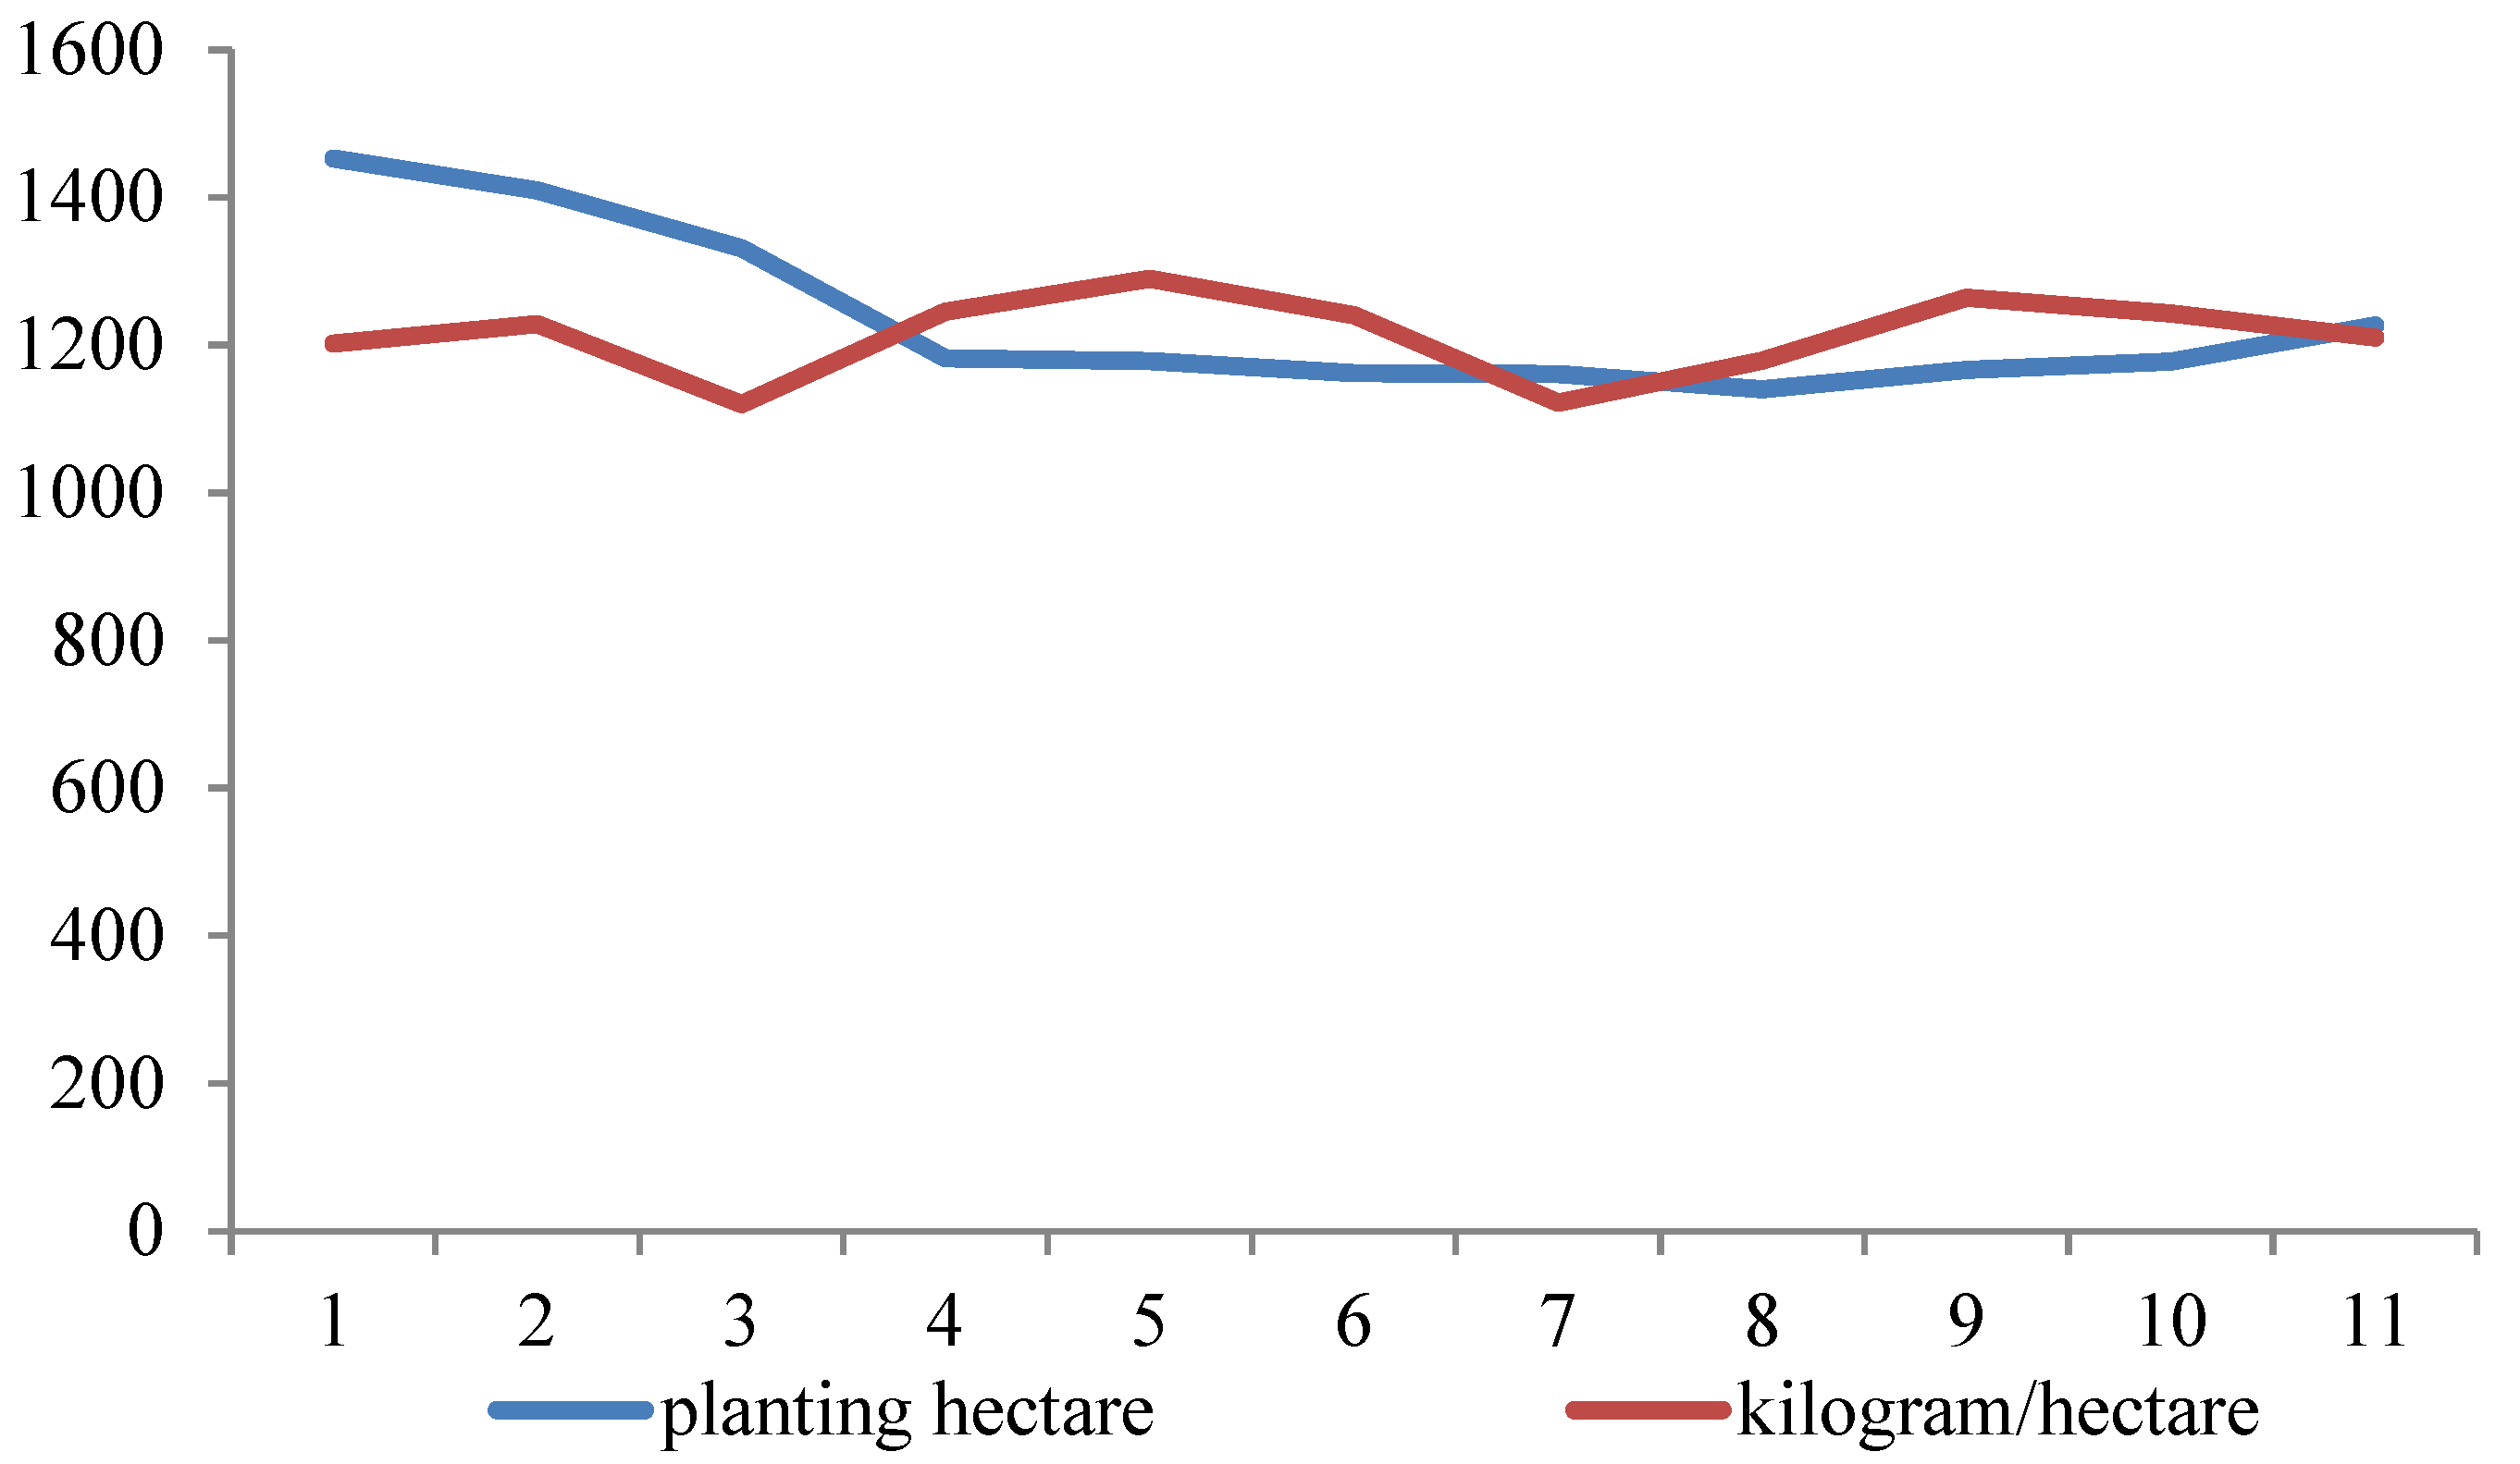
2.4. Tea Planting in Taiwan

The climate conditions and geographic location are suitable for growing tea in Taiwan. The quality of the tea is normally deemed to be high. This arises not only from the original quality of the tea plant, but also from the significant improvement in tea roasting technology. This has made tea famous since the 18th century, when the British found tea planting in Taiwan. The export of tea continues to cause tea to be one of the important agricultural products in Taiwan. The species of tea exported became quite diverse when tea roasting technologies for Indian Assam tea and Japanese green tea were introduced in the 19th century. The most recently available data show that tea exports accounted for 42.17% of total tea production in 2020 [37].
Tea in Taiwan is mainly planted in the mountain areas at an altitude of 1000 m. These areas are located in five different cities and counties. The most recently available data show that tea harvest acreages decreased from 14,530 hectares in 2010 to 12,270 hectares in 2020, respectively. The corresponding harvest production quantity, however, increased from 1202 kg per hectare in 2010 to 1210 kg per hectare in 2020 [37]. The changes in the total hectares harvested and the quantity produced per hectare during 2010–2020 in Taiwan are shown in Figure 3. This indicates that the efficiency of production has increased during the most recent decade. Among the cities and counties planting tea, the hectares planted that have grown the most during the past decade are those located in Hsinchu county. This county is one of the areas where tea is grown close to the capital of Taiwan and adjacent to the largest municipality in Taiwan.

3. Methodology and Model

3.1. Design of Questions for the Model of the TPB

To explore the impact of the factors of attitude, subjective norms, and perceived behavioural control on potential consumers regarding their purchase intention and/or purchase behaviour for tea planted under contract between corporates and farmers in the aboriginal tribal areas, it was considered that questions should be designed to reflect each factor. According to the definitions for each factor presented above, three questions were designed for the respondent to reveal what he/she knew and his/her view regarding a CSR-related tea. These questions are presented in Table 1 in the row on attitude. The subjective norm is related to the influence of others, such as friends, parents, one’s spouse, relatives, colleagues, neighbours, and peers. Under such effects or pressure, there might have been a positive or negative intention and/or behaviour expressed in a certain decision. Three questions presented in Table 1 are designed to address this factor.
The factor of perceived behavioural control is related to how the consumer perceives the difficulties related to a specific behaviour in terms of achieving certain objectives. Since CSR tea farming guarantees a quantity purchased and a price so that the farmers’ income can be ensured, there are some who believe that if farmers in the aboriginal tribal areas overly rely on tea production via CSR, such dependence might inevitably reduce the competitiveness of the farmers. The respondent may therefore not agree with tea farming between corporates and farmers in the aboriginal regions. On the contrary, if tea farming is deemed to be one of the behaviours related to CSR, the respondent might think tea planting is a good way of assisting farmers in maintaining stable farm incomes. Thus, four questions inspired by studies by [38,39] are designed for the case at hand and are listed in Table 1. The respondents replied to all of the questions listed in Table 1. Each question is designed to be answered using a 5-level Likert scale ranging from “very much disagree”, “disagree”, “no comment”, “agree”, to “very much agree”. A numerical scale from 1 to 5 is assigned to each selection, respectively.

3.2. Purchase Intention and Behaviour in Relation to Products from the CSR Project

The respondent might have experience of purchasing planted tea based on the contract between corporates and farmers in the aboriginal tribal areas. Regardless of who the respondent is, the factor of behavioural intention can be used to predict the probability of exhibiting a certain kind of behaviour. The higher the behavioural intention is, the higher the likelihood that a certain behaviour will be expressed. Two question-related statements, namely, “I feel that I assist farmers in the tribal areas when I purchase tea contracted by tribal farmers and corporates” and “Society expects cooperation through a contract between corporates and farmers in the aboriginal tribal areas”, were designed to portray this factor.
The purchase intention is expected to be consistent with the purchasing behaviour for those have purchasing experience and can be treated as a hypothetical market for those who will purchase in the future. An average price of 600 g of contractual tea in terms of weight in Taiwan is USD 66.67 (TWD 2000), which is used as a reference. The amounts for the higher prices are USD 67.33–USD 70.00; USD 70.67–USD 73.33; USD 74.00–USD 76.67; USD 77.33–USD 80.00; USD 80.67–USD 83.33; USD 84.09–USD 86.67 and the amounts for the lower prices are USD 63.33–USD 66; USD 60–USD 62.67; USD 56.67–USD 59.33; USD 53.33–USD 56; USD 50.00–USD 52.67; and USD 46.67–USD 49.33. All price levels and ranges in the questionnaire are shown in New Taiwan dollars. The above amounts are expressed at the USD: TWD exchange rate of 1:30.
There are 15 sets of higher price ranges, and each is higher than the reference one by 5%, ranging from 1–5% to 26–30%. Similarly, there are 15 sets of lower price ranges, and each is lower than the reference one by −5%, ranging from −1% to −5% and from −26% to −30%. Altogether, there are 225 different combinations. Orthogonality is employed to leave 15 sets of prices for all respondents. As a result, each respondent faces a set of prices, one being the reference price, another two ranges of higher prices, and the other two ranges of lower prices in the questionnaire. That is, 26 respondents replied to each set of prices.

3.3. Sociodemographic Variables of the Respondents

The purchase intention and/or behaviour might be affected by those factors in the TPB. Other sociodemographic variables, such as gender, age, educational level, type of occupation, location of residence, and income of the respondent, might also have an impact on the purchase intention and/or behaviour. These sociodemographic variables, along with those factors in the TPB, are used simultaneously to explore their impact on the respondent’s purchase intention or behaviour for tea grown in relation to the CSR projects.

3.4. Sampling and Survey

Sampling is conducted in the capital of Taiwan, Taipei, and the largest municipality, New Taipei. These two cities account for 28.15% of the total population in Taiwan [40]. The number of observations is determined by Equation (1) as suggested by [41]. In Equation (1), N is the number of observations in the sample, P is the proportion with designated attributes, z ( α 2 ) is the standard error associated with the chosen level of confidence, and e is the acceptable sampling error. At the 95% confidence level (1 − α = 0.95), the sampling error is less than 5%, the standardized value is 1.96, and the size of sample computed using (1) is equivalent to 384.
N = P ( 1 P ) [ z ( α 2 ) e ] 2 ,
This study consists of a sample of 390 questionnaires. There are 41 districts in these two cities. The allotment of these 390 questionnaires among these districts is based on the share of households in each district in relation to the total number of households in these two cities. Accordingly, the total number of questionnaires distributed in Taipei accounts for about 40% and New Taipei accounts for 60% of the sample. Before a formal survey was conducted, a pre-test of 30 observations was completed. The feedback from the pre-test was used for questionnaire modification and survey arrangement. The survey was conducted through personal interviews from March to May 2021, right before the start of the outbreak of the COVID-19 pandemic in Taiwan. There were 384 effective questionnaires that could be used for further analysis. The ineffective questionnaires lacked replies on the WTP.

4. Model Specification and Analysis of Results

4.1. Mean Values for all Related Variables

As with the purchase intention for tea planted by aboriginal farmers under contract with corporates, five different levels, namely, “very unwilling”, “unwilling”, “no comment”, “willing”, and “very willing”, were assigned values of 1, 2, 3, 4, and 5 to represent different levels of purchase intention. The respondents were then asked to reveal their WTP tea if there was an opportunity. A payment card type price range was offered to each respondent. Each respondent selected one of the price ranges offered, and the mid-value of each range was used as his/her WTP for every 600 g of tea. The mean and the standard deviation of the above variables and for all other sociodemographic variables are listed in Table 2.
It can be seen from Table 2 that the purchase intention for tea purchases contracted between corporates and farmers in aboriginal tribal areas was on average “willing”. This indicated that this type of tea had a high probability of being in the respondent’s choice list as long as the respondents knew the source of the tea. The average WTP for this type of tea was about USD 58 per 600 g. As with the mean values of the sociodemographic variables, the years of education was 15.23 and this was about the level of a junior in college [42,43].
In terms of occupation, more than half of the respondents were in the service sector, including the medical care, finance, catering, and transportation sectors accounting for 59.84%. The manufacturing sector had a share of 13.13%; the public sector, which consisted of being a civil servant, all levels of teachers, and being in the military, had a share of 6.30%; the agricultural sector 0.78%; and respondents whose occupation was not in any of the categories listed in the questionnaire, including housekeepers, retired persons, or people changing jobs, accounted for the final 19.95%. The average annual income, including rent, interest revenue, and all kinds of investment revenue, was about USD 30,370. This mean value was close to the personal average annual incomes from all sources for these two cities [44,45].

4.2. Estimation of Purchase Intention and WTP for Tea Grown under CSR

According to the framework of the TPB, the empirical analysis first involved estimating the change in probability for a rising or falling purchase intention and further finding the factors that had a significant impact on the WTP for tea grown under the CSR project.

4.2.1. Analysis of the Purchase Intention for Contractual Tea

Before proceeding with the estimation, a test of the correlation among all independent variables is essential to avoid possible multicollinearity. Variance inflation factors (VIFs) are much more robust than testing for simple correlation between any pair of independent variables. The VIF tests for all the independent variables At, Su, Pe, Cit, Gen, Age, Mar, Edu, Gov, Agr, Man, Ser, and Inc give rise to the following results: 1.56, 1.60, 1.65, 1.03, 1.04, 1.84, 1.45, 1.49, 1.32, 1.06, 1.56, 1.72, and 1.14, respectively. None of the VIFs is greater than 10. Thus, there is no multicollinearity among the independent variables.
Since there are five different levels of purchase intention, an ordered probit model was adopted to analyse this type of data [46]. The five levels of purchase intention observed were represented by and are an unobservable latent variable. The answers for the five levels of purchase intention are then shown as (2):
Y i = 1 Y i * μ 1 Y i = 2 μ 1 < Y i * μ 2 Y i = 3 μ 2 < Y i * μ 3 Y i = 4 μ 3 < Y i * μ 4 Y i = 5 μ 4 < Y i * μ 5 ,
In Equation (2), different μs are thresholds used to divide different levels of purchase intention. If X is a vector of explanatory variables that have a potential impact on the probability of purchase intention, β 0 is the intercept term, the vector β refers to the coefficients to be estimated and ε is the error term, the general form can be expressed as (3) below:
Y i * = β 0 + β X i + ε i , ε i : N ( 0 , 1 ) ,
All the explanatory variables in the estimation of the purchase intention are those listed in Table 2. The model specification in the estimation is as in (4) shown below:
Y i = β 0 + β 1 A t i + β 2 S u i + β 3 P e i + β 4 C i t i + β 5 G e n i + β 6 A g e i + β 7 M a r i + β 8 E d u i + β 9 G o v i + β 10 A g r i + β 11 M a n i + β 12 S e r i + β 13 I n c i + ε i , 1 , 2 , , 384 .
It is observed from Table 3 that attitude ( A t ), the subjective norm ( S u ), and perceived behavioural control ( P e ) are all significant. This indicates that the respondent understands contractual tea farming, the influence of other people and the environment, and the assistance provided by corporates to a specific group of people, i.e., the tribal tea farmers, all of which have a positive impact on the purchase intention. For all other demographic variables, educational level ( E d u ) is close to being significant and has a positive impact on the purchase intention. Similarly, a respondent who is employed in the service sector ( S e r ) is also close to being significant but has a negative impact on the purchase intention.
The marginal effect for different levels of selection is computed as:
Pr ( Y i * = 1 ) = ϕ ( μ 1 < β X ) Pr ( Y i * = 2 ) = ϕ ( μ 2 β X ) ϕ ( μ 1 β X ) Pr ( Y i * = 3 ) = ϕ ( μ 3 β X ) ϕ ( μ 2 β X ) Pr ( Y i * = 4 ) = ϕ ( μ 4 β X ) ϕ ( μ 3 β X ) Pr ( Y i * = 5 ) = ϕ ( μ 5 β X ) ϕ ( μ 4 β X ) ,
In Equation (5), ϕ is the cumulative density function. Under the thresholds μ 1 , μ 2 , μ 3 , μ 4 , and μ 5 , the maximum likelihood estimation method is employed for the estimation of all β s. According to the estimation results, the marginal effect will then be computed for attitude (At), the subjective norm (Su), and perceived behavioural control (Pe) for five different levels, namely, “very willing”, “willing”, “no comment”, “unwilling”, and “very unwilling” as shown in Table 4.
From these results, we are able to know the impact of each factor. At, Su, and Pe, as stated above, change from one level to the other level. It is known that with the enhancement of the subjective norm ( S u ) the probability of selecting “willing” will increase by 0.0464 and the probability will increase by 0.0421 for selecting “very willing”. The results are similar for the factors of attitude ( A t ) and perceived behavioural control ( P e ). The probabilities for selecting “willing” and “very willing” are all positive. For these three essential factors in the TPB, the change in the marginal effect from “very willing” to “very unwilling” is not moving consistently in one direction, i.e., it is not consistently increasing or decreasing. The change in the marginal effect is divided by “no comment” into two change trends. The marginal effect decreases on the “willing” side. Similarly, it also increases on the “unwilling” side. This indicates that when people have a positive view towards attitudes, subjective norms, or perceived behavioural control, their purchase intention increases, moving from “willing” to “very willing”. On the contrary, when people have negative views towards these three factors, their purchase intentions increase, moving from “unwilling” to “very unwilling”.

4.2.2. Estimation Results of WTP for Tea with Different Percentiles under the CSR Project

A QR is employed to estimate the WTP for tea under the CSR project. The advantage of using QR is that it can relax the assumption of a normal distribution, which is usually not met. It is thus more flexible and capable when observing different marginal effects of a change in a specific explanatory variable on a certain level of WTP. It thus provides more information for the decision-makers. Before the estimation of the quantile, the VIF test is also conducted for all explanatory variables, including the predicted one from the previous estimation, xb. The values of all VIFs are less than 10. Thus, no multicollinearity exists in the quantile estimation.
The general specification of QR is expressed as (6):
W T P i = γ θ Z i + V θ i ,
In Equation (6), W T P i is the amount that denotes respondent i’s willingness to pay for the contractual tea. θ is a quantile and ranges between 0~1. γ θ is a vector of coefficients to be estimated and V θ is a random error for quantile θ . Z is a vector of all explanatory variables for WTP. All these explanatory variables are the same as those used in the estimation of purchase intention in (4) in addition to one more explanatory variable, a predicted variable, xb, computed from (7):
Y i * ^ = β 0 ^ + β 1 ^ A t i + β 2 ^ S u i + β 3 ^ P e i + β 4 ^ C i t i + β 5 ^ G e n i + β 6 ^ A g e i + β 7 ^ M a r i + β 8 ^ E d u i + β 9 ^ G o v i + β 10 ^ A g r i + β 11 ^ M a n i + β 12 ^ S e r i + β 13 ^ I n c i , 1 , 2 , , 384 . ,
Thus, the specification for WTP under different quantiles is as shown in (8):
W T P i = γ θ 0 + γ θ 1 A t i + γ θ 2 S u i + γ θ 3 P e i + γ θ 4 C i t i + γ θ 5 G e n i + γ θ 6 A g e i + γ θ 7 M a r i + γ θ 8 E d u i + γ θ 9 G o v i + γ θ 10 A g r i + γ θ 11 M a n i + γ θ 12 S e r i + γ θ 13 I n c i + γ θ 14 x b i + V θ i , 1 , 2 , , 384 . ,
Under the specification of (8), the estimation is performed using (9):
min γ [ W T P i γ θ Z i θ | W T P i γ θ Z i | + W T P i < γ θ Z i ( 1 θ ) | W T P i γ θ Z i | ] ,
The quantile regression is accomplished for the 10th, 25th, 50th, 75th, and 90th percentiles, respectively. The results shown in Table 5 indicate that the attitude (At) factor is significant at the low 5th and 25th percentiles for WTP. This means that respondents have only a low financial capability to pay more for the tea under the CSR project when they learn more about the source of origin and its quality once they have the opportunity to do so. The subjective norm (Su) factor is significant at all 5th percentiles. This indicates that respondents who pay for any level of WTP for the contractual tea are in general easily influenced by people or the surrounding media, such as friends, neighbours, colleagues, or relatives. On the contrary, perceived behavioural control (Pe) has no significant impact on the WTP for contractual tea.
Among all the sociodemographic variables, gender has a significant impact on most of the WTP percentiles. The results show that the WTP among males is higher than among females. This might be a reflection that males consume tea more often than females. Thus, males are willing to pay a higher price for contractual tea for any level of tea price. As with the respondent’s age, although younger respondents easily adapt to tea with multiple purposes through their WTP, however, the younger the respondents are, the less income they have and the lower their WTP will be. This is consistent with the expectation that respondents’ incomes have a dominant and significant impact for respondents with higher WTP at the 50th, 75th, and 90th percentiles.

4.3. CSR Value of Tea Grown under Contract between Corporates and Aboriginal Farmers

The corresponding value of CSR evaluated by potential consumers at the 10th, 25th, 50th, 75th, and 90th percentiles is computed from their average mean WTP at all levels shown in Table 6 accordingly. The WTP for the 10th percentile is USD 46 per 600 g and is consistently increasing to the 90th percentile with a WTP of USD 70, but the increase in the WTP is not at an increasing rate. That is, the CSR value for those who have the least concern for CSR is about USD 46 and for those who have the highest concern for CSR is about USD 70 per 600 g of tea. The difference between these two is USD 24 per 600 g. The average WTP for all percentiles is USD 53 per 600 g and this value is close to the WTP at the 50th percentile. This indicates that the estimation of the sample via an overall mean regression will not enable us to observe different WTP values for respondents who are influenced by different factors in the TPB framework. This, then, will not allow us to find an appropriate promotion strategy for different groups of potential consumers.
It is observed that the value of WTP for tea is a reflection of the (potential) consumers’ evaluation of their WTPs for tea planted via a contractual agreement between the corporates and aboriginal farmers. The results show that different respondents have different WTPs for tea. This indicates that the values of CSR are not equally important for all respondents. The subjective norm that the respondent perceives regarding the information delivered by the media or news and purchase experiences suggested by friends, relatives, neighbours, or colleagues has a positive and significant impact on WTP. The respondent’s attitude toward the quality guarantee and the source of origin of the contractual tea have a positive impact on WTP at the 5th and 25th percentiles, i.e., the relatively lower WTP. On the contrary, potential consumers with a higher WTP for tea, i.e., WTP at the 75th and 90th percentiles, are mainly affected by their income. A quality guarantee or the source of origin of the tea are not a concern in their purchasing decision. The overall results analysed above demonstrate that it is effective to promote tea planted by corporates and farmers in the aboriginal tribal regions through the media, advertisements, or news for all types of potential consumers as it will stimulate their purchase intention and/or purchase behaviour for all potential consumers who have different levels of WTP for tea. However, it is essential that different information be targeted at different potential consumers if corporates consider attaching importance to CSR in society. The information regarding the quality guarantee and source of origin of the tea should be delivered to the younger and male groups of potential consumers with a relatively low value of WTP as they pay close attention to these aspects. On the other hand, the information on the benefits to farmers within the aboriginal tribes should be highlighted for the elderly and male potential consumers with higher WTP as their incomes will dominate their final purchasing behaviour.
The total value of CSR for contractual tea between corporates and aboriginal farmers can thus be computed from the previous WTP values for each percentile to observe how people evaluate CSR if all tea farms are cultivated and managed in an economic and philanthropic manner. The most recently available data indicates that the average amount of tea production per hectare was 1210 kg in 2020 [37]. The value of CSR per hectare for each percentile is then presented in the last column of Table 6. It can be seen that the value of CSR per hectare of tea between corporates and aboriginal farmers ranges between USD 92,232 and USD 141,761 and the overall average CSR value per hectare is USD 118,035. The corporates can calculate the total hectares of tea trees to be grown and engage with farmers in the aboriginal tribal areas.

5. Conclusions

This study uses the theory of planned behaviour (TPB) to evaluate the corporate social responsibility (CSR) for tea tree planting between corporates and farmers in the aboriginal tribal areas. An ordered probit model and a quantile regression model are employed to explore the major factors in the TPB with regard to attitude, subjective norms, and perceived behavioural control and their impact on potential consumers’ purchase intentions to grow tea under the CSR project and further to evaluate the willingness to pay to grow those tea trees.
The more positive the attitude toward the guarantee of quality and the source of origin of the tea is, the easier it is to be influenced by others, and the higher the perceived behavioural control regarding the benefits of CSR contracts between corporates and farmers in the aboriginal tribal areas, the higher the purchase intention for all potential consumers will be. These three factors all have significant impacts on the purchase intention of all potential consumers. Such impacts are not felt for sociodemographic factors, such as gender, age, different types of occupation, and even income. These three factors, along with all sociodemographic factors and the predicted purchase intention, are further used to estimate their impact on the WTP for tea. To account for the quantity of tea produced per hectare, the value of CSR is then computed per hectare. The corresponding highest and lowest values of CSR per hectare are USD 92,232 and USD 141,762, respectively. The overall average value of CSR per hectare is USD 118,035. These values represent the specific amount that a corporate can potentially contribute to society when contractual tea is the practical outcome of the cooperation between corporates and farmers in aboriginal tribal areas.
The subjective norm of influence from others has a significant and positive impact on all levels of WTP. Potential consumers with high incomes will have a higher WTP to purchase tea. The benefits of contractual farming for farmers, such as the stability of farm income and employment, and contractual products for consumers, such as a guarantee of quality, are not within the consideration of potential consumers with higher income levels. This predicted purchase intention undeniably becomes the dominant factor for potential consumers with relatively high WTP. However, potential consumers with relatively low WTP attach importance to the product’s quality and source of origin that the contractual tea guarantees. Since these factors have different impacts and influences on consumers with different income levels, this indicates the promotion of CSR should carry different information and/or through different promotion channels for consumers with different income levels.
The implications of such results indicate that the guaranteed quality of tea through the cooperation between corporate and aboriginal farmers via a project of CSR will attract low-income consumers. That is, consumers with low income levels have more consideration toward economic and/or legal responsibility of CSR. Guaranteed CSR quality tea can then play an important role as being a driving force to make tea from such a project a popular and common product. On the other hand, consumers with relatively high income levels are more concerned about the incomes or working conditions of the producers, i.e., farmers in the aboriginal tribes in the case at hand. Thus, the promotion of tea from the CSR project should emphasise the precise support for aboriginal farmers for consumers with high income levels, as they consider philanthropic responsibility and/or ethical responsibility essential for the CSR accomplishment.
This study makes the first attempt to evaluate the monetary value of CSR for economic responsibility, legal responsibility, ethical responsibility, and philanthropic responsibility as a whole, these components are deemed to be important components of CSR in the existing literature. The specifics of responsibility components covered in this study are reflected by the product safety, economic security for contractual farmers, protection of the environment, and the conservation of ecology. The results shown in this study reveal an overall CSR value for all components. That is, this study is limited to evaluating the monetary value for all components, and this leaves room for future study with an effort to evaluate the monetary value for each CSR component with alternative designs of the questionnaire to determine the CSR value for individual components. As commanding the monetary value for economic, legal, ethical, and philanthropic responsibility components will provide more information for corporates to promote different CSR projects to different groups of consumer targets or give instructions for corporates to prioritise different CSR projects if the corporates’ resources are limited. The allotment of the corporate’s resources for its sustainable operation relies heavily on the specific measurement. The monetary value of CSR intends to play an equivalent role as all common-use monetary financial indicators in the corporation.

Author Contributions

Conceptualization, C.-H.L., J.-L.L., P.-I.W. and S.-L.Y.; methodology, J.-L.L. and P.-I.W.; software, C.-H.L. and J.-L.L.; validation, C.-H.L., J.-L.L., P.-I.W. and S.-L.Y.; formal analysis, C.-H.L., J.-L.L., P.-I.W. and S.-L.Y.; investigation, C.-H.L., J.-L.L., P.-I.W. and S.-L.Y.; resources, C.-H.L. and P.-I.W.; data curation, C.-H.L. and J.-L.L.; writing—original draft preparation, C.-H.L. and P.-I.W.; writing—review and editing, C.-H.L., J.-L.L. and S.-L.Y.; visualization, C.-H.L. and S.-L.Y.; supervision, P.-I.W.; project administration, P.-I.W. All authors have read and agreed to the published version of the manuscript.

Funding

This research received no external funding.

Institutional Review Board Statement

Not applicable.

Informed Consent Statement

Not applicable.

Data Availability Statement

Data are not publicly available. The data can be obtained on the request of the authors.

Acknowledgments

The authors sincerely appreciate Ching-Ren Chiu for the comments regarding the methods designed of this study.

Conflicts of Interest

The authors declare no conflict of interest.

References

  1. Bowen, H.R. Social Responsibilities of the Businessman; Harper & Row: New York, NY, USA, 1953. [Google Scholar]
  2. Carroll, A.B. A Three-Dimensional Conceptual Model of Corporate Performance. Acad. Manag. Rev. 1979, 4, 497–505. [Google Scholar] [CrossRef]
  3. Carroll, A.B. The Pyramid of Corporate Social Responsibility: Toward the Moral Management of Organizational Stakeholders. Bus. Horiz. 1991, 34, 39–48. [Google Scholar] [CrossRef]
  4. Kloppers, E.; Fourie, L. CSR Communication in a South African Agricultural Company. S. Afr. J. Commun. Theor. Res. 2014, 40, 305–322. [Google Scholar] [CrossRef]
  5. Shahzad, M.; Qu, Y.; Javed, S.A.; Zafar, A.U.; Rehman, S.U. Relation of Environment Sustainability to CSR and Green Innovation: A Case of Pakistani Manufacturing Industry. J. Clean. Prod. 2019, 253, 119938. [Google Scholar] [CrossRef]
  6. Keraita, B.; Drechsel, P. Consumer Perceptions of Fruit and Vegetable Quality: Certification and Options for Safeguarding Public Health in West Africa. Int. Water Manag. Inst. 2015, 32, 164. [Google Scholar] [CrossRef]
  7. Bardos, K.S.; Ertugrul, M.; Gao, L.S. Corporate Social Responsibility, Product Market Perception, and Firm Value. J. Corp. Financ. 2020, 62, 101588. [Google Scholar] [CrossRef]
  8. Basu, D.; Basu, G. Corporate Social Responsibility Program of PepsiCo India: A Unique Agro-Based CSR Model. Acta Hortic. 2011, 895, 45–49. [Google Scholar] [CrossRef]
  9. Herath, C.S.; Wijekoon, R. Study on Attitudes and Perceptions of Organic and Non-Organic Coconut Growers towards Organic Coconut Farming. IDESIA (Chile) Mayo-Agosto 2013, 31, 5–14. [Google Scholar] [CrossRef]
  10. Marquina, P.; Morales, C.E. The Influence of CSR on Purchasing Behaviour in Peru and Spain. Int. Mark. Rev. 2012, 29, 299–312. [Google Scholar] [CrossRef]
  11. De Magistris, T.; Del Giudice, T.; Verneau, F. The Effect of Information on Willingness to Pay for Canned Tuna Fish with Different Corporate Social Responsibility (CSR) Certification: A Pilot Study. J. Consum. Aff. 2015, 49, 457–471. [Google Scholar] [CrossRef] [Green Version]
  12. Lerro, M.; Caracciolo, F.; Vecchio, R.; Cembalo, L. Consumer’s Side of Corporate Social Responsibility: A Nonhypothetical Study. J. Consum. Aff. 2018, 52, 689–710. [Google Scholar] [CrossRef]
  13. Lerro, M.; Vecchio, R.; Caracciolo, F.; Pascucci, S.; Cembalo, L. Consumers’ Heterogeneous Preferences for Corporate Social Responsibility in the Food Industry. Corp. Soc. Responsib. Environ. Manag. 2018, 25, 1050–1061. [Google Scholar] [CrossRef]
  14. Luhmann, H.; Theuvsen, L. Corporate Social Responsibility in Agribusiness: Literature Review and Future Research Directions. J. Agric. Environ. Ethic 2016, 29, 673–696. [Google Scholar] [CrossRef]
  15. Heald, M. The Social Responsibilities of Business: Company and Community, 1900–1960; Case Western Reserve University Press: Cleveland, OH, USA, 1970. [Google Scholar]
  16. Schrempf-Stirling, J.; Palazzo, G. Upstream Corporate Social Responsibility: The Evolution Form Contract Responsibility to Full Producer Responsibility. Bus. Soc. 2016, 55, 491–527. [Google Scholar] [CrossRef]
  17. Luhmann, H.; Theuvsen, L. Corporate Social Responsibility: Exploring a Framework for the Agribusiness Sector. J. Agric. Environ. Ethic 2017, 30, 241–253. [Google Scholar] [CrossRef]
  18. Carroll, A.B. Corporate Social Responsibility Evolution of a Definitional Construct. Bus. Soc. 1999, 38, 268–295. [Google Scholar] [CrossRef]
  19. Faizrakhmanov, D.; Zakirova, A.; Klychova, G.; Yusupova, A.; Klychova, A. Formation and Disclosure of Information on Social Responsibility of Agribusiness Enterprises. Proc. E3S Web Conf. 2019, 91, 06004. [Google Scholar] [CrossRef]
  20. Beltratti, A. The Complementarity between Corporate Governance and Corporate Social Responsibility. Geneva Pract. Risk Insur.-Issues Pract. 2005, 30, 373–386. [Google Scholar] [CrossRef] [Green Version]
  21. Jamali, D.A. Stakeholder Approach to Corporate Social Responsibility: A Fresh Perspective into Theory and Practice. J. Bus. Ethics 2008, 82, 213–231. [Google Scholar] [CrossRef]
  22. Kanji, G.K.; Chopra, P.K. Corporate Social Responsibility in a Global Economy. Total Qual. Manag. 2010, 21, 119–143. [Google Scholar] [CrossRef]
  23. Mazur-Wierzbicka, E. The Application of Corporate Social Responsibility in European Agriculture. J. Misc. Geogr. Reg. Stud. Dev. 2015, 19, 19–23. [Google Scholar] [CrossRef] [Green Version]
  24. Waswa, F.; Netondo, G.; Maina, L.; Naisiko, T.; Wangamati, J. Potential of Corporate Social Responsibility for Poverty Alleviation among Contract Sugarcane Farmers in the Nzoia Sugarbelt, Western Kenya. J. Agric. Environ. Ethic 2009, 22, 463–475. [Google Scholar] [CrossRef]
  25. Giomi, T.; Runhaar, P.; Runhaar, H. Reducing Agrochemical Use for Nature Conservation by ltalian Olive Farmers: An Evaluation of Public and Private Governance Strategies. Int. J. Agicr. Sustain. 2018, 16, 94–105. [Google Scholar] [CrossRef] [Green Version]
  26. Sarmila, M.S.; Zaimah, R.; Lyndon, N.; Hussain, M.Y.; Awang, A.H. Local Community Economic Wellbeing through CSR Project. Mediterr. J. Soc. Sci. 2015, 6, S3. [Google Scholar] [CrossRef] [Green Version]
  27. CommonWealth Magazine. 2019 CSR Award: Generalization Unjustice? The Empowerment for the Youth of CommonWealth CSR Award in 2019. Available online: https://www.cw.com.tw/article/article.action?id=5096612 (accessed on 20 March 2022).
  28. Taiwan Stock Exchange. Taiwan Stock Exchange Corporation Rules Governing the Preparation and Filing of Sustainability Reports by TWSE Listed Companies. 2014. Available online: https://cgc.twse.com.tw/pressReleases/promoteNewsArticleCh/116 (accessed on 15 February 2022).
  29. Corporate Governance Center, Taiwan Stock Exchange. Corporate Social Responsibility. 2018. Available online: https://cgc.twse.com.tw/front/responsibility (accessed on 10 January 2022).
  30. Ajzen, I. The Theory of Planned Behavior. Organ. Behav. Hum. Dec. 1991, 50, 179–211. [Google Scholar] [CrossRef]
  31. Borges, J.A.R.; Tauer, L.W.; Lansink, A.G.J.M.O. Using the Theory of Planned Behavior to Identify Key Beliefs Underlying Brazilian Cattle Farmers’ Intention to Use Improved Natural Grassland: A MIMIC Modelling Approach. Land Use Policy 2016, 55, 193–203. [Google Scholar] [CrossRef]
  32. Senger, I.; Borges, J.A.R.; Machado, J.A.D. Using the Theory of Planned Behavior to Understand the Intention of Small Farmers in Diversifying Their Agricultural Production. J. Rural Stud. 2017, 49, 32–40. [Google Scholar] [CrossRef]
  33. Wang, X.; Pacho, F.; Liu, J.; Kajungiro, R. Factors Influencing Organic Food Purchase Intention in Developing Countries and the Moderating Role of Knowledge. Sustainability 2019, 11, 209. [Google Scholar] [CrossRef] [Green Version]
  34. Yanakittkul, P.; Aungvaravong, C. A Model of Farmers Intentions towards Organic Farming: A Case Study on Rice Farming in Thailand. Heliyon 2020, 6, e03039. [Google Scholar] [CrossRef] [Green Version]
  35. Läpple, D.; Kelley, H. Understanding the Uptake of Organic Farming: Accounting for Heterogeneities among Irish Farmers. Ecol. Econ. 2013, 88, 11–19. [Google Scholar] [CrossRef]
  36. Hijbeek, R.; Pronk, A.; van Ittersum, M.; Verhagen, A.; Ruysschaert, G.; Bijttebier, J.; Zavattaro, L.; Bechini, L.; Schlatter, N.; Berge, H.T. Use of Organic Inputs by Arable Farmers in Six Agro-Ecological Zones Across Europe: Drivers and Barriers. Agric. Ecosyst. Environ. 2019, 275, 42–53. [Google Scholar] [CrossRef]
  37. Council of Agriculture, Executive Yuan, Taiwan. Statistics Yearbook 2020. 2021. Available online: https://agrstat.coa.gov.tw/sdweb/public/book/Book.aspx (accessed on 12 February 2022).
  38. Micha, E.; Areal, F.J.; Tranter, R.B.; Bailey, A.P. Uptake of Agri-Environmental Schemes in Less-Favoured Areas of Greece: The Role of Corruption and Farmers’ Responses to the Financial. Land Use Policy 2015, 48, 144–157. [Google Scholar] [CrossRef]
  39. Poppenborg, P.; Koellner, T. Do Attitudes toward Ecosystem Services Determine Agricultural Land Use Practices?An Analysis of Farmers’ Decision-Making in a South Korean Watershed. Land Use Policy 2013, 31, 422–429. [Google Scholar] [CrossRef]
  40. National Statistics, Republic of China (Taiwan). 2020 Population and Housing Census. 2021. Available online: https://statdb.dgbas.gov.tw/pxweb/Dialog/View.asp?ti=&path=../OneSection/temp&lang=9&strList=L&ma=Po0101A1AT001&ViewplusIncHeader=0 (accessed on 15 January 2022).
  41. Cochran, W.G. Sampling Techniques, 3rd ed.; Wiley: New York, NY, USA, 1977. [Google Scholar]
  42. Department of Civil Affairs, New Taipei City Government. Statistics: Educational Levels. 2021. Available online: https://www.ca.ntpc.gov.tw/home.jsp (accessed on 8 January 2022).
  43. Department of Civil Affairs, Taipei City Government. 2020: The Population Census Data of Each District by Age above 15 and Educational Level Groupsstatistics. 2021. Available online: https://ca.gov.taipei/News_Content.aspx?n=8693DC9620A1AABF&sms=D19E9582624D83CB&s=49EE949EED38EF73 (accessed on 12 March 2022).
  44. Budget, Accounting and Statistics Department, New Taipei City Government. Report on the Survey of Family Income and Expenditure, New Taipei City. 2019. Available online: https://www.bas.ntpc.gov.tw/home.jsp?id=2b0baf69708768d0&act=be4f48068b2b0031&dataserno=e0fb88c654849dd68b417115a2c95c96 (accessed on 7 February 2022).
  45. Department of Budget, Accounting & Statistics, Taipei City Government. Report on the Family Income and Expenditure Survey in Taipei. 2021. Available online: https://www-ws.gov.taipei/Download.ashx?u=LzAwMS9VcGxvYWQvMzY3L3JlbGZpbGUvNDU2NzIvODQ3MTQxNy81NzJjZWNkMy04MTBjLTQ1NjUtOWM2Mi05NzBmYmRjNjE4NmMucGRm&n=MTA55bm06Ie65YyX5biC5a625bqt5pS25pSv6Kiq5ZWP6Kq%2f5p%2bl5aCx5ZGKLnBkZg%3d%3d&icon=.pdf (accessed on 10 January 2022).
  46. McKelvey, R.D.; Zavoina, W. A statistical model for the analysis of ordinal level dependent variables. J. Math. Sociol. 1975, 4, 103–120. [Google Scholar] [CrossRef]
Figure 1. The components of CSR and their hierarchical relationship. Source: Arranged from Carroll [2] and Carroll [3].
Sustainability 14 08145 g001
Figure 2. The framework of the theory of planned behaviour. Source: This figure is modified from [30].
Sustainability 14 08145 g002
Figure 3. The changes in hectares of tea harvested and production per hectare in Taiwan. Source: [37].
Sustainability 14 08145 g003
Table 1. Statements underlying questions for each factor in the TPB.
FactorQuestion
Attitude
  • I know what contractual tea is.
  • I think tea that is planted based on a contract between corporates and aboriginal tribes has a guaranteed quality.
  • I think the contractual tea ensures the source of origin for consumers.
Subjective norm
  • I will purchase tea planted based on a contract between corporates and aboriginal tribes from seeing the media advertisement.
  • I will purchase tea planted based on a contract between corporates and aboriginal tribes as recommended by my friends, neighbours, or relatives.
  • I will purchase tea labelled with information regarding the contract between corporates and farmers in aboriginal tribal areas.
Perceived
behavioural control
  • It is a demonstration of social responsibility for corporates to sign contracts with farmers in aboriginal tribal areas.
  • It will not affect the competitiveness of tea farmers in aboriginal tribal areas when they engage in contractual farming with corporates.
  • The employment of farmers in the tribal areas will be increased if there are contracts between tribal farmers and corporates.
  • The contractual tea farming between tribal farmers and corporates conforms to the enhancement of environmental protection and the conservation of ecology.
Behavioural
intention
  • I feel that I assist farmers in the tribal areas when I purchase tea contracted by farmers in the aboriginal tribes and corporates.
  • Society expects cooperation through contracts between corporates and farmers in the aboriginal tribal areas.
Table 2. Variables used in the estimations and their definitions and mean values.
VariableDefinitionMeanStandard
Deviation
Dependent Variables
WbIntention to purchase high mountain tea contracted between
corporates and farmers in aboriginal tribal areas
3.84240.6970
WpWillingness to pay for the contractual tea (USD/600 g)58.264311.70
Explanatory Variables
AtAttitude
Total score from three attitude questions in the questionnaire
10.54871.9909
SuSubjective norm
Total score from three subjective norm questions
in the questionnaire
11.27022.0643
PePerceived behavioural control
Total score from four perceived behavioural control questions in the questionnaire
14.28122.1771
CitDummy variable for the city where the respondent lives
Cit = 1 if lives in Taipei, Cit = 0 otherwise
0.41480.4932
GenDummy variable for the gender of the respondent
Gen = 1 if the respondent is male, Gen = 0 otherwise
0.45130.4982
AgeAge of the respondent (years)43.973812.1502
MarDummy variable for the respondent’s marriage status
Mar = 1 if married, Mar = 0 otherwise
0.49070.5005
EduYears of school education (years)15.23252.6666
GovDummy variable
Gov = 1 if respondent is a civil servant, teacher, in the military,
Gov = 0 otherwise
0.06300.2432
AgrDummy variable
Agr = 1 if respondent serves in the agricultural sector,
Agr = 0 otherwise
0.00780.0884
ManDummy variable
Man = 1 if respondent is an employee in any type of
manufacturing, Man = 0 otherwise
0.13130.3382
SerDummy variable
(Ser = 1 if respondent is employed in the service sector,
Ser = 0 otherwise)
0.59840.4908
IncRespondent’s annual income (US$)30,370.465872.3732
Table 3. Coefficient estimation for purchase intention.
VariableCoefficient Standard Deviation
At0.1317***0.0397
Su0.3177***0.0440
Pe0.1083***0.0368
Cit−0.0138 0.1286
Gen−0.0036 0.1346
Age−0.0039 0.0063
Mar0.0839 0.1478
Edu0.0314 0.0251
Gov0.2082 0.2156
Agr0.6683 0.9064
Man0.1901 0.2321
Ser−0.1797 0.1571
Inc0.0008 0.0009
Wald χ 2 (13)121.44
Pseudo R20.2534
N384
Note: The coefficients with three asterisks “***” indicate that the coefficient is significant at the 1% significance levels.
Table 4. Marginal effect of the TPB components.
Purchase IntentionAttitude (At)Subjective Norm (Su)Perceived Behavioural
Control (Pe)
Very willing0.01750.04210.0144
Willing0.01920.04640.0158
No comment−0.0351−0.0844−0.0289
Unwilling−0.0019−0.0042−0.0013
Very unwilling−0.0010−0.0028−0.0012
Table 5. Coefficient estimation of WTP for tea under CSR project for different percentiles.
VariablePercentile
θ = 10 θ = 25 θ = 50 θ = 75 θ = 90
At26.5191
(13.1836)
**28.6605
(10.9678)
***0.3316
(15.8587)
−11.8669
(14.1598)
−22.7568
(17.2992)
Su44.2183
(22.0301)
**42.3011
(12.3281)
***51.4678
(12.0946)
***35.3396
(16.8741)
**65.0448
(16.8820)
***
Pe−21.6824
(22.6255)
−8.4805
(10.4947)
0.8528
(10.7660)
5.8672
(10.3848)
20.8252
(15.5936)
Xb841.0070
(1232.2759)
804.6108
(578.6389)
641.5037
(338.1408)
*613.0383
(331.7031)
*781.6157
(463.2516)
*
Cit−84.5362 −13.0820 50.1751 36.4055 3.4090
(57.0191) (40.6534) (39.6102) (40.1150) (55.7412)
Gen109.4818
(60.6774)
*106.9065
(36.9366)
***156.0277
(40.3501)
***68.1669
(46.6881)
114.4139
(59.3097)
*
Age−8.3728
(3.5897)
**−3.2655
(1.7010)
*−1.6403
(2.4604)
3.0712
(2.7927)
4.3439
(2.5710)
*
Mar−30.3208 69.3541 57.7935 −26.6873 −15.0383
(65.3092) (53.9305) (40.5600) (57.9510) (55.9556)
Edu17.7808 3.9312 −0.1917 −2.9117 11.9174
(18.5297) (9.6466) (8.3647) (10.3549) (13.4754)
Gov49.8058
(134.5856)
178.2470
(102.1649)
*150.1812
(96.0379)
44.4325
(97.0595)
25.8226
(174.3308)
Agr448.3893
(282.8444)
249.6267
(247.8754)
366.0275
(194.8691)
*476.0707
(187.4482)
**260.5602
(175.8912)
Man−88.1921 −37.6287 −26.9596 6.1411 43.8633
(112.4348) (73.0941) (81.2303) (73.8283) (100.0003)
Ser61.5741
(64.1471)
64.8674
(54.3539)
37.5940
(62.5279)
78.2839
(55.6808)
115.8893
(62.7558)
Inc0.5904
(0.4424)
0.4028
(0.3474)
0.7139
(0.2948)
**0.6619
(0.3083)
**0.6124
(0.3437)
*
Cons870.4145
(503.8881)
*812.7283
(352.1750)
**993.3233
(277.0036)
***1369.5380
(342.1330)
***747.7514
(446.3397)
*
Pseudo R20.0512 0.0637 0.1223 0.1300 0.1064
N = 384
Note: The numbers in parentheses with one, two, and three asterisks “*”, “**” and “***” indicate the coefficient is significant at 10%, 5%, or 1% significant level, respectively.
Table 6. The average WTP and value of CSR for tea trees growing under each percentile.
PercentileAverage WTP
(USD/600 g)
Change in Average WTP for Each Percentile
(USD/600 g)
Value of CSR per Hectare of Tea Trees Growing
(USD/h)
θ = 1045.735-----92,232.250
θ = 2552.7166.981106,310.600
θ = 5058.5015.785117,977.017
θ = 7565.4046.903135,494.600
θ = 9070.2954.891141,761.583
Average58.530----118,035.500
N = 384
Publisher’s Note: MDPI stays neutral with regard to jurisdictional claims in published maps and institutional affiliations.

