
Effects of Farmyard Manure and Different Phosphorus Inorganic Fertilizer Application Rates on Wheat Cultivation in Phosphorus-Deficient Soil

 , , ,
, , ,  ,
,  ,
,
Abstract
:1. Introduction
2. Materials and Methods
2.1. Experimental Site and Design
2.2. Soil Characteristics
2.3. Treatment Plan
2.4. Fertilizer Application
2.5. Wheat Varieties and Sowing Methods
2.6. Irrigation
2.7. Harvesting
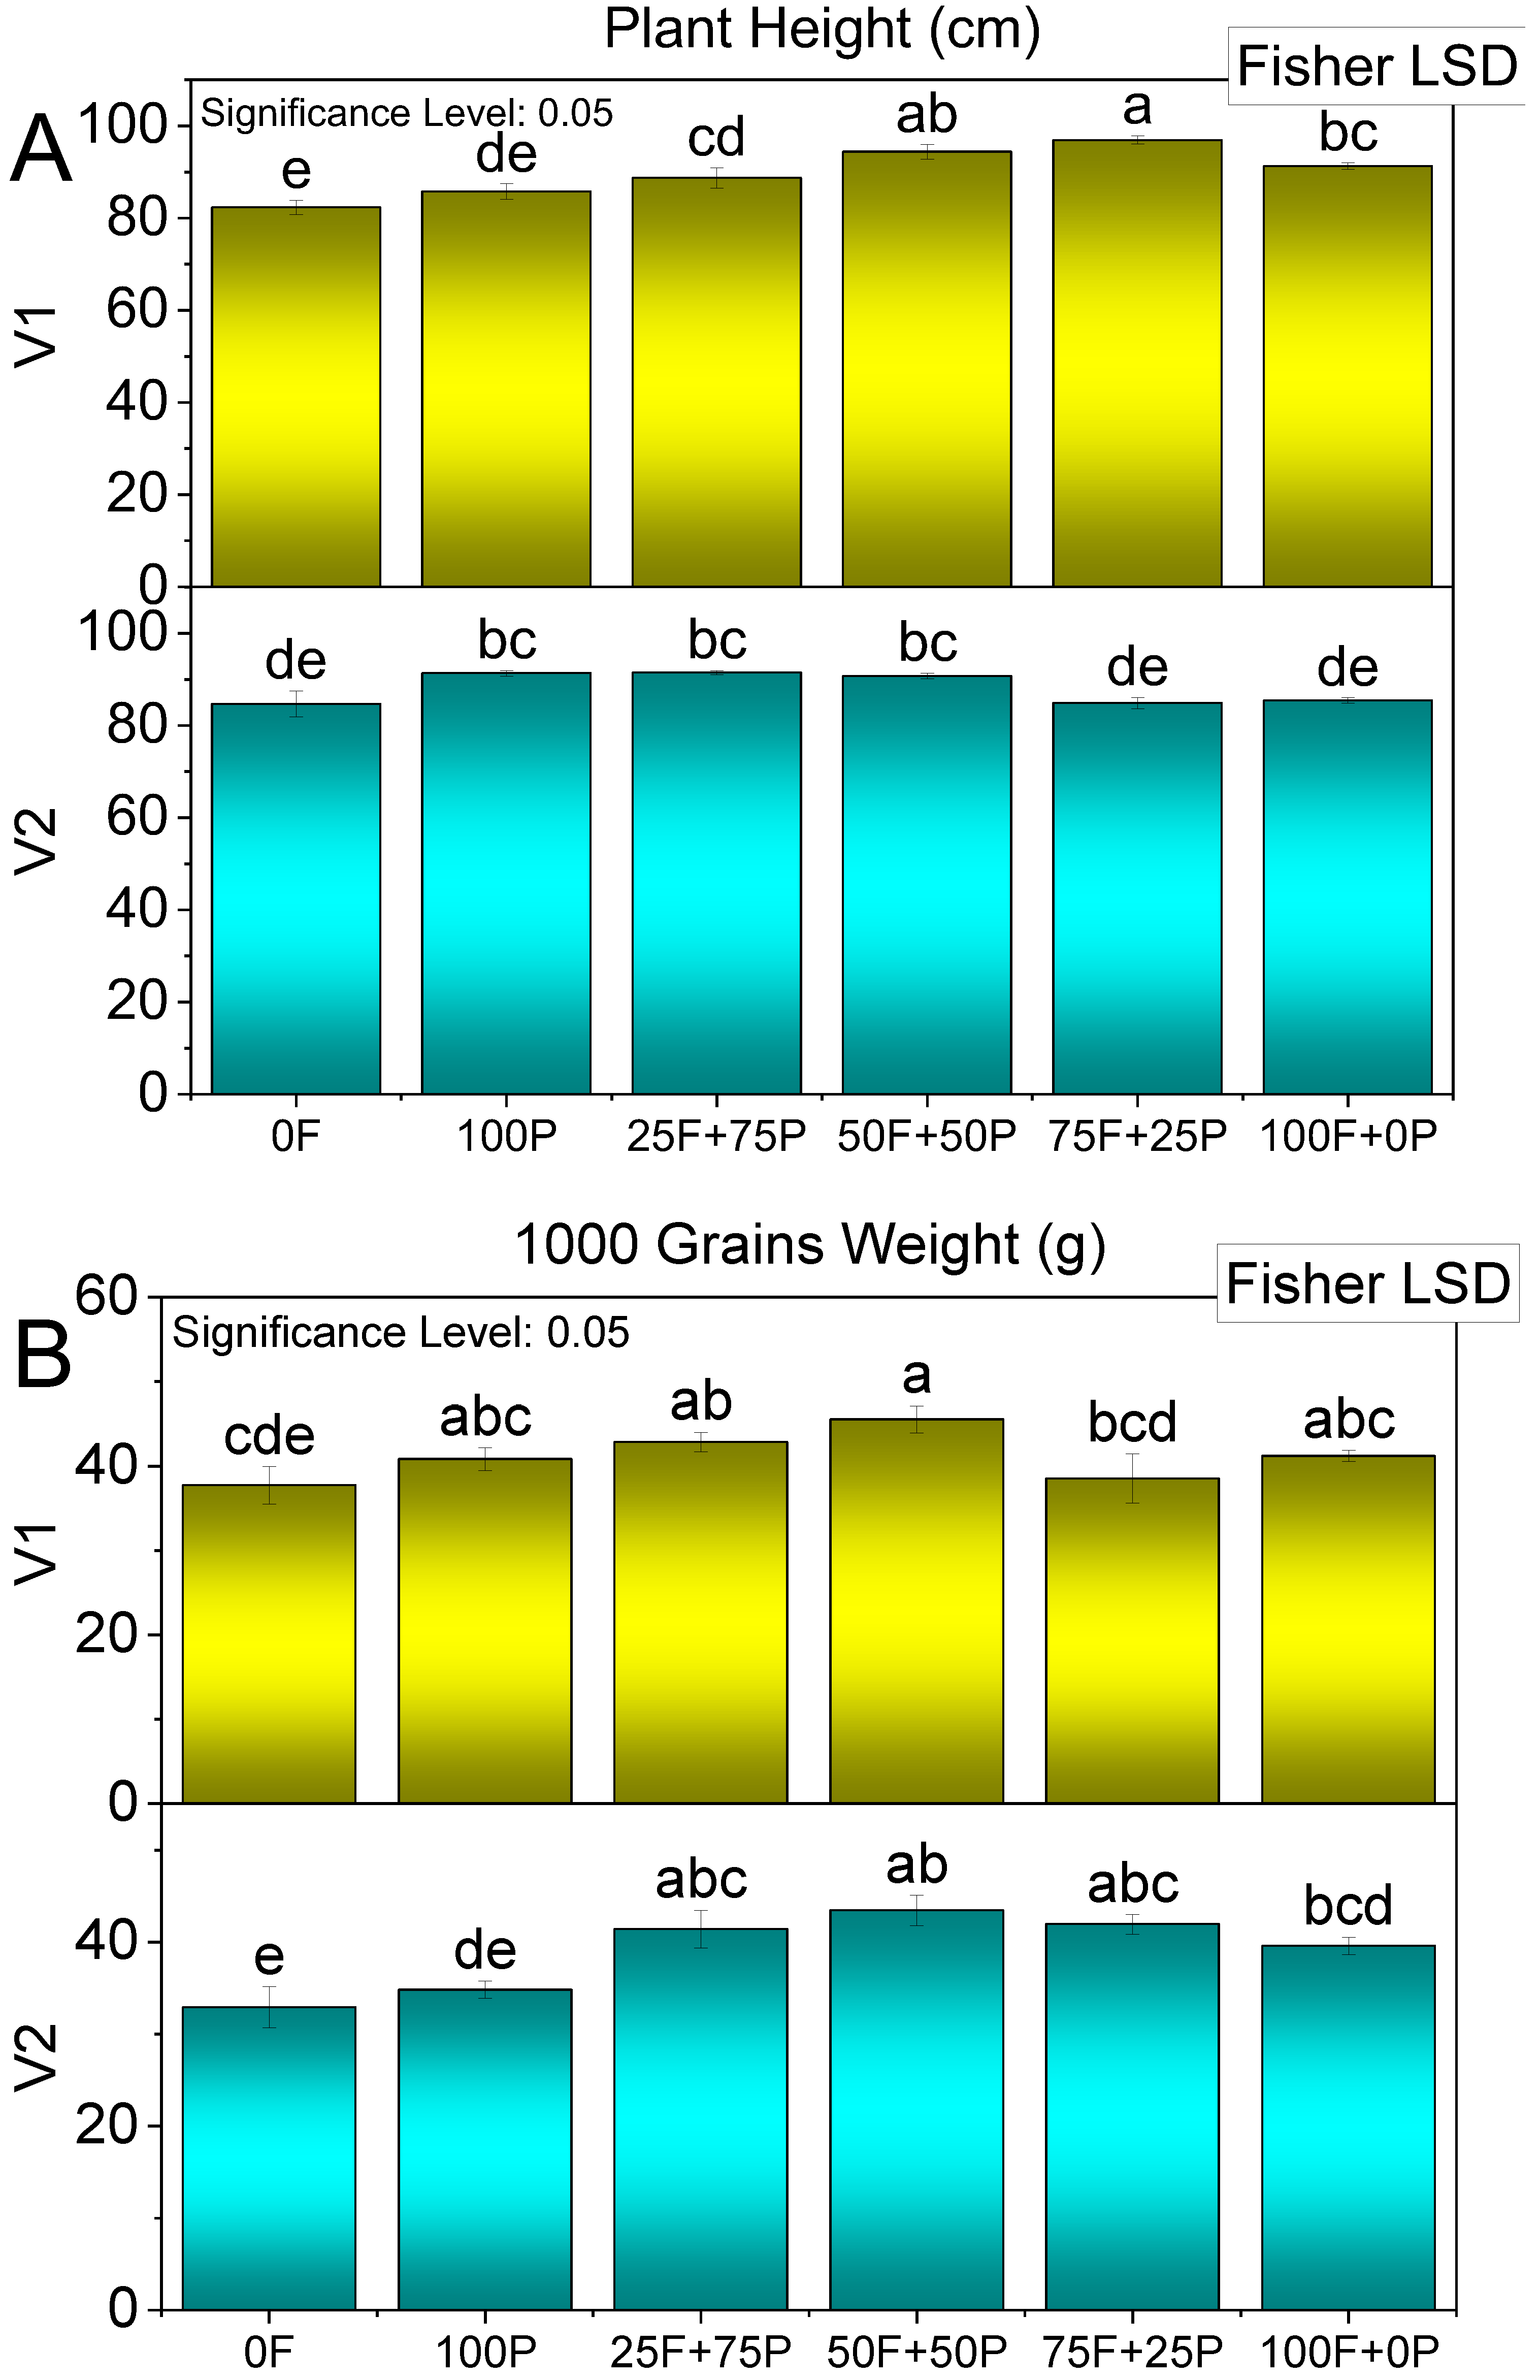
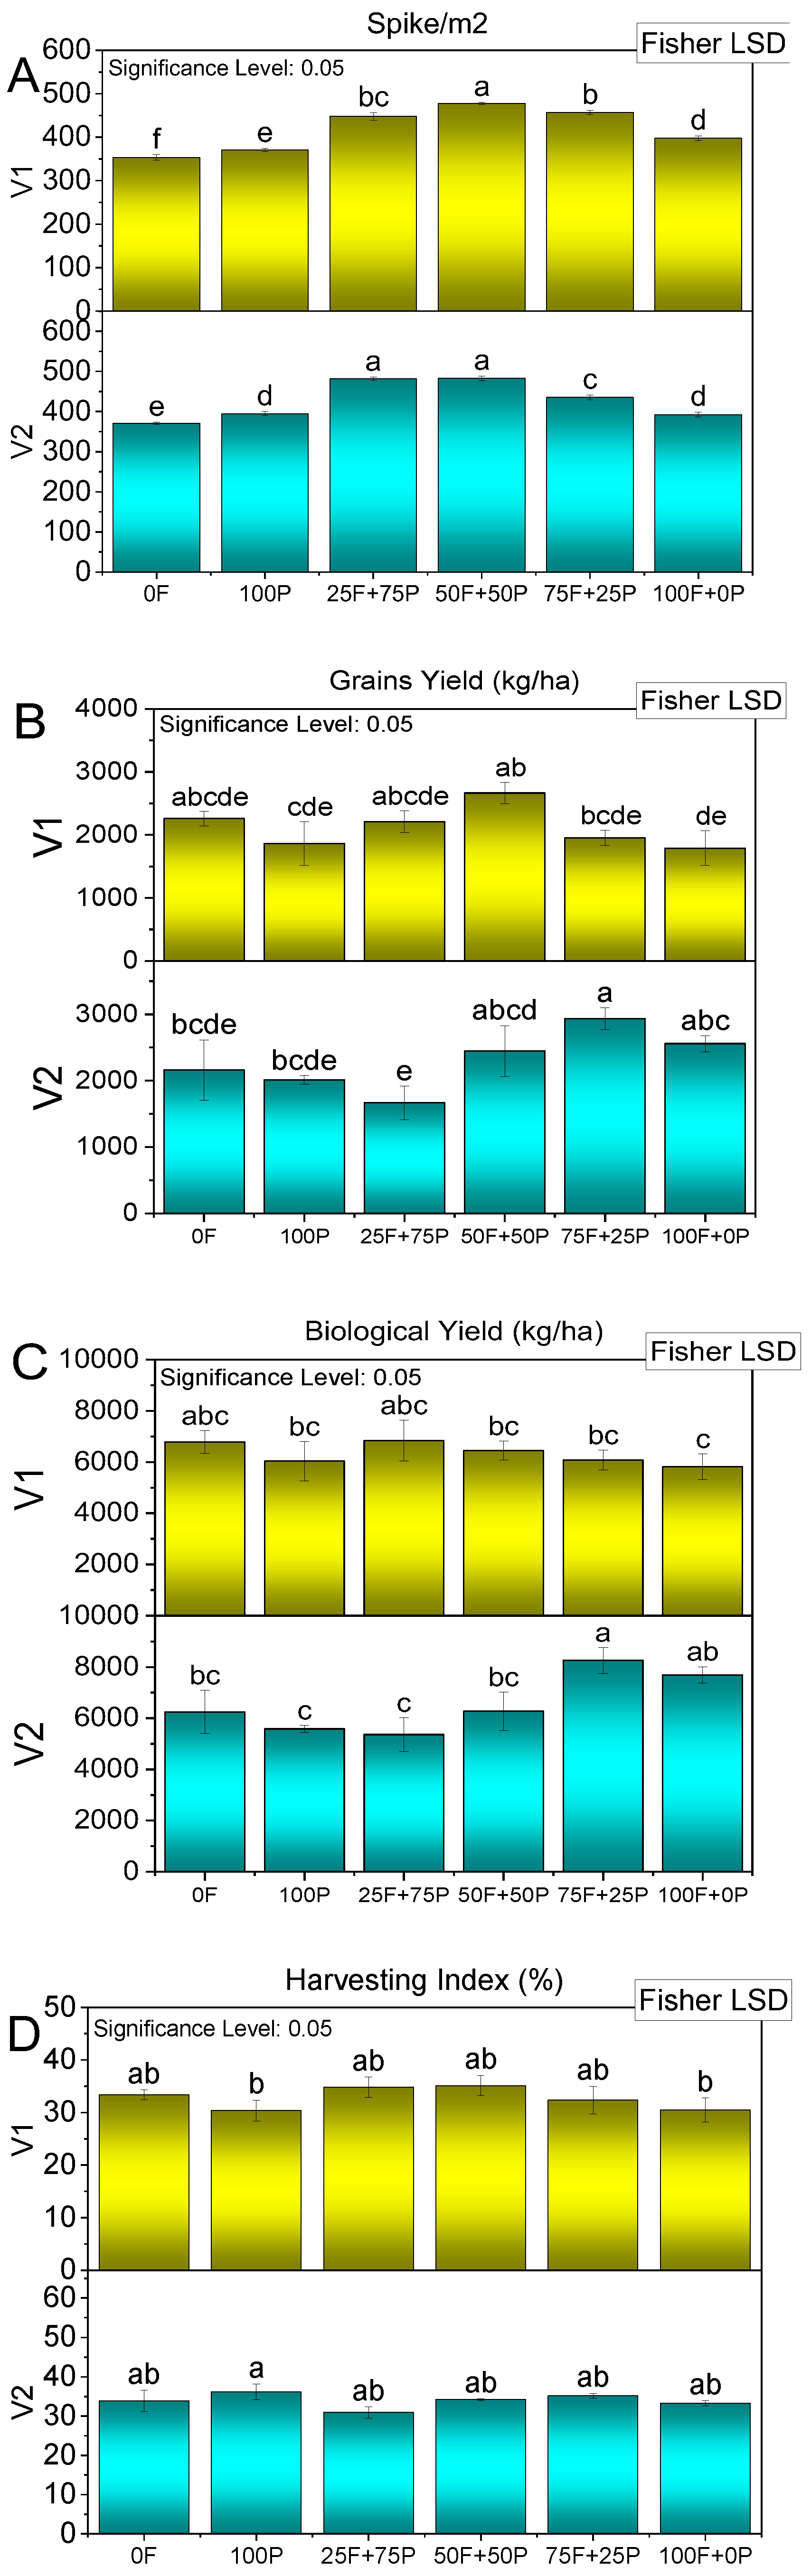
2.8. Spikes m−2
2.9. Grain Yield (kg ha−1)
2.10. Thousand-Grain Weight (g)
2.11. Biological Yield (kg ha−1)
2.12. Harvest Index (%)
2.13. P Uptake
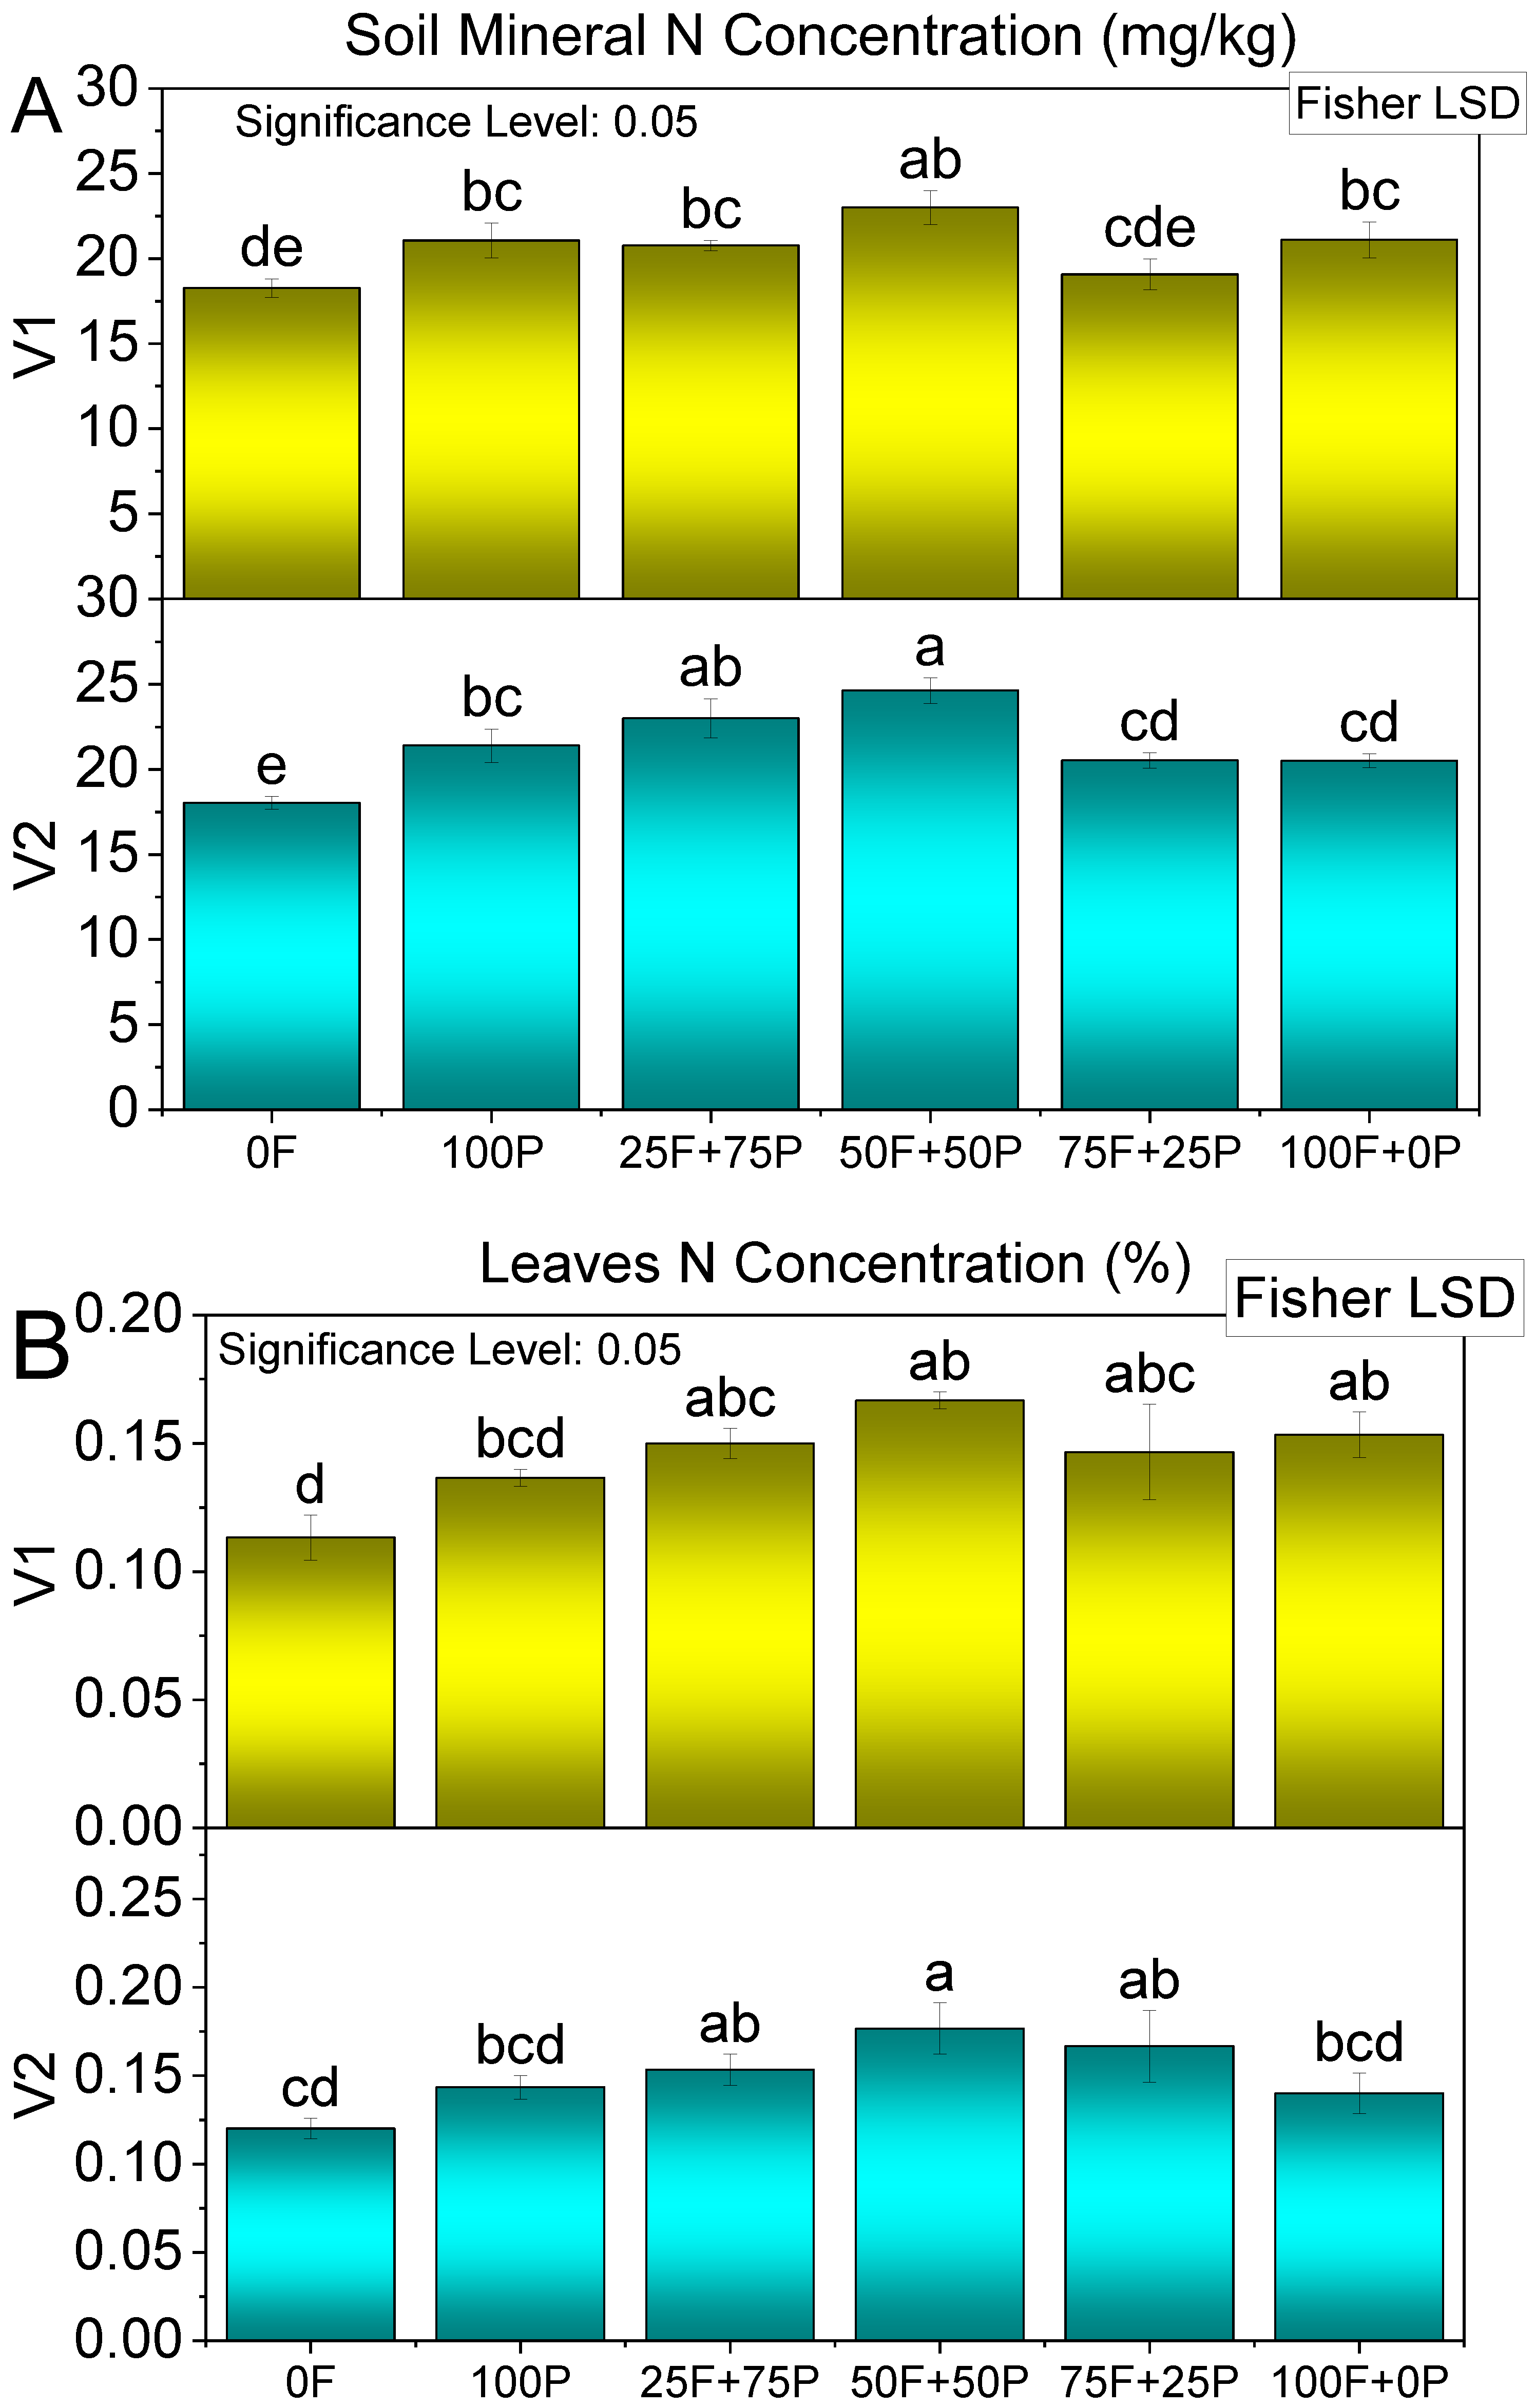
2.14. N Concentration in Leaves
2.15. P and K Concentration in Leaves
2.16. Soil Mineral N
2.17. AB-DTPA Extractable Soil P and K
2.18. Statistical Analysis
3. Results
4. Discussion
5. Conclusions
Author Contributions
Funding
Institutional Review Board Statement
Informed Consent Statement
Data Availability Statement
Acknowledgments
Conflicts of Interest
References
- Tao, F.; Zhang, Z.; Xiao, D.; Zhang, S.; Rötter, R.P.; Shi, W.; Liu, Y.; Wang, M.; Liu, F.; Zhang, H. Responses of wheat growth and yield to climate change in different climate zones of China, 1981–2009. Agric. For. Meteorol. 2014, 189, 91–104. [Google Scholar] [CrossRef]
- Rose, T.J.; Raymond, C.A.; Bloomfield, C.; King, G.J. Perturbation of nutrient source—sink relationships by post-anthesis stresses results in differential accumulation of nutrients in wheat grain. J. Plant Nutr. Soil Sci. 2015, 178, 89–98. [Google Scholar] [CrossRef]
- Laghari, A.H.; Talpur, M.G.H.; Laghari, G.M.; Leghari, S.J.; Rajput, R.M.I.; Sanjrani, N.; Laghari, A.H. Statistical Survey on Analyzing Market and Environmental Factors Influencing Wheat Crop. Adv. Environ. Biol. 2016, 10, 242–245. [Google Scholar]
- Bibi, F.; Saleem, I.; Javid, S.; Ehsan, S.; Danish, S.; Ahmad, I. Phosphorus release kinetics of applied phosphate is influenced by time and organic sources in clay loam and sandy clay loam soils. Soil Environ. 2018, 37, 136–142. [Google Scholar] [CrossRef]
- Rafiullah; Khan, M.J.; Muhammad, D.; Fahad, S.; Adnan, M.; Wahid, F.; Alamri, S.; Khan, F.; Dawar, K.M.; Irshad, I.; et al. Phosphorus nutrient management through synchronization of application methods and rates in wheat and maize crops. Plants 2020, 9, 1389. [Google Scholar] [CrossRef]
- Ahmad, M.; Khan, M.J.; Muhammad, D. Response of maize to different phosphorus levels under calcareous soil conditions. Sarhad J. Agric. 2013, 29, 43–48. [Google Scholar]
- Rychter, A.M.; Rao, I.M. Role of phosphorus in photosynthetic carbon metabolism. Handb. Photosynth. 2005, 2, 123–148. [Google Scholar]
- Bernal, M.P.; Sanchez-Monedero, M.A.; Paredes, C.; Roig, A. Carbon mineralization from organic wastes at different composting stages during their incubation with soil. Agric. Ecosyst. Environ. 1998, 69, 175–189. [Google Scholar] [CrossRef]
- Shafi, M.I.; Adnan, M.; Fahad, S.; Wahid, F.; Khan, A.; Yue, Z.; Danish, S.; Zafar-Ul-Hye, M.; Brtnicky, M.; Datta, R. Application of single superphosphate with humic acid improves the growth, yield and phosphorus uptake of wheat (Triticum aestivum L.) in calcareous soil. Agronomy 2020, 10, 1224. [Google Scholar] [CrossRef]
- Yaseen, S.; Amjad, S.F.; Mansoora, N.; Kausar, S.; Shahid, H.; Alamri, S.A.M.; Alrumman, S.A.; Eid, E.M.; Ansari, M.J.; Danish, S.; et al. Supplemental Effects of Biochar and Foliar Application of Ascorbic Acid on Physio-Biochemical Attributes of Barley (Hordeum vulgare L.) under Cadmium-Contaminated Soil. Sustainability 2021, 13, 9128. [Google Scholar] [CrossRef]
- Rahi, A.A.; Anjum, M.A.; Iqbal Mirza, J.; Ahmad Ali, S.; Marfo, T.D.; Fahad, S.; Danish, S.; Datta, R. Yield Enhancement and Better Micronutrients Uptake in Tomato Fruit through Potassium Humate Combined with Micronutrients Mixture. Agriculture 2021, 11, 357. [Google Scholar] [CrossRef]
- Kiran, S.; Iqbal, J.; Danish, S.; Bakhsh, A.; Bukhari, S.I.U.S.; Bibi, F.; Alotaibi, K.D.; Fahad, S.; Nasif, O.; Zuan, A.T.K.; et al. Physio-chemical characterization of indigenous agricultural waste materials for the development of potting media. Saudi J. Biol. Sci. 2021, 28, 7491–7498. [Google Scholar] [CrossRef] [PubMed]
- Haider, S.A.; Lalarukh, I.; Amjad, S.F.; Mansoora, N.; Naz, M.; Naeem, M.; Bukhari, S.A.; Shahbaz, M.; Ali, S.A.; Marfo, T.D.; et al. Drought Stress Alleviation by Potassium-Nitrate-Containing Chitosan/Montmorillonite Microparticles Confers Changes in Spinacia oleracea L. Sustainability 2021, 13, 9903. [Google Scholar] [CrossRef]
- Danish, S.; Zafar-ul-Hye, M.; Mohsin, F.; Hussain, M. ACC-deaminase producing plant growth promoting rhizobacteria and biochar mitigate adverse effects of drought stress on maize growth. PLoS ONE 2020, 15, e0230615. [Google Scholar] [CrossRef] [PubMed] [Green Version]
- Hashmi, S.; Younis, U.; Danish, S.; Munir, T.M. Pongamia pinnata L. leaves biochar increased growth and pigments syntheses in Pisum sativum L. exposed to nutritional stress. Agriculture 2019, 9, 153. [Google Scholar] [CrossRef] [Green Version]
- Bhattacharyya, R.; Kundu, S.; Prakash, V.; Gupta, H.S. Sustainability under combined application of mineral and organic fertilizers in a rainfed soybean--wheat system of the Indian Himalayas. Eur. J. Agron. 2008, 28, 33–46. [Google Scholar] [CrossRef]
- Manzar-ul-Alam, S.; Shah, S.A.; Ali, S.; Iqbal, M.M. Yield and phosphorus-uptake by crops as influenced by chemical fertilizer and integrated use of industrial by-products. Songklanakarin J. Sci. Technol. 2005, 27, 9–16. [Google Scholar]
- Deribe, H.; Debele, T. Review on Integrated Nutrient Management on Growth and Yield of Wheat (Triticum spp) in Ethiopia. J. Biol. Agric. Healthc. 2016, 6, 97–104. [Google Scholar]
- Cherr, C.M.; Scholberg, J.M.S.; McSorley, R. Green manure approaches to crop production: A synthesis. Agron. J. 2006, 98, 302–319. [Google Scholar] [CrossRef] [Green Version]
- Gosal, S.K.; Gill, G.K.; Sharma, S.; Walia, S.S. Soil nutrient status and yield of rice as affected by long-term integrated use of organic and inorganic fertilizers. J. Plant Nutr. 2018, 41, 539–544. [Google Scholar] [CrossRef]
- Liu, M.; Hu, F.; Chen, X.; Huang, Q.; Jiao, J.; Zhang, B.; Li, H. Organic amendments with reduced chemical fertilizer promote soil microbial development and nutrient availability in a subtropical paddy field: The influence of quantity, type and application time of organic amendments. Appl. Soil Ecol. 2009, 42, 166–175. [Google Scholar] [CrossRef]
- Gee, G.W.; Bauder, J.W. Particle-size analysis. In Methods of Soil Analysis: Part 1—Physical and Mineralogical Methods; Klute, A., Ed.; Soil Science Society of America: Madison, WI, USA, 1986; pp. 383–411. [Google Scholar]
- Chapman, H.D.; Pratt, P.F. Methods of Analysis for Soils, Plants and Water; University of California, Division of Agricultural Sciences: Berkeley, CA, USA, 1961. [Google Scholar]
- Page, A.L.; Miller, R.H.; Keeny, D.R. Soil pH and lime requirement. In Methods of Soil Analysis; American Society of Agronomy: Madison, WI, USA, 1982; pp. 199–208. [Google Scholar]
- Rhoades, J.D. Salinity: Electrical Conductivity and Total Dissolved Solids. In Methods of Soil Analysis, Part 3, Chemical Methods; Sparks, D.L., Page, A.L., Helmke, P.A., Loeppert, R.H., Soltanpour, P.N., Tabatabai, M.A., Johnston, C.T., Sumner, M.E., Eds.; Soil Science Society of America: Madison, WI, USA, 1996; Volume 5, pp. 417–435. [Google Scholar]
- Nelson, D.W.; Sommers, L.E. Total Carbon, Organic Carbon, and Organic Matter. In Methods of Soil Analysis: Part 2 Chemical and Microbiological Properties; Page, A.L., Ed.; American Society of Agronomy, Crop Science Society of America, and Soil Science Society of America: Madison, WI, USA, 1982; pp. 539–579. [Google Scholar]
- Bremner, M. Nitrogen-Total. In Methods of Soil Analysis Part 3. Chemical Methods; SSSA Book Series 5; Sparks, D.L., Page, A.L., Helmke, P.A., Loeppert, R.H., Eds.; John Wiley & Sons, Inc.: Madison, WI, USA, 1996; pp. 1085–1121. [Google Scholar]
- Kuo, S. Phosphorus. In Methods of Soil Analysis Part 3: Chemical Methods; Sparks, D.L., Page, A.L., Helmke, P.A., Loeppert, R.H., Soltanpour, P.N., Tabatabai, M.A., Johnston, C.T., Sumner, M.E., Eds.; John Wiley & Sons, Ltd.: Madison, WI, USA, 1996; pp. 869–919. [Google Scholar]
- Pratt, P.F. Potassium. In Methods of Soil Analysis: Part 2 Chemical and Microbiological Properties, 9.2; Norman, A.G., Ed.; John Wiley & Sons, Ltd.: Hoboken, NJ, USA, 1965; pp. 1022–1030. [Google Scholar]
- Bremner, J.M.; Mulvaney, C.S. Nitrogen–total. In Methods of Soil Analysis. Part 2. Chemical and Microbiological Properties; Page, A.L., Miller, R.H., Keeney, D.R., Eds.; American Society of Agronomy, Soil Science Society of America, Madison: Madison, WI, USA, 1982; pp. 595–624. [Google Scholar]
- Soltanpour, P.N.; Schwab, A.P. A new soil test for simultaneous extraction of macroand micro-nutrients in alkaline soils. Commun. Soil Sci. Plant Anal. 1977, 8, 195–207. [Google Scholar] [CrossRef]
- Steel, R.G.; Torrie, J.H.; Dickey, D.A. Principles and Procedures of Statistics: A Biometrical Approach, 3rd ed.; McGraw Hill Book International Co.: Singapore, 1997. [Google Scholar]
- OriginLab Corporation OriginPro; OriginLab: Northampton, MA, USA, 2021.
- Ma, Q.; Wen, Y.; Wang, D.; Sun, X.; Hill, P.W.; Macdonald, A.; Chadwick, D.R.; Wu, L.; Jones, D.L. Farmyard manure applications stimulate soil carbon and nitrogen cycling by boosting microbial biomass rather than changing its community composition. Soil Biol. Biochem. 2020, 144, 107760. [Google Scholar] [CrossRef]
- Turan, M.; Arjumend, T.; Argin, S.; Yildirim, E.; Katirciouglu, H.; Gürkan, B.; Ekinci, M.; Günecs, A.; Kocaman, A.; Bolouri, P. Plant root enhancement by plant growth promoting rhizobacteria. In Plant Roots; IntechOpen: London, UK, 2021. [Google Scholar]
- Danish, S.; Zafar-ul-Hye, M.; Fahad, S.; Saud, S.; Brtnicky, M.; Hammerschmiedt, T.; Datta, R. Drought Stress Alleviation by ACC Deaminase Producing Achromobacter xylosoxidans and Enterobacter cloacae, with and without Timber Waste Biochar in Maize. Sustainability 2020, 12, 6286. [Google Scholar] [CrossRef]
- Zafar-Ul-Hye, M.; Danish, S.; Abbas, M.; Ahmad, M.; Munir, T.M. ACC deaminase producing PGPR Bacillus amyloliquefaciens and Agrobacterium fabrum along with biochar improve wheat productivity under drought stress. Agronomy 2019, 9, 343. [Google Scholar] [CrossRef] [Green Version]
- Danish, S.; Zafar-Ul-Hye, M.; Hussain, S.; Riaz, M.; Qayyum, M.F. Mitigation of drought stress in maize through inoculation with drought tolerant ACC deaminase containing PGPR under axenic conditions. Pakistan J. Bot. 2020, 52. [Google Scholar] [CrossRef]
- Dhaliwal, S.S.; Sharma, S.; Sharma, V.; Shukla, A.K.; Walia, S.S.; Alhomrani, M.; Gaber, A.; Toor, A.S.; Verma, V.; Randhawa, M.K.; et al. Long-Term Integrated Nutrient Management in the Maize--Wheat Cropping System in Alluvial Soils of North-Western India: Influence on Soil Organic Carbon, Microbial Activity and Nutrient Status. Agronomy 2021, 11, 2258. [Google Scholar] [CrossRef]
- Hosseinzadeh, M.H.; Ghalavand, A.; Boojar, M.M.-A.; Modarres-Sanavy, S.A.M.; Mokhtassi-Bidgoli, A. Application of manure and biofertilizer to improve soil properties and increase grain yield, essential oil and $ω$3 of purslane (Portulaca oleracea L.) under drought stress. Soil Tillage Res. 2021, 205, 104633. [Google Scholar] [CrossRef]
- Ma, X.; Li, H.; Xu, Y.; Liu, C. Effects of organic fertilizers via quick artificial decomposition on crop growth. Sci. Rep. 2021, 11, 3900. [Google Scholar] [CrossRef]
- Sultan, H.; Ahmed, N.; Mubashir, M.; Danish, S. Chemical production of acidified activated carbon and its influences on soil fertility comparative to thermo-pyrolyzed biochar. Sci. Rep. 2020, 10, 595. [Google Scholar] [CrossRef] [Green Version]
- Torabian, S.; Farhangi-Abriz, S.; Qin, R.; Noulas, C.; Sathuvalli, V.; Charlton, B.; Loka, D.A. Potassium: A Vital Macronutrient in Potato Production-A Review. Agronomy 2021, 11, 543. [Google Scholar] [CrossRef]
- Saima, S.; Perveen, M.; Nawaz, M.; Ahmad, K.M.; Sultan, H. Comparison of Foliar Spray and Side Dressing of Potassium on Growth, Flowering, Productions of Corms in Gladiolus cv. Yellow Stone. Sarhad J. Agric. 2021, 37, 548–554. [Google Scholar] [CrossRef]
- Wahid, F.; Sharif, M.; Fahad, S.; Adnan, M.; Khan, I.A.; Aksoy, E.; Ali, A.; Sultan, T.; Alam, M.; Saeed, M.; et al. Arbuscular mycorrhizal fungi improve the growth and phosphorus uptake of mung bean plants fertilized with composted rock phosphate fed dung in alkaline soil environment. J. Plant Nutr. 2019, 42, 1760–1769. [Google Scholar] [CrossRef]
- Marschner, H. Mineral Nutrition of Higher Plants, 2nd ed.; Academic Press: San Diego, CA, USA, 1995; ISBN 9780124735422. [Google Scholar]
- Benbella, M.; Paulsen, G.M. Efficacy of treatments for delaying senescence of wheat leaves: II. Senescence and grain yield under field conditions. Agron. J. 1998, 90, 332–338. [Google Scholar] [CrossRef]


| Soil | Analysis Methods References | Water | Analysis Methods References | ||||
|---|---|---|---|---|---|---|---|
| Attributes | Units | Values | [22] | Attributes | Units | Values | [23] |
| Sand | % | 30.3 | pH | - | 6.02 | ||
| Silt | % | 64.2 | TSS | ppm | 567 | ||
| Clay | % | 5.5 | Carbonates | meq./L | 0 | ||
| Texture | Silt Loam | Bicarbonates | 5.34 | ||||
| pHs | - | 8.01 | [24] | Chloride | 0.45 | ||
| ECe | dS/m | 2.54 | [25] | Ca+Mg | 4.21 | ||
| Organic matter | % | 0.35 | [26] | ||||
| Total N | % | 0.0175 | [27] | ||||
| Available P | mg/kg | 2.34 | [28] | ||||
| Extractable K | mg/kg | 89 | [29] | ||||
| Principal Component | Eigenvalue | PC1 | PC2 | Percentage of Variance (%) | Cumulative (%) |
|---|---|---|---|---|---|
| Loadings | |||||
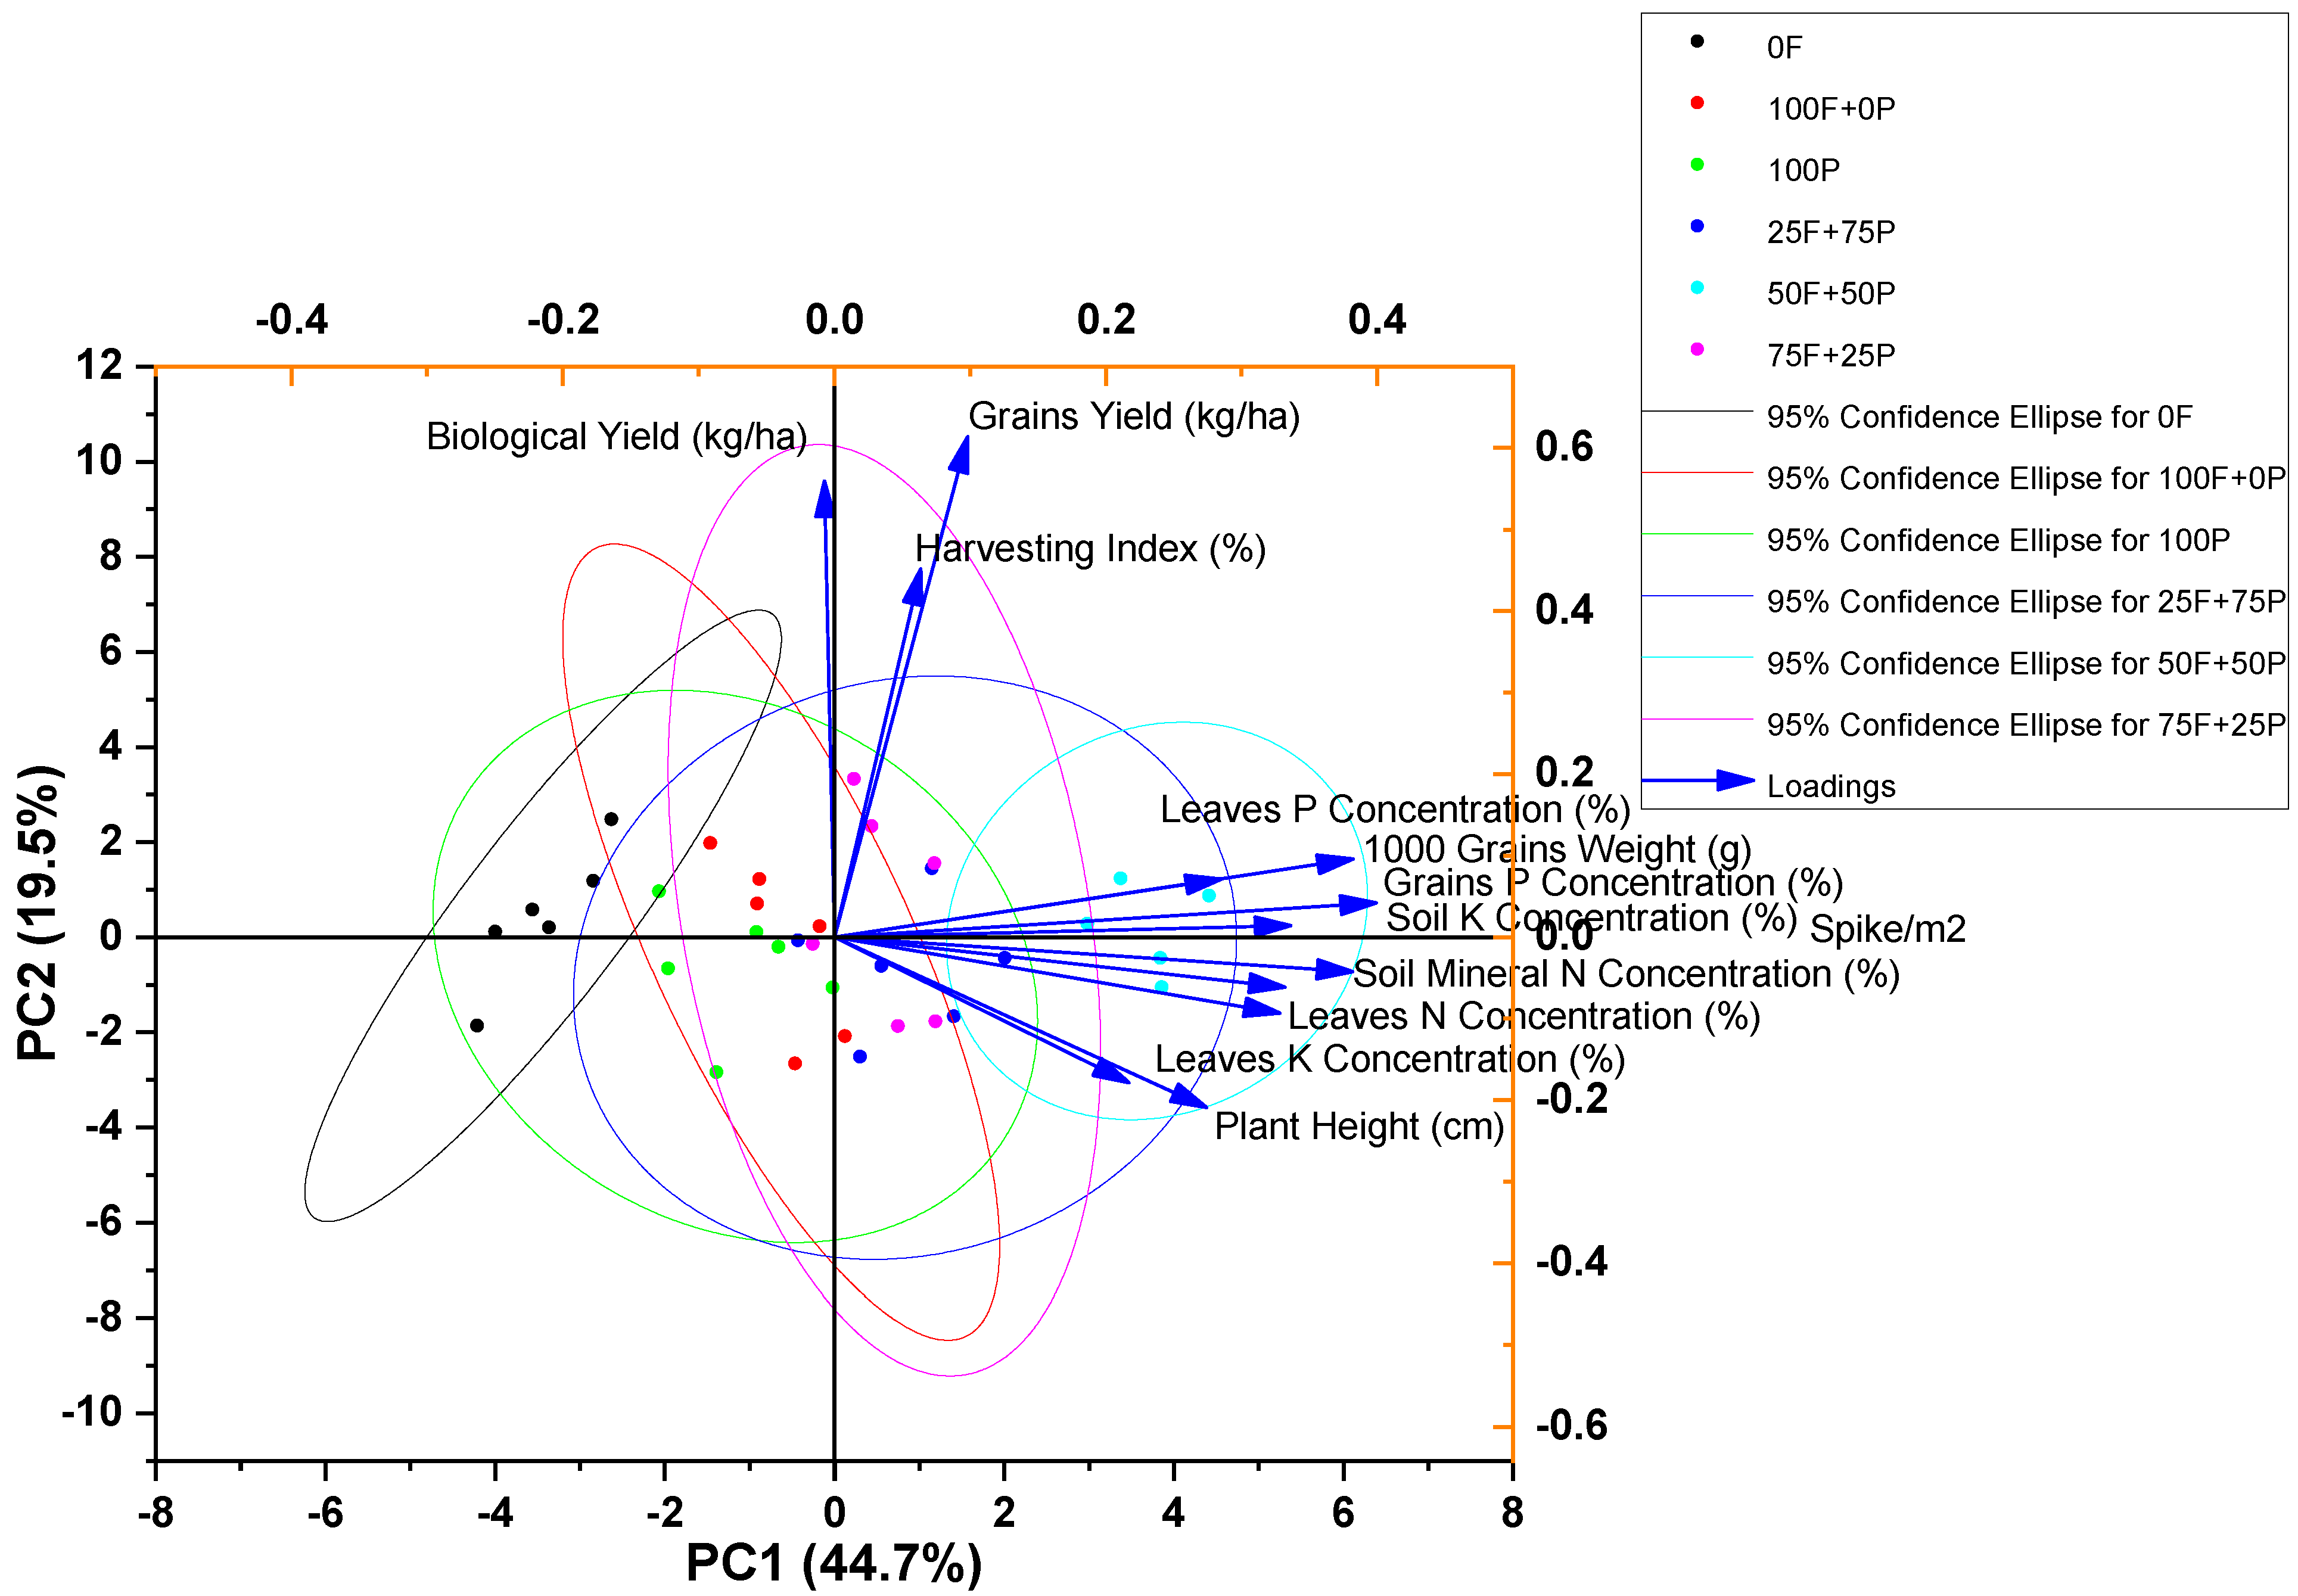
| Plant height (cm) | 5.36924 | 0.27434 | −0.2091 | 44.74368 | 44.74368 |
| 1000-grain eight (g) | 2.33501 | 0.28526 | 0.07137 | 19.45838 | 64.20206 |
| Spike/m2 | 1.19411 | 0.382 | −0.04231 | 9.95091 | 74.15296 |
| Grain yield (kg/ha) | 0.8141 | 0.09821 | 0.61369 | 6.78418 | 80.93714 |
| Biological yield (kg/ha) | 0.61524 | −0.00731 | 0.55953 | 5.127 | 86.06414 |
| Harvesting index (%) | 0.41689 | 0.06365 | 0.45174 | 3.4741 | 89.53824 |
| Leaf P concentration (%) | 0.38629 | 0.38231 | 0.09609 | 3.21911 | 92.75735 |
| Grain P concentration (%) | 0.33157 | 0.39911 | 0.04185 | 2.7631 | 95.52045 |
| Soil K concentration (%) | 0.23143 | 0.33621 | 0.01405 | 1.92858 | 97.44903 |
| Leaf K concentration (%) | 0.17116 | 0.21705 | −0.17873 | 1.42631 | 98.87534 |
| Soil mineral N concentration (%) | 0.10103 | 0.33207 | −0.06154 | 0.84189 | 99.71723 |
| Leaf N concentration (%) | 0.03393 | 0.32835 | −0.09347 | 0.28277 | 100 |
Publisher’s Note: MDPI stays neutral with regard to jurisdictional claims in published maps and institutional affiliations. |
© 2022 by the authors. Licensee MDPI, Basel, Switzerland. This article is an open access article distributed under the terms and conditions of the Creative Commons Attribution (CC BY) license (https://creativecommons.org/licenses/by/4.0/).
Share and Cite
Dawar, K.; Khalil, Z.; Mian, I.A.; Khan, B.; Ali, S.; Rahi, A.A.; Tahir, M.S.; Ahmed, N.; Fahad, S.; Danish, S.; et al. Effects of Farmyard Manure and Different Phosphorus Inorganic Fertilizer Application Rates on Wheat Cultivation in Phosphorus-Deficient Soil. Sustainability 2022, 14, 9030. https://0-doi-org.brum.beds.ac.uk/10.3390/su14159030
Dawar K, Khalil Z, Mian IA, Khan B, Ali S, Rahi AA, Tahir MS, Ahmed N, Fahad S, Danish S, et al. Effects of Farmyard Manure and Different Phosphorus Inorganic Fertilizer Application Rates on Wheat Cultivation in Phosphorus-Deficient Soil. Sustainability. 2022; 14(15):9030. https://0-doi-org.brum.beds.ac.uk/10.3390/su14159030
Chicago/Turabian StyleDawar, Khadim, Zeeshan Khalil, Ishaq Ahmad Mian, Bushra Khan, Shamsher Ali, Ashfaq Ahmad Rahi, Muhammad Saeed Tahir, Niaz Ahmed, Shah Fahad, Subhan Danish, and et al. 2022. "Effects of Farmyard Manure and Different Phosphorus Inorganic Fertilizer Application Rates on Wheat Cultivation in Phosphorus-Deficient Soil" Sustainability 14, no. 15: 9030. https://0-doi-org.brum.beds.ac.uk/10.3390/su14159030